Submitted:
11 December 2023
Posted:
12 December 2023
You are already at the latest version
Abstract
Keywords:
1. Introduction
2. Materials and Methods
2.1. Design and Study Population
2.2. RT-qPCR and viral load for non-SARS-CoV-2 respiratory viruses
2.3. Multiplex immunoassay of cytokines and chemokines
2.4. Data analysis
3. Results
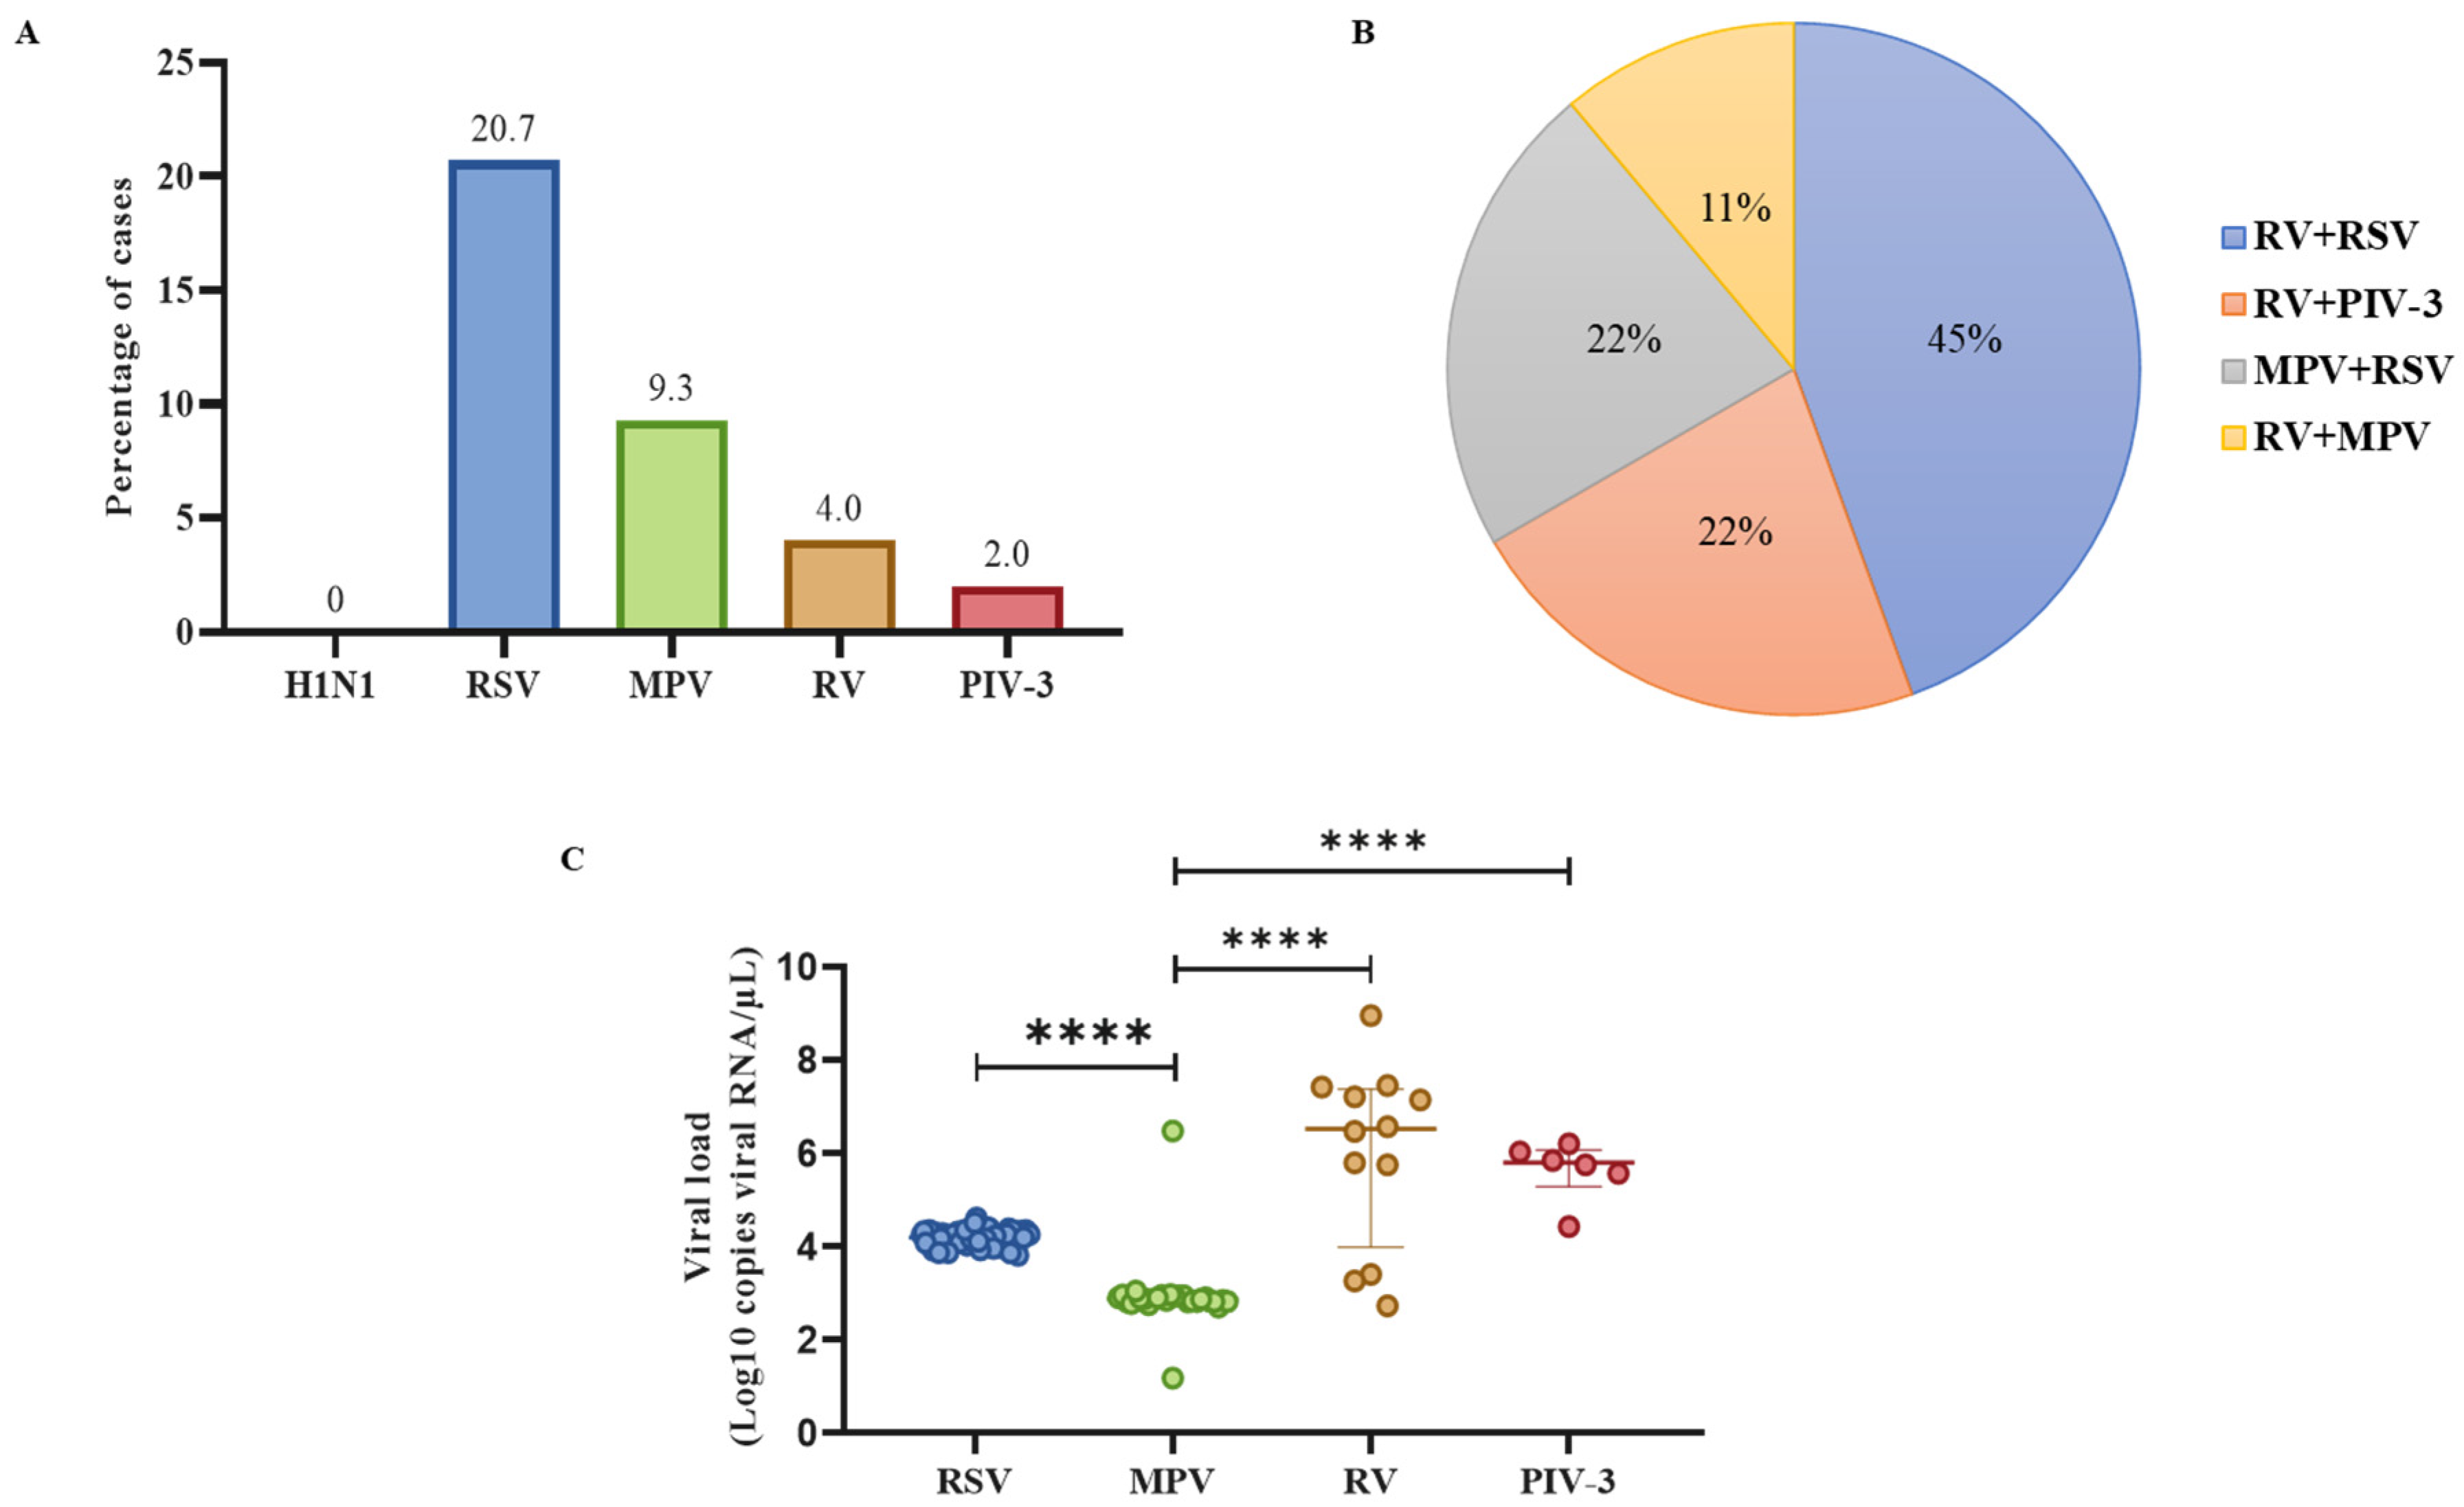
3.1. RSV was the most frequent non-SARS-CoV-2 respiratory virus in the population with ARIs, and RV was the most common virus in dual co-infections
3.2. Patients positive for RV infection had the highest viral loads compared to other respiratory viruses
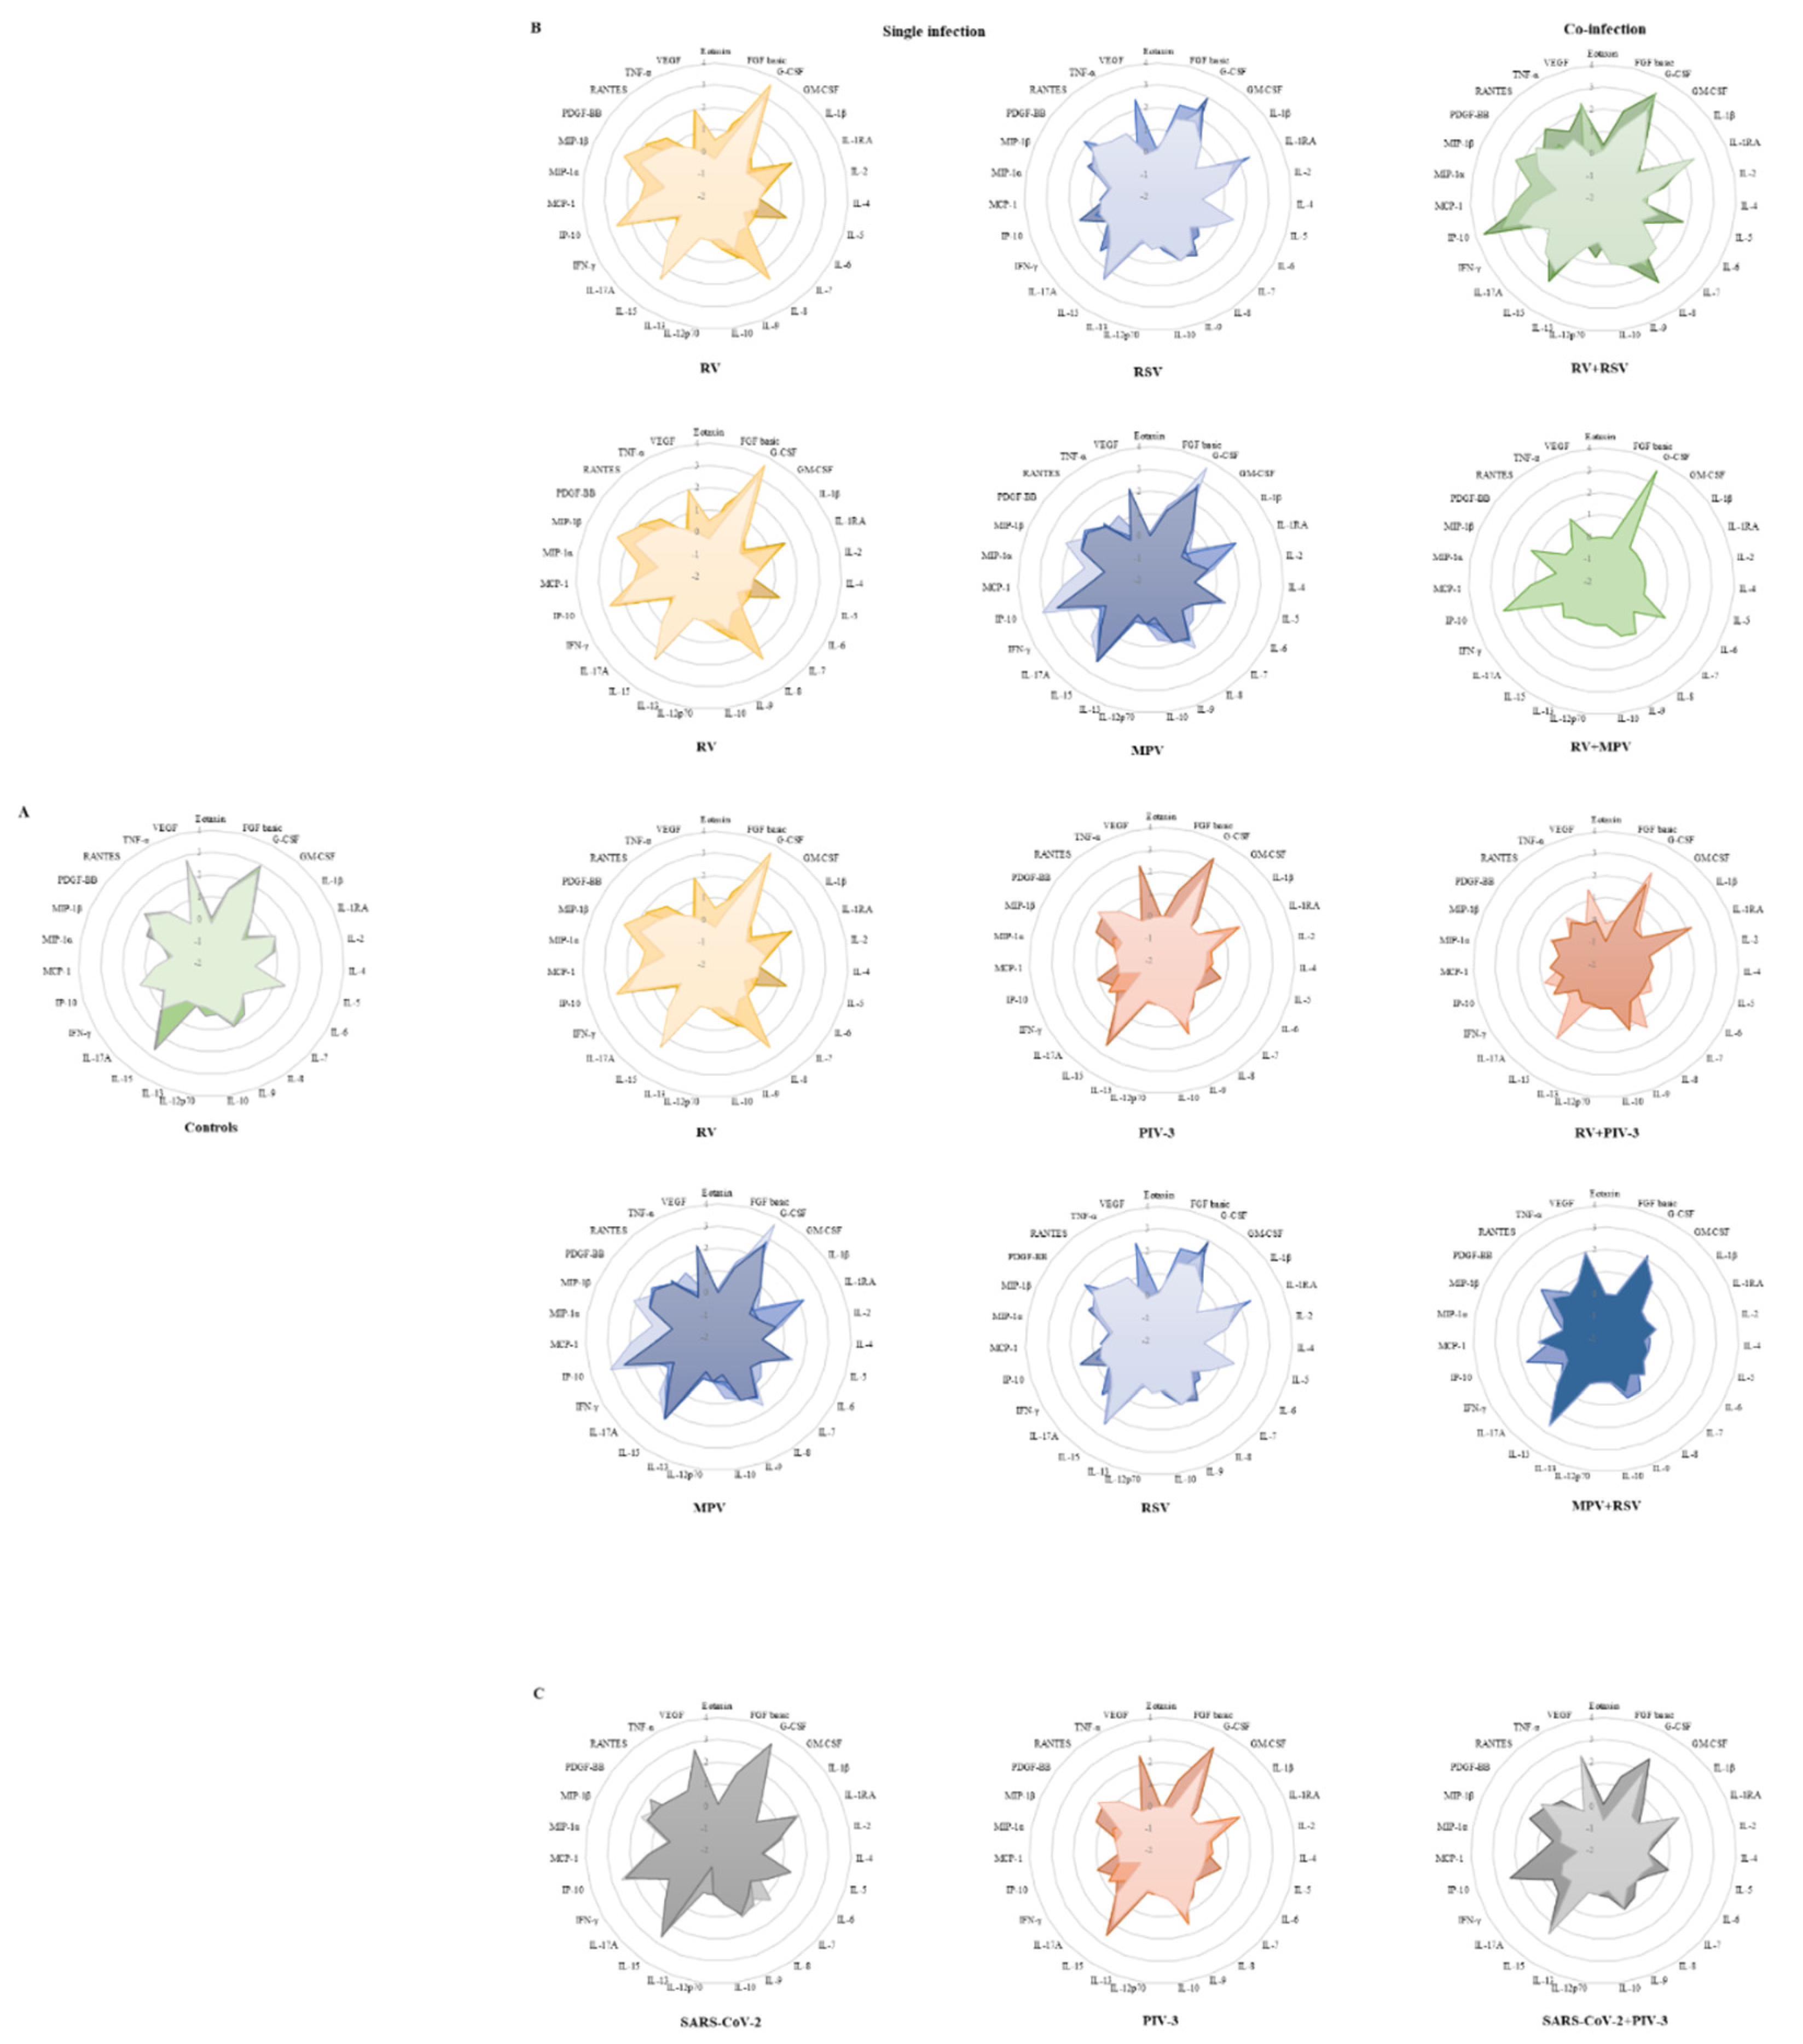
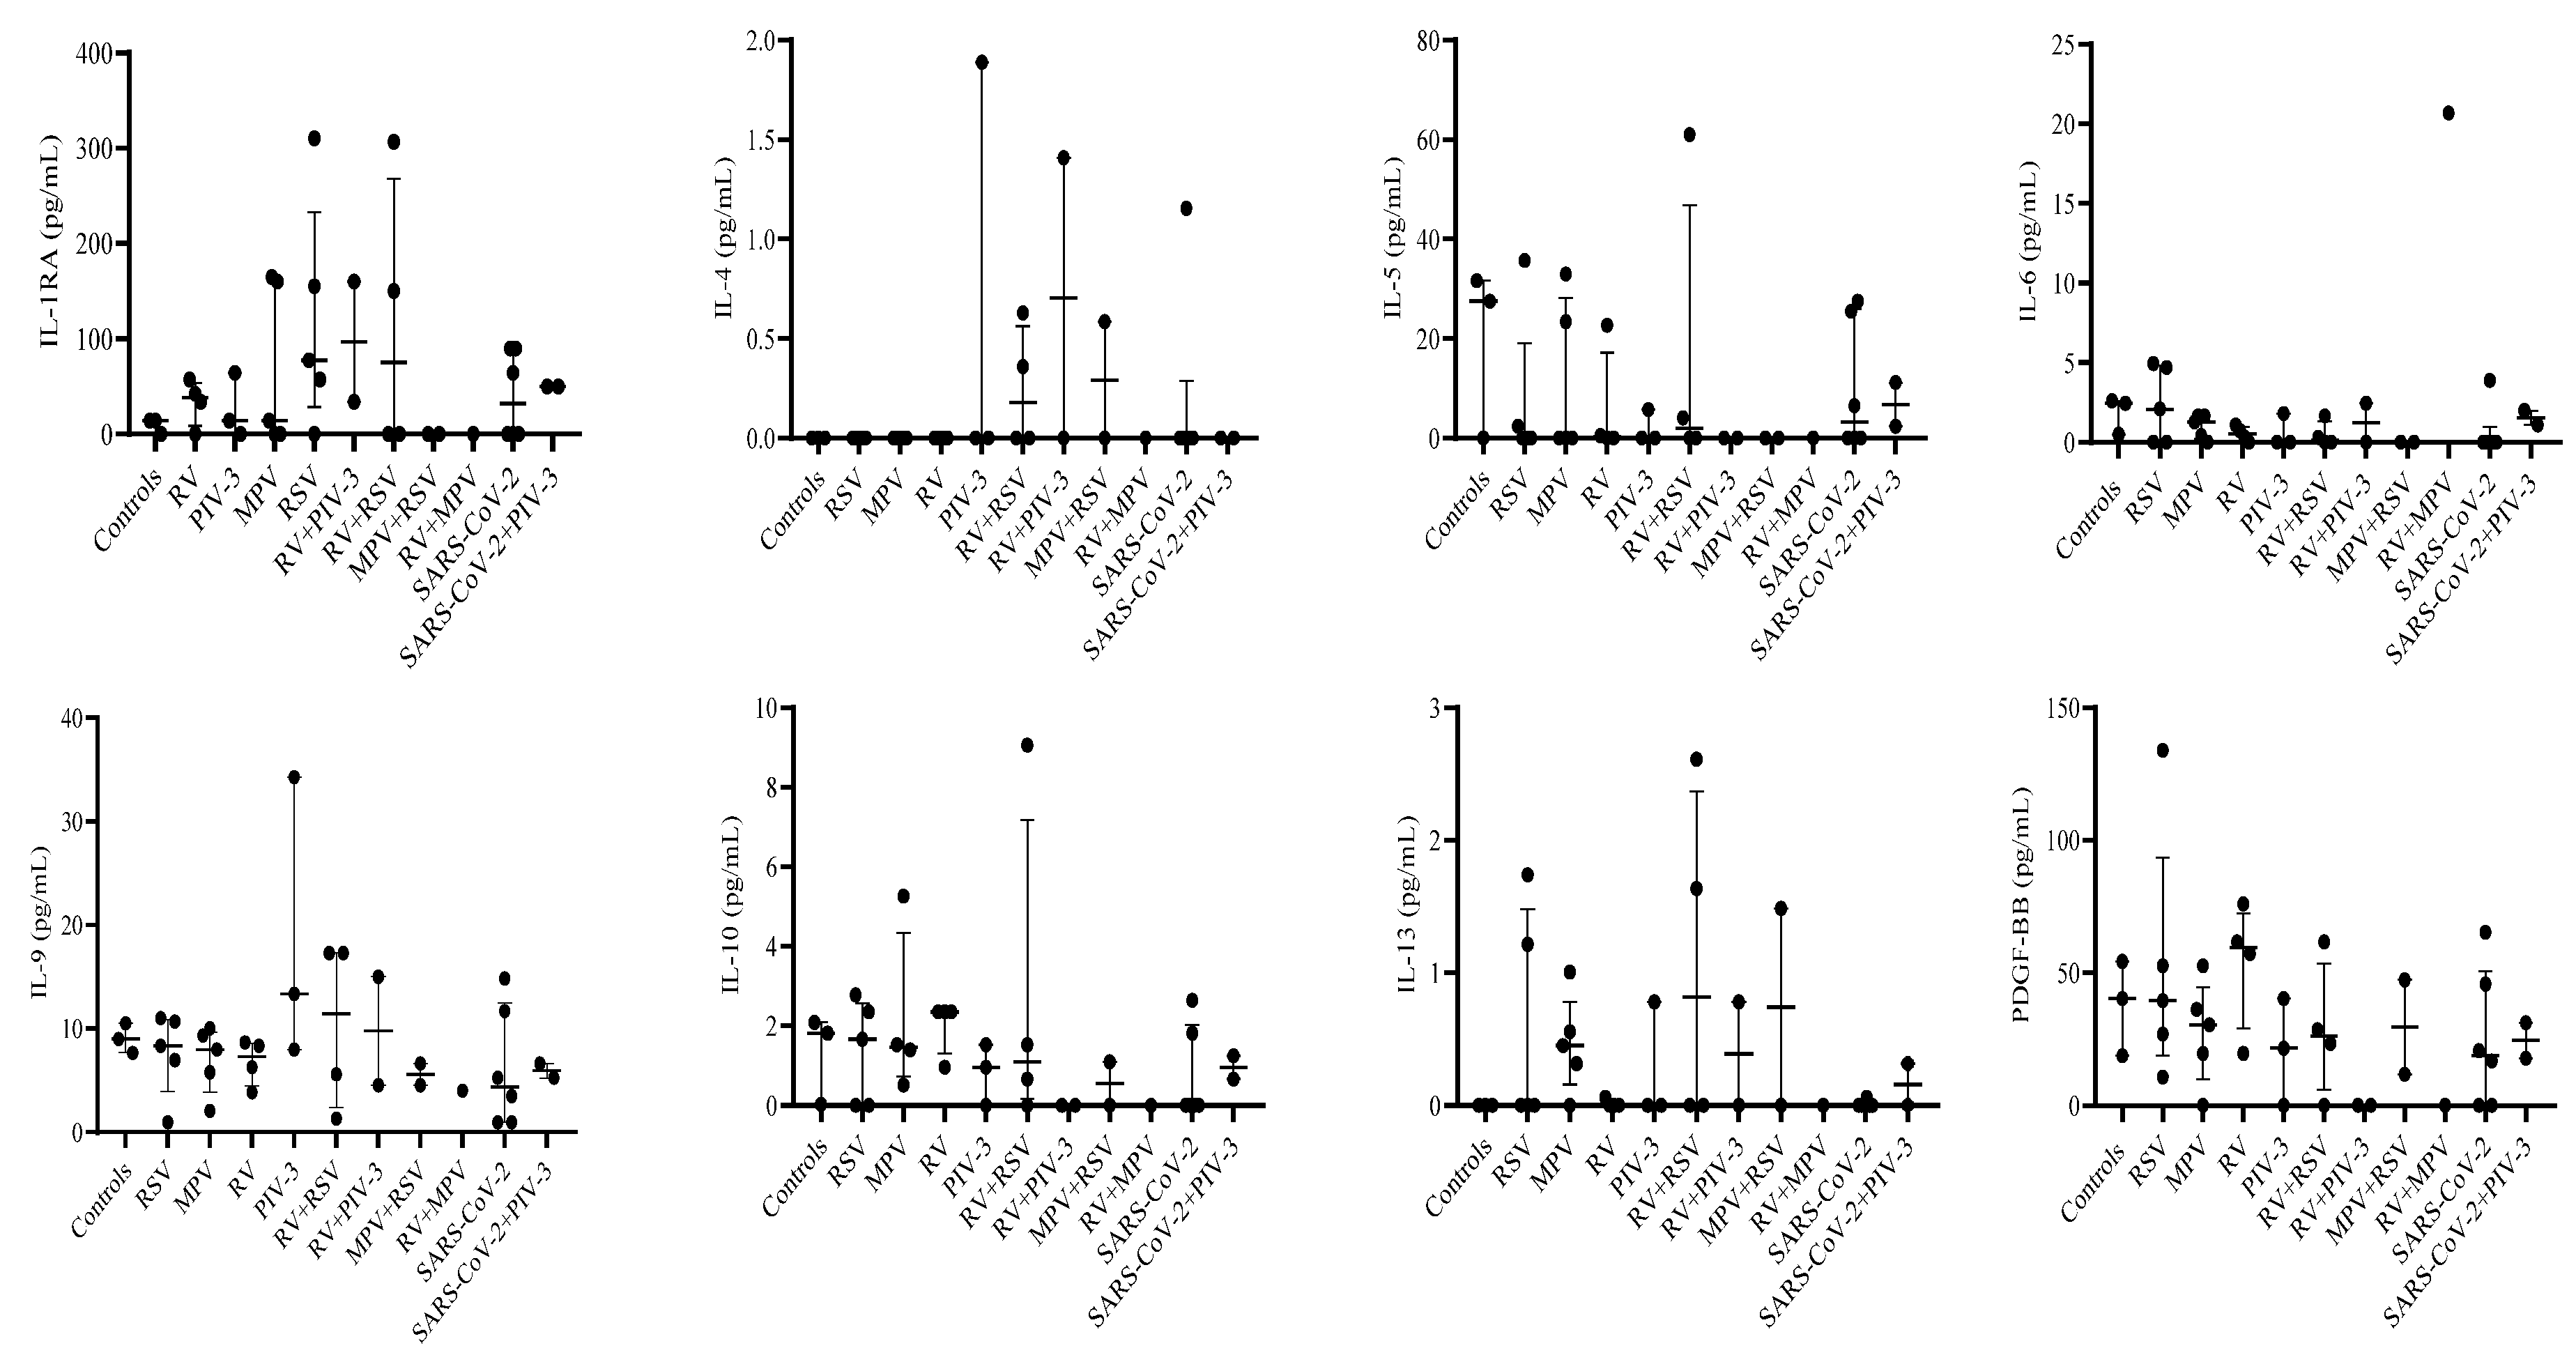
3.3. Single infection or dual co-infection with non-SARS-CoV-2 viruses was characterized by an increase in the expression of IL-1RA and MIP-1α
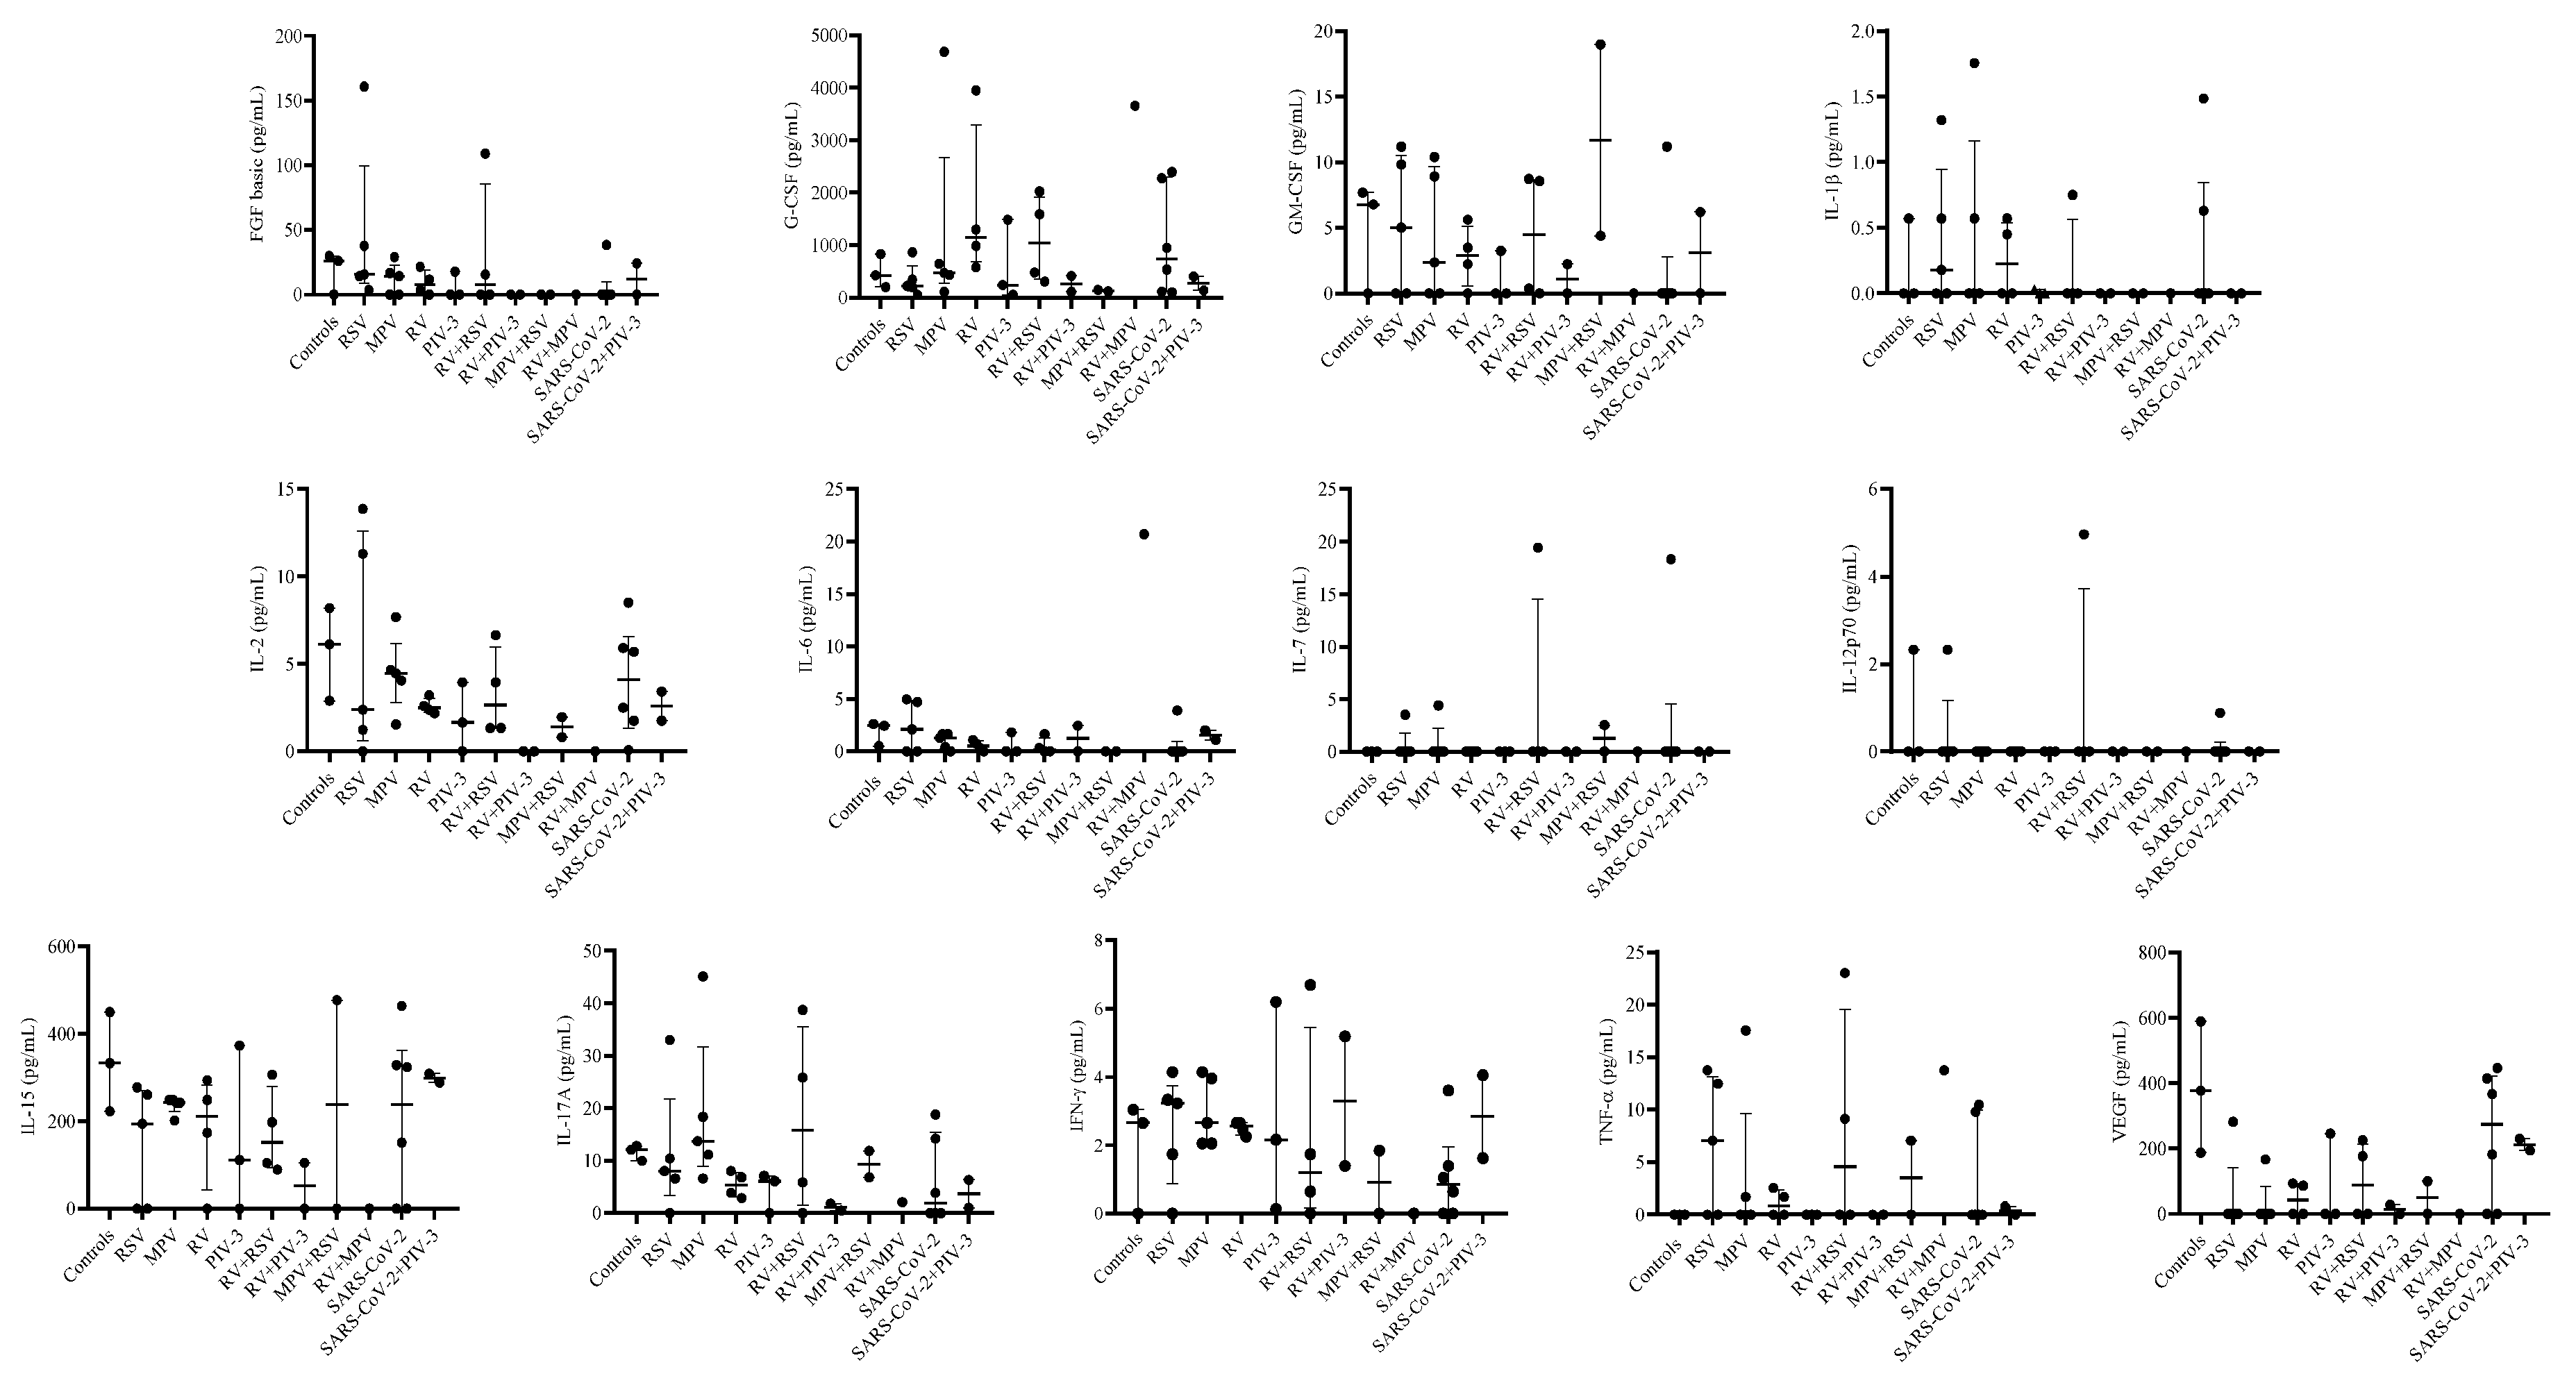
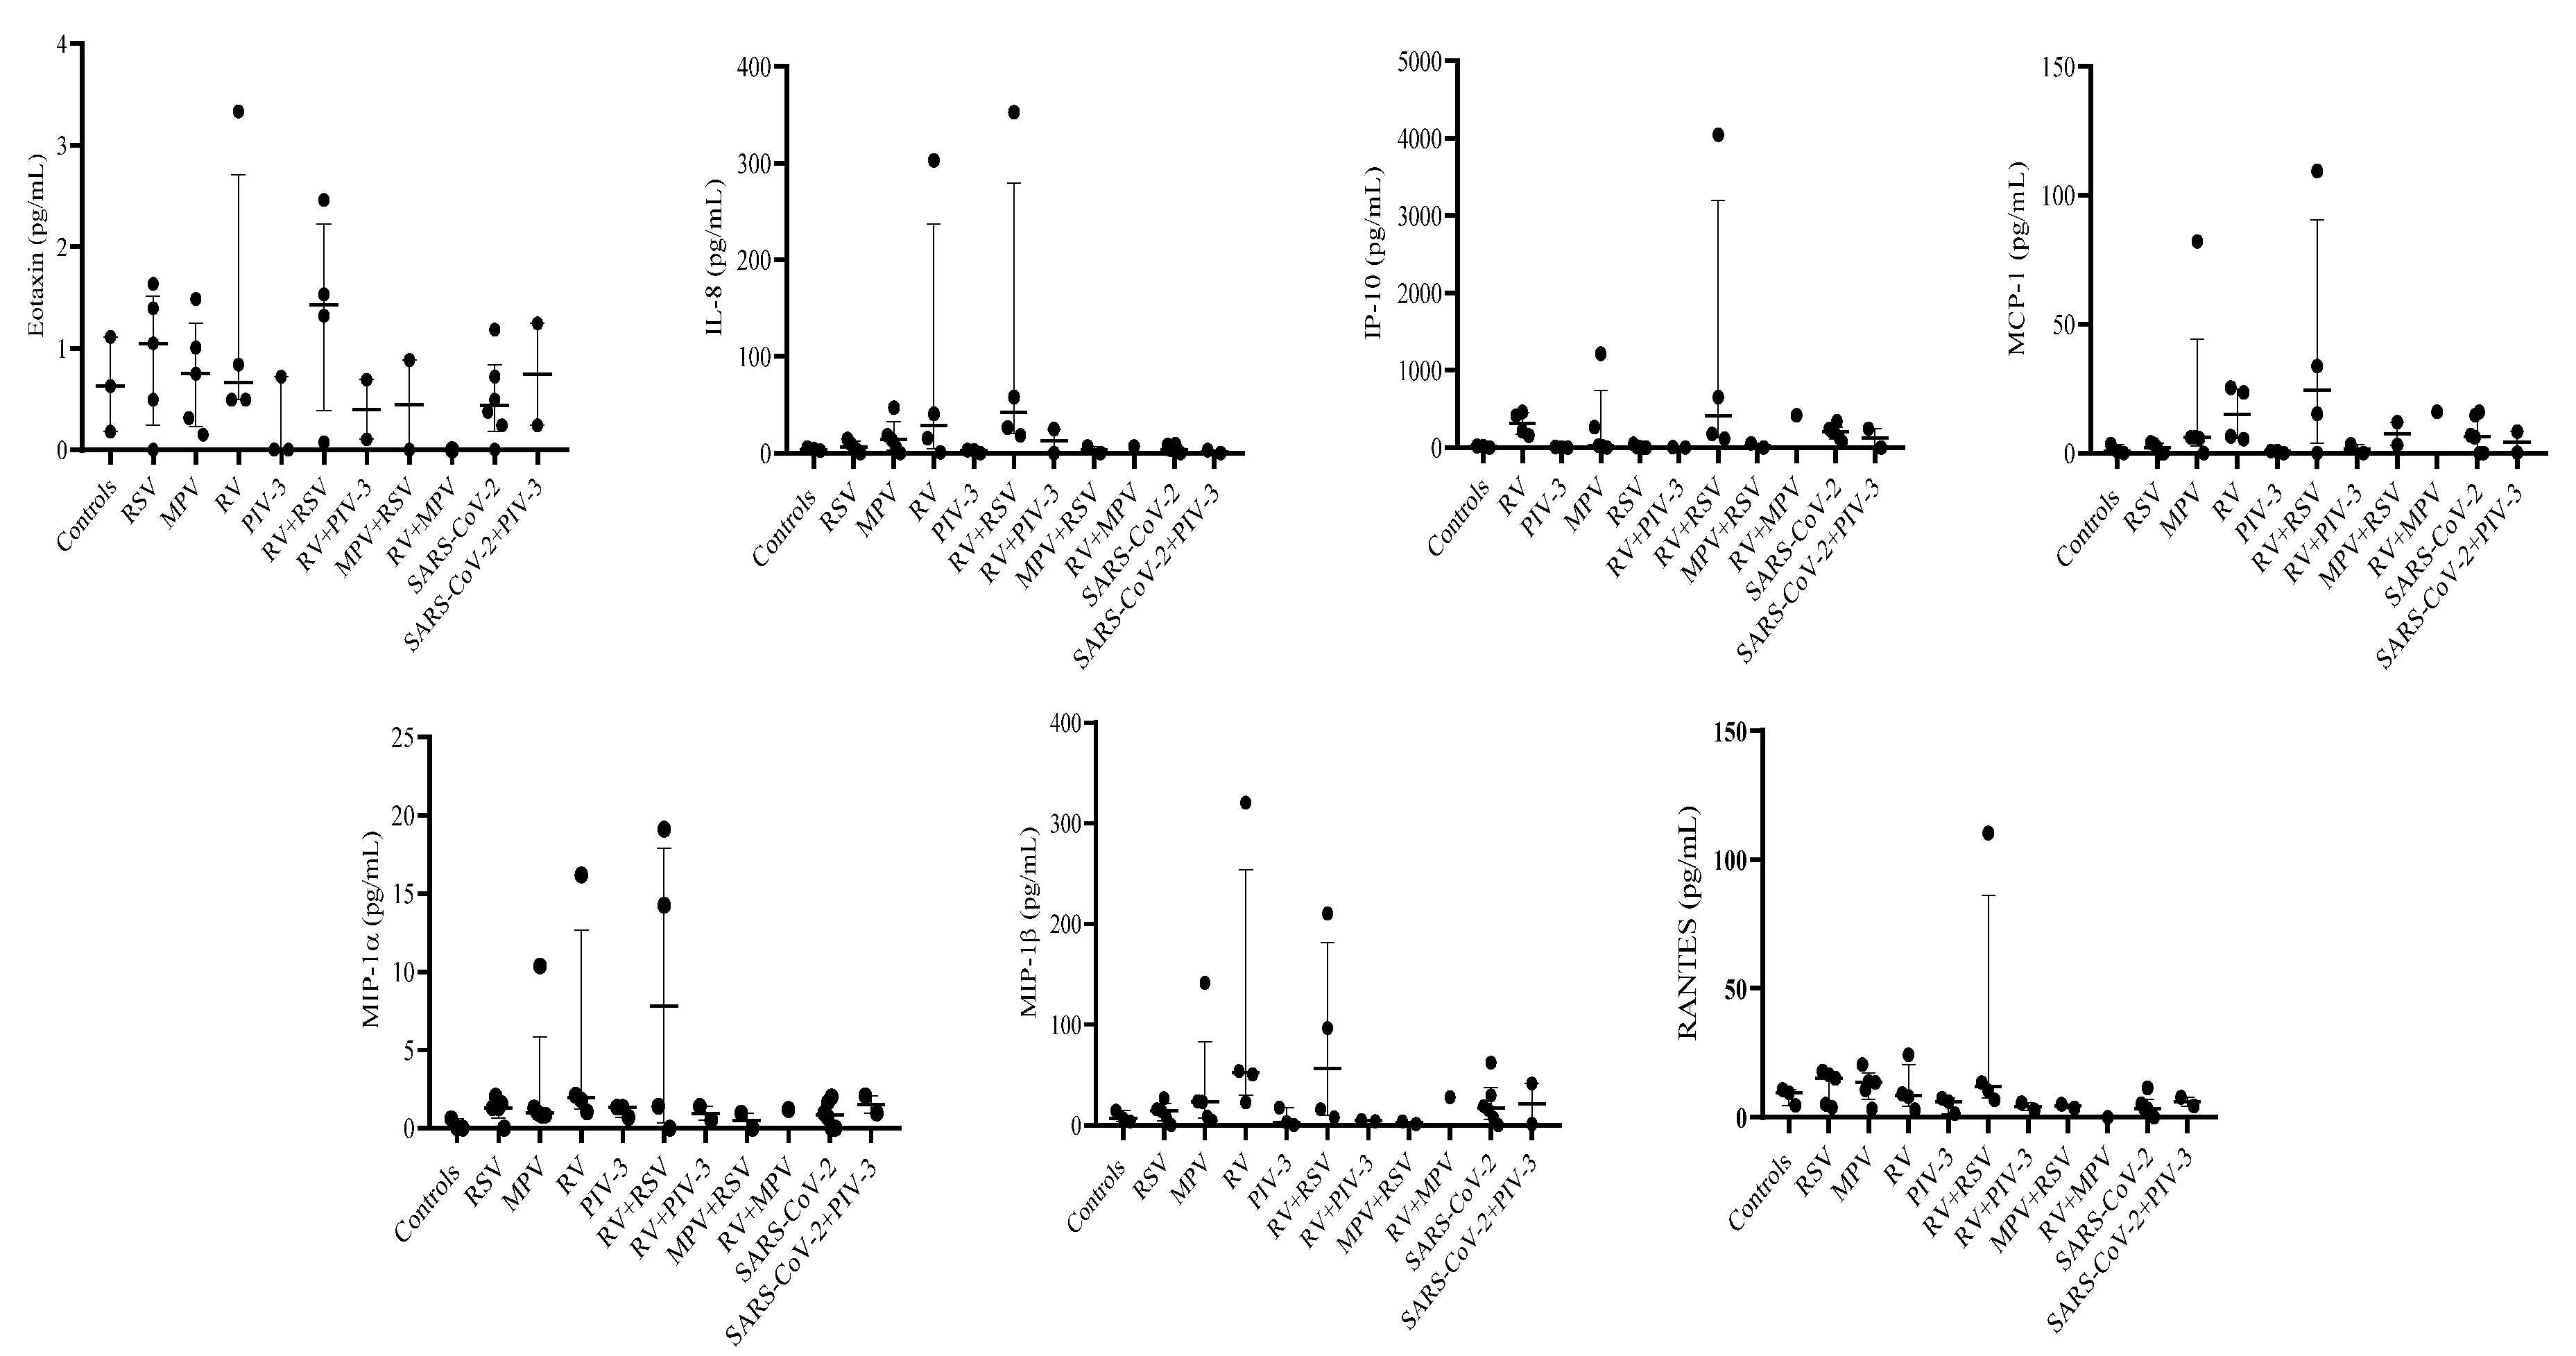
3.4. G-CSF, IP-10, and VEGF expression were decreased in PIV-3 dual co-infections. FGF basic, MIP-1α, IL-8, IP-10, MCP-1, IFN-γ, and RANTES are differentially expressed between single infections and dual co-infections
3.5. Eotaxin expression levels are significantly associated with RSV viral load
4. Discussion
5. Conclusions
Supplementary Materials
Author Contributions
Institutional Review Board Statement
Informed Consent Statement
Acknowledgments
Conflicts of Interest
References
- Perin, J.; Mulick, A.; Yeung, D.; Villavicencio, F.; Lopez, G.; Strong, K.L.; Prieto-Merino, D.; Cousens, S.; Black, R.E.; Liu, L. Global, Regional, and National Causes of under-5 Mortality in 2000–19: An Updated Systematic Analysis with Implications for the Sustainable Development Goals. Lancet Child Adolesc Health 2022, 6, 106–115. [Google Scholar] [CrossRef]
- Hodinka, R.L. Respiratory RNA Viruses. Microbiol Spectr 2016, 4. [Google Scholar] [CrossRef]
- Price, R.H.M.; Graham, C.; Ramalingam, S. Association between Viral Seasonality and Meteorological Factors. Sci Rep 2019, 9, 929. [Google Scholar] [CrossRef] [PubMed]
- Moriyama, M.; Hugentobler, W.J.; Iwasaki, A. Seasonality of Respiratory Viral Infections. Annu Rev Virol 2020, 7, 83–101. [Google Scholar] [CrossRef]
- Audi, A.; AlIbrahim, M.; Kaddoura, M.; Hijazi, G.; Yassine, H.M.; Zaraket, H. Seasonality of Respiratory Viral Infections: Will COVID-19 Follow Suit? Front Public Health 2020, 8, 567184. [Google Scholar] [CrossRef]
- Olsen, S.J.; Winn, A.K.; Budd, A.P.; Prill, M.M.; Steel, J.; Midgley, C.M.; Kniss, K.; Burns, E.; Rowe, T.; Foust, A.; et al. Changes in Influenza and Other Respiratory Virus Activity During the COVID-19 Pandemic — United States, 2020–2021. MMWR Morb Mortal Wkly Rep 2021, 70, 1013–1019. [Google Scholar] [CrossRef]
- Bergeron, H.C.; Tripp, R.A. Immunopathology of RSV: An Updated Review. Viruses 2021, 13, 2478. [Google Scholar] [CrossRef]
- Park, G.Y.S.; Tishkowski, K. Paramyxovirus. In StatPearls; StatPearls Publishing: Treasure Island (FL), 2022. [Google Scholar]
- Ali, A.; Lopardo, G.; Scarpellini, B.; Stein, R.T.; Ribeiro, D. Systematic Review on Respiratory Syncytial Virus Epidemiology in Adults and the Elderly in Latin America. Int J Infect Dis 2020, 90, 170–180. [Google Scholar] [CrossRef] [PubMed]
- Chadha, M.; Hirve, S.; Bancej, C.; Barr, I.; Baumeister, E.; Caetano, B.; Chittaganpitch, M.; Darmaa, B.; Ellis, J.; Fasce, R.; et al. Human Respiratory Syncytial Virus and Influenza Seasonality Patterns—Early Findings from the WHO Global Respiratory Syncytial Virus Surveillance. Influenza Other Respir Viruses 2020, 14, 638–646. [Google Scholar] [CrossRef] [PubMed]
- Benítez-Guerra, D.; Piña-Flores, C.; Zamora-López, M.; Escalante-Padrón, F.; Lima-Rogel, V.; González-Ortiz, A.M.; Guevara-Tovar, M.; Bernal-Silva, S.; Benito-Cruz, B.; Castillo-Martínez, F.; et al. Respiratory Syncytial Virus Acute Respiratory Infection-Associated Hospitalizations in Preterm Mexican Infants: A Cohort Study. Influenza Other Respir Viruses 2020, 14, 182–188. [Google Scholar] [CrossRef]
- Gamiño-Arroyo, A.E.; Moreno-Espinosa, S.; Llamosas-Gallardo, B.; Ortiz-Hernández, A.A.; Guerrero, M.L.; Galindo-Fraga, A.; Galán-Herrera, J.F.; Prado-Galbarro, F.J.; Beigel, J.H.; Ruiz-Palacios, G.M.; et al. Epidemiology and Clinical Characteristics of Respiratory Syncytial Virus Infections among Children and Adults in Mexico. Influenza Other Respir Viruses 2017, 11, 48–56. [Google Scholar] [CrossRef] [PubMed]
- Fernandes-Matano, L.; Monroy-Muñoz, I.E.; Uribe-Noguez, L.A.; Hernández-Cueto, M. de L.Á.; Sarquiz-Martínez, B.; Pardavé-Alejandre, H.D.; Coy-Arechavaleta, A.S.; Alvarado-Yaah, J.E.; Rojas-Mendoza, T.; Santacruz-Tinoco, C.E.; et al. [Coinfections by SARS-CoV-2 and other respiratory viruses and their clinical outcome]. Rev Med Inst Mex Seguro Soc 2021, 59, 482–489. [Google Scholar] [PubMed]
- Noyola, D.E.; Hunsberger, S.; Valdés Salgado, R.; Powers, J.H.; Galindo-Fraga, A.; Ortiz-Hernández, A.A.; Ramirez-Venegas, A.; Moreno-Espinosa, S.; Llamosas-Gallardo, B.; Guerrero, M.L.; et al. Comparison of Rates of Hospitalization Between Single and Dual Virus Detection in a Mexican Cohort of Children and Adults With Influenza-Like Illness. Open Forum Infect Dis 2019, 6, ofz424. [Google Scholar] [CrossRef] [PubMed]
- Torres-García, M.; Pérez Méndez, B.B.; Sánchez Huerta, J.L.; Villa Guillén, M.; Rementería Vazquez, V.; Castro Diaz, A.D.; López Martinez, B.; Laris González, A.; Jiménez-Juárez, R.N.; de la Rosa-Zamboni, D. Healthcare-Associated Pneumonia: Don’t Forget About Respiratory Viruses! Front Pediatr 2019, 7, 168. [Google Scholar] [CrossRef] [PubMed]
- Bochkov, Y.A.; Gern, J.E. Rhinoviruses and Their Receptors: Implications for Allergic Disease. Curr Allergy Asthma Rep 2016, 16, 30. [Google Scholar] [CrossRef] [PubMed]
- Vandini, S.; Biagi, C.; Fischer, M.; Lanari, M. Impact of Rhinovirus Infections in Children. Viruses 2019, 11, 521. [Google Scholar] [CrossRef]
- Jackson, D.J.; Gern, J.E. Rhinovirus Infections and Their Roles in Asthma: Etiology and Exacerbations. The Journal of Allergy and Clinical Immunology: In Practice 2022, 10, 673–681. [Google Scholar] [CrossRef]
- Le Glass, E.; Hoang, V.T.; Boschi, C.; Ninove, L.; Zandotti, C.; Boutin, A.; Bremond, V.; Dubourg, G.; Ranque, S.; Lagier, J.-C.; et al. Incidence and Outcome of Coinfections with SARS-CoV-2 and Rhinovirus. Viruses 2021, 13, 2528. [Google Scholar] [CrossRef] [PubMed]
- Varela, F.H.; Sartor, I.T.S.; Polese-Bonatto, M.; Azevedo, T.R.; Kern, L.B.; Fazolo, T.; de David, C.N.; Zavaglia, G.O.; Fernandes, I.R.; Krauser, J.R.M.; et al. Rhinovirus as the Main Co-Circulating Virus during the COVID-19 Pandemic in Children. J Pediatr (Rio J) 2022, 98, 579–586. [Google Scholar] [CrossRef]
- Amarasinghe, G.K.; Aréchiga Ceballos, N.G.; Banyard, A.C.; Basler, C.F.; Bavari, S.; Bennett, A.J.; Blasdell, K.R.; Briese, T.; Bukreyev, A.; Caì (蔡莹芸), Y.; et al. TAXONOMY OF THE ORDER MONONEGAVIRALES: UPDATE 2018. Arch Virol 2018, 163, 2283–2294. [Google Scholar] [CrossRef]
- Ballegeer, M.; Saelens, X. Cell-Mediated Responses to Human Metapneumovirus Infection. Viruses 2020, 12, 542. [Google Scholar] [CrossRef] [PubMed]
- Uddin, S.; Thomas, M. Human Metapneumovirus. In StatPearls; StatPearls Publishing: Treasure Island (FL), 2022. [Google Scholar]
- Rodriguez, P.E.; Frutos, M.C.; Adamo, M.P.; Cuffini, C.; Cámara, J.A.; Paglini, M.G.; Moreno, L.; Cámara, A. Human Metapneumovirus: Epidemiology and Genotype Diversity in Children and Adult Patients with Respiratory Infection in Córdoba, Argentina. PLoS One 2020, 15, e0244093. [Google Scholar] [CrossRef] [PubMed]
- Stein, M.; Cohen, H.; Nemet, I.; Atari, N.; Kliker, L.; Fratty, I.S.; Bucris, E.; Geva, M.; Mendelson, E.; Zuckerman, N.; et al. Human Metapneumovirus Prevalence during 2019-2021 in Israel Is Influenced by the COVID-19 Pandemic. International Journal of Infectious Diseases 2022, 120, 205–209. [Google Scholar] [CrossRef] [PubMed]
- Elboukari, H.; Ashraf, M. Parainfluenza Virus. In StatPearls; StatPearls Publishing: Treasure Island (FL), 2022. [Google Scholar]
- Phan, M.V.T.; Arron, G.; GeurtsvanKessel, C.H.; Huisman, R.C.; Molenkamp, R.; Koopmans, M.P.G.; Cotten, M. Complete Genome Characterization of Eight Human Parainfluenza Viruses from the Netherlands. Microbiol Resour Announc 2019, 8, e00125-19. [Google Scholar] [CrossRef]
- Zhang, C.; Zhang, K.; Zang, G.; Chen, T.; Lu, N.; Wang, S.; Zhang, G. Curcumin Inhibits Replication of Human Parainfluenza Virus Type 3 by Affecting Viral Inclusion Body Formation. Biomed Res Int 2021, 2021, 1807293. [Google Scholar] [CrossRef] [PubMed]
- Trifonova, I.; Christova, I.; Madzharova, I.; Angelova, S.; Voleva, S.; Yordanova, R.; Tcherveniakova, T.; Krumova, S.; Korsun, N. Clinical Significance and Role of Coinfections with Respiratory Pathogens among Individuals with Confirmed Severe Acute Respiratory Syndrome Coronavirus-2 Infection. Frontiers in Public Health 2022, 10. [Google Scholar] [CrossRef] [PubMed]
- Kim, D.; Quinn, J.; Pinsky, B.; Shah, N.H.; Brown, I. Rates of Co-Infection Between SARS-CoV-2 and Other Respiratory Pathogens. JAMA 2020, 323, 2085–2086. [Google Scholar] [CrossRef] [PubMed]
- Kikkert, M. Innate Immune Evasion by Human Respiratory RNA Viruses. J Innate Immun 2020, 12, 4–20. [Google Scholar] [CrossRef] [PubMed]
- Clementi, N.; Ghosh, S.; De Santis, M.; Castelli, M.; Criscuolo, E.; Zanoni, I.; Clementi, M.; Mancini, N. Viral Respiratory Pathogens and Lung Injury. Clin Microbiol Rev 2021, 34, e00103-20. [Google Scholar] [CrossRef]
- Cevik, M.; Tate, M.; Lloyd, O.; Maraolo, A.E.; Schafers, J.; Ho, A. SARS-CoV-2, SARS-CoV, and MERS-CoV Viral Load Dynamics, Duration of Viral Shedding, and Infectiousness: A Systematic Review and Meta-Analysis. Lancet Microbe 2021, 2, e13–e22. [Google Scholar] [CrossRef]
- Fajnzylber, J.; Regan, J.; Coxen, K.; Corry, H.; Wong, C.; Rosenthal, A.; Worrall, D.; Giguel, F.; Piechocka-Trocha, A.; Atyeo, C.; et al. SARS-CoV-2 Viral Load Is Associated with Increased Disease Severity and Mortality. Nat Commun 2020, 11, 5493. [Google Scholar] [CrossRef] [PubMed]
- Ynga-Durand, M.; Maaß, H.; Milošević, M.; Krstanović, F.; Pribanić Matešić, M.; Jonjić, S.; Protić, A.; Brizić, I.; Šustić, A.; Čičin-Šain, L. SARS-CoV-2 Viral Load in the Pulmonary Compartment of Critically Ill COVID-19 Patients Correlates with Viral Serum Load and Fatal Outcomes. Viruses 2022, 14, 1292. [Google Scholar] [CrossRef] [PubMed]
- Hijano, D.R.; Brazelton de Cardenas, J.; Maron, G.; Garner, C.D.; Ferrolino, J.A.; Dallas, R.H.; Gu, Z.; Hayden, R.T. Clinical Correlation of Influenza and Respiratory Syncytial Virus Load Measured by Digital PCR. PLoS One 2019, 14, e0220908. [Google Scholar] [CrossRef] [PubMed]
- Walsh, E.E.; Wang, L.; Falsey, A.R.; Qiu, X.; Corbett, A.; Holden-Wiltse, J.; Mariani, T.J.; Topham, D.J.; Caserta, M.T. Virus-Specific Antibody, Viral Load, and Disease Severity in Respiratory Syncytial Virus Infection. J Infect Dis 2018, 218, 208–217. [Google Scholar] [CrossRef]
- Definiciones_operacionales_de_casos_COVID-19.Pdf.
- LVL_VR-E_RT-PCR_en_tiempo_real_para_el_diagn_stico_de_SARS-CoV-2_Protocolo_de_Berlin.Pdf.
- Kodani, M.; Yang, G.; Conklin, L.M.; Travis, T.C.; Whitney, C.G.; Anderson, L.J.; Schrag, S.J.; Taylor, T.H.; Beall, B.W.; Breiman, R.F.; et al. Application of TaqMan Low-Density Arrays for Simultaneous Detection of Multiple Respiratory Pathogens▿. J Clin Microbiol 2011, 49, 2175–2182. [Google Scholar] [CrossRef]
- Meskill, S.D.; O’Bryant, S.C. Respiratory Virus Co-Infection in Acute Respiratory Infections in Children. Curr Infect Dis Rep 2020, 22, 3. [Google Scholar] [CrossRef] [PubMed]
- Neumann, G.; Kawaoka, Y. Seasonality of Influenza and Other Respiratory Viruses. EMBO Mol Med 2022, 14, e15352. [Google Scholar] [CrossRef] [PubMed]
- Obando-Pacheco, P.; Justicia-Grande, A.J.; Rivero-Calle, I.; Rodríguez-Tenreiro, C.; Sly, P.; Ramilo, O.; Mejías, A.; Baraldi, E.; Papadopoulos, N.G.; Nair, H.; et al. Respiratory Syncytial Virus Seasonality: A Global Overview. J Infect Dis 2018, 217, 1356–1364. [Google Scholar] [CrossRef] [PubMed]
- Tempia, S.; Walaza, S.; Bhiman, J.N.; McMorrow, M.L.; Moyes, J.; Mkhencele, T.; Meiring, S.; Quan, V.; Bishop, K.; McAnerney, J.M.; et al. Decline of Influenza and Respiratory Syncytial Virus Detection in Facility-Based Surveillance during the COVID-19 Pandemic, South Africa, January to October 2020. Euro Surveill 2021, 26, 2001600. [Google Scholar] [CrossRef]
- Casalegno, J.-S.; Ploin, D.; Cantais, A.; Masson, E.; Bard, E.; Valette, M.; Fanget, R.; Targe, S.C.; Myar-Dury, A.-F.; Doret-Dion, M.; et al. Characteristics of the Delayed Respiratory Syncytial Virus Epidemic, 2020/2021, Rhône Loire, France. Euro Surveill 2021, 26, 2100630. [Google Scholar] [CrossRef]
- Yeoh, D.K.; Foley, D.A.; Minney-Smith, C.A.; Martin, A.C.; Mace, A.O.; Sikazwe, C.T.; Le, H.; Levy, A.; Blyth, C.C.; Moore, H.C. Impact of Coronavirus Disease 2019 Public Health Measures on Detections of Influenza and Respiratory Syncytial Virus in Children During the 2020 Australian Winter. Clin Infect Dis 2021, 72, 2199–2202. [Google Scholar] [CrossRef] [PubMed]
- Li, Y.; Reeves, R.M.; Wang, X.; Bassat, Q.; Brooks, W.A.; Cohen, C.; Moore, D.P.; Nunes, M.; Rath, B.; Campbell, H.; et al. Global Patterns in Monthly Activity of Influenza Virus, Respiratory Syncytial Virus, Parainfluenza Virus, and Metapneumovirus: A Systematic Analysis. The Lancet Global Health 2019, 7, e1031–e1045. [Google Scholar] [CrossRef] [PubMed]
- Arellanos-Soto, D.; Padilla-Rivas, G.; Ramos-Jimenez, J.; Galan-Huerta, K.; Lozano-Sepulveda, S.; Martinez-Acuña, N.; Treviño-Garza, C.; Montes-de-Oca-Luna, R.; de-la-O-Cavazos, M.; Rivas-Estilla, A.M. Decline in Influenza Cases in Mexico after the Implementation of Public Health Measures for COVID-19. Sci Rep 2021, 11, 10730. [Google Scholar] [CrossRef]
- Comte, A.; Bour, J.-B.; Darniot, M.; Pitoiset, C.; Aho-Glélé, L.S.; Manoha, C. Epidemiological Characteristics and Clinical Outcomes of Human Rhinovirus Infections in a Hospitalized Population. Severity Is Independently Linked to RSV Coinfection and Comorbidities. J Clin Virol 2020, 125, 104290. [Google Scholar] [CrossRef]
- Chatzis, O.; Darbre, S.; Pasquier, J.; Meylan, P.; Manuel, O.; Aubert, J.D.; Beck-Popovic, M.; Masouridi-Levrat, S.; Ansari, M.; Kaiser, L.; et al. Burden of Severe RSV Disease among Immunocompromised Children and Adults: A 10 Year Retrospective Study. BMC Infect Dis 2018, 18, 111. [Google Scholar] [CrossRef]
- Pacheco, G.A.; Gálvez, N.M.S.; Soto, J.A.; Andrade, C.A.; Kalergis, A.M. Bacterial and Viral Coinfections with the Human Respiratory Syncytial Virus. Microorganisms 2021, 9, 1293. [Google Scholar] [CrossRef]
- Vos, L.M.; Bruyndonckx, R.; Zuithoff, N.P.A.; Little, P.; Oosterheert, J.J.; Broekhuizen, B.D.L.; Lammens, C.; Loens, K.; Viveen, M.; Butler, C.C.; et al. Lower Respiratory Tract Infection in the Community: Associations between Viral Aetiology and Illness Course. Clin Microbiol Infect 2021, 27, 96–104. [Google Scholar] [CrossRef] [PubMed]
- Peng, D.; Zhao, X.; Liu, E.; Huang, Y.; Yang, X.; Zhao, Y.; Chen, X.; Zhang, Z. Analysis of Viral Load in Children Infected with Human Metapneumovirus. Iran J Pediatr 2010, 20, 393–400. [Google Scholar]
- Kumar, N.; Sharma, S.; Barua, S.; Tripathi, B.N.; Rouse, B.T. Virological and Immunological Outcomes of Coinfections. Clin Microbiol Rev 2018, 31, e00111-17. [Google Scholar] [CrossRef]
- Pinky, L.; Dobrovolny, H.M. Coinfections of the Respiratory Tract: Viral Competition for Resources. PLoS One 2016, 11, e0155589. [Google Scholar] [CrossRef]
- Pinky, L.; Dobrovolny, H.M. SARS-CoV-2 Coinfections: Could Influenza and the Common Cold Be Beneficial? J Med Virol 2020, 92, 2623–2630. [Google Scholar] [CrossRef] [PubMed]
- JOSHI, P.; SHAW, A.; KAKAKIOS, A.; ISAACS, D. Interferon-Gamma Levels in Nasopharyngeal Secretions of Infants with Respiratory Syncytial Virus and Other Respiratory Viral Infections. Clin Exp Immunol 2003, 131, 143–147. [Google Scholar] [CrossRef] [PubMed]
- Sarkar, S.; Ratho, R.K.; Singh, M.; Singh, M.P.; Singh, A.; Sharma, M. Comparative Analysis of Epidemiology, Clinical Features, and Cytokine Response of Respiratory Syncytial and Human Metapneumovirus Infected Children with Acute Lower Respiratory Infections. Jpn J Infect Dis 2022, 75, 56–62. [Google Scholar] [CrossRef] [PubMed]
- Raita, Y.; Pérez-Losada, M.; Freishtat, R.J.; Harmon, B.; Mansbach, J.M.; Piedra, P.A.; Zhu, Z.; Camargo, C.A.; Hasegawa, K. Integrated Omics Endotyping of Infants with Respiratory Syncytial Virus Bronchiolitis and Risk of Childhood Asthma. Nat Commun 2021, 12, 3601. [Google Scholar] [CrossRef] [PubMed]
- Shibabaw, T. Inflammatory Cytokine: IL-17A Signaling Pathway in Patients Present with COVID-19 and Current Treatment Strategy. J Inflamm Res 2020, 13, 673–680. [Google Scholar] [CrossRef]
- Lieberman, N.A.P.; Peddu, V.; Xie, H.; Shrestha, L.; Huang, M.-L.; Mears, M.C.; Cajimat, M.N.; Bente, D.A.; Shi, P.-Y.; Bovier, F.; et al. In Vivo Antiviral Host Transcriptional Response to SARS-CoV-2 by Viral Load, Sex, and Age. PLOS Biology 2020, 18, e3000849. [Google Scholar] [CrossRef]
- Churiso, G.; Husen, G.; Bulbula, D.; Abebe, L. Immunity Cell Responses to RSV and the Role of Antiviral Inhibitors: A Systematic Review. IDR 2022, Volume 15, 7413–7430. [Google Scholar] [CrossRef]
| Cytokine | Controls | RSV | MPV | RV | PIV-3 | ||||||||||
|---|---|---|---|---|---|---|---|---|---|---|---|---|---|---|---|
| n | Median | Percentile 25-75 | n | Median | Percentile 25-75 | n | Median | Percentile 25-75 | n | Median | Percentile 25-75 | n | Median | Percentile 25-75 | |
| Eotaxin | 3 | 0.63 | 0.18-1.11 | 5 | 1.05 | 0.50-1.40 | 5 | 0.75 | 0.32-1.01 | 4 | 0.67 | 0.5-2.09 | 3 | 0 | 0-0.72 |
| FGF basic | 3 | 25.9 | 0-29.73 | 5 | 15.405 | 14.19-37.73 | 5 | 14.19 | 0-16.56 | 4 | 7.40 | 1.66-16.55 | 3 | 0 | 0-17.66 |
| G-CSF | 3 | 425.72 | 201.56-830.91 | 5 | 223.83 | 196.29-341.91 | 5 | 472.28 | 432.48-645.06 | 4 | 1144.28 | 782.8-2624.34 | 3 | 239.43 | 55.5-1486.55 |
| GM-CSF | 3 | 6.78 | 0-7.7 | 5 | 5.03 | 0-9.83 | 5 | 2.37 | 0-8.91 | 4 | 2.87 | 1.12-4.56 | 3 | 0 | 0-3.26 |
| IL-1β | 3 | 0.00 | 0-0.57 | 5 | 0.18 | 0-0.57 | 5 | 0 | 0-0.57 | 4 | 0.23 | 0-0.51 | 3 | 0 | 0-0.03 |
| IL-1RA | 3 | 14.28 | 0-14.28 | 5 | 77.39 | 57.18-155.06 | 5 | 14.28 | 0-160.01 | 4 | 38.03 | 16.95-49.67 | 3 | 14.28 | 0-64.17 |
| IL-2 | 3 | 6.12 | 2.9-8.19 | 5 | 2.39 | 1.23-11.30 | 5 | 4.46 | 4.05-4.67 | 4 | 2.49 | 2.28-2.90 | 3 | 1.65 | 0-3.95 |
| IL-4 | 3 | 0.00 | 0-0 | 5 | 0.00 | 0-0 | 5 | 0 | 0-0 | 4 | 0 | 0-0 | 3 | 0 | 0-1.89 |
| IL-5 | 3 | 27.57 | 0-31.67 | 5 | 0.00 | 0-2.39 | 5 | 0 | 0-23.42 | 4 | 0.26 | 0-11.62 | 3 | 0 | 0-5.73 |
| IL-6 | 3 | 2.45 | 0.51-2.61 | 5 | 2.09 | 0-4.71 | 5 | 1.28 | 0.42-1.65 | 4 | 0.52 | 0.16-0.91 | 3 | 0 | 0-1.82 |
| IL-7 | 3 | 0.00 | 0-0 | 5 | 0 | 0-0 | 5 | 0 | 0-0 | 4 | 0 | 0-0 | 3 | 0 | 0-0 |
| IL-8 | 3 | 3.92 | 2.7-5.73 | 5 | 6.33 | 3.11-9.77 | 5 | 14.22 | 6.03-18.27 | 4 | 28.21 | 8.27-171.76 | 3 | 2.81 | 0-3.3 |
| IL-9 | 3 | 9.00 | 7.65-10.52 | 5 | 8.33 | 6.96-10.68 | 5 | 7.98 | 5.76-9.33 | 4 | 7.30 | 5.06-8.49 | 3 | 13.35 | 7.98-34.29 |
| IL-10 | 3 | 1.82 | 0.03-2.09 | 5 | 1.67 | 0-2.36 | 5 | 1.40 | 0.51-1.53 | 4 | 2.36 | 1.66-2.36 | 3 | 0.96 | 0-1.53 |
| IL-12p70 | 3 | 0.00 | 0-2.33 | 5 | 0.00 | 0-0 | 5 | 0 | 0-0 | 4 | 0 | 0-0 | 3 | 0 | 0-0 |
| IL-13 | 3 | 0.00 | 0-0 | 5 | 0.00 | 0-1.22 | 5 | 0.45 | 0.32-0.56 | 4 | 0 | 0-0.3 | 3 | 0 | 0-0.78 |
| IL-15 | 3 | 333.08 | 222.98-449.64 | 5 | 194.16 | 0-260.6 | 5 | 242.48 | 242.48-248.66 | 4 | 211.26 | 86.93-271.18 | 3 | 111.71 | 0-372.8 |
| IL-17A | 3 | 12.09 | 9.98-12.8 | 5 | 6.62 | 0.33-8.06 | 5 | 13.74 | 11.16-18.36 | 4 | 5.38 | 3.39-7.46 | 3 | 6.12 | 0-7.1 |
| IFN-γ | 3 | 2.66 | 0-3.05 | 5 | 3.23 | 1.74-3.33 | 5 | 2.66 | 2.06-3.96 | 4 | 2.56 | 2.36-2.66 | 3 | 2.16 | 0.14-6.2 |
| IP-10 | 3 | 18.08 | 0-22.07 | 5 | 5.24 | 0-8.49 | 5 | 25.49 | 12.3-268.52 | 4 | 314.85 | 185.39-437.22 | 3 | 0 | 0-10.59 |
| MCP-1 | 3 | 0.83 | 0-3.48 | 5 | 2.13 | 0-3.48 | 5 | 6.14 | 5.75-6.14 | 4 | 15.02 | 5.93-24.46 | 3 | 0.83 | 0-0.83 |
| MIP-1α | 3 | 0.45 | 0-0.62 | 5 | 1.31 | 1.31-1.58 | 5 | 0.98 | 0.84-1.31 | 4 | 1.97 | 1.43-9.16 | 3 | 1.35 | 0.71-1.35 |
| MIP-1β | 3 | 6.89 | 3.78-14.51 | 5 | 14.18 | 7.73-15.83 | 5 | 23.21 | 8.63-23.91 | 4 | 52.17 | 36.61-187.19 | 3 | 2.79 | 0-17.61 |
| PDGF-BB | 3 | 40.26 | 18.72-54.24 | 5 | 39.45 | 26.88-52.73 | 5 | 25.73 | 19.65-30.35 | 4 | 59.45 | 38.45-68.84 | 3 | 21.51 | 0-40.26 |
| RANTES | 3 | 9.51 | 4.59-10.73 | 5 | 15.12 | 5.1-16.53 | 5 | 13.59 | 10.73-13.94 | 4 | 8.60 | 5.50-16.73 | 3 | 6.09 | 1.37-7.44 |
| TNF-α | 3 | 0.00 | 0-0 | 5 | 7.05 | 0-12.47 | 5 | 0 | 0-1.70 | 4 | 0.85 | 0-2.12 | 3 | 0 | 0-0 |
| VEGF | 3 | 377.79 | 187.52-589.74 | 5 | 0 | 0-0 | 5 | 0 | 0-0 | 4 | 43.46 | 0-90.29 | 3 | 0 | 0-245.75 |
| Cytokine | RV+RSV | RV+PIV-3 | MPV+RSV | RV+MPV | ||||||||
|---|---|---|---|---|---|---|---|---|---|---|---|---|
| n | Median | Percentile 25-75 | n | Median | Percentile 25-75 | n | Median | Percentile 25-75 | n | Median | Percentile 25-75 | |
| Eotaxin | 4 | 1.43 | 0.7-2 | 2 | 0.4 | 0.11-0.69 | 2 | 0.44 | 0-0.89 | 1 | 0 | --- |
| FGF basic | 4 | 7.7 | 0-62.17 | 2 | 0 | 0-0 | 2 | 0 | 0-0 | 1 | 0 | --- |
| G-CSF | 4 | 1035.1 | 394.4-1808.09 | 2 | 262.81 | 110.99-414.63 | 2 | 134.41 | 119.33-149.49 | 1 | 3655.38 | --- |
| GM-CSF | 4 | 4.47 | 0.19-8.65 | 2 | 1.12 | 0-2.24 | 2 | 11.69 | 4.4-18.98 | 1 | 0 | --- |
| IL-1β | 4 | 0 | 0-0.38 | 2 | 0 | 0-0 | 2 | 0 | 0-0 | 1 | 0 | --- |
| IL-1RA | 4 | 75.03 | 0-228.37 | 2 | 96.96 | 33.9-160.01 | 2 | 0 | 0-0 | 1 | 0 | --- |
| IL-2 | 4 | 2.64 | 1.34-5.3 | 2 | 0 | 0-0 | 2 | 1.39 | 0.81-1.97 | 1 | 0 | --- |
| IL-4 | 4 | 0.18 | 0-0.5 | 2 | 0.71 | 0-1.41 | 2 | 0.29 | 0-0.59 | 1 | 0 | --- |
| IL-5 | 4 | 2.05 | 0-32.57 | 2 | 0 | 0-0 | 2 | 0 | 0-0 | 1 | 0 | --- |
| IL-6 | 4 | 0.16 | 0-0.98 | 2 | 1.22 | 0-2.45 | 2 | 0 | 0-0 | 1 | 20.7 | --- |
| IL-7 | 4 | 0 | 0-9.72 | 2 | 0 | 0-0 | 2 | 1.26 | 0-2.52 | 1 | 0 | --- |
| IL-8 | 4 | 42.25 | 22.43-205.58 | 2 | 12.43 | 0-24.86 | 2 | 3.37 | 0-6.74 | 1 | 6.84 | --- |
| IL-9 | 4 | 11.44 | 3.45-17.3 | 2 | 9.77 | 4.55-15 | 2 | 5.58 | 4.55-6.62 | 1 | 4.02 | --- |
| IL-10 | 4 | 1.1 | 0.33-5.3 | 2 | 0 | 0-0 | 2 | 0.55 | 0-1.1 | 1 | 0 | --- |
| IL-12p70 | 4 | 0 | 0-2.48 | 2 | 0 | 0-0 | 2 | 0 | 0-0 | 1 | 0 | --- |
| IL-13 | 4 | 0.82 | 0-2.12 | 2 | 0.39 | 0-0.78 | 2 | 0.74 | 0-1.49 | 1 | 0 | --- |
| IL-15 | 4 | 151.46 | 97.45-252.24 | 2 | 52.47 | 0-104.94 | 2 | 238.63 | 0-477.26 | 1 | 0 | --- |
| IL-17A | 4 | 15.86 | 2.94-32.295 | 2 | 1.17 | 0.5-1.85 | 2 | 9.36 | 6.86-11.87 | 1 | 2.1 | --- |
| IFN-γ | 4 | 1.19 | 0.32-4.22 | 2 | 3.29 | 1.4-5.19 | 2 | 0.92 | 0-1.85 | 1 | 0 | --- |
| IP-10 | 4 | 415.38 | 145.83-2349.82 | 2 | 3.79 | 0-7.58 | 2 | 27.11 | 0-54.21 | 1 | 418.28 | --- |
| MCP-1 | 4 | 24.53 | 7.64-71.65 | 2 | 1.67 | 0-3.33 | 2 | 7.57 | 3.17-11.97 | 1 | 16.1 | --- |
| MIP-1α | 4 | 7.83 | 0.7-16.7 | 2 | 0.96 | 0.53-1.4 | 2 | 0.49 | 0-0.98 | 1 | 1.2 | --- |
| MIP-1β | 4 | 56.27 | 11.84-153.4 | 2 | 4.59 | 3.96-5.22 | 2 | 2.54 | 1.29-3.78 | 1 | 27.83 | --- |
| PDGF-BB | 4 | 25.97 | 11.66-45.14 | 2 | 0 | 0-0 | 2 | 29.57 | 11.78-47.36 | 1 | 0 | --- |
| RANTES | 4 | 11.86 | 8.48-61.88 | 2 | 4.21 | 2.82-5.6 | 2 | 4.34 | 3.59-5.1 | 1 | 0 | --- |
| TNF-α | 4 | 4.57 | 0-16.08 | 2 | 0 | 0-0 | 2 | 3.53 | 0-7.05 | 1 | 13.76 | --- |
| VEGF | 4 | 88.40 | 0-201.26 | 2 | 14.02 | 0-28.04 | 2 | 50.06 | 0-100.13 | 1 | 0 | --- |
| Cytokine | SARS-CoV-2 | SARS-CoV-2+PIV-3 | ||||
|---|---|---|---|---|---|---|
| n | Median | Percentile 25-75 | n | Median | Percentile 25-75 | |
| Eotaxin | 6 | 0.44 | 0.24-0.72 | 2 | 0.74 | 0.24-1.25 |
| FGF basic | 6 | 0 | 0-0 | 2 | 12.13 | 0-24.26 |
| G-CSF | 6 | 741.42 | 116.55-2274.51 | 2 | 269.42 | 136.55-402.29 |
| GM-CSF | 6 | 0 | 0-0 | 2 | 3.11 | 0-6.21 |
| IL-1β | 6 | 0 | 0-0.63 | 2 | 0 | 0-0 |
| IL-1RA | 6 | 32.09 | 0-89.82 | 2 | 49.88 | 49.88-49.88 |
| IL-2 | 6 | 4.1 | 1.76-5.91 | 2 | 2.59 | 1.76-3.42 |
| IL-4 | 6 | 0 | 0-0 | 2 | 0 | 0-0 |
| IL-5 | 6 | 3.26 | 0-25.5 | 2 | 6.77 | 2.39-11.16 |
| IL-6 | 6 | 0 | 0-0 | 2 | 1.55 | 1.1-2 |
| IL-7 | 6 | 0 | 0-0 | 2 | 0 | 0-0 |
| IL-8 | 6 | 3.71 | 3.11-8.36 | 2 | 1.65 | 0-3.3 |
| IL-9 | 6 | 4.36 | 0.95-11.69 | 2 | 5.93 | 5.24-6.62 |
| IL-10 | 6 | 0 | 0-1.82 | 2 | 0.95 | 0.66-1.25 |
| IL-12p70 | 6 | 0 | 0-0 | 2 | 0 | 0-0 |
| IL-13 | 6 | 0 | 0-0 | 2 | 0.16 | 0-0.32 |
| IL-15 | 6 | 237.33 | 0-328.4 | 2 | 298.72 | 288.42-309.02 |
| IL-17A | 6 | 1.95 | 0-14.21 | 2 | 3.71 | 1.05-6.36 |
| IFN-γ | 6 | 0.85 | 0.0-1.4 | 2 | 2.84 | 1.62-4.05 |
| IP-10 | 6 | 203.91 | 128.09-240.17 | 2 | 121.76 | 0.83-242.7 |
| MCP-1 | 6 | 6.56 | 0-14.75 | 2 | 4.28 | 0.15-8.4 |
| MIP-1α | 6 | 0.84 | 0-1.67 | 2 | 1.52 | 0.98-2.07 |
| MIP-1β | 6 | 17.08 | 7.65-29.54 | 2 | 21.38 | 1.19-41.57 |
| PDGF-BB | 6 | 18.7 | 0-45.8 | 2 | 24.48 | 17.76-31.2 |
| RANTES | 6 | 3.26 | 0.96-5.34 | 2 | 6.08 | 4.35-7.82 |
| TNF-α | 6 | 0 | 0-9.81 | 2 | 0.4 | 0-0.8 |
| VEGF | 6 | 274.63 | 0-414.8 | 2 | 212.45 | 194.46-230.43 |
Disclaimer/Publisher’s Note: The statements, opinions and data contained in all publications are solely those of the individual author(s) and contributor(s) and not of MDPI and/or the editor(s). MDPI and/or the editor(s) disclaim responsibility for any injury to people or property resulting from any ideas, methods, instructions or products referred to in the content. |
© 2023 by the authors. Licensee MDPI, Basel, Switzerland. This article is an open access article distributed under the terms and conditions of the Creative Commons Attribution (CC BY) license (http://creativecommons.org/licenses/by/4.0/).


