
Submitted:
11 December 2023
Posted:
12 December 2023
You are already at the latest version
Abstract
Membrane filtration is a popular choice in the treatment of wastewater for reuse. However, when used to produce clean water, these devices are subject to concentration polarization and fouling, which inhibit their ability to operate efficiently and provide high-quality permeate streams. Patterned membrane surfaces offer a hydrodynamic approach to mitigating concentration polarization and the surface fouling that follows. However, when subject to a steady feed flow rate, surface patterns generally produce stagnant zones in cavity-like spaces where particulate from the bulk flow recirculates in stationary vortices. To prevent aggregation in these recirculation zones, and therefore the onset of surface fouling, we study a rapidly pulsed feed flow. When combined with cavity-like geometries, such as the valleys present in membrane surface patterns, a rapidly pulsed flow generates mixing mechanisms (i.e., the deep sweep and the vortex ejection) that disrupt otherwise stagnant regions. First, we confirm the existence of these mechanisms, which are typically induced in impermeable cavities at relatively low Reynolds numbers, for near transitional feed Reynolds numbers in permeable cavity spaces via numerical simulation of the flow field. Following this confirmation, we demonstrate the ability of these mechanisms to remove particles trapped in recirculation zones via massless particle tracking studies. The results of this work suggest that when combined with a rapidly pulsed inlet flow, patterned membrane surfaces can not only alleviate concentration polarization and the surface fouling that follows but also reduce the need for traditional cleaning methods, which require operational downtime and often involve the use of abrasive chemical agents.
Keywords:
filtration
; concentration polarization
; fouling
; surface pattern
; pulsed flow
; vortex ejection
; deep sweep
1. Introduction
Membrane filtration is a popular choice in the treatment of wastewater for reuse [1,2,3]. In comparison to other treatment technologies, membranes require less energy than thermal treatment processes and less time than traditional filtration methods (e.g., sand filtration). Further benefits of membrane technologies are modest footprints, relatively low capital costs, and a demonstrated efficacy in producing pathogen-free outputs. However, in application to complex waste streams with high fouling potential, membranes face significant operational challenges.
1.1. Concentration Polarization and Membrane Fouling
Membranes used in the treatment of wastewater, and subsequent production of clean water, are subject to concentration polarization and fouling at their surface. Fouling can be loosely defined as a catch-all term for phenomena that reduce the productivity and selectivity of a membrane over time. Similar to fouling, concentration polarization poses resistance to permeate flow, and is a result of membrane selectivity. Solutes retained at the membrane surface are slow to diffuse back into the bulk flow, resulting in an elevated concentration at the membrane surface (up to 20 – 50 times the concentration in the bulk flow [4]). The presence of this concentrated solute layer increases the resistance to permeate flow and decreases the productivity of the system [5]. Readers are directed to Song and Elimelech [6] for a thorough overview of the hydrodynamics and thermodynamics of concentration polarization and the surface fouling (i.e., cake and gel layer growth) that follows.
Although concentration polarization is a reversible phenomenon (often mitigated via disturbance of the mass boundary layer at the membrane surface [4]), it leads to fouling of the membrane surface when left uncurbed [7,8]. Shang et al. [9] explain that fouling stemming from concentration polarization significantly thwarts the wide scale adoption of nanofiltration. Baker [4] confirms that the phenomenon poses similar operational challenges to the implementation of microporous membranes (i.e., microfiltration and ultrafiltration modules). Gençal et al. [10] assert, like many other authors (e.g., Jamshidi Gohari et al. [11], Maruf et al. [12], Çulfaz et al. [13], etc.), that concentration polarization and the membrane fouling that ensues pose the most significant hurdles in the application of pressure-driven membrane process.
Fouling at the membrane surface is typically abated through use of chemical modification of the membrane surface or cleaning procedures. The former, while undoubtedly beneficial to the targeting and rejection of certain contaminant species, is cautioned by authors who express concerns about stability, longevity, and effect on membrane performance (e.g., Upadhyaya et al. [14], Choi et al. [15], Maruf et al. [12], etc.). And the latter, while routinely used to restore membrane performance, is associated with a number of significant drawbacks. Chemicals commonly used in cleaning procedures can deteriorate the physical properties of the membrane surface, reducing selectivity to solutes in the feed stream [16], especially in the case of polymeric modules [17] and other thin film composites [18]. Membranes can also be damaged by incorrect chemical cleaning procedures [19]. And finally, one must consider the negative environmental impacts of chemical use [20]. Thus, it is advantageous to minimize the need for and frequency of chemical cleanings.
1.2. Hydrodynamic Intervention
To postpone the need for chemical cleaning procedures, it is necessary to mitigate particle aggregation at the membrane surface – the precursor to membrane fouling. Following, we discuss the recent attempts to mitigate particle aggregating and deposition at the membrane surface via hydrodynamic manipulation of the feed flow and patterning of the membrane surface.
1.2.1. Flow Manipulation
To reduce the severity of concentration polarization, the mass boundary layer at the membrane surface is disturbed through a variety of standard techniques; we note that this discussion pertains strictly to crossflow filtration. The most common of these techniques is to force the feed flow into the transitional/turbulent flow regime to increase wall shear and induce local turbulence; it is widely recognized that low feed Reynolds numbers result in increased concentration polarization [21]. This method, however, is often prohibitive due to the associated energy demand of feed pumps [12]. Other commonplace techniques include limiting the length of the membrane surface (to inhibit boundary layer growth) and utilizing pulsatile flows, flow reversals, and centrifugal instabilities [22]. Anything other than a forward feed flow, however, requires operational downtime, thwarting the productivity of the membrane.
1.2.2. Patterned Membrane Surfaces
Patterned membrane surfaces, which induce local turbulence and high surface shear, offer yet another hydrodynamic approach to mitigating concentration polarization and surface fouling. Multiple research groups have demonstrated the ability to create micro- and nano-structures on flat and tubular membrane surfaces. Among them, we highlight Won et al. [23,24,25], who demonstrate successful fabrication of membrane surfaces with pyramids and prism patterns; in our work, we replicate the two-dimensional surface pattern utilized by Won et al. [24]. Heinz et al. [26] provide a comprehensive list of thirty-five studies concerning the fabrication of patterned polymeric membrane surfaces used in separation applications. Barambu et al. [27] summarize the approaches used to produce these patterns and the subsequent effect on membrane performance.
Although a relatively new research endeavor, there is ample numerical and experimental evidence that patterned membrane surfaces effectively mitigate concentration polarization. Çulfaz et al. [13,28] appear to be among the first to study the effect of a controlled surface pattern on fouling and membrane performance. There was, however, ample interest in the study of spacer patterns in cross flow channels beforehand (e.g., see Ma and Song [29] for results and a brief summary of prior studies). In their study on the fouling behavior of micro-structured hollow fibers in the filtration of sodium alginate, Çulfaz et al. found that in comparison to smooth fibers, the structured fibers exhibited a higher degree of reversibility in surface fouling. The authors attribute this phenomenon to a looser packing of the deposited particles onto the structured membrane, which are ultimately more conducive to removal procedures. Similar results were obtained by Rickman et al. [30], who found that patterned membranes recover more of their initial flux than their nonpatterned counterparts. Further, Ward et al. [31] found that when exposed to feed streams containing E. coli cells, nanopatterned membranes recovered 18% more of their initial flux than non-patterned membranes. In this case, the improved cleanability of the patterned membrane is attributed to the fact that the E. coli cells cannot not deposit into the valleys of the membrane, thus thwarting the rate of biofouling in these regions [31].
Following the work of Çulfaz et al. [13,28], Won et al. [25] utilized a new patterning process to treat wastewater in crossflow; they found that the deposition of microbial cells onto the patterned membrane surface was significantly reduced. The authors attribute the reduction to the apexes of the surface pattern, which they deem responsible for inducing local turbulence and high shear – a conclusion also supported by their later work on the biofouling of prism patterns [23]. Shortly after the work of Won et al. [25], Lee et al. [32] published similar findings, indicating the importance of flow characteristics and shear stress distribution to the frequency and severity of particle deposition in the valleys of the surface pattern. Shang et al. [9] later confirmed that reduction in concentration and thickness of the concentration polarization layer are attributed to the increased shear generated by the surface pattern.
In another study on triangular patterned surfaces, Choi et al. [33] highlight a dependence on the size of the particles in the feed suspension and pore water flux in addition to crossflow feed rate. The authors find that, for the microfiltration of mixed suspensions (i.e., those with a large distribution in particle size), the deposition of larger particles affects the flow streamlines, and therefore the deposition of smaller particles. They also find that the bulk flow and vortex streamlines are “well-separated” from one another, making it difficult for small particles to traverse the separation and deposit onto the valleys of the membrane surface. Jung et al. [34] find that the particles they studied tended to deposit into the surface valleys and not at the peaks, indicating a conclusion later drawn by Jung and Ahn [35]: a patterned membrane surface can tremendously reduce surface fouling, given a judicious choice in Reynolds number and pattern depth relative to average particle size. Won et al. [24] provide a numerical investigation of patterned membrane surfaces; manipulating the parameters of the surface pattern to determine the effect on particle deposition. The authors show that the tested patterns yield a significant reduction in the mass attached to the membrane wall. Maruf et al. [12] and Jamshidi Gohari et al. [11] demonstrate a decrease in surface fouling accompanied by an increase in orientation angle between the surface pattern lines and feed flow direction. Wang et al. [36] provide a thorough summary of the work that has been done, to date, on correlating pattern configuration with the rate of particle deposition and fouling, numerically and experimentally. Again, we note that the summarized works focus only on a steady inlet flow condition.
2. Window of Opportunity
Although there is extensive documentation that patterned membrane surfaces reduce the thickness and degree of concentration in the concentration polarization layer, surface patterns produce stationary vortices in valleys and cavity-like spaces capable of trapping buoyant particles. It is recognized that the presence of these stagnant zones promotes particle aggregation and induces surface fouling in the pattern valleys [10,32,34,36]. Wang et al. [36] explain that while vortices can create flow separation in pattern valleys, and therefore hinder particle deposition along the valley surface, they can also capture foulants. Once captured, foulants generally remain in the recirculation zone as they are slow to diffuse back into the bulk flow. For example, in their study of a rectangular surface pattern, Gençal et al. [10] found that an increase in surface pattern height, relative to pattern width, created larger dead-zones in the pattern bottoms, and exacerbated surface fouling. Given the tendency of trapped particles to aggregate and aggravate surface fouling in pattern valleys, there remains the need to flush these stagnant zones with a comparatively clean flow volume; thus, we look to the vortex ejection and deep sweep mechanisms. Given the ability to induce these mechanisms during the processing of wastewater, they are attractive alternatives to traditional cleaning methods (i.e., clean water flushes and chemical cleanings) which require operational downtime and often subject membrane surfaces to degradation.
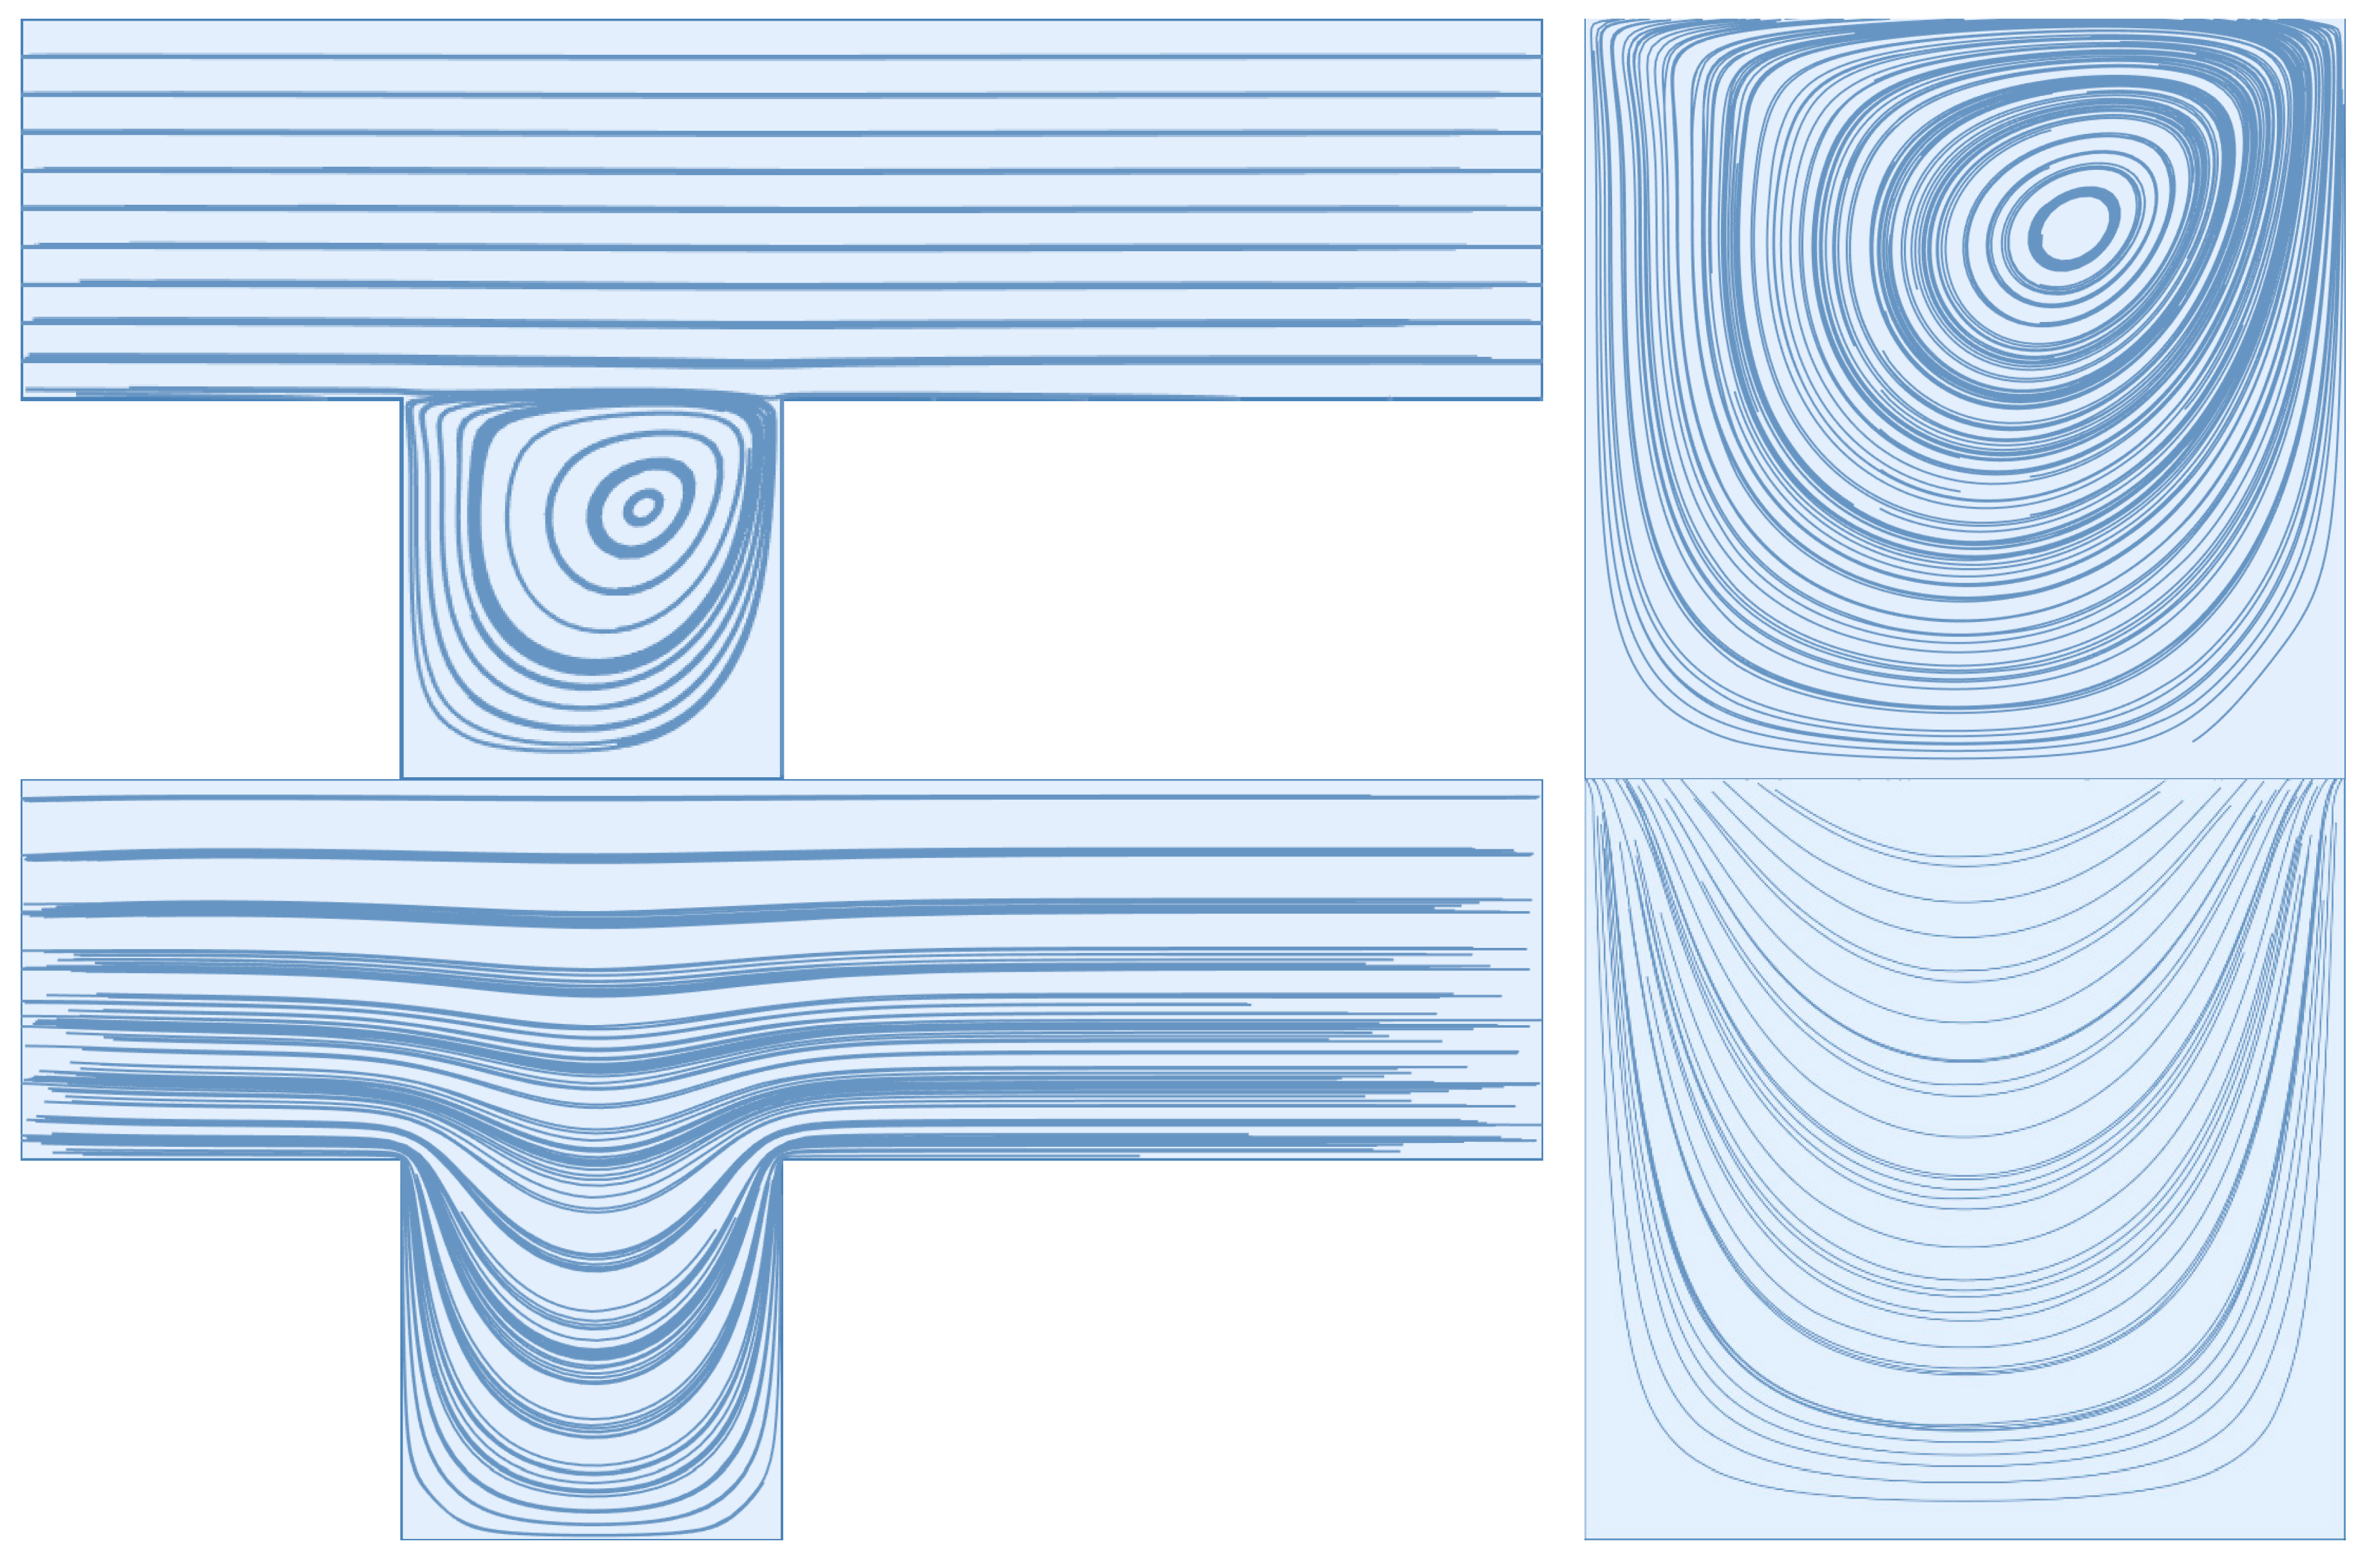
The deep sweep and vortex ejection mechanisms are generated by rapidly pulsed flow – a sudden decrease in feed flow volume results in an ejection of the cavity vortex, while a sudden increase in feed flow volume results in a deep sweep of the feed flow into the cavity space. We illustrate these mechanisms below for the dead-end pore model, which is discussed extensively by Young and Kabala [37] and is standard in the study of impermeable surfaces with patterns and groves, e.g., Shen and Floryan [38] and Fang et al. [39]. For comparison, we also provide illustration of a stationary cavity vortex driven by a steady feed flow. We remind readers that there is a no-slip and no-penetration condition applied to the upper and lower boundaries of the pictured simulation domain; flow direction is from left to right. Readers are referred to the supplemental material (DEP_CavityAnimation.mp4) to observe these mechanisms in sequence.
Figure 1.
(from top to bottom) A stationary cavity vortex driven by a steady feed flow with a Reynolds number of 600, the deep sweep, and the vortex ejection.
Figure 1.
(from top to bottom) A stationary cavity vortex driven by a steady feed flow with a Reynolds number of 600, the deep sweep, and the vortex ejection.
Previously, Kahler and Kabala [40,41,42] found that these mechanisms are responsible for enhanced transport between cavity spaces and the bulk flow. In simulation, they found that rapidly pulsed pumping recovered 11% more contaminant than steady flow. They also found that rapidly pulsed pumping recovered the same amount of contaminant as steady flow 7 times faster [40]. Therefore, it is plausible to suspect that rapidly pulsed pumping could disrupt concentration polarization at the membrane surface via the deep sweep and the vortex ejection mechanisms. Given the ability of these mechanisms to move otherwise trapped particles back into the bulk flow, a rapidly pulsed feed flow could greatly reduce the fouling of patterned membrane surfaces. Thus, we use this work as an opportunity to subject a patterned membrane surface to a rapidly pulsed inlet flow, numerically. We carry out this simulation work for average feed Reynolds numbers in the laminar flow regime and a permeate flow condition at the membrane surface.
3. Methods
In this study, we replicate the simulation parameters utilized by Won et al. [24]; namely, a two-dimensional, isosceles triangle prism pattern with a height and width of 400 micrometers (pictured below and labeled pattern B in their work), a crossflow velocity with a Reynolds number of 600 and 1600, and a constant permeate flow rate (i.e., membrane flux) 1/2000 of the maximum feed flow velocity. To approximate the trajectories of particles in the feed solution, we integrate the flow field, given an initial starting position for each particle. We note that this process does not account for particle mass or other physical/chemical characteristics, interactions with other particles in the feed solution, or with the membrane surface.
3.1. Numerical Solver
The numerical solver used in this work is the same as the solver described by Young and Kabala [37,43], which we provide a brief overview of below. First, we use Mathematica’s numerical differential equation solver, NDSolve, to solve the incompressible form of the continuity (mass conservation) and Navier-Stokes (momentum evolution) equations in two-dimensions. Slight modifications to the solver allow for solution in the (non-dimensional) time-domain (i.e., retention of the local acceleration term in the Navier-Stokes equations). Use of these simplified forms requires that we also greatly simplify the chemistry and complexity of real feed streams; in this work, we assume the properties of water at standard conditions. At the domain boundaries, we apply a set of Dirichlet boundary conditions to specify a fully developed laminar flow profile at the channel inlet, the no-slip and no penetration along the top channel boundary, a constant permeation rate along the membrane surface, and outflow via a constant pressure condition. For simplicity, we enforce the permeate flux condition purely in the vertical direction rather than normal to the membrane surface (note for reviewers: we are currently working with Wolfram Technical Support to be able to enforce this condition normal to the membrane surface, assuming the no-slip condition still holds at the membrane surface). We specify the inlet velocity profile using the Hagen-Poiseuille model for fully developed channel flow. These equations are normalized by the cavity depth, d, and the average inlet flow velocity, U, which we restrict to the laminar flow regime (i.e., Re < 2,400). We choose the scaling on the pressure term to be ρu2 given that we anticipate inertial effects to dominate the bulk flow. Finally, we note that flow is assigned to the entire domain, given the assumption that the membrane bore, and surface, are fully saturated.
3.2. Solver Domain
The membrane surface is idealized via a single or sequential triangular cavity geometry; the former is used to minimize simulation time. In each case, the geometry through-channel is extended past the cavity by at least the cavity depth on each side to eliminate end effects from the channel inlet and outlet. Discretization of the flow geometry is accomplished through use of the ElementMesh function. By default, this function generates a second-order, triangular element mesh. We refine the interior and boundary mesh elements via the MaxCellMeasure and MaxBoundaryCellMeasure commands. Young and Kabala [37] provide a brief convergence analysis in their supplemental material.
Figure 2.
Flow geometry for a single (left) and sequential (right) cavity geometry.
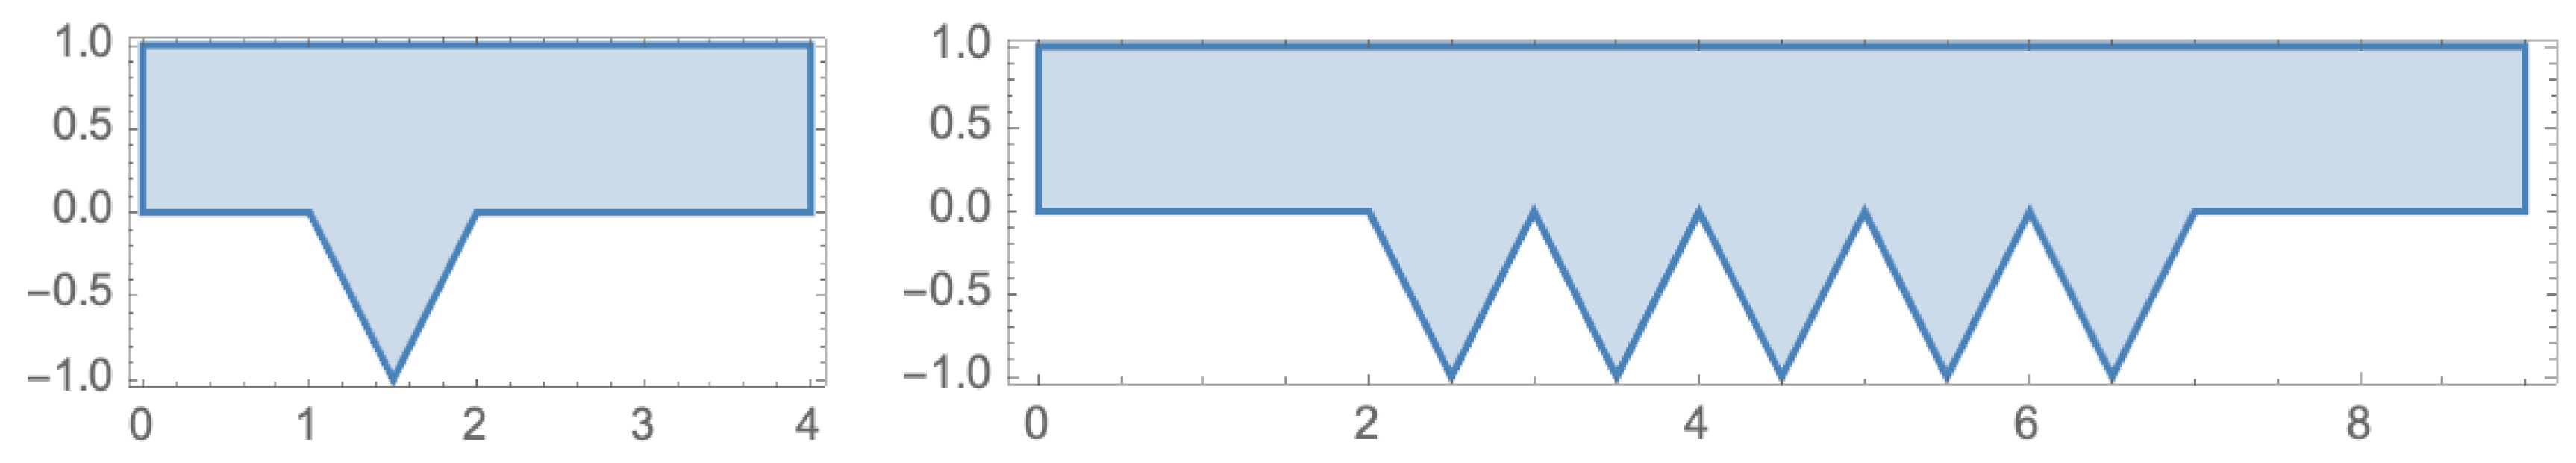
Here, we call attention to the channel height of the flow geometry, which we set equal to the cavity depth. In reality, we know the former to be much larger than the latter. Even still, the flow geometry pictured above has been previously used to approximate mass transport across surfaces with grooves and cavities with success (e.g., Shen and Floryan [38] and Fang et al. [39]). In the study of steady flows over patterned membrane surfaces, other researchers have used truncated domains wherein the channel height is multiple times larger than the cavity depth and a velocity boundary condition is assigned to the upper channel boundary (e.g., Jung and Ahn [35]). Unfortunately, this type of boundary condition would be inappropriate to assign to a pulsed flow simulation due to the presence of mixing induced in the bulk flow. Thus, we move forward with the pictured geometry, noting that adjustments should be made to the channel height (relative to the cavity depth) should the aim of the simulation be to replicate experimental results.
4. Results and Discussion
4.1. Flow Visualization
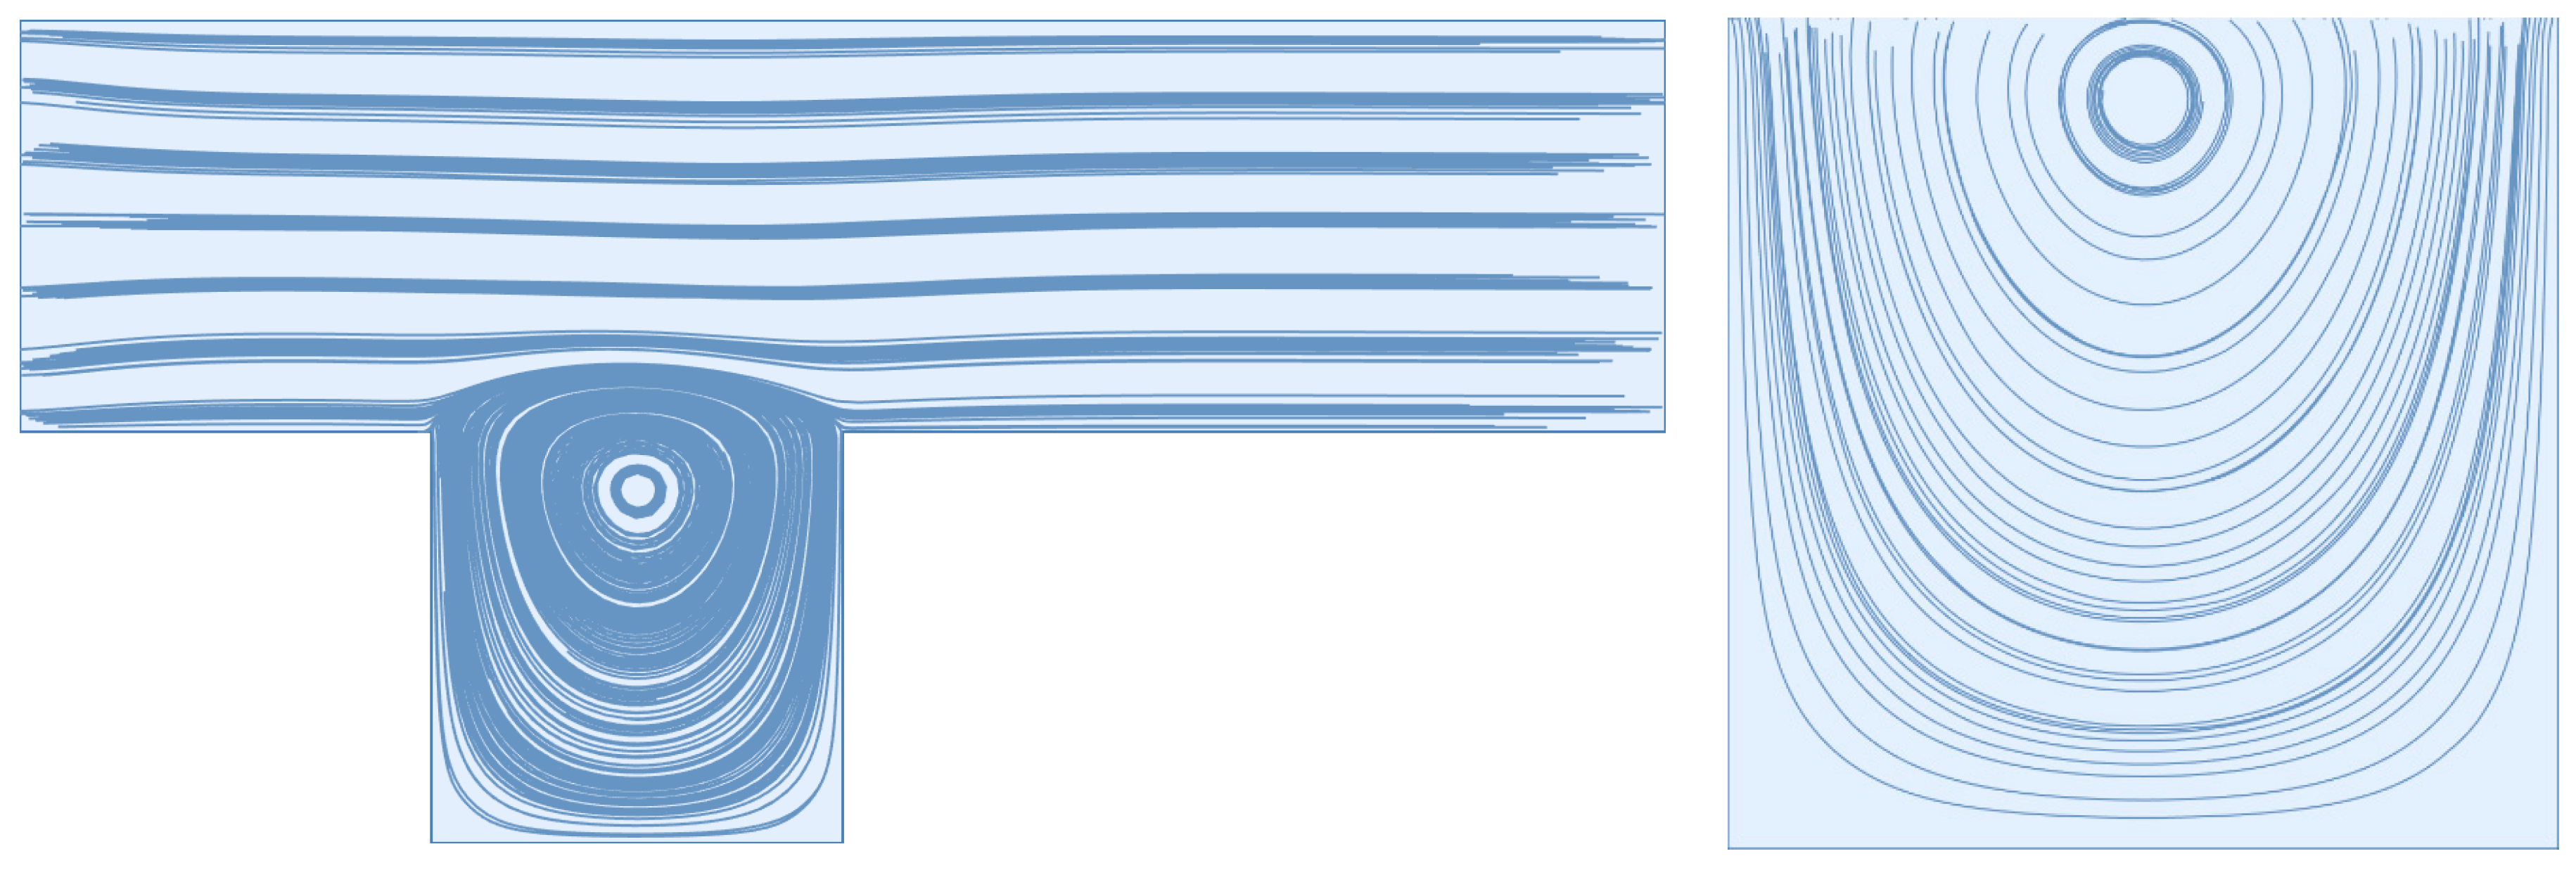
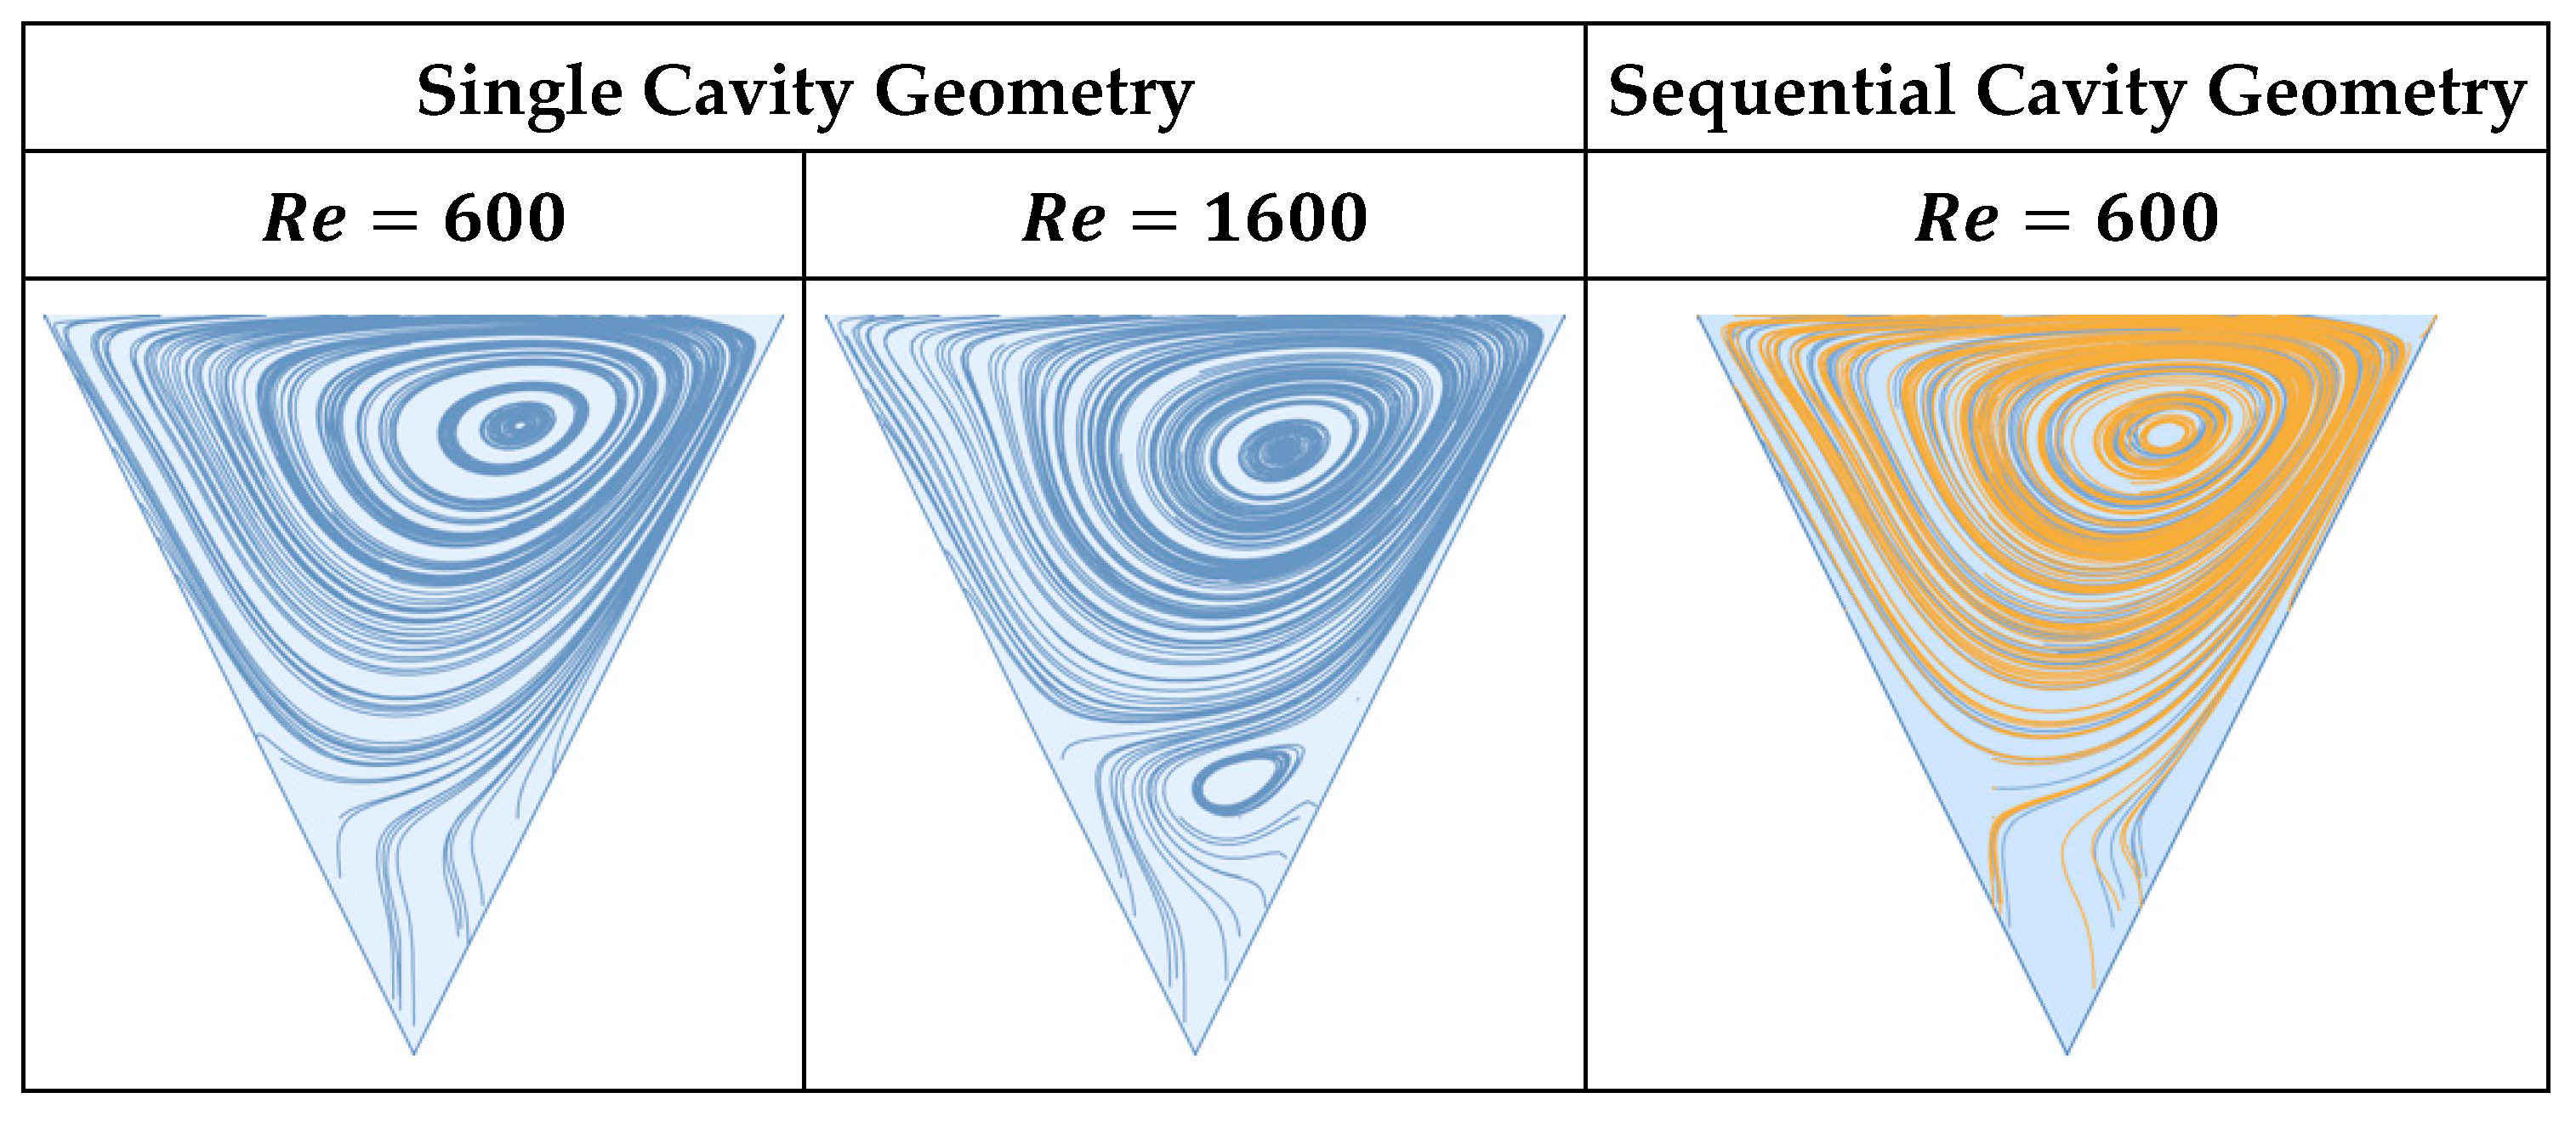
We start by replicating the work of Won et al. [24]. In the figure below, we present cavity stream plots at Reynolds numbers 600 and 1600 and illustrate the relative volumes of the mobile and immobile zones of the membrane surface cavity. As defined by Young and Kabala [37], the mobile zone refers to the volume of cavity space conducive to through-flow, and the immobile zone corresponds to the recirculatory volume in the cavity space. Here, through-flow refers to the portion of feed flow that becomes permeate flow. As demonstrated by Won et al. [24], an increase in Reynolds number results in an increase in the size of the immobile zone. These results are also in agreement with our previous studies on impermeable cavities; see Young and Kabala [37,43]. We note that an increase in Reynolds number results in the generation of a secondary, counter-rotating vortex large enough to be observed. It is reasonable to postulate that, under steady flow conditions, particulate captured in this vortex will remain in perpetuity due to flow separation between it and the primary cavity vortex caused by the permeate stream (see the stream plot corresponding to a Reynolds number of 1600). For the reader’s edification, we replicate this simulation at a Reynolds number of 600 for a flow domain containing five sequential cavities (see the supplemental material) and compare the stream plots of the first and last cavities. We see no significant difference in the stream plots, thus supporting the use of a single idealized cavity space for flow-field imaging and particle tracking.
Figure 3.
Vortex formation under steady flow (left), comparison of stream plot lines in first (blue) and last (yellow) cavities of sequential cavity geometry (right).
Figure 3.
Vortex formation under steady flow (left), comparison of stream plot lines in first (blue) and last (yellow) cavities of sequential cavity geometry (right).
In Figure 4 and Figure 5 below, we illustrate the deep sweep and vortex ejection mechanisms in the cavity space that result from a sinusoidal feed flow with an average Reynolds number of 600 and 1600 and a non-dimensional period of 4 and amplitude of 0.75. The deep sweep and vortex ejection manifest themselves somewhat differently over the patterned membrane surface than they do in the cavity spaces of impermeable media. The high Reynolds numbers of crossflows over membrane surfaces induce additional mixing in the cavity space, and therefore the generation of secondary vortices comparable in size to the primary cavity vortex. As the through-channel flow volume abruptly increases and decreases, these vortices interact, clouding our ability to easily recognize the deep sweep and the vortex ejection as they occur at lower Reynolds numbers. Despite the presence of these additional vortices, the deep sweep and vortex ejection are still present in the high Reynolds number flows we study in this work, as evidenced by Figure 4 and Figure 5. Readers are again directed to the supplemental material to visualize these mechanisms in an impermeable, square cavity space at an average Reynolds number of 10. This sequence clearly demonstrates the deep sweep and vortex ejection streamline patterns.
Similar to steady flow conditions, we observe that an increase in Reynolds number results in an increase in immobile zone volume; this is true over the entire period of the inlet waveform. Notably, during the vortex ejection mechanism, we observe the formation of a large, counter-rotating vortex along the upper channel-wall. In the supplemental material, we verify that existence of this vortex is not strictly an artifact of the selected channel height. For a channel height 10 times that of the pattern depth, the presence of this vortex persists. Therefore, we conclude that the vortex ejection mechanism is not only capable of flushing contaminants from the cavity space, but also of inducing large-scale mixing and shear reversals along boundaries within the immediate vicinity of the cavity geometry.
Finally, we confirm the presence of the deep sweep and vortex ejection mechanisms when the magnitude of the permeate flux is increased by a factor of 10. Because these mechanisms have been previously shown to exist in impermeable cavity spaces (e.g., Kahler and Kabala [40] and Young and Kabala [37,43]), we do not decrease the magnitude of the permeate flux condition. Comparison of the stream plot sequences that result from the two flux conditions result in a decrease in immobile zone volume with an increase in permeate flow volume. It is likely the case that this decrease in immobile zone volume will result in more particle accumulation at the membrane surface, even in the presence of the deep sweep and vortex ejection mechanisms. Support for this conclusion is provided by results of steady flow simulations. Won et al. [24] found that an increase in the permeation stream area, relative to the vortex stream area, resulted in a higher degree of surface fouling. Jung and Ahn [35] confirm that an increase in the volume of the “inaccessible” zone results in a decrease in probability that particles will access the membrane surface. After a review of the past two decades of experimental and numerical data on patterned membrane flows, Wang et al. [36] add further support of this conclusion.
4.2. Particle Tracking
To confirm the ability of the deep sweep and vortex ejection mechanisms to remove particles from the cavity space, we visualize the trajectory of massless particles via integration of the flow field over time. To start, we demonstrate the fate of particles seeded at the geometric boundary between the feed channel and cavity space under steady flow conditions. The results presented below are for a non-dimensional simulation time of 100.
For a Reynolds number of 600, we observe all but 2 of the 9 particles are captured in the recirculation zone; of the remainder, one particle rejoins the bulk flow, and the other settles at the membrane surface. For a Reynolds number of 1600, the only particle that escapes recirculation also settles at the membrane surface. As expected, if we populate the cavity space with a grid of particles, we observe that the particles remain almost entirely in the cavity space. For a Reynolds number of 600 and 1600, 1.5% and 1.9% of the particles leave the cavity space and enter the bulk flow, respectively. In general, the final location of the particles is the same for each of the tested Reynolds numbers. The results presented below are for a non-dimensional simulation time of 200.
To explain the void where there are no particles in the lower-third of the cavity space, we refer back to the stream plots presented in Figure 3. If we overlay the two plots, we see that the permeation volume remains clear of particles. We also observe a secondary immobile zone on the downstream cavity wall responsible for a small grouping of particles for Re = 1600.
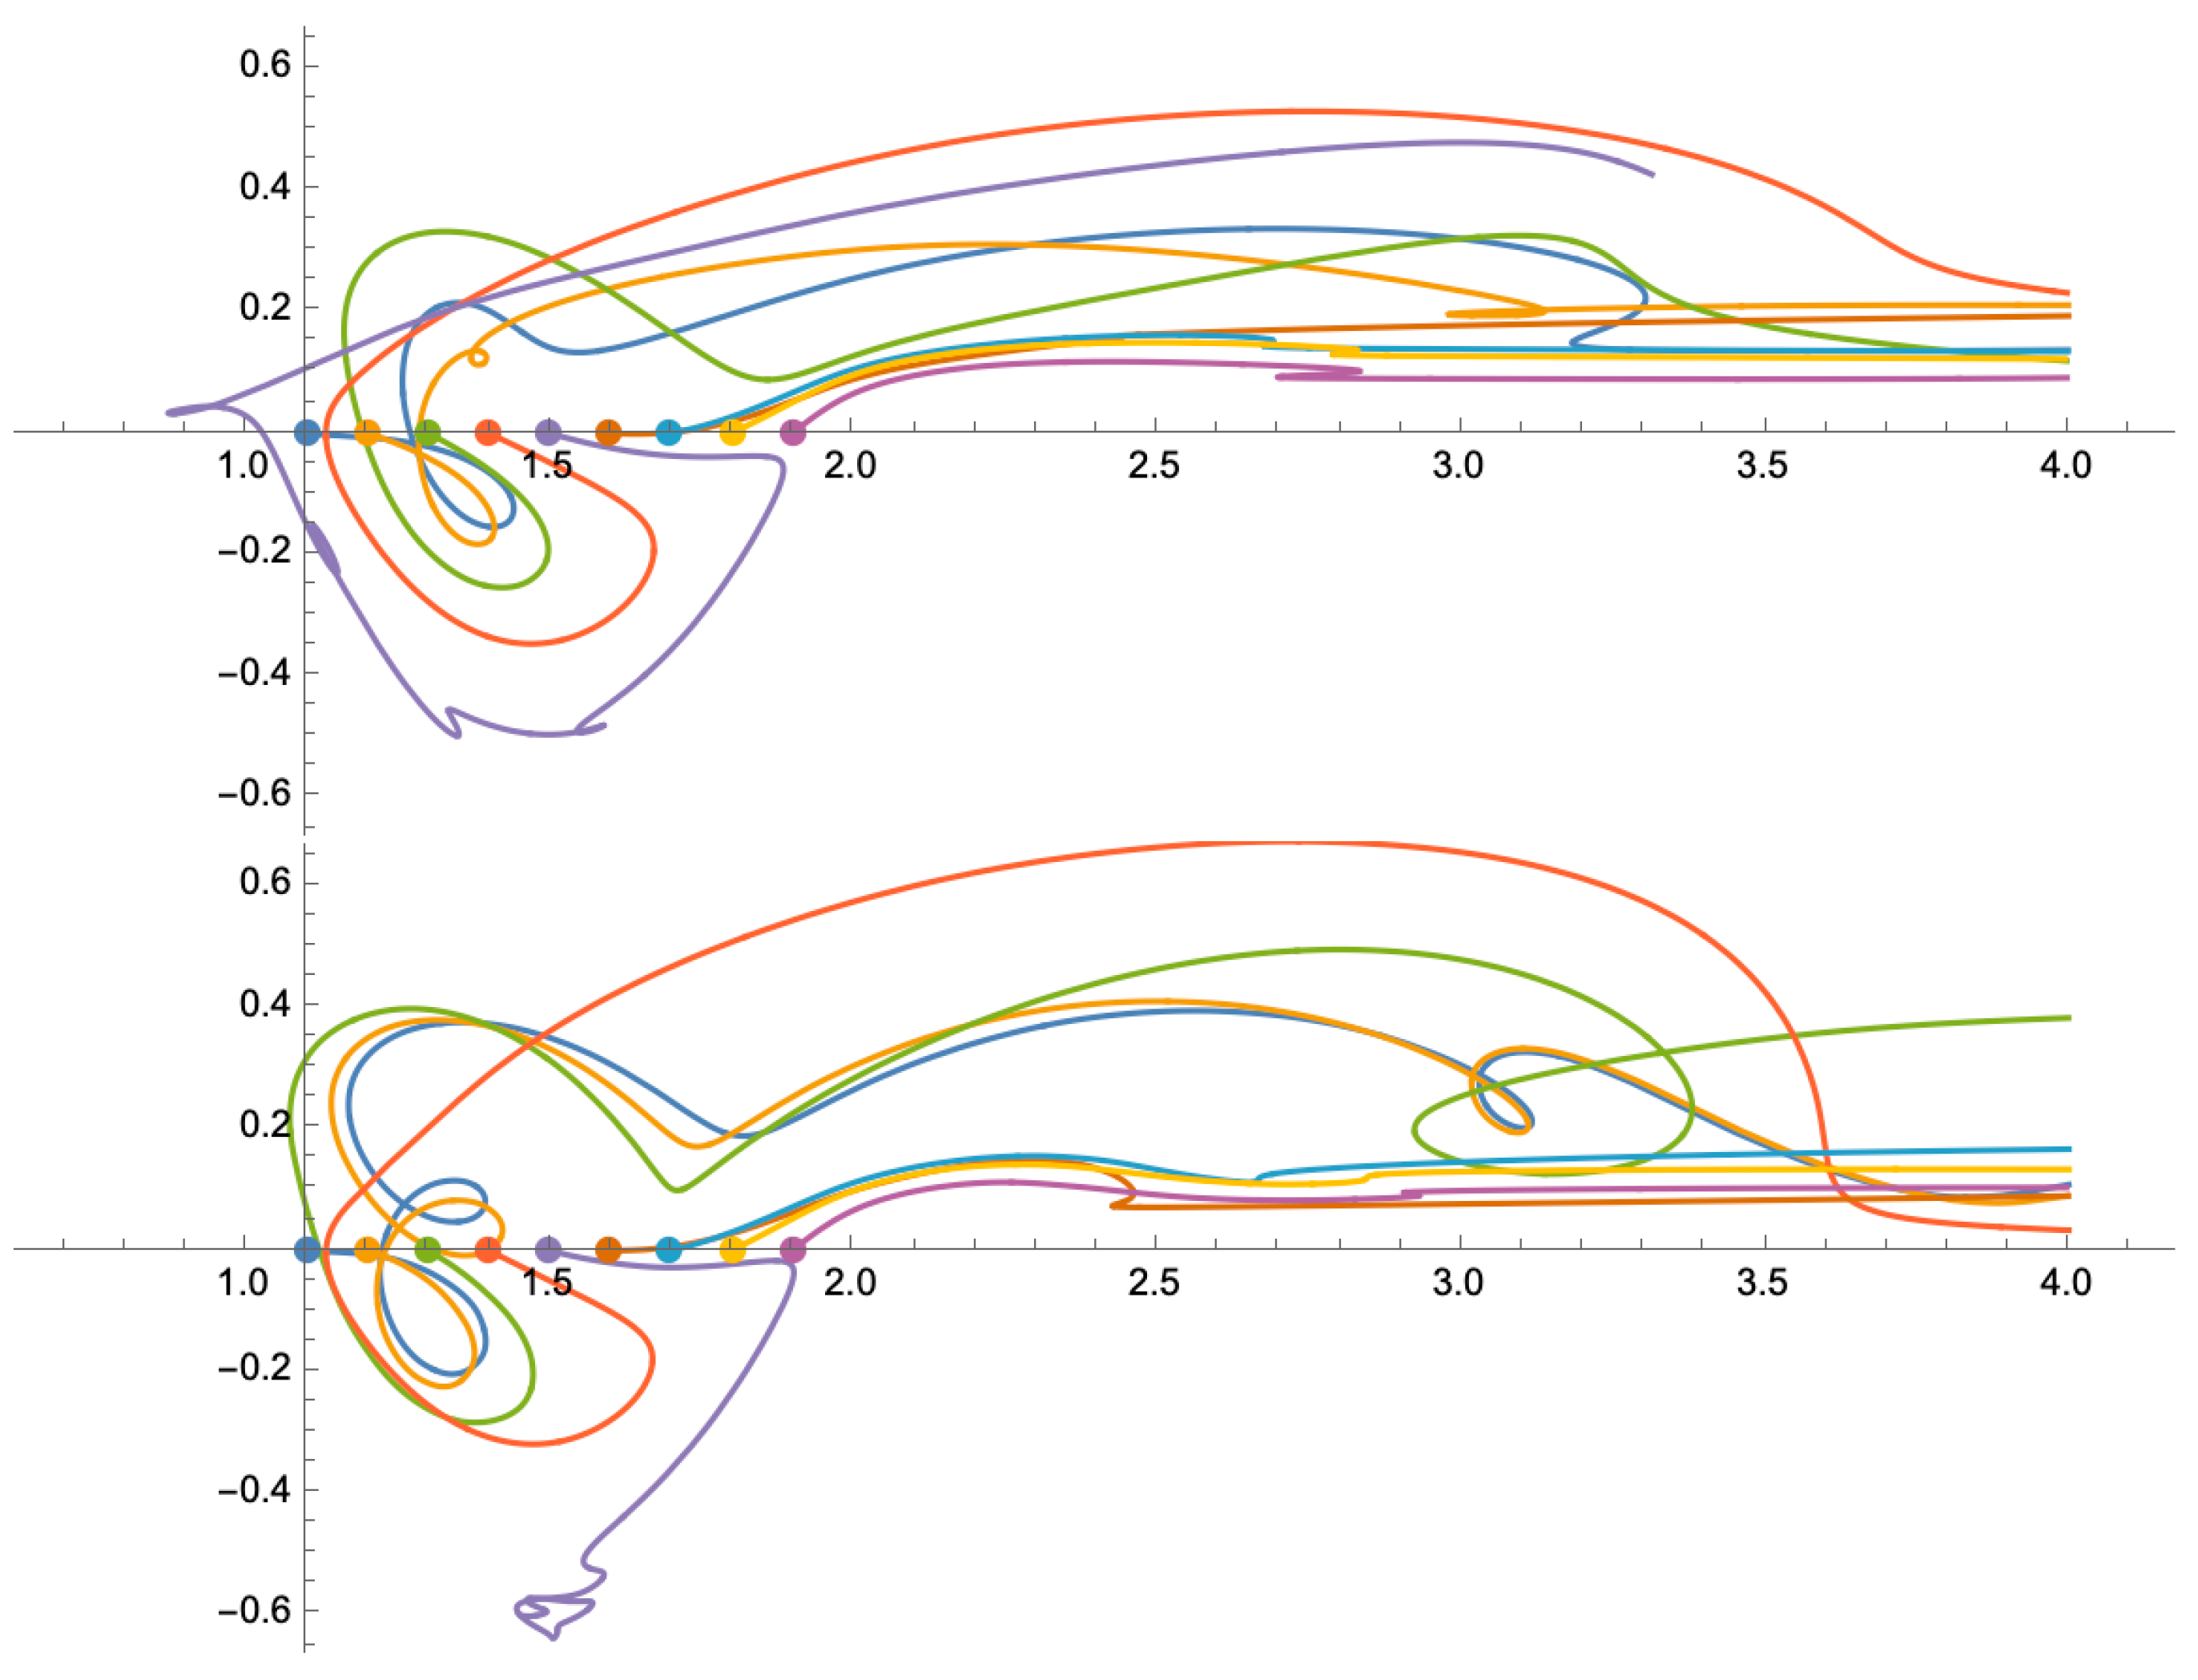
For a rapidly pulsed inlet flow, we observe that, for the boundary particles, all but one is swept away into the bulk flow. Although the particles may enter the cavity space, they are not subject to remain there indefinitely, as in the case of steady flow (see Figure 6). To reduce computational demand, the non-dimensional simulation time is restricted to 20.
Figure 6.
Trajectories for particles seeded along the boundary of the membrane surface cavity and feed channel, subject to a steady flow with a Reynolds number of 600 (left) and 1600 (right).
Figure 6.
Trajectories for particles seeded along the boundary of the membrane surface cavity and feed channel, subject to a steady flow with a Reynolds number of 600 (left) and 1600 (right).
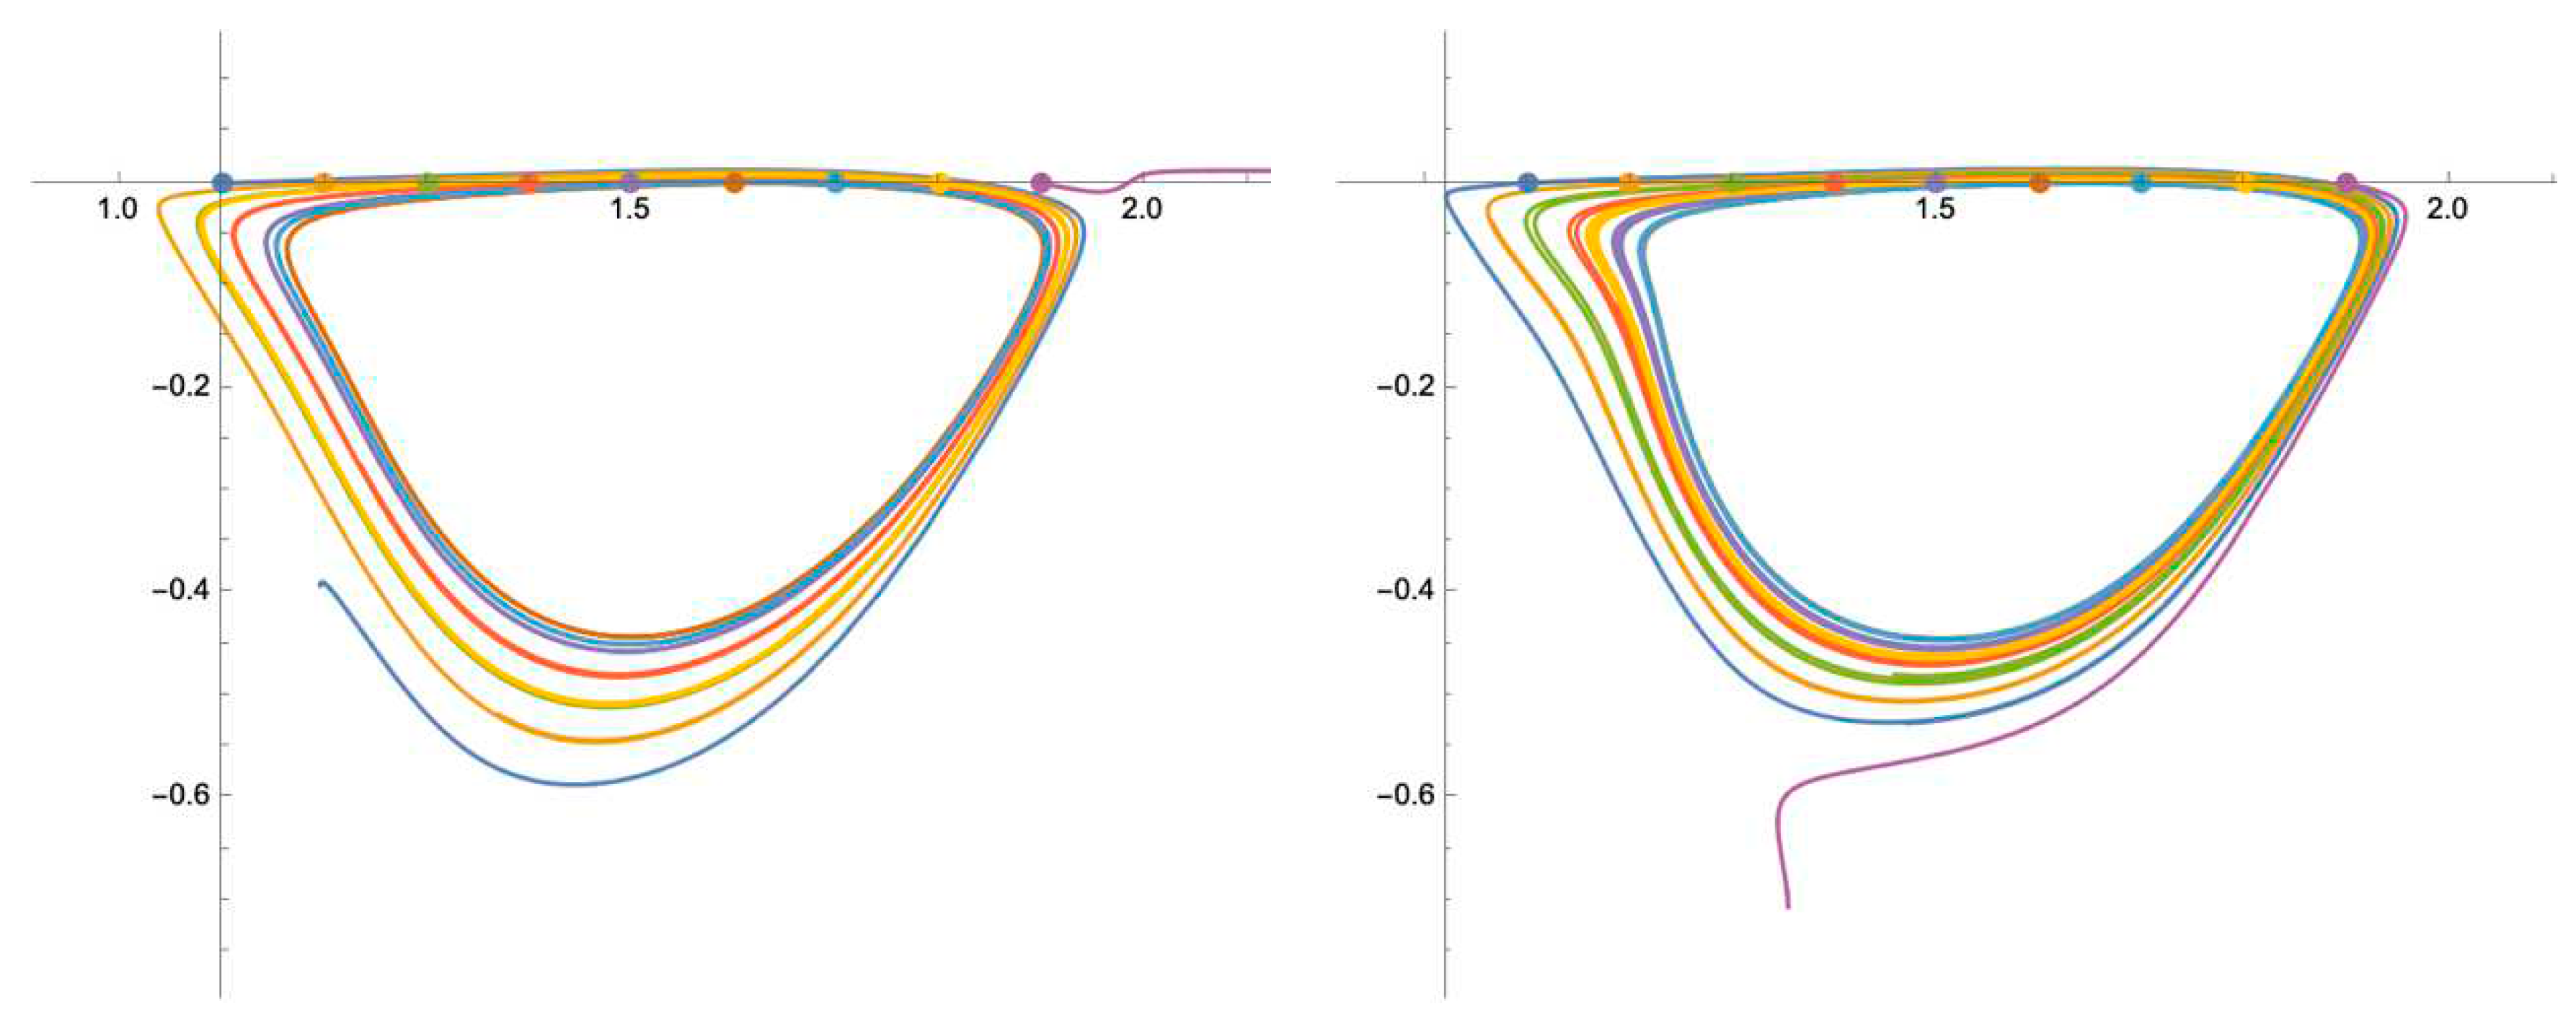
Figure 7.
Particle positions for a steady feed flow condition; initial position (left), final position (right) for a feed Reynolds number of 600 (red) and 1600 (blue).
Figure 7.
Particle positions for a steady feed flow condition; initial position (left), final position (right) for a feed Reynolds number of 600 (red) and 1600 (blue).
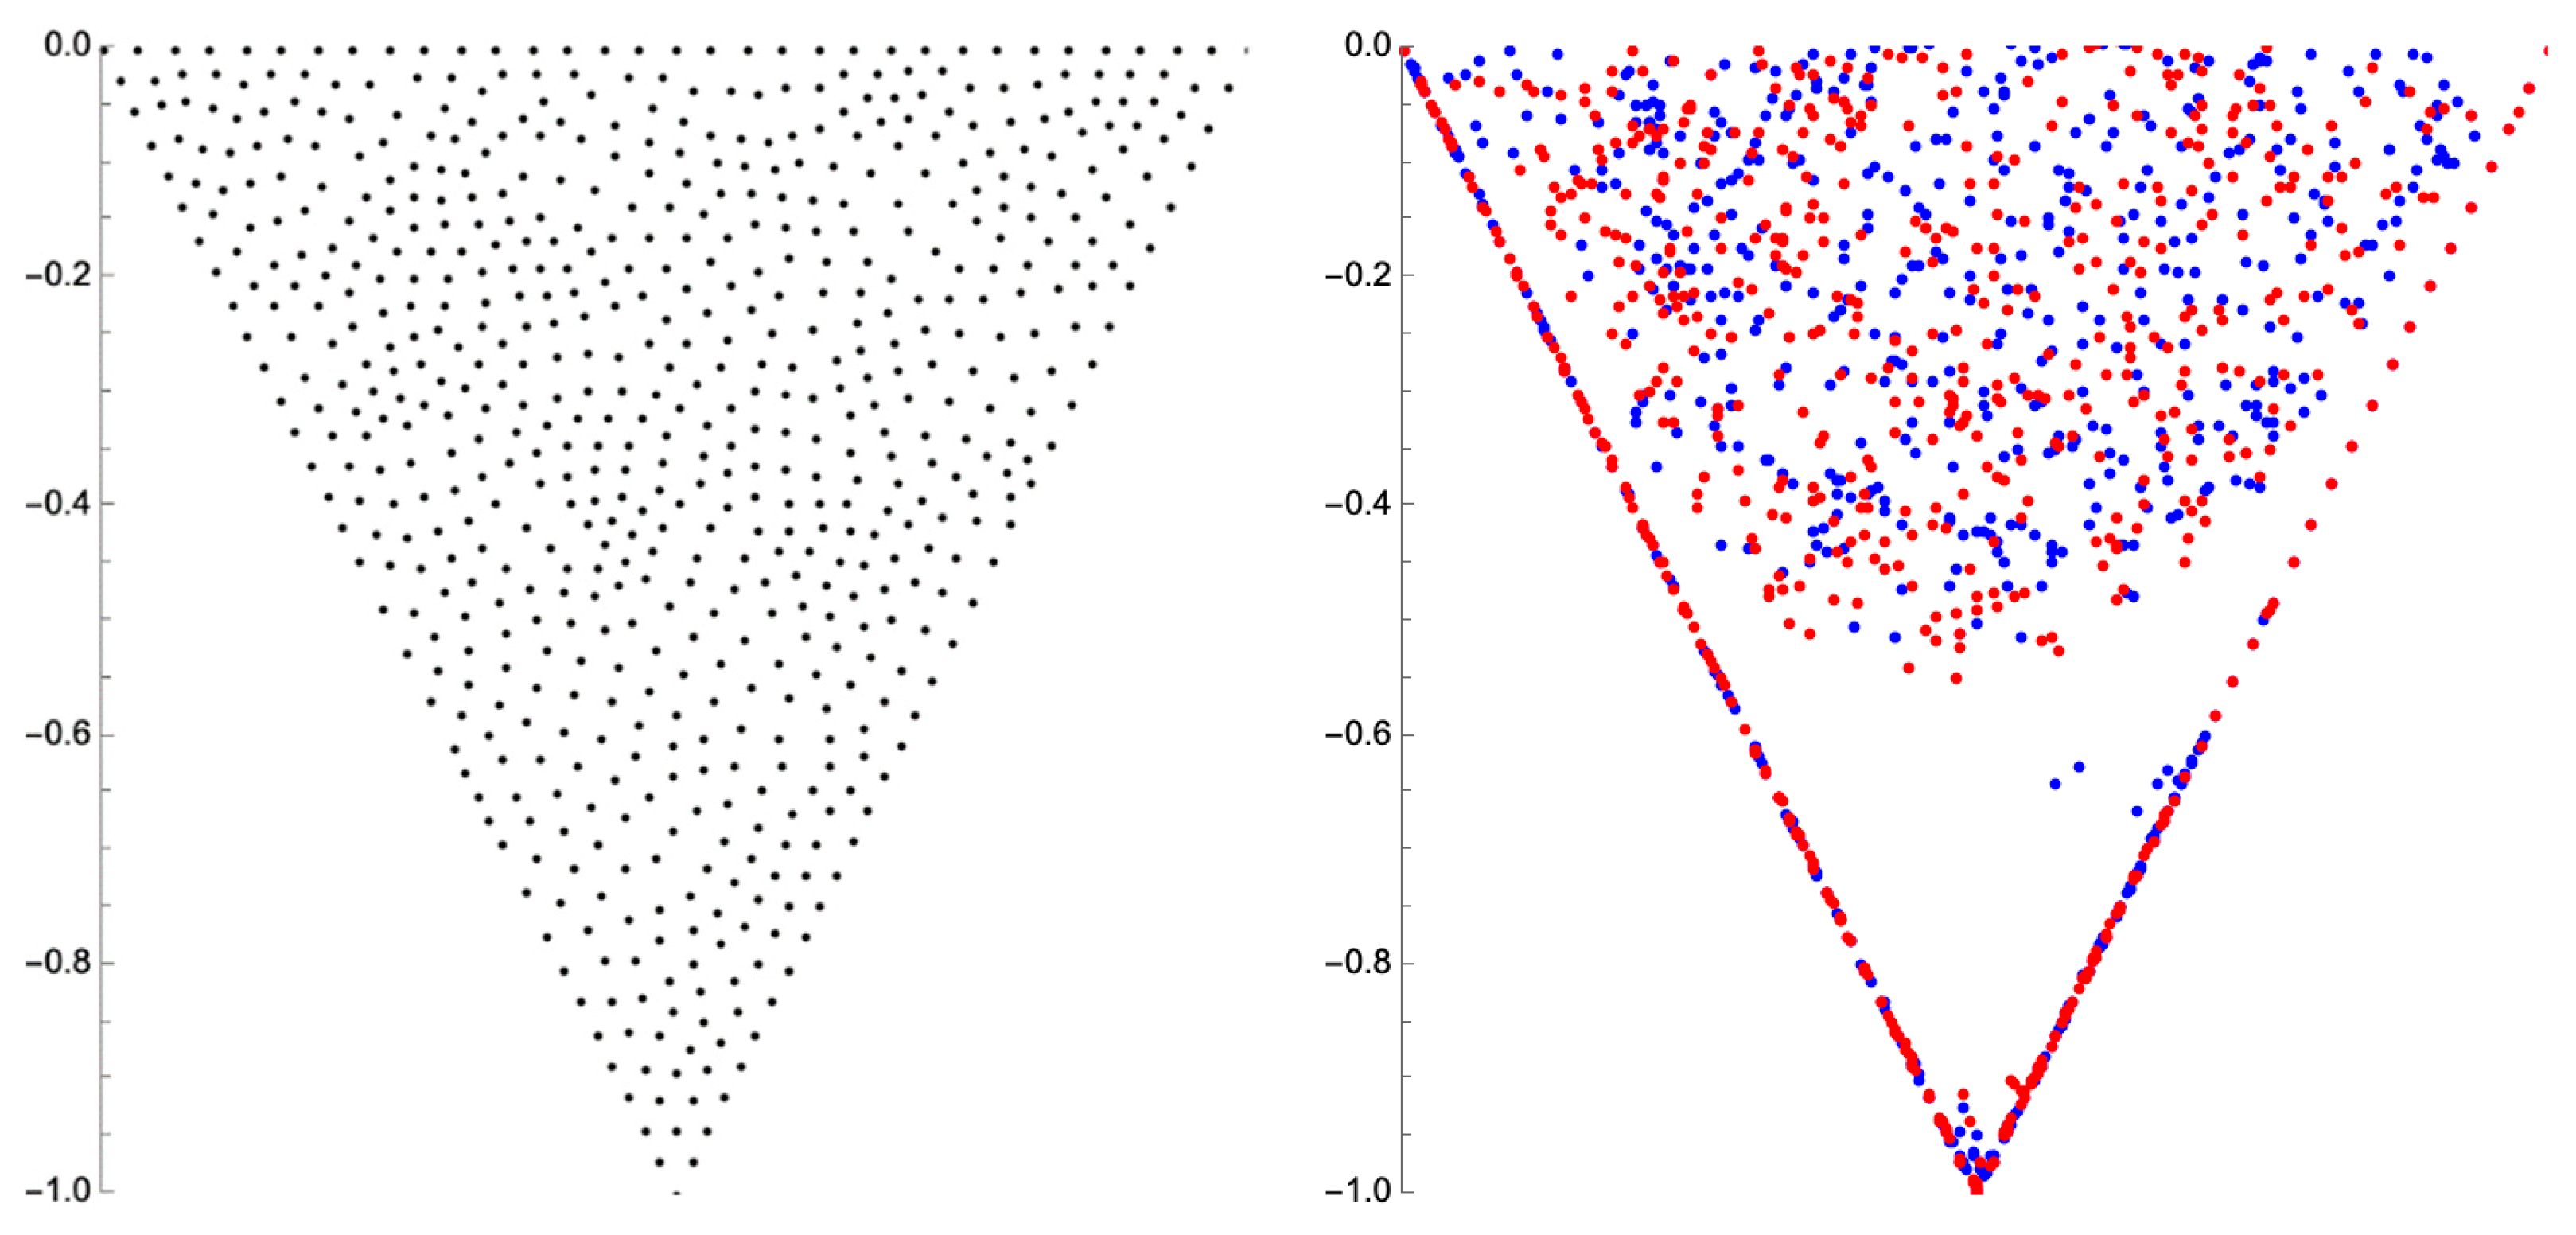
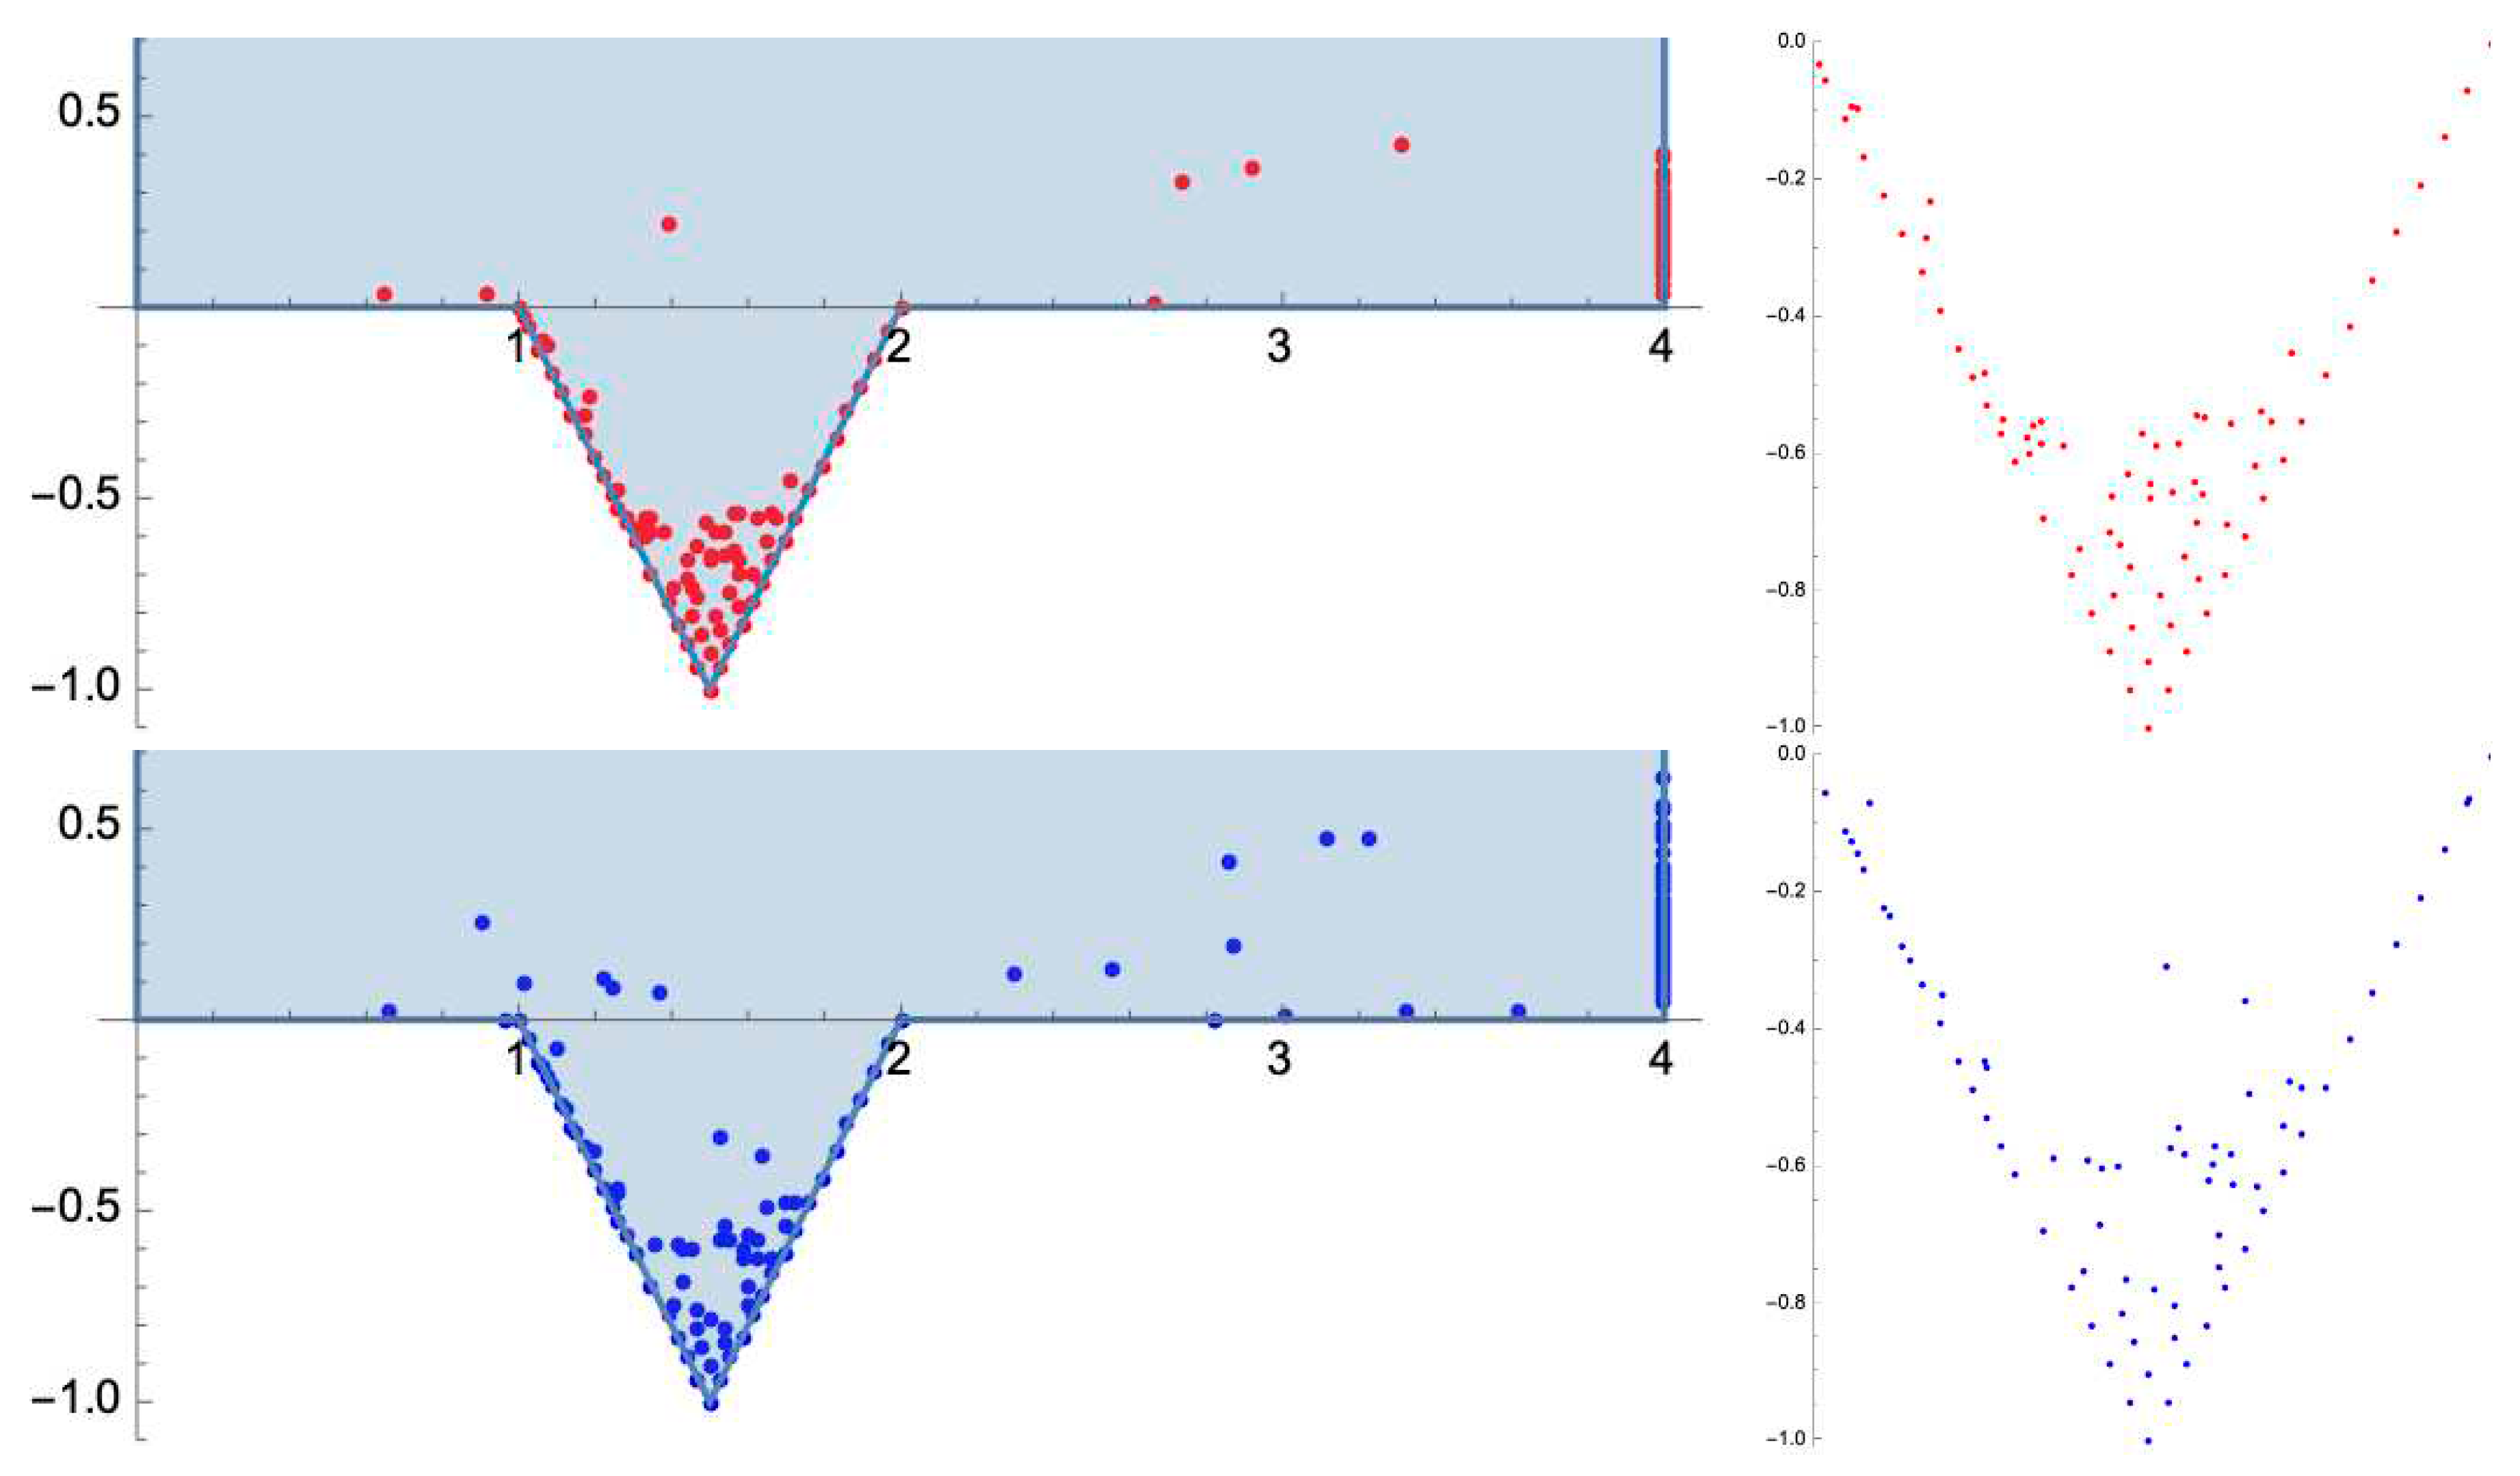
Figure 8.
Final particle positions for a steady feed flow condition (see Figure 7) are driven by the locations of the recirculation zones in the membrane surface pattern.
Figure 8.
Final particle positions for a steady feed flow condition (see Figure 7) are driven by the locations of the recirculation zones in the membrane surface pattern.
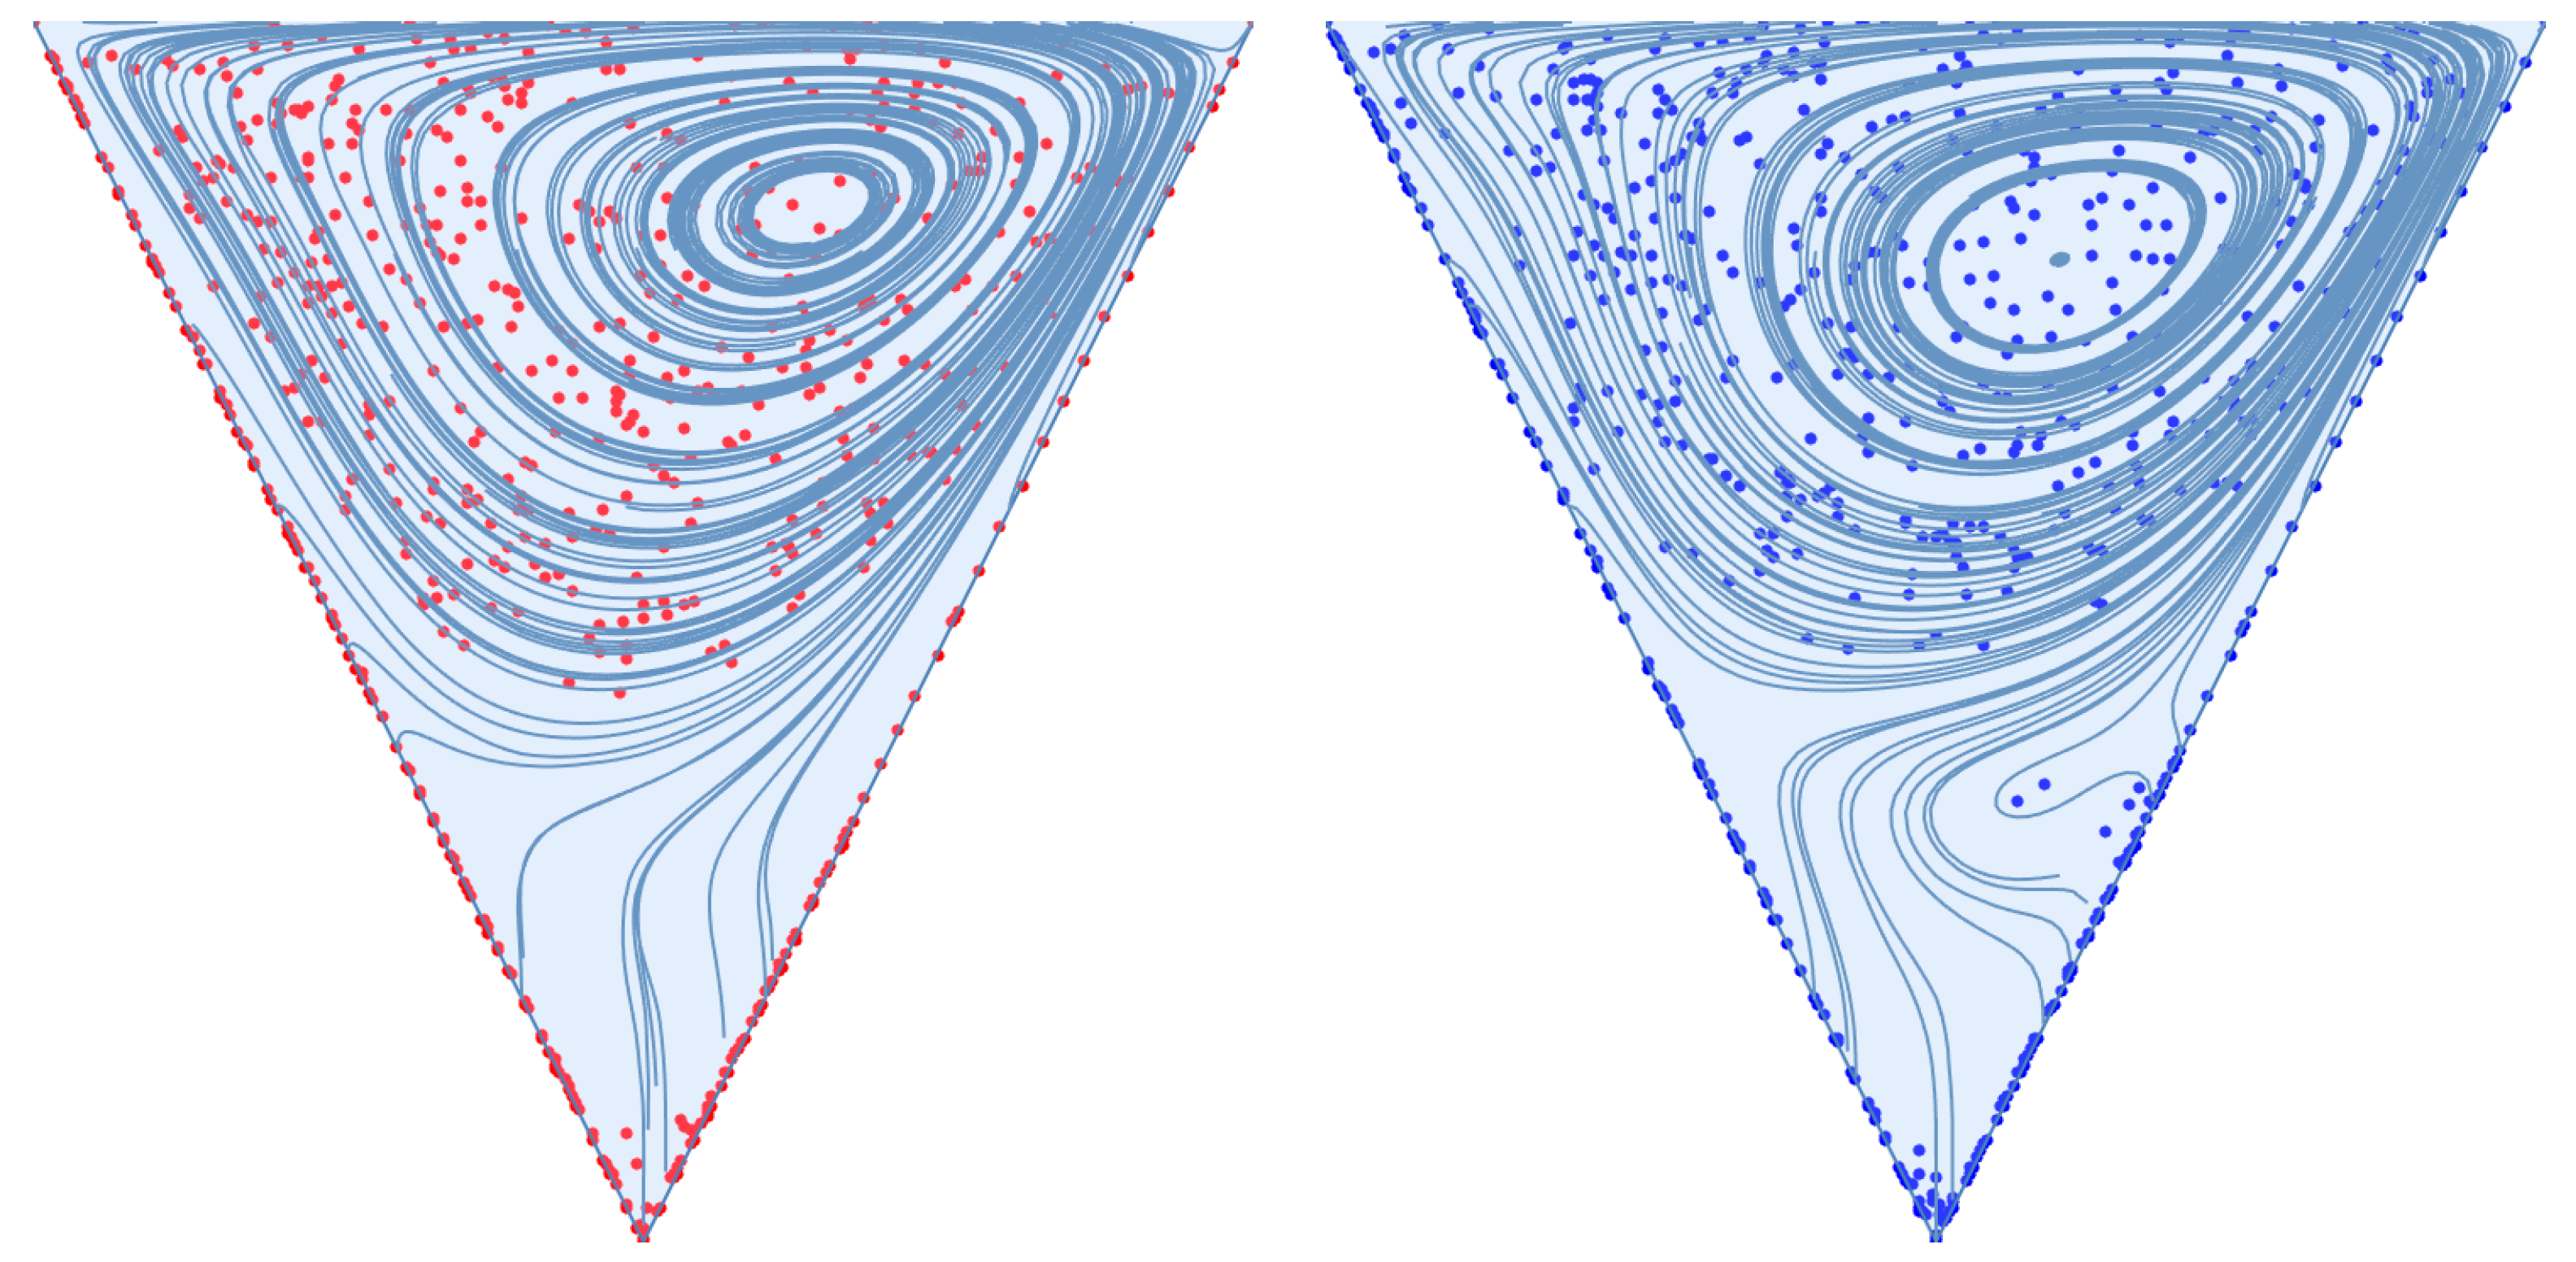
Figure 9.
Trajectories for particles seeded along the boundary of the membrane surface cavity and feed channel, subject to a rapidly pulsed flow with an average Reynolds number of 600 (top) and 1600 (bottom).
Figure 9.
Trajectories for particles seeded along the boundary of the membrane surface cavity and feed channel, subject to a rapidly pulsed flow with an average Reynolds number of 600 (top) and 1600 (bottom).
If we then seed the cavity space with particles, albeit over a coarser grid to minimize computational demand (180 particles versus the 668 used for steady flow simulation), we observe that approximately half of the particles move into the bulk flow; 56.7% for an average Reynolds number of 600 and 58.9% for 1600. Final particle locations are provided in Figure 10 below.
Figure 10.
Final location of particles seeded in the cavity space for a rapidly pulsed inlet flow with an average Reynolds number of 600 (red) and 1600 (blue).
Figure 10.
Final location of particles seeded in the cavity space for a rapidly pulsed inlet flow with an average Reynolds number of 600 (red) and 1600 (blue).
Although these plots clearly demonstrate the ability of a rapidly pulsed flow to remove particles from the cavity space via the vortex ejection and the deep sweep, it is necessary to optimize the shape of the waveform, relative to the pattern morphology, to maximize removal. To that end, even with the arbitrary waveform selected for this study, a rapidly pulsed flow is still able to remove approximately fifty times more particles from the cavity space in one-tenth the time – supporting our earlier statement that this type of inlet flow should reduce the need and frequency for traditional membrane cleaning methods.
4.3. Study Limitations
Aside from the numerical error associated with the simulation parameters (e.g., mesh size, precision and accuracy goals, time-step, solver method, etc.), the accuracy of our results is limited by a few simplifying assumptions. Namely, we do not account for the surface roughness of the membrane, which would induce local turbulence. We also enforce a uniform permeate flux in the vertical direction. Realistically, this condition should be imposed normal to the membrane surface (to properly enforce the no-slip condition) and be non-uniform along the membrane length, especially as the membrane fouls. Finally, and most significantly, we simulate only the flow of massless particles – we neglect interactions between the particles and the physical and chemical properties of the membrane itself. Nonetheless, the results provided in this study reveal an accurate first-order representation of the flow field induced over a patterned membrane surface subject to a rapidly pulsed flow.
5. Conclusions
In this work, we demonstrate the ability of a rapidly pulsed feed flow to remove particles trapped in the cavity-like spaces of patterned membrane surfaces (i.e., valleys and channels). When subject to a steady feed flow, particles become trapped in recirculation zones where they aggregate and aggravate surface fouling. A rapidly pulsed flow induces the deep sweep and vortex ejection mechanisms and flushes recirculation zones with a relatively clean flow volume. This work is well-suited for further expansion, especially considering its application to fouling prevention. It is important to identify how the pulse frequency and amplitude about the baseline flow rate affect the ability of these mechanisms to move particles away from the membrane surface. The results of this work suggest that when combined with a rapidly pulsed inlet flow, patterned membrane surfaces can not only alleviate concentration polarization and the surface fouling that follows but also reduce the need for traditional cleaning methods, which require operational downtime and often involve the use of abrasive chemical agents.
Author Contributions
Conceptualization (A.H.Y.), data curation (A.H.Y.), formal analysis (A.H.Y.), investigation (A.H.Y.), methodology (A.H.Y. and. Z.J.K.), project administration (N.H. and B.T.H.), supervision (N.H., B.T.H., and Z.J.K.), validation (A.H.Y.), visualization (A.H.Y.), writing – original draft (A.H.Y.), writing – review & editing (A.H.Y., N.H., B.T.H., and. Z.J.K.).
Acknowledgements
This work is, in part, supported by a grant, OPP1173370 (Sanitation Technology Cluster), from the Bill & Melinda Gates Foundation through Duke University’s Center for WaSH-AID. All opinions, findings, and conclusions or recommendations expressed in these works are those of the author(s) and do not necessarily reflect the views of the Foundation, Duke, or the Center.
Declaration of Competing Interest: The authors declare no competing conflict of interest.
References
- Obotey Ezugbe, E.; Rathilal, S. Membrane Technologies in Wastewater Treatment: A Review. Membranes (Basel) 2020, 10. [Google Scholar] [CrossRef] [PubMed]
- Rather, A. M.; Xu, Y.; Dupont, R. L.; Wang, X. "Polymeric Membranes in Wastewater Treatment." In Nanoscale Engineering of Biomaterials: Properties and Applications, edited by Lalit M. Pandey and Abshar Hasan, 487-515. Singapore: Springer Nature Singapore, 2022.
- Hidalgo, A. M.; Murcia, M. D. Membranes for Water and Wastewater Treatment. Membranes (Basel) 2021, 11. [Google Scholar] [CrossRef] [PubMed]
- Baker, R. W. Membrane Technology and Applications. Third ed: Wiley, 2012.
- Hale, J. S.; Harris, A.; Li, Q.; Houchens, B. C. "The Fluid Mechanics of Membrane Filtration." Paper presented at the ASME 2007 International Mechanical Engineering Congress and Exposition 2007.
- Song, L.; Elimelech, M. Theory of Concentration Polarization in Crossflow Filtration. Journal of the Chemical Society, Faraday Transactions 1995, 91, 3389–3398. [Google Scholar] [CrossRef]
- Giacobbo, A.; Moura Bernardes, A.; Filipe Rosa, M. J.; de Pinho, M. N. Concentration Polarization in Ultrafiltration/Nanofiltration for the Recovery of Polyphenols from Winery Wastewaters. Membranes (Basel) 2018, 8. [Google Scholar] [CrossRef] [PubMed]
- Matthiasson, E.; Sivik, B. Concentration Polarization and Fouling. Desalination 1980, 35, 59–103. [Google Scholar] [CrossRef]
- Shang, W.; Li, X.; Liu, W.; Yue, S.; Li, M.; von Eiff, D.; Sun, F.; An, A. K. Effective Suppression of Concentration Polarization by Nanofiltration Membrane Surface Pattern Manipulation: Numerical Modeling Based on Lif Visualization. J. Membrane Sci. 2021, 622, 119021. [Google Scholar] [CrossRef]
- Gençal, Y.; Durmaz, E. N.; Çulfaz-Emecen, P. Z. Preparation of Patterned Microfiltration Membranes and Their Performance in Crossflow Yeast Filtration. J. Membrane Sci. 2015, 476, 224–233. [Google Scholar] [CrossRef]
- Jamshidi Gohari, R.; Lau, W. J.; Matsuura, T.; Ismail, A. F. Effect of Surface Pattern Formation on Membrane Fouling and Its Control in Phase Inversion Process. J. Membrane Sci. 2013, 446, 326–331. [Google Scholar] [CrossRef]
- Maruf, S. H.; Wang, L.; Greenberg, A. R.; Pellegrino, J.; Ding, Y. Use of Nanoimprinted Surface Patterns to Mitigate Colloidal Deposition on Ultrafiltration Membranes. J. Membrane Sci. 2013, 428, 598–607. [Google Scholar] [CrossRef]
- Çulfaz, P. Z.; Haddad, M.; Wessling, M.; Lammertink, R. G. H. Fouling Behavior of Microstructured Hollow Fibers in Cross-Flow Filtrations: Critical Flux Determination and Direct Visual Observation of Particle Deposition. J. Membrane Sci. 2011, 372, 210–218. [Google Scholar] [CrossRef]
- Upadhyaya, L.; Qian, X.; Ranil Wickramasinghe, S. Chemical Modification of Membrane Surface—Overview. Curr. Opin. Chem. Eng. 2018, 20, 13–18. [Google Scholar] [CrossRef]
- Choi, W.; Shin, M. G.; Lee, G. W.; Kim, D.; Yoo, C. H.; Lee, J. S.; Jung, H. W.; Lee, J.-H. Anisotropic Biofouling Behavior of Sharkskin-Patterned Desalination Membranes. J. Membrane Sci. 2023, 683, 121814. [Google Scholar] [CrossRef]
- Gul, A.; Hruza, J.; Dvorak, L.; Yalcinkaya, F. Chemical Cleaning Process of Polymeric Nanofibrous Membranes. Polymers (Basel) 2022, 14. [Google Scholar] [CrossRef] [PubMed]
- Chheang, M.; Hongprasith, N.; Ratanatawanate, C.; Lohwacharin, J. Effects of Chemical Cleaning on the Ageing of Polyvinylidene Fluoride Microfiltration and Ultrafiltration Membranes Fouled with Organic and Inorganic Matter. Membranes 2022, 12, 280. [Google Scholar] [CrossRef] [PubMed]
- Huang, J.; Luo, J.; Chen, X.; Feng, S.; Wan, Y. How Do Chemical Cleaning Agents Act on Polyamide Nanofiltration Membrane and Fouling Layer? Industrial & Engineering Chemistry Research 2020, 59, 17653–17670. [Google Scholar] [CrossRef]
- Gul, A.; Hruza, J.; Yalcinkaya, F. Fouling and Chemical Cleaning of Microfiltration Membranes: A Mini-Review. Polymers (Basel) 2021, 13. [Google Scholar] [CrossRef] [PubMed]
- Ang, W. S.; Yip, N. Y.; Tiraferri, A.; Elimelech, M. Chemical Cleaning of Ro Membranes Fouled by Wastewater Effluent: Achieving Higher Efficiency with Dual-Step Cleaning. J. Membrane Sci. 2011, 382, 100–106. [Google Scholar] [CrossRef]
- Zhou, Z.; Ling, B.; Battiato, I.; Husson, S. M.; Ladner, D. A. Concentration Polarization over Reverse Osmosis Membranes with Engineered Surface Features. J. Membrane Sci. 2021, 617, 118199. [Google Scholar] [CrossRef]
- Belfort, G. Fluid Mechanics in Membrane Filtration: Recent Developments. J. Membrane Sci. 1989, 40, 123–147. [Google Scholar] [CrossRef]
- Won, Y.-J.; Choi, D.-C.; Jang, J. H.; Lee, J.-W.; Chae, H. R.; Kim, I.; Ahn, K. H.; Lee, C.-H.; Kim, I.-C. Factors Affecting Pattern Fidelity and Performance of a Patterned Membrane. J. Membrane Sci. 2014, 462, 1–8. [Google Scholar] [CrossRef]
- Won, Y.-J.; Jung, S.-Y.; Jang, J.-H.; Lee, J.-W.; Chae, H.-R.; Choi, D.-C.; Hyun Ahn, K.; Lee, C.-H.; Park, P.-K. Correlation of Membrane Fouling with Topography of Patterned Membranes for Water Treatment. J. Membrane Sci. 2016, 498, 14–19. [Google Scholar] [CrossRef]
- Won, Y.-J.; Lee, J.; Choi, D.-C.; Chae, H. R.; Kim, I.; Lee, C.-H.; Kim, I.-C. Preparation and Application of Patterned Membranes for Wastewater Treatment. Environ. Sci. Technol. 2012, 46, 11021–11027. [Google Scholar] [CrossRef]
- Heinz, O.; Aghajani, M.; Greenberg, A. R.; Ding, Y. Surface-Patterning of Polymeric Membranes: Fabrication and Performance. Curr. Opin. Chem. Eng. 2018, 20, 1–12. [Google Scholar] [CrossRef]
- Barambu, N. U.; Bilad, M. R.; Wibisono, Y.; Jaafar, J.; Mahlia, T. M. I.; Khan, A. L. Membrane Surface Patterning as a Fouling Mitigation Strategy in Liquid Filtration: A Review. Polymers 2019, 11, 1687. [Google Scholar] [CrossRef]
- Çulfaz, P. Z.; Buetehorn, S.; Utiu, L.; Kueppers, M.; Bluemich, B.; Melin, T.; Wessling, M.; Lammertink, R. G. H. Fouling Behavior of Microstructured Hollow Fiber Membranes in Dead-End Filtrations: Critical Flux Determination and Nmr Imaging of Particle Deposition. Langmuir 2011, 27, 1643–1652. [Google Scholar] [CrossRef]
- Ma, S.; Song, L. Numerical Study on Permeate Flux Enhancement by Spacers in a Crossflow Reverse Osmosis Channel. J. Membrane Sci. 2006, 284, 102–109. [Google Scholar] [CrossRef]
- Rickman, M.; Maruf, S.; Kujundzic, E.; Davis, R. H.; Greenberg, A.; Ding, Y.; Pellegrino, J. Fractionation and Flux Decline Studies of Surface-Patterned Nanofiltration Membranes Using Nacl-Glycerol-Bsa Solutions. J. Membrane Sci. 2017, 527, 102–110. [Google Scholar] [CrossRef]
- Ward, L. M.; Shah, R. M.; Schiffman, J. D.; Weinman, S. T. Nanopatterning Reduces Bacteria Fouling in Ultrafiltration. ACS ES&T Water 2022, 2, 1593–1601. [Google Scholar] [CrossRef]
- Lee, Y. K.; Won, Y.-J.; Yoo, J. H.; Ahn, K. H.; Lee, C.-H. Flow Analysis and Fouling on the Patterned Membrane Surface. J. Membrane Sci. 2013, 427, 320–325. [Google Scholar] [CrossRef]
- Choi, D.-C.; Jung, S.-Y.; Won, Y.-J.; Jang, J. H.; Lee, J.; Chae, H.-R.; Ahn, K. H.; Lee, S.; Park, P.-K.; Lee, C.-H. Three-Dimensional Hydraulic Modeling of Particle Deposition on the Patterned Isopore Membrane in Crossflow Microfiltration. J. Membrane Sci. 2015, 492, 156–163. [Google Scholar] [CrossRef]
- Jung, S. Y.; Won, Y.-J.; Jang, J. H.; Yoo, J. H.; Ahn, K. H.; Lee, C.-H. Particle Deposition on the Patterned Membrane Surface: Simulation and Experiments. Desalination 2015, 370, 17–24. [Google Scholar] [CrossRef]
- Jung, S. Y.; Ahn, K. H. Transport and Deposition of Colloidal Particles on a Patterned Membrane Surface: Effect of Cross-Flow Velocity and the Size Ratio of Particle to Surface Pattern. J. Membrane Sci. 2019, 572, 309–319. [Google Scholar] [CrossRef]
- Wang, Q.; Lin, W.; Chou, S.; Dai, P.; Huang, X. Patterned Membranes for Improving Hydrodynamic Properties and Mitigating Membrane Fouling in Water Treatment: A Review. Water Res. 2023, 236, 119943. [Google Scholar] [CrossRef]
- Young, A. H.; Kabala, Z. J. Hydrodynamic Porosity: A Paradigm Shift in Flow and Contaminant Transport through Porous Media, Part I. Hydrol. Earth Syst. Sci. Discuss. 2023, 2023, 1–36. [Google Scholar] [CrossRef]
- Shen, C.; Floryan, J. M. Low Reynolds Number Flow over Cavities. Phys. Fluids 1985, 28. [Google Scholar] [CrossRef]
- Fang, L. C.; Cleaver, J. W.; Nicolaou, D. "Hydrodynamic Cleansing of Cavities." Paper presented at the 8th International Conference on Computational Methods and Experimental Measurements (CMEM 97), Rhodes, Greece, May 1997.
- Kahler, D. M.; Kabala, Z. J. Acceleration of Groundwater Remediation by Deep Sweeps and Vortex Ejections Induced by Rapidly Pulsed Pumping. Water Resour. Res. 2016, 52, 3930–3940. [Google Scholar] [CrossRef]
- ———. Rapidly Pulsed Pumping Accelerates Remediation in a Vertical Circulation Well Model. Water 2018, 10. [CrossRef]
- ———. Acceleration of Groundwater Remediation by Rapidly Pulsed Pumping: Laboratory Column Tests. J. Environ. Eng. 2019, 145. [CrossRef]
- Young, A. H.; Kabala, Z. J. Hydrodynamic Porosity: A Paradigm Shift in Flow and Contaminant Transport through Porous Media, Part Ii. Hydrol. Earth Syst. Sci. Discuss. 2023, 2023, 1–21. [Google Scholar] [CrossRef]
Figure 4.
The deep sweep followed by a vortex ejection for a rapidly pulsed feed flow with an average Reynolds number of 600 (top) and 1600 (bottom) and a permeate flux condition of 1/2000 the maximum inlet flow velocity.
Figure 4.
The deep sweep followed by a vortex ejection for a rapidly pulsed feed flow with an average Reynolds number of 600 (top) and 1600 (bottom) and a permeate flux condition of 1/2000 the maximum inlet flow velocity.
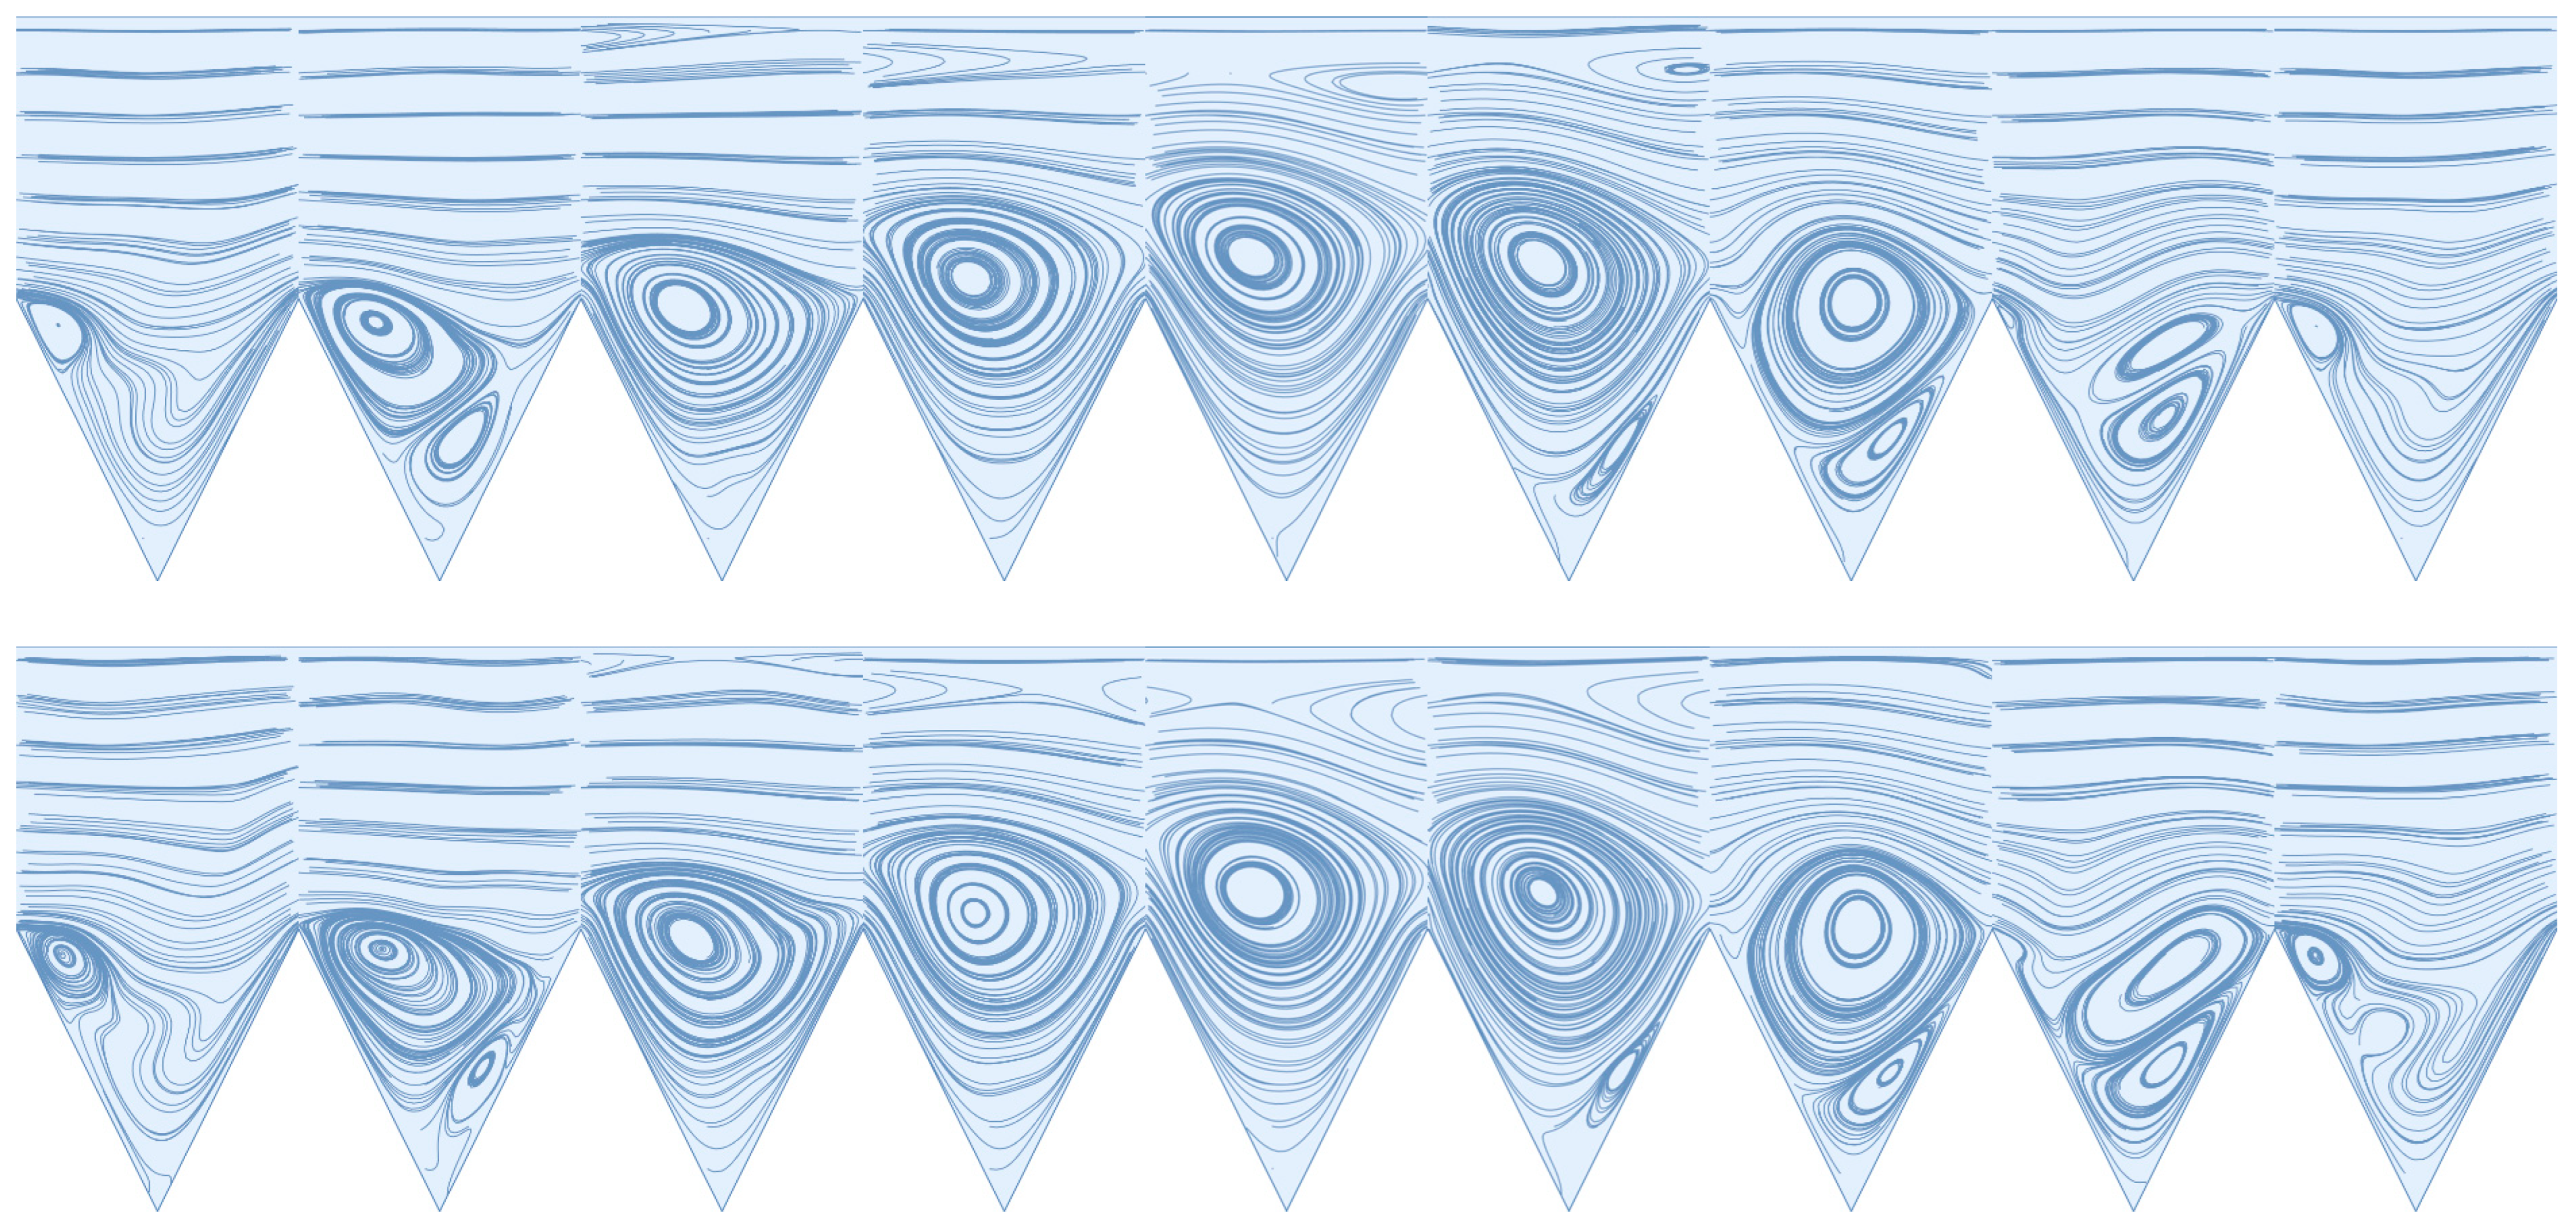
Figure 5.
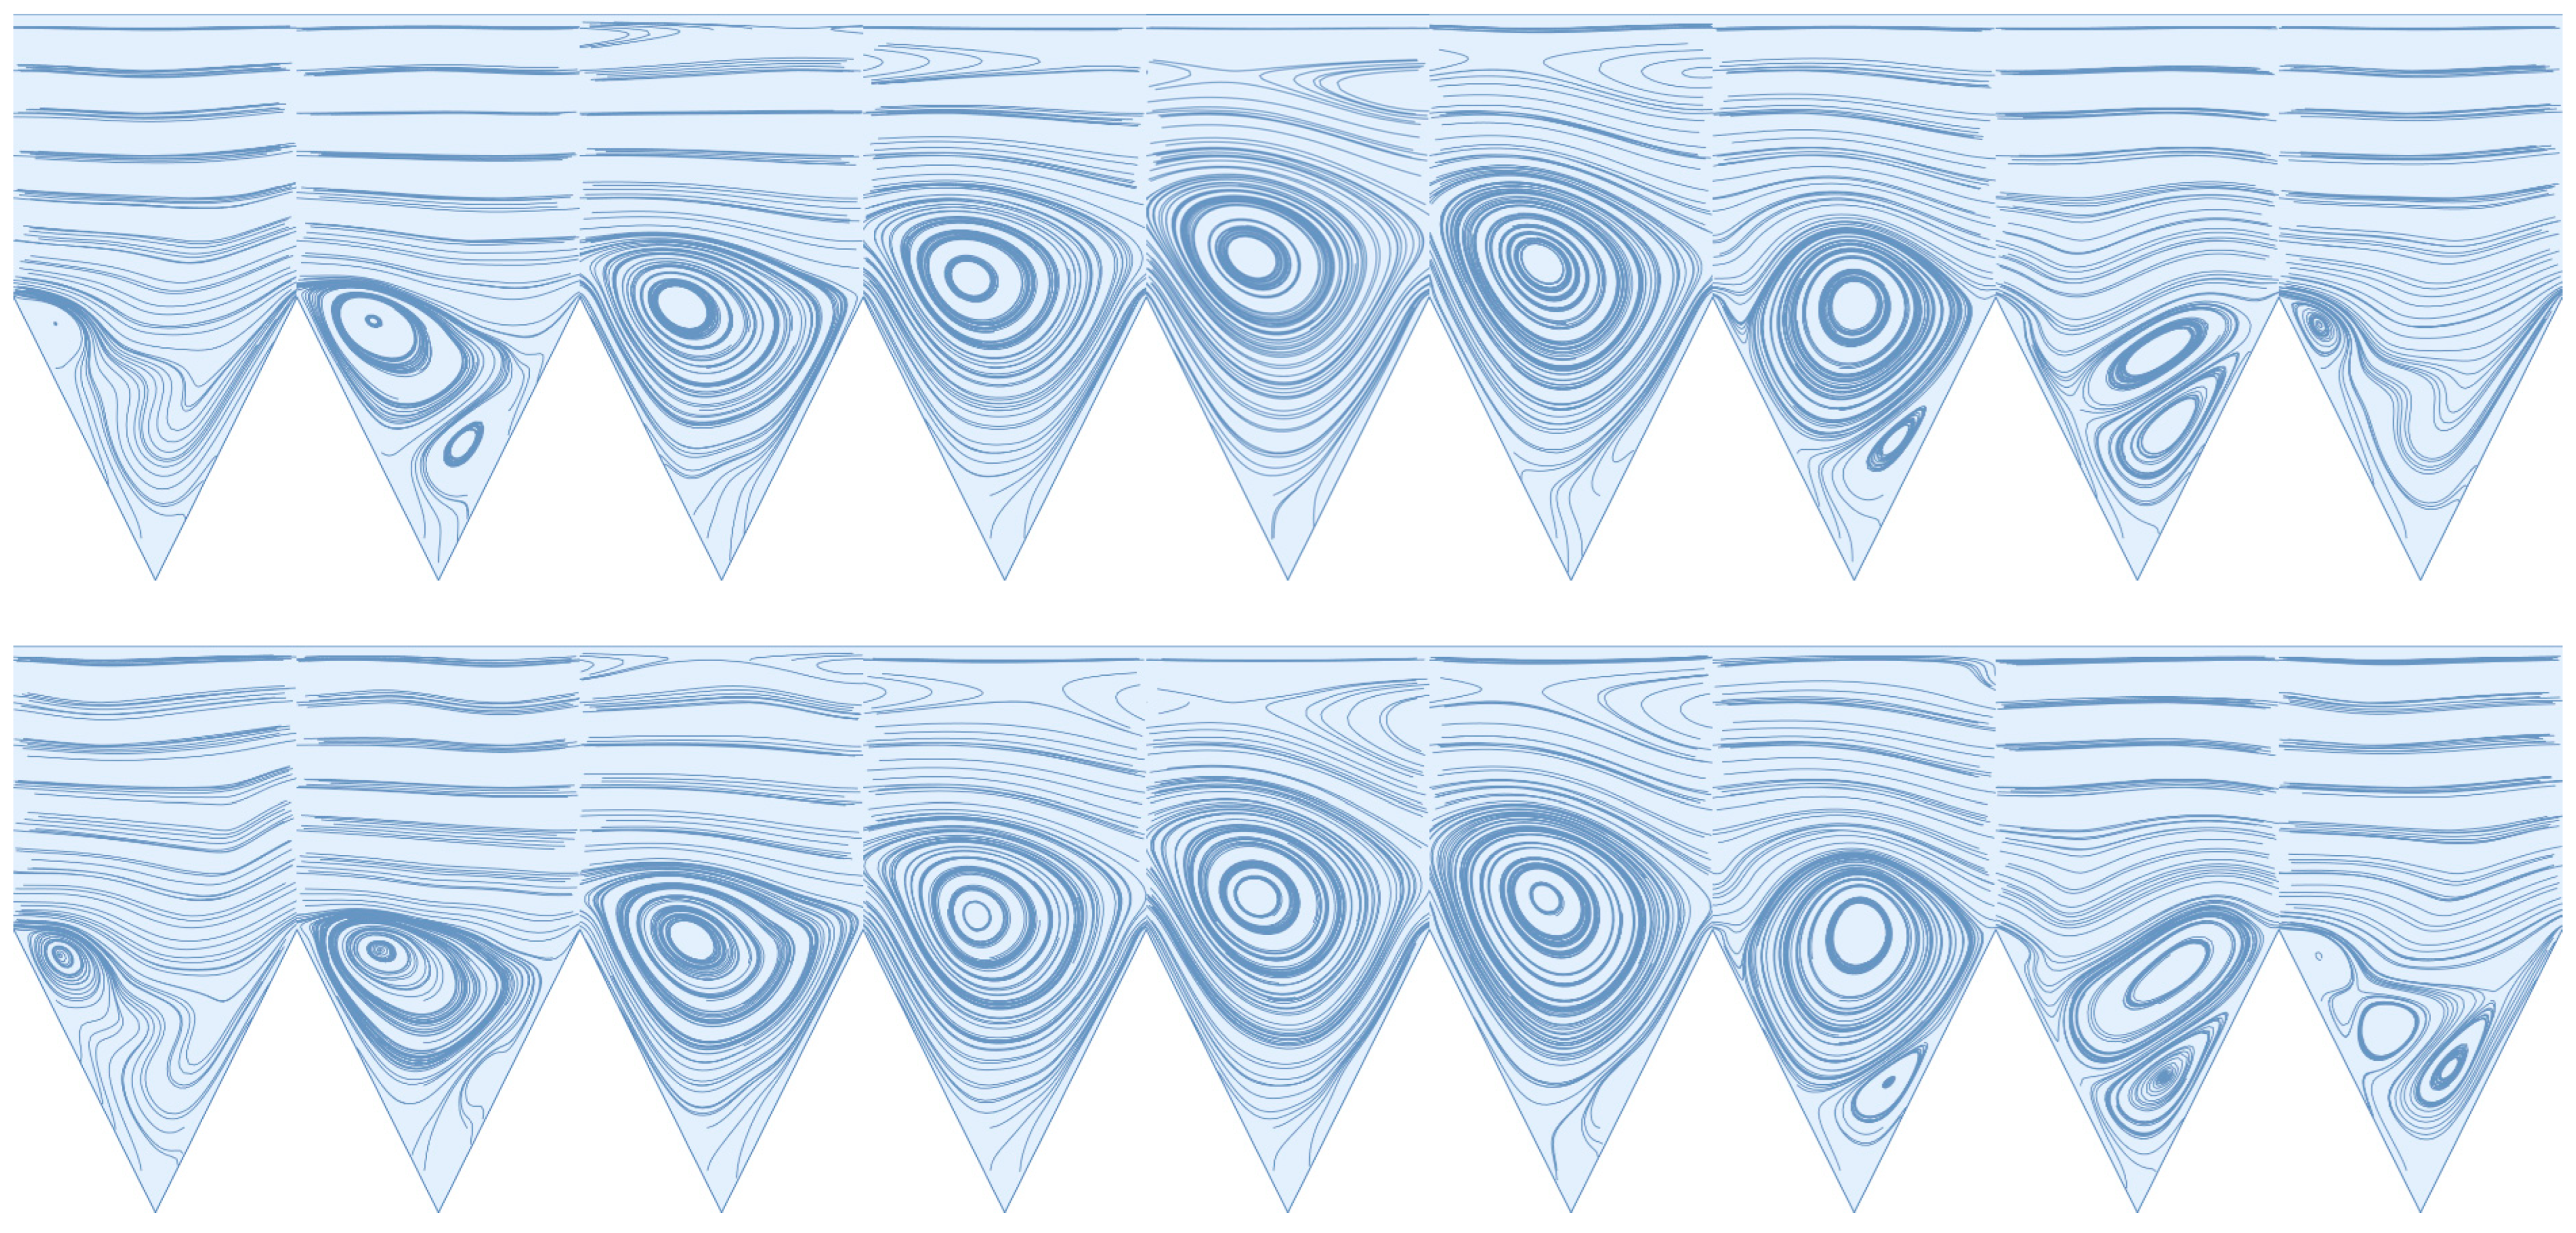
The deep sweep followed by a vortex ejection for a rapidly pulsed feed flow with an average Reynolds number of 600 (top) and 1600 (bottom) and a permeate flux condition of 1/200 the maximum inlet flow velocity.
Figure 5.
The deep sweep followed by a vortex ejection for a rapidly pulsed feed flow with an average Reynolds number of 600 (top) and 1600 (bottom) and a permeate flux condition of 1/200 the maximum inlet flow velocity.
Disclaimer/Publisher’s Note: The statements, opinions and data contained in all publications are solely those of the individual author(s) and contributor(s) and not of MDPI and/or the editor(s). MDPI and/or the editor(s) disclaim responsibility for any injury to people or property resulting from any ideas, methods, instructions or products referred to in the content. |
© 2023 by the authors. Licensee MDPI, Basel, Switzerland. This article is an open access article distributed under the terms and conditions of the Creative Commons Attribution (CC BY) license (http://creativecommons.org/licenses/by/4.0/).
Copyright: This open access article is published under a Creative Commons CC BY 4.0 license, which permit the free download, distribution, and reuse, provided that the author and preprint are cited in any reuse.


