Submitted:
12 December 2023
Posted:
12 December 2023
You are already at the latest version
Abstract
Keywords:
1. Introduction
2. Materials and Methods
2.1. Growth Conditions and Magnesium Treatment for the Mulberry Plant (Morus alba).
2.2. Data Collection and Identification of XTH Gene Family Members in Morus alba
2.3. Gene Structure, Motif Analysis and Sequence Alignment
2.4. Physicochemical Properties of the MaXTH Gene Family
2.5. Phylogenetic Analysis
2.6. Analysis of Cis-Regulatory Elements of MaXTH Genes and GO Analysis
2.7. Chromosomal Localization, Circos, and Synteny Analyses
2.8. Gene Expression Analysis and qRT-PCR Gene Validation
3. Results
3.1. Identification and Physiological Features XTH Genes in M. alba
3.2. Gene Structure, Conserved Domain, and Motif Analysis
3.3. Evolutionary Relationship of the MaXTH Proteins
3.4. Cis-Acting Regulatory Elements of XTH Genes from Morus alba
3.5. Chromosomal Localization, Circos, and Synteny Analyses
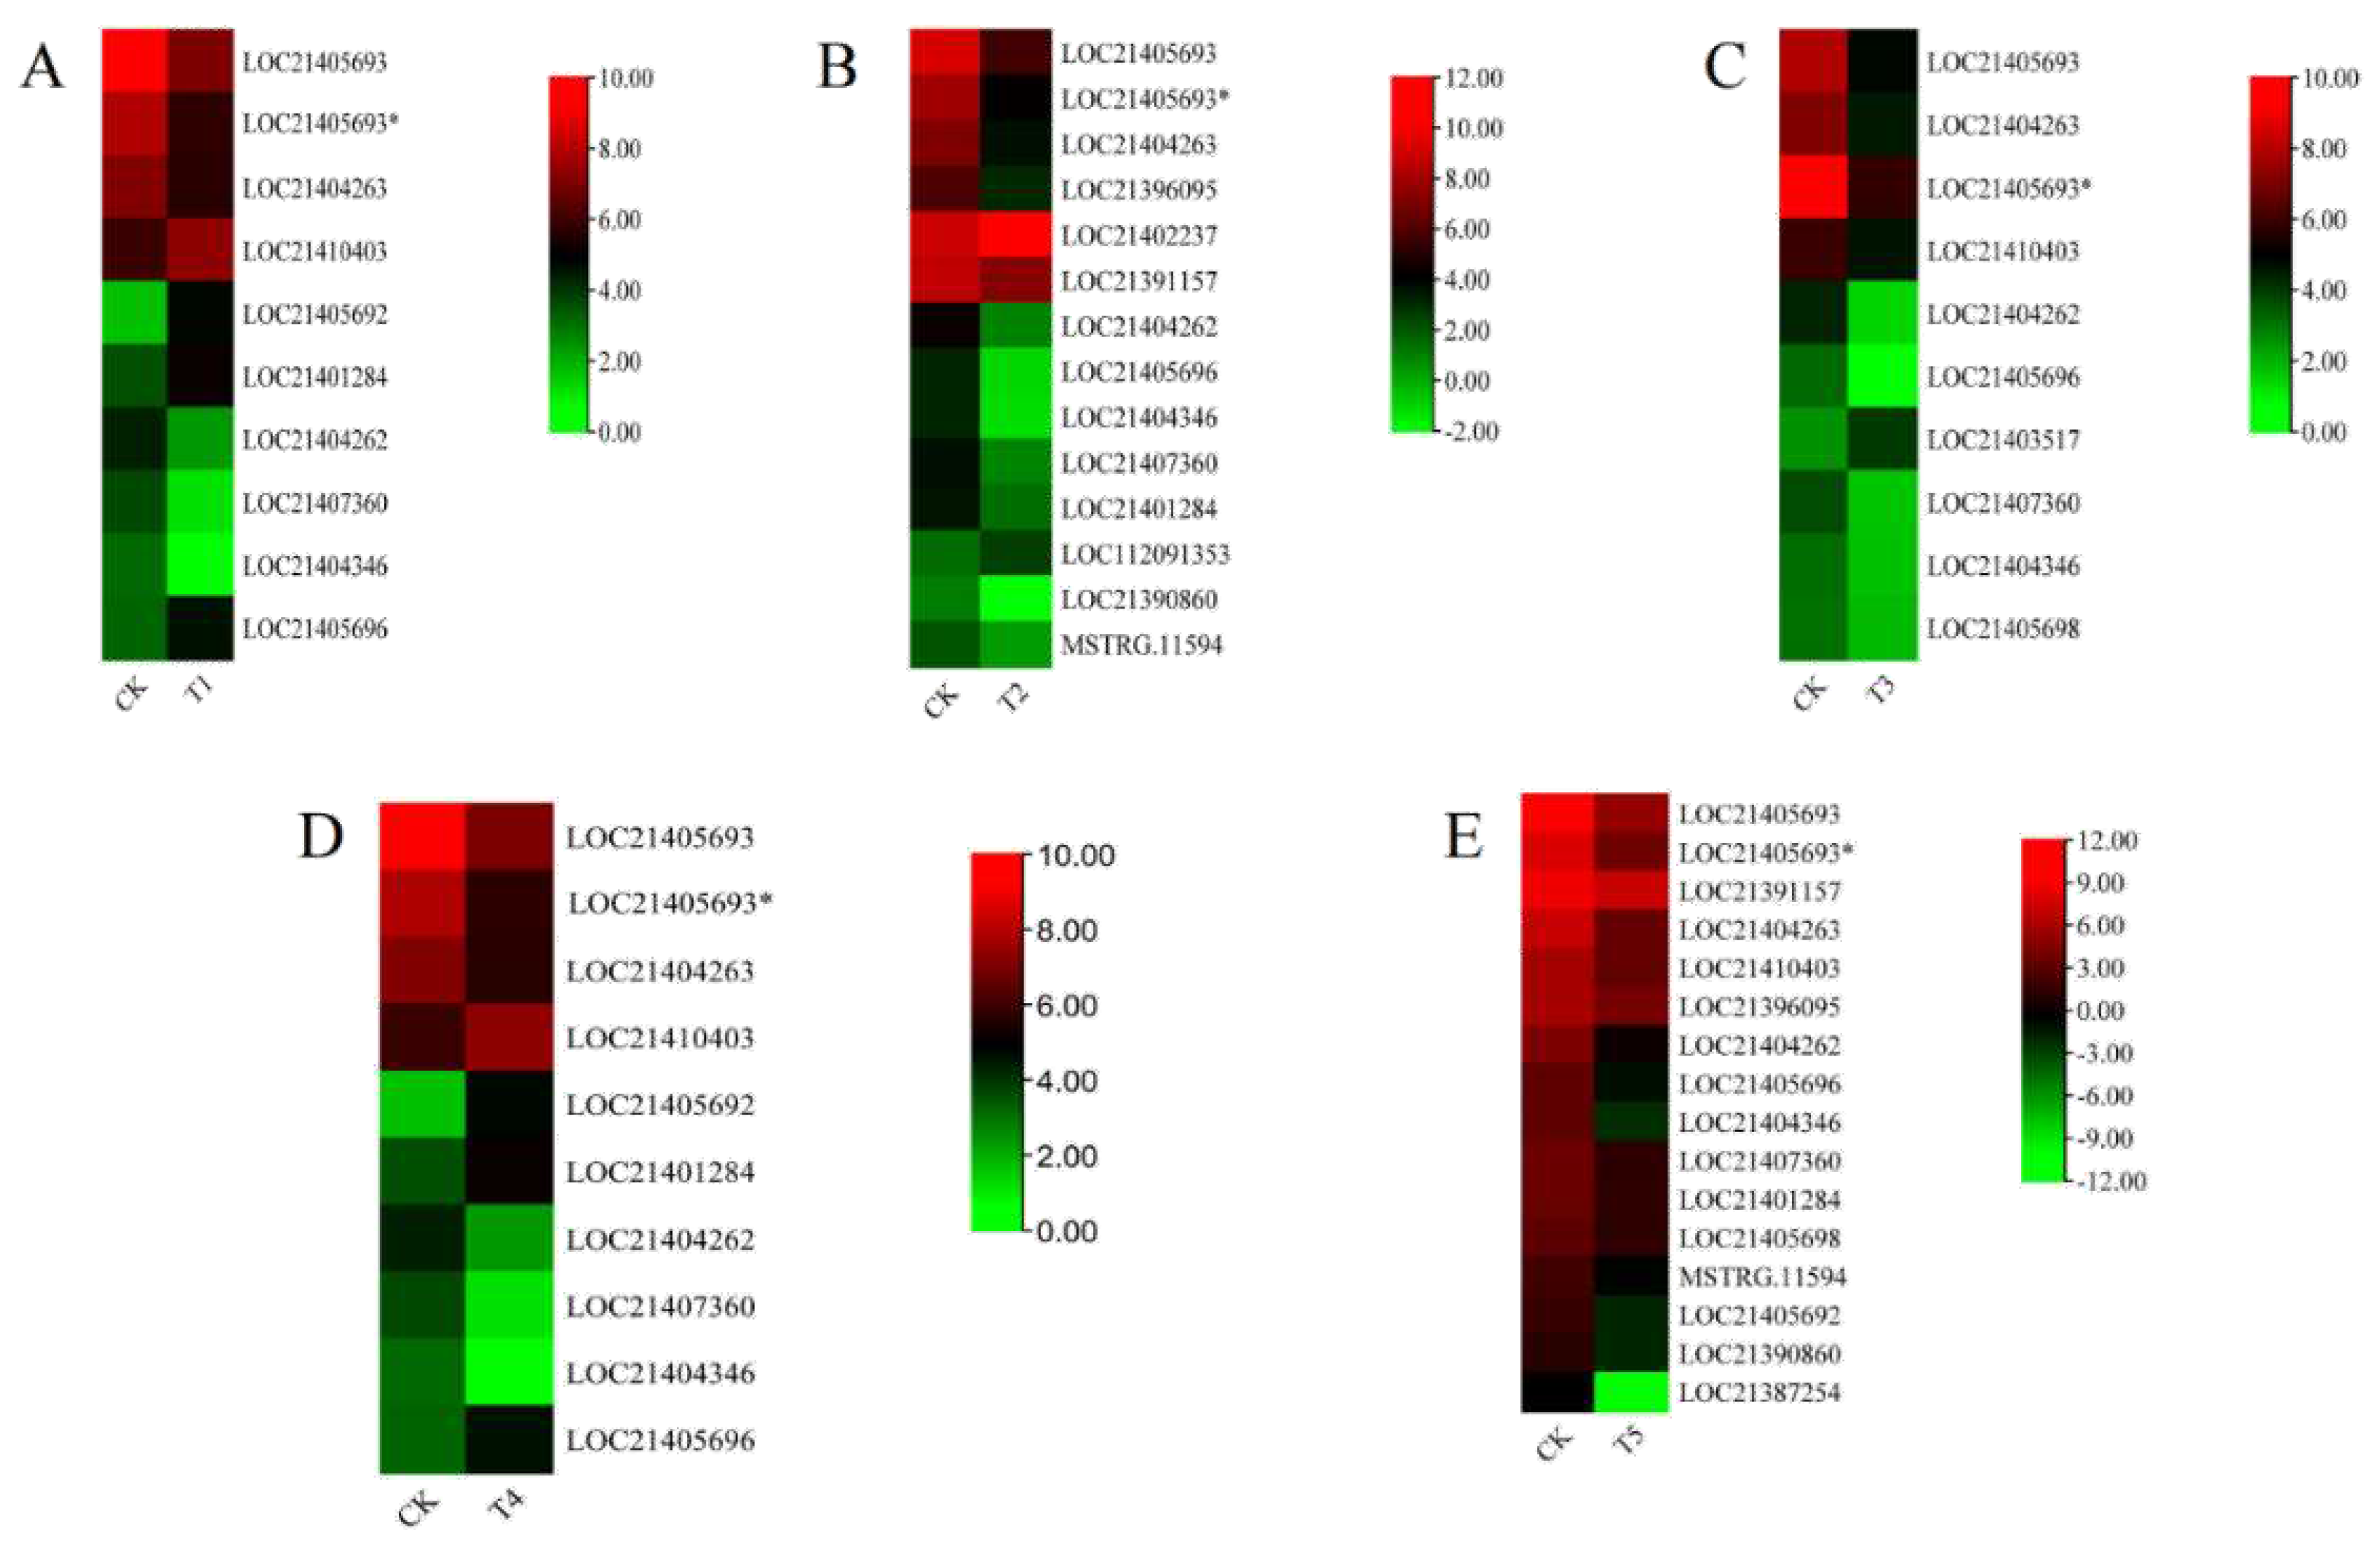
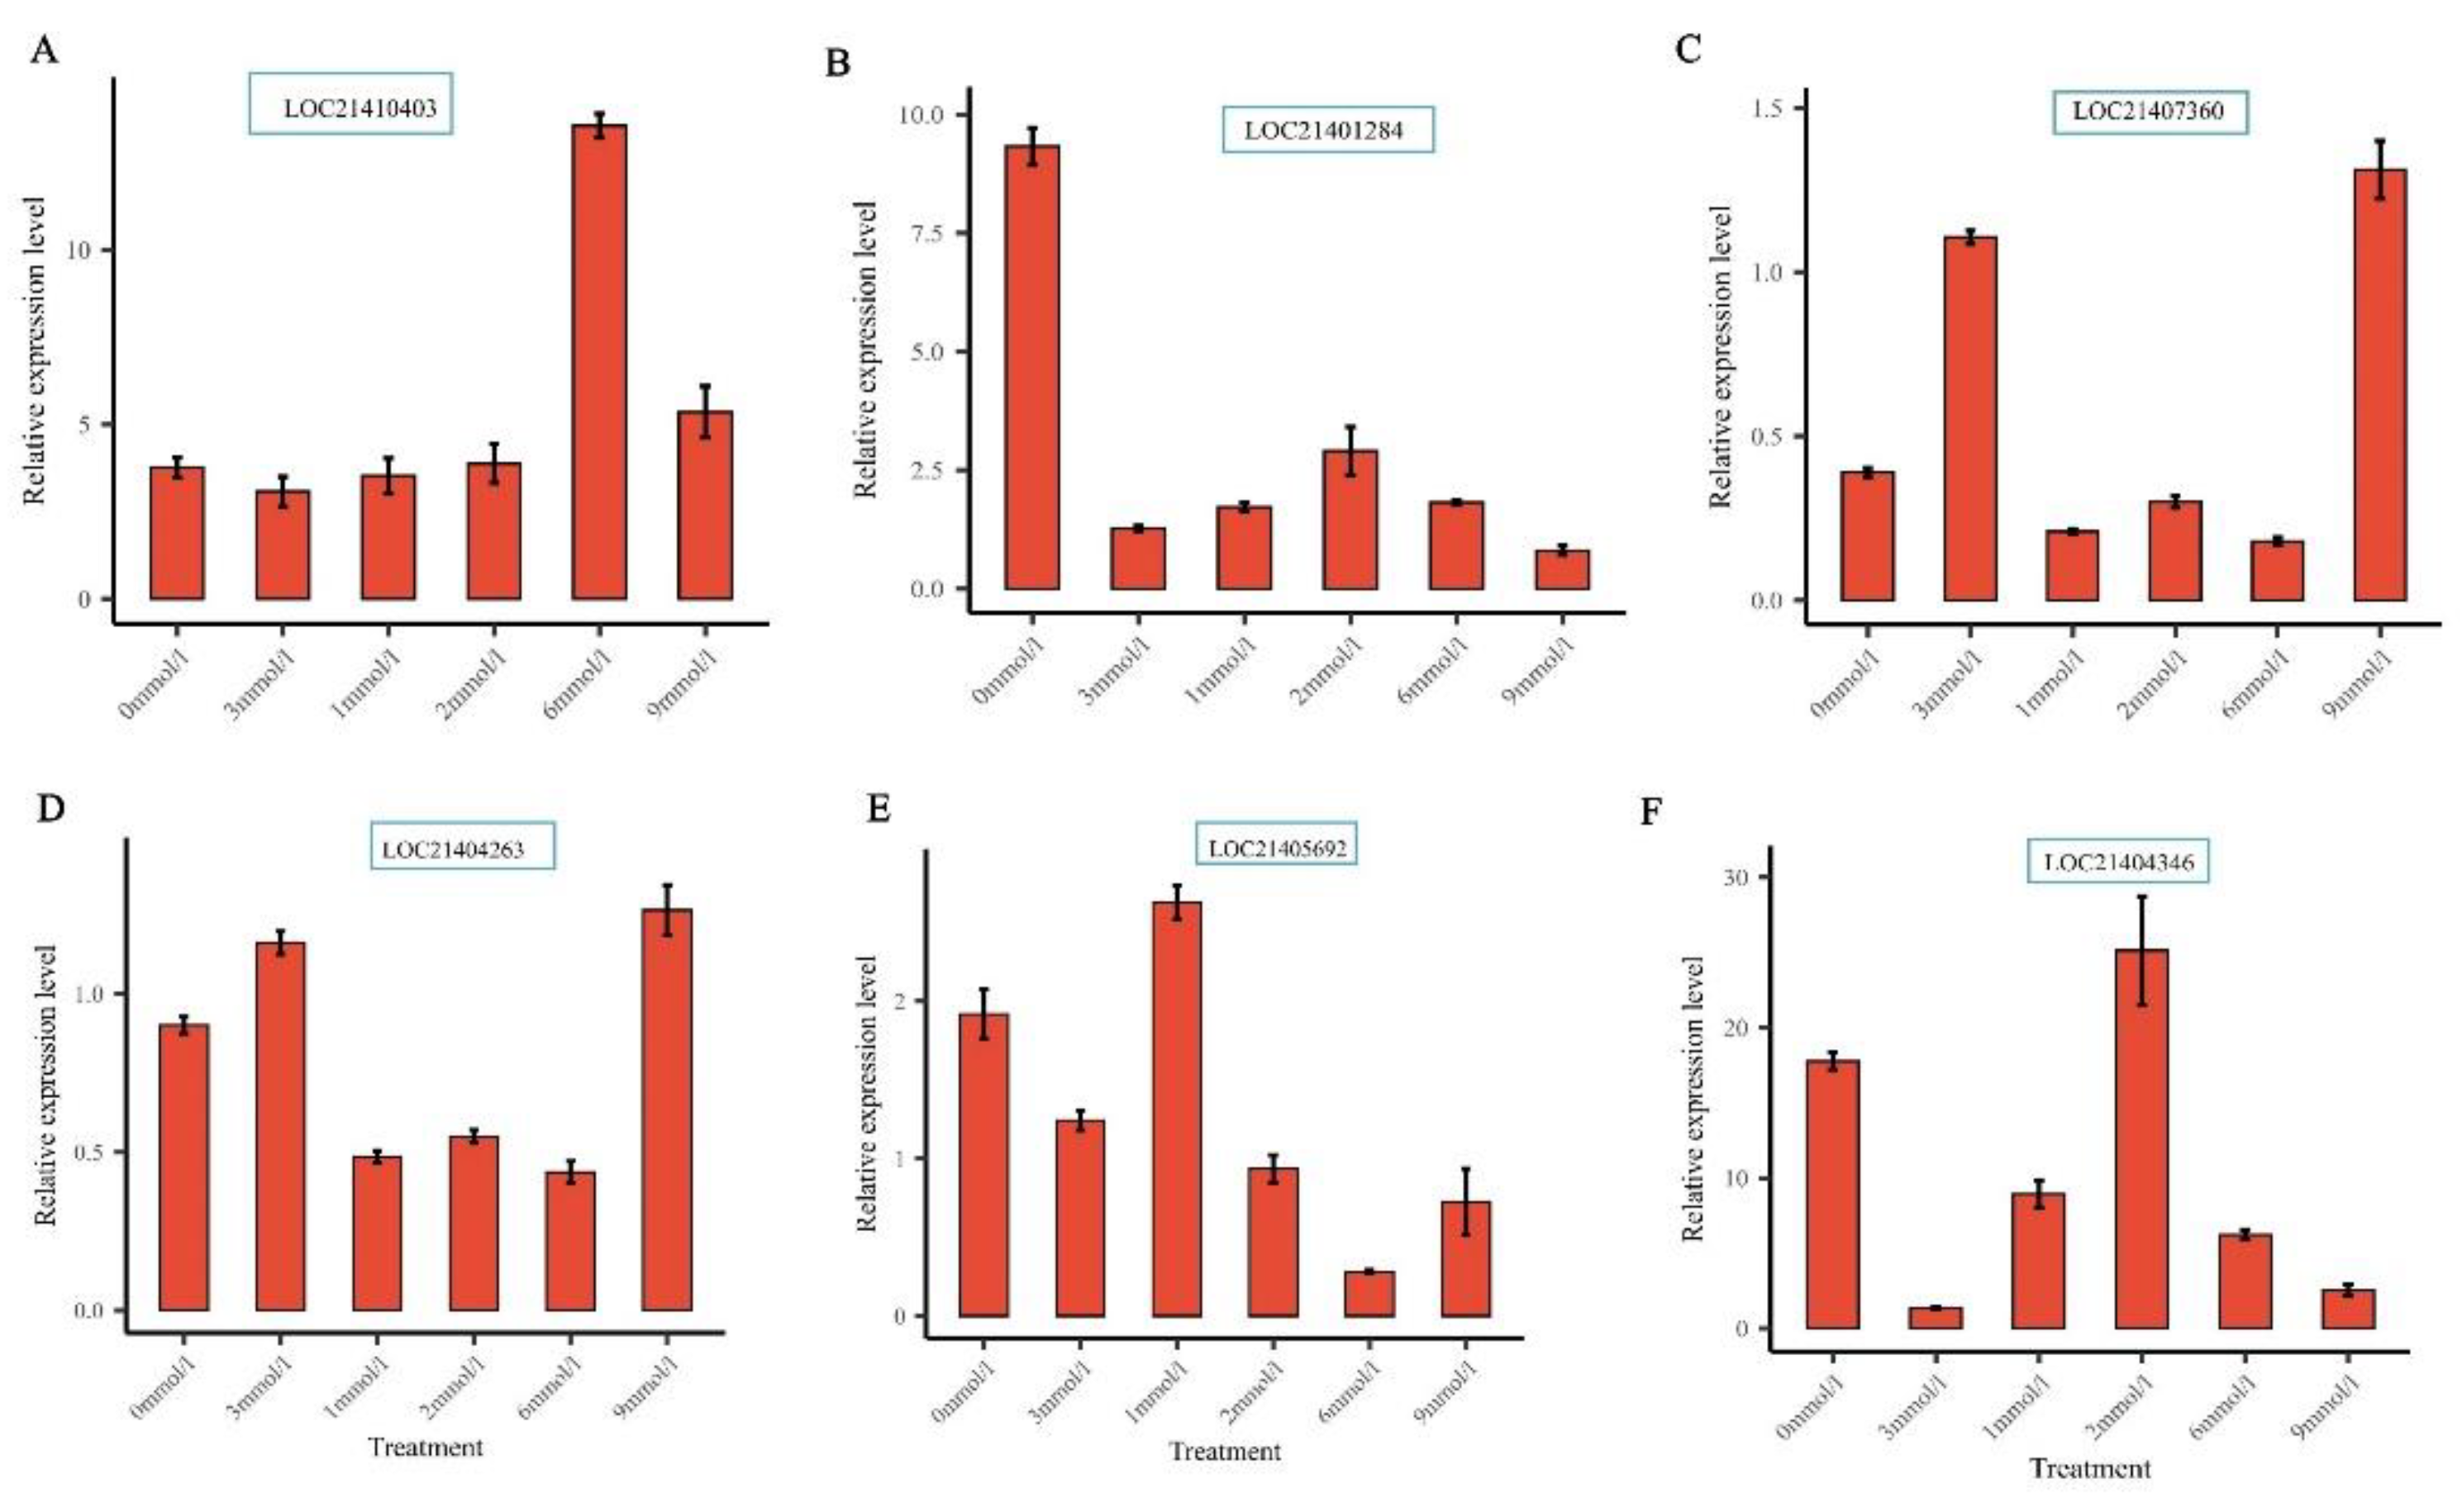
3.6. Expression Profiling of MaXTH Genes under Different Magnesium Treatment and qRT-PCR Validation
4. Discussion
5. Conclusions
Supplementary Materials
Author Contributions
Funding
Institutional Review Board Statement
Declaration of competing interest
References
- Buhroo, Z.I., et al., Trends in development and utilization of sericulture resources for diversification and value addition. International Journal of Entomological Research, 2018. 6(1): p. 27-47. [CrossRef]
- Chauhan, T. and M.K. Tayal, Mulberry sericulture. Industrial entomology, 2017: p. 197-263.
- Zeng, P., et al., Physiological stress responses, mineral element uptake and phytoremediation potential of Morus alba L. in cadmium-contaminated soil. Ecotoxicology and environmental safety, 2020. 189: p. 109973. [CrossRef]
- Zhang, R., et al., Mulberry leaf (Morus alba L.): A review of its potential influences in mechanisms of action on metabolic diseases. Pharmacological Research, 2022. 175: p. 106029. [CrossRef]
- Jin, X., et al., Magnesium Nutrient Application Induces Metabolomics and Physiological Responses in Mulberry (Morus alba) Plants. International Journal of Molecular Sciences, 2023. 24(11): p. 9650. [CrossRef]
- Aitken, R., et al., Response of field-grown maize to applied magnesium in acidic soils in north-eastern Australia. Australian Journal of Agricultural Research, 1999. 50(2): p. 191-198. [CrossRef]
- Ogura, T., et al., Short-Term Magnesium Deficiency Triggers Nutrient Retranslocation in Arabidopsis thaliana. Front Plant Sci, 2020. 11: p. 563. [CrossRef]
- Gerendás, J. and H. Führs, The significance of magnesium for crop quality. Plant and Soil, 2013. 368: p. 101-128. [CrossRef]
- Guo, W., et al., Magnesium deficiency in plants: an urgent problem. Crop J 4: 83–91. 2016. [CrossRef]
- Yang, L.-T., et al., Magnesium deficiency induced global transcriptome change in Citrus sinensis leaves revealed by RNA-Seq. International journal of molecular sciences, 2019. 20(13): p. 3129. [CrossRef]
- Sarmiento-López, L.G., et al., Genome-wide characterization of the xyloglucan endotransglucosylase/hydrolase gene family in Solanum lycopersicum L. and gene expression analysis in response to arbuscular mycorrhizal symbiosis. PeerJ, 2023. 11: p. e15257.
- Pauly, M. and K. Keegstra, Biosynthesis of the plant cell wall matrix polysaccharide xyloglucan. Annual review of plant biology, 2016. 67: p. 235-259. [CrossRef]
- Eklöf, J.M. and H. Brumer, The XTH gene family: an update on enzyme structure, function, and phylogeny in xyloglucan remodeling. Plant physiology, 2010. 153(2): p. 456-466.
- Li, X., et al., Identification and analysis of the xyloglucan endotransferase/hydrolase (XTH) family genes in apple. Scientia Horticulturae, 2023. 315: p. 111990. [CrossRef]
- Stratilová, B., et al., Plant xyloglucan xyloglucosyl transferases and the cell wall structure: subtle but significant. Molecules, 2020. 25(23): p. 5619. [CrossRef]
- Li, Q., et al., Genome-wide identification and characterization of xyloglucan endotransglycosylase/hydrolase in Ananas comosus during Development. Genes, 2019. 10(7): p. 537. [CrossRef]
- Zhu, J., et al., Genome-wide identification of xyloglucan endotransglucosylase/hydrolase gene family members in peanut and their expression profiles during seed germination. PeerJ, 2022. 10: p. e13428. [CrossRef]
- Song, L., et al., Characterization of the XTH gene family: new insight to the roles in soybean flooding tolerance. International Journal of Molecular Sciences, 2018. 19(9): p. 2705. [CrossRef]
- Yokoyama, R. and K. Nishitani, A comprehensive expression analysis of all members of a gene family encoding cell-wall enzymes allowed us to predict cis-regulatory regions involved in cell-wall construction in specific organs of Arabidopsis. Plant and cell physiology, 2001. 42(10): p. 1025-1033. [CrossRef]
- Zhang, J.-Z., et al., Genome-wide identification and expression analysis of the xyloglucan endotransglucosylase/hydrolase gene family in sweet potato [Ipomoea batatas (L.) Lam]. International Journal of Molecular Sciences, 2023. 24(1): p. 775. [CrossRef]
- Yokoyama, R., J.K. Rose, and K. Nishitani, A surprising diversity and abundance of xyloglucan endotransglucosylase/hydrolases in rice. Classification and expression analysis. Plant Physiology, 2004. 134(3): p. 1088-1099. [CrossRef]
- Wang, M., et al., Genome-wide identification and expression profiling analysis of the xyloglucan endotransglucosylase/hydrolase gene family in tobacco (Nicotiana tabacum L.). Genes, 2018. 9(6): p. 273. [CrossRef]
- Wu, D., et al., Genome-wide identification, and phylogenetic and expression profiling analyses, of XTH gene families in Brassica rapa L. and Brassica oleracea L. Bmc Genomics, 2020. 21: p. 1-17. [CrossRef]
- Osato, Y., R. Yokoyama, and K. Nishitani, A principal role for AtXTH18 in Arabidopsis thaliana root growth: a functional analysis using RNAi plants. Journal of plant research, 2006. 119: p. 153-162. [CrossRef]
- Lee, J., et al., Xyloglucan endotransglycosylase/hydrolase genes in cotton and their role in fiber elongation. Planta, 2010. 232: p. 1191-1205. [CrossRef]
- Zhai, Z., et al., Genome-wide identification of the xyloglucan endotransglucosylase/hydrolase (XTH) and polygalacturonase (PG) genes and characterization of their role in fruit softening of sweet cherry. International Journal of Molecular Sciences, 2021. 22(22): p. 12331. [CrossRef]
- Miedes, E. and E.P. Lorences, Xyloglucan endotransglucosylase/hydrolases (XTHs) during tomato fruit growth and ripening. Journal of plant physiology, 2009. 166(5): p. 489-498. [CrossRef]
- Witasari, L.D., et al., Higher expression of the strawberry xyloglucan endotransglucosylase/hydrolase genes Fv XTH 9 and Fv XTH 6 accelerates fruit ripening. The Plant Journal, 2019. 100(6): p. 1237-1253.
- Atkinson, R.G., et al., Analysis of xyloglucan endotransglucosylase/hydrolase (XTH) gene families in kiwifruit and apple. Postharvest Biology and Technology, 2009. 51(2): p. 149-157. [CrossRef]
- Lu, W.J., et al., Cloning and expression analysis of an XET cDNA in the peel and pulp of banana fruit ripening and softening. Acta Botanica Sinica, 2004. 46(3): p. 355-362.
- Cho, S.K., et al., Constitutive expression of abiotic stress-inducible hot pepper CaXTH3, which encodes a xyloglucan endotransglucosylase/hydrolase homolog, improves drought and salt tolerance in transgenic Arabidopsis plants. FEBS letters, 2006. 580(13): p. 3136-3144.
- Han, Y., et al., Overexpression of persimmon DkXTH1 enhanced tolerance to abiotic stress and delayed fruit softening in transgenic plants. Plant cell reports, 2017. 36: p. 583-596. [CrossRef]
- Yang, K.A., et al., Identification of cell wall genes modified by a permissive high temperature in Chinese cabbage. Plant science, 2006. 171(1): p. 175-182. [CrossRef]
- Han, Y., et al., Isolation and characterization of two persimmon xyloglucan endotransglycosylase/hydrolase (XTH) genes that have divergent functions in cell wall modification and fruit postharvest softening. Frontiers in Plant Science, 2016. 7: p. 624. [CrossRef]
- Zhu, J., et al., Cell wall proteome in the maize primary root elongation zone. II. Region-specific changes in water soluble and lightly ionically bound proteins under water deficit. Plant physiology, 2007. 145(4): p. 1533-1548. [CrossRef]
- Zhu, X.F., et al., XTH31, encoding an in vitro XEH/XET-active enzyme, regulates aluminum sensitivity by modulating in vivo XET action, cell wall xyloglucan content, and aluminum binding capacity in Arabidopsis. The Plant Cell, 2012. 24(11): p. 4731-4747. [CrossRef]
- Han, Y., et al., Overexpression of Populus euphratica xyloglucan endotransglucosylase/hydrolase gene confers enhanced cadmium tolerance by the restriction of root cadmium uptake in transgenic tobacco. Environmental and experimental botany, 2014. 100: p. 74-83. [CrossRef]
- Du, H., et al., ZmXTH, a xyloglucan endotransglucosylase/hydrolase gene of maize, conferred aluminum tolerance in Arabidopsis. Journal of Plant Physiology, 2021. 266: p. 153520. [CrossRef]
- Adolf, A., et al., Transcriptome profiling reveals candidate genes associated with cold stress in mulberry. Brazilian Journal of Botany, 2021. 44: p. 125-137. [CrossRef]
- Chen, C., et al., TBtools: An Integrative Toolkit Developed for Interactive Analyses of Big Biological Data. Molecular Plant, 2020. 13(8): p. 1194-1202. [CrossRef]
- Yu, C.S., et al., Prediction of protein subcellular localization. Proteins: Structure, Function, and Bioinformatics, 2006. 64(3): p. 643-651.
- Tamura, K., et al., MEGA6: molecular evolutionary genetics analysis version 6.0. Molecular biology and evolution, 2013. 30(12): p. 2725-2729.
- Lescot, M., et al., PlantCARE, a database of plant cis-acting regulatory elements and a portal to tools for in silico analysis of promoter sequences. Nucleic acids research, 2002. 30(1): p. 325-327. [CrossRef]
- Wang, Y., et al., MCScanX: a toolkit for detection and evolutionary analysis of gene synteny and collinearity. Nucleic acids research, 2012. 40(7): p. e49-e49. [CrossRef]
- Chen, C., et al., TBtools, a toolkit for biologists integrating various biological data handling tools with a user-friendly interface. BioRxiv, 2018. 289660(10.1101): p. 289660.
- Ackah, M., et al., DNA methylation changes and its associated genes in mulberry (Morus alba L.) Yu-711 response to drought stress using MethylRAD sequencing. Plants, 2022. 11(2): p. 190.
- Livak, K.J. and T.D. Schmittgen, Analysis of relative gene expression data using real-time quantitative PCR and the 2− ΔΔCT method. methods, 2001. 25(4): p. 402-408.
- Kwon, M.C., et al., Comparative metabolomics unravel the effect of magnesium oversupply on tomato fruit quality and associated plant metabolism. Metabolites, 2019. 9(10): p. 231. [CrossRef]
- Ishida, K. and R. Yokoyama, Reconsidering the function of the xyloglucan endotransglucosylase/hydrolase family. Journal of Plant Research, 2022. 135(2): p. 145-156. [CrossRef]
- Ma, X., et al., Genome-wide analysis of the XTH gene family and functional analysis of DlXTH23. 5/25 during early longan somatic embryogenesis. Frontiers in Plant Science, 2022. 13: p. 1043464. [CrossRef]
- Maris, A., et al., Differences in enzymic properties of five recombinant xyloglucan endotransglucosylase/hydrolase (XTH) proteins of Arabidopsis thaliana. Journal of Experimental Botany, 2011. 62(1): p. 261-271. [CrossRef]
- Han, J., et al., A Surprising Diversity of Xyloglucan Endotransglucosylase/Hydrolase in Wheat: New in Sight to the Roles in Drought Tolerance. International Journal of Molecular Sciences, 2023. 24(12): p. 9886. [CrossRef]
- Qiao, T., et al., Identification and expression analysis of xyloglucan endotransglucosylase/hydrolase (XTH) family in grapevine (Vitis vinifera L.). PeerJ, 2022. 10: p. e13546.
- Fu, M.-M., C. Liu, and F. Wu, Genome-wide identification, characterization and expression analysis of xyloglucan endotransglucosylase/hydrolase genes family in barley (Hordeum vulgare). Molecules, 2019. 24(10): p. 1935.
- Cheng, Z., et al., Genome-wide identification and expression analysis of the xyloglucan endotransglucosylase/hydrolase gene family in poplar. BMC genomics, 2021. 22: p. 1-13. [CrossRef]
- Yang, Z., R. Zhang, and Z. Zhou, The XTH gene family in Schima superba: Genome-wide identification, expression profiles, and functional interaction network analysis. Frontiers in Plant Science, 2022. 13: p. 911761. [CrossRef]
- Du, H., et al., Genome-wide analysis of the MYB transcription factor superfamily in soybean. BMC plant biology, 2012. 12: p. 1-22. [CrossRef]
- Chen, C., et al., Genome-wide analysis of the WRKY gene family in the cucumber genome and transcriptome-wide identification of WRKY transcription factors that respond to biotic and abiotic stresses. BMC Plant Biology, 2020. 20: p. 1-19. [CrossRef]
- Biłas, R., et al., Cis-regulatory elements used to control gene expression in plants. Plant Cell, Tissue and Organ Culture (PCTOC), 2016. 127: p. 269-287. [CrossRef]
- Han, Y., et al., Genome-wide characterization and expression analysis of bZIP gene family under abiotic stress in Glycyrrhiza uralensis. Frontiers in Genetics, 2021. 12: p. 754237. [CrossRef]
- Xu, P., et al., The brassinosteroid-responsive xyloglucan endotransglucosylase/hydrolase 19 (XTH19) and XTH23 genes are involved in lateral root development under salt stress in Arabidopsis. The Plant Journal, 2020. 104(1): p. 59-75. [CrossRef]
- Ma, Y.-S., et al., Identification of the Xyloglucan Endotransglycosylase/Hydrolase (XTH) Gene Family Members Expressed in Boehmeria nivea in Response to Cadmium Stress. International Journal of Molecular Sciences, 2022. 23(24): p. 16104. [CrossRef]
- Wu, Z., et al., Identification and response analysis of xyloglucan endotransglycosylase/hydrolases (XTH) family to fluoride and aluminum treatment in Camellia sinensis. BMC genomics, 2021. 22(1): p. 1-16. [CrossRef]
- Yang, J.L., et al., Cell wall hemicellulose contributes significantly to aluminum adsorption and root growth in Arabidopsis. Plant physiology, 2011. 155(4): p. 1885-1892. [CrossRef]

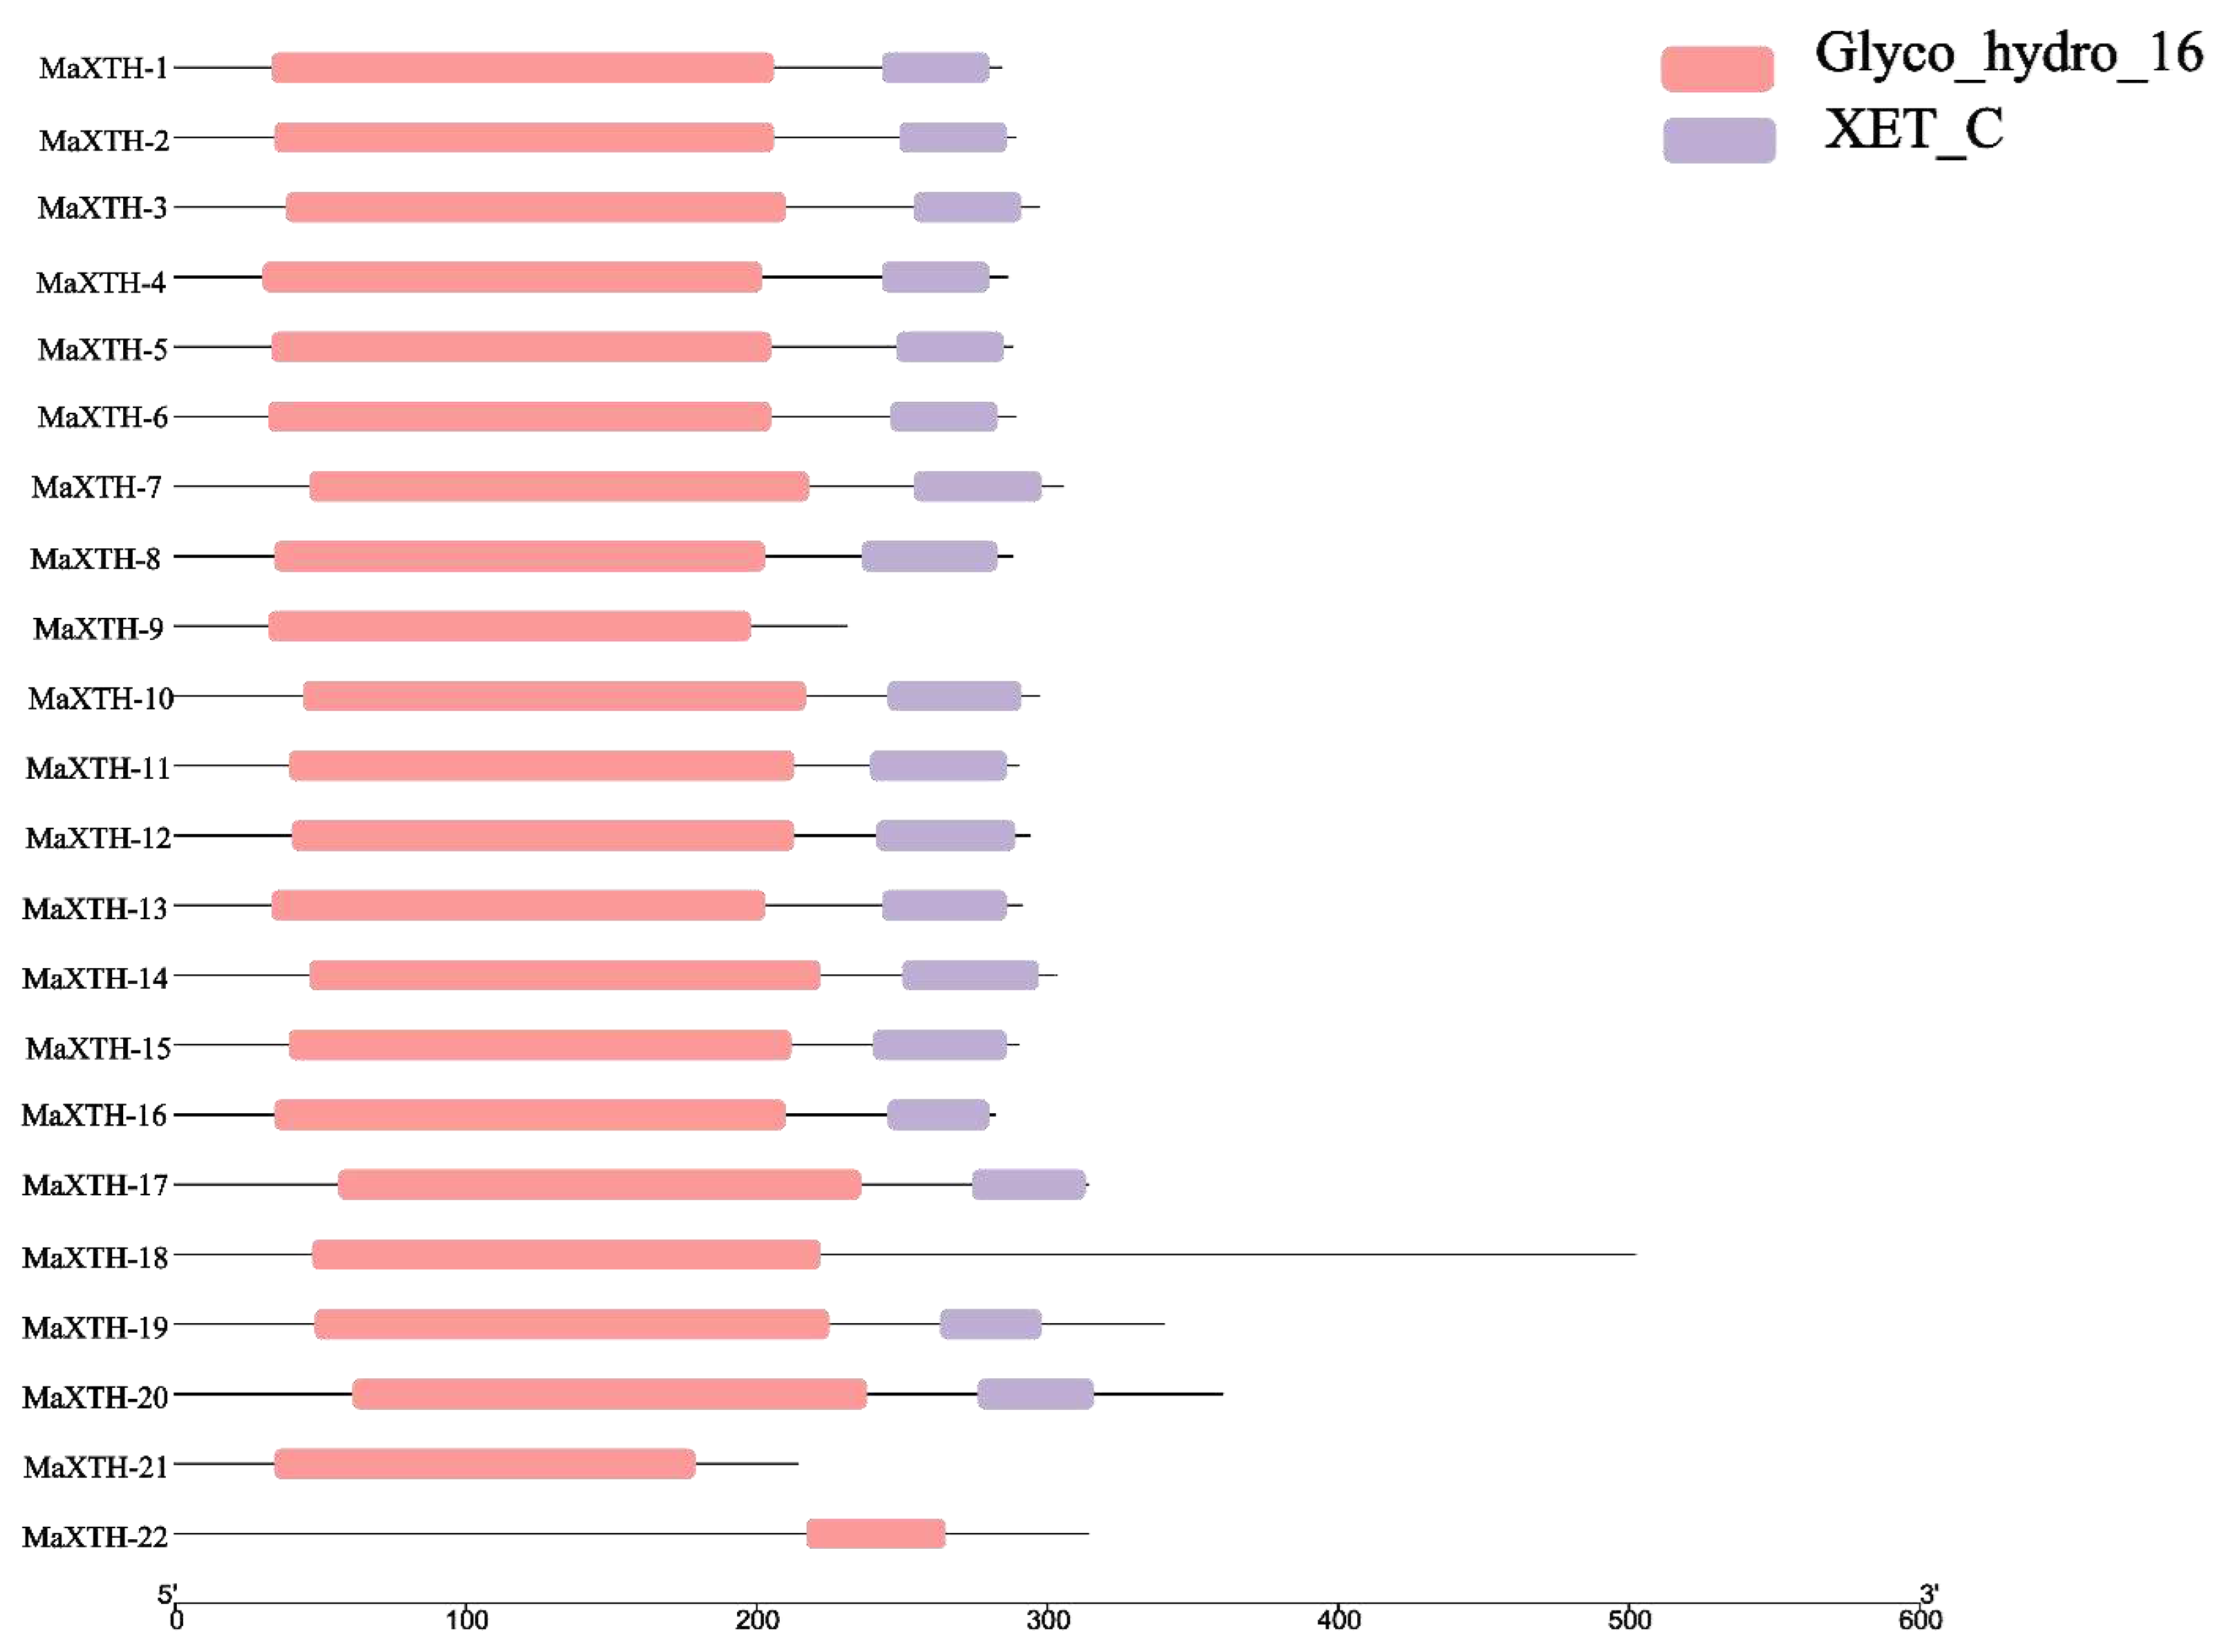
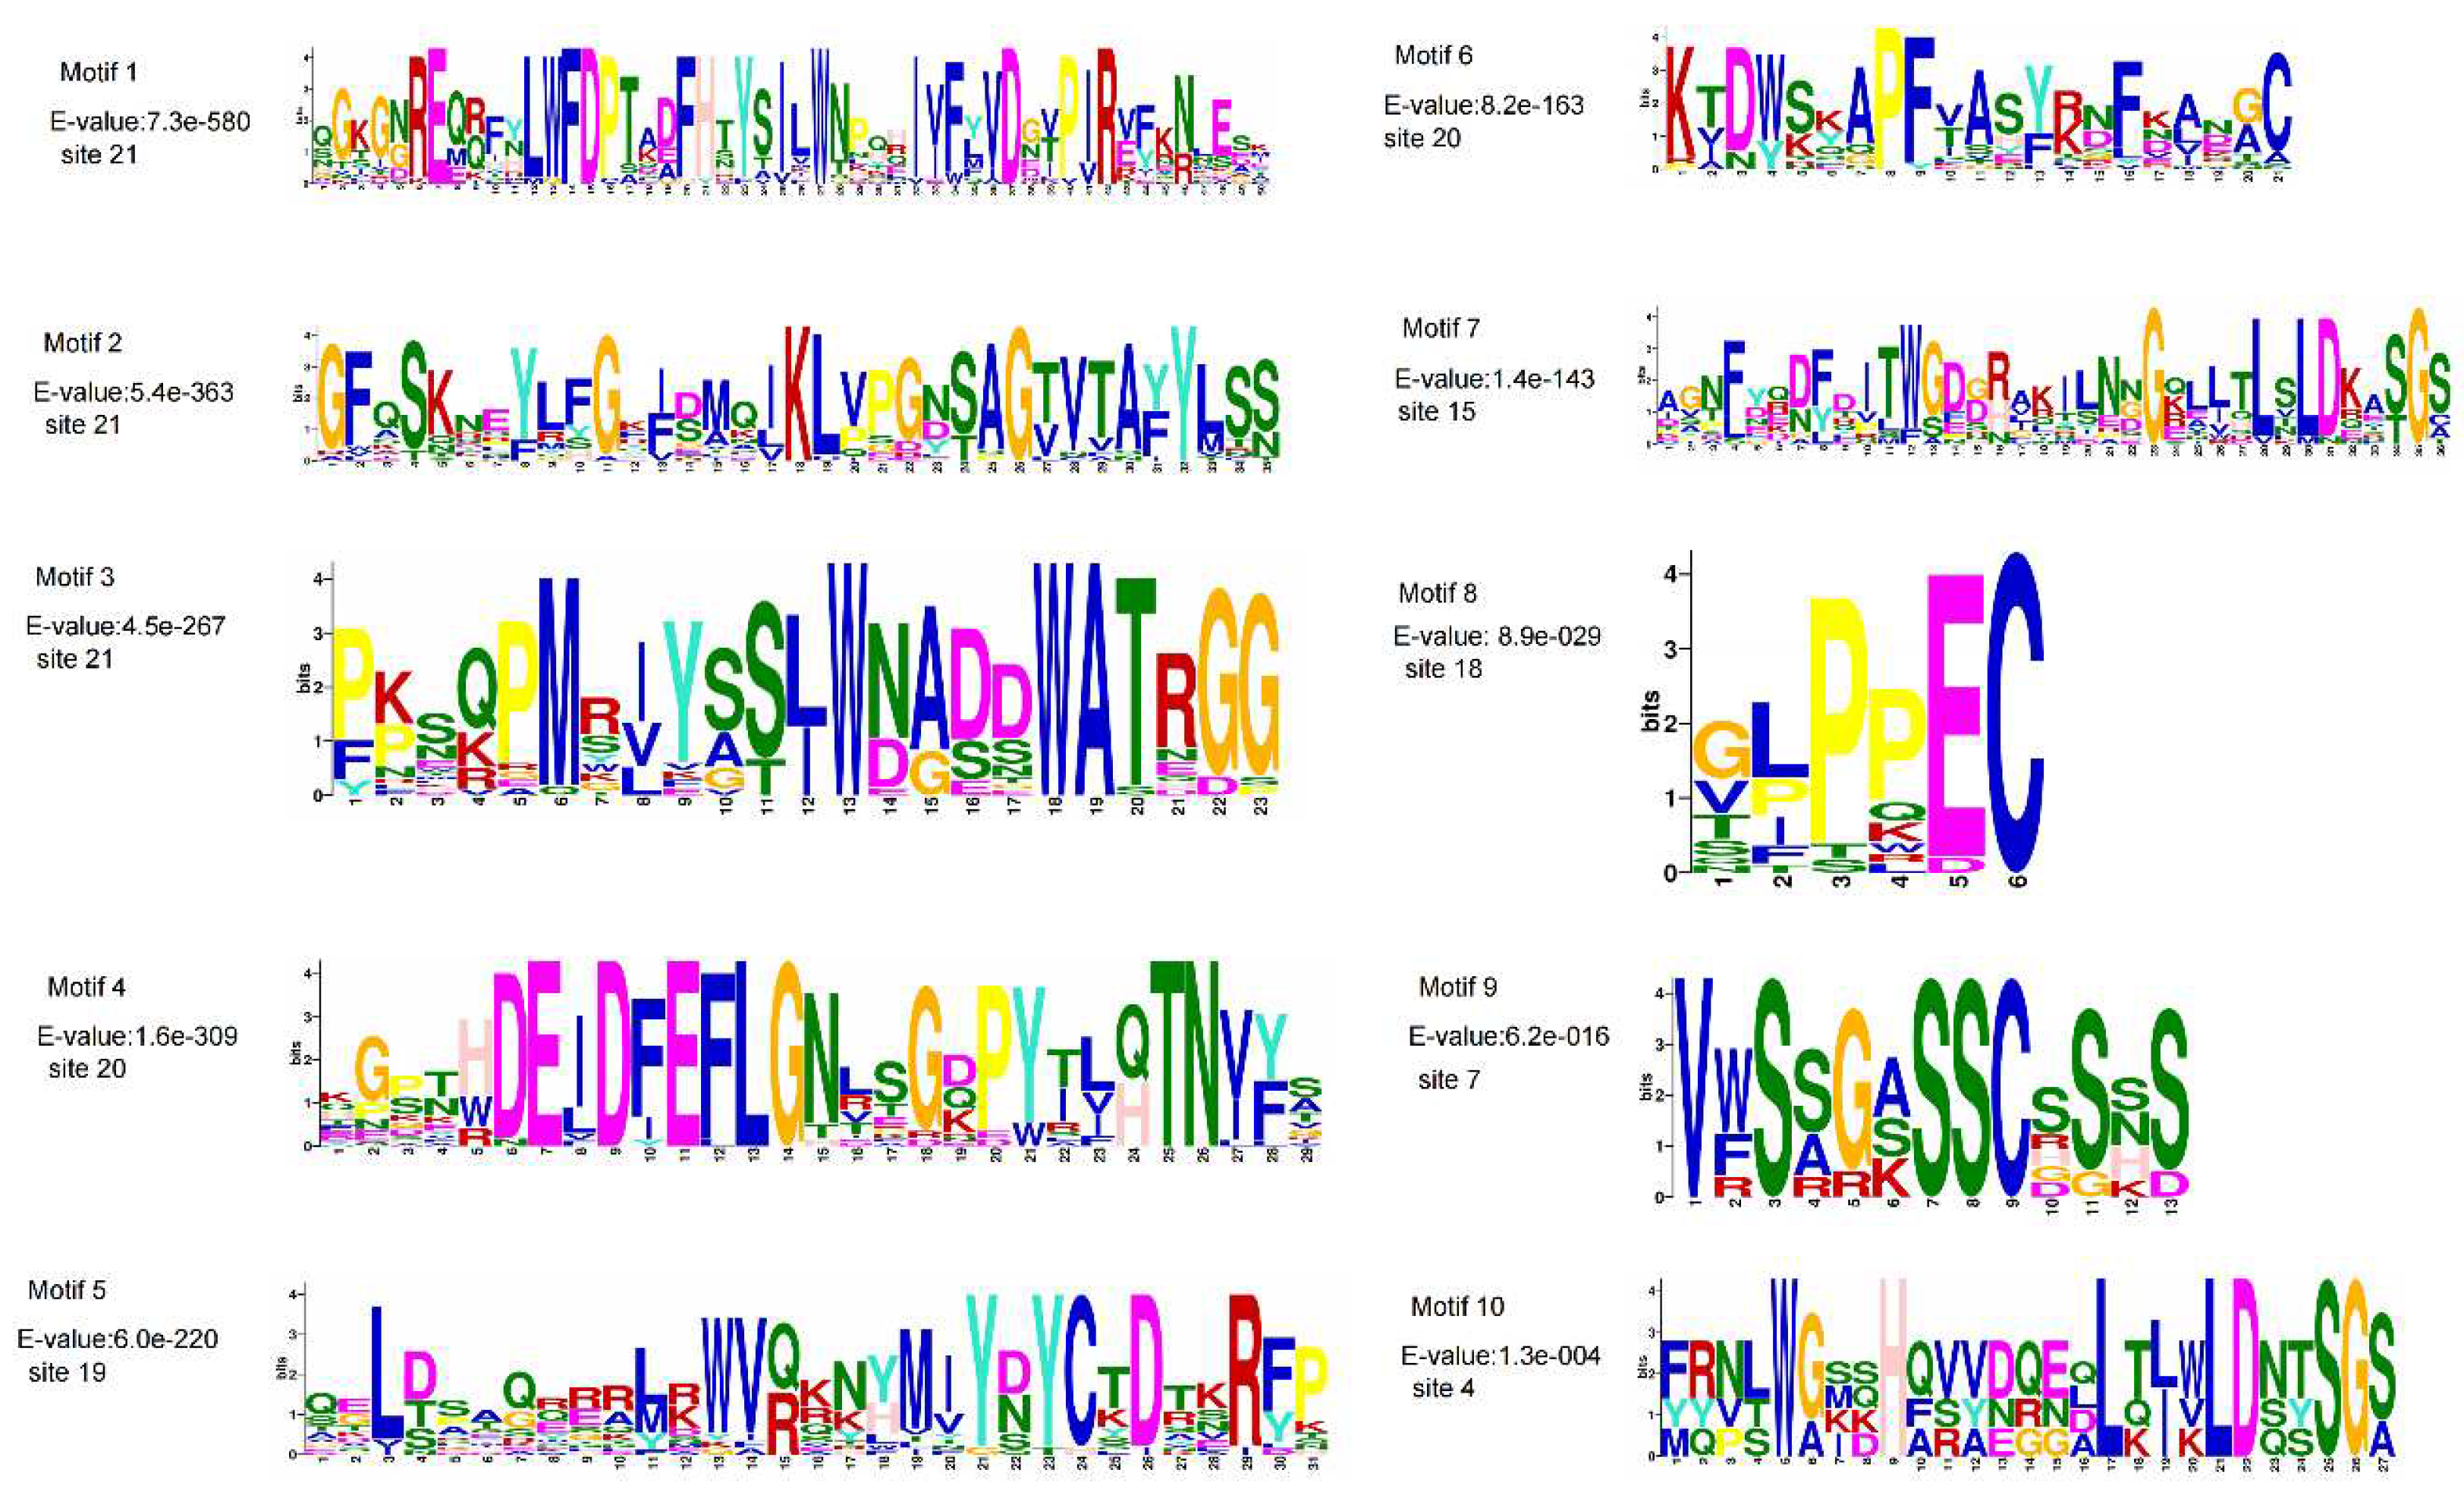
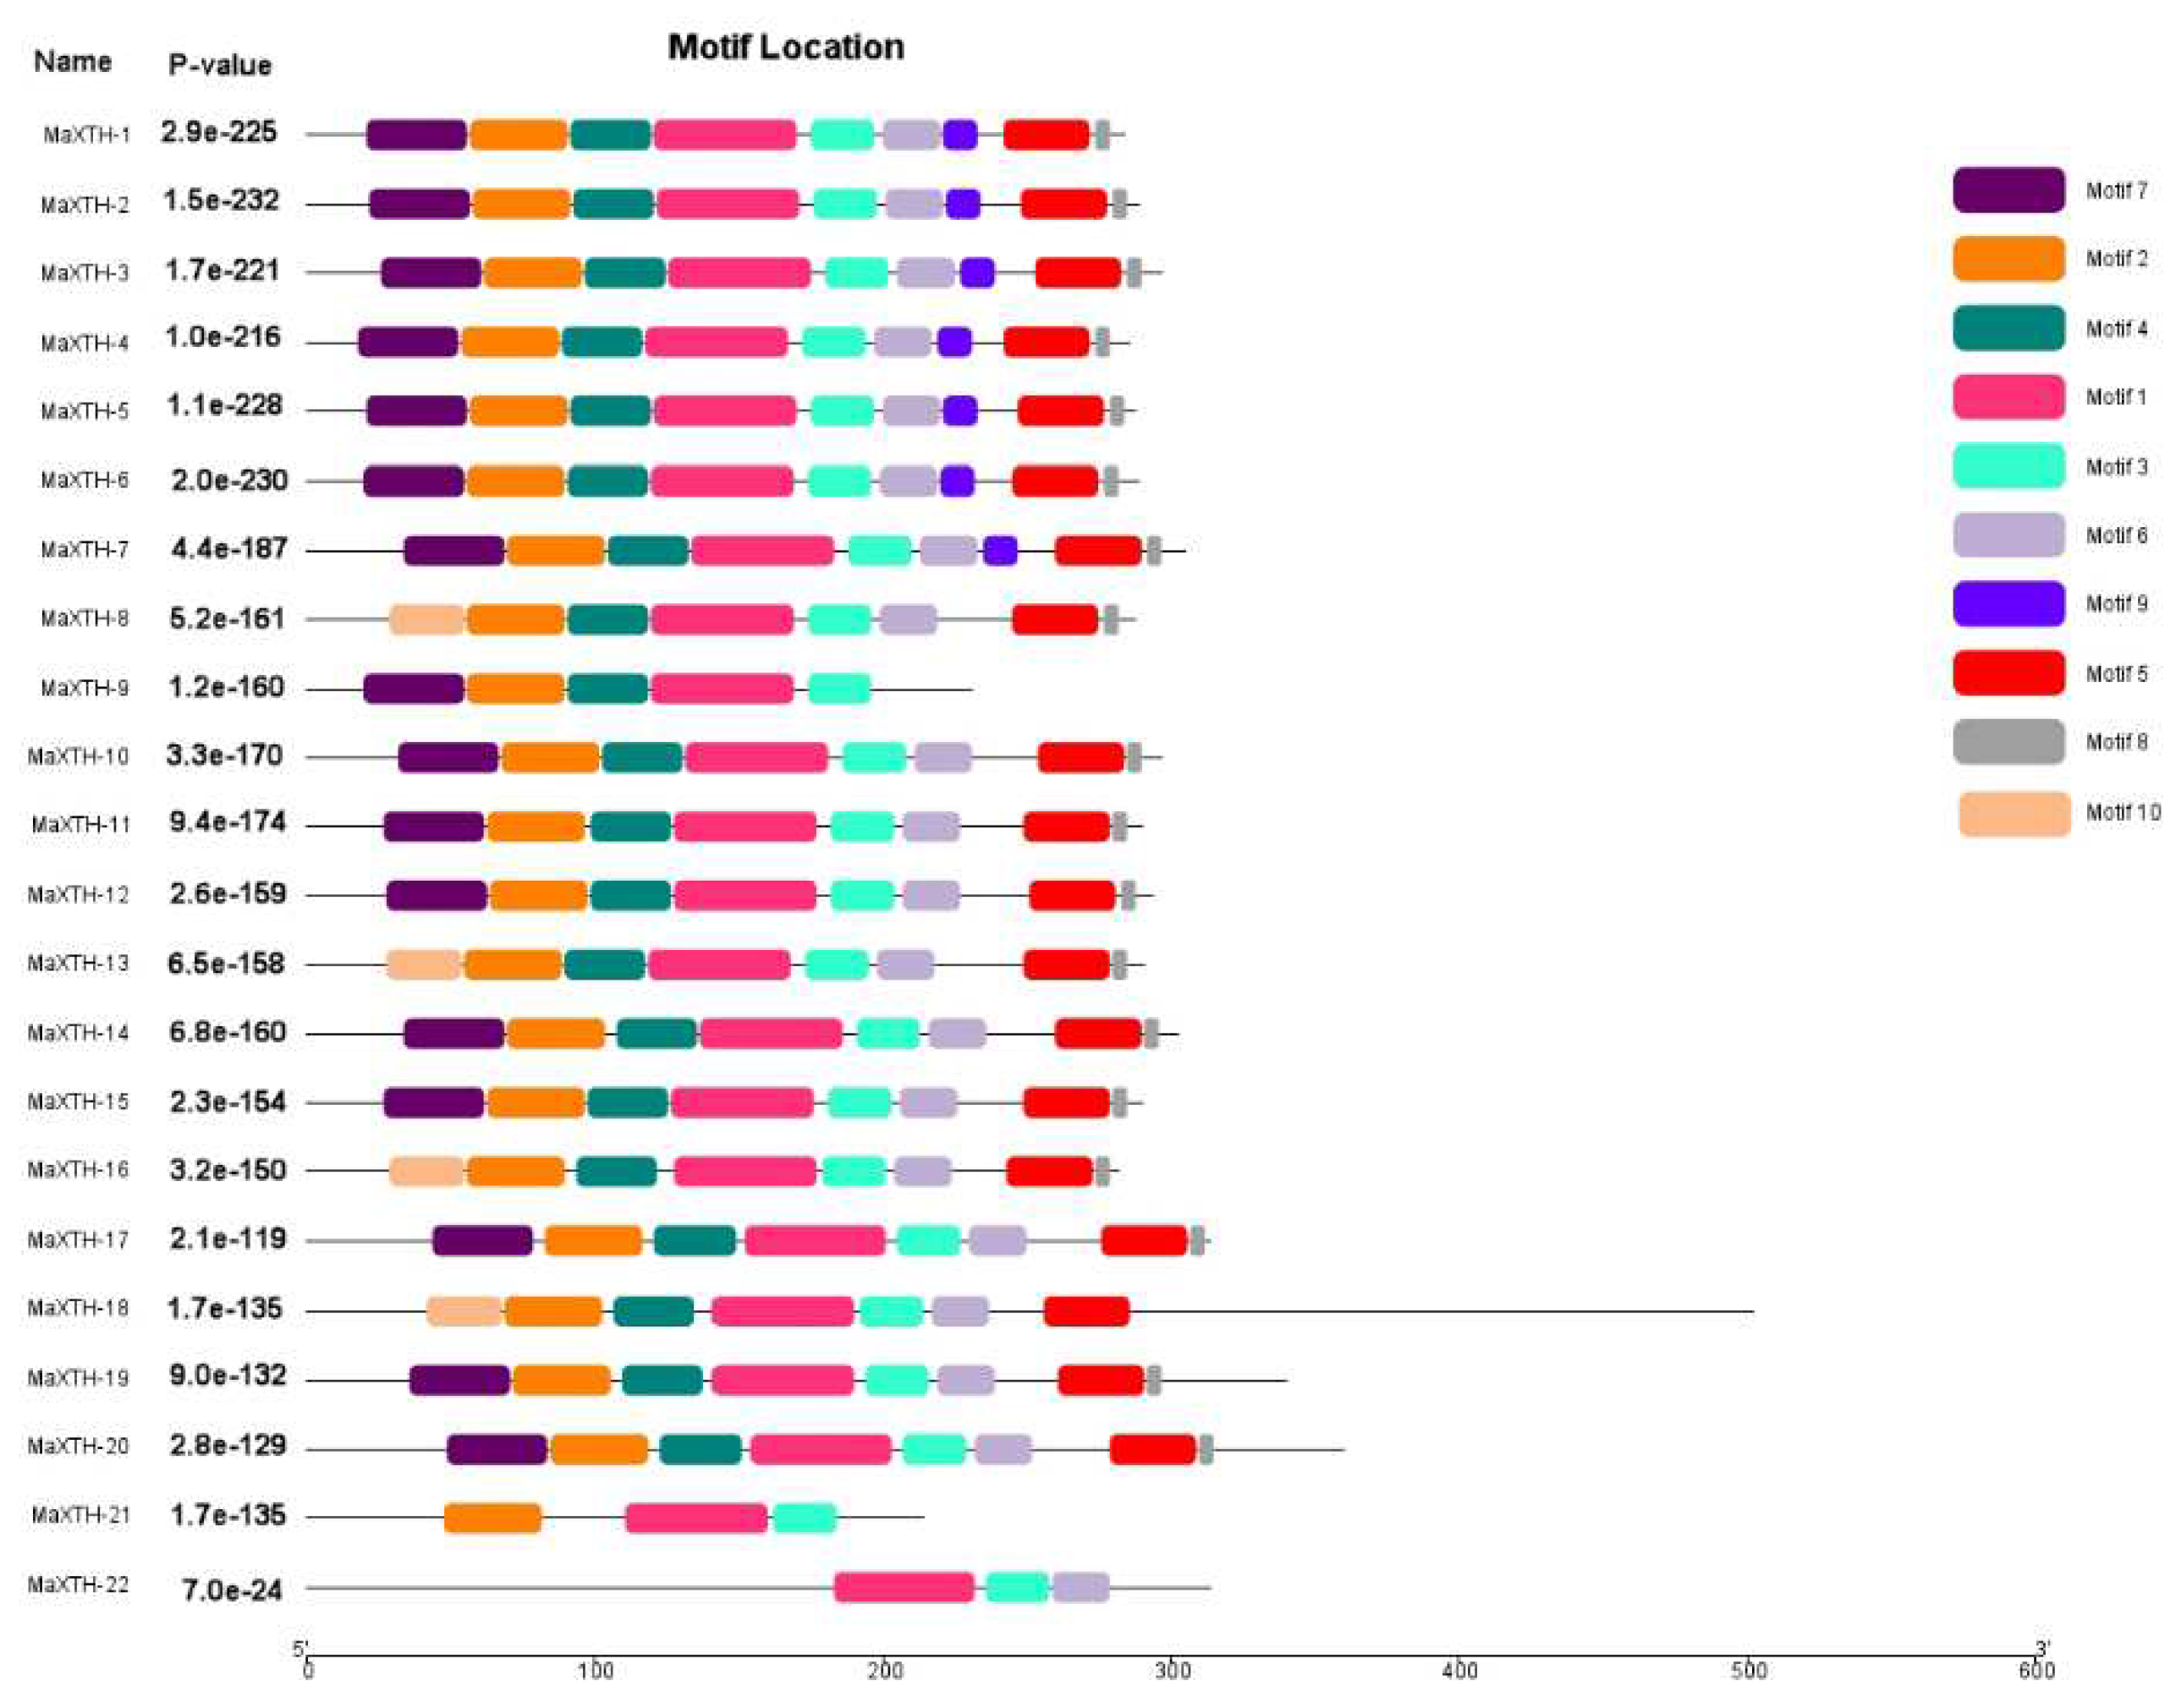
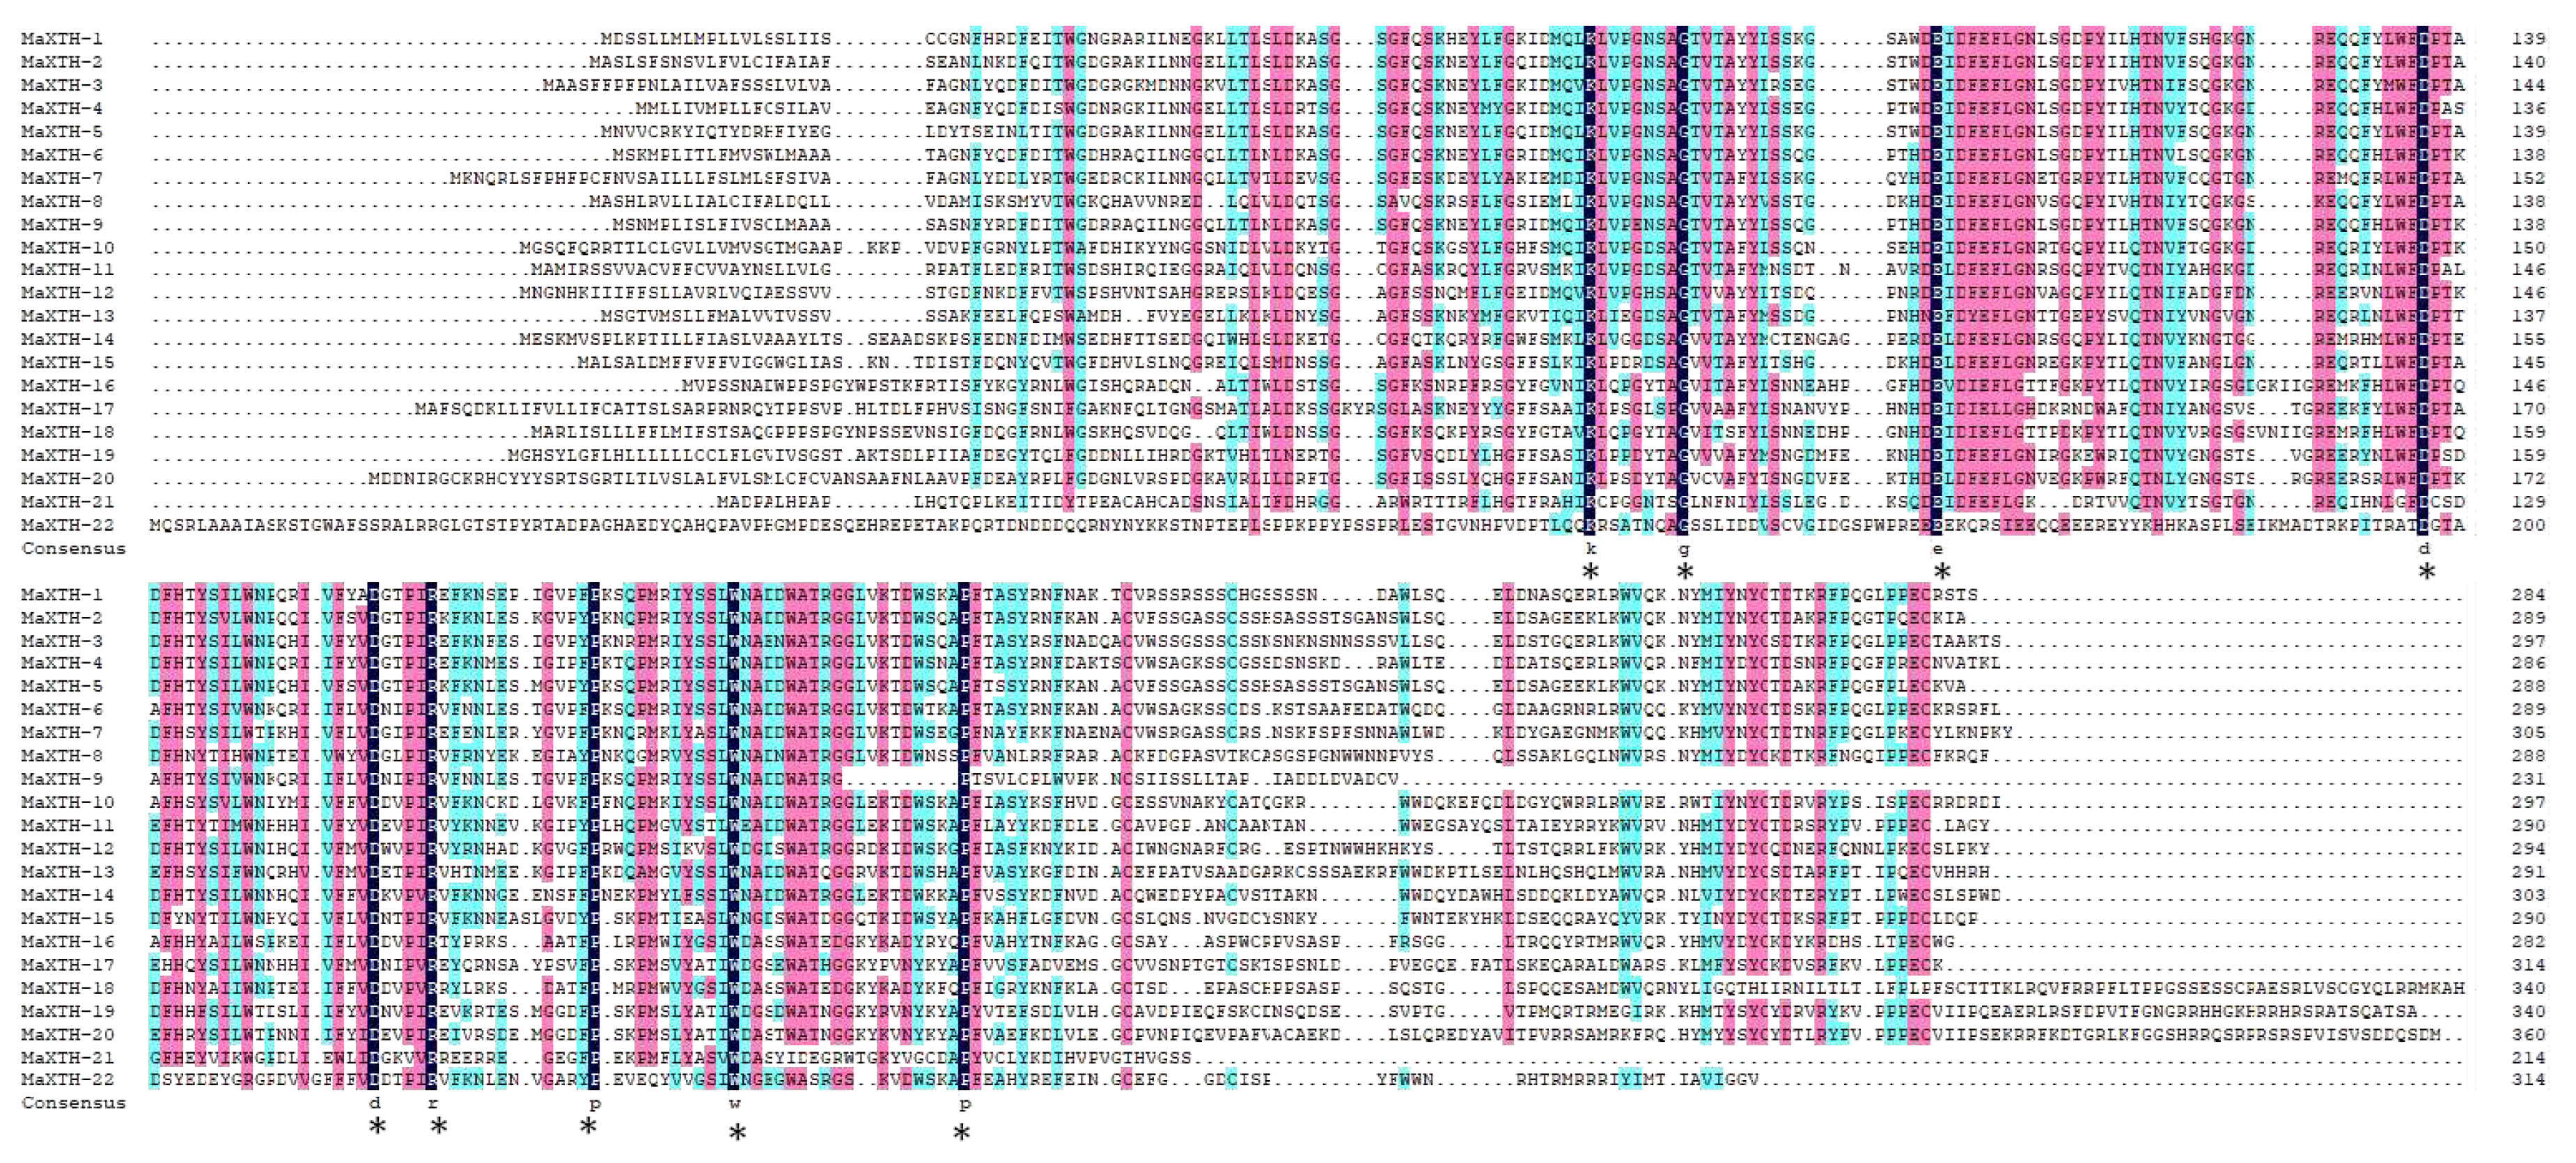
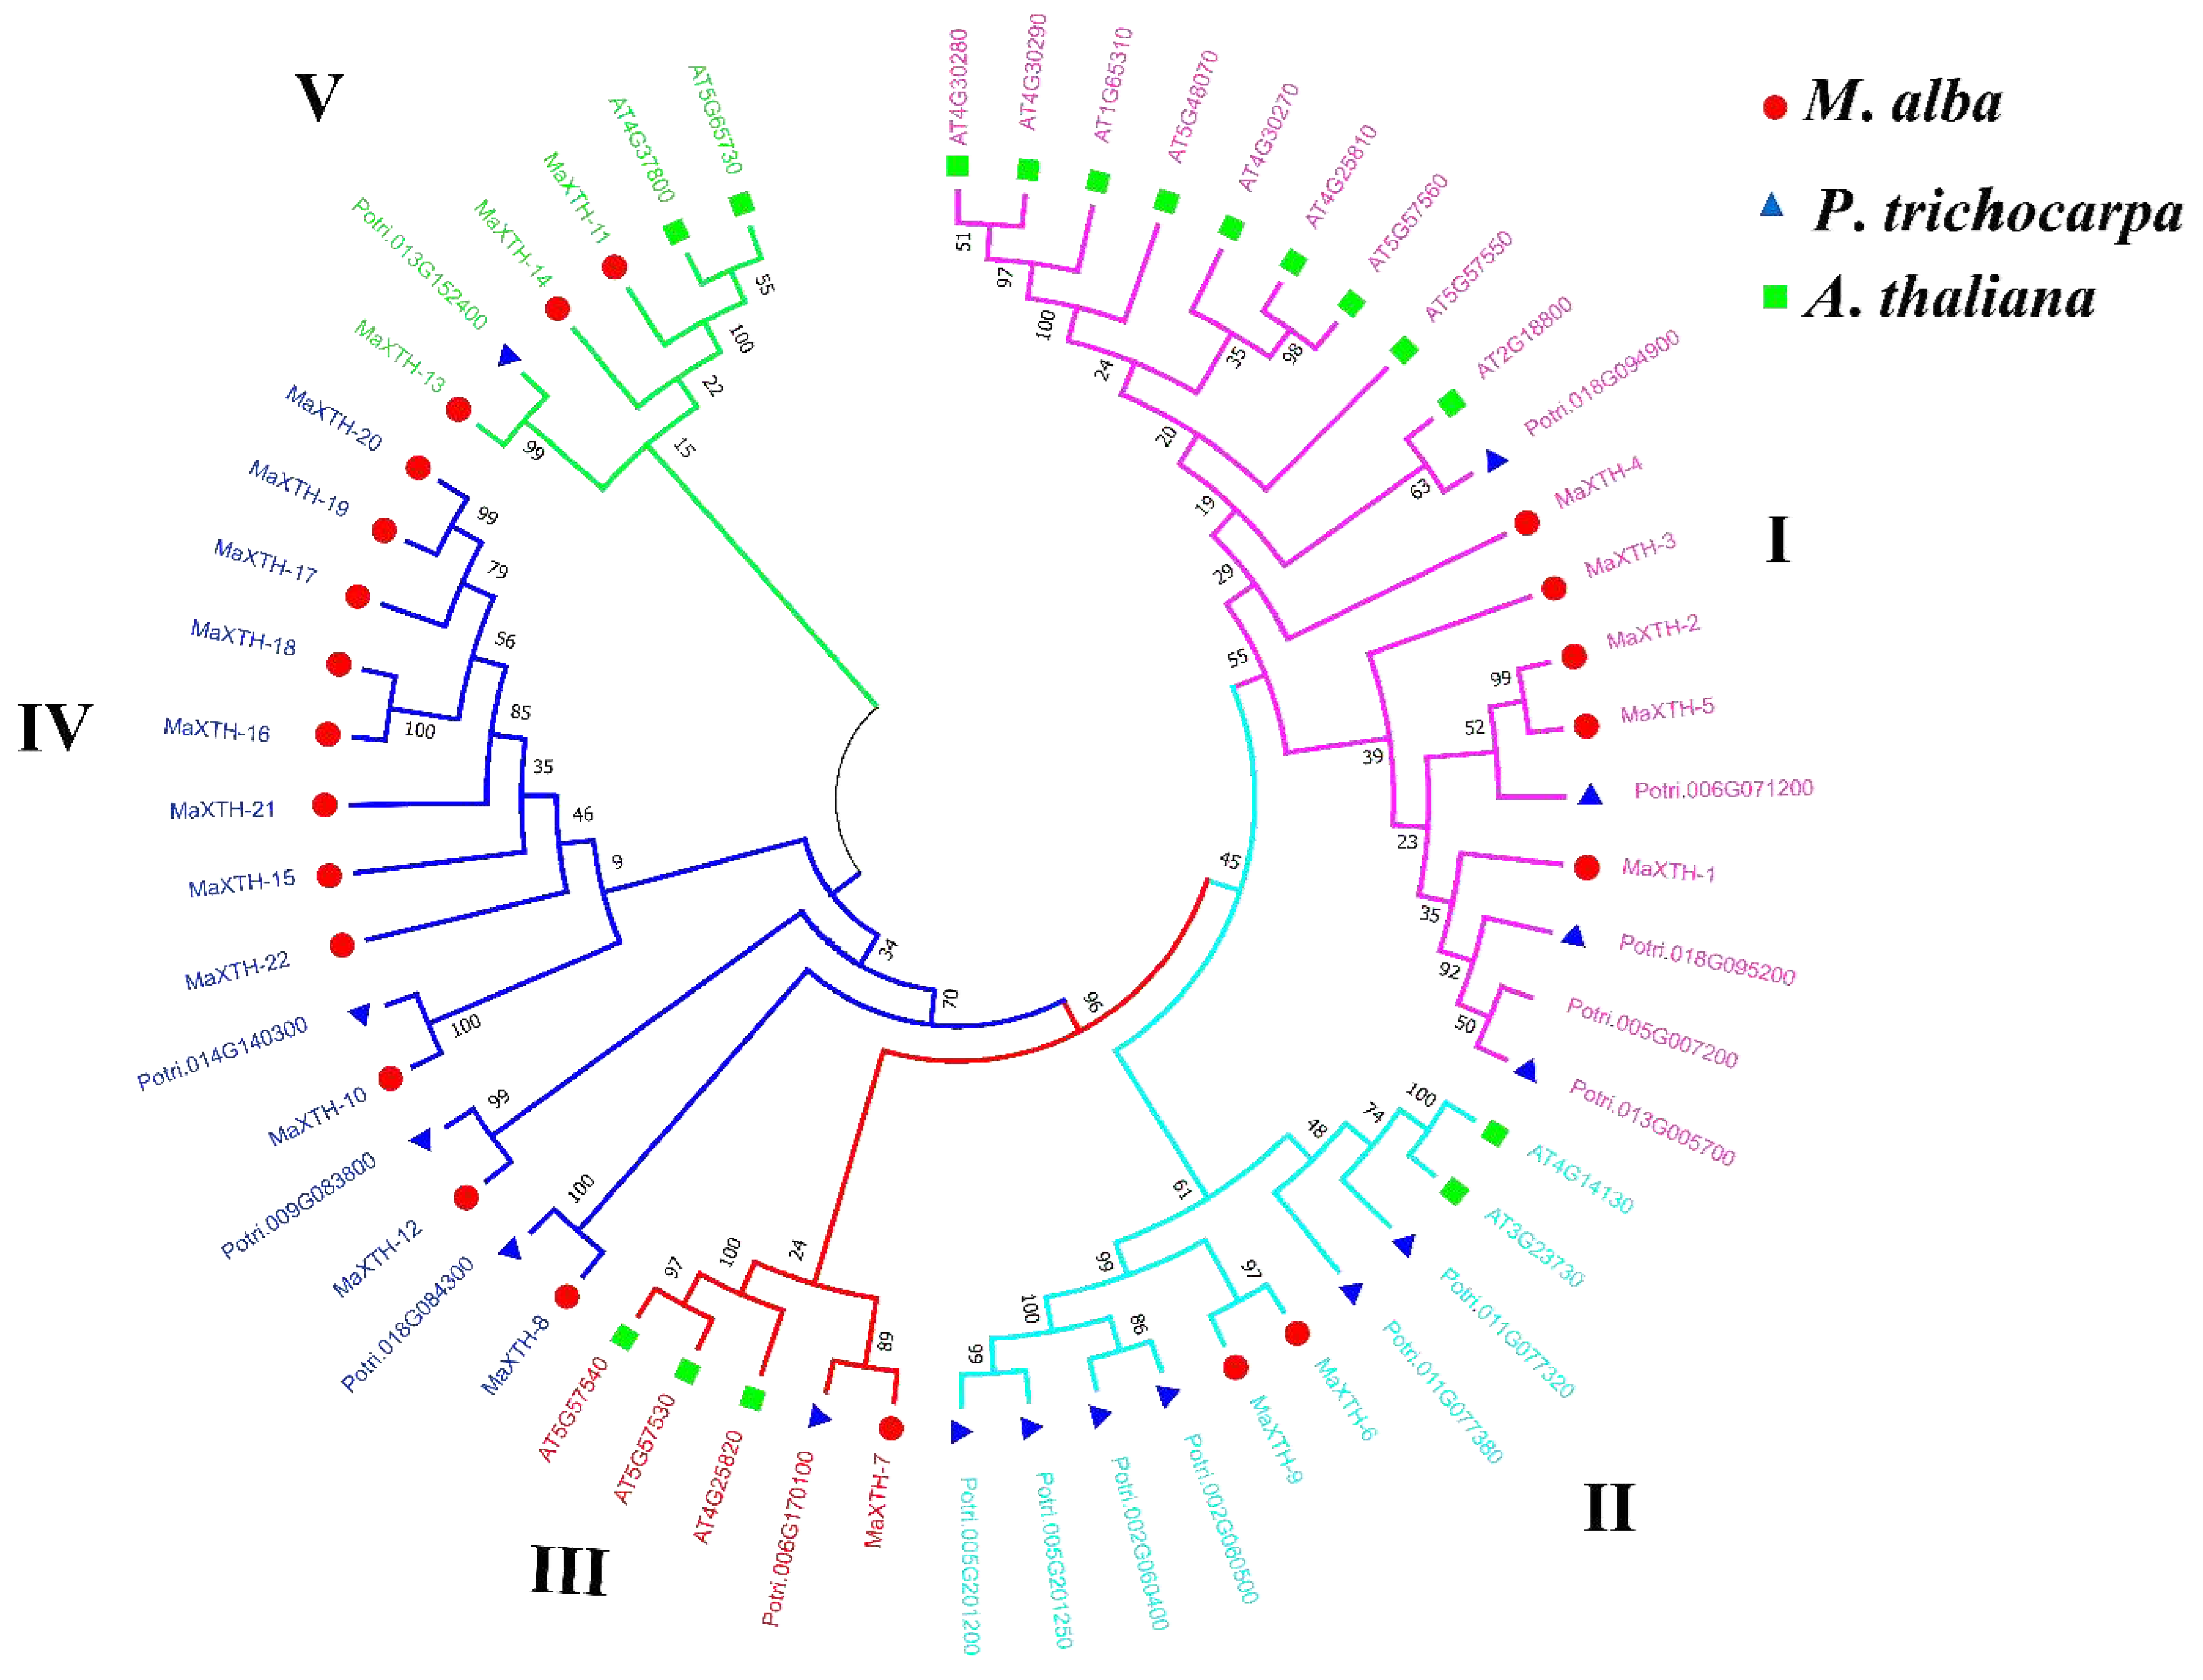
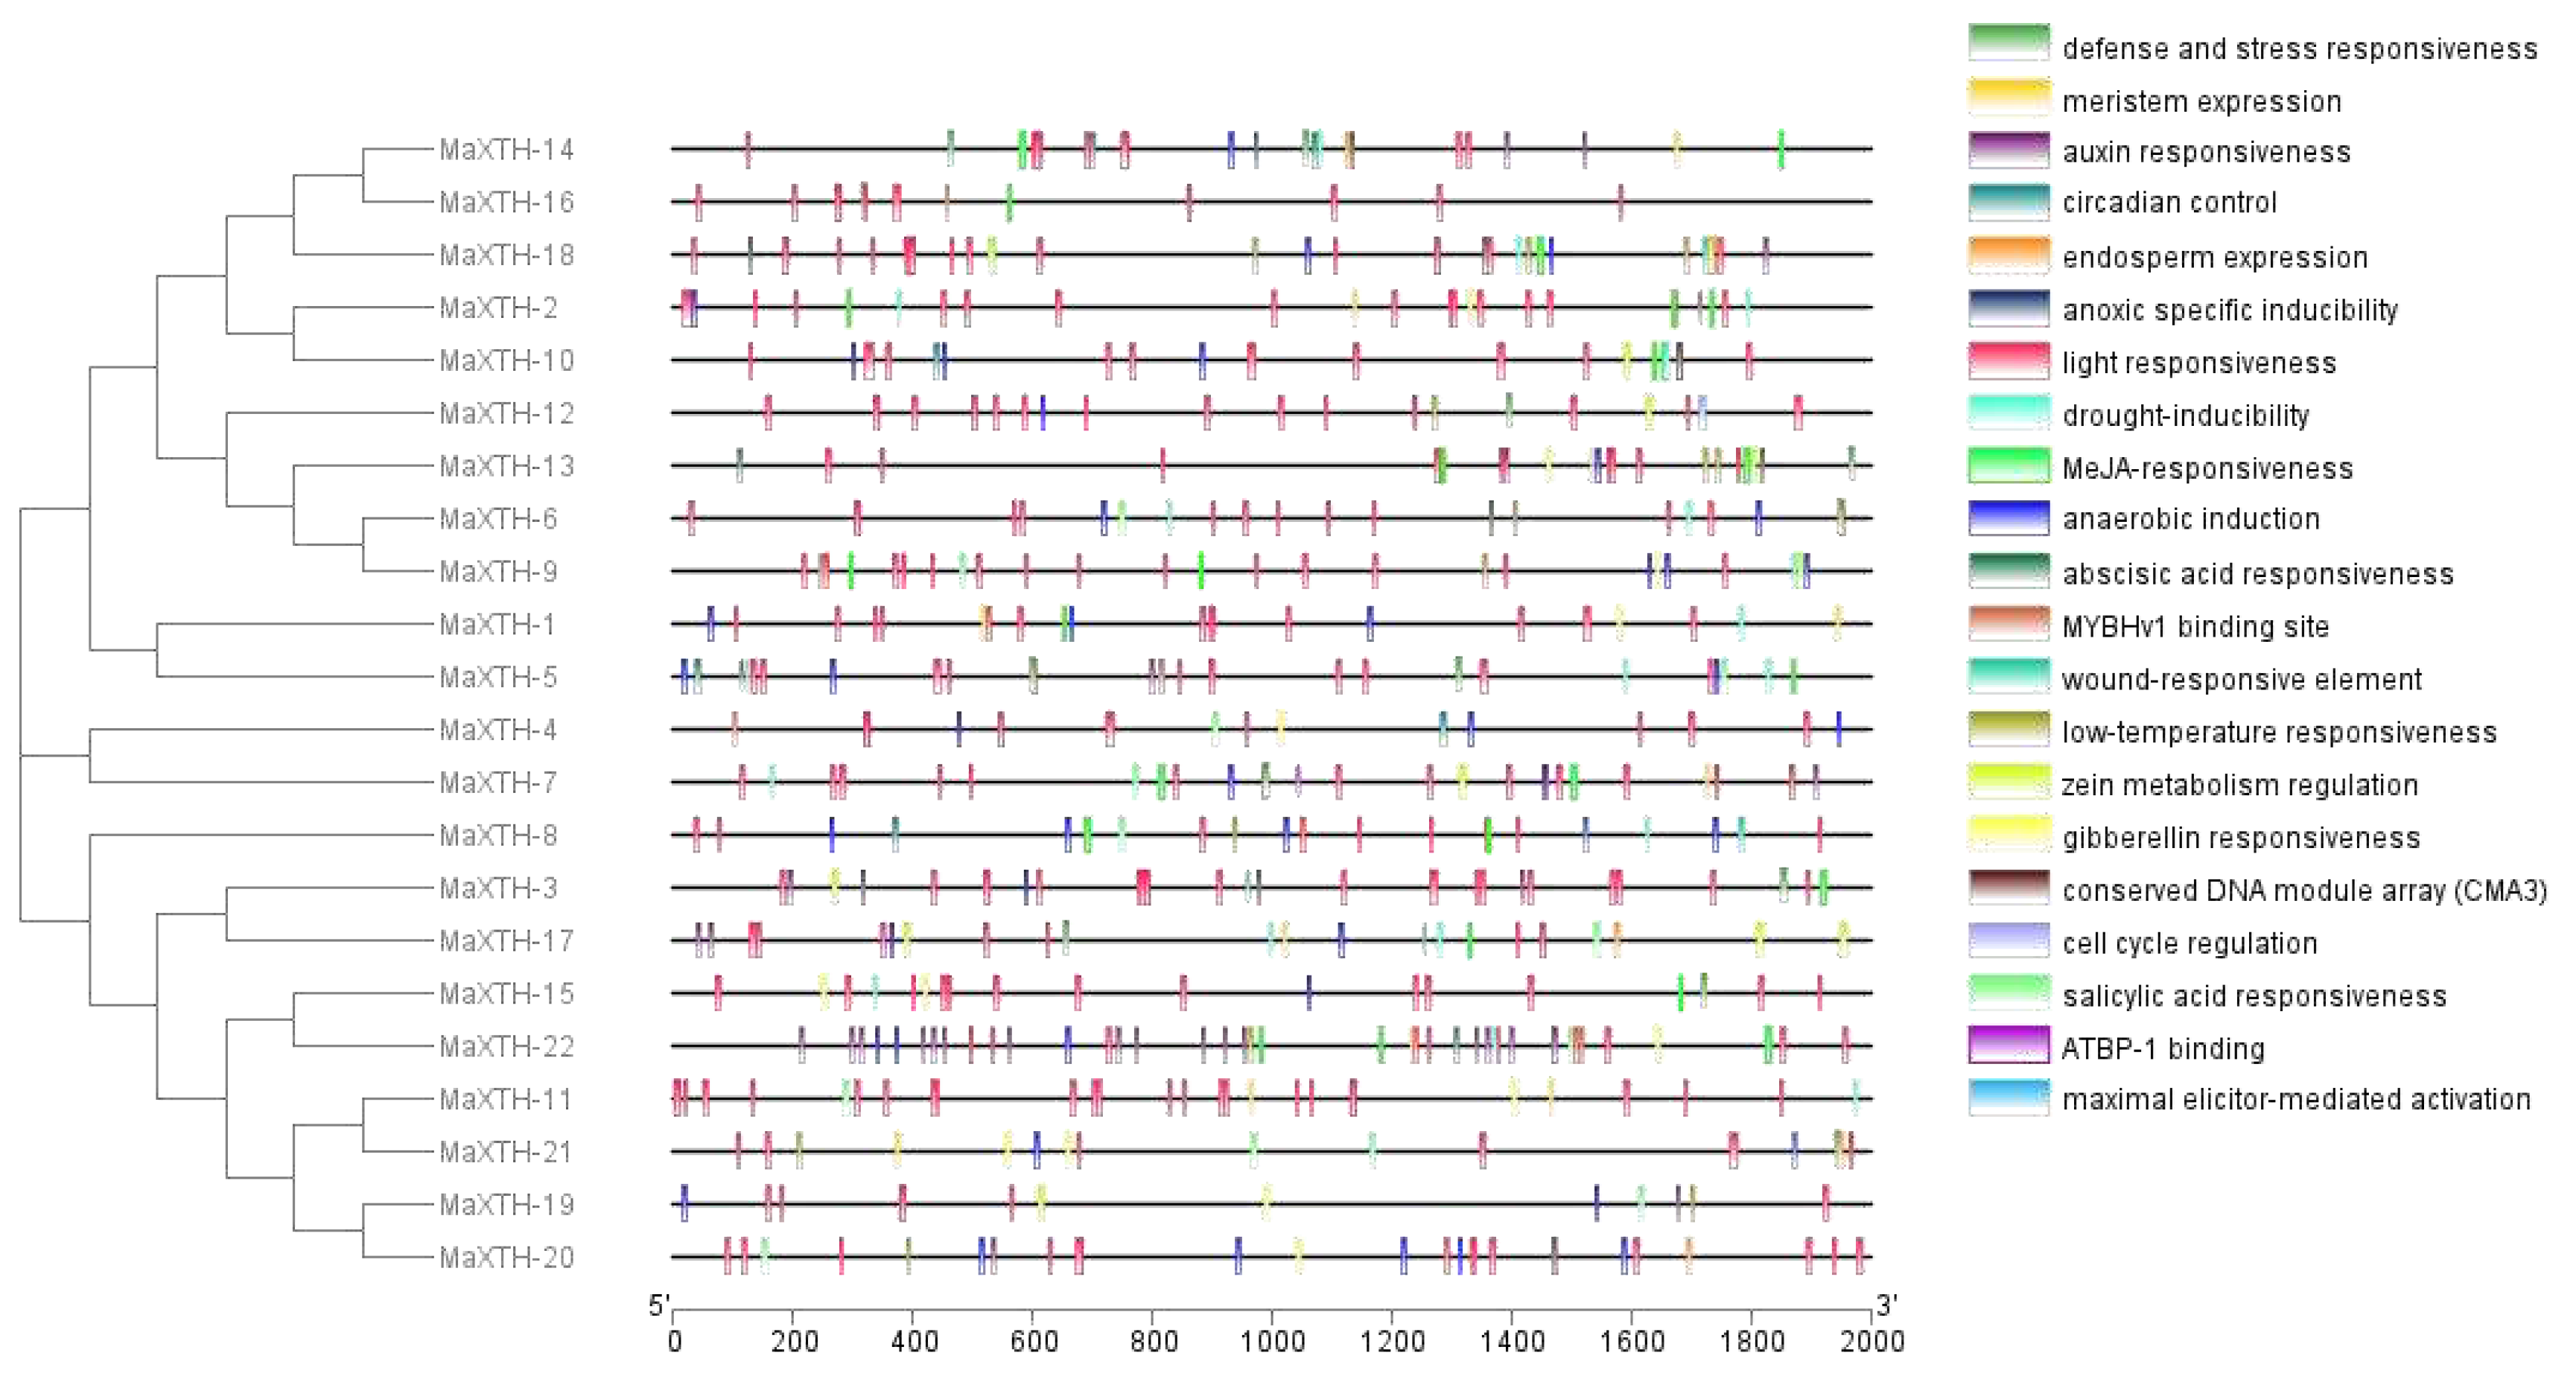

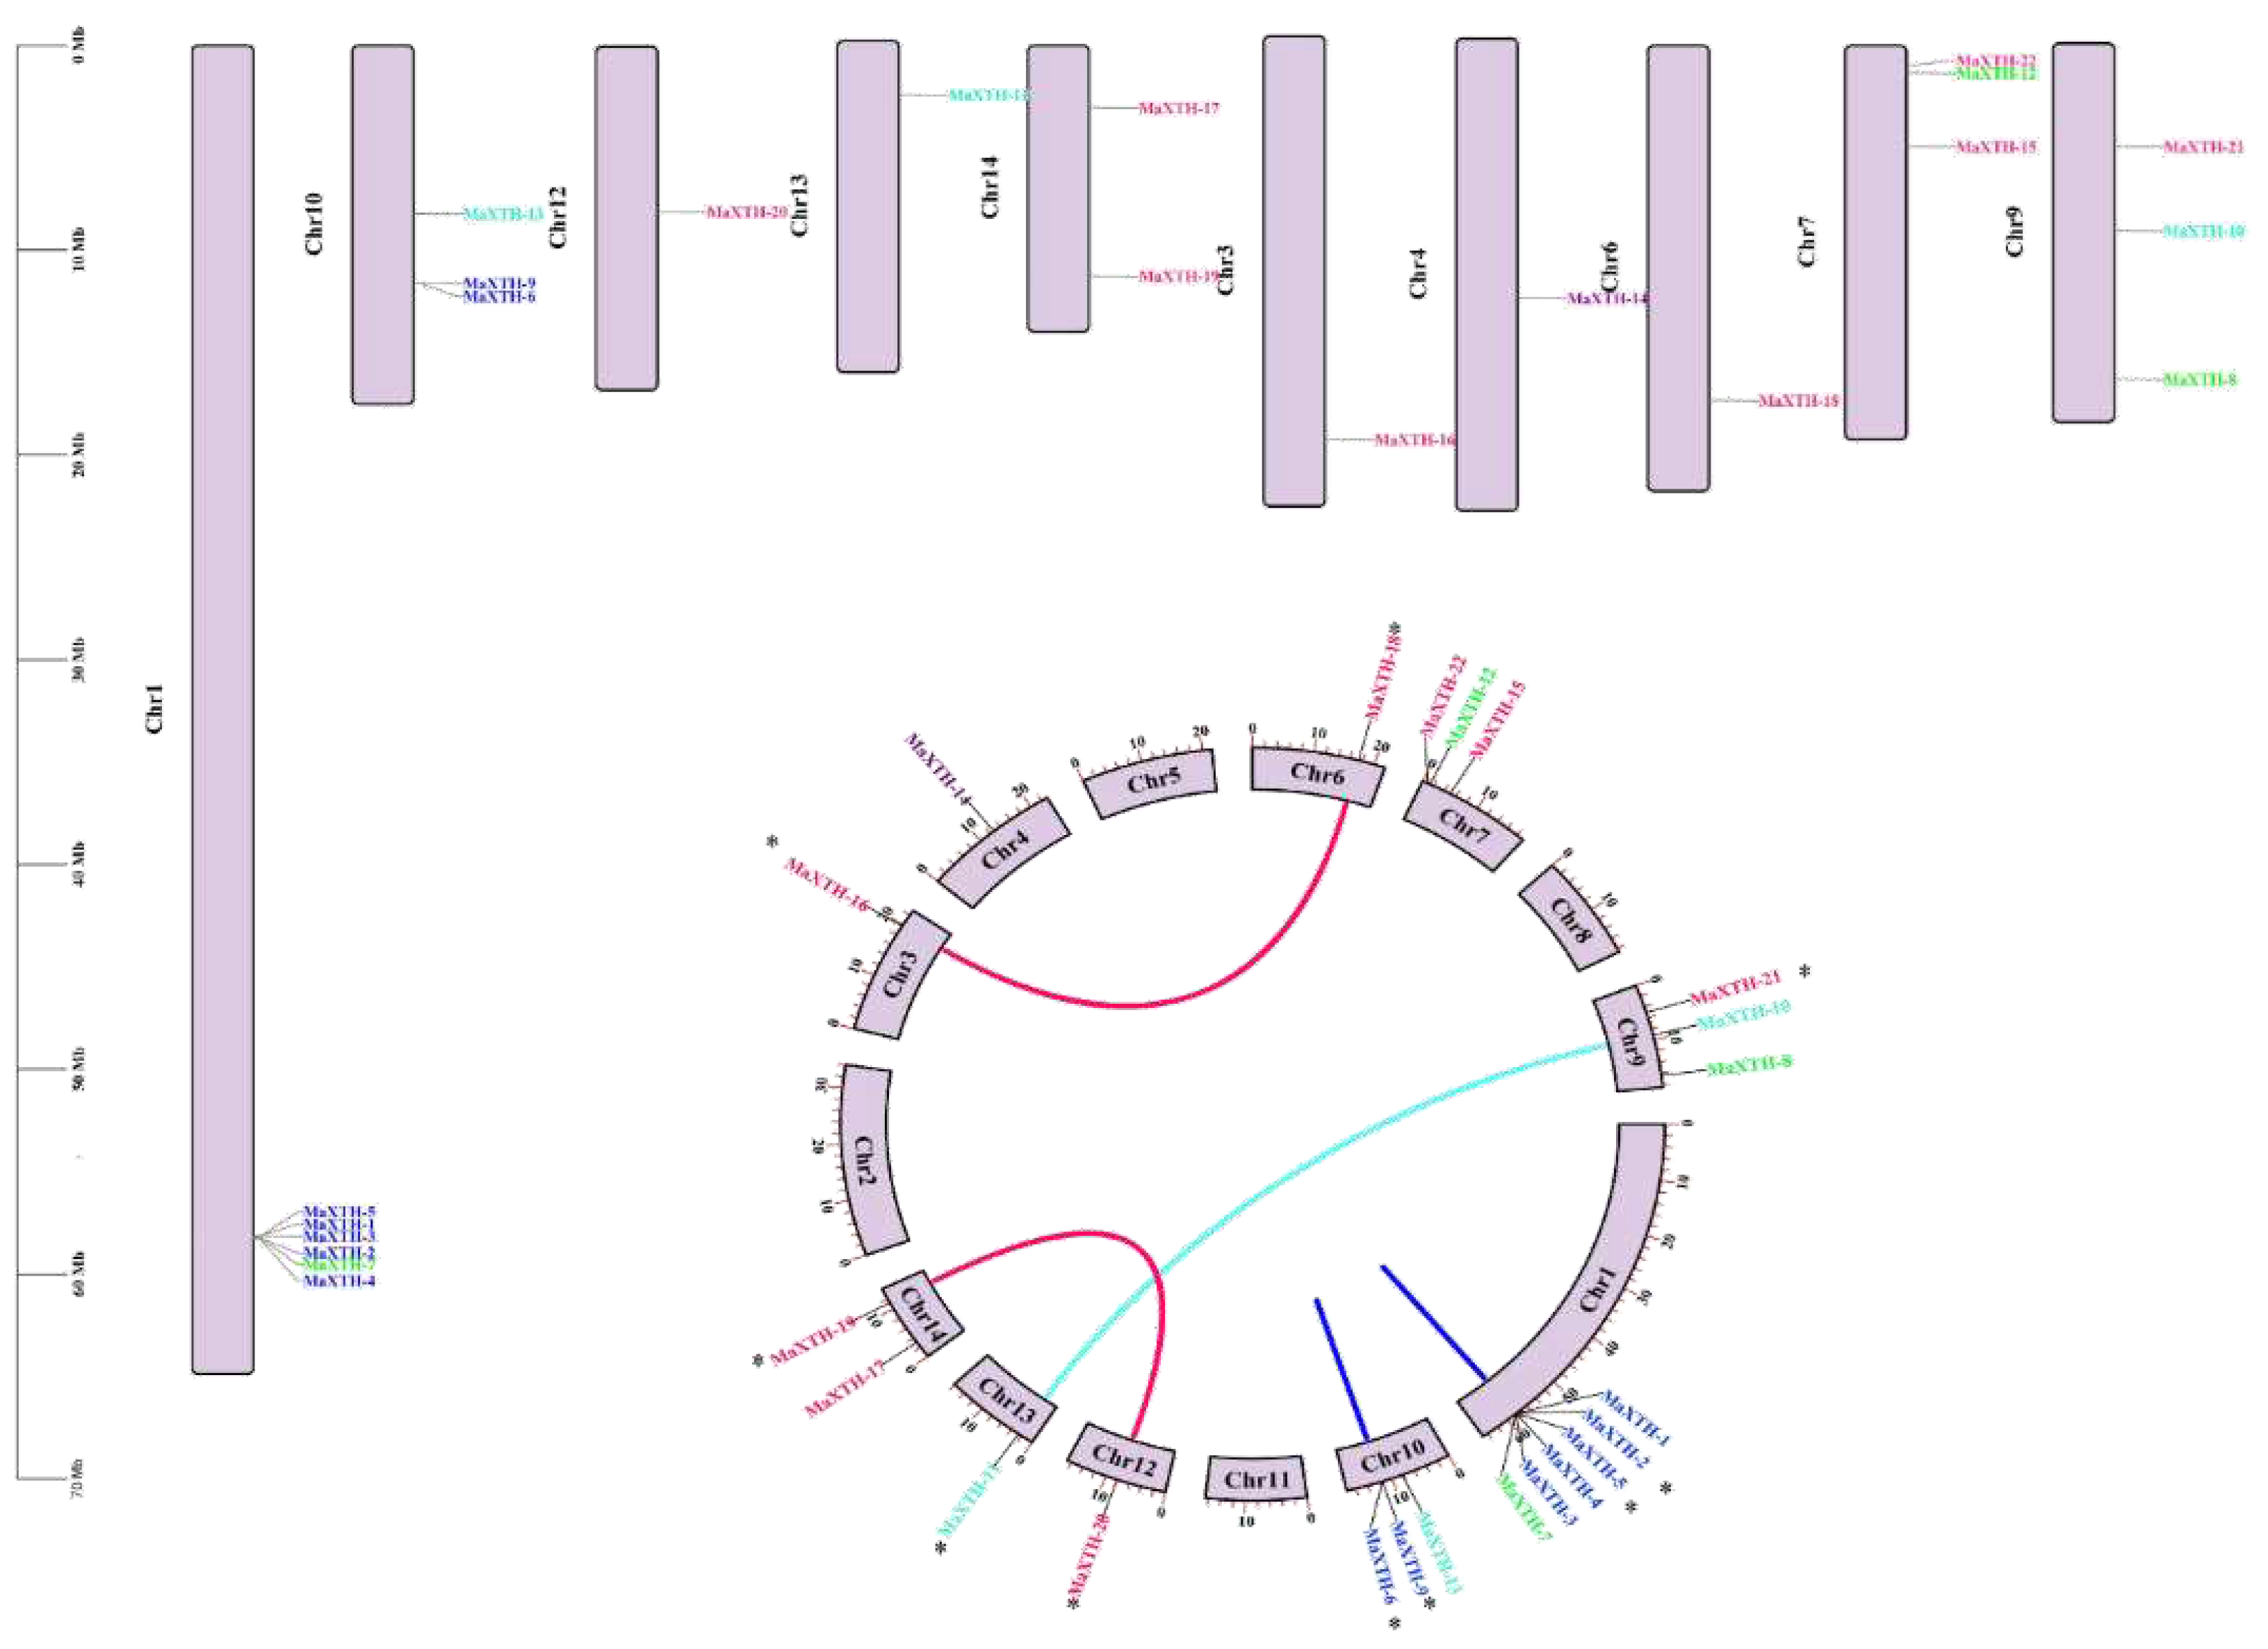
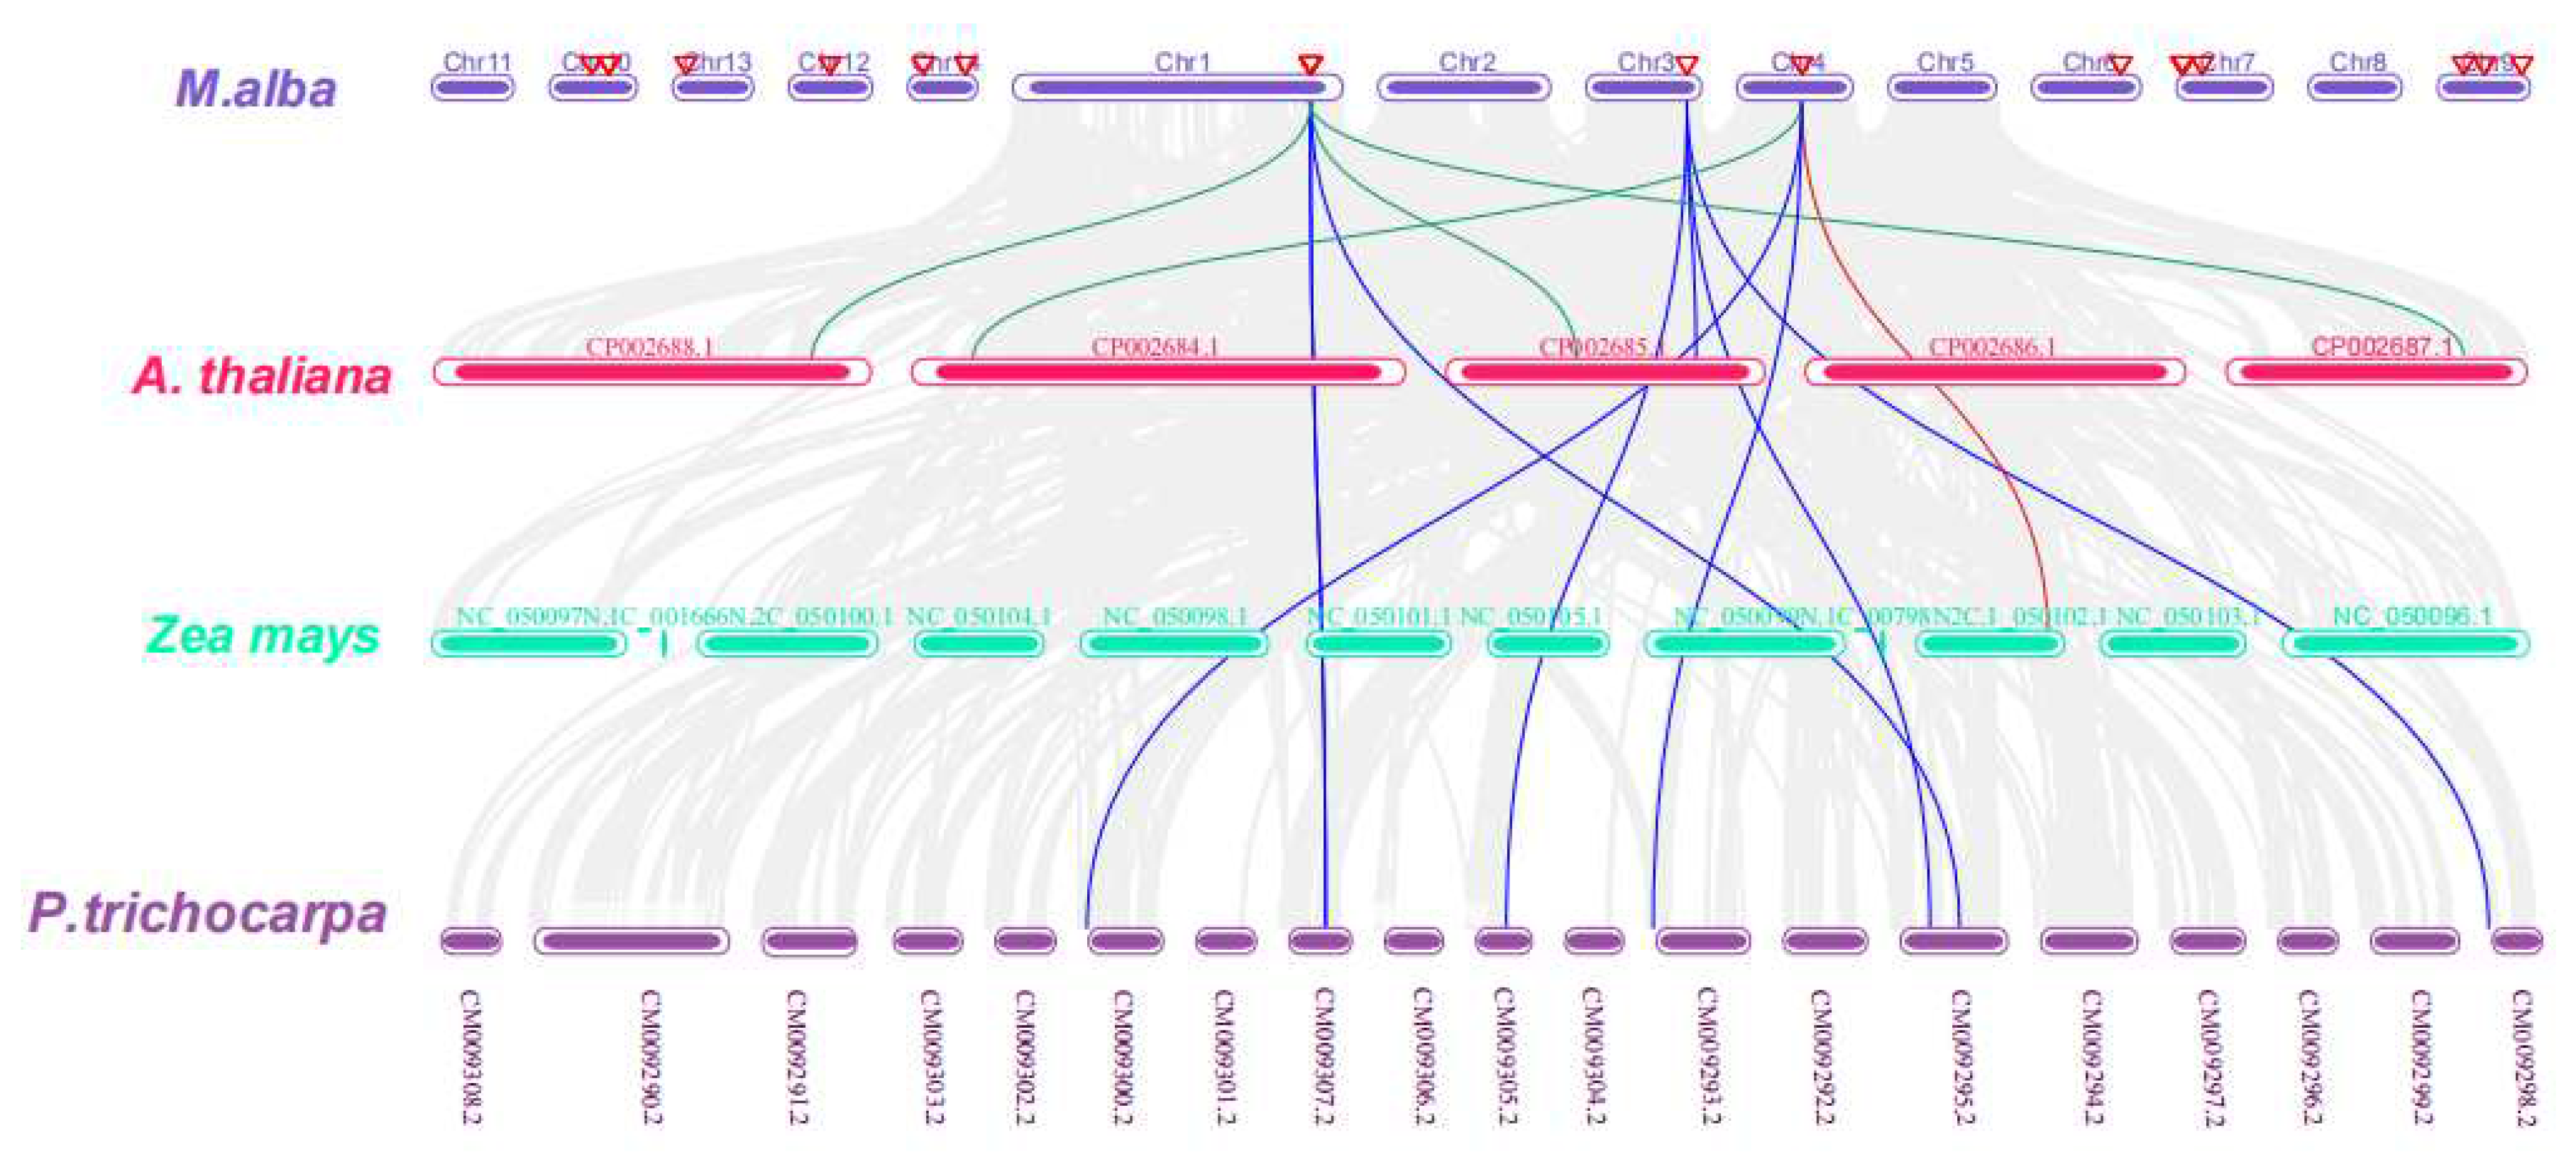
| Gene ID | Gene Name | Chromosome | CDS (bp) | Protein Length (aa) | Exons | pI | Protein Molecular Weight (kDa) |
Sublocalization |
| LOC21405692 | MaXTH-1 | 1 | 855 | 284 | 3 | 8.15 | 32.220 | Extracellular |
| LOC21405693 | MaXTH-2 | 1 | 870 | 289 | 3 | 6.31 | 32.211 | Extracellular |
| LOC21405698 | MaXTH-3 | 1 | 894 | 297 | 3 | 5.95 | 33.323 | Extracellular |
| LOC21405697 | MaXTH-4 | 1 | 861 | 286 | 3 | 4.96 | 32.655 | Extracellular |
| LOC21405696 | MaXTH-5 | 1 | 867 | 288 | 3 | 6.21 | 32.501 | Extracellular |
| LOC21404263 | MaXTH-6 | 10 | 870 | 289 | 3 | 8.94 | 32.771 | Extracellular |
| LOC21405699 | MaXTH-7 | 1 | 918 | 305 | 3 | 6.6 | 35.306 | Extracellular |
| LOC21387185 | MaXTH-8 | 9 | 867 | 288 | 4 | 8.96 | 32.893 | Extracellular |
| LOC21404262 | MaXTH-9 | 10 | 813 | 231 | 4 | 5.28 | 25.884 | Extracellular |
| LOC21404346 | MaXTH-10 | 13 | 894 | 297 | 5 | 8.87 | 34.529 | Extracellular |
| LOC21391157 | MaXTH-11 | 9 | 873 | 290 | 4 | 6.24 | 33.270 | Extracellular |
| LOC21387254 | MaXTH-12 | 7 | 885 | 294 | 4 | 8.56 | 34.306 | Extracellular |
| LOC21401284 | MaXTH-13 | 10 | 885 | 291 | 4 | 5.71 | 33.172 | Extracellular |
| LOC21396095 | MaXTH-14 | 4 | 912 | 303 | 4 | 4.72 | 35.292 | Extracellular |
| LOC21390452 | MaXTH-15 | 7 | 873 | 290 | 4 | 5.09 | 33.165 | Extracellular |
| LOC21405370 | MaXTH-16 | 3 | 849 | 282 | 4 | 9.34 | 32.603 | Extracellular, Mitochondrial |
| LOC21410403 | MaXTH-17 | 14 | 945 | 314 | 4 | 7.67 | 35.265 | Extracellular, Vacuole |
| LOC21403517 | MaXTH-18 | 6 | 1,509 | 502 | 4 | 9.74 | 56.843 | Plasma membrane |
| LOC21402237 | MaXTH-19 | 14 | 1,023 | 340 | 4 | 6.27 | 38.748 | Extracellular |
| LOC21391267 | MaXTH-20 | 12 | 1,083 | 360 | 4 | 8.73 | 41.304 | Extracellular |
| LOC21407360 | MaXTH-21 | 9 | 645 | 214 | 1 | 5.52 | 24.071 | Cytoplasmic, Extracellular |
| LOC21390860 | MaXTH-22 | 7 | 945 | 314 | 3 | 5.68 | 35.599 | Cytoplasmic, Nuclear |
Disclaimer/Publisher’s Note: The statements, opinions and data contained in all publications are solely those of the individual author(s) and contributor(s) and not of MDPI and/or the editor(s). MDPI and/or the editor(s) disclaim responsibility for any injury to people or property resulting from any ideas, methods, instructions or products referred to in the content. |
© 2023 by the authors. Licensee MDPI, Basel, Switzerland. This article is an open access article distributed under the terms and conditions of the Creative Commons Attribution (CC BY) license (http://creativecommons.org/licenses/by/4.0/).


