Preprint
Article

Tourism Itinerary Recommendation using Vehicle Routing Problem Time Windows Based on Shortest Path Method and Analytics Hierarchy Process

Altmetrics

Downloads

145

Views

68

Comments

0

A peer-reviewed article of this preprint also exists.

Submitted:

09 December 2023

Posted:

12 December 2023

You are already at the latest version

Alerts
Abstract
Bandung and Lembang are the cities that are chosen by many tourists (local and foreign) as their destinations. Geographically, these cities are placed side-by-side and each city has its own characteristics. As in Bandung, there are many hotels and culinary spots, meanwhile, in Lembang, there are many scenery tourism spots. Tourists usually have limited time to visit all the destinations on holiday, which makes them choose several tourist destinations to visit. In this paper, the tourism itinerary recommendation system is proposed by calculating the most optimal route between destinations and approaching the Vehicle Routing Problem with Time Windows. The optimal route is defined by using Dijkstra the shortest path algorithm by using the collaboration between the road information (road length, traffic condition, travel time, and weather condition) and criteria weight that is determined using the Analytics Hierarchy Process as the graph weights. According to the simulation results, the criteria weights are 6.9%, 62.7%, 18.6%, and 11.9% for Route Length, Traffic Condition, Travel Time, and Weather Condition respectively. Moreover, the optimal number of tourism itinerary plans for the tourist in this research is 4 destinations. As the usage of computational resources, it takes 31.8% of CPU and 61.9% of Memory usage. For the time processing, it increases exponentially as the increment of number of requested stops. The output of this research is expected to be a solution to the tourist itinerary plan, especially in Bandung and Lembang.
Keywords: 
Subject: Engineering  -   Transportation Science and Technology

1. Introduction

Bandung is one of the favorite destinations for tourists in Indonesia, which commonly comes from nearby big cities, such as Jakarta, Bekasi, etc. Along with the rise of the tourist’s number that comes to Bandung City, the traffic rose especially in the weekend and holiday seasons. It is proven based on Nasution, et al., who stated that the traffic condition gets worse on weekend [1]. The things that getting worse is not only the traffic on the road, but also the tourist spot is getting more crowded than before.
The destination of tourism in Bandung is not limited to the central of Bandung, but also the other sister city that is located near Bandung, called Lembang. It has various kinds of tourism, such as culinary, scenery, playground, etc. [2]. According to the information from the West Bandung Regency Government, which is the government of Lembang, they claimed that Lembang had more than 50 destinations for tourists in all categories mentioned earlier.
As previously mentioned, the rise in the number of tourists, which comes from local and other cities, made the traffic in Bandung and Lembang get worse and made the queues in the tourism spots longer than usual. This condition makes some tourists only able to visit one or two tourist spots in Lembang before they come back to their Hotel in Bandung. This situation made the tourists waste their time and money when visiting Bandung and Lembang.
In this paper, a recommendation system for a tourist itinerary plan is proposed by finding the best routes between tourist spots which will be collaborated using vehicle routing problems based on time windows. There is a lot of research that tried to find the shortest (best) route by approaching the Djikstra [3] or A* [4] algorithm based on the least route length of the shortest time travel as its criteria. In this paper, the best route is defined not only by the minimum length between origin and destination, but also considered other road information, such as time travel, traffic, and weather conditions. The collaboration between these criteria can be used as a new definition for finding the best route from an origin to a destination [5,6,7]. It is determined by calculating each criterion’s weight using the Analytic Hierarchy Process (AHP) based on a user preference [8].
The development of tourism route recommendations is commonly done by implementing machine learning, which uses a convolutional neural network in the recommendation system [9]. Moreover, several factors are considered in tourism route recommendations besides the shortest travel time, such as scenery [10], landscape character [11], etc. In general, the route recommendation systems in tourism areas only have one destination for their itinerary [12,13]. On the other hand, this paper provides a route recommendation system based on multiple road criteria to determine the pairs of tourism spots at the designated time.
The structure of this paper as follows, section 1 discusses the problems that arise from real situations in tourism are, especially in Bandung and Lembang. As in section 2, the discussion is on the research methods that support this research. The implementation and the result discussion will be shown in sections 3 and 4. Finally, in section 5 the conclusion and future works for the recommendation for tourist itinerary is defined.

2. Materials and Methods

This paper proposed a recommendation system for tourist itineraries based on the rating of the tourist spot and considered the optimal route between destinations. The itinerary plan will suggest the tourists visit several tourist spots. The selection of tourism spots can be done by implementing the Vehicle Routing Problem (VRP). It tried to find the optimal number of tourist destinations that might be visited by tourists by considering some aspects such as visiting time, number of passengers, etc. [14].
Commonly, the limitation in tourist itineraries is about the visiting time in the destinations. The tourism plan must be arranged carefully by observing the time aspects. The extension of VRP, which considers the time aspect is called VRP Time Windows (VRPTW) [15]. This method is suitable to use in tourism since, there are several time constraints such as opening, closing, visiting, travel time between the previous spot to the next tourism spot, and other time aspects that might affect the tourist’s itinerary plan [16,17].
In the determination of tourist spots that might be visited by the tourists, the system calculates the best route between the destinations based on several road conditions or criteria. It is calculated based on the road infrastructure (road length), and road traffic (traffic conditions, travel time, and weather conditions). These criteria will be compiled into new road weights and could be used as a parameter to define the optimal route to the destinations. Nasution, et al. proposed the concept of the measurement of road weight based on criteria and driver’s preference in 2022 [7].
Figure 1 shows the system that proposed in this paper. According to Figure 1, there are several steps namely, (1) the collection of road infrastructure; (2) the collection of road information for each criterion in every road segment; (3) the best route calculation based on the driver preference; and (4) the creation of tourism itinerary plan using VRPTW approach. The proposed system’s output will recommend an itinerary plan for the tourists.

2.2. Gathering Road Information

The road information is gathered from various sources. As previously explained, the road information that tried to be collected are road length, traffic condition, travel time, and weather conditions. From this information, the road length is the only criterion that won't change dynamically. On the other hand, the rest criteria can be changed every time.
In this paper, the information on road length is taken from open-source digital maps called OpenStreetMaps [18]. The information that might be collected in the source is the length of the road segment, the type of the road, the location of intersections, the connectivity between intersections (road segments), etc. This information will not be changed in a short time, so it is categorized as static information.
The other information is gathered variously by using common services, such as (1) TomTom digital maps that are used in an Advanced Driving Assistance System (ADAS) or a Map application in Apple devices [19]; and (2) openWeather which delivers the weather information in a specific coordinate [20]. TomTom will cover several basic information about traffic situation, such as vehicle speed and travel time which both also covers the current and free traffic information. Meanwhile, openWeather collects the weather information in the observation areas. This information is categorized as dynamic information since it can be changed every time.

2.2.1. Road Infrastructure

The infrastructure of the road is illustrated as a road network which generally has at least two nodes that are connected using an edge. According to Liu et al., the mathematical model of road infrastructure is shown in Equation (1) [21]. It shows that a graph G is built from a set of nodes N and edges E . In each edge, there is a set of weights w that could be any road criterion mentioned earlier. Moreover, the variation of weight w could be the number of incoming and outgoing lanes in the intersection [22], travel time [23,24,25,26], route length [27], or the collaboration of several weights [7,28].
G = ( N , E , w )
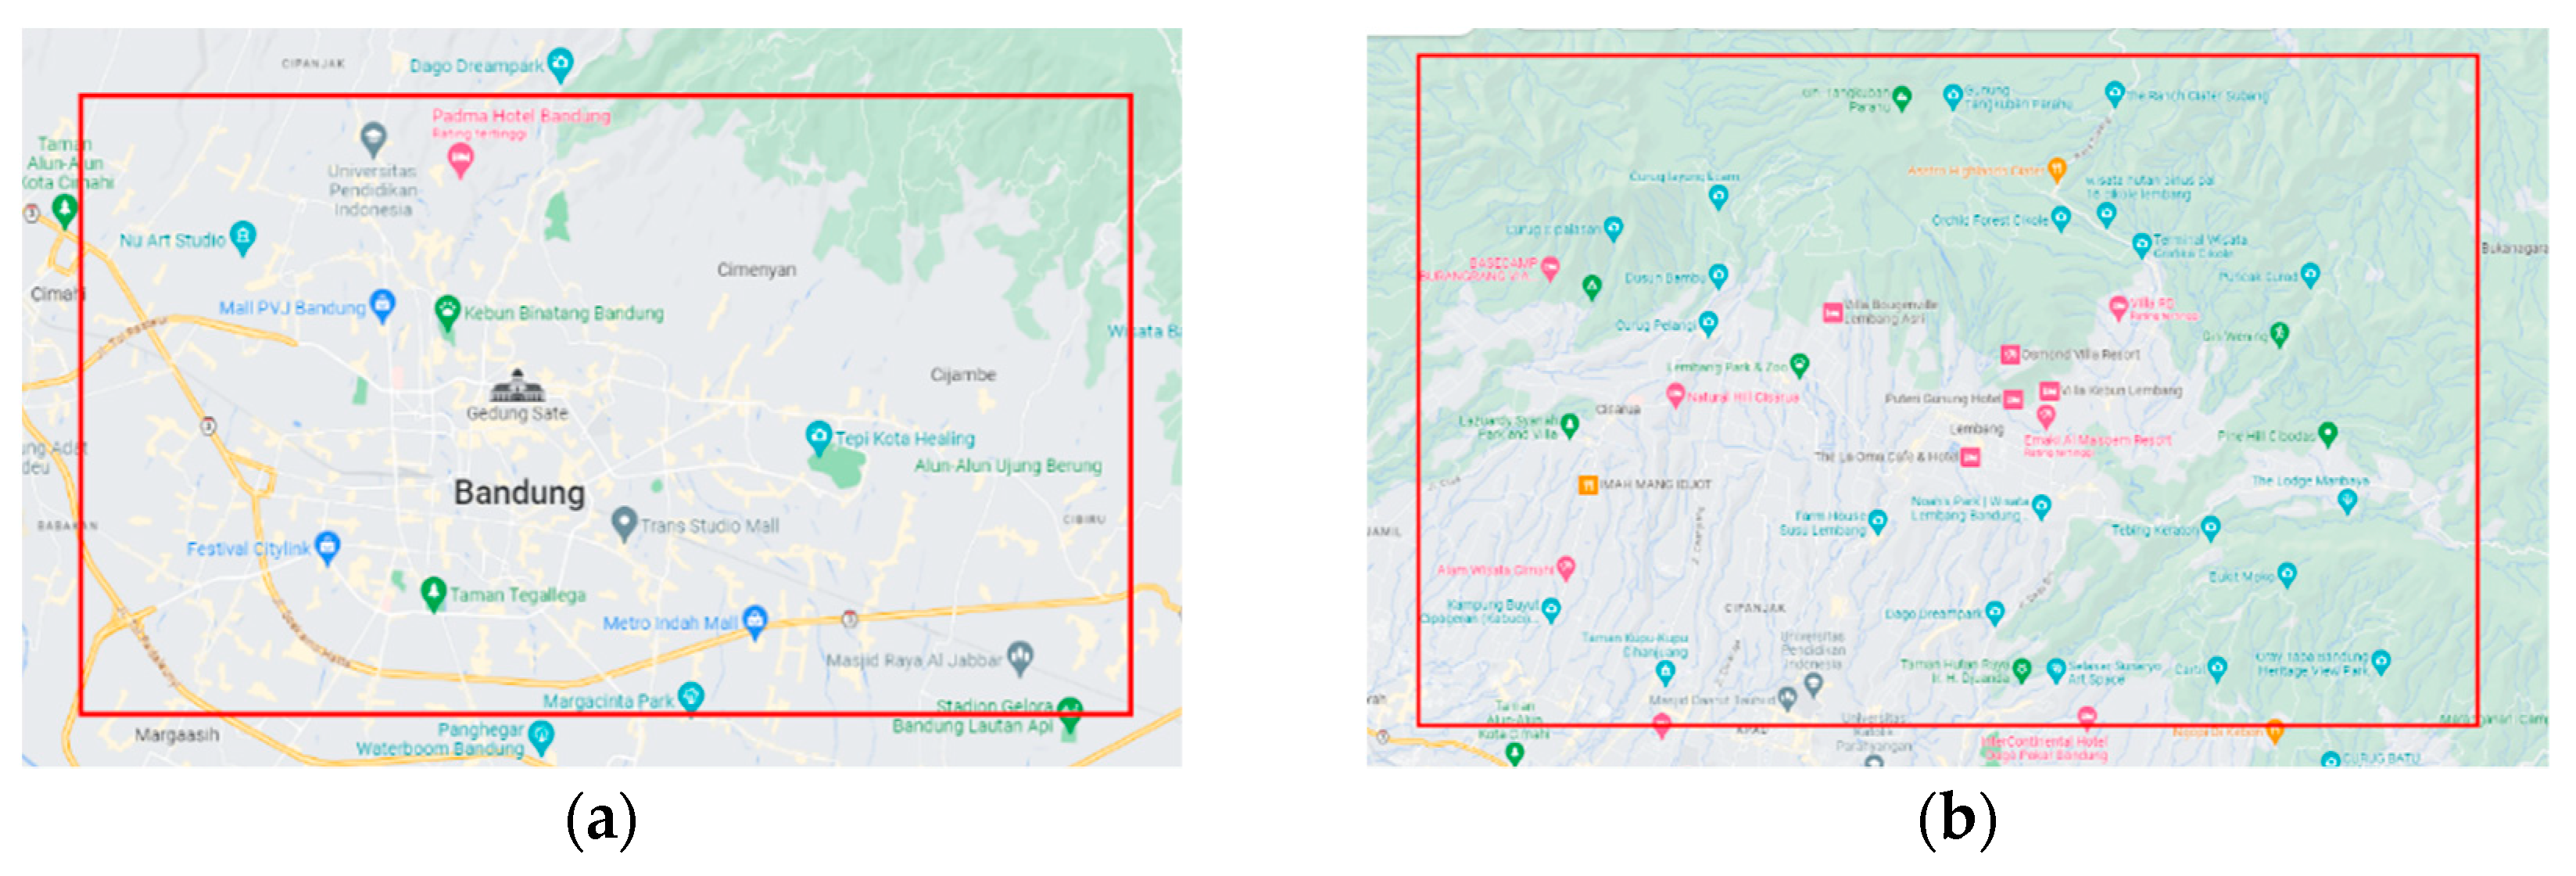
OpenStreetMap is a digital map system that provides basic information about the observation area. As mentioned at the beginning of this paper, the observation area is in Bandung and Lembang City, Indonesia. The size of these two cities are 167.3 and 95.56 km2 geographically located in the range of coordinates (-6.83693, 107.54499) to (-6.96987, 107. 73983) and (-6.75604, 107.57134) to (-6.86499, 107.6610) for Bandung and Lembang respectively. Based on the prior result of collecting road information, Bandung has 28,879 nodes which are connected to 68,029 edges. Meanwhile, in Lembang, there are 5,336 nodes and 12,070 edges that cover the city. This information for the observed area is shown in Table 1.
These two cities are located side by side and the position of Lembang is in the north-west of Bandung. Figure 2, shows the observation area (a) Bandung and (b) Lebang. As the function of these cities, Lembang has more tourist spots than Bandung, since Lembang has lots of hills it makes this city unique and it is able to attract more tourists. On the other hand, Bandung has comfier places to stay and a better place to eat. Based on this condition, this paper arranged Lembang as the destination in the tourism itinerary and Bandung as the origin and the last destination. Later in this paper, these cities will be combined into one area.
The collection of road information is done by using OpenStreetMaps which provides the infrastructure information for each intersection and road segment. In this paper, the information from OpenStreetMaps gathered using the OSMNX library in Python. According to the OSMNX, these two cities have 34,215 intersections and 80,099 road segments.
The number of road segments must be pruned by its type, since there is a road segment that is categorized as private roads, such as residential, living street, etc. It must be done in order to reduce the computational cost because it only needs less road segment (edge) to be calculated in finding the best route. Furthermore, the unused intersections are also pruned automatically if there is no road segment connected to the intersections.

2.2.2. Traffic Condition

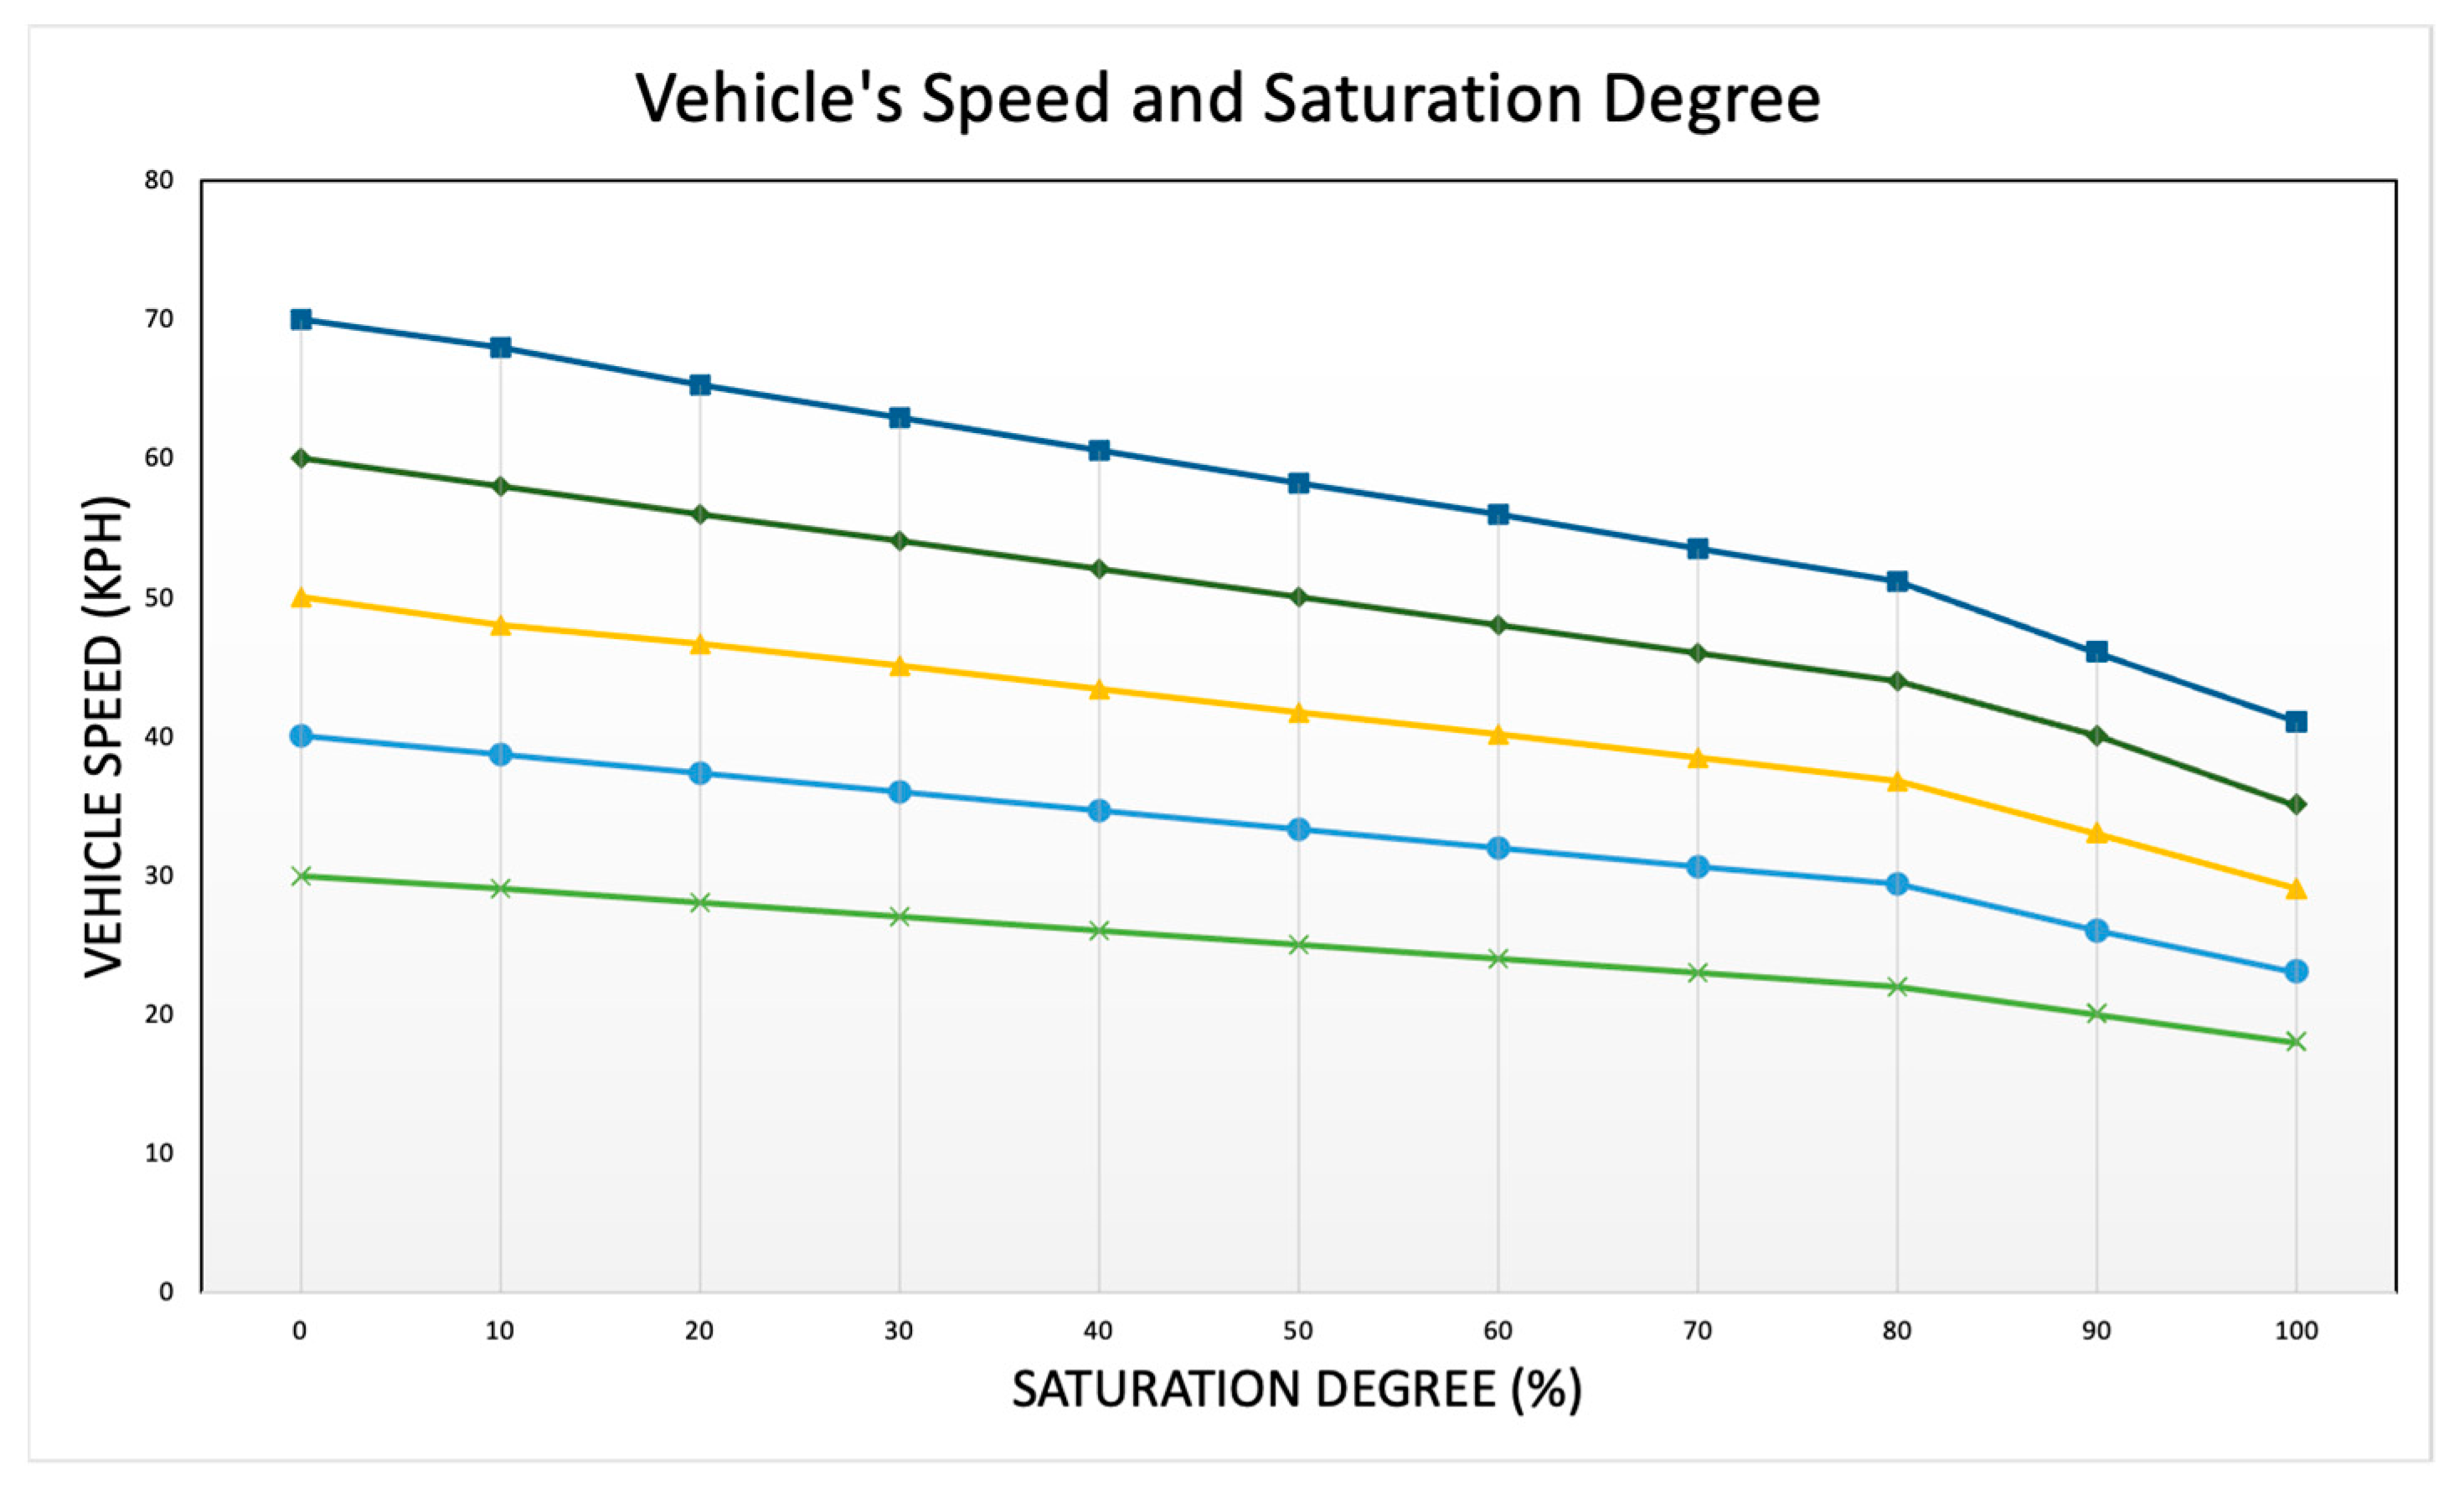
According to the road infrastructure in Bandung and Lembang, the number of lanes in these cities is dominated by the 2 lanes, 2 ways undivided (2/2UD), especially on the road that connects these two cities. Based on the Indonesian Highway Capacity Manual (MKJI 1997) [29], the traffic condition in this type of road is already formulated by using the speed of the vehicle and the saturation degree for each road segment. In Figure 3, the relationship between the vehicle’s speed and saturation degree (SD) is shown. As seen in the figure, a higher saturation degree will make the vehicle’s speed lower. This connection between these two variables is linear until the saturation degree reaches 80%.
Nasution, et al. formulated the relationship between a vehicle’s speed and saturation degree for a 2/2UD road segment [1]. By using equation (2) the value of saturation degree ( S D ) is calculated based on the current vehicle speed ( V ) and the average vehicle’s speed when the traffic is free ( V f f ).
S D = 3 1 V V f f
The value of saturation degree that has been calculated will be categorized in order to find the traffic level. The level of traffic can be categorized into many levels, as Nasution et al., tried to divide it into 4 level [1]. On the other hand, the Transportation Bureau in Indonesia categorized it into 6 levels of traffic, where level A shows the lowest traffic (free flow) and F as the highest traffic (severe congestion) [30]. In the traffic level F , the congestion that occurs on the road can’t be solved by using the common solution, the final solution for this level is more likely towards infrastructure improvement. In this paper, the traffic level will adopt the categorization from the Transportation Bureau with some adjustments, especially in the definition of lower and upper boundary in traffic congestion. Equation (2) is used to determine the traffic level based on the saturation degree.
T C = A ,                               0   % S D < 16.67   % B ,               16.67   % S D < 33.33   % C ,                           33.33   % S D < 50   % D ,                         50   % S D < 66.67   % E ,               66.67   % S D < 83.33   % F ,                     83.33   % S D                                      
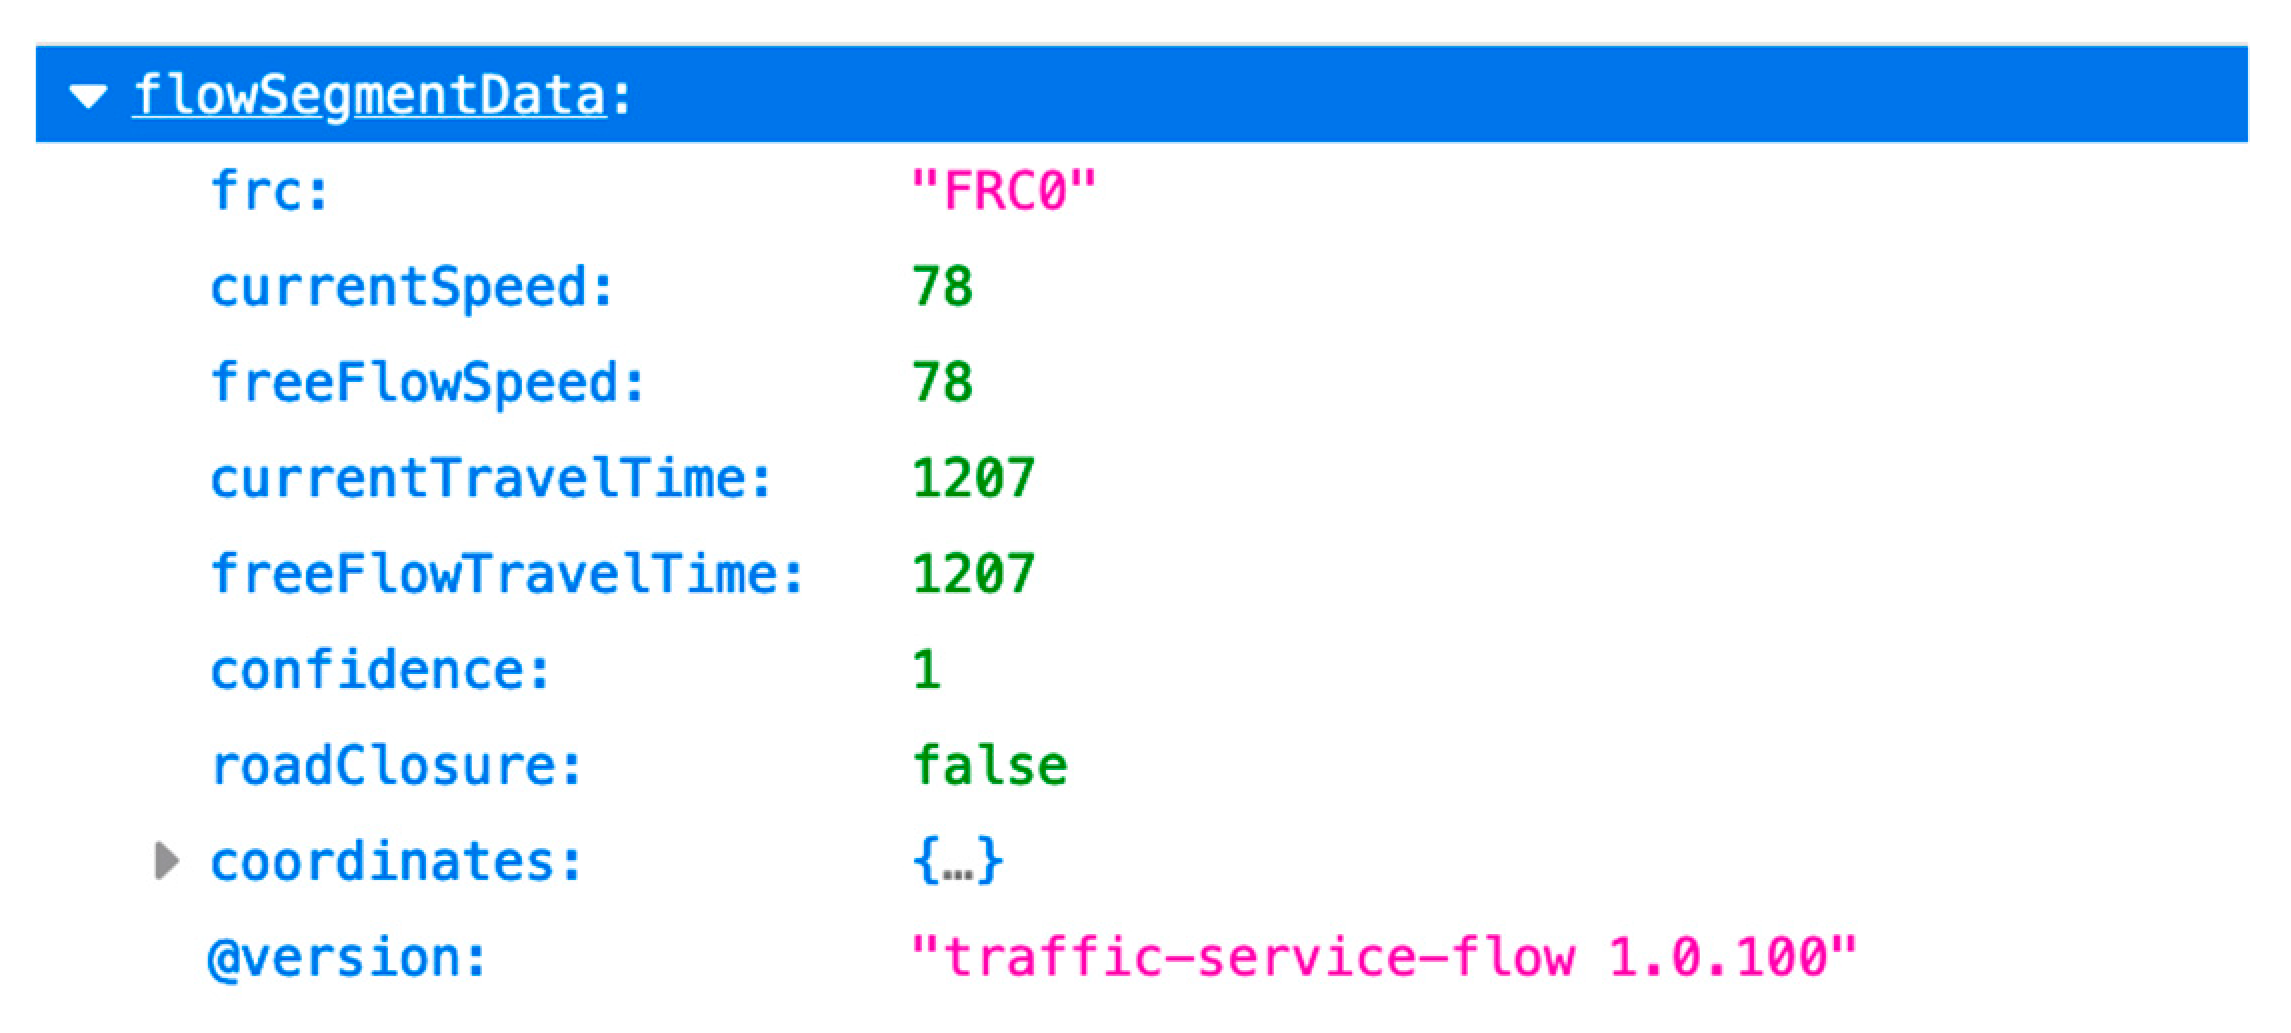
The information that needed to calculate the traffic level is gathered from TomTom digital maps. Figure 4 shows the response from TomTom digital maps for a specific location. As seen in the figure, the information given by TomTom includes vehicle speed and travel time in current conditions and when the traffic level is low. By using Equation (1) and (2) the traffic condition for a specific road segment is determined.
Furthermore, the value of traffic level will be used as an estimation of the real traffic situation for each road segment that is observed. This value is also used in the calculation of road weight in order to define the best route to the destinations with other criteria.

2.2.3. Weather Information

As an important additional criterion, the weather information is also being collected by using the openWeather service [20]. It delivers the information of the weather based on the designated coordinates when the request is sent to their server. As the server responds, it will give specific information related to the weather conditions, temperature, humidity, the direction of wind, etc.
The most important information related to the study is the weather conditions, whereas the rest of the information could be ignored. In the process of gathering the weather information, there will be an adjustment on the weather level, since Indonesia only have two kind of seasons, namely dry and rainy season. Meanwhile, according to openWeather’s documentation, the weather condition is scattered into other variations such as snow, tornado, etc. Based on this situation, the adjustment must be done in other to fit the server’s responses and the real weather conditions in Indonesia. Table 2 shows the result of the adjustment in weather conditions used in this paper.

2.3. Route Planning

As an approach to modeling the travel route, the concept of finding the best route between nodes is applied by connecting all nodes that are used as the destinations. The full-mesh network is used as a concept in order to find the best scheme for designing the tourism itinerary. In a full-mesh network, nodes will be connected. In a road network, every node will have several alternative routes to connect each node that is used in the network. Based on this situation, route planning is used to define the optimal route between alternatives in each connected node.
As mentioned in the previous section, in the step of calculating the optimal route, the system requires several criteria that represent the situation on the road, namely road length, traffic conditions, travel time, and weather conditions. These criteria will be compiled into new road weights. The compilation will use the Sum Additive Weight (SAW) which gives the priority or weight for each criterion [31]. The priority value will be defined by using the Analytic Hierarchy Process (AHP) approach [8]. AHP can determine the priority level for criteria by measuring the preference from the user [32].

2.3.1. Road Weight Calculations

The criteria weight calculation in the AHP method can be done based on personal or group preferences. AHP considers the decision maker’s opinion in determining the criteria weight. In this study, the role of decision-makers is on the drivers or tourists. The criteria weight in AHP is formulated based on the comparison between two criteria and it must be compared for all criteria that are used in the measurement. As shown in Table 3, the sample criteria importance comparison between criteria is done.
As the criteria weight calculation in AHP, the importance level has ranged from 1 to 9 [33], with each value describing its importance. The value 1 in the criteria comparison describes the importance level between two criteria as the same, meanwhile, value 9 describes one of the criteria as extremely stronger than the other one. That means the higher value illustrates that a criterion is more important than the other [34].
By the time, the comparison between criteria is collected, the calculation is continued in order to find the criteria weight (averaged value in the same row). At first, all the criteria’s value in the same column is added, as shown in Table 4. All values in the criteria’s comparison will be normalized by the summation value. Meanwhile, in Table 5, it shows the normalized value based on the summation value calculated in Table 4. On the right side of Table 5, the averaged value (initial criteria weight) for each criterion is shown.
At the time the initial criteria weights are calculated, it must be checked for consistency. Equations 5, 6, and 7 are used as a consistency checking formula [35]. As seen in equation (5), the calculation of the total number of criteria in the same row ( x ) and the number of initial criteria weights ( x ' ) will measure the value of lambda ( λ ) which is shown as the eigenvalue. The maximum eigenvalue ( λ m a x ) will be used in further calculation, as shown in equation (6). The consistency index ( C I ) is determined based on the λ m a x and the number of criteria ( n ).
λ = x ' x
C I = ( λ m a x 1 ) ( n 1 )
In the end, the consistency ratio ( C R ) is determined by dividing the consistency index and a constant Ratio Index value ( R I ) as shown in equation (7). The consistency ratio must have a value less than or equal to 0.1 ( C R     0.1 ). If the value of C R is greater than the threshold, the criteria comparison must be recalculated until its value reaches the threshold.
C R = C I R I
On the other hand, the initial criteria weight is changed into the final criteria weight at the time the C R is less or equal to 0.1. Equation (8) shows the measurement of the compilation of weight using the SAW method as previously mentioned. The value of weight ( W p r e f ) is measured by all values of criteria weight ( w n ) and the criteria value ( C n ) as shown in equation (8). In this paper, the value of W p r e f shows the new weight for every road segment and it will be used as a parameter in calculating the recommended optimal route for the drivers or tourists.
W p r e f = w 1 C 1 + w 2 C 2 + w 3 C 3 + + w n C n

2.3.2. Shortest Path Calculations

There are lots of shortest path calculation methods that can be applied to find the optimal route between destinations, such as Dijkstra [36], A* [37], Floyd-Warshall [38,39], etc.. However, the most common algorithm used in calculating the shortest path is Dijkstra and A* [40,41,42,43].
In Dijkstra, the shortest route is determined by calculating the edge’s weight in a graph [3,44]. This method has vast improvement, such as the addition of a probabilistic feature in the define the route [45], dynamic route optimization [36], etc. Dijkstra also could be implemented for Single-Source or All-Pair Shortest Path cases. On the other hand, A* measures the shortest path based on the heuristic and cost calculation [40].
In this paper, the implementation of the shortest path algorithm aims to find the optimal path for all pairs of destinations in the observation area. It means the calculation result must deliver the most optimal route for each destination. By using the networkX library in Python, the k-best shortest path can be defined, as Nasution et al. did in 2022 [7]. As mentioned in the previous section, the determination of the shortest path will be using several criteria, such as road length, traffic conditions, travel time, and weather conditions. The shortest path will be focused on finding the route with the lowest cost among the other alternatives.

2.4. Tourism Spot Information

As explained in the earlier section, Lembang has lots of tourist spots for local and foreign tourists. According to the data from the Tourism Bureau of West Bandung Regency, there are more than 50 tourist spots for scenery, culinary, and culture [2].
In this paper, the simulation is done by using 18 tourist spots that are in Lembang. Table 6 shows the detailed tourism spots used in the simulation. The table shows the specific location of every tourist spot (location name and coordinates), its opening and closing time, the common duration that is taken in every spot, and its rating.
Meanwhile, there is only one node that is used as a departure point in this paper. It will function as a source and sink node in the VRPTW. It is placed in the middle of Bandung City since it relatively similar distance to all destinations (Table 6) that are used in this paper. Table 7 shows the detailed location of the source and sink nodes. It is common that hotel is open 24 hours, but in this study, the opening time is set as the departure time. Since this location is used as the initial departure and destination, the duration in this location will be set as 0.

2.5. Vehicle Routing Problem Time Windows

Vehicle Routing Problem (VRP) is a method that tries to solve the vehicle’s routing using constraints, such as time, capacity, maximum stops, etc. For example, the derivative methods of VRP are the Capacitated Vehicle Routing Problem (CVRP) [46], Fleet Size Vehicle Routing Problem [47], Vehicle Routing Problem Time Windows (VRPTW) [17], etc.
In CVRP, the main constraint used to solve the routing problem is in the number of capacities that can be carried by vehicles on all stop points [48,49]. Meanwhile, in Fleet-Size VRP find the number of vehicles to solve all the problems that arise from the demand (users) [50]. As in VRPTW which is the derivative version of VRP, solved the problem based on time constraints, such as travel time, operational time, interval time, and other time aspects [51].
T c = T s t + T s v + T t
VRPTW needs several information that related to locations that must be visited like the earliest time arrived in the location, travel time between destinations, common service time in each destination. Equation (9) illustrates the calculation of consumption time ( T c ) based on the starting time ( T s t ), service time ( T s v ), and travel time ( T t ). VRPTW must be able to calculate the travel route based on the time windows that may appear differently for each destination.

3. Results

The proposed system is simulated in a computer that has 2 GHz Quad-Core Intel Core i5 as its processor, and 16 GB 3733 MHz DDR4. The simulation is divided into several important steps, namely information collection, optimal travel route between tourism spots, and tourism itinerary recommendation system using VRPTW. The main output from the proposed system is the recommendation of a tourism itinerary that has the highest rating compared with other itineraries.

3.1. Road Information

The required information is gathered from several sources. In this subsection, the discussion is on the results of collecting information from its sources. The results in this step are the information on the road infrastructures, calculation of traffic conditions, and weather conditions. On the other hand, the travel time is only calculated based on the length of each road and the vehicle’s speed.

3.1.1. Road Infrastructure

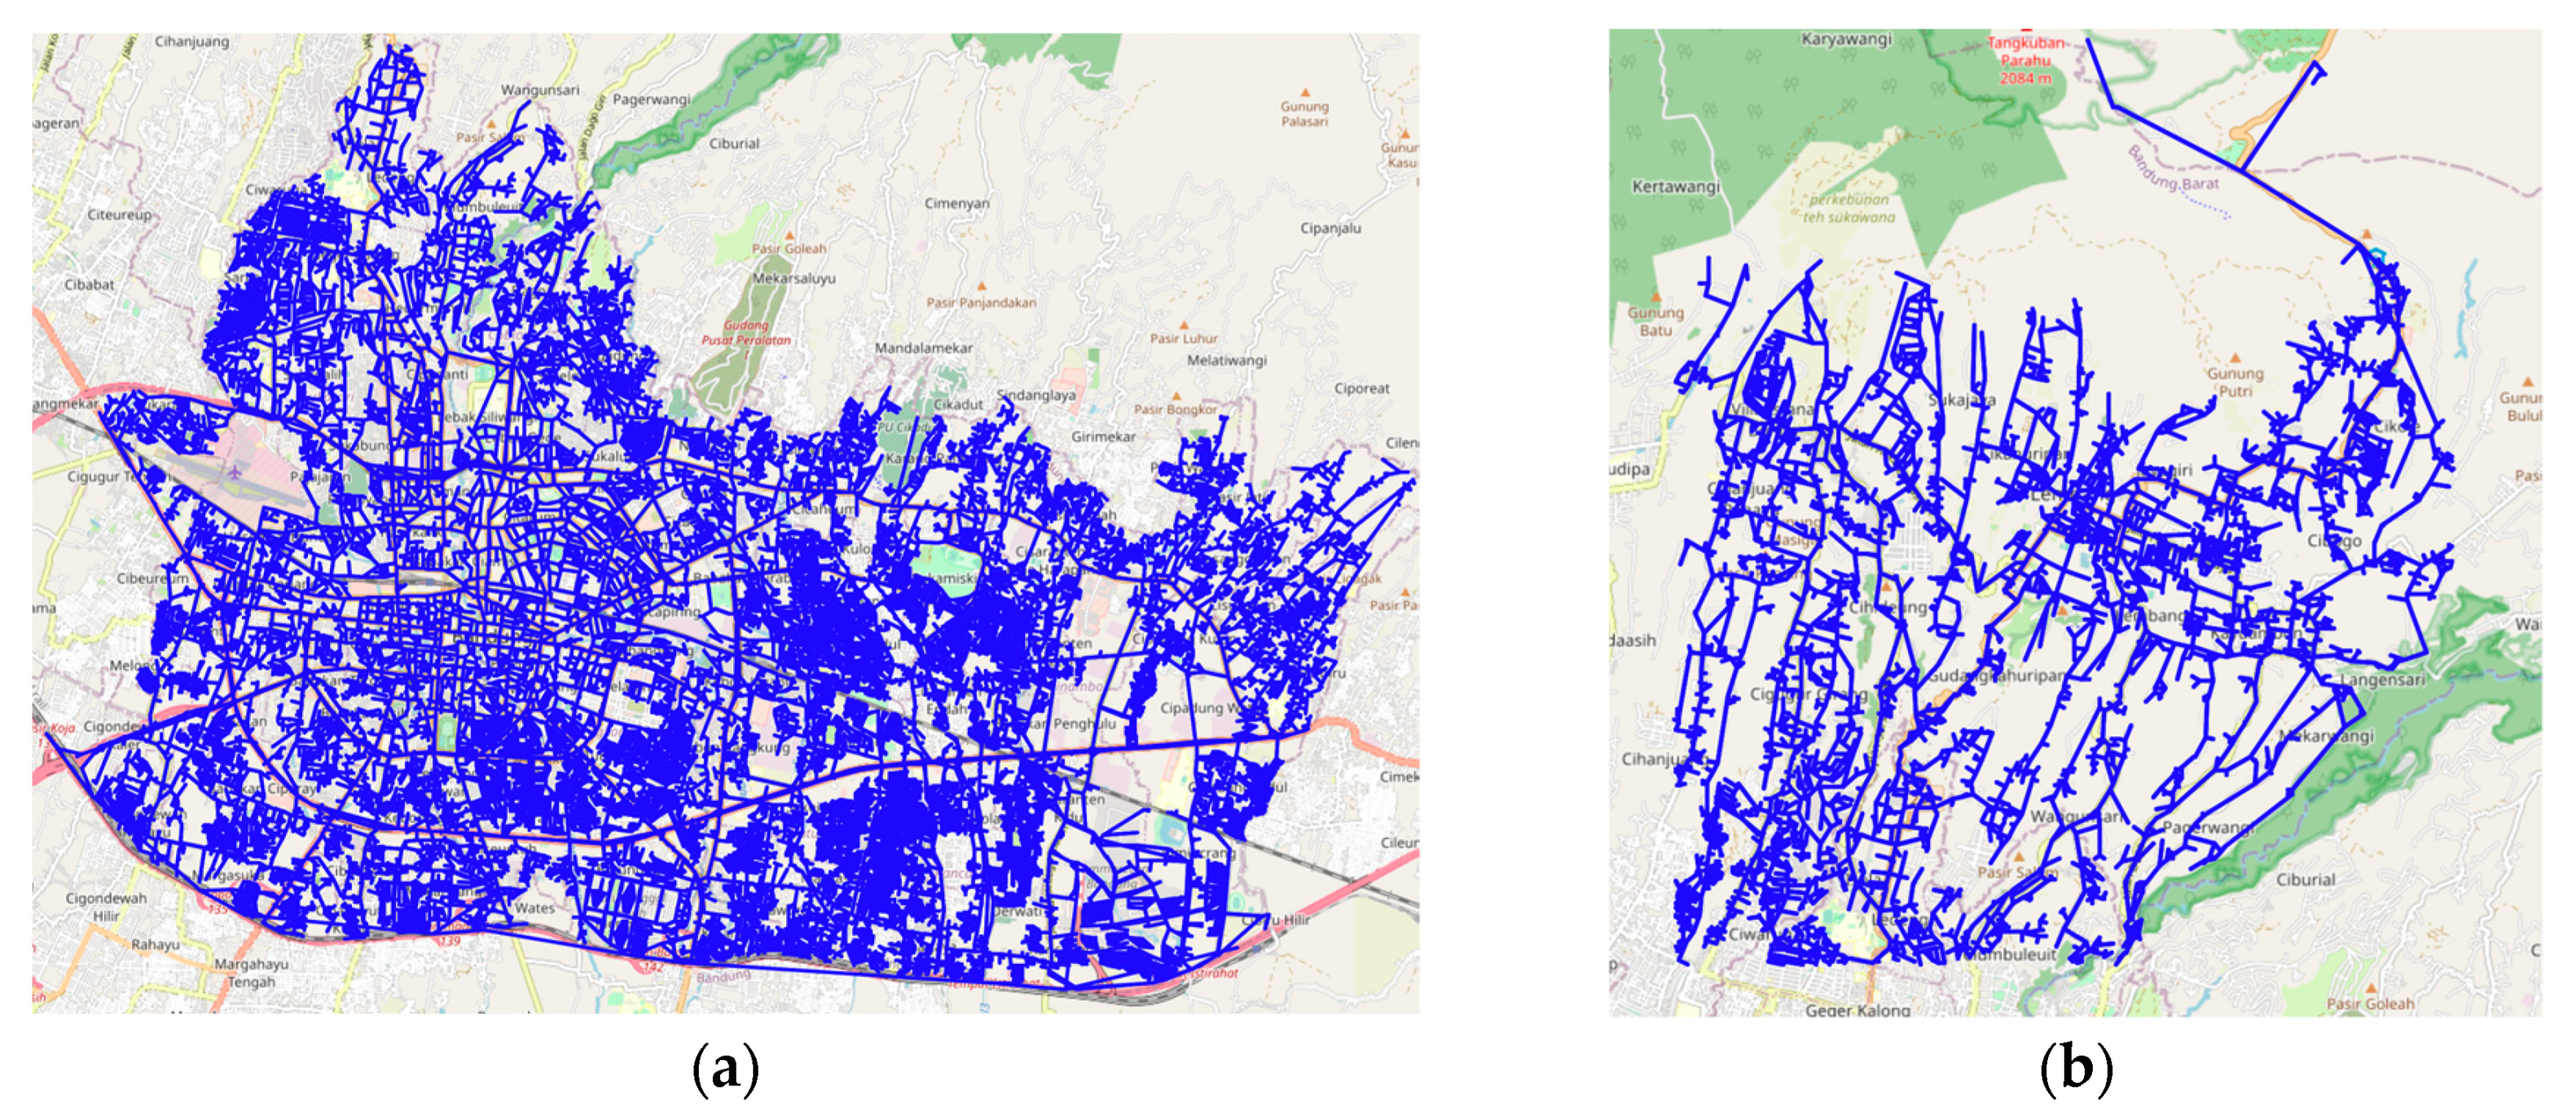
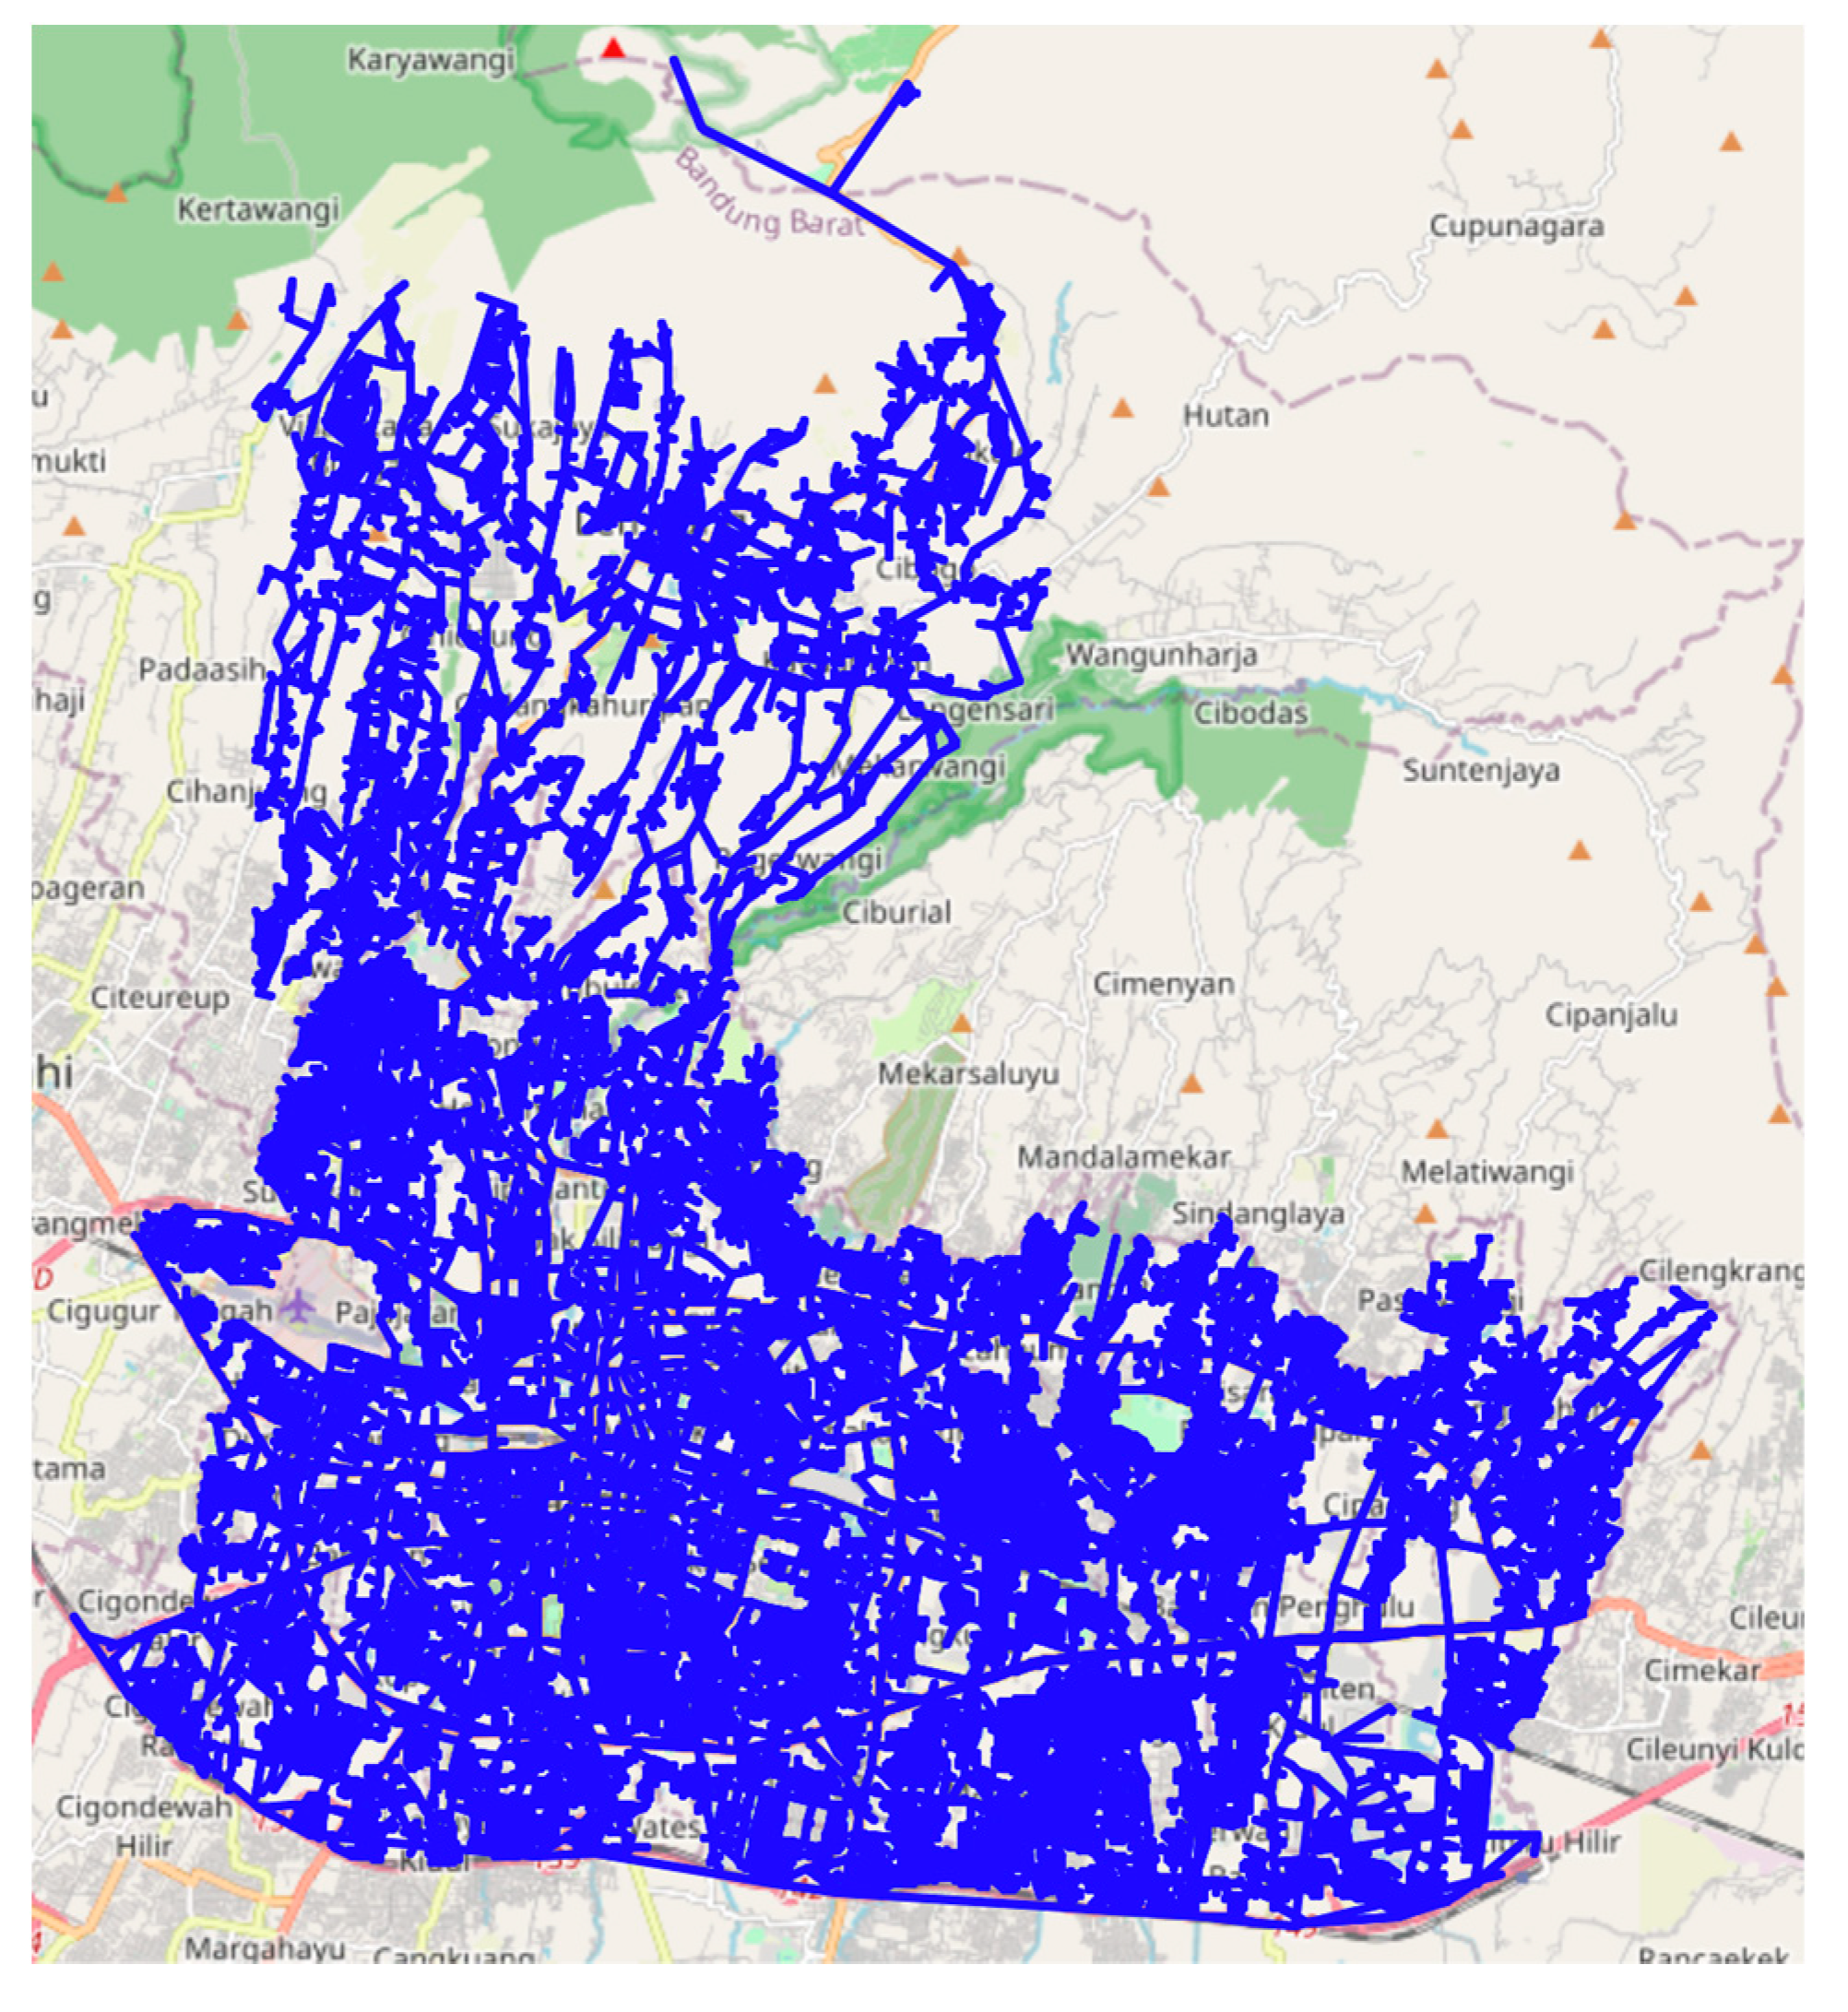
In the initial stage of information collection of the road infrastructure in Bandung and Lembang, the number of intersections and road segments is 34,215 and 80,099 respectively. Figures 5 (a) and (b) show the road infrastructure in Bandung and Lembang, collected from OpenStreetMaps using the OSMNX library in Python. Both road infrastructures will be combined as one map. As shown in Figure 6, the result of combining the city of Bandung and Lembang succeeded. It also can be seen that both cities are connected based on their intersections and road segments.
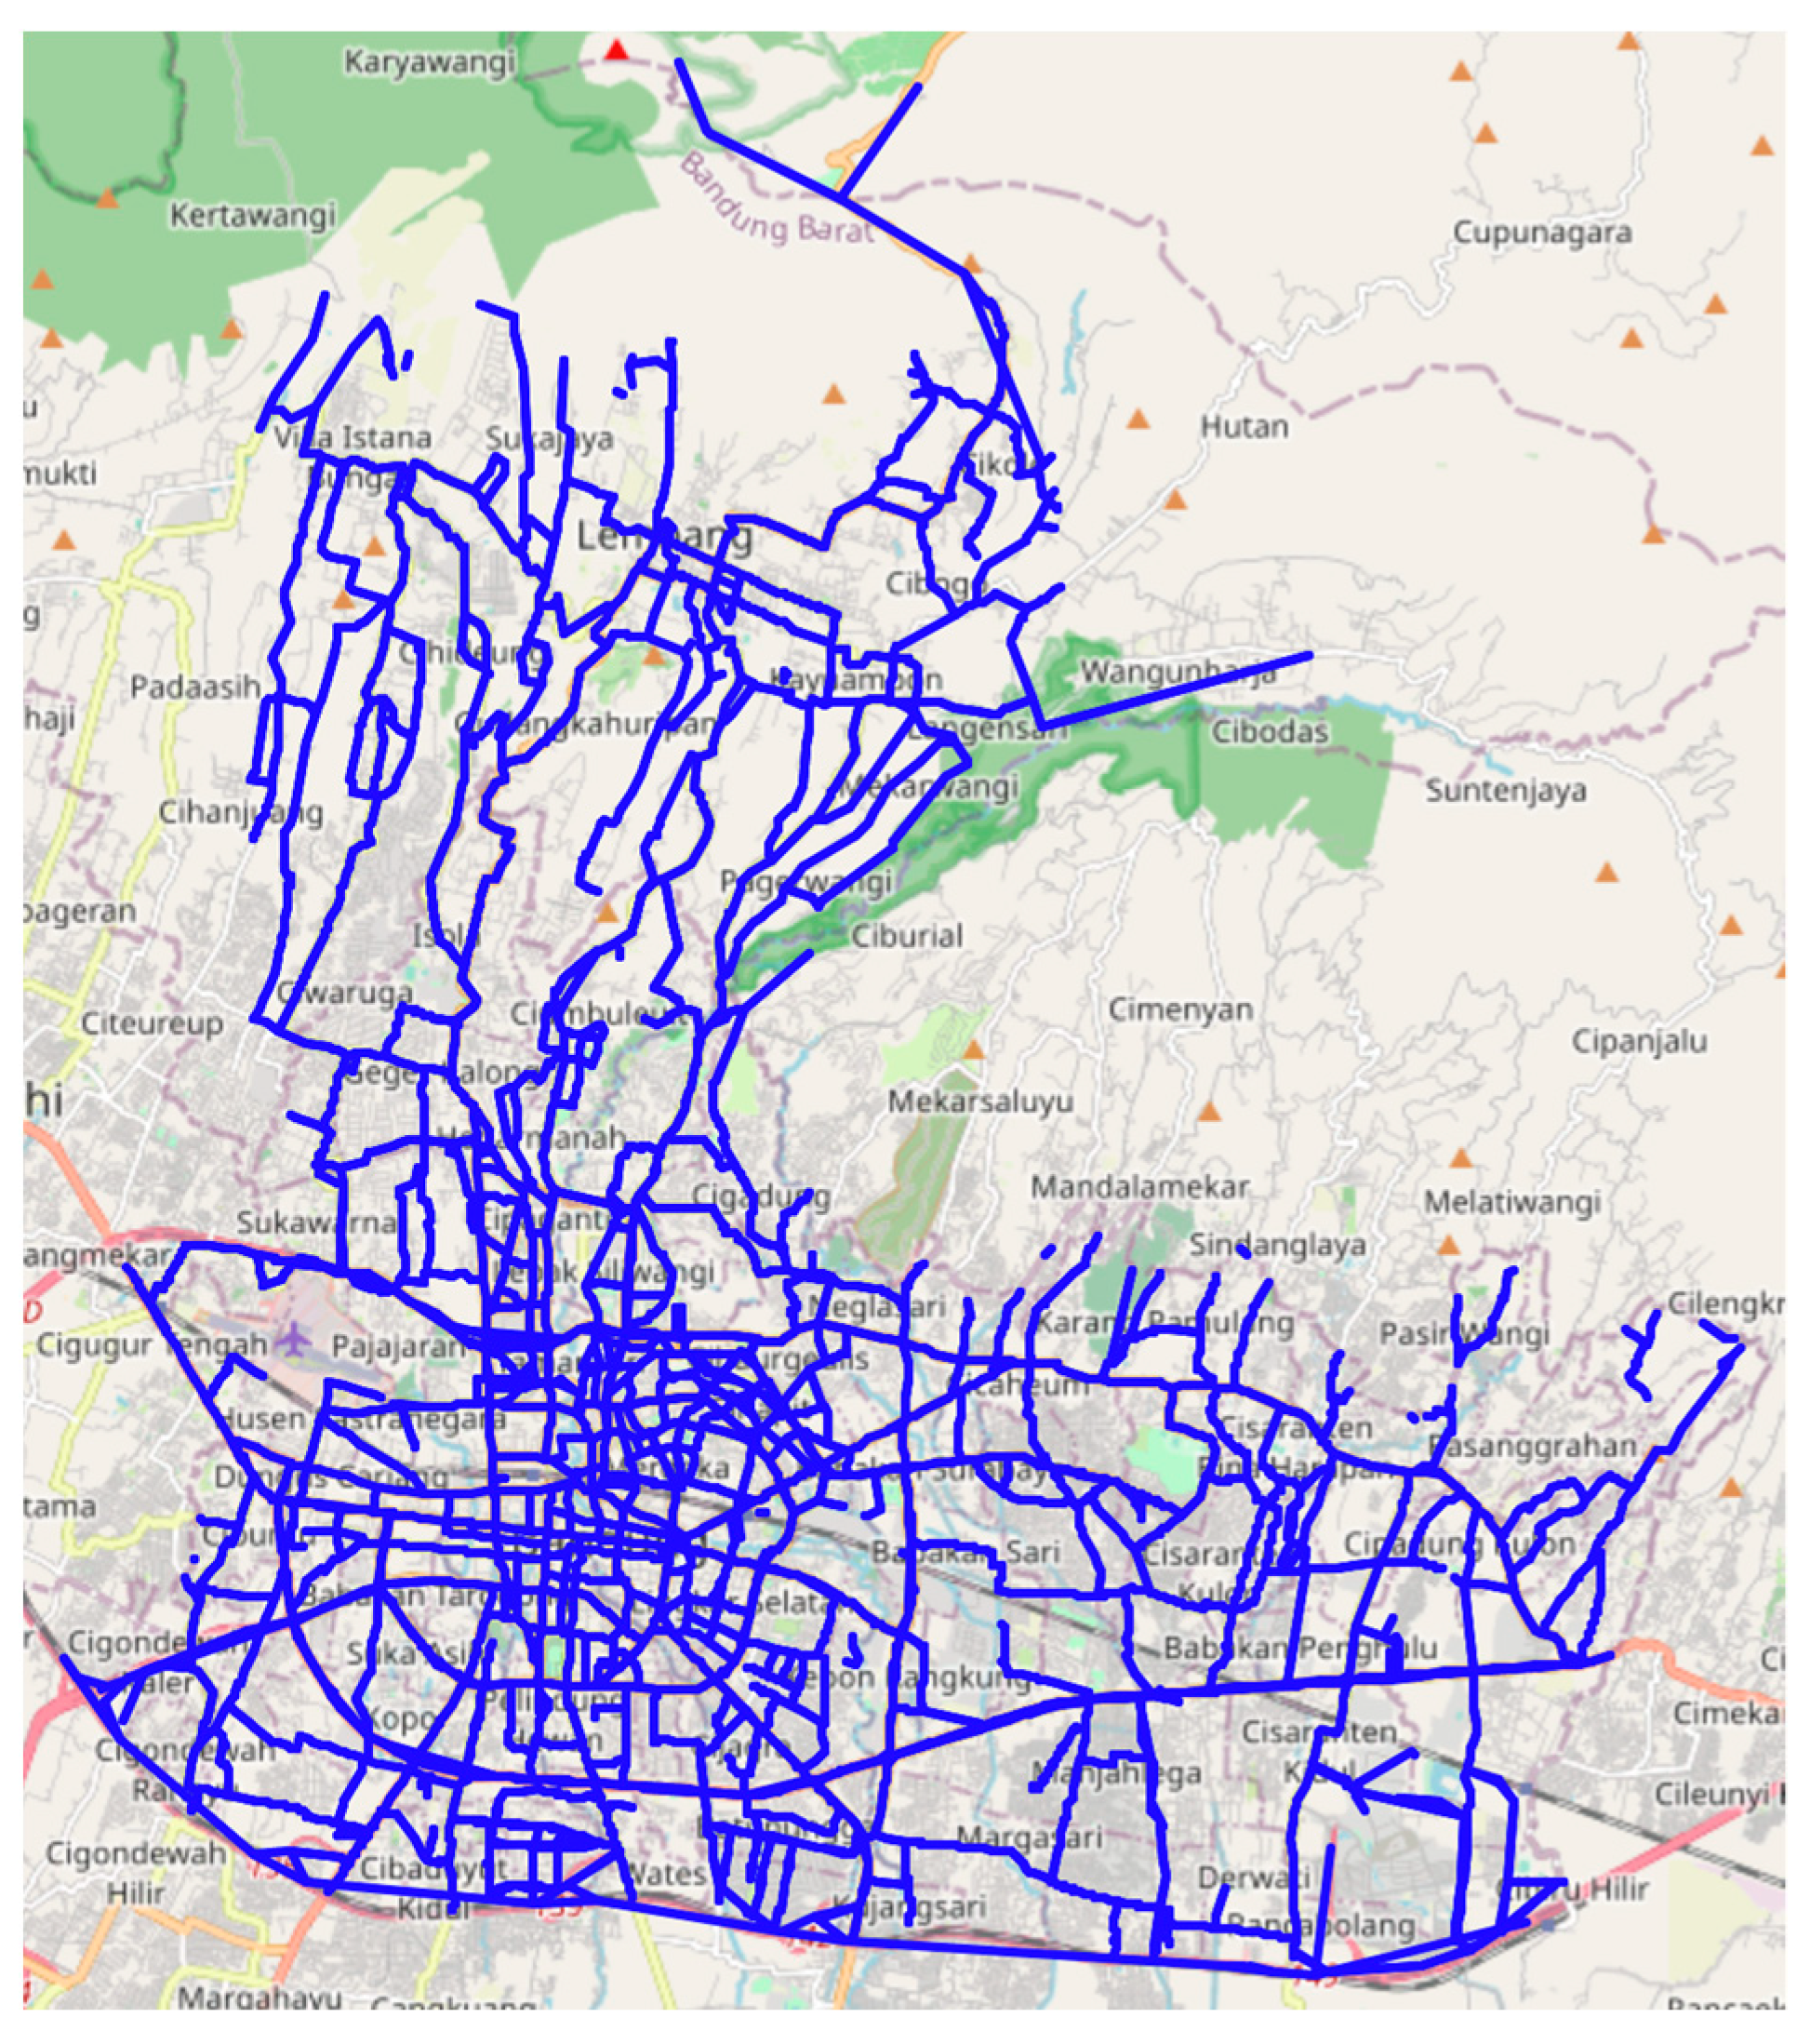
As mentioned in the previous section, there will be a pre-processing by eliminating several road types. In general, the road types that must be eliminated the residential access, private roads, etc. As a result, Figure 7 shows the reduction results of the road type that won’t be used in the simulation. The number of road segments is reduced from 80,099 to 13,150. This means the pre-processing stage reduces the road segments by about 83.58%. This process aims to reduce the computational process, not only in the context of saving resources but also in the time requirements.

3.1.2. Traffic Condition

In this step, the calculation of traffic conditions is realized based on the responses of TomTom digital maps. Table 8 shows some samples of calculation results from TomTom’s responses from several locations. Traffic condition is determined by using vehicle speed both in current and traffic-free situations. Since, the road type in the observation area is 2/2UD, the equation (1) is used to determine the Saturation Degree.

3.1.3. Weather Condition

In this step, the realization of the weather information is done. To reduce the computational cost, there will be a step of simplification of requested weather data. It is common, that several areas have similar weather. According to this condition, the observation area will be divided into several sectors.
Figure 8 shows the illustration of sectors that are used in gathering the weather information. In the observation area, there will be 16 sectors. If there is any data requested by the system, there are only 16 requests at one time. Whenever a road segment needs weather information, it will refer to the nearest sector.

3.1.4. Road Weight Compilation

This step needs at least two components, (1) road information that is gathered by using many sources; and (2) the measurement of driver preferences. In this paper, the criteria that will be compared by a driver are the road length, traffic conditions, travel time, and weather conditions. By the time, the road information and preferences are collected, the compilation of the road weight began.
  • Criteria Weight Compilation
In the approach of criteria weight compilation, the preference from a driver is needed. The driver will be asked about the 4 criteria that mentioned before. The number of criteria comparisons can be determined by using equation (10), n is the number of criteria that tried to be compared. Indirectly, the number of comparisons will be increased along with the number of criteria.
C o m p a r i s o n = i = 1 n 1 n i
In this paper, the number of criteria that compared is 4. This means there will be 6 comparisons of criteria that will be asked to the driver. Table 9 shows the pairwise comparison of the criteria from a driver. It can be seen that the comparison value between similar criteria will be set as 1. Meanwhile, the compared criteria can have various importance levels, as shown in the Table, Route Length has less importance level than Traffic Condition (1:7). On the other hand, the comparison between Traffic Condition and Route Length is the reciprocal value (7:1) of the comparison of the Route Length and Traffic Condition.
By the time the comparison of criteria is done, the process of criteria weight measurement begins with adding the values that appear in the same column. As seen in the last row of Table 9 shows the result of the addition of the criteria value in the same column which will be used in the normalization process.
Meanwhile, Table 10 shows the normalization using the addition result as mentioned in Table 9. Each normalized value in the criteria comparison will be averaged for each row. As seen on the right side of Table 10, the initial criteria weight is determined. Later, these numbers can be used as the final weight if the process of consistency ratio is done and its value is lower than 0.1.
When the consistency ratio is higher than 0.1, the criteria comparison is not consistent. There must be an adjustment in the criteria comparison. This process must be done repeatedly until the consistency ratio is under the threshold. Table 11 shows the results of the consistency ratio according to the criteria comparison in Table 9.
Maximum   Eigen   Value   ( λ m a x Consistency   Index   ( C I Consistency   Ratio   ( C R As seen in Table 11, if the calculation result of the consistency ratio is less than the threshold, the final weight is determined. It appears the initial weight shown in Table 9 is not only the initial weight but also the final criteria weight that can be used in the process of road weight calculation. The criteria weights are 6.9%, 62.7%, 18.6%, and 11.9% for Route Length, Traffic Condition, Travel Time, and Weather Condition respectively.

3.2. The Best Routes Calculation

The best route calculation is trying to find the best path between the destinations. As an example, Table 12 shows the result of the best route calculation between the destinations. In the Table, there are two simulation results from tourism spots called “Farmhose Lembang” to “Floating Market Lembang” and “Dusun Bambu” to “Taman Begonia”.
In the first simulation (“Farmhouse” to “Floating Market”), the best route has 42 road segments that must be passed by the tourists. The nodes that are shown in the table is the node number according to the OpenStreetMaps. Another simulation shows the path that can be passed by the tourist who wants to visit “Taman Begonia” from a tourist spot called “Dusun Bambu”. As in the second result, the route length is 12,869 m between the origin and the destination and it’s the reason that the second has longer nodes to be passed.
In the simulation, there are 1 hotel and 18 tourism destinations that will be used as sets of origin and destination. Thus, the measurement of the best path is done for all nodes. By applying the permutations for 19 places, there will be 342 sets of origin and destination in this paper.

3.3. VRPTW Implementation

As explained in the earlier part of this paper, the tourism itinerary will be generated using VRPTW according to the best path from each tourism spot, including the initial departure nodes (hotel). In the simulation, experiments are using various stops in the tourism nodes. Figure 9 shows the simulation result using 5 tourism destinations with limited time windows.
Table 13 shows the detailed simulation results that illustrated in Figure 9. Based on the simulation, an adjustment in the number of destinations is needed. According to the simulation, there are 5 alternatives to the tourist’s itinerary which consists of 3-4 destinations in each itinerary. Along with the determination of the tourist’s itinerary being calculated, there is also a measurement of average rating tourism destination.
Based on the simulation results that recommend several itinerary lists, the system will recommend the itinerary list with the highest rating among others. As seen in Table 13, the first itinerary recommendation delivered to the tourist is “Route-1” which consists of nodes as follows: “Museum Geologi Bandung”, “Curug Dago Pakar”, and “Taman Hutan Raya Ir. H. Djuanda”. The itinerary plan is arranged from the “Source” to the “Sink”, which is in the same location, namely “Hotel Santika” as mentioned in Table 7. The “Source” and “Sink” nodes are the one-way trip, in which the “Source” node only can be used as to departure point and the “Sink” only be used as the arrival point.
The traffic information shown in Table 8, was gathered on October 25th, 2023, at 6 AM. As seen in the table, several road segments have traffic levels as follows: E , F , D , and A . These values are determined using equation (2), which is used to categorize the traffic condition according to its saturation degree. According to the calculation result, there is a saturation degree of more than 100%. Based on equation (2), this traffic level will be defined as class F . Later, this value will be adjusted into numerical form, so the traffic levels A to F will be changed into levels 1 to 6 respectively and this number will be normalized to have 0 to 1 as it ranges.
Meanwhile, the information on travel time will be recalculated by using vehicle speed and the road length. It must be done since TomTom takes it from several roads that are directly connected to the location’s coordinates.

4. Discussion

In this section, the discussion based on the simulation result is conducted. The discussion is divided into two parts, namely: (1) The Best Routes Calculation; and (2) The Recommendation Result of the Tourism Itinerary. The discussion is around the requirement of processing time and computational resources when determining the tourist’s itinerary.

4.1. The Best Routes Calculation

Route calculation is done for each node used in this research. Every node will act as the origin and destination, except the initial point since it will be used as the first departure and final arrival point. The initial point is the hotel that is mentioned in Table 5, meanwhile, the destination point that is used is shown in Table 4.
Pairs of origin and destination are determined using the permutation from all nodes used in the study. Table 14 shows the sample result of the comparison between alternatives of the calculated routes according to the number of intersections and the estimated travel time from node 8761228379 to node 5864754682. The first row is the best route calculated that will be recommended to the tourist. Based on this result, the best route calculation determined in this study is the optimal route according to the road weight that was previously measured using driver preferences.

4.2. The Itinerary Recommendation

There are several scenarios in testing the tourist’s itinerary recommendation system, especially in the number of destinations. The scenario in calculating the number of visited tourism spots, from 1 to 7 nodes. Table 15 shows the result for the various number of stops that were requested for each simulation. As shown in the table, the maximum stops calculation, the number of itinerary recommendations, and the computational resources that were used (CPU and Memory Usage (%), and Processing Time (s)).
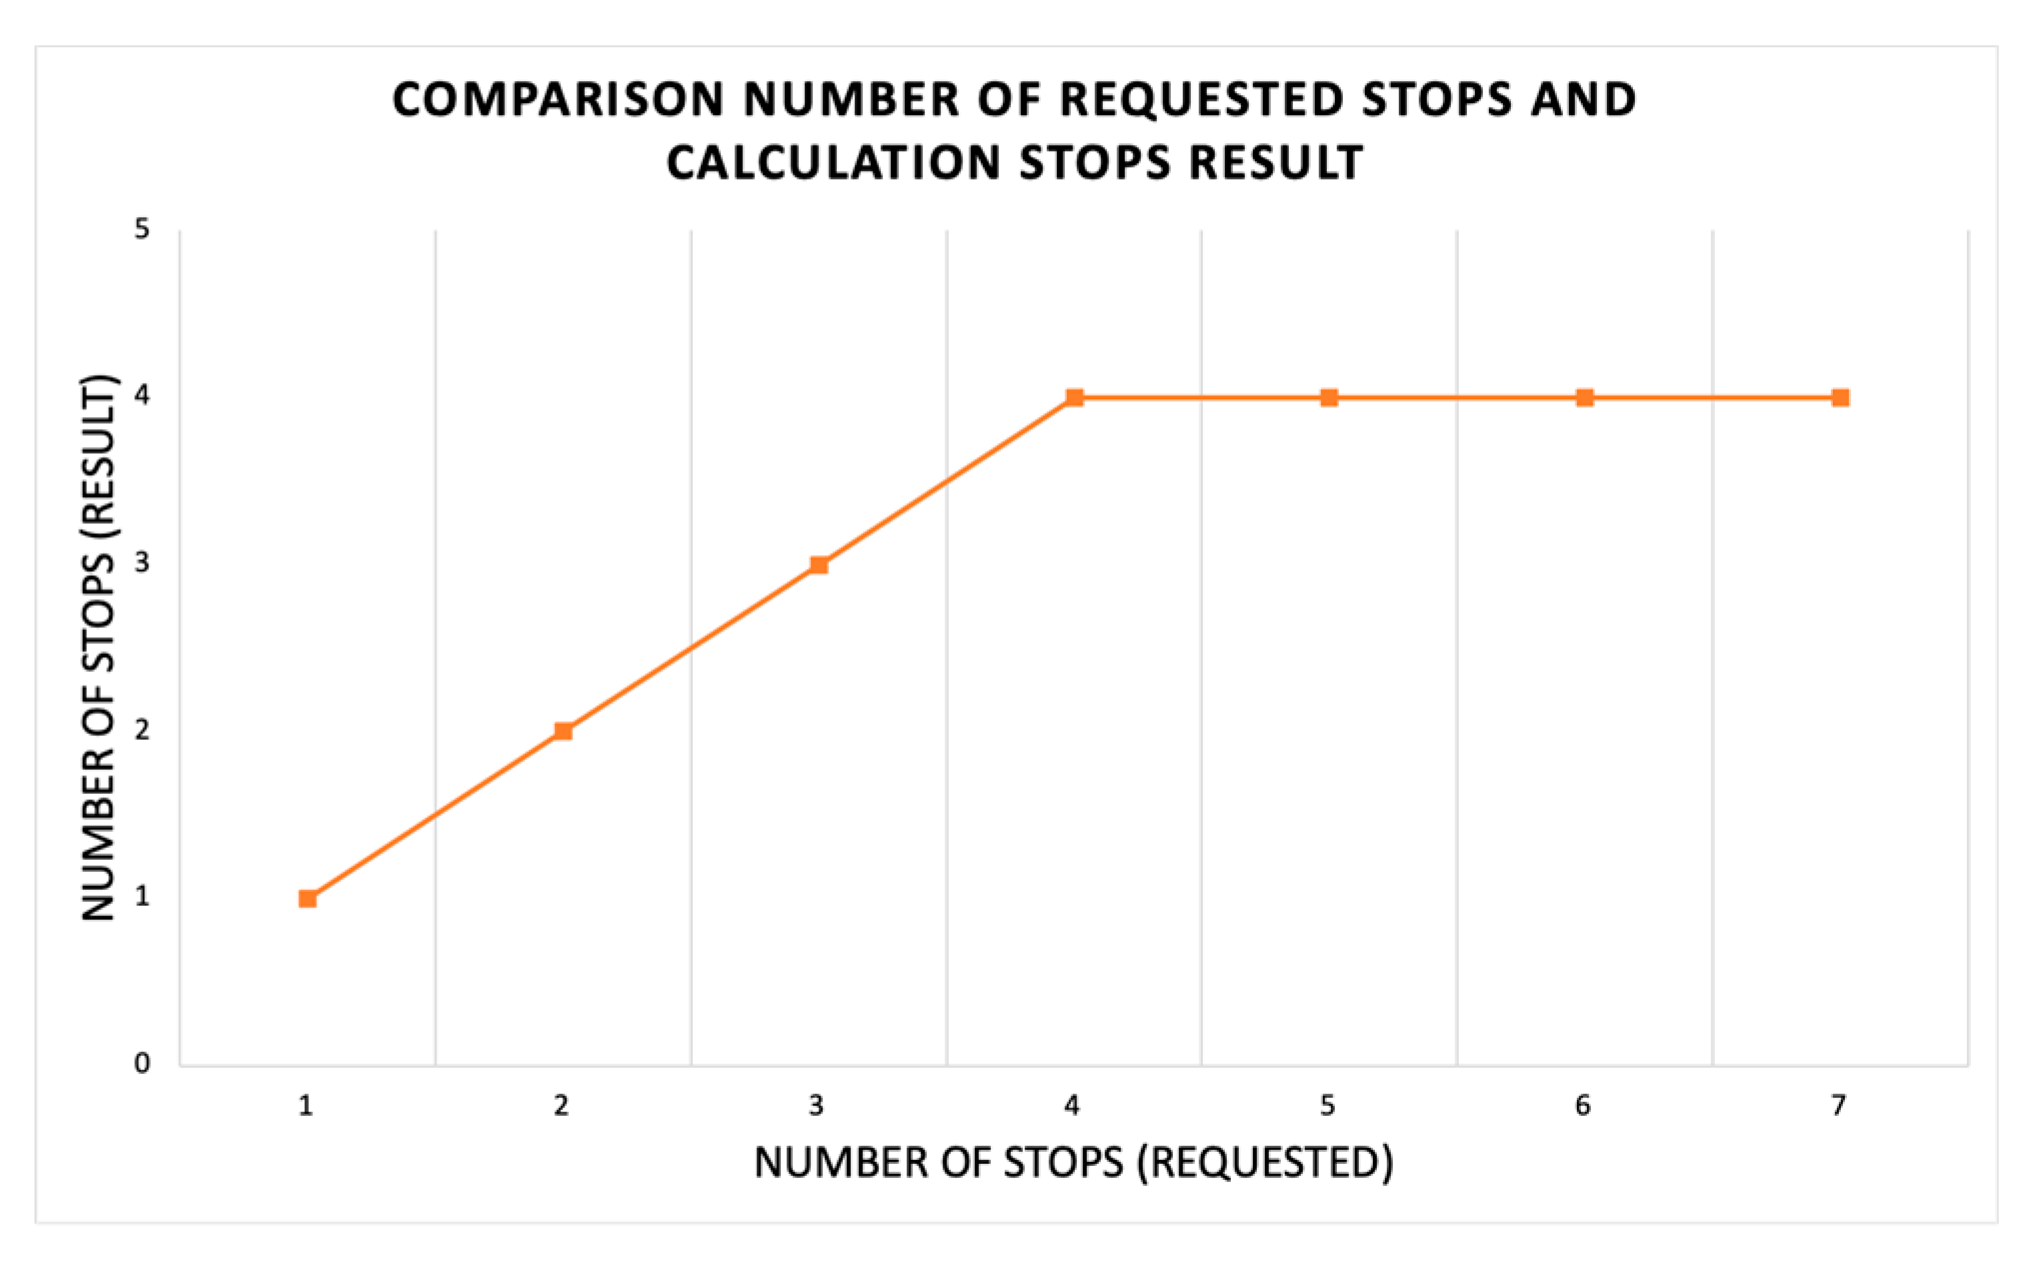
According to the comparison results in the various numbers of visited tourism spots, there are saturation values in the number of calculated. As shown in Figure 10, the saturated point for the visited tourism spots is in 4 nodes. Based on the simulation, if the requested spots are greater than 4 nodes, the system is only able to recommend 4 tourism spots. This saturated number of tourism spots is because of the limited time windows that are stated for each tourism spot.
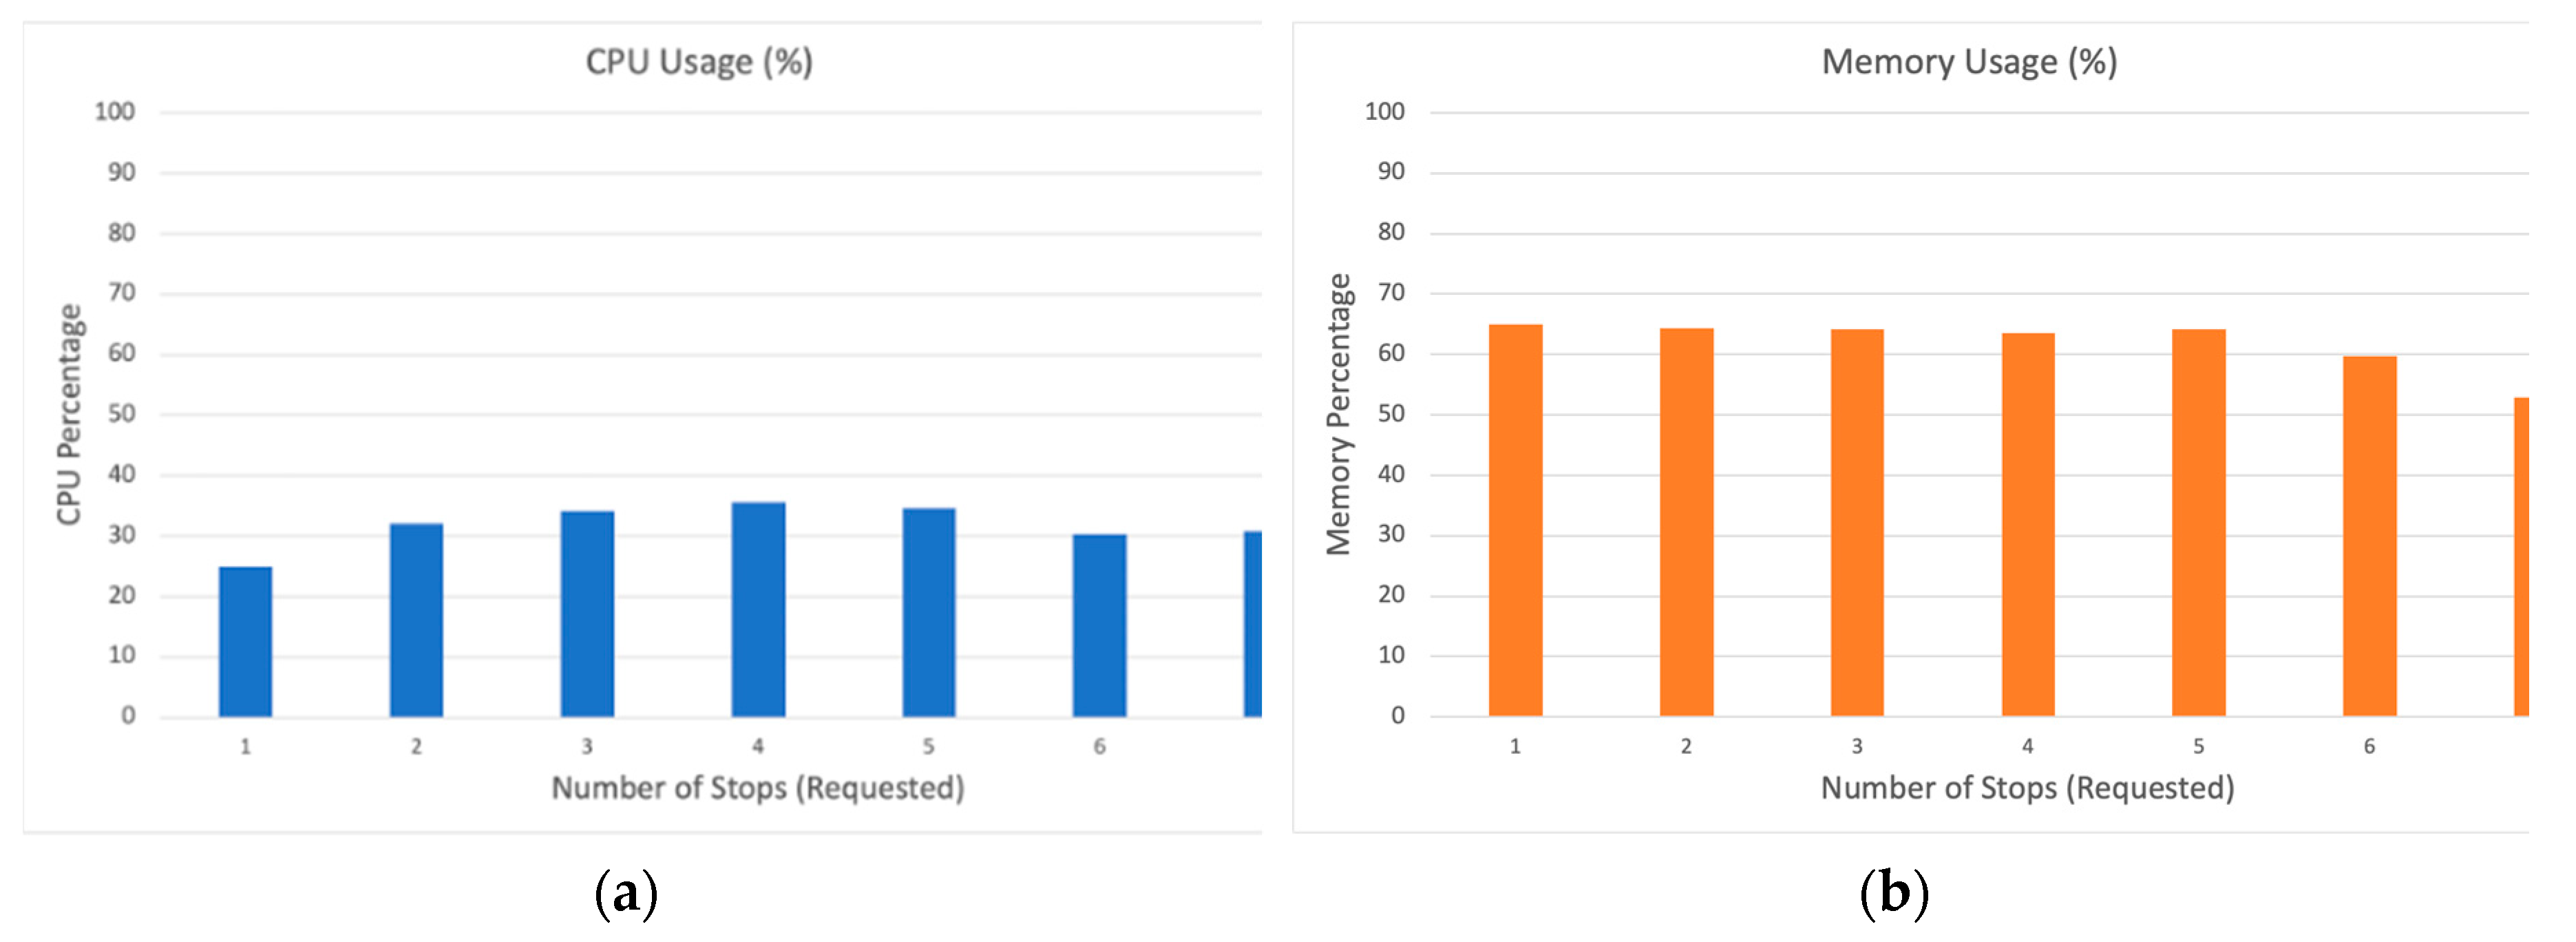
Figure 11 shows the computational resource that used while calculating the itinerary plan for the tourist. As shown in Figure 11 (a), the CPU usage is less than 35% for all scenarios conducted in the simulation, in average it takes 31.8% of CPU Usage. On the other hand, in Figure 11 (b), the memory usage is averaged at 61.9% for the simulation in determining the tourist’s itinerary.
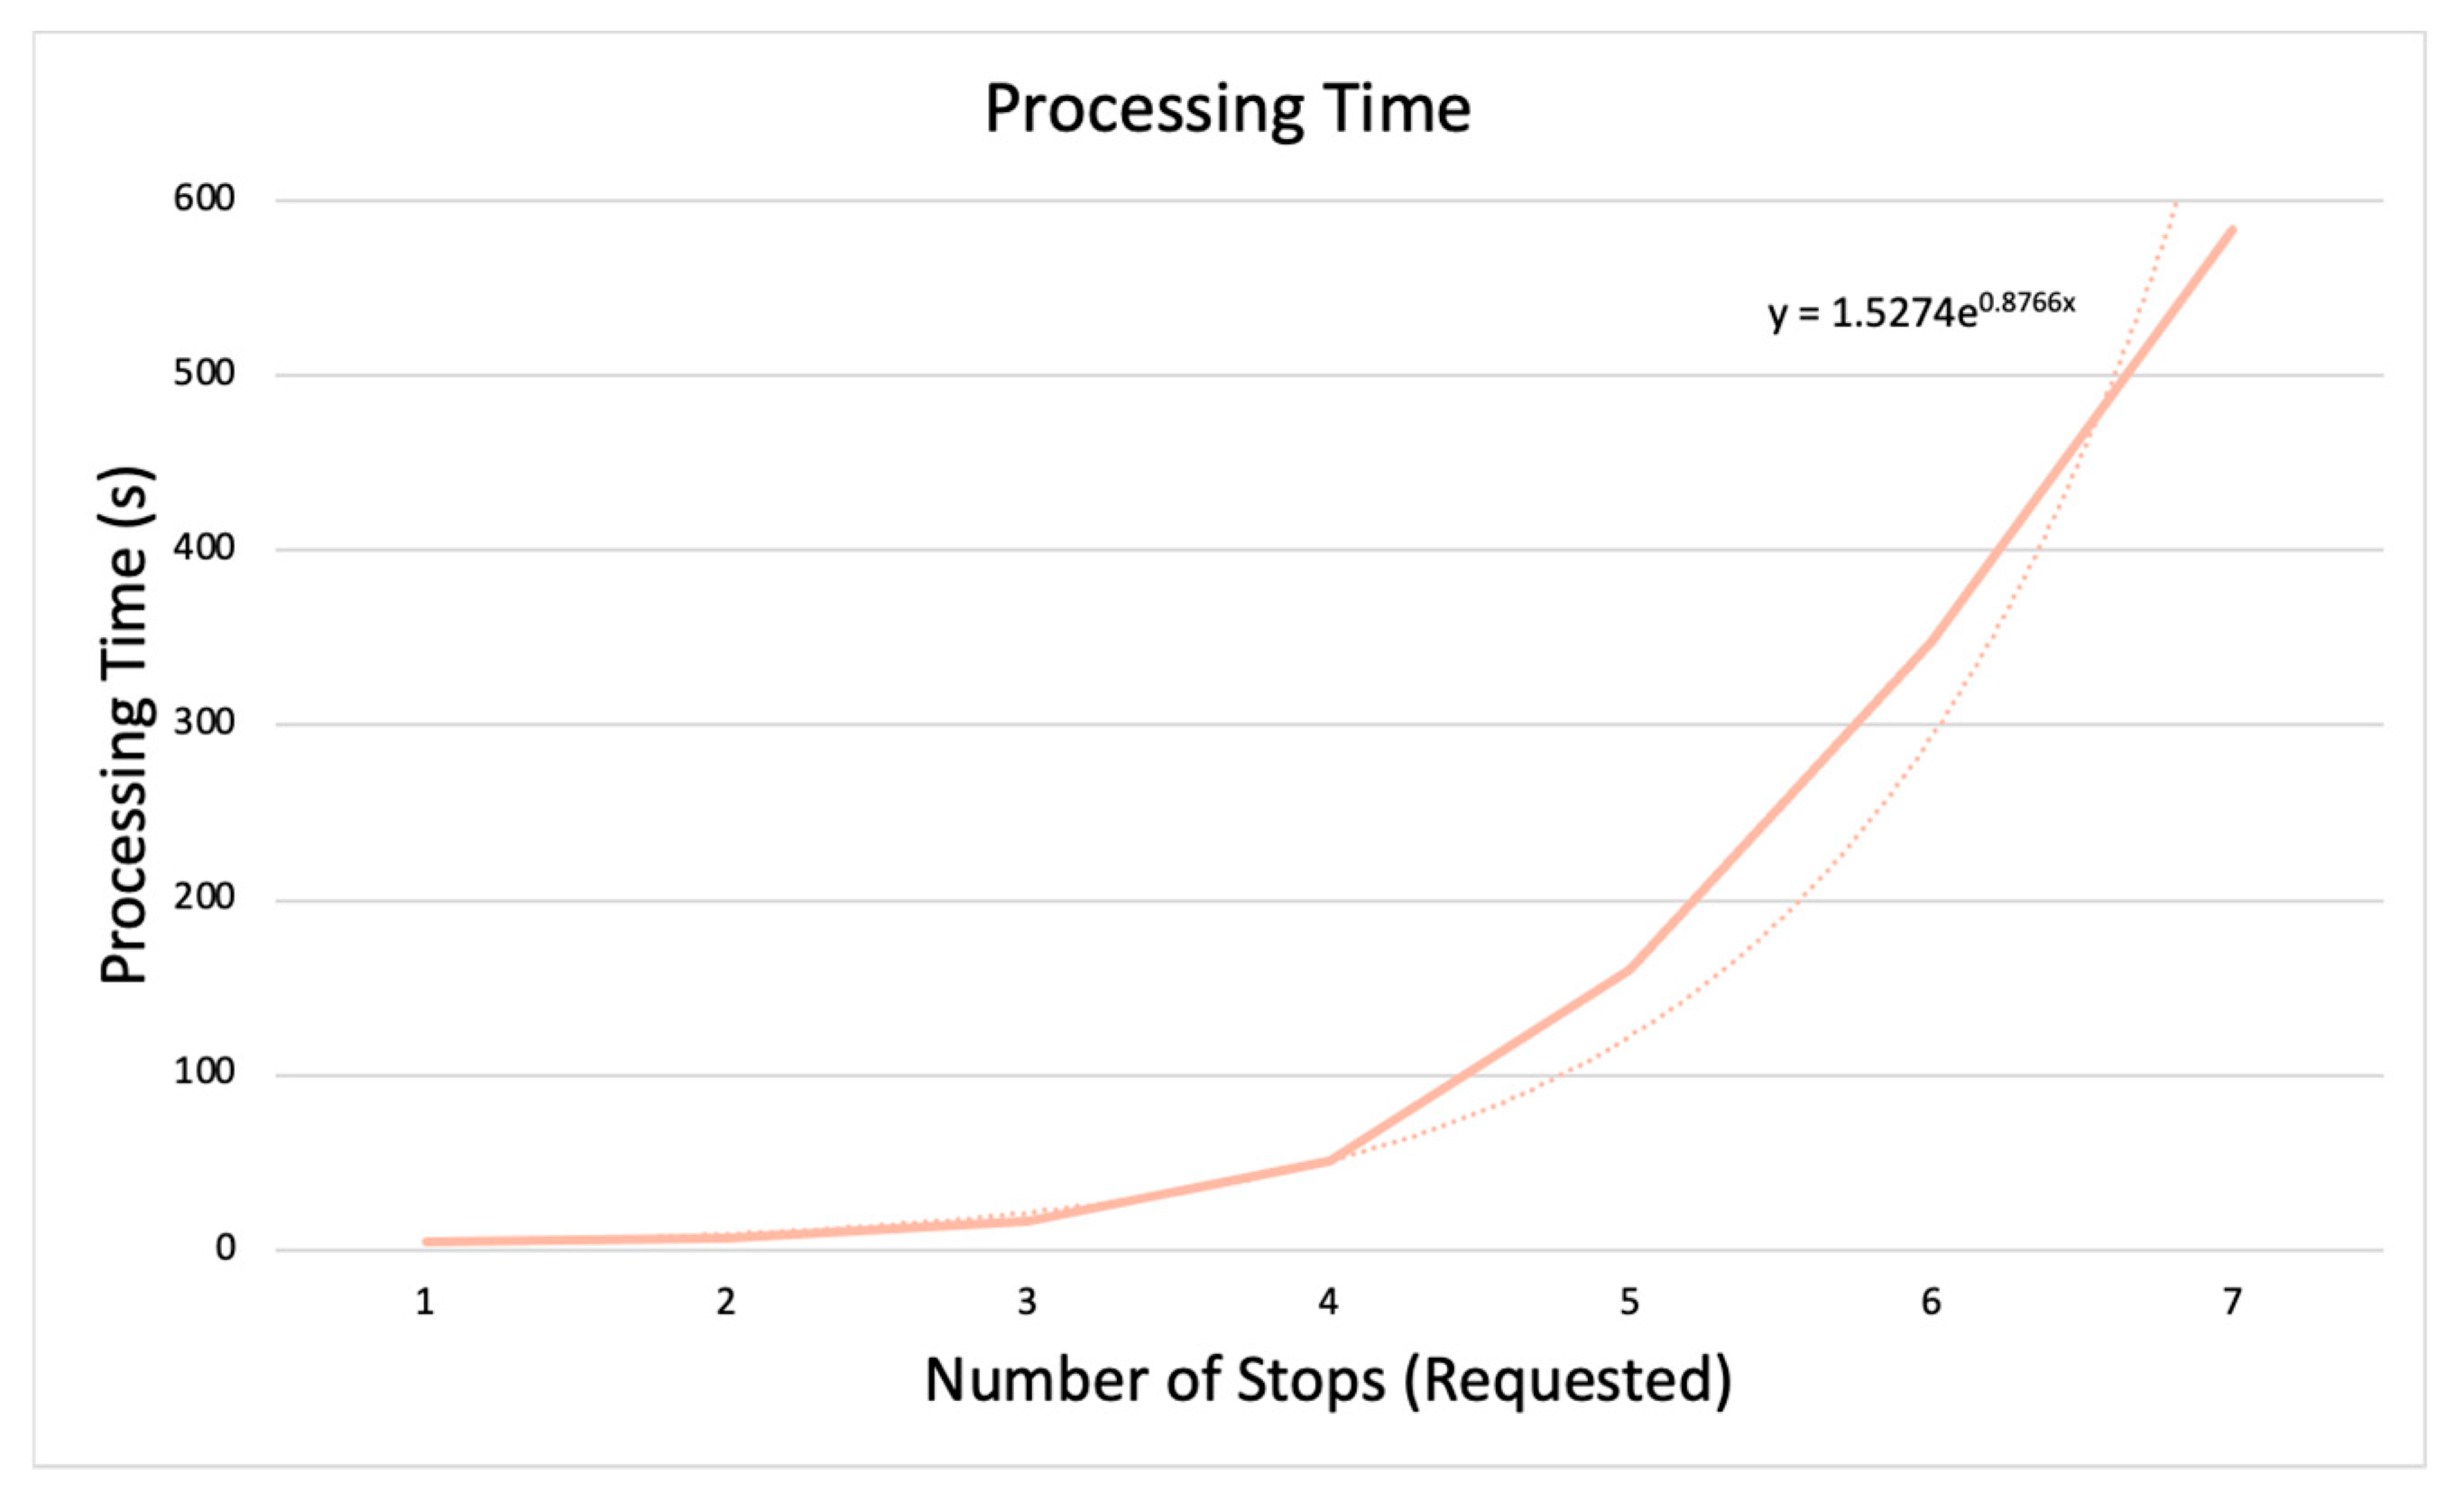
As shown in Figure 12, the processing time that used in defining the itinerary plan for the tourists. As seen in the figure, the relationship between the number of requested stops and the processing time is exponential with the following linear equation y = 1.5274   e 0.8766 x . According to this result, the best tourism stops from the point of view processing time is 4 stops. This statement is in accordance with the simulation result as shown in Figure 10. Based on the simulation, the system recommends 4 stops for the limited time that is set in the study.

5. Conclusions

This paper proposed the recommender system for tourist itineraries by approaching the Vehicle Routing Problem based on the Time Windows (VRPTW). In order to reach the objectives, the system is divided into several steps, namely: (1) road information gathering; (2) road weight calculation using Analytics Hierarchy Process (AHP) based on preferences; and (3) constructing the tourist’s itinerary plan by using VRPTW. The result of this paper is the itinerary plan for tourists based on time aspects, such as opening, travel, closing time, and time spent in each tourism spot.
At first, the criteria weight is determined based on the preferences of the drivers or tourists. The preferences are checked to find the comparison consistency. By the time it's consistent, the collaborated road weight is defined by processing the criteria with its weights. By using the road weight, the optimal route between destinations is measured, including the initial departure and final arrival points. Later, these optimal routes for each node are used as the basis of the generation of itineraries for tourists.
The simulation result shows that the optimal number of visited tourism stops is 4 destinations. The differences in requesting 4 and 5 destinations show the needs processing time is 3 times longer although it delivers the same results. On the other hand, the usage of computational resources (CPU and Memory) tends to be stable for all simulations of the requested number of visited tourism spots. For various numbers of requested stops, it takes 31.8% and 61.9% for average CPU and Memory Usage respectively. For the time processing, it increases exponentially as the increment of number of requested stops.
For further research, the opportunity to use a prediction system for traffic congestion could be implemented to estimate the time travel between tourism spots. Lots of machine learning methods are suitable for predicting traffic conditions using several criteria. Even more, the optimal itinerary plan can be determined by calculating the best departure time to the destinations to the recommendation system proposed in this paper.

Author Contributions

Conceptualization, S.M.N., R.R.S., and F.A.; methodology, S.M.N.; software, S.M.N.; validation, S.M.N. and R.R.S.; formal analysis, S.M.N.; investigation, S.M.N. and R.R.S.; resources, F.A.; data curation, S.M.N.; writing—original draft preparation, S.M.N.; writing—review and editing, R.R.S. and F.A..; visualization, S.M.N.; supervision, S.M.N.; project administration, R.R.S.; funding acquisition, S.M.N. All authors have read and agreed to the published version of the manuscript.

Funding

This work is funded by The Ministry of Education, Culture, Research, and Technology, Republic of Indonesia (Kementrian Pendidikan, Kebudayaan, Riset, dan Teknologi, Kemdikbudristek) via DRTPM 2023 under the contract number 003/SP2H/RT-MONO/LL4/2023, 346/PNLT2/PPM/2023.

Data Availability Statement

The traffic condition dataset collected during the current study is available online, http://dx.doi.org/10.6084/m9.figshare.24778215 (access on 9 December 2023).

Acknowledgments

This work is funded by The Ministry of Education, Culture, Research, and Technology, Republic of Indonesia (Kementrian Pendidikan, Kebudayaan, Riset, dan Teknologi, Kemdikbudristek) via DRTPM 2023.

Conflicts of Interest

The authors declare no conflict of interest. The funders had no role in the design of the study; in the collection, analyses, or interpretation of data; in the writing of the manuscript; or in the decision to publish the results.

References

  1. Nasution, S.M.; Husni, E.; Kuspriyanto, K.; Yusuf, R. Heterogeneous Traffic Condition Dataset Collection for Creating Road Capacity Value. Big Data Cogn. Comput. 2023, 7. [Google Scholar] [CrossRef]
  2. Disparbudbandungbarat INFORMASI DESTINASI WISATA DI SEKITAR KABUPATEN BANDUNG BARAT Available online:. Available online: https://s1-tk.cc/wisatakbb (accessed on 5 December 2023).
  3. Gunawan, R.D.; Napianto, R. Implementation of Dijkstra ’ S Algorithm in Determining the Shortest Path ( Case Study : Specialist Doctor Search in Bandar Lampung ). Int. J. Inf. Syst. Comput. Sci. 2019, 3, 98–106. [Google Scholar]
  4. Herlawati, H.; Atika, P.D.; Yusuf, A.Y.P.; Khasanah, F.N.; Retnoningsih, E.; Sanusi, B.A.; Wakhid, G.H. Android-Based Shortest Path Finding Using A-Star (A*) Algorithm in Bekasi City. PIKSEL Penelit. Ilmu Komput. Sist. Embed. Log. 2021, 9, 197–210. [Google Scholar] [CrossRef]
  5. CHOOSUMRONG, S.; RAGHAVAN, V.; BOZON, N. Multi-Criteria Emergency Route Planning Based on Analytical Hierarchy Process and PgRouting. Geoinformatics 2012, 23, 159–167. [Google Scholar] [CrossRef]
  6. Xiang, Q.J.; Ma, Y.F.; Lu, J. Optimal Route Selection in Highway Network Based on Travel Decision Making. IEEE Intell. Veh. Symp. Proc. 2007, 1266–1270. [Google Scholar] [CrossRef]
  7. Nasution, S.M.; Husni, E.; Kuspriyanto, K.; Yusuf, R. Personalized Route Recommendation Using F-AHP-Express. Sustain. 2022, 14, 1–28. [Google Scholar] [CrossRef]
  8. Saaty, T.L. Decision Making With The Analytic Hierarchy Process. Int. J. Serv. Sci. 2008, 1, 83–98. [Google Scholar] [CrossRef]
  9. He, S. Research on Tourism Route Recommendation Strategy Based on Convolutional Neural Network and Collaborative Filtering Algorithm. Secur. Commun. Networks 2022, 2022. [Google Scholar] [CrossRef]
  10. Zheng, Y.T.; Yan, S.; Zha, Z.J.; Li, Y.; Zhou, X.; Chua, T.S.; Jain, R. GPSView: A Scenic Driving Route Planner. ACM Trans. Multimed. Comput. Commun. Appl. 2013, 9, 1–18. [Google Scholar] [CrossRef]
  11. Zakariya, K.; Haron, R.C.; Tukiman, I.; Rahman, S.A.A.; Harun, N.Z. Landscape Characters for Tourism Routes: Criteria to Attract Special Interest Tourists to The Kuala Selangor - Sabak Bernam Route. J. Malaysian Inst. Planners 2020, 18, 430–441. [Google Scholar] [CrossRef]
  12. Kiruthika, R.; Yiping, L.; Laohakangvalvit, T.; Sripian, P.; Sugaya, M. Recommendation of Sustainable Route Optimization for Travel and Tourism; Springer Nature Switzerland, 2023; Vol. 14048 LNCS. ISBN 978303135 6773.
  13. Malik, S.; Kim, D.H. Optimal Travel Route Recommendation Mechanism Based on Neural Networks and Particle Swarm Optimization for Efficient Tourism Using Tourist Vehicular Data. Sustain. 2019, 11. [Google Scholar] [CrossRef]
  14. Braekers, K.; Ramaekers, K.; Van Nieuwenhuyse, I. The Vehicle Routing Problem: State of the Art Classification and Review. Comput. Ind. Eng. 2016, 99, 300–313. [Google Scholar] [CrossRef]
  15. Kallehauge, B.; Larsen, J.; Madsen, O.B.G.; Solomon, M.M. Vehicle Routing Problem with Time Windows. Column Gener. 2005, 67–98. [Google Scholar]
  16. El-Sherbeny, N.A. Vehicle Routing with Time Windows: An Overview of Exact, Heuristic and Metaheuristic Methods. J. King Saud Univ. - Sci. 2010, 22, 123–131. [Google Scholar] [CrossRef]
  17. Priyo Anggodo, Y.; Kartika Ariyani, A.; Khaerul Ardi, M.; Firdaus Mahmudy, W. Optimization of Multi-Trip Vehicle Routing Problem With Time Windows Using Genetic Algorithm. J. Enviromental Eng. Sustain. Technol. 2016, 3, 92–97. [Google Scholar] [CrossRef]
  18. Vargas-Munoz, J.E.; Srivastava, S.; Tuia, D.; Falcao, A.X. OpenStreetMap: Challenges and Opportunities in Machine Learning and Remote Sensing. IEEE Geosci. Remote Sens. Mag. 2021, 9, 184–199. [Google Scholar] [CrossRef]
  19. TomTom REAL TIME & HISTORICAL TRAFFIC TomTom Delivers a Unique Proposition.
  20. Open Weather.
  21. George, B.; Kim, S. Spatio-Temporal Networks Modeling and Algorithms; SpringerBriefs in Computer Science, 2013.
  22. Liu, Z.; Zhang, W.; Gao, X.; Meng, H.; Tan, X.; Zhu, X.; Xue, Z.; Ye, X.; Zhang, H.; Wen, S.; et al. Robust Movement-Specific Vehicle Counting at Crowded Intersections. IEEE Comput. Soc. Conf. Comput. Vis. Pattern Recognit. Work. 2020, 2020, 2617–2625. [Google Scholar] [CrossRef]
  23. Das, P.; Ribas-Xirgo, L. Parameter Estimation for Optimal Path Planning in Internal Transportation. CoRR 2018, abs/1808.0, 1–11. [Google Scholar]
  24. Qu, Y.; Li, L.; Liu, Y.; Chen, Y. Travel Routes Estimation in Transportation Systems Modeled by Petri Nets. IEEE Int. Conf. Veh. Electron. Saf. 2010, 73–77. [Google Scholar]
  25. Safira, E.; Khuluqi, F.S. Analisis Tingkat Kemacetan dan Faktor Penyebab Kemacetan Lalu Lintas Di Jalan Sultan Hamid Ii Kecamatan Pontianak Selatan. Georeference J. Kaji. Ilmu dan Pendidik. Geogr. Univ. Tanjungpura 2023, 1, 36–43. [Google Scholar] [CrossRef]
  26. Yang, Z.S.; Cai, C.Q.; Bao, L.X. Intelligent In-Vehicle Control and Navigation Based on Multi-Route Traffic Optimization. Proc. 2006 Int. Conf. Mach. Learn. Cybern. 2006, 2006, 962–966. [Google Scholar] [CrossRef]
  27. Ge, Y.; Li, H.; Tuzhilin, A. Route Recommendations for Intelligent Transportation Services. IEEE Trans. Knowl. Data Eng. 2021, 33, 1169–1182. [Google Scholar] [CrossRef]
  28. Nasution, S.M.; Husni, E.; Kuspriyanto, K.; Yusuf, R.; Yahya, B.N. Contextual Route Recommendation System in Heterogeneous Traffic Flow. Sustain. 2021, 13. [Google Scholar] [CrossRef]
  29. Manual Kapasitas Jalan Indonesia; PT. Bina Karya (Persero), 1997.
  30. Peraturan Menteri Perhubungan No: KM 14 Tahun 2006 Tentang Manajemen Dan Rekayasa Lalu Lintas Di Jalan.
  31. Aziz, A.; Nasution, S.M.; Setianingsih, C. Analysis Simple Additive Weighting and Genetic Algorithm for Traffic Management System. Int. J. Integr. Eng. 2020, 12, 104–112. [Google Scholar] [CrossRef]
  32. Eltarabishi, F.; Omar, O.H.; Alsyouf, I.; Bettayeb, M. Multi-Criteria Decision Making Methods And Their Applications-- A Literature Review. Proc. Int. Conf. Ind. Eng. Oper. Manag. 2020. [Google Scholar]
  33. Nguyen, H.D.; Lo, W.T.; Sheu, R.K. An AHP-Based Recommendation System for Exclusive or Specialty Stores. Proc. - 2011 Int. Conf. Cyber-Enabled Distrib. Comput. Knowl. Discov. CyberC 2011 2011, 16–23. [Google Scholar] [CrossRef]
  34. Chandak, M.M.A.; Borkar, P. Review on Optimal Route Guidance Using Analytical Hierarchy Process. Int. Conf. Intell. Syst. Control 2015, 9. [Google Scholar]
  35. Deng, Z.; Wang, J. Multi-Sensor Data Fusion Based on Improved Analytic Hierarchy Process. IEEE Access 2020, 8, 9875–9895. [Google Scholar] [CrossRef]
  36. Shafiq, M. Dynamic Route Optimization for Heterogeneous Agent Envisaging Topographic of Maps. SUMO 2018- Simulating Auton. Intermodal Transp. Syst. 2018, 2, 206–217. [Google Scholar]
  37. Duc, D.N.; Huu, T.T.; Nananukul, N. A Dynamic Route-Planning System Based on Industry 4.0 Technology. Algorithms 2020, 13. [Google Scholar] [CrossRef]
  38. KESKİN, B.; ÖZCAN, E. Floyd-Warshall Algorithm in Shortest Path Optimizations: Example of Logistics Centers. Demiryolu Mühendisliği 2023, 82–92. [Google Scholar] [CrossRef]
  39. Ramadhan, Z.; Putera Utama Siahaan, A.; Mesran, M. Prim and Floyd-Warshall Comparative Algorithms in Shortest Path Problem. 2018, 47–58. [CrossRef]
  40. Candra, A.; Budiman, M.A.; Hartanto, K. Dijkstra’s and A-Star in Finding the Shortest Path: A Tutorial. 2020 Int. Conf. Data Sci. Artif. Intell. Bus. Anal. DATABIA 2020 - Proc. 2020, 28–32. [Google Scholar] [CrossRef]
  41. George, B. Spatio-Temporal Networks: Modeling and Algorithms; 2008; ISBN 9781461449171.
  42. Lanning, D.R.; Harrell, G.K.; Wang, J. Dijkstra’s Algorithm and Google Maps. 2014, 3–5.
  43. Suardinata, S.; Rusmi, R.; Lubis, M.A. Determining Travel Time and Fastest Route Using Dijkstra Algorithm and Google Map. Sistemasi 2022, 11, 496. [Google Scholar] [CrossRef]
  44. Delling, D.; Sanders, P.; Schultes, D.; Wagner, D. Engineering and Augmenting Route Planning Algorithms. Algorithmics of Large and Complex Networks 2009, 5515, 117–139. [Google Scholar]
  45. Galán-Garćía, J.L.; Aguilera-Venegas, G.; Galán-Garćia, M.Á.; Rodríguez-Cielos, P. A New Probabilistic Extension of Dijkstra’s Algorithm to Simulate More Realistic Traffic Flow in a Smart City. Appl. Math. Comput. 2015, 267, 780–789. [Google Scholar] [CrossRef]
  46. Kristina, S.; Doddy Sianturi, R.; Husnadi, R. Application of the Capacitated Vehicle Routing Problem (CVRP) Model Using Google OR-Tools to Map Drug Delivery Routes to Pharmaceutical Wholesale Companies (Penerapan Model Capacitated Vehicle Routing Problem (CVRP) Menggunakan Google OR-Tools Untuk Penen. J. Telemat. 2020, 15, 101–106. [Google Scholar]
  47. Hasibuan, H.S.; Suwilo, S.; Sitompul, O.S. Fleet Size from Split Delivery in Vehicle Routing Problems. J. Phys. Conf. Ser. 2019, 1255. [Google Scholar] [CrossRef]
  48. Toth, P.; Vigo, D. Models, Relaxations and Exact Approaches for the Capacitated Vehicle Routing Problem. Discret. Appl. Math. 2002, 123, 487–512. [Google Scholar] [CrossRef]
  49. Helal, N.; Pichon, F.; Porumbel, D.; Mercier, D.; Lefèvre, É. The Capacitated Vehicle Routing Problem with Evidential Demands. Int. J. Approx. Reason. 2018, 95, 124–151. [Google Scholar] [CrossRef]
  50. Masmoudi, M.A.; Hosny, M.; Koç, Ç. The Fleet Size and Mix Vehicle Routing Problem with Synchronized Visits. Transp. Lett. 2022, 14, 427–445. [Google Scholar] [CrossRef]
  51. Afrizal, F. Penerapan Metode Vehiclea Routing Problem With Time Windows ( VRPTW ) Pada Penentuan Rute Distribusi Ikan Gurami Dan Nila. 2021, 691–697.
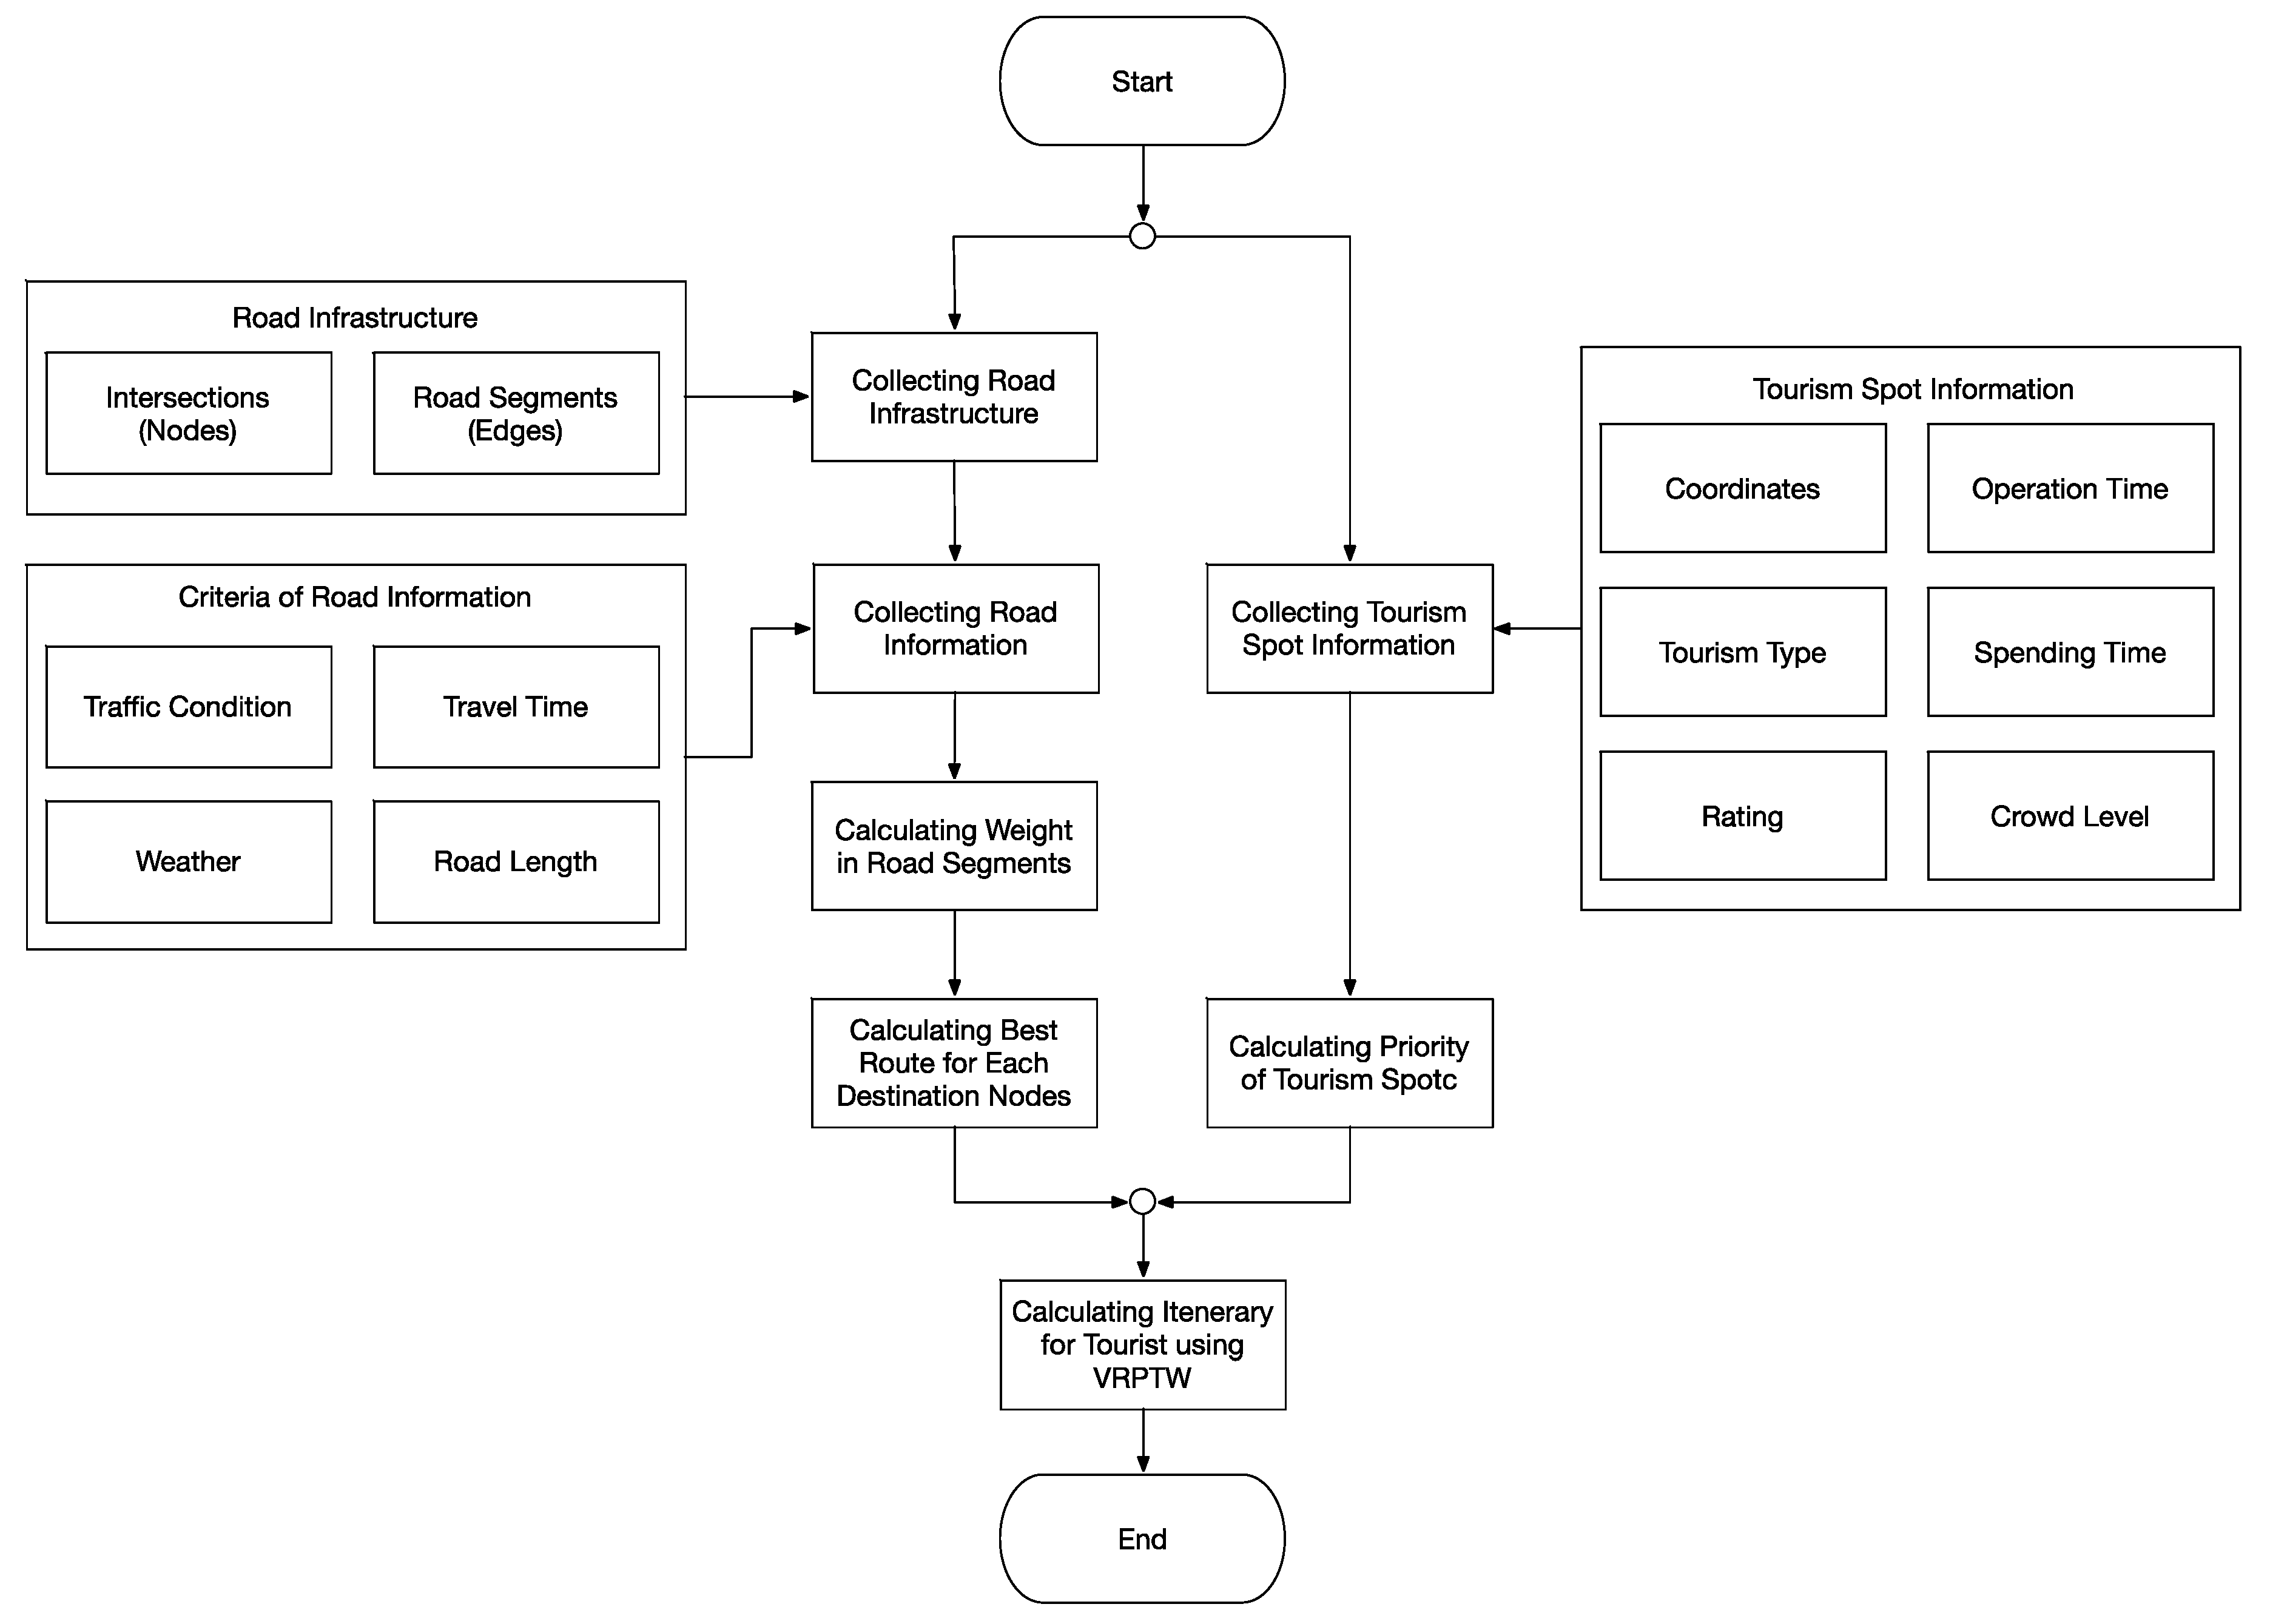
Figure 1. Proposed System.
Preprints 92807 g001
Figure 2. The Observation Areas: (a) Bandung; (b) Lembang.
Preprints 92807 g002
Figure 3. This is a figure. Schemes follow the same formatting. .
Preprints 92807 g003
Figure 4. TomTom Traffic Information Response.
Preprints 92807 g004
Figure 5. The Nodes and Edges on The Observation Area: (a) Bandung; (b) Lembang.
Preprints 92807 g005
Figure 6. Combination Result of The Observation Areas. .
Preprints 92807 g006
Figure 7. Reduced Observation Area based on The Type of The Road. .
Preprints 92807 g007
Figure 8. Sectors for the Collection of Weather Condition.
Preprints 92807 g008
Figure 9. VRPTW Simulation Result for 5 Stops.
Preprints 92807 g009
Figure 10. Comparison of Number Requested and The Calculation Stops.
Preprints 92807 g010
Figure 11. The Computational Resources: (a) CPU Usage (%); (b) Memory Usage (%).
Preprints 92807 g011
Figure 12. The Processing Time for Requested Number of Tourist’s Stops.
Preprints 92807 g012
Table 1. The Information of Observation Area.
Area Latitude Longitude No. of Nodes No. Of Edges
Bandung Min: -6.83693
Max: -6.96987
Min: 107.54499
Max: 107.73983
28,879 68,029
Lembang Min: -6.75604
Max: -6.86499
Min: 107.57134
Max: 107.6610
5,336 12,070
Table 2. Simplification on Weather Information.
Weather Condition Detailed Condition
Dry Clear sky, few, scatter, broken, and overcast clouds
Rain Light, moderate, heavy intensity, very heavy rain, etc.
Table 3. Comparison between Criteria Importance.
Preferences Criteria 1 Criteria 2 Criteria 3 Criteria 4
Criteria 1 1 3 3 5
Criteria 2 1/3 1 1/5 1/3
Criteria 3 1/3 5 1 7
Criteria 4 1/5 3 1/7 1
Table 4. Summation for each Criterion in the same Column.
Criteria 1 Criteria 2 Criteria 3 Criteria 4
Criteria 1 1 3 3 5
Criteria 2 1/3 1 1/5 1/3
Criteria 3 1/3 5 1 7
Criteria 4 1/5 3 1/7 1
Total 1.867 12 4.343 13.333
Table 5. Normalization and Initiation of Criteria Weight.
Criteria 1 Criteria 2 Criteria 3 Criteria 4 Criteria Weight
(Averaged Row)
Criteria 1 0.536 0.250 0.691 0.375 0.463
Criteria 2 0.179 0.083 0.046 0.025 0.083
Criteria 3 0.179 0.417 0.230 0.525 0.338
Criteria 4 0.107 0.250 0.033 0.075 0.116
Table 6. Tourism Spots Information.
Name of Tourism Spots Coordinates Opening Time Closing Time Duration Rating
Farmhouse Lembang -6.832751, 107.605311 32400 72000 10800 4.4
Dusun Bambu -6.789715, 107.579163 36000 72000 10800 4.5
Floating Market Lembang -6.81979, 107.618408 32400 68400 10800 4.5
Tebing Keraton -6.834154, 107.663733 28800 52200 7200 4.5
Gunung Batu Lembang -6.830264, 107.636098 0 86338.8 14400 4.6
Curug Dago Pakar -6.865551, 107.618148 28800 61200 7200 4.1
Taman Begonia -6.826042,107.63835 25200 61200 7200 4.4
Grafika Cikole -6.785136,107.651469 28800 57600 10800 4.4
Kampung Gajah Wonderland -6.829372, 107.595603 28800 64800 14400 4.2
Table 7. Departure and Arrival Location.
Location Coordinates Opening Time Closing Time Duration
Santika -6.907670, 107.611769 25200 72000 0
Table 8. The Calculation of Traffic Conditions Based on TomTom Road Information.
Time Location Current Speed (KpH) Free Flow Speed (KpH) Current Travel Time (s) Free Flow Travel Time (s) Saturation Degree (%) Traffic Condition
(A-F)
06:07:38 (-6.8815738, 107.5787958) 47 61 531 409 68.852 E
06:07:49 (-6.8698634, 107.5814747) 45 61 554 409 78.689 E
06:09:00 (-6.9077766, 107.5723946) 42 60 594 416 90 F
06:12:26 (-6.8656363, 107.5818828) 39 69 649 416 130.435 F
06:12:26 (-6.8641757, 107.5814459) 58 71 306 250 54.93 D
06:43:43 (-6.9348241, 107.6232444) 77 77 1222 1222 0 A
Table 9. Criteria Comparison based on Driver Preferences.
Preferences Route Length Traffic Condition Travel Time Weather
Route Length 1 1/7 1/3 1/2
Traffic Condition 7 1 5 5
Travel Time 3 1/5 1 2
Weather 2 1/5 1/2 1
Total 13.000 1.543 6.833 8.500
Table 10. Normalization and Criteria Weight Initialization.
Preferences Route Length Traffic Condition Travel Time Weather Criteria Weight (Average)
Route Length 0.077 0.093 0.049 0.059 0.069
Traffic Condition 0.538 0.648 0.732 0.588 0.627
Travel Time 0.231 0.130 0.146 0.235 0.186
Weather 0.154 0.130 0.073 0.118 0.119
Table 11. The Calculation of Consistency Ratio.
Preferences Route Length Traffic Condition Travel Time Weather Total Initial
Criteria Weight
Eigen   Value   ( λ
Route Length 0.069 0.090 0.062 0.059 0.280 0.069 4.040
Traffic Condition 0.485 0.627 0.928 0.593 2.632 0.627 4.200
Travel Time 0.208 0.125 0.186 0.237 0.756 0.186 4.074
Weather 0.139 0.125 0.093 0.119 0.475 0.119 4.008
Maximum   Eigen   Value   ( λ m a x ) 4.081
Consistency   Index   ( C I ) 0.027
Consistency   Ratio   ( C R ) 0.030
Table 12. The Best Route Calculation (via Nodes).
Origin Destination Path (via Nodes)
Farmhouse Lembang Floating Market Lembang [8761228379, 5400248699], [5400248699, 5400248696], [5400248696, 305869145], [305869145, 5400248865], [5400248865, 8760931390], [8760931390, 9852588117], [9852588117, 5397880241], [5397880241, 1013572351], [1013572351, 5416066120], [5416066120, 1947081886], [1947081886, 5397880795], [5397880795, 5397880798], [5397880798, 6056551911], [6056551911, 5397880800], [5397880800, 1013572350], [1013572350, 5864608126], [5864608126, 5397880801], [5397880801, 1013572346], [1013572346, 7284311010], [7284311010, 1942487012], [1942487012, 1942486992], [1942486992, 1942486971], [1942486971, 4705498029], [4705498029, 5416066056], [5416066056, 5394799134], [5394799134, 5394799129], [5394799129, 7284426093], [7284426093, 1837534382], [1837534382, 6056725416], [6056725416, 634441870], [634441870, 634442418], [634442418, 634441900], [634441900, 1942487002], [1942487002, 8879877402], [8879877402, 1942487004], [1942487004, 1942486995], [1942486995, 1942486981], [1942486981, 5394792893], [5394792893, 5394799137], [5394799137, 5394799139], [5394799139, 1942486977], [1942486977, 1942486984]
Dusun Bambu Taman Begonia [4119238397, 8410429741], [8410429741, 8759319125], [8759319125, 5852590915], [5852590915, 634454943], [634454943, 5852590936], [5852590936, 8408198279], [8408198279, 6386090342], [6386090342, 9854874644], [9854874644, 7353097673], [7353097673, 3671288846], [3671288846, 4247860639], [4247860639, 5287124277], [5287124277, 4247893016], [4247893016, 5356025600], [5356025600, 3470310971], [3470310971, 5356025393], [5356025393, 5356025390], [5356025390, 5287056198], [5287056198, 5356025385], [5356025385, 3987298953], [3987298953, 5357984915], [5357984915, 5356025620], [5356025620, 4247892991], [4247892991, 3987299360], [3987299360, 3987299361], [3987299361, 5287048116], [5287048116, 634455275], [634455275, 634455279], [634455279, 6385344985], [6385344985, 634455292], [634455292, 1947086762], [1947086762, 1947086761], [1947086761, 634455308], [634455308, 3976361389], [3976361389, 7480019079], [7480019079, 5426148707], [5426148707, 5864807973], [5864807973, 3110200349], [3110200349, 5369327473], [5369327473, 3110224312], [3110224312, 3110224316], [3110224316, 3110224319], [3110224319, 3110214291], [3110214291, 6021063501], [6021063501, 3110214304], [3110214304, 3110214932], [3110214932, 3110214949], [3110214949, 3110225041], [3110225041, 1931997172], [1931997172, 6054277318], [6054277318, 5397880753], [5397880753, 1933113076], [1933113076, 3110200563], [3110200563, 5153610086], [5153610086, 5153610098], [5153610098, 634455123], [634455123, 7483750023], [7483750023, 3987325773], [3987325773, 634455134], [634455134, 3987325783], [3987325783, 3987325785], [3987325785, 7301214730], [7301214730, 5397880490], [5397880490, 6142082192], [6142082192, 5416067430], [5416067430, 3987325788], [3987325788, 6142081882], [6142081882, 634455078], [634455078, 5400698452], [5400698452, 677319967], [677319967, 1788598488], [1788598488, 8414325936], [8414325936, 677319946], [677319946, 2852996472], [2852996472, 4119238445], [4119238445, 2852996458], [2852996458, 4551396728], [4551396728, 5862995481], [5862995481, 5287107596], [5287107596, 1013565370], [1013565370, 4119238427], [4119238427, 4119243597], [4119243597, 4119238424], [4119238424, 5397880507], [5397880507, 5397880511], [5397880511, 5287041492], [5287041492, 1013564791], [1013564791, 1107766030], [1107766030, 5287041144], [5287041144, 1933308819], [1933308819, 11171121457], [11171121457, 8086733976], [8086733976, 10166759113], [10166759113, 307949886], [307949886, 5416066397], [5416066397, 5394799158], [5394799158, 8410797345], [8410797345, 1781530227], [1781530227, 5394799171], [5394799171, 5394799173], [5394799173, 5394799159], [5394799159, 5397880499], [5397880499, 1107766302], [1107766302, 9855030754], [9855030754, 5391602954], [5391602954, 1107766141], [1107766141, 1107766071], [1107766071, 5416066209], [5416066209, 8410711531], [8410711531, 5416066207], [5416066207, 5864755177], [5864755177, 5864715427], [5864715427, 1933484679], [1933484679, 634455164], [634455164, 4852689606], [4852689606, 5397463235], [5397463235, 5287049056], [5287049056, 6380695258], [6380695258, 9859714946], [9859714946, 6707385662], [6707385662, 6707385660]
Table 13. Simulation Results of Tourism Itinerary.
Route Path (via Tourism Spot) Rating (avg)
Route – 1 Source → Museum Geologi Bandung → Curug Dago Pakar → Taman Hutan Raya Ir. H. Djuanda → Sink 4.433
Route – 2 Source → Dago Dream Park → Taman Begonia → Floating Market Lembang → Kampung Daun → Sink 4.425
Route – 3 Source → Gunung Batu Lembang → Observatorium Bosscha → The Great Asia Afrika → Farmhouse Lembang → Sink 4.5
Route – 4 Source → Grafika Cikole → De Ranch Lembang → Tebing Keraton → Curug Maribaya → Sink 4.375
Route – 5 Source → Curug Cimahi → DusunBambu → Kampung Gajah Wonderland → Sink 4,267
Table 14. Comparison of Route Calculation Based on Intersection and Travel Time.
Route Total Intersections Total Travel Time (s)
8761228379, 5400248699, 5400248696, 305869145, 5400248865, 8760931390, 9852588117, 5397880241, 1013572351, 5416066120, 1947081886, 5397880795, 5397880798, 6056551911, 5397880800, 1013572350, 5864608126, 5397880801, 1013572346, 7284311010, 1942487012, 1942486992, 1942486971, 4705498029, 5416066056, 5394799134, 5394799129, 7284426093, 1837534382, 6056725416, 634441870, 634442418, 634441900, 634442426, 634442434, 5416065933, 1954824861, 5416066033, 5416065940, 5416065934, 1107504793, 5416066024, 5394792902, 5397880789, 5397880786, 1954824888, 634442384, 634442373, 5287106749, 6411818337, 634442401, 8413725290, 634442394, 634442392, 5394672214, 5409499524, 5409499529, 634442201, 5287068009, 5287068011, 634442111, 634442097, 634442096, 634442018, 634442011, 634442010, 634442004, 634441999, 5287067990, 5400248439, 5864754682 71 838.637
8761228379, 5400248699, 5400248696, 305869145, 5400248865, 8760931390, 9852588117, 5397880241, 1013572351, 5416066120, 1947081886, 5397880795, 5397880798, 6056551911, 5397880800, 1013572350, 5864608126, 5397880801, 1013572346, 7284311010, 1013565673, 1942487012, 1942486992, 1942486971, 4705498029, 5416066056, 5394799134, 5394799129, 7284426093, 1837534382, 6056725416, 634441870, 634442418, 634441900, 634442426, 634442434, 5416065933, 1954824861, 5416066033, 5416065940, 5416065934, 1107504793, 5416066024, 5394792902, 5397880789, 5397880786, 1954824888, 634442384, 634442373, 5287106749, 6411818337, 634442401, 8413725290, 634442394, 634442392, 5394672214, 5409499524, 5409499529, 634442201, 5287068009, 5287068011, 634442111, 634442097, 634442096, 634442018, 634442011, 634442010, 634442004, 634441999, 5287067990, 5400248439, 5864754682 72 839.646
8761228379, 5400248699, 5400248696, 305869145, 5400248865, 8760931390, 9852588117, 5397880241, 1013572351, 5416066120, 1947081886, 5397880795, 5397880798, 6056551911, 5397880800, 1013572350, 5864608126, 5397880801, 1013572346, 7284311010, 1942487012, 1942486992, 1942486971, 4705498029, 5416066056, 5394799134, 5394799129, 7284426093, 1837534382, 6056725416, 634441870, 634442418, 634441900, 634442426, 634442434, 5416065933, 1954824861, 5416066033, 5416065940, 5416065934, 1107504793, 5416066024, 5394792902, 5397880789, 5397880786, 1954824888, 634442384, 634442373, 5287106749, 6411818337, 634442401, 8413725290, 634442394, 7211858967, 5287039849, 5287039852, 5287039854, 5409499940, 5287039866, 1745879005, 10155083344, 5397463221, 1745878903, 1745879025, 1745878961, 5409491286, 6707385598, 5409491284, 1745878973, 1745878962, 634441999, 5287067990, 5400248439, 5864754682 74 924.92
8761228379, 5400248699, 5400248696, 305869145, 5400248865, 8760931390, 9852588117, 5397880241, 1013572351, 5416066120, 1947081886, 5397880795, 5397880798, 6056551911, 5397880800, 1013572350, 5864608126, 5397880801, 1013572346, 7284311010, 1013565673, 1942487012, 1942486992, 1942486971, 4705498029, 5416066056, 5394799134, 5394799129, 7284426093, 1837534382, 6056725416, 634441870, 634442418, 634441900, 634442426, 634442434, 5416065933, 1954824861, 5416066033, 5416065940, 5416065934, 1107504793, 5416066024, 5394792902, 5397880789, 5397880786, 1954824888, 634442384, 634442373, 5287106749, 6411818337, 634442401, 8413725290, 634442394, 7211858967, 5287039849, 5287039852, 5287039854, 5409499940, 5287039866, 1745879005, 10155083344, 5397463221, 1745878903, 1745879025, 1745878961, 5409491286, 6707385598, 5409491284, 1745878973, 1745878962, 634441999, 5287067990, 5400248439, 5864754682 75 925.929
Table 15. The Simulation Result of Various Number of Stops.
Number of Stops Requested Maximum Stops Calculation Itinerary
Recommendations
CPU Usage (%) Memory Usage (%) Processing Time (s)
1 1 18 24.9 65.0 4.881
2 2 9 32.1 64.4 6.621
3 3 6 34.2 64.1 16.549
4 4 5 35.6 63.6 50.855
5 4 5 34.7 64.2 160.412
6 4 5 30.3 59.7 347.895
7 4 5 30.8 52.9 583.106
Disclaimer/Publisher’s Note: The statements, opinions and data contained in all publications are solely those of the individual author(s) and contributor(s) and not of MDPI and/or the editor(s). MDPI and/or the editor(s) disclaim responsibility for any injury to people or property resulting from any ideas, methods, instructions or products referred to in the content.
Copyright: This open access article is published under a Creative Commons CC BY 4.0 license, which permit the free download, distribution, and reuse, provided that the author and preprint are cited in any reuse.
Prerpints.org logo

Preprints.org is a free preprint server supported by MDPI in Basel, Switzerland.

Subscribe

© 2024 MDPI (Basel, Switzerland) unless otherwise stated