Preprint
Article

The Influence of Light Intensity and Duration on the Formation of Primary and Secondary Metabolites in Tea Plant Cell Culture

Submitted:

12 December 2023

Posted:

13 December 2023

You are already at the latest version

Abstract
Tea plants (Camellia sinensis L.) are economically important horticultural crops for industrial use. The drink (tea) obtained from them is used all over the world, and its functional activity is determined by the polyphenols content and composition. Its accumulation is regulated by the action of many environmental factors. This paper presents data on the different intensity (50, 75, and 100 µmol·m−2·s−1) and duration of light exposure on tea plant in vitro cultures. Changes in morphophysiological characteristics, accumulation of carbohydrates and polyphenols, including their monomeric (phenylpropanoids, flavanols) and oligomeric (proanthocyanidins) forms, were studied. The malondialdehyde and photosynthetic pigments (chlorophyll a and b) contents were also analyzed. In the calli grown in light conditions, chloroplasts and anthocyanoplasts formation was noted, which was especially pronounced under the highest illumination intensity. A significant similarity between the growth of callus cultures, the carbohydrates and polyphenols accumulation at 50 and 75 µmol·m−2·s−1 was established. Which wasn’t characteristic of the calli grown at 100 µmol·m−2·s−1. The stress reaction absence in tea callus cultures has been demonstrated, which may be a consequence of the phenolic antioxidants’ accumulation in them. The obtained data evidence that their potential ability to accumulate primary (carbohydrates) and secondary (polyphenols) metabolites depends on the light exposure intensity and duration.
Keywords: 
Subject: 
Biology and Life Sciences  -   Plant Sciences

1. Introduction

The tea plant (Camellia sinensis L.) belongs to economically important horticultural crops, growing in tropical and subtropical latitudes [1]. The product obtained from it (tea) is one of the most consumed functional drinks throughout the world. It has both nutritional and medicinal effects due to its organoleptic properties (taste, flavour) and the presence of biologically active compounds [2].
The tea plant metabolome is represented by many compounds of both primary and secondary metabolism. These are various amino acids (including L-theanine, characteristic of this crop), carbohydrates and lipids (linoleic and linolenic acids), as well as pigments (chlorophylls and carotenoids), vitamins (A, C, E, K and B), resinous substances and organic acids [3,4,5]. Secondary metabolites in tea plants are represented by alkaloids of the purine group (theophylline, theobromine and caffeine), as well as various polyphenols (PCs) [1,5,6]. The PCs content in young tea shoots can reach 30% of dry weight [3]. Their main components are flavanols such as (+)-catechin, (-)-epicatechin, (-)-gallocatechin, (-)-gallocatechin gallate, (-)-epigallocatechin, (-)-epicatechin gallate and (-)-epigallocatechin gallate [3,5]. Tea plants are also characterized by the formation of simple PCs, represented by gallic, p-coumaric and caffeic acids, as well as their derivatives – theogallin and chlorogenic acid [6].
PCs are one of the most common secondary compounds, formed in almost all plant cells, the number of which exceeds 10,000 [7,8]. They are present in plants mainly as monomeric substances and are represented by hydroxybenzoic acids, phenylpropanoids and flavonoids [9]. In addition, PCs oligomers are also formed in plants – proanthocyanidins and lignans, which are derivatives of flavanols (catechins) and phenylpropanoids (coniferyl alcohol), respectively [8]. We should not forget about the phenolic polymer lignin, an important component of plant cell walls [10].
PCs regulate the growth and development of plants, participate in the modulation of phytohormonal signaling, are attractants, and also protect cells from the action of reactive oxygen species (ROS), the amount of which increases under stress [7,8,11]. The protective function of these specialized metabolites is due to the ability to directly interact with free radicals, as well as modulate the signaling cascade caused by their action [8,12]. There is numerous data on the antioxidant activity of various PCs, as well as on an increase in their accumulation in plants under stress conditions [7,8,11].
It should also be emphasized that the antioxidant properties of plant PCs are preserved even when they enter the human body with food [2,13]. There is evidence that the consumption of flavonoids in effective amounts reduces the risk of pathogenesis caused by oxidative stress and chronic inflammatory processes [14]. They are promising in the treatment of diseases associated with obesity, as well as in the fight against infectious and viral diseases, including COVID-19 [8,15]. The significant role of PCs for the prevention of cardiovascular diseases, atherosclerosis, diabetes mellitus, and cancer has been noted [1,13]. All this confirms the need to study these representatives of specialized metabolism, search for producing plants, as well as factors regulating their formation.
One of the most important regulators of plant growth and development, as well as their metabolism, is light [16,17]. It is necessary for photosynthesis, the formation of energy sources (ATP) and reducing agents (NADPH2), and the regulation of metabolic processes. The important role of light in such key physiological processes as seed germination, photosynthesis, phototropism, opening/closing of stomata, circadian rhythms, flowering induction and others has been noted [17,18,19].
When exposed to light, the macro- and microelement composition of plants changes, carbohydrate and nitrogen metabolism is stimulated, the functioning of the antioxidant system is activated, including the accumulation of PCs – some of their effective bioantioxidants [9,17,20]. At the same time, the intensity and duration of the light exposure, as well as its spectral composition, are important [16]. It was reported that its high intensity activated the genes of antioxidant protection of cells and initiated the biosynthesis of biologically active compounds and antioxidants, including flavonoids – effective protectors of plants [20]. At the same time, the accumulation of flavonol glycosides in tea plants was more dependent on the intensity of light exposure compared with the accumulation of catechins [21]. The effect of red, blue, green light, as well as UV-B rays on the content of various PCs in in vivo and in vitro plant cells has also been reported [17,22].
It should be emphasized that under natural growing conditions, plants are exposed to white light with photosynthetically active wavelengths in the range of 380–750 nm [21]. Consequently, they have mechanisms for reducing its potentially destructive (photoinhibitory) effect, including through the accumulation of PCs. It was reported that light promoted the expression of genes for key enzymes of phenolic metabolism – L-phenylalanine ammonia-lyase, 4-coumarate-CoA ligase and chalcone synthase [23]. There was a synergism between the activity of genes associated with gallic acid biosynthesis and the photosynthetic ability of C. sinensis cells under high light conditions. It was found that the increase in the amount of (-)-epigallocatechin gallate is due not only to an enhance in the content of its precursors, but also to up-regulation of the CsSCPL gene, responsible for the activity of the SCPL enzyme (serine carboxypeptidase-like acetyltransferase), involved in the process of galloylation of flavan-3-ols [24]. All this indicates the possibility of directed light regulation of the accumulation of various PCs in plants.
Today, the possibilities for the replenishable use of phytocenoses as sources of pharmacologically valuable metabolites are limited [25]. There are also environmental restrictions on the use of plants producing PCs due to the impact of technogenic factors on them. All this necessitated the use of other technological approaches in obtaining plant raw materials. These include biotechnological methods that provide continuous, cost-effective production for the food, pharmaceutical, and nutraceutical industries [26]. And in this case, the culture of plant cells and tissues can be considered as the main platform for the production of secondary metabolites, including PCs [27]. It is characterized by the following advantages: growth in controlled conditions; absence of restrictions in the action of seasonal, climatic and geographical factors; preservation of the ability to form metabolites characteristic of intact plants and the possibility of modulating their biosynthesis by different exogenous influences. The accumulation of various specialized metabolites, such as picrosides, phenylpropanoids (rosmarinic, caffeic and chicoric acid) and flavonoids (rutin, isoquercetin, cyanidin, peonidin), was noted for various in vitro plant cultures [28,29]. Tea calli also retained the ability to accumulate PCs, including flavanols, which are characteristic of the original explants [30]. Interest in these metabolites is due to their P-vitamin capillary-strengthening activity. The main representatives of the tea phenolic complex are (+)-catechin and (-)-epicatechin, as well as oligomers of phenolic nature – proanthocyanidins, mainly procyanidin B1 [31].
Consequently, tea callus cultures represent the unique object for studying the effect of various exogenous factors on the monomeric and oligomeric PCs accumulation.
In this study, for the first time the influence of different intensity and duration of light exposure on in vitro cultures of C. sinensis was studied. For this purpose, researches were carried out on the morphophysiological characteristics, accumulation of carbohydrates, various polyphenols, including their monomeric (phenylpropanoids, flavanols) and oligomeric (proanthocyanidins) forms, the content of malondialdehyde and photosynthetic pigments (chlorophyll a and b) during the cultivation period. According to the data obtained, using different intensity and duration of light exposure, it is possible to regulate the productivity of tea plant cells in relation to the accumulation of primary (carbohydrates) and secondary (various PCs) metabolites.

2. Materials and Methods

2.1. Plant Material and General Growth Conditions

The object of the study was callus cultures grown in vitro, obtained from the stem of young shoots of a tea plant (Camellia sinensis L., Georgian variety). For their growth, Heller's nutrient medium [32] containing 2,4-dichlorophenoxyacetic acid (5 mg L-1), glucose (25 g L-1) and agar [Bacto Agar Typ USA, Ferak, Berlin, Germany] (7 g L-1) was used [30]. Calli were grown in a growth cabinet at the IPP RAS at +26 °С, relative air humidity 70%, in the dark.
During the experiment, tea calluses were placed in sterile Petri dishes (Medpolymer, Russia) containing 30 ml of growth medium with the same composition. Six calluses were placed in each cup, the weight of each was 150-180 mg. Cultures were grown in the growth cabinet at 16/8 h photoperiod and different light intensity: 50 µmol·m-2·s-1, 75 µmol·m-2·s-1 и 100 µmol·m-2·s-1 (L1, L2 and L3 variants, respectively) (Figure S1). To do this, the racks located at different distances from Philips TL–D 58 W/33-640 fluorescent white lamps (Bielsko-Biała, Poland) were used. The light intensity was controlled by LI-190R Quantum Sensor (LI-COR, Lincoln, Nebraska, USA).
The subcultivation duration was 40 days. Sampling was carried out every 10 days (the 10th, 20th, 30th and 40th days of culture growth). The material for biochemical studies was fixed with liquid nitrogen and stored at ˗70 °С until determinations were carried out.

2.2. Determination of Morphological Parameters of Tea Callus Cultures

The morphology of tea callus cultures grown at different light intensities was assessed according to the following criteria: color, density, and the presence of pigments [33]. Lateral sections of calluses were viewed on a SteReo LumarV12 stereoscopic microscope (Carl Zeiss, Jena, Germany). Photos were taken using a Nikon COOLPIX P600 camera (Tokyo, Japan).

2.3. Determination of Tea Callus Culture Growth

The growth of callus tissue was assessed by the change in fresh weight over the study period and expressed as a percentage [34]. To do this, the callus weight was determined at the beginning and at the end of subcultivation (sampling periods for analysis).

2.4. Determination of the Water Content in Tea Callus Cultures

To determine the water content, the calluses (150 mg fresh weight (FW) each) were dried (BD-115 thermostat, Binder, Tuttlingen, Germany) to a constant weight (+70 °C, 48 h). The water content was determined by the difference between its FW and dry weight (DW) and expressed as a percentage of the water content in the callus [35].

2.5. Determination of the Soluble Carbohydrates Content in Tea Callus Cultures

To extract soluble carbohydrates, tea callus samples frozen in liquid nitrogen (50 mg FW each) were homogenized in mortar and pestle with 96% ethanol [36]. After heating the homogenate at +70 °C in the dark for 1 hour, the supernatant liquid was separated (12,000 g, 5 min) and used for spectrophotometric determination of the total soluble carbohydrates content by reaction with phenol and sulfuric acid [37]. The carbohydrates content was expressed in mg sucrose equivalents (SE) per gram of DW (mg SE·g-1 DW) using a four-point calibration curve of the sucrose standard (Acros Organics, Geel, Belgium).

2.6. Extraction of Phenolic Compounds from Tea Callus Cultures

To extract PCs from frozen and crushed in liquid nitrogen calluses (50 mg FW each), 96% ethanol (1,5 mL) was extracted at 45 °C (Gnom thermostat, Russia) for 40 minutes [36]. The homogenate was centrifuged (12,000 g, 5 min) and the supernatant was used for spectrophotometric determination (spectrophotometer Specord M40, Carl Zeiss, Jena, Germany) of the various PCs classes content.

2.7. Determination of the Total Phenolics Content in Tea Callus Cultures

The determination of the total PCs content in ethanol extracts of callus tissues was carried out using the Folin–Ciocalteu reagent (Panreac, Barcelona, E.U.) according to our modified method [38]. During the determinations, the reaction mixture contained 0.075 mL of callus tissues’ ethanol extract, 0.075 mL of Folin–Ciocolteu reagent, 0.15 mL of 20% Na2CO3 (w/v) and 1.20 mL of distilled water. The mixture was stirred and incubated for 45 min in the dark at room temperature. The absorption of the product formed in the reaction (tungsten blue or heteropolyblue) was measured on a spectrophotometer (Specord M40, Carl Zeiss, Jena, Germany) at 725 nm [39]. Results were expressed as mg of gallic acid equivalents (GAE) per g of DW (mg GAE·g-1 DW) using a four-point calibration curve of the gallic acid standard (Serva, Heidelberg, Germany).

2.8. Determination of the Phenylpropanoids Content in Tea Callus Cultures

The phenylpropanoids content was evaluated by direct spectrophotometry of callus tissues’ ethanol extracts at 330 nm (spectrophotometer Specord M40, Carl Zeiss, Jena, Germany), due to the characteristic absorption of these substances in the UV region of the spectrum [40]. As control there was used 96% ethanol. The results were expressed in mg of caffeic acid equivalents (CAE) per g of DW (mg CAE·g-1 DW) using a four-point calibration curve of the caffeic acid standard (Serva, Heidelberg, Germany).

2.9. Determination of the Flavanols Content in Tea Callus Cultures

The flavanols content was determined with a vanillin reagent, which is a 1% vanillin (Merck, Darmstadt, Germany) in 70% sulfuric acid [41,42]. During the determinations, the reaction mixture contained 0.25 mL of ethanol extract and 1.25 mL of vanillin reagent. The absorption of red adducts formed in this reaction was measured on a spectrophotometer (Specord M40, Carl Zeiss, Jena, Germany) at 500 nm. The results were expressed in mg of epicatechin equivalents (ECE) per g of DW (mg ECE·g-1 DW) using a four-point calibration curve of the (-)-epicatechin standard (Serva, Heidelberg, Germany).

2.10. Determination of the Proanthocyanidins Content in Tea Callus Cultures

Determination of the proanthocyanidins content was carried out with a butanol reagent (n-butanol:HCl, 95:5 v/v) [43]. During the determinations, the reaction mixture contained 0.5 mL of ethanol extract and 1 mL of butanol reagent. The reaction mixture was hydrolyzed for 45 minutes at +95 °C (Gnome thermostat, Russia), cooled, centrifuged (12,000 g, 5 min) and the absorption of anthocyanidins formed in this reaction was determined at 550 nm (spectrophotometer Specord M40, Carl Zeiss, Jena, Germany). The results were expressed in mg of cyanidin equivalents (CE) per g of DW (mg CE·g-1 DW) using a four-point calibration curve of the cyanidin standard (Sigma, USA).

2.11. Determination of the Chlorophyll a and b Content in Tea Callus Cultures

To determine the chlorophyll content, tea calluses (100 mg FW each) were extracted with 96% ethanol [44]. Chlorophylls a and b were determined using an RF-5301PC spectrofluorophotometer (Shimadzu, Tokyo, Japan) at the corresponding excitation and emission wavelengths: for chlorophyll a, λex = 440 nm; λem = 600−800 nm; for chlorophyll b, λex = 460 nm; λem = 600−800 nm. Using the Panorama Fluorescence 3.1 software (Lab Cognition, Japan) , the relative content of chlorophylls a and b was expressed in conventional units of chlorophyll fluorescence intensity [45].

2.12. Determination of the Lipid Peroxidation Level in Tea Callus Cultures

The level of lipid peroxidation in tea callus tissues was determined by the content of malondialdehyde (MDA), using the reaction with thiobarbituric acid (TBA) [46]. For this purpose, callus frozen in liquid nitrogen (200 mg FW each) was homogenized in 5 mL of 0.1 M tris-HCl buffer (pH 7.5) containing 0.35 M NaCl. One mL of a 0.5% solution of TBA in a 20% aqueous solution of trichloroacetic acid was added to the resulting homogenate. The reaction mixture was incubated in a boiling water bath for 30 min, and the optical density of the solution was measured at 532 nm (spectrophotometer Specord M40, Carl Zeiss, Jena, Germany). To calculate the MDA content (µmol·g-1 DW), a molar extinction coefficient of 156 mmol-1·cm-1 was used [47].

2.13. Statistical Analysis

All determinations were carried out in three biological and three analytical replicates. The obtained data was statistically processed using Microsoft Excel 2010 14.0 (Redmond, WA, USA) and SigmaPlot 12.2 (Technology Networks, Sudbury, UK) software. The figures show the arithmetic means ± standard deviations (± SDs). The data statistical analyses were performed using the two-way analysis of variance (ANOVA). Mean separation was performed using Normality Test (Shapiro–Wilk) and all Pairwise Multiple Comparison Procedures (Tukey test). The significant differences at p < 0.05 are denoted by different Latin letters: uppercase letters indicate significant differences between different light intensities in alphabetic order from highest to lowest, lowercase letters indicate significant differences between duration of light exposure in alphabetic order from highest to lowest.

3. Results and Discussion

3.1. Morphological Parameters of Tea Callus Cultures

Morphological characteristics of in vitro plant cultures are the important parameters of their physiological state [48]. According to our data, tea callus cultures, grown at different light intensities, changed depending on duration of exposure (Figure 1).
At the beginning of the light exposure (the 10th day), the calli of all studied variants had similar morphological characteristics. They were compact, quite dense, light beige in color. White cells were located on the surface of the calluses. Their formation is more pronounced in the L1 and L2 variants (Figure 1 and Figure S2). These are "young" cells that are formed after the transfer of callus to a fresh nutrient medium [49]. It is believed that their formation is due to the functional activity of the so-called “meristematic zone” of plant calluses [50].
The further growth of tea calli at different light intensities was accompanied by changes in their morphology. Thus, on the 20th day, in all variants, the formation of cells with a pink color was noted on their surface. Perhaps, this is due to the accumulation of PCs in them such as anthocyanins, the accumulation of which is typical for the young shoots’ leaves of an intact plant [51]. This pigmentation in calli of the L1 variant was not pronounced. Under conditions of higher light intensity (variant L2), which exceeded that of variant L1 by 1.5 times, their formation was more pronounced, which gave some areas a pink-red color. In cultures grown at the highest light intensity (variant L3), which was twice higher than the minimum value, these cells with pink pigmentation were located predominantly in the upper part of the callus. Perhaps this arrangement is due to the functional role of anthocyanins associated with their participation in protecting plant cells from light exposure.
Tea callus cultures grown at different light intensities are also characterized by the formation of chlorophyll-containing cells, as was noted for other in vitro cultures [52]. This process was represented in the greening of individual areas of tea callus and depended on the intensity and duration of light exposure. First of all, it was noted in variant L3 on the 20th day of growth under light conditions, which is not typical for other variants. However, with its prolonged exposure (40 days), the surfaces of all calli acquired a green color of varying intensity: in the variant L1 – light green, in the variant L2 – bright green, in the variant L3 – green-yellowish. Consequently, the formation of chlorophyll-containing cells in tea callus cultures depended on the intensity and duration of exposure to white light, as is typical for plant tissues and organs [52,53].
All of the above indicates that the intensity and duration of light exposure led to changes in the morphology of tea callus cultures. This was manifested in the formation of cells with pink or green pigmentation on their surface, which may indicate the accumulation of anthocyanins and chlorophyll in them, respectively [54]. All these changes were noted already at the beginning of culture growth under light conditions (the 20th day) and continued throughout the entire light exposure period (the 40th day). This once again confirms the regulatory role of light on the processes of cell differentiation and their functional activity, as is typical for the initial stages of plant photomorphogenesis [16].

3.2. Growth of Tea Callus Culture

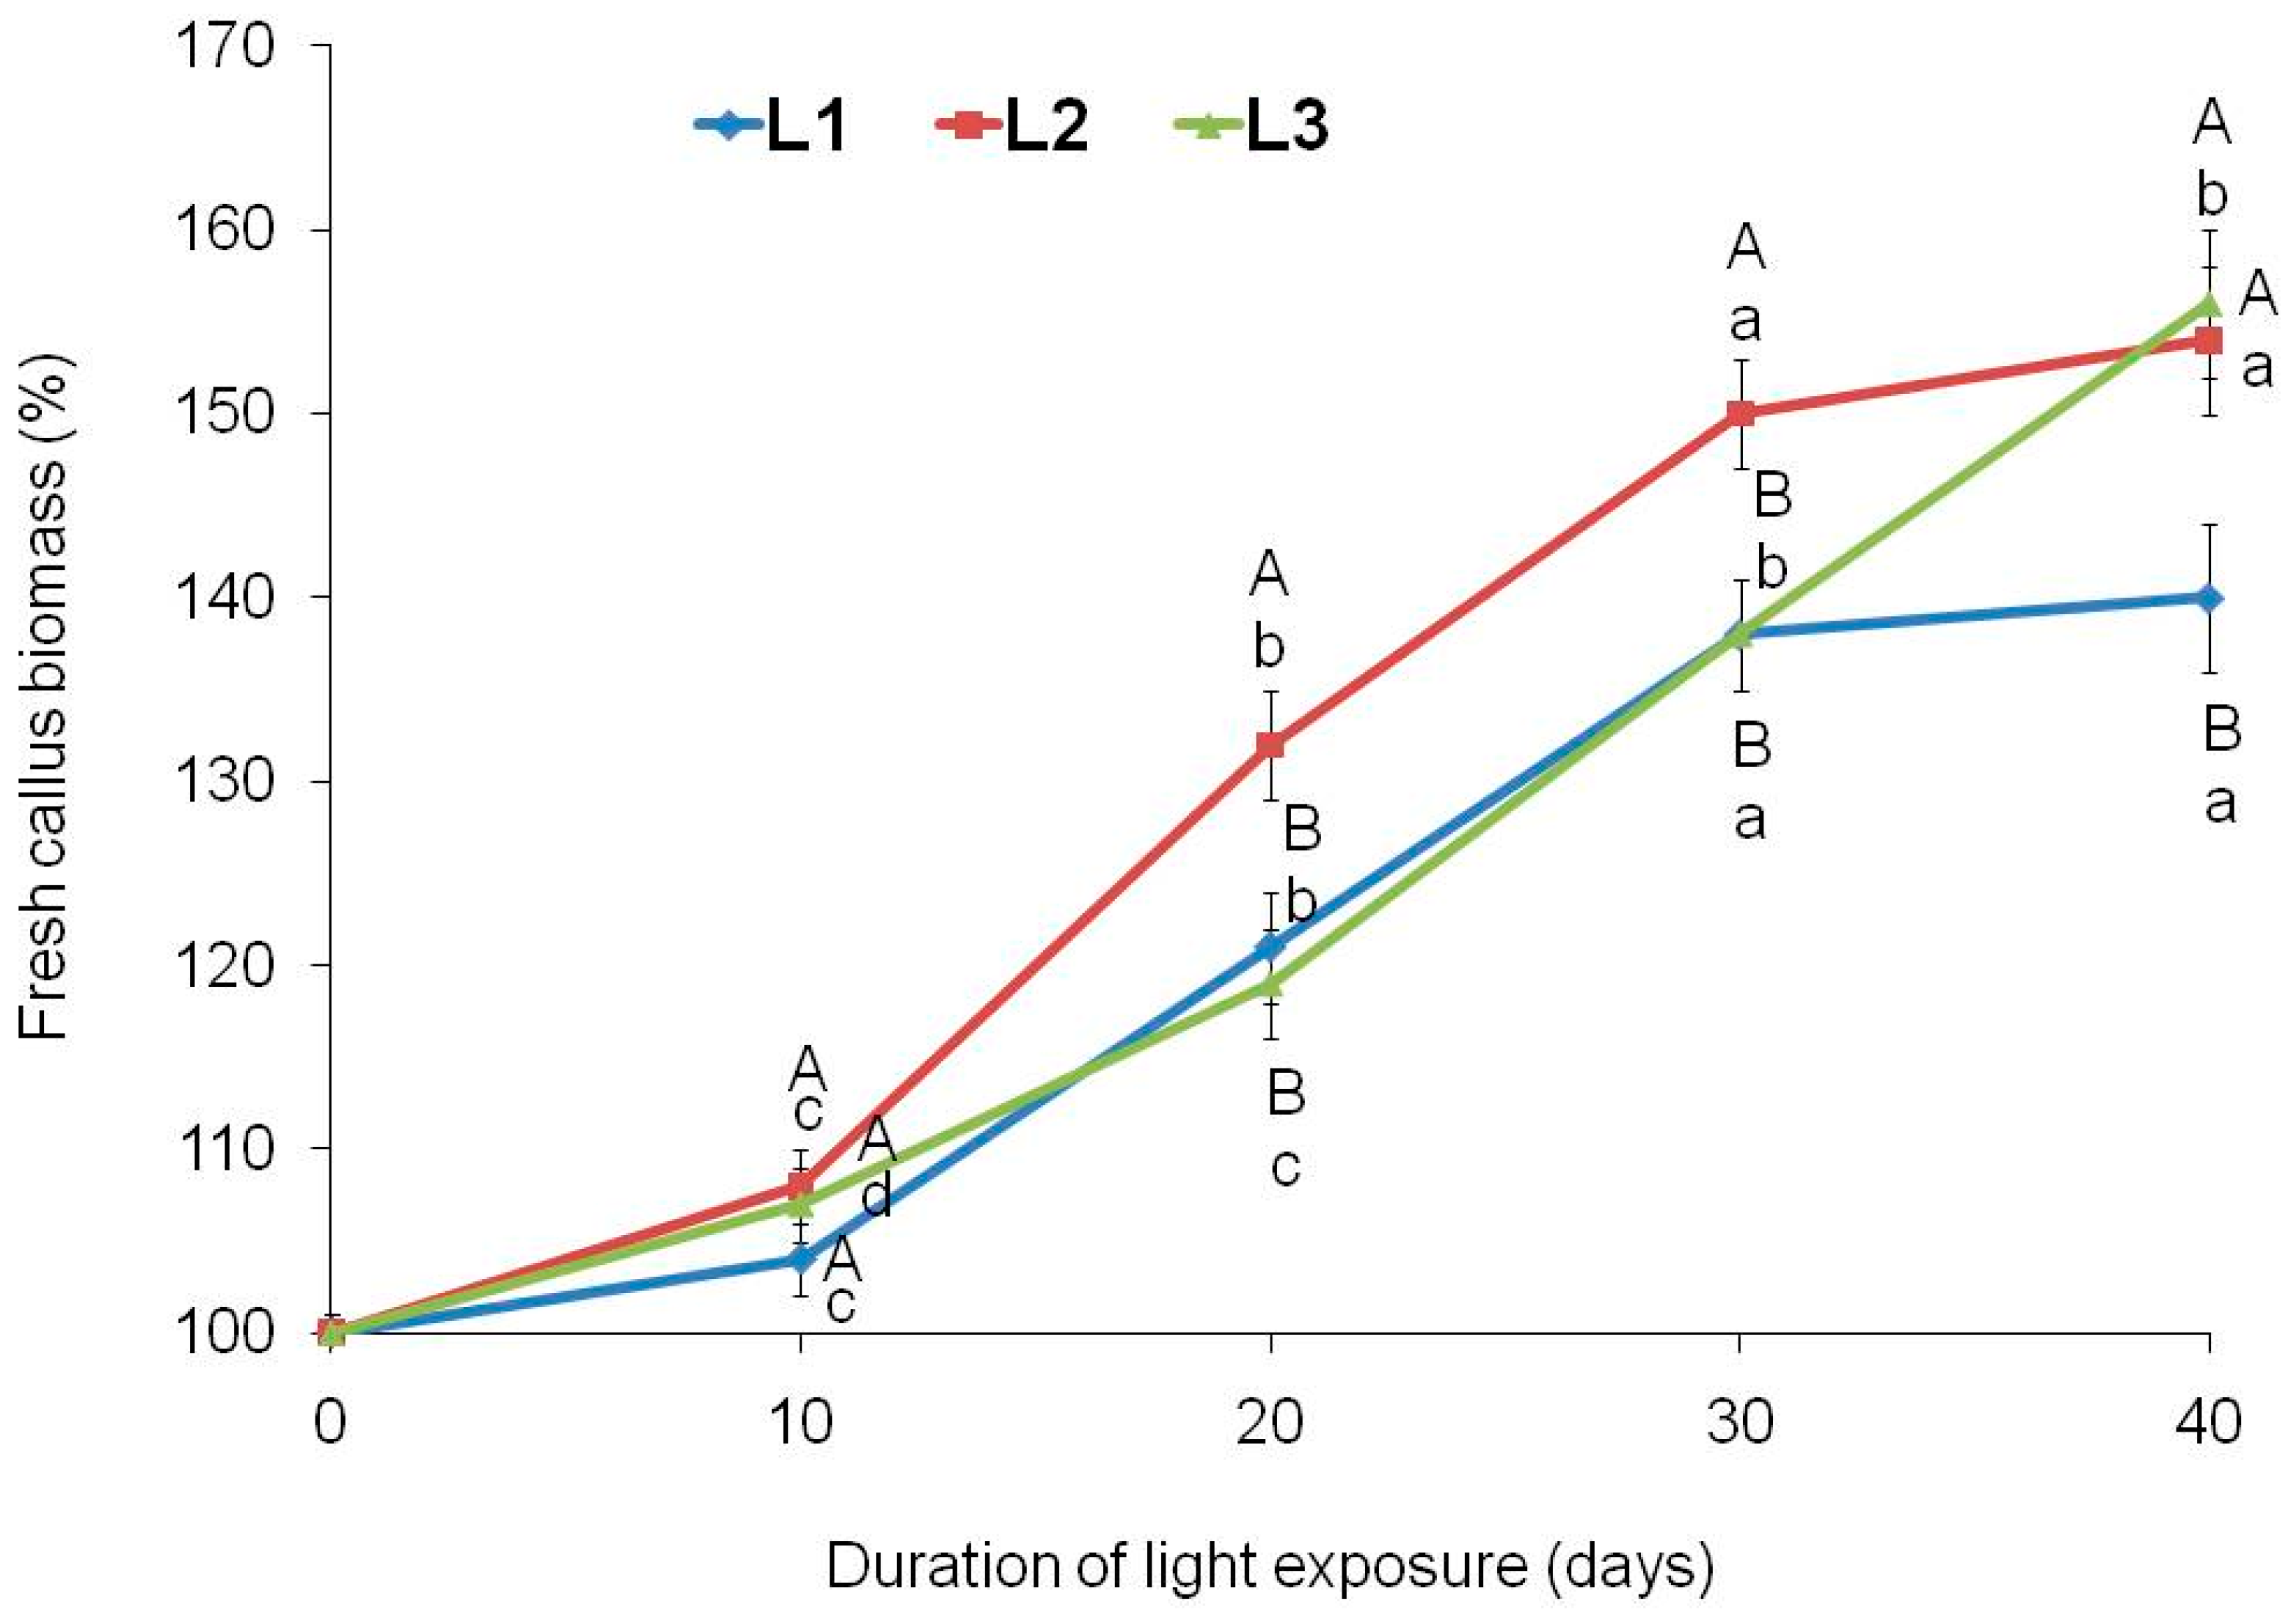
Light is an important factor regulating plant growth both in vivo and in vitro [18,26]. As noted above, its intensity and duration effect influenced the tea callus cultures morphology. This was a consequence of changes in their intertissue and intracellular differentiation, in particular due to the formation of chloroplasts – important “suppliers” of energy and metabolites for the vital activity of plant cells [17]. All these changes can affect the biomass increase of tea calli grown under different light intensities. One of the tea callus cultures features is their low growth rate compared to other in vitro plant cultures [48]. In all variants, its increase by the end of the passage did not exceed 156% (Figure 2).
According to the data obtained, L1 and L2 variants are characterized by a typical S-shaped growth curve [55]. The duration of their lag, linear and stationary phases was equal. At the same time, the biomass increasing in the variant L2, starting from the 10th day of cultivation under light exposure, exceeded that of the variant L1 and by the 40th day was 154% relative to 140%, respectively. In calli grown at the highest light intensity (variant L3), the initial stages of growth under light conditions were similar to those of variant L1. However, after the 30th day, its growth continued, reaching the growth values of the variant L2 (156%) by the 40th day. Perhaps the absence of a moving to the stationary growth phase in this culture is due to the chloroplasts’ formation in it, the switching to a photomixotrophic type of nutrition and, as a consequence, the preservation of growth activity.
All of the above indicates the possibility of regulating biomass increase in tea calli when grown under different light intensities. The greatest changes in growth dynamics were noted at high values, as was noted in leaf-derived callus of Solanum xanthocarpum cultivated under the influence of white light [56].
One of the important parameters when assessing the viability of plant tissues is their water content [57]. According to our data, it had similar values in calli of all variants and practically did not change during the passage (Table 1). The average water content was 89%. Small deviations from this value were not statistically significant (Table S1).
All of the above indicates differences in the growth dynamics of tea plant callus cultures grown under different intensity and duration of light exposure. Thus, at its lower values (L1 and L2 variants), a transition to the stationary growth phase was noted (from 30 to 40 days of cultivation), which is not typical for its highest value (variant L3), where the linear growth phase continued. Perhaps this effect is a specific reaction of tea cells grown at high light intensity, which is characterized by the greatest greening of callus surface. The relationship between chlorophyll accumulation and plant growth has been noted by a number of authors [58,59]. It should also be noted that in the calli of all variants the water content was the same during the passage. This indicates the absence of significant changes in cell elongation [60]. This growth pattern of tea callus cultures is reflected in their morphological characteristics, including high density and low biomass growth.

3.3. Chlorophyll a and b Content in Tea Callus Cultures

An important parameter when assessing the metabolic potential of plant tissues is the determination of the content of chlorophylls a and b – the main photosynthetic pigments responsible for the absorption of light energy and its further conversion into the energy of chemical bonds [23,25].
Tea callus cultures grown under different intensity and duration of light exposure are characterized by the formation of green pigmentation, the saturation of which in all variants increased towards the end of the experiment. It can be assumed that this is due to the light-dependent regulation of chloroplastogenesis and the formation of photosynthetic pigments [17]. However, in extracts of tea callus cultures, the content of chlorophylls a and b could not be analyzed by the spectrophotometric method, which is widely used for their determination in plant tissues [61]. In this regard, a more sensitive spectrofluorimetric method was used [45,62].
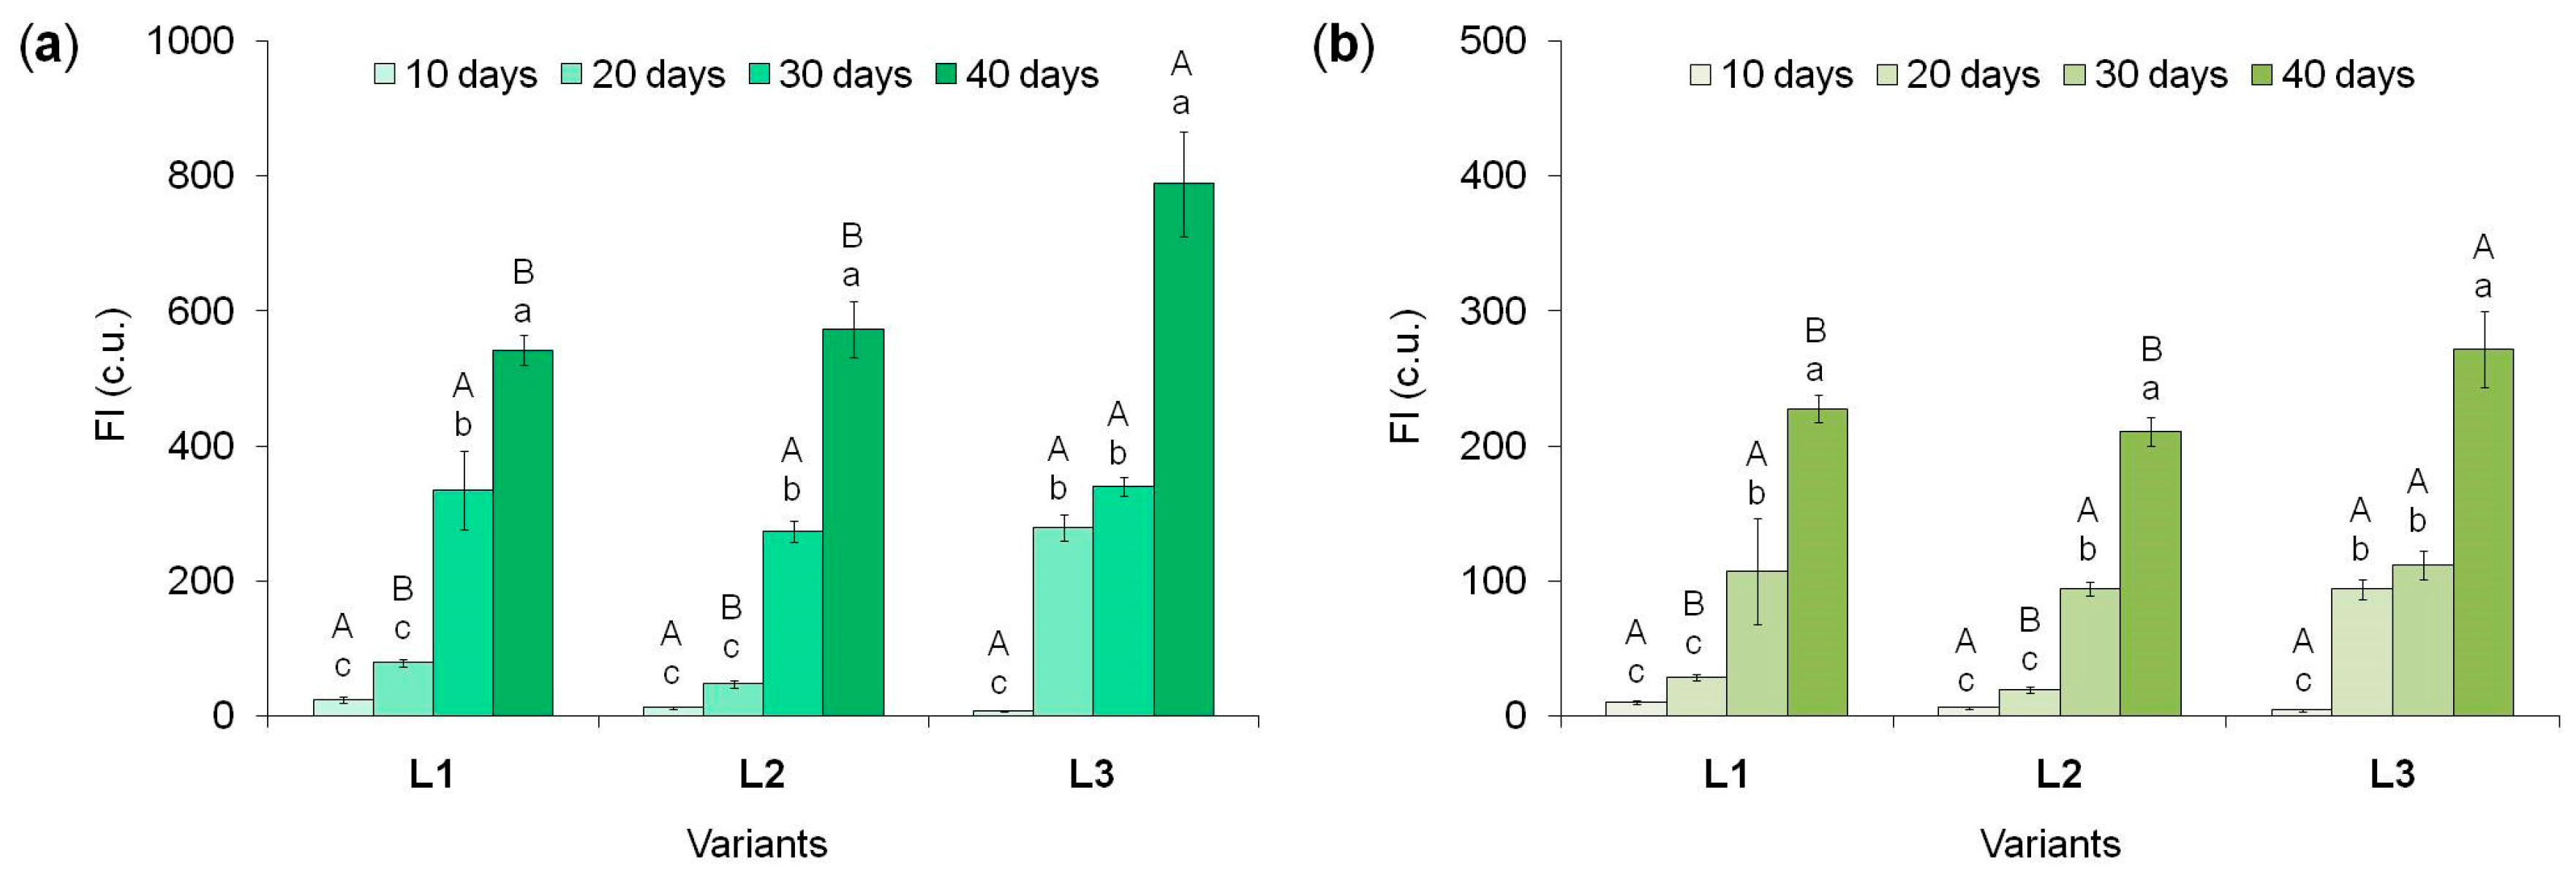
According to the data obtained, in tea plant calli grown at different light intensities, the amount of chlorophylls a and b increased as they grew, reaching maximum values by the end of the passage that is, with prolonged exposure (Figure 3).
The chlorophyll a content at the beginning of the light exposure (the 10th day) in calli of all variants was minimal (Figure 3a). On the 20th day, it increased multiple times, especially in the variant L3, exceeding the parameters of the L1 and L2 variants by 3.5 and 6 times, respectively. By the 30th day, the chlorophyll a content increased in calli of the L1 and L2 variants by 4 and 5.5 times, accordingly. While in the L3 variant it enhanced by only 20%. As a result, in all variants it was statistically equal. The tendency to increase the amount of this pigment continued until the 40th day of light exposure: 1.5 times in the L1 variant and 2.0 times in other variants. At the same time, the maximum content of chlorophyll a was in calli of the L3 variant, exceeding its level in other variants by 1.4 times. All this indicates that the highest light intensity contributed to the rapid activation of chlorophyll a formation in tea callus, as well as its maximum accumulation under prolonged exposure (40 days). At lower light intensities (L1 and L2 variants), the amount of this photosynthetic pigment in calli was almost equal and gradually increased as they grew.
For chlorophyll b, the amount of which was significantly less than that of chlorophyll a, a similar, but less pronounced, trend of its accumulation in tea calli was noted (Figure 3b). At the beginning of the light exposure, its level was minimal. On the 20th day, the amount of chlorophyll b in callus cultures increased, although it remained at a quite low level. Moreover, for the L1 and L2 variants it was statistically equal and significantly lower (3.0 and 4.0 times, respectively) than in the L3 variant. Further growth under light exposure (30 days) was accompanied by an increase in the amount of chlorophyll b only in the L1 and L2 variants (3.6 and 4.5 times, respectively), which led to its equal values in all studied cultures. By the 40th day, it doubled in all variants compared to the 30th day, reaching its maximum value. Moreover, it was statistically equal for the L1 and L2 variants and higher (by 20%) for the L3 variant.
All these data confirm our earlier assumption about the formation of photosynthetic pigments in tea callus cultures grown under different light intensities. Moreover, the accumulation of chlorophylls a and b in them depends on both the intensity and duration of its exposure (Table S1). This is consistent with the ideas about the important role of photosynthetic pigments in light absorption, photoprotection of cells from high exposure, as well as the functional activity of photosynthesis, which makes a major contribution to plant productivity [63].

3.4. Soluble Carbohydrates Content in Tea Callus Cultures

One of the important and necessary metabolites for plant growth are carbohydrates or sugars [64]. They are substances of primary metabolism that serve as substrates for the biosynthesis of various compounds, including PCs [36,65].
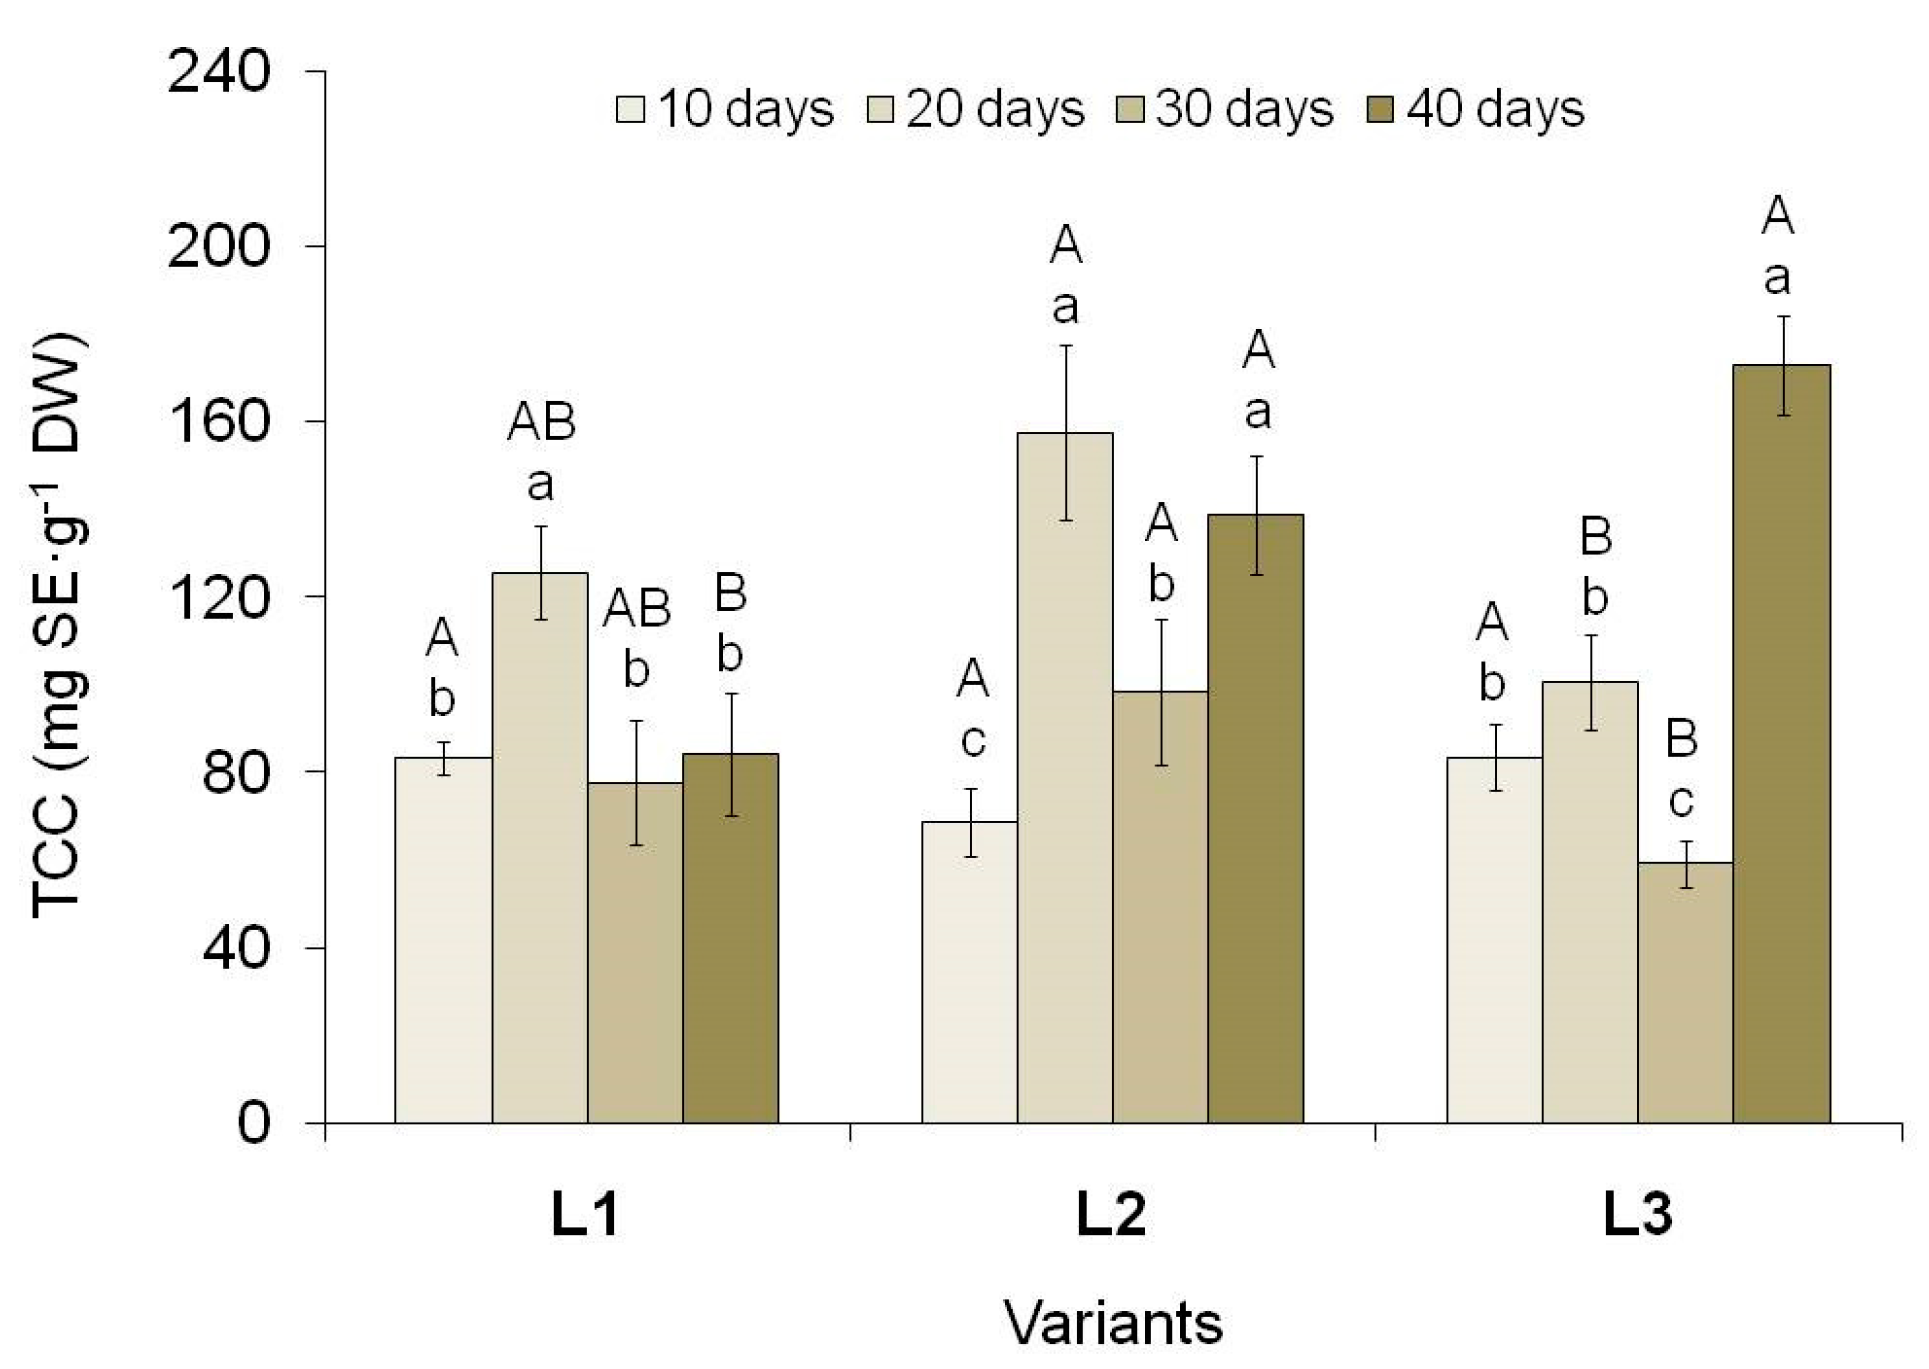
Determination of the total soluble carbohydrates content (TCC) in tea callus cultures showed its changes as they grew under conditions of different light intensity and duration (Figure 4). In general, the trends in their accumulation are close to the circadian rhythms of many biological processes [66]. In all variants, on the 10th day of tea callus culture growth under light exposure, TCC was almost equal, by the 20th day it increased, by the 30th day it decreased, and by the 40th day it increased again.
Moreover, at the beginning of the light exposure (10 days), TCC in calli of all variants was equal. By the 20th day, it increased significantly in the L1 and L2 variants (by 34% and 56%, respectively) and did not change in the variant L3. By the 30th day, TCC decreased in calli of all variants by 1.6 times. A different trend is typical for the final stages of culture growth under light exposure (40 days), when the amount of these primary metabolites either did not change (variant L1) or increased (variants L2 and especially L3). The consequence of these changes was the highest TCC in tea callus cultures on the 40th day of increased light exposure (L2 and, to a greater extent, L3 variants).
Since carbohydrates are important components of primary metabolism and “intermediate” products of photosynthesis, a positive correlation has often been noted between their accumulation and the chlorophyll content [67]. To a certain extent, this is also typical for tea callus cultures (Table S1). One can also note the relationship between TCC and biomass accumulation in tea callus cultures, which further confirms the important energetic role of these metabolites for plant cells and tissues.

3.5. Phenolic Compounds Content in Tea Callus Cultures

As noted above, PCs are formed in almost all plants, as well as in cell cultures initiated from them [7,27]. Their antioxidant activity and participation in plant protection from various environmental factors, including light, are known [17]. On the one hand, it is important for their vital activity, on the other hand, it can act as an elicitor, including increasing the formation of reactive oxygen species [68]. And in this case, an important role in their inactivation belongs to PCs [8].

3.5.1. Total Phenolics Content in Tea Callus Cultures

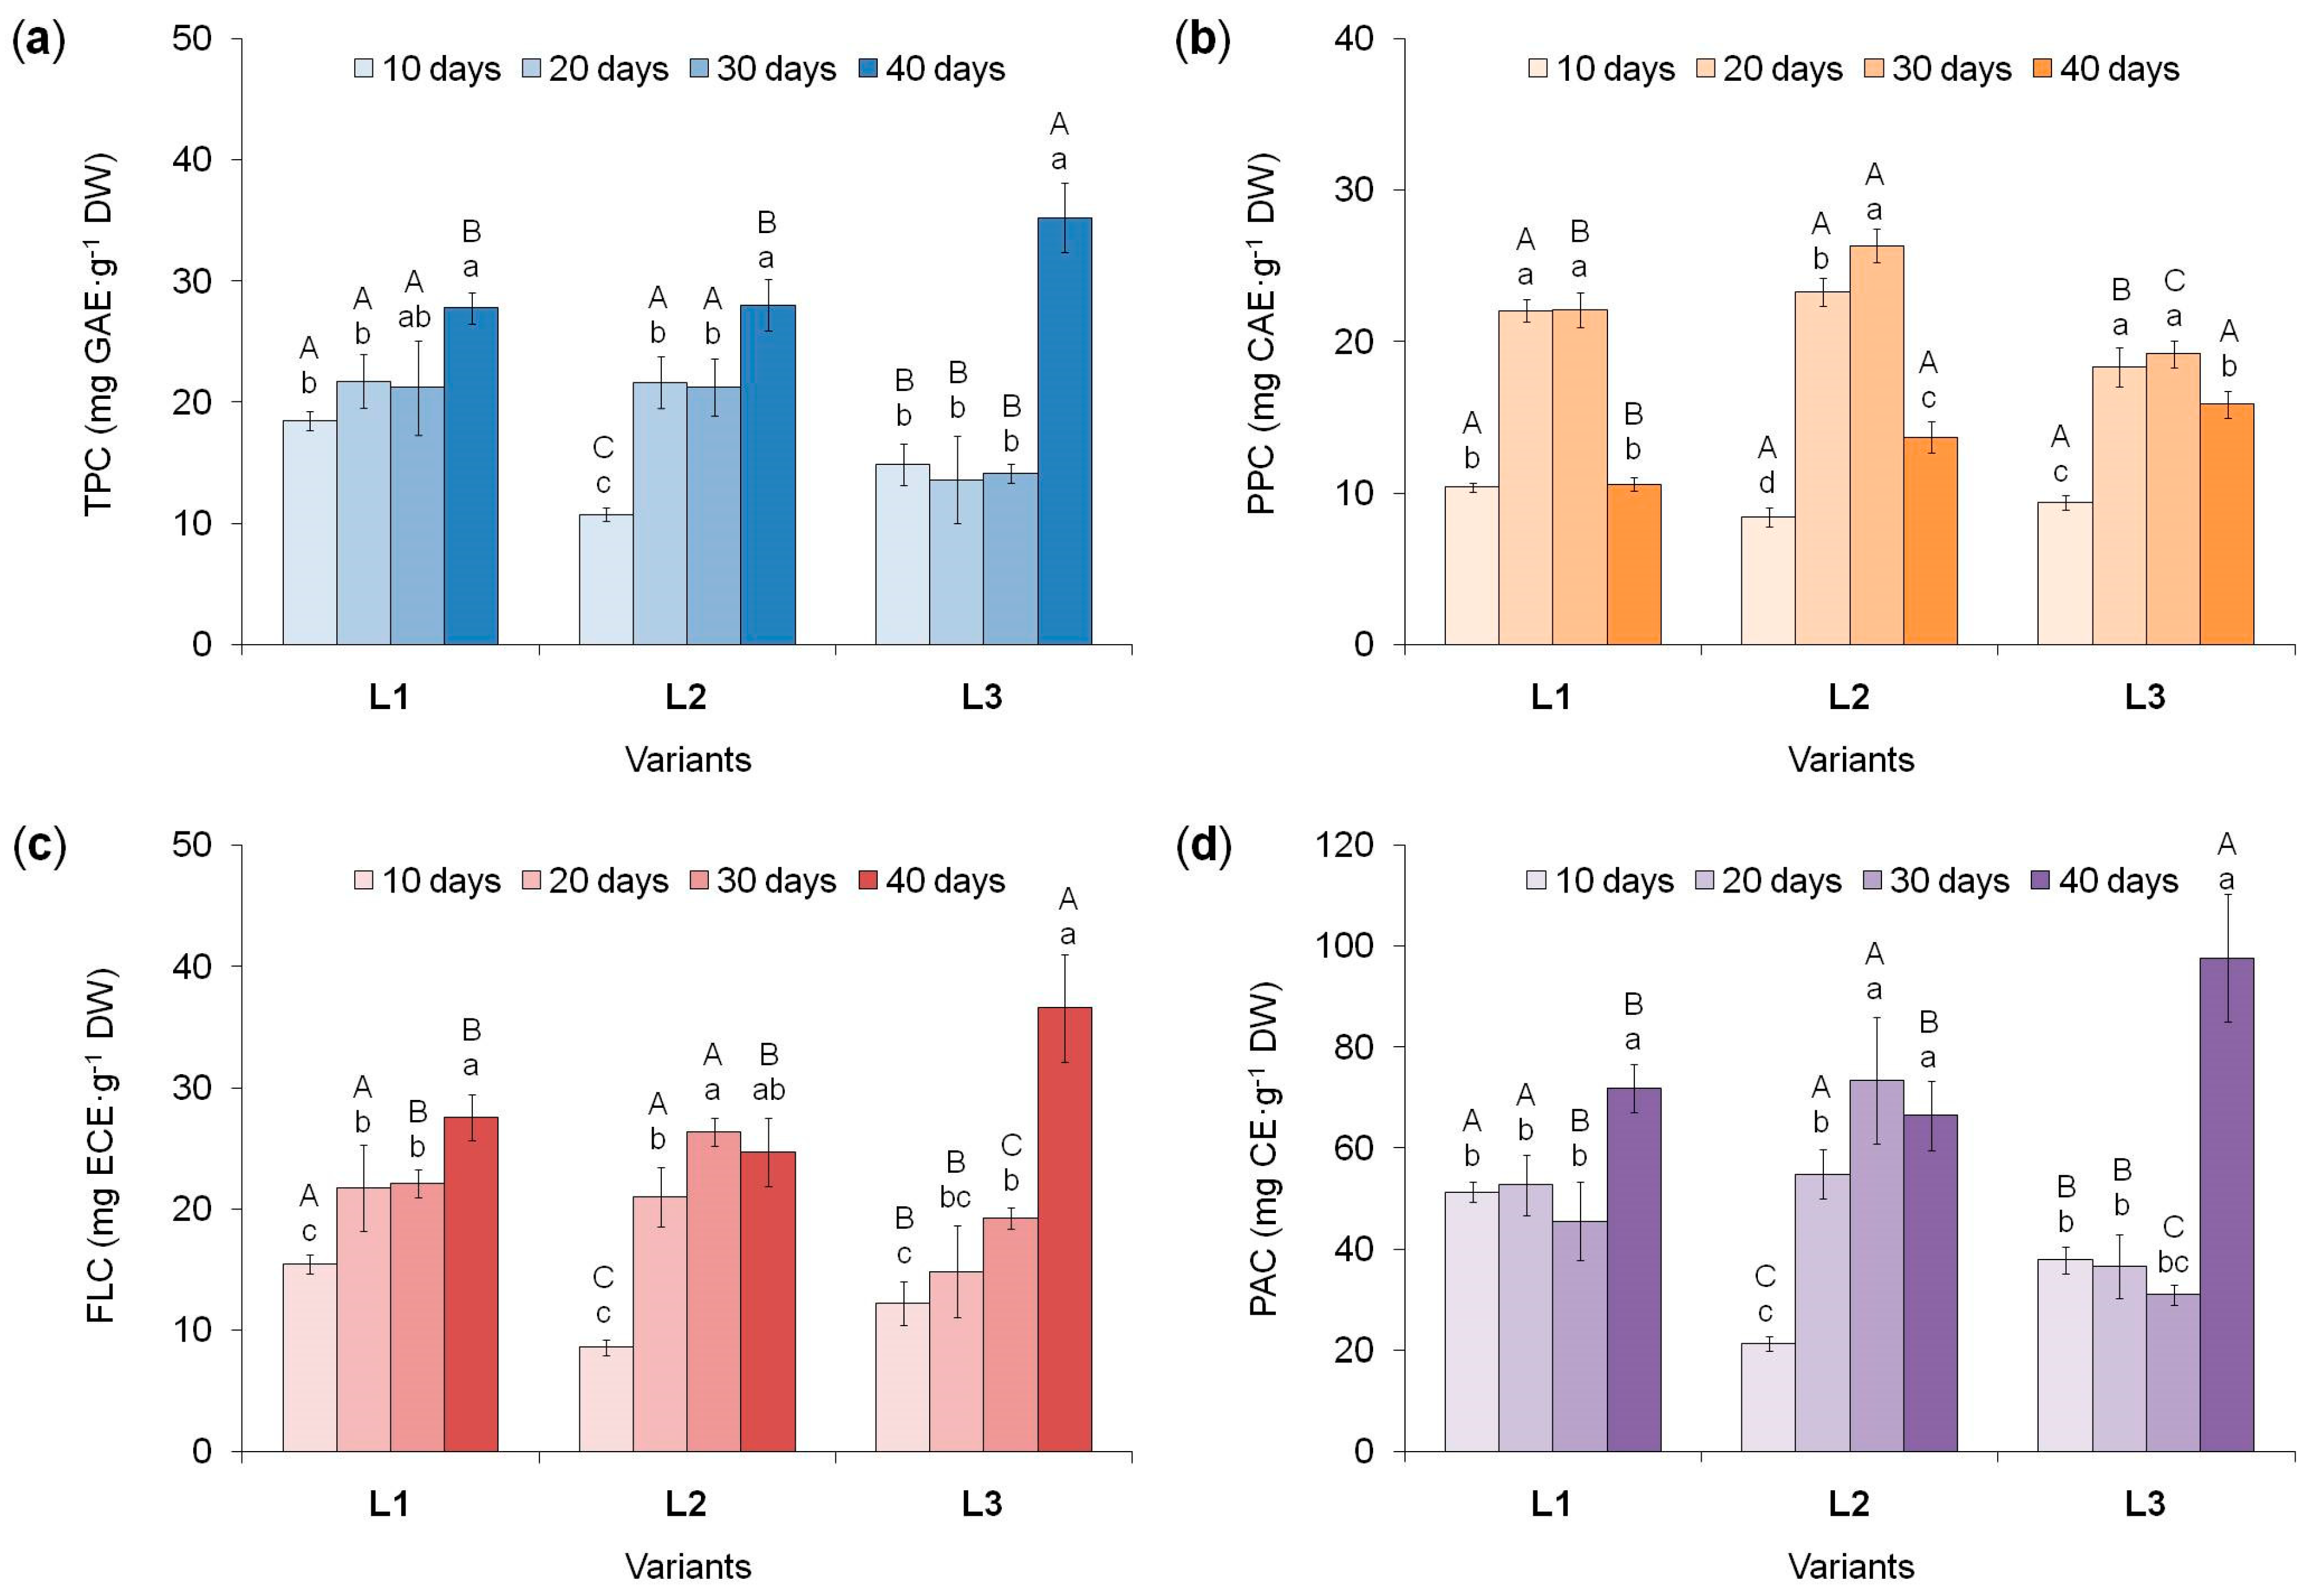
Determination of the total phenolics content (TPC) allows to assess the potential ability of plant cells to biosynthesize them [22,30]. According to the data obtained, TPC in tea callus cultures grown under different intensity and duration of light exposure changed (Figure 5a). Moreover, in all variants, its highest values were noted at the end of the cultivation cycle, especially in the L3 variant.
At the initial stages of tea callus cultures growth under different light intensity (10 days), the highest TPC value was observed in the L1 variant. In other cultures, it was lower: by 19% and 42% for the L3 and L2 variants, respectively. With further growth in the L1 and L3 variants of light exposure TPC remained at the same level until the 30th day. A different trend is typical for the L2 variant: a significant increase in TPC by the 20th day (2 times) and no changes until the 30th day. By the 40th day, in tea calli of the L1 and L2 variants, TPC increased equally (by 25%), while in the variant L3 it increased by 60%, which contributed to the greatest accumulation of PCs.
Thus, TPC in tea callus cultures changed as they grew under light conditions, reaching the highest values with prolonged exposure (40 days). At the same time, the dynamics of this process had similar trends in the L1 and L3 variants: TPC was at the same level during the first 30 days of growth (lower in the L3 variant), and by the 40th day it increased, especially in the L3 variant. In the L2 variant, changes in TPC are largely similar to those in the L1 variant, with the exception of its lower values at the beginning of the light exposure.
Consequently, the accumulation of PCs in tea callus cultures depends on both the intensity and the duration of light impact, to which they are exposed during the growing process (Table S1). Moreover, in all variants, the greatest amount of them accumulated at the final stages of cultures growth, when they had a high level of photosynthetic pigments. Probably, increasing the cell differentiation level, in particular, the formation of chloroplasts in tea calli, as one of the sites of PCs biosynthesis in plant cells [8], contributed to the accumulation of these secondary metabolites.

3.5.2. Phenylpropanoids Content in Tea Callus Cultures

Phenylpropanoids are polyphenols formed at the initial stages of the phenolic metabolism [10]. They can not only accumulate in plant cells, but also serve as precursors in the biosynthesis of various flavonoids [7].
In tea callus cultures grown under different light intensities, the content of phenylpropanoids changed under light exposure (Figure 5b). At the beginning of its impact (10 days), the phenylpropanoids content in all tea callus cultures grown under different light intensities was low and almost equal. By the 20th day of light exposure, it increased significantly (in the L1 and L3 variants by 50%, in the variant L2– by 60%) and remained at this level until the 30th day. By the 40th day, the phenylpropanoids content in tea calluses decreased. Moreover, under high light intensity conditions (variant L3), this change was only 17%, whereas in the other two variants (L1 and L2) it was almost twice.
Based on these data, it can be concluded that the light effect on tea callus cultures contributes to the accumulation of biogenetically early compounds of phenolic nature – phenylpropanoids. This process was activated in all cases on the 20th−30th days of light exposure and decreased by the 40th day. To a greater extent, this is typical for calluses of the L1 and L2 variants, which during this period passed to the stationary phase of growth. When callus cultures were exposed to the highest light intensity (variant L3), these changes were not so significant, which is probably a consequence of their maintaining high growth activity inherent in the linear phase of culture growth in vitro [55, 60].

3.5.3. Flavanols Content in Tea Callus Cultures

Flavanols are the most reduced compounds of the largest polyphenols class, namely flavonoids [69]. They are the main components of the tea plant phenolic complex, as well as callus cultures initiated from it [5,30,31].
Determination of flavanol content showed their increase in tea calli as the duration of the light exposure increases (Figure 5c). In most cases, their greatest accumulation was noted by the 40th day, which depended on the light intensity (Table S1).
On the 10th day of tea callus culture growth, the lowest flavanol content was observed in the L2 variant, while in the L1 and L3 variants it was higher (by 45% and 30%, respectively). By the 20th day, it increased in the L1 and L2 variants by 30% and 60%, respectively. A different trend is typical for calli grown under the highest light intensity (L3 variant), where no statistically significant changes in this parameter were note. By the 30th day, in the L1 and L3 variants, the flavanols content remained at the same level, while in the L2 variant it increased slightly (by 20%). A different tendency was observed on the 40th day of light exposure, when the accumulation of these metabolites increased in the L1 and L3 variants (by 20% and 50%, respectively), but did not change in the L2 variant. It should also be noted that at the end of the tea callus culture growth the amount of flavanols in the L1 and L2 variants was almost equal, while in the variant L3 it was significantly higher (by 30%).
All this indicates significant light regulation of the flavanols accumulation in tea callus cultures. To a certain extent, one can note the similarity in the accumulation of flavans in calli grown at the lower intensities of light exposure. At high intensity, the amount of these metabolites increased only under its prolonged and to a much greater extent than under other variants of illumination. Therefore, the flavanols accumulation in tea callus cultures is regulated not only by the light intensity, but also by the duration of exposure (Table S1).

3.5.4. Proanthocyanidins Content in Tea Callus Cultures

Proanthocyanidins are oligomers of phenolic nature based on flavan-3-ols (catechins), the formation of which is characteristic of perennial plants, including tea [8,70].
As with other phenolic metabolites, the accumulation of proanthocyanidins in tea callus cultures grown changed under different intensity of light exposure, reaching in most cases the highest values at the end of the passage (Figure 5d).
At the beginning of the growing cycle under light conditions (the 10th day), the lowest proanthocyanidins content was noted in the callus of the variant L2 and higher in the L1 and L3 variants (by 60% and 44%, respectively). As the cultures continued to grow (up to 30 days), it remained at this level in calluses grown at the lower and highest light intensities (L1 and L3 variants). A different trend is typical for the variant L2, in which the proanthocyanidins content increased significantly on the 20th day (2.6 times). By the 40th day the amount of these metabolites increased in the L1 and L3 variants (1.5 and 3.0 times, respectively), while in the variant L2 it remained at the same level. The result of these changes was the maximum content of proanthocyanidins in tea callus grown at the highest light intensity (variant L3), which was 30% higher that of other variants, where it was statistically equal during this period.
Thus, the dynamics of proanthocyanidins accumulation in tea callus cultures grown under different intensities of light exposure differed. In the conditions of the lower and highest light intensity (L1 and L3 variants), it increased only under its prolonged exposure and it was very significant in the L3 variant. In the L2 variant, the main and significant changes in the accumulation of proanthocyanidins occurred at the initial stages of light impact (the 20th day). All this indicates differences in the response of tea callus cultures to both the intensity and duration of light exposure (Table S1).

3.6. Lipid Peroxidation Level in Tea Callus Cultures

It is known that any exogenous factor can have a stressful effect on plant cells [11]. This also applies to light, which in a number of studies is considered as an elicitor and stressor [8,56]. We must not forget that with a high intensity of light flux the reactive oxygen species generation can be activated and, as a consequence, an increase in their quantity up to the development of oxidative stress [71]. Based on these data, we determined the content of MDA as an parameter of the level of lipid peroxidation (LPO) and the presence/absence of a stress response in plant cells [43,72].
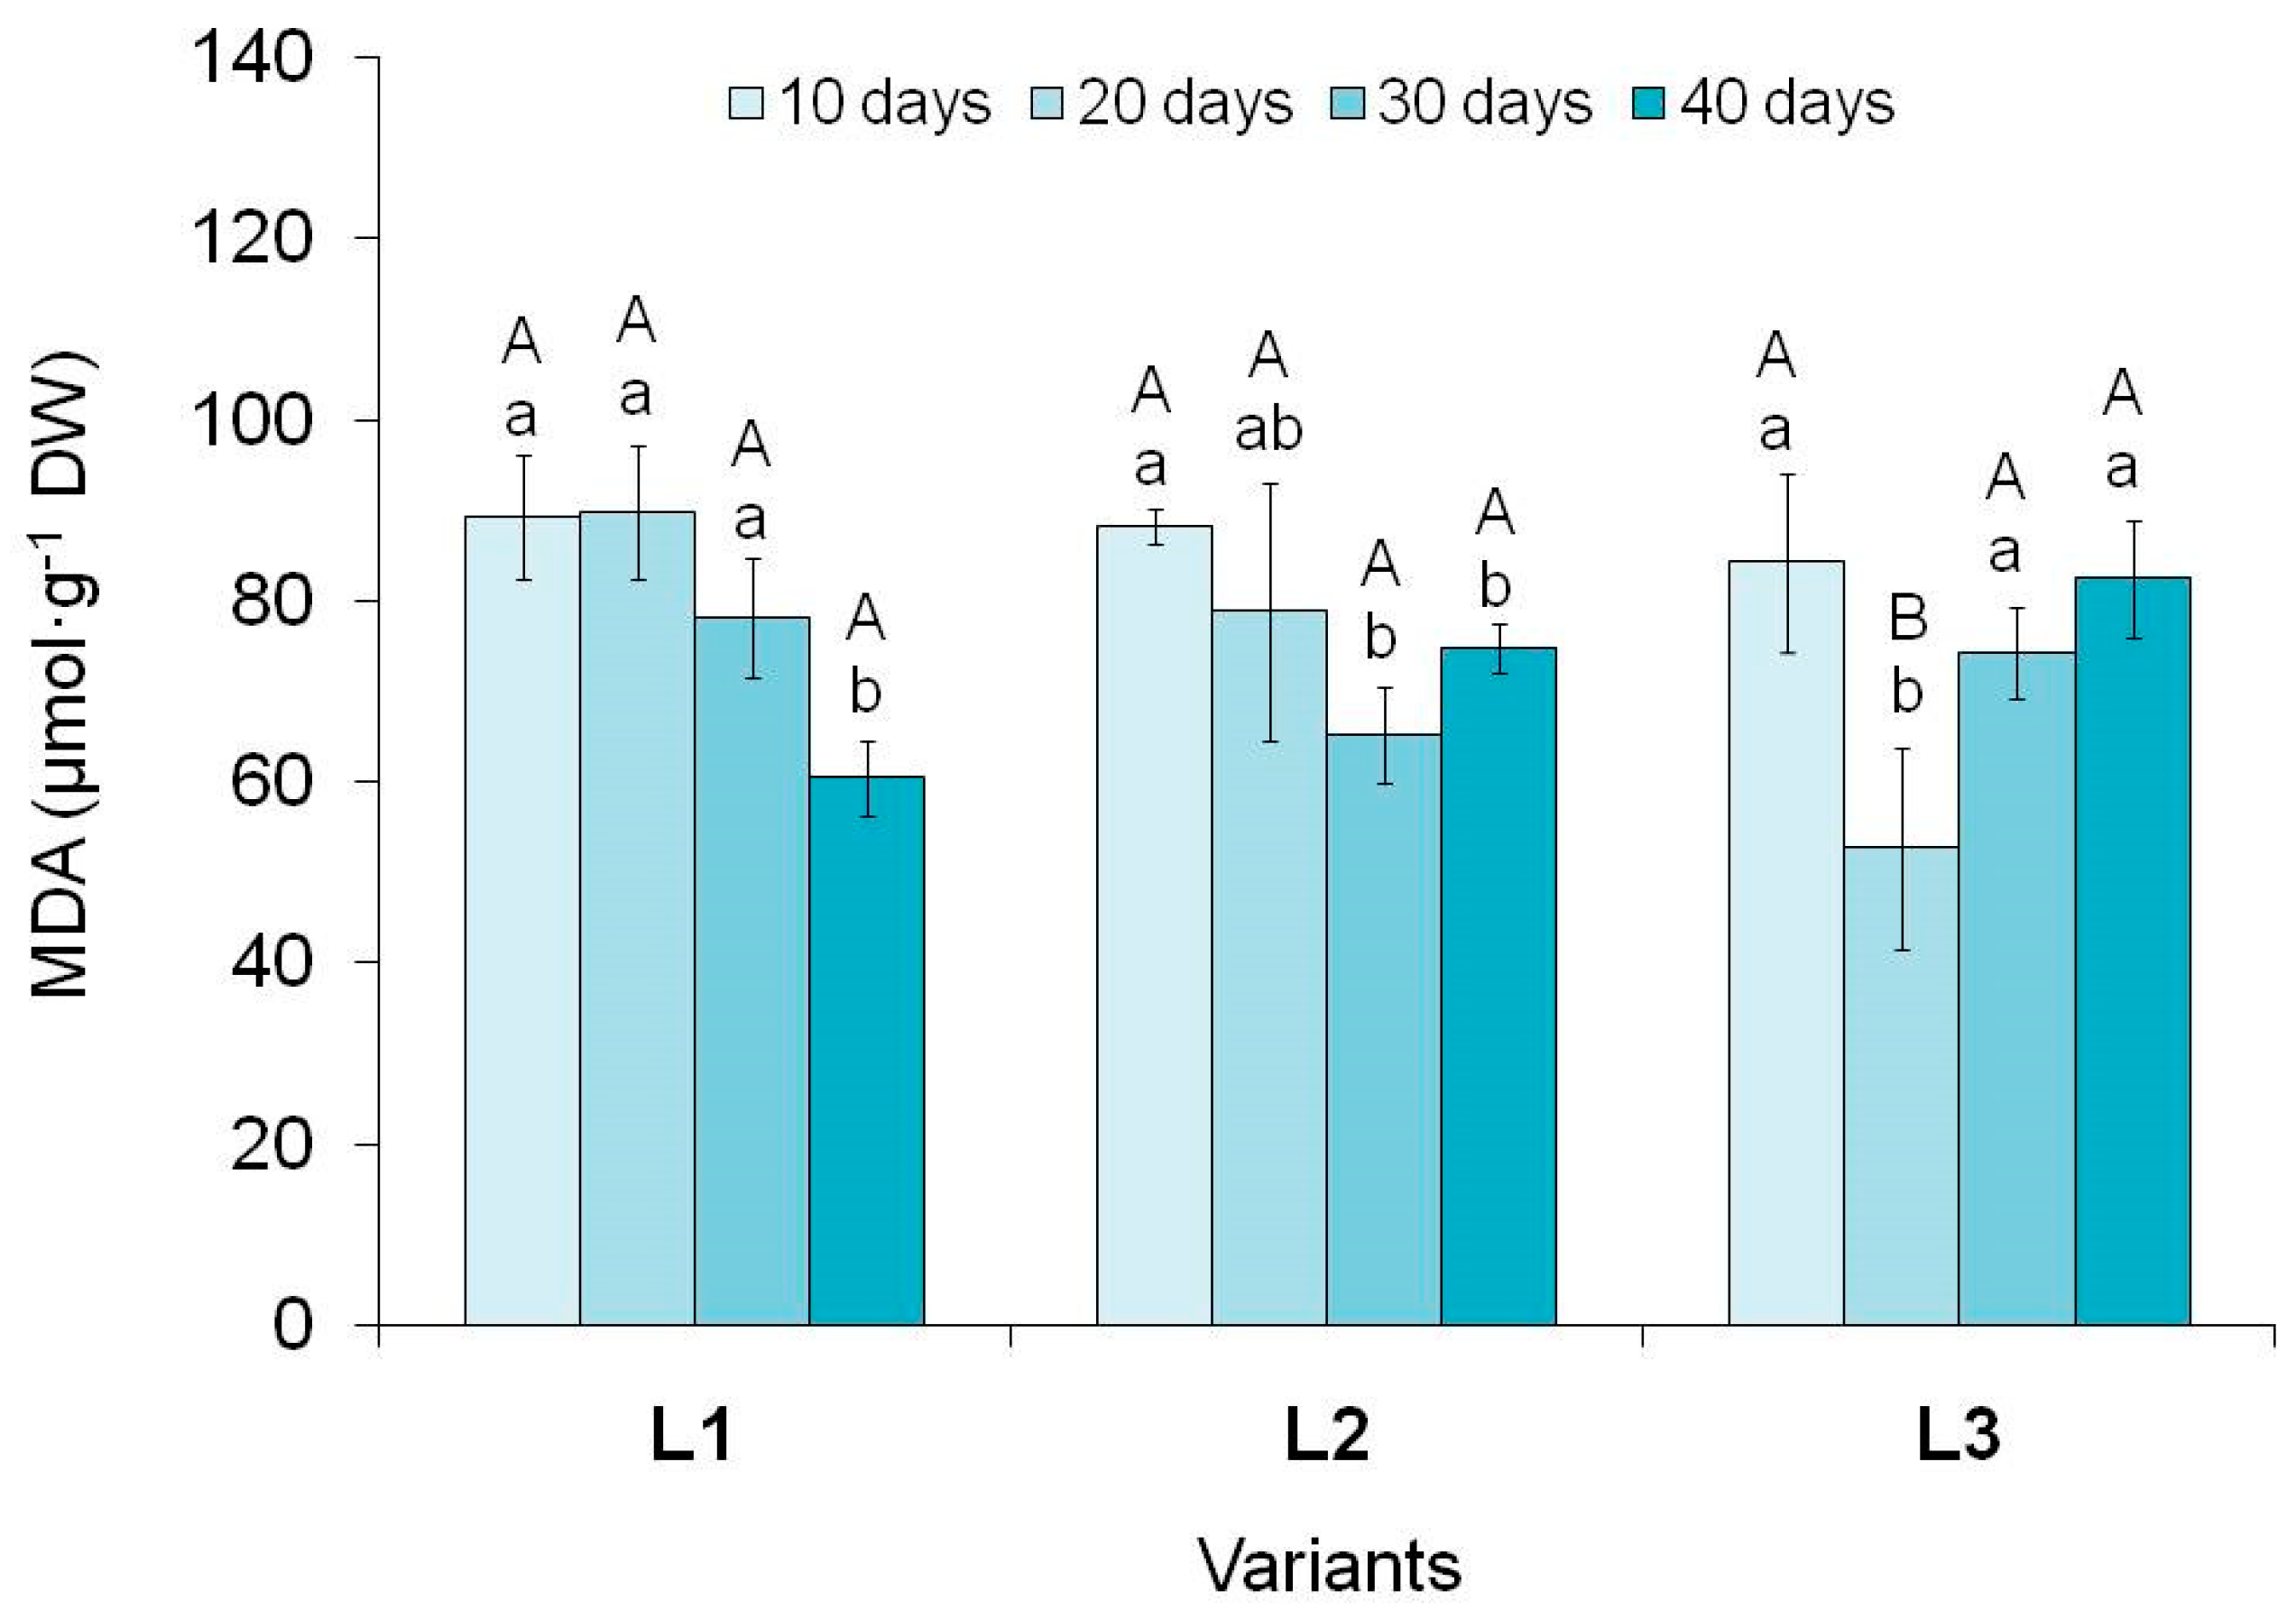
Determination of MDA content in tea callus culture showed its changes as they grow under different light intensities (Figure 6). In most cases, it was higher at the beginning of its exposure than at the end (10 and 40 days), with the exception of the L3 variant, where this parameter was the same.
It should also be noted that at the beginning of the light impact (the 10th day), the MDA content in callus cultures of all variants was quite high and statistically equal. This indicated the same level of lipid peroxidation, that is, the absence of dependence on the light intensity (Table S1). With further growth in calli of the variant L1, the MDA content was statistically equal during the first 30 days of cultivation under light conditions, and by the 40th day it decreased (by 30%). This decrease in LPO level is a consequence of cells adaptation to the action of the exogenous factor, as well as activation of their defense systems [8,72]. In the variant L2, a decrease in this parameter began on the 20th day of cultivation (insignificant), and by the 30th day it was 26% lower than its initial level and did not change until the end of the passage. As for the variant L3, in this case the trend was different: a significant decrease on the 20th day (by 40%), a subsequent increase by the 30th day (to the initial values) and retention at this level until the end of the light exposure. Consequently, in tea callus cultures grown at high light intensity, in general, no significant changes in the MDA content were observed throughout the entire light illumination period.
Based on the data obtained, we can conclude that at the initial stages of tea callus cultures growth exposed to different light intensities, the level of LPO was the same, and with prolonged exposure it decreased towards the end of the passage (with the exception of the variant with high light intensity). This indicates the adaptation of in vitro cultures to its effects and the formation of defense systems against reactive oxygen species that arise under these conditions. To a certain extent, this may be a consequence of the PCs accumulation, effective bioantioxidants, in them [8,9].

4. Conclusions

The tea plant (Camellia sinensis L.) is one of the most important horticultural crops widely used throughout the world, both in the food and pharmaceutical industries, due to the accumulation of biologically active substances, including polyphenols. Their accumulation depends on the action of various environmental factors, including light. A study of the tea callus cultures response to the action of light of various intensities showed that at increased values (75 and 100 µmol·m-2·s-1) growth activity was higher than at lower values (50 µmol·m-2·s-1). The accumulation of carbohydrates, one of the representatives of primary metabolism and substrates for the biosynthesis of other substances, was very similar in all studied variants and was close to the circadian rhythms of many biological processes. As for polyphenols, namely the content of flavanols and proanthocyanidins, it was maximum at the final stages of callus growth at the highest light intensity (100 µmol·m-2·s-1). A different trend is typical for phenylpropanoids (biogenetically early compounds of phenolic metabolism): their greatest accumulation was noted on the 20-30th day of crop growth at lower light intensity (50 and 75 µmol·m-2·s-1). All this indicates some differences in the activity of the phenylpropanoid and flavonoid pathways of polyphenol biosynthesis in the tea callus cultures grown under different light intensities, which can serve as the subject of further studies at the metabolome and transcriptome levels.

Supplementary Materials

Figure S1: The design of the experiment and analyzed parameters. Figure S2: Lateral sections of tea callus calluses grown under different light intensity: 50 µmol·m−2·s−1 (a); 75 µmol·m−2·s−1 (b) и 100 µmol·m−2·s−1 (c). Duration of light exposure – 20 days. Symbol: YC -young cells. Table S1: Two-way ANOVA showing the effect of intensity and duration of light exposure and their interaction on water, different phenolic compounds, malondialdehide, total carbohydrates, chlorophyll a and b contents in tea callus cultures.

Author Contributions

Conceptualization, M.Y.Z., M.A.A. and N.V.Z.; methodology, M.Y.Z., M.A.A., T.L.N. and N.V.Z.; formal analysis, M.Y.Z., T.L.N. and N.V.Z.; investigation, M.Y.Z., T.L.N., E.A.G., V.V.K. and V.M.K.; resources, N.V.Z.; data curation, M.Y.Z. and N.V.Z..; writing—original draft preparation, M.Y.Z., M.A.A., E.A.G. and N.V.Z.; writing—review and editing, M.Y.Z., M.A.A. and N.V.Z.; visualization, M.Y.Z. and V.V.K.; supervision, M.Y.Z., M.A.A. and N.V.Z.; project administration, M.A.A. and N.V.Z.; funding acquisition, N.V.Z. All authors have read and agreed to the published version of the manuscript.

Funding

This research was supported by Russian Science Foundation: "Conducting Basic Scientific Research and exploratory scientific research by small individual scientific groups", grant No. 23-24-00359.

Data Availability Statement

The data presented in this study are available on request from the corresponding author. Data are contained within the article or Supplementary Material.

Conflicts of Interest

The authors declare no conflicts of interest.

References

  1. Meng, X.H.; Li, N.; Zhu, H.T.; Wang, D.; Yang, C.R.; Zhang, Y.J. Plant resources, chemical constituents, and bioactivities of tea plants from the genus Camellia Section Thea. J. Agric. Food Chem. 2018, 67, 5318–5349. [Google Scholar] [CrossRef]
  2. Samanta, S. Potential bioactive components and health promotional benefits of tea (Camellia sinensis). J. Am. Nutr. Assoc. 2022, 41, 65–93. [Google Scholar] [CrossRef]
  3. Zhou, J.; Fang, T.; Li, W.; Jiang, Z.; Zhou, T.; Zhang, L.; Yu, Y. Widely targeted metabolomics using UPLC-QTRAP-MS/MS reveals chemical changes during the processing of black tea from the cultivar Camellia sinensis (L.) O. Kuntze cv. Huangjinya. Food Res. Int. 2022, 162, 112169. [Google Scholar] [CrossRef] [PubMed]
  4. Wu, W.; Shi, J.; Jin, J.; Liu, Z.; Yuan, Y.; Chen, Z.; Zhang, S.; Dai, W.; Lin, Z. Comprehensive metabolic analyses provide new insights into primary and secondary metabolites in different tissues of Jianghua Kucha tea (Camellia sinensis var. assamica cv. Jianghua). Front. Nutr. 2023, 10, 1181135. [Google Scholar] [CrossRef]
  5. Gong, A.; Lian, S.; Wu, N.; Zhou, Y.; Zhao, S.; Zhang, L.; Cheng, L.; Yuan, H. Integrated transcriptomics and metabolomics analysis of catechins, caffeine and theanine biosynthesis in tea plant (Camellia sinensis) over the course of seasons. BMC Plant Biol. 2020, 20, 294. [Google Scholar] [CrossRef] [PubMed]
  6. Zhang, L.; Ho, C.-T.; Zhou, J.; Santos, J.S.; Armstrong, L.; Granato, D. Chemistry and biological activities of processed Camellia sinensis Teas: A comprehensive review. Compr. Rev. Food Sci. Food Saf. 2019, 18, 1474–1495. [Google Scholar] [CrossRef]
  7. Cheynier, V.; Comte, G.; Davies, K.M.; Lattanzio, V.; Martens, S. Plant phenolics: Recent advances on their biosynthesis, genetics, and ecophysiology. Plant Physiol. Biochem. 2013, 72, 1–20. [Google Scholar] [CrossRef] [PubMed]
  8. Zagoskina, N.V.; Zubova, M.U.; Nechaeva, T.L.; Kazantseva, V.V.; Goncharuk, E.A.; Katanskaya, V.M.; Baranova, E.N.; Aksenova, M.A. Polyphenols in plants: Structure, biosynthesis, abiotic stress regulation, and practical applications. Int. J. Mol. Sci. 2023, 24, 13874. [Google Scholar] [CrossRef]
  9. Belščak-Cvitanović, A.; Durgo, K.; Huđek, A.; Bačun-Družina, V.; Komes, D. Overview of polyphenols and their properties. In Polyphenols: Properties, Recovery, and Applications; Galanakis, C. M., Ed.; Elsevier: Amsterdam, The Netherlands, 2018; pp. 3–44. [Google Scholar] [CrossRef]
  10. Yao, T.; Feng, K.; Xie, M.; Barros, J.; Tschaplinski, T.J.; Tuskan, G.A.; Muchero, W.; Chen, J.C. Phylogenetic occurrence of the phenylpropanoid pathway and lignin biosynthesis in plants. Front. Plant Sci. 2021, 12, 704697. [Google Scholar] [CrossRef]
  11. Singh, A.K.; Dhanapal, S.; Yadav, B.S. The dynamic responses of plant physiology and metabolism during environmental stress progression. Mol. Biol. Rep. 2020, 47, 1459–1470. [Google Scholar] [CrossRef]
  12. Gulcin, İ. Antioxidants and antioxidant methods: An updated overview. Arch. Toxicol. 2020, 94, 651–715. [Google Scholar] [CrossRef] [PubMed]
  13. Cosme, P.; Rodriguez, A. B.; Espino, J.; Garrido, M. Plant phenolics: Bioavailability as a key determinant of their potential health-promoting applications. Antioxidants 2020, 9, 1263. [Google Scholar] [CrossRef] [PubMed]
  14. Maiuolo, J.; Gliozzi, M.; Carresi, C.; Musolino, V.; Oppedisano, F.; Scarano, F.; Nucera, S.; Scicchitano, M.; Bosco, F.; Macri, R.; et al. Nutraceuticals and cancer: Potential for natural polyphenols. Nutrients 2021, 13, 3834. [Google Scholar] [CrossRef] [PubMed]
  15. El-Missiry, M.; Fekri, A.; Kesar, L.A.; Othman, A.I. Polyphenols are potential nutritional adjuvants for targeting COVID-19. Phytother. Res. 2021, 35, 2879–2889. [Google Scholar] [CrossRef] [PubMed]
  16. Paradiso, R.; Proietti, S. Light-quality manipulation to control plant growth and photomorphogenesis in greenhouse horticulture: The state of the art and the opportunities of modern LED systems. J. Plant Growth Regul. 2022, 41, 742–780. [Google Scholar] [CrossRef]
  17. Landi, M.; Zivcak, M.; Sytar, O.; Brestic, M.; Allakhverdiev, S.I. Plasticity of photosynthetic processes and the accumulation of secondary metabolites in plants in response to monochromatic light environments: A review. Biochim. Biophys. Acta Bioenerg. 2020, 1861, 148131. [Google Scholar] [CrossRef] [PubMed]
  18. Li, X.; Liang, T.; Liu, H. How plants coordinate their development in response to light and temperature signals. Plant Cell. 2022, 34, 955–966. [Google Scholar] [CrossRef] [PubMed]
  19. Osnato, M.; Cota, I.; Nebhnani, P.; Cereijo, U.; Pelaz, S. Photoperiod control of plant growth: Flowering time genes beyond flowering. Front. Plant Sci. 2021, 12, 805635. [Google Scholar] [CrossRef]
  20. Al Murad, M.; Razi, K.; Jeong, B.R.; Samy, P.M.A.; Muneer, S. Light emitting diodes (LEDs) as agricultural lighting: Impact and its potential on improving physiology, flowering, and secondary metabolites of crops. Sustainability. 2021, 13, 1985. [Google Scholar] [CrossRef]
  21. Ye, J.-H.; Lv, Y.-Q.; Liu, S.-R.; Jin, J.; Wang, Y.-F.; Wei, C.-L.; Zhao, S.-Q. Effects of light intensity and spectral composition on the transcriptome profiles of leaves in shade grown tea plants (Camellia sinensis L.) and regulatory network of flavonoid biosynthesis. Molecules 2021, 26, 5836. [Google Scholar] [CrossRef]
  22. Kołton, A.; Długosz-Grochowska, O.; Wojciechowska, R.; Czaja, M. Biosynthesis regulation of folates and phenols in plants. Sci. Hortic. 2022, 291, 110561. [Google Scholar] [CrossRef]
  23. Liu, Y.; Fang, S.; Yang, W.; Shang, X.; Fu, X. Light quality affects flavonoid production and related gene expression in Cyclocarya paliurus. J. Photochem. Photobiol. B Biol. 2018, 179, 66–73. [Google Scholar] [CrossRef] [PubMed]
  24. Ahmad, M.Z.; Li, P.; She, G.; Xia, E.; Benedito, V.A.; Wan, X.C.; Zhao, J. Genome-wide analysis of serine carboxypeptidase-like acyltransferase gene family for evolution and characterization of enzymes involved in the biosynthesis of galloylated catechins in the tea plant (Camellia sinensis). Front. Plant Sci. 2020, 11, 848. [Google Scholar] [CrossRef] [PubMed]
  25. Barrett, G. E.; Alexander, P. D.; Robinson, J. S.; Bragg, N. C. Achieving environmentally sustainable growing media for soilless plant cultivation systems–A review. Scientia horticulturae. 2016, 212, 220–234. [Google Scholar] [CrossRef]
  26. Chandran, H.; Meena, M.; Barupal, T.; Sharma, K. Plant tissue culture as a perpetual source for production of industrially important bioactive compounds. Biotechnol. Rep. 2020, 26, e00450. [Google Scholar] [CrossRef] [PubMed]
  27. Wu, T.; Kerbler, S.M.; Fernie, A.R.; Zhang, Y. Plant cell cultures as heterologous bio-factories for secondary metabolite production. Plant Comm. 2021, 2, 100235. [Google Scholar] [CrossRef] [PubMed]
  28. Partap, M.; Chhimwal, J.; Kumar, P.; Kumar, D.; Padwad, Y.; Warghat, A.R. Growth dynamics and differential accumulation of picrosides and its precursor metabolites in callus cell lines of Picrorhiza kurroa with distinct anti-steatotic potential. Process Biochem. 2022, 120, 85–100. [Google Scholar] [CrossRef]
  29. Nazir, M.; Ullah, M.A.; Younas, M.; Siddiquah, A.; Shah, M.; Giglioli-Guivarc’H, N.; Hano, C.; Abbasi, B.H. Light-mediated biosynthesis of phenylpropanoid metabolites and antioxidant potential in callus cultures of purple basil (Ocimum basilicum L. var purpurascens). Plant Cell, Tissue Organ Cult. 2020, 142, 107–120. [Google Scholar] [CrossRef]
  30. Nikolaeva, T.N.; Zagoskina, N.V.; Zaprometov, M.N. Production of phenolic compounds in callus cultures of tea plant under the effect of 2, 4-D and NAA. Russ. J. Plant Physiol. 2009, 56, 45–49. [Google Scholar] [CrossRef]
  31. Ossipov, V.; Zubova, M.; Nechaeva, T.; Zagoskina, N.; Salminen, J. P. The regulating effect of light on the content of flavan-3-ols and derivatives of hydroxybenzoic acids in the callus culture of the tea plant, Camellia sinensis L. Biochem. Syst. Ecol. 2022, 101, 104383. [Google Scholar] [CrossRef]
  32. Eeuwens, C. J. Mineral requirements for growth and callus initiation of tissue explants excised from mature coconut palms (Cocos nucifera) and cultured in vitro. Physiologia Plantarum. 1976, 36, 23–28. [Google Scholar] [CrossRef]
  33. Schween, G.; Schwenkel, H.G. Effect of genotype on callus induction, shoot regeneration, and phenotypic stability of regenerated plants in the greenhouse of Primula ssp. Plant Cell Tiss. Org. Cult. 2003, 72, 53–61. [Google Scholar] [CrossRef]
  34. Kokotkiewicz, A.; Bucinski, A.; Luczkiewicz, M. Light and temperature conditions affect bioflavonoid accumulation in callus cultures of Cyclopia subternata Vogel (honeybush). Plant Cell Tiss. Organ Cult. 2014, 118, 589–593. [Google Scholar] [CrossRef]
  35. Grieve, C.M.; Grattan, S.R. Rapid assay for determination of water soluble quaternary ammonium compounds. Plant Soil. 1983, 70, 303–307. [Google Scholar] [CrossRef]
  36. Olenichenko, N.A.; Zagoskina, N.V.; Astakhova, N.V.; Trunova, T.I.; Kuznetsov, Y. V Primary and secondary metabolism of winter wheat under cold hardening and treatment with antioxidants. Appl. Biochem. Microbiol. 2008, 44, 535. [Google Scholar] [CrossRef]
  37. Dubois, M.; Gilles, K.A.; Hamilton, J.K.; Rebers, P.A.; Smith, F. Colorimetric method for determination of sugars and related substances. Anal. Chem. 1956, 28, 350–356. [Google Scholar] [CrossRef]
  38. Nikolaeva, T.N.; Lapshin, P.V.; Zagoskina, N.V. Method for determining the total content of phenolic compounds in plant extracts with Folin–Denis reagent and Folin–Ciocalteu reagent: modification and comparison. Russ. J. Bioorg. Chem. 2022, 48, 1519–1525. [Google Scholar] [CrossRef]
  39. Singleton, V.L.; Orthofer, R.; Lamuela Raverntos, R.M. Analysis of total phenols and other oxidation substrates and antioxidants by means of folin-ciocalteu reagent. Methods Enzymol. 1999, 299, 152–178. [Google Scholar] [CrossRef]
  40. Kurdyukov, Е.Е.; Vodop'yanova, O.A.; Mitishev, A.V.; Moiseev, Ya.P.; Semenova, E.F. Method for quantifying the amount of phenylpropanoids in Stevia raw materials. Khim. Rastit. Syr’ya. 2020, 3, 115–121. [Google Scholar] [CrossRef]
  41. Swain, T.; Hillis, W.E. The phenolic constituents of Prunus domestica. I.—The quantitative analysis of phenolic constituents. J. Sci. Food Agric. 1959, 10, 63–68. [Google Scholar] [CrossRef]
  42. Sarkar, S.K.; Howarth, R.E. Specificity of the vanillin test for flavanols. J. Agric. Food Chem. 1976, 24, 317–320. [Google Scholar] [CrossRef]
  43. Ossipova, S.; Ossipov, V.; Haukioja, E.; Loponen, J.; Pihlaja, K. Proanthocyanidins of mountain birch leaves: Quantification and properties. Phytochem. Anal. 2001, 12, 128–133. [Google Scholar] [CrossRef]
  44. Palta, J. P. Leaf chlorophyll content. Remote sens. rev. 1990, 5, 207–213. [Google Scholar] [CrossRef]
  45. Doroshenko, A.S.; Danilova, M.N.; Medvedeva, A.S.; Kusnetsov, V.V. Influence of blue-light signaling components on the regulation of cytokinin-dependent Arabidopsis thaliana seedlings’ greening. Russ. J. Plant Physiol. 2019, 66, 864–871. [Google Scholar] [CrossRef]
  46. Lukatkin, A.S. Contribution of oxidative stress to the development of cold-induced damage to leaves of chilling-sensitive plants: 1. Reactive oxygen species formation during plant chilling. Russ. J. Plant Physiol. 2002, 49, 622–627. [Google Scholar] [CrossRef]
  47. Hodges, D.M.; DeLong, J.M.; Forney, C.F.; Prange, R.K. Improving the thiobarbituric acid-reactive-substances assay for estimating lipid peroxidation in plant tissues containing anthocyanin and other interfering compounds. Planta 1999, 207, 604–611. [Google Scholar] [CrossRef]
  48. Efferth, T. Biotechnology applications of plant callus cultures. Engineering 2019, 5, 50–59. [Google Scholar] [CrossRef]
  49. Ikeuchi, M.; Sugimoto, K.; Iwase, A. Plant Callus: Mechanisms of induction and repression. Plant Cell 2013, 25, 3159–3173. [Google Scholar] [CrossRef]
  50. Kruglova, N.; Zinatullina, A.; Yegorova, N. Histological approach to the study of morphogenesis in callus cultures in vitro: A Review. Int. J. Plant Biol. 2023, 14, 533–545. [Google Scholar] [CrossRef]
  51. Zhang, Q.; Hu, J.; Liu, M.; Shi, Y.; De Vos, R.C.H.; Ruan, J. Stimulated biosynthesis of delphinidin-related anthocyanins in tea shoots reducing the quality of green tea in summer. J. Sci. Food Agric. 2019, 100, 1505–1514. [Google Scholar] [CrossRef] [PubMed]
  52. Doyle, S.M.; Diamond, M.; McCabe, P.F. Chloroplast and reactive oxygen species involvement in apoptotic-like programmed cell death in Arabidopsis suspension cultures. J. Exp. Bot. 2010, 61, 473–482. [Google Scholar] [CrossRef]
  53. Liu, X.; Li, Y.; Zhong, S. Interplay between light and plant hormones in the control of Arabidopsis seedling chlorophyll biosynthesis. Front. Plant Sci. 2017, 8, 1433. [Google Scholar] [CrossRef]
  54. Zhang, H.; Wang, L.; Deroles, S.; Bennett, R.; Davies, K. New insight into the structures and formation of anthocyanic vacuolar inclusions in flower petals. BMC Plant Biol. 2006, 6, 29. [Google Scholar] [CrossRef]
  55. Pan, Y.; Li, L.; Xiao, S.; Chen, Z.; Sarsaiya, S.; Zhang, S.; ShangGuan, Y.; Liu, H.; Xu, D. Callus growth kinetics and accumulation of secondary metabolites of Bletilla striata Rchb.f. using a callus suspension culture. PLoS ONE 2020, 15, e0220084. [Google Scholar] [CrossRef]
  56. Usman, H.; Ullah, M.A.; Jan, H.; Siddiquah, A.; Drouet, S.; Anjum, S.; Giglioli-Guviarc’h, N.; Hano, C.; Abbasi, B.H. Interactive effects of wide-spectrum monochromatic lights on phytochemical production, antioxidant and biological activities of Solanum xanthocarpum callus cultures. Molecules 2020, 25, 2201. [Google Scholar] [CrossRef]
  57. Phillips, G.; Garda, M. Plant tissue culture media and practices: An overview. Vitr. Cell. Dev. Biol. Plant. 2019, 55, 242–257. [Google Scholar] [CrossRef]
  58. Biswal, B.; Jena, B.; Giri, A.K.; Acharya, L. Monochromatic light elicited biomass accumulation, antioxidant activity, and secondary metabolite production in callus culture of Operculina turpethum (L.). PCTOC 2022, 149, 123–134. [Google Scholar] [CrossRef]
  59. Siegień, I.; Adamczuk, A.; Wróblewska, K. Light affects in vitro organogenesis of Linum usitatissimum L. and its cyanogenic potential. Acta Physiol. Plant. 2012, 35, 781–789. [Google Scholar] [CrossRef]
  60. Batista, D.; Felipe, S.H.S.; Silva, T.D.; De Castro, K.M.; Mamedes-Rodrigues, T.C.; Miranda, N.; Ríos, A.M.R.; Faria, D.; Fortini, E.A.; Chagas, K.; et al. Light quality in plant tissue culture: Does it matter? In Vitro Cell. Dev. Biol. Plant. 2018, 54, 195–215. [Google Scholar] [CrossRef]
  61. Chen, X.; Tao, H.; Wu, Y.; Xu, X. Effects of Cadmium on metabolism of photosynthetic pigment and photosynthetic system in Lactuca sativa L. revealed by physiological and proteomics analysis. Sci. Hortic. 2022, 305, 111371. [Google Scholar] [CrossRef]
  62. Kouril, R.; Ilík, P.; Naus, J.; Schoefs, B. On the limits of applicability of spectrophotometric and spectrofluorimetric methods for the determination of chlorophyll a/b ratio. Photosynth. Res. 1999, 62, 107–116. [Google Scholar] [CrossRef]
  63. Simkin, A.J.; Kapoor, L.; Doss, C.G.P.; Hofmann, T.A.; Lawson, T.; Ramamoorthy, S. The role of photosynthesis related pigments in light harvesting, photoprotection and enhancement of photosynthetic yield in planta. Photosynth. Res. 2022, 152, 23–42. [Google Scholar] [CrossRef] [PubMed]
  64. Seydel, C.; Kitashova, A.; Fürtauer, L.; Nägele, T. Temperature-induced dynamics of plant carbohydrate metabolism. Physiol. Plant. 2022, 174, e13602. [Google Scholar] [CrossRef] [PubMed]
  65. Julius, B.T.; Leach, K.A.; Tran, T.M.; Mertz, R.A.; Braun, D.M. Sugar transporters in plants: New insights and discoveries. Plant Cell Physiol. 2017, 58, 1442–1460. [Google Scholar] [CrossRef] [PubMed]
  66. Srivastava, D.; Shamim, M.; Kumar, M.; Mishra, A.; Maurya, R.; Sharma, D.; Pandey, P.; Singh, K.N. Role of circadian rhythm in plant system: An update from development to stress response. Environ Exp. Bot. 2019, 162, 256–271. [Google Scholar] [CrossRef]
  67. Azad, M.O.K.; Kjaer, K.H.; Adnan, M.; Naznin, M.T.; Lim, J.D.; Sung, I.J.; Park, C.H.; Lim, Y.S. The evaluation of growth performance, photosynthetic capacity, and primary and secondary metabolite content of leaf lettuce grown under limited irradiation of blue and red LED light in an urban plant factory. Agriculture 2020, 10, 28. [Google Scholar] [CrossRef]
  68. Khan, T.; Abbasi, B.H.; Khan, M.A. The interplay between light, plant growth regulators and elicitors on growth and secondary metabolism in cell cultures of Fagonia indica. J. Photochem. Photobiol. B Biol. 2018, 185, 153–160. [Google Scholar] [CrossRef] [PubMed]
  69. Luo, Y.; Jian, Y.Q.; Liu, Y.K.; Jiang, S.; Muhammad, D.; Wang, W. Flavanols from nature: A phytochemistry and biological activity review. Molecules 2022, 27, 719. [Google Scholar] [CrossRef] [PubMed]
  70. Sharma, A.K.; Beniwal, V. Biosynthesis and medicinal applications of proanthocyanidins: A recent update. Biocatal. Agric. Biotechnol. 2022, 45, 102500. [Google Scholar] [CrossRef]
  71. Hashim, M.; Ahmad, B.; Drouet, S.; Hano, C.; Abbasi, B.H.; Anjum, S. Comparative effects of different light sources on the production of key secondary metabolites in plants in vitro cultures. Plants 2021, 10, 1521. [Google Scholar] [CrossRef]
  72. Meitha, K.; Pramesti, Y.; Suhandono, S. Reactive oxygen species and antioxidants in postharvest vegetables and fruits. Int. J. Food Sci. 2020, 8817778. [Google Scholar] [CrossRef] [PubMed]
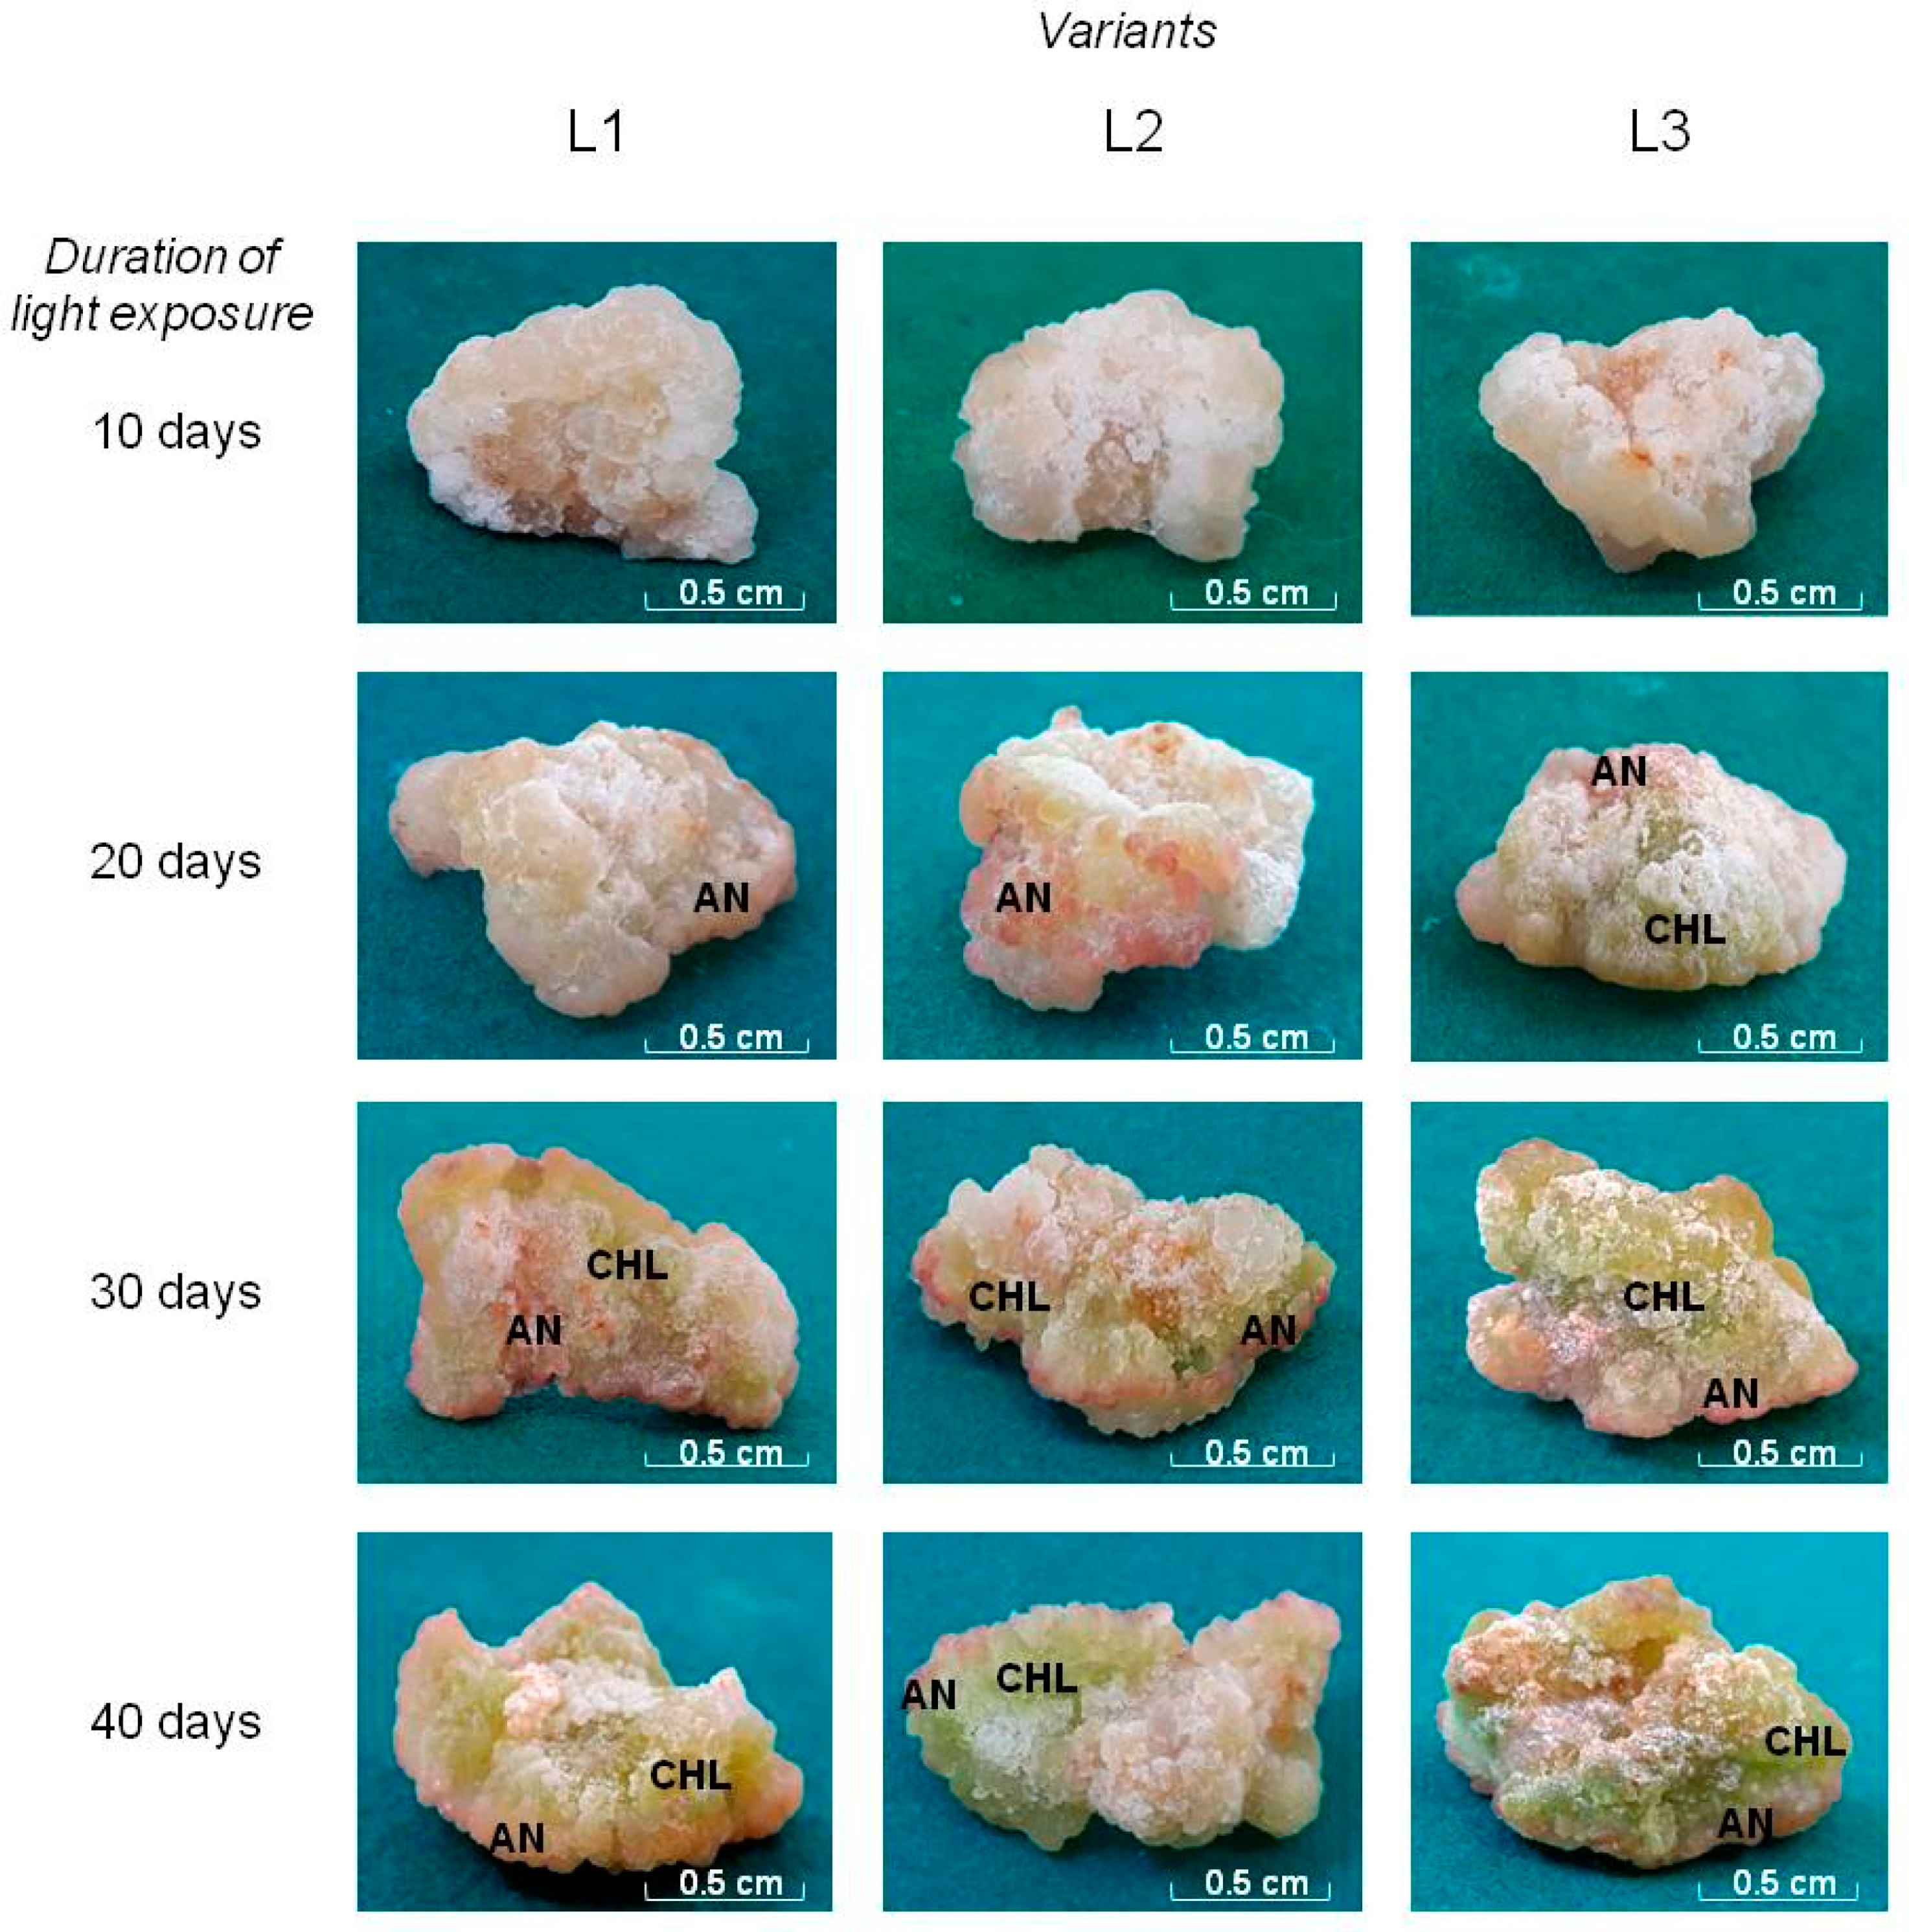
Figure 1. Tea callus cultures grown under different intensity and duration of light exposure. Light intensity variants: L1 – 50 µmol·m−2·s−1; L2 – 75 µmol·m−2·s−1; L3 – 100 µmol·m−2·s−1. Symbols: AN – anthocyanin-containing cells, CHL – chlorophyll containing cells.
Preprints 93126 g001
Figure 2. Biomass growth dynamics of tea callus cultures grown under different intensity and duration of light exposure. Light intensity variants: L1 – 50 µmol·m−2·s−1; L2 – 75 µmol·m−2·s−1; L3 – 100 µmol·m−2·s−1. Results are expressed as means ± SDs, n = 3. The significant differences at p < 0.05 are denoted by different Latin letters: uppercase letters indicate significant differences between different light intensities in alphabetic order from highest to lowest, lowercase letters indicate significant differences between duration of light exposure in alphabetic order from highest to lowest. Pairwise multiple comparisons were carried out using Tukey’s range test.
Preprints 93126 g002
Figure 3. The chlorophyll a (a) and chlorophyll b (b) fluorescence intensity (FI) in tea callus cultures grown under different intensity and duration of light exposure. Light intensity variants: L1 - 50 µmol·m−2·s−1; L2 - 75 µmol·m−2·s−1; L3 - 100 µmol·m−2·s−1. Results are expressed as means ± SDs, n = 3. The significant differences at p < 0.05 are denoted by different Latin letters: uppercase letters indicate significant differences between different light intensities in alphabetic order from highest to lowest, lowercase letters indicate significant differences between duration of light exposure in alphabetic order from highest to lowest. Pairwise multiple comparisons were carried out using Tukey’s range test.
Preprints 93126 g003
Figure 4. The total soluble carbohydrates content (TCC) in tea callus cultures grown under different intensity and duration of light exposure. Light intensity variants: L1 – 50 µmol·m−2·s−1; L2 – 75 µmol·m−2·s−1; L3 – 100 µmol·m−2·s−1. Results are expressed as means ± SDs, n = 3. The significant differences at p < 0.05 are denoted by different Latin letters: uppercase letters indicate significant differences between different light intensities in alphabetic order from highest to lowest, lowercase letters indicate significant differences between duration of light exposure in alphabetic order from highest to lowest. Pairwise multiple comparisons were carried out using Tukey’s range test.
Preprints 93126 g004
Figure 5. The content of different phenolic compounds in tea callus cultures grown under different intensity and duration of light exposure. TPC – total phenolic content (a), PPC – phenylpropanoids content (b), FLC – flavanols content (c) and PAC – proanthocyanidins content (d). Light intensity variants: L1 – 50 µmol·m−2·s−1; L2 – 75 µmol·m−2·s−1; L3 – 100 µmol·m−2·s−1. Results are expressed as means ± SDs, n = 3. The significant differences at p < 0.05 are denoted by different Latin letters: uppercase letters indicate significant differences between different light intensities in alphabetic order from highest to lowest, lowercase letters indicate significant differences between duration of light exposure in alphabetic order from highest to lowest. Pairwise multiple comparisons were carried out using Tukey’s range test.
Preprints 93126 g005
Figure 6. The malondialdehyde (MDA) content in tea callus cultures grown under different intensity and duration of light exposure. Light intensity variants: L1 – 50 µmol·m−2·s−1; L2 – 75 µmol·m−2·s−1; L3 – 100 µmol·m−2·s−1. Results are expressed as means ± SDs, n = 3. The significant differences at p < 0.05 are denoted by different Latin letters: uppercase letters indicate significant differences between different light intensities in alphabetic order from highest to lowest, lowercase letters indicate significant differences between duration of light exposure in alphabetic order from highest to lowest. Pairwise multiple comparisons were carried out using Tukey’s range test.
Preprints 93126 g006
Table 1. Water content in tea callus cultures grown under different intensity and duration of light exposure.
Duration of light exposure, days Water Content in Cultures of Different Variants, %
L1 L2 L3
10 89.77 ± 0.21Aa 89.08 ± 0.22Aa 89.34 ± 0.21Aa
20 89.32 ± 0.18Aa 89.6 ± 0.37Aa 87.43 ± 0.19Aa
30 89.65 ± 0.30Aa 86.54 ± 2.45Ab 87.24 ± 1.65Aa
40 88.37 ± 0.18Aa 90.84 ± 0.74Aa 89.55 ± 0.10Aa
Light intensity variants: L1 – 50 µmol·m−2·s−1; L2 – 75 µmol·m−2·s−1; L3 – 100 µmol·m−2·s−1. Results are expressed as means ± SDs, n = 3. The significant differences at p < 0.05 are denoted by different Latin letters: uppercase letters indicate significant differences between different light intensities in alphabetic order from highest to lowest, lowercase letters indicate significant differences between duration of light exposure in alphabetic order from highest to lowest. Pairwise multiple comparisons were carried out using Tukey’s range test.
Disclaimer/Publisher’s Note: The statements, opinions and data contained in all publications are solely those of the individual author(s) and contributor(s) and not of MDPI and/or the editor(s). MDPI and/or the editor(s) disclaim responsibility for any injury to people or property resulting from any ideas, methods, instructions or products referred to in the content.
Copyright: This open access article is published under a Creative Commons CC BY 4.0 license, which permit the free download, distribution, and reuse, provided that the author and preprint are cited in any reuse.
Alerts
Prerpints.org logo

Preprints.org is a free preprint server supported by MDPI in Basel, Switzerland.

Subscribe

© 2025 MDPI (Basel, Switzerland) unless otherwise stated