Submitted:
13 December 2023
Posted:
13 December 2023
You are already at the latest version
Abstract
Keywords:
1. Introduction
2. Research Area and Data
2.1. Introduction to the Research Area
2.2. Data Preparation
3. Methods
3.1. Overview
3.2. Calculation of Component Indicators
3.2.1. Calculation of Greenness Index
3.2.2. Calculation of Humidity Index
3.2.3. Calculation of Dryness Index
3.2.4. Calculation of Heat Index
- (1)
- Radiometric calibration
- (2)
- NDVI calculation
- (3)
- Vegetation cover calculation
- (1)
- Calculation of Surface Emissivity (SE)
- (2)
- Calculation of blackbody radiance values under identical temperature conditions
3.2.5. Calculation of Salinity Index
3.3. Calculation of IRSEI
4. Results
4.1. Results of Component Indicators
4.1.1. Results of Greenness Index
4.1.2. Results of Humidity Index
4.1.3. Results of Dryness Index
4.1.4. Results of Heat Index
4.1.5. Results of Salinity Index
4.2. Results of IRSEI
4.2.1. Validity Analysis of IRSEI
4.2.2. Analysis of Spatial and Temporal Variations
5. Discussion and Conclusions
Author Contributions
Funding
Acknowledgments
Conflicts of Interest
References
- Xu, H.Q. A remote sensing urban ecological index and its application. Acta Ecologica Sinica 2013, 33(24), 7853–7862. [Google Scholar]
- Hatfield, S.B.I.A. Normalizing the stress-degree-day parameter for environmental variability. Agricultural Meteorology 1981.
- Xu, H.; et al. Prediction of ecological effects of potential population and impervious surface increases using a remote sensing based ecological index (RSEI). Ecological Indicators 2019, 93, 730–740. [Google Scholar] [CrossRef]
- Yuan, B.; et al. Spatiotemporal change detection of ecological quality and the associated affecting factors in Dongting Lake Basin, Based on RSEI. Journal of Cleaner Production 2021, (Suppl 1), 126995. [Google Scholar] [CrossRef]
- Xu, H.; et al. Remote Sensing Detecting Ecological Changes with a Remote Sensing Based Ecological Index (RSEI) Produced Time Series and Change Vector Analysis. Remote Sensing 2019, 11. [Google Scholar] [CrossRef]
- Jing, Y.; et al. Assessment of spatial and temporal variation of ecological environment quality in Ebinur Lake Wetland National Nature Reserve, Xinjiang, China. Ecological Indicators 2020, 110, 105874. [Google Scholar] [CrossRef]
- Qureshi, S.; et al. A Remotely Sensed Assessment of Surface Ecological Change over the Gomishan Wetland, Iran. Remote Sensing 2020, 12(18), 2989. [Google Scholar] [CrossRef]
- B, C.L.A.; et al. Spatiotemporal evolution of island ecological quality under different urban densities: A comparative analysis of Xiamen and Kinmen Islands, southeast China. Ecological Indicators 2021, 124. [Google Scholar]
- Jiang, C.; et al. Dynamic monitoring of eco-environmental quality in arid desert area by remote sensing: Taking the Gurbantunggut Desert China as an example. Journal of applied ecology 2019, 30(3), 877–883. [Google Scholar]
- Airiken, M.; et al. Assessment of spatial and temporal ecological environment quality under land use change of urban agglomeration in the North Slope of Tianshan, China. Environmental Science and Pollution Research 2022, 29(8), 12282–12299. [Google Scholar] [CrossRef]
- Song, H.M. and L. Xue. Dynamic monitoring and analysis of ecological environment in Weinan City, Northwest China based on RSEI model. Journal of applied ecology 2016, 27(12), 3913. [Google Scholar]
- Nie, X.; et al. Research on Temporal and Spatial Resolution and the Driving Forces of Ecological Environment Quality in Coal Mining Areas Considering Topographic Correction. Remote Sensing 2021. [CrossRef]
- Moran, M.S.; et al. Estimating crop water deficit using the relation between surface-air temperature and spectral vegetation index. Remote Sensing of Environment 1994, 49(3), 246–263. [Google Scholar] [CrossRef]
- Lei, M., et al., Uncertainty of Object-Based Image Analysis for Drone Survey Images. 2018: Drones - Applications.
- Benz, U.C.; et al. Multi-resolution, object-oriented fuzzy analysis of remote sensing data for GIS-ready information. ISPRS Journal of Photogrammetry and Remote Sensing 2004, 58(3/4), 239–258. [Google Scholar] [CrossRef]
- Rouse, J.W., et al., Monitoring Vegetation Systems in the Great Plains with Erts. NASA Special Publication, 1974. 351.
- Zha, Y., J. Gao and N.I. S. Use of normalized difference built-up index in automatically mapping urban areas from TM imagery. International Journal of Remote Sensing 2003, 24(3), 583–594. [Google Scholar] [CrossRef]
- Roy, P.S., A. Rikimaru and S. Miyatake. Tropical forest cover density mapping. Tropical Ecology 2002, 43(No 1), 39–47. [Google Scholar]
- Xu, H. A new index for delineating built-up land features in satellite imagery. International Journal of Remote Sensing 2008, 29(14), 4269–4276. [Google Scholar] [CrossRef]
- Xu and Hanqiu. Analysis of Impervious Surface and its Impact on Urban Heat Environment using the Normalized Difference Impervious Surface Index (NDISI). Photogrammetric Engineering & Remote Sensing 2010, 76(5), 557–565. [Google Scholar]
- Shivers, S.W., D.A. Roberts and J.P. Mcfadden. Using paired thermal and hyperspectral aerial imagery to quantify land surface temperature variability and assess crop stress within California orchards. Remote Sensing of Environment 2019, 222, 215–231. [Google Scholar] [CrossRef]
- Wulder, M.A.; et al. Current status of Landsat program, science, and applications. Remote Sensing of Environment 2019, 225, 127–147. [Google Scholar] [CrossRef]
- Jimenez-Munoz, J.C.; et al. Revision of the Single-Channel Algorithm for Land Surface Temperature Retrieval From Landsat Thermal-Infrared Data. IEEE Transactions on Geoscience and Remote Sensing 2009, 47(1), 339–349. [Google Scholar] [CrossRef]
- Jiménez-Muoz, J.C. and J.A. Sobrino. A generalized single-channel method for retrieving land surface temperature from remote sensing data (vol 109, art no D08112, 2004). Journal of Geophysical Research Atmospheres 2003, 108(D8). [Google Scholar]
- Duan, S.B.; et al. Land-surface temperature retrieval from Landsat 8 single-channel thermal infrared data in combination with NCEP reanalysis data and ASTER GED product. International Journal of Remote Sensing 2018, 1–16. [Google Scholar] [CrossRef]
- A, L.Y. and D.P.R.A. B. Spatially and temporally complete Landsat reflectance time series modelling: The fill-and-fit approach. Remote Sensing of Environment 2020, 241. [Google Scholar]
- Zhichun, W.U.; et al. A Review on Application of Techniques of Principle Component Analysis on Extracting Alteration Information of Remote Sensing. Journal of Geo-Information Science 2018. [Google Scholar]
- Shrivastava, P. and R. Kumar. Soil salinity: A serious environmental issue and plant growth promoting bacteria as one of the tools for its alleviation. Saudi Journal of Biological Sciences 2015, 22(2), 123–131. [Google Scholar] [CrossRef]
- Xiao, X.L.J. Soil salinization of cultivated land in Shandong Province, China-Dynamics during the past 40 years. Land Degradation and Development 2019, 30(4). [Google Scholar] [CrossRef]
- Yang, J.S. Development and prospect of the research on salt-affected soils in China. Acta Pedologica Sinica 2008.
- A, A.A. and R.A. B. Mapping soil salinity in arid and semi-arid regions using Landsat 8 OLI satellite data-ScienceDirect. Remote Sensing Applications: Society and Environment 2019, 13, 415–425. [Google Scholar]
- Kumar, N., S.K. Singh and H.K. Pandey. Drainage morphometric analysis using open access earth observation datasets in a drought-affected part of Bundelkhand, India. Applied Geomatics 2018, 10(2), 1–17. [Google Scholar] [CrossRef]
- Jun-Han, L.I. and G. Ming-Xiu. Temporal and Spatial Characteristics of Salinization of Coastal Soils in the Yellow River Delta. Chinese Journal of Soil Science 2018.
- Abderrazak, B.; et al. Sentinel-MSI VNIR and SWIR Bands Sensitivity Analysis for Soil Salinity Discrimination in an Arid Landscape. Remote Sensing 2018, 10(6), 1–20. [Google Scholar]
- Scudiero, E., T.H. Skaggs and D.L. Corwin. Regional-scale soil salinity assessment using Landsat ETM+ canopy reflectance. Remote Sensing of Environment 2015, 169, 335–343. [Google Scholar] [CrossRef]
- Wang, J.; et al. Capability of Sentinel-2 MSI data for monitoring and mapping of soil salinity in dry and wet seasons in the Ebinur Lake region, Xinjiang, China. Geoderma 2019, 353, 172–187. [Google Scholar] [CrossRef]
- Khan, N.M.; et al. Assessment of hydrosaline land degradation by using a simple approach of remote sensing indicators. Agricultural Water Management 2005, 77(1-3), 96–109. [Google Scholar] [CrossRef]
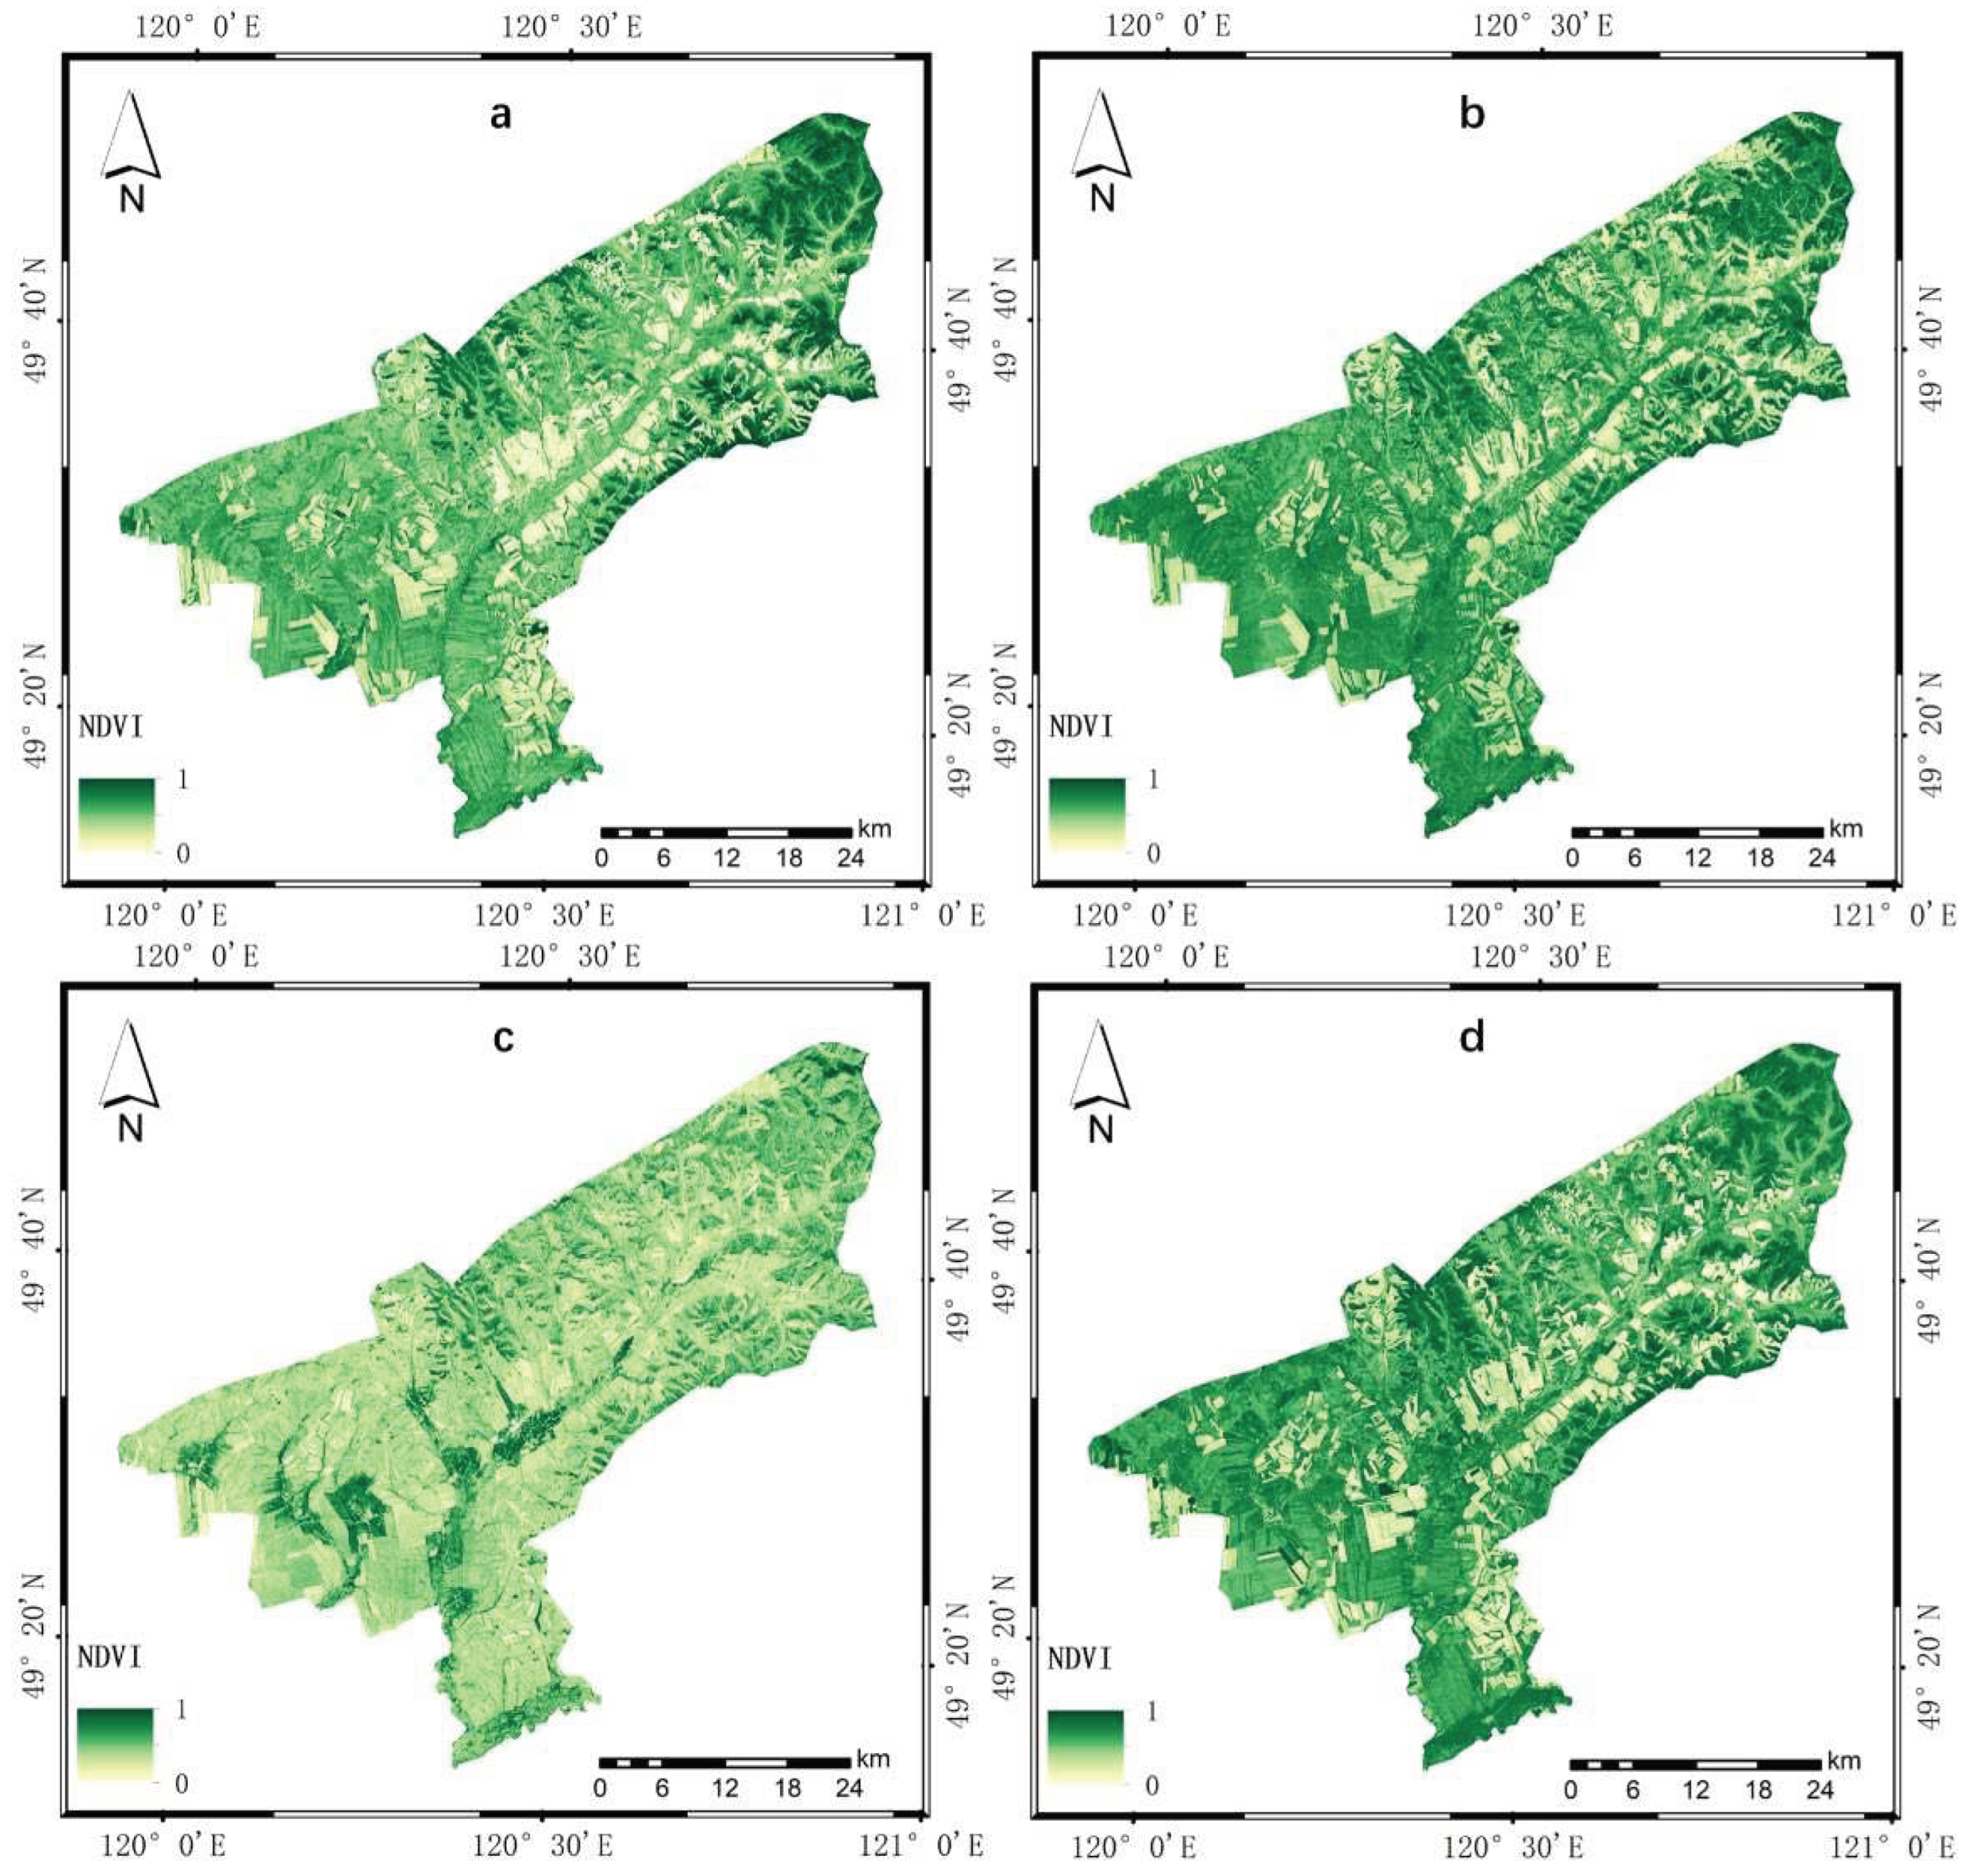
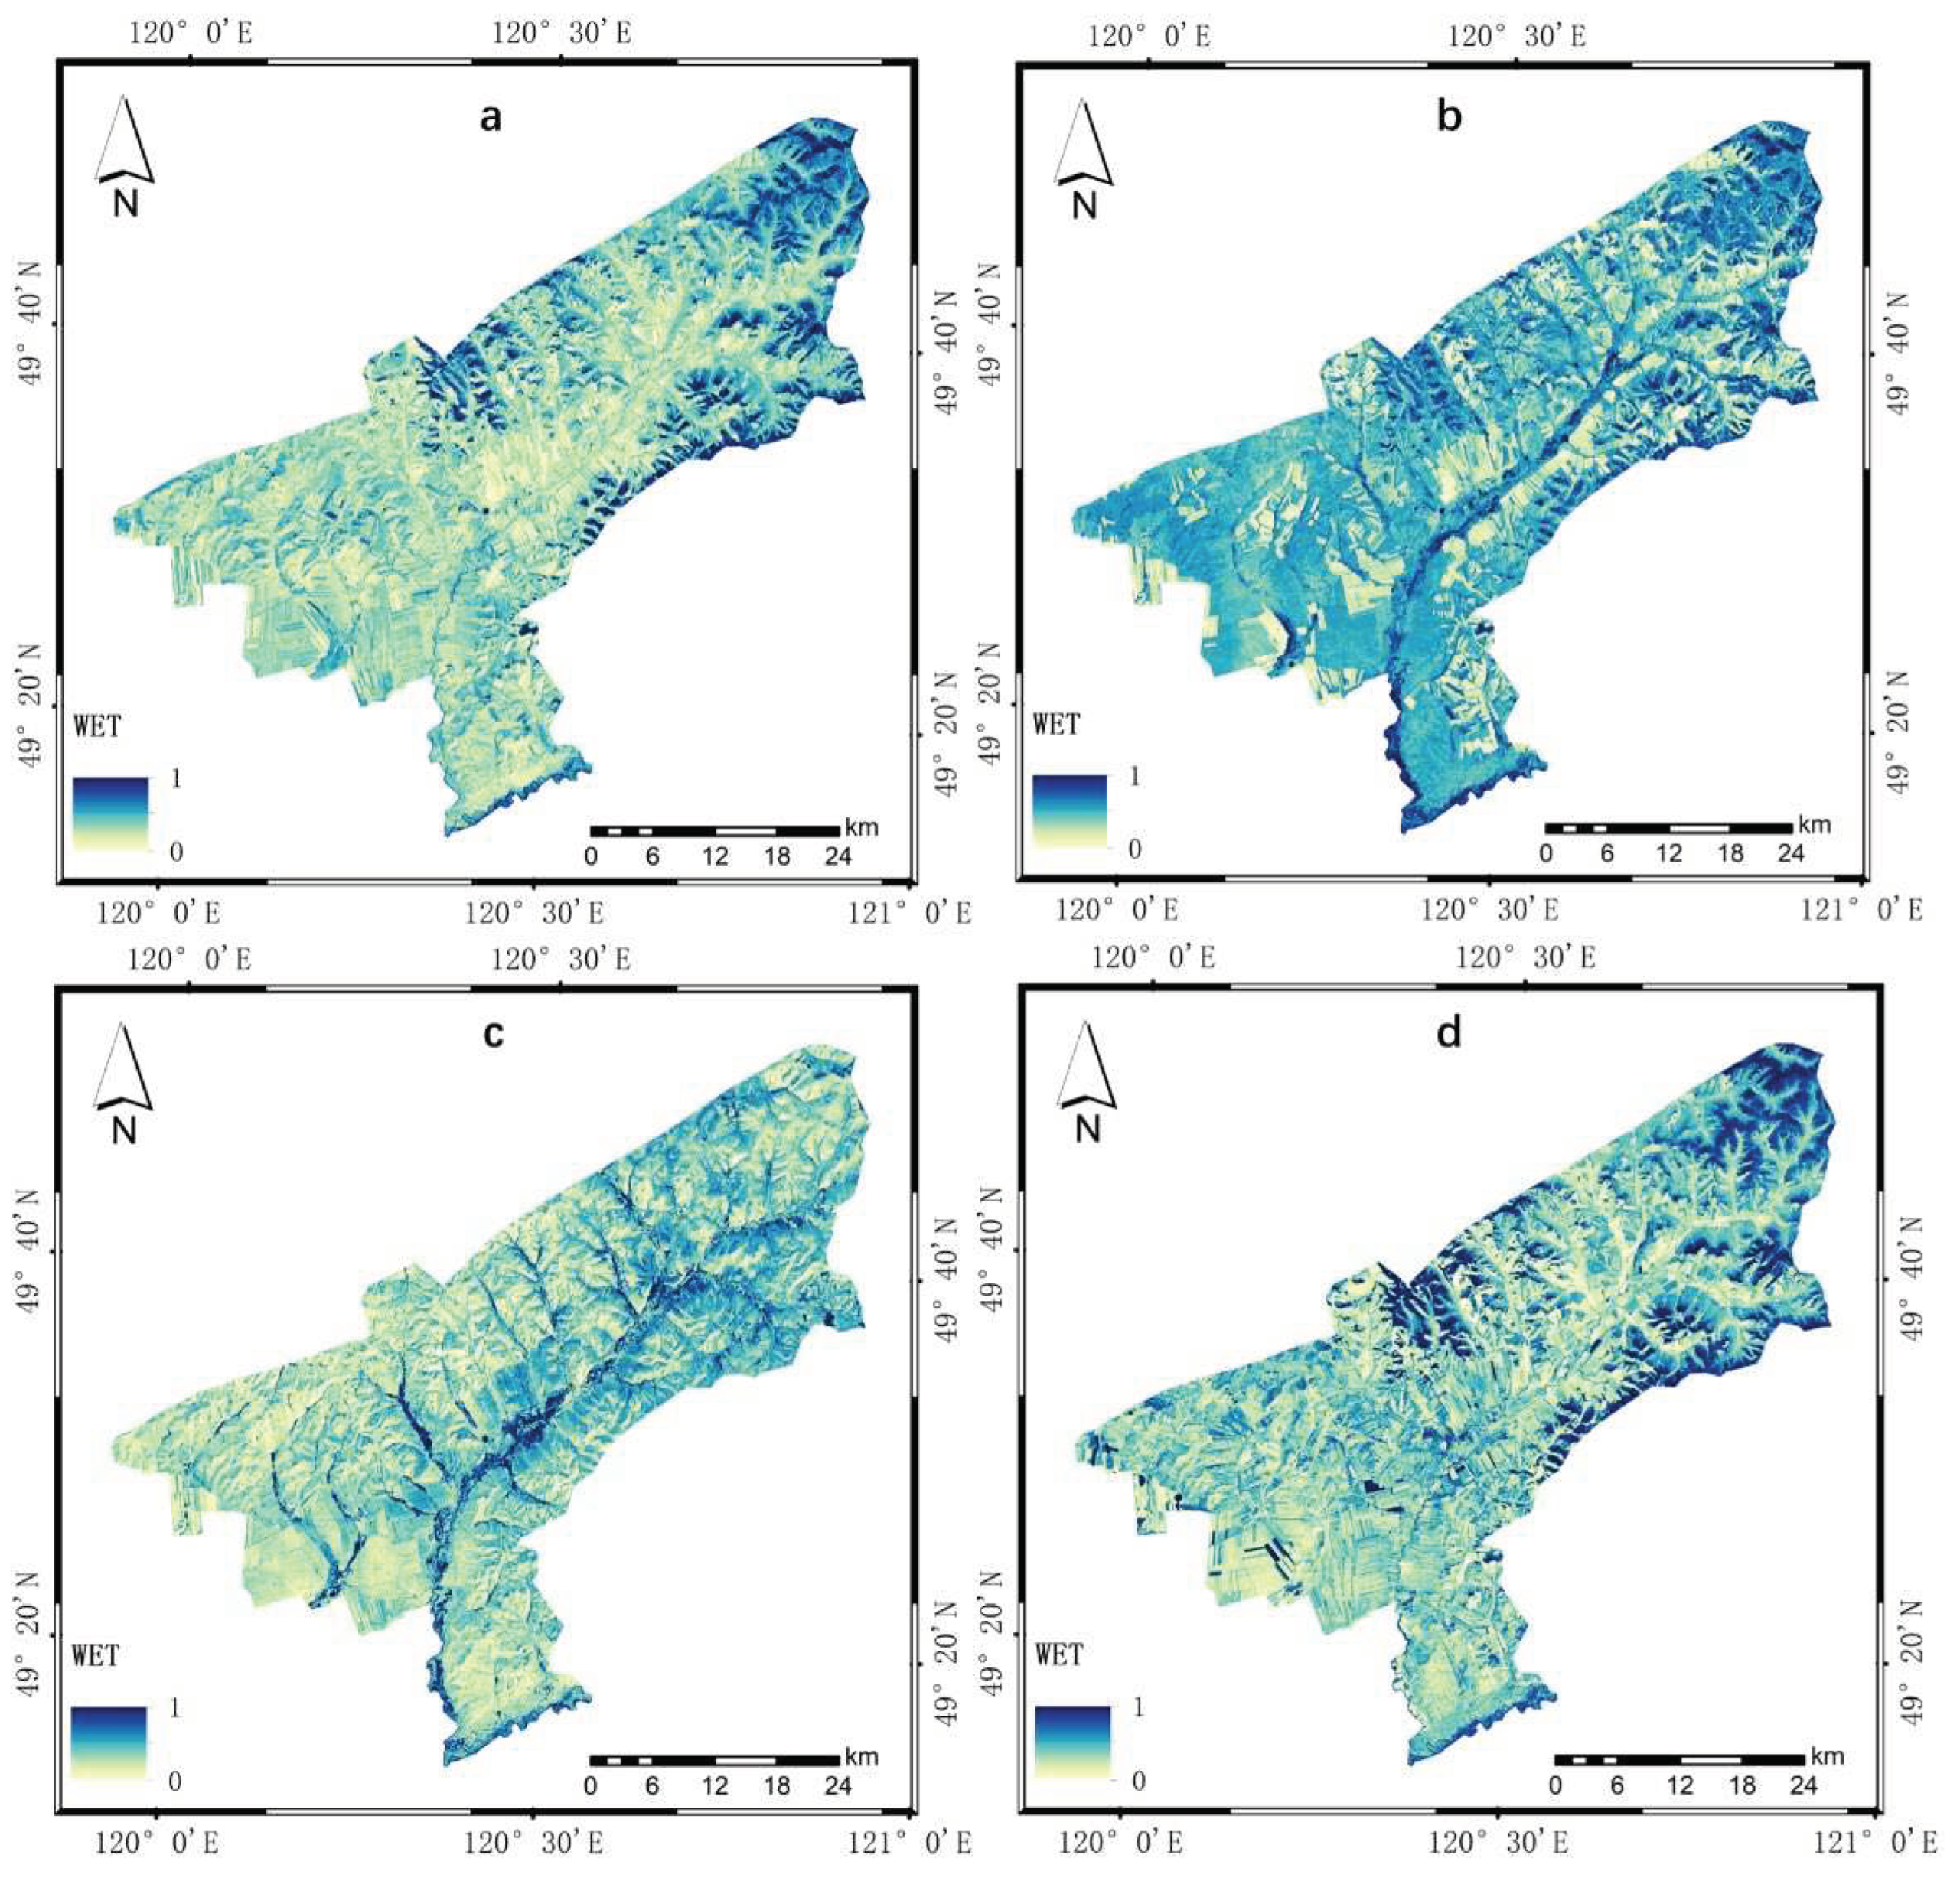
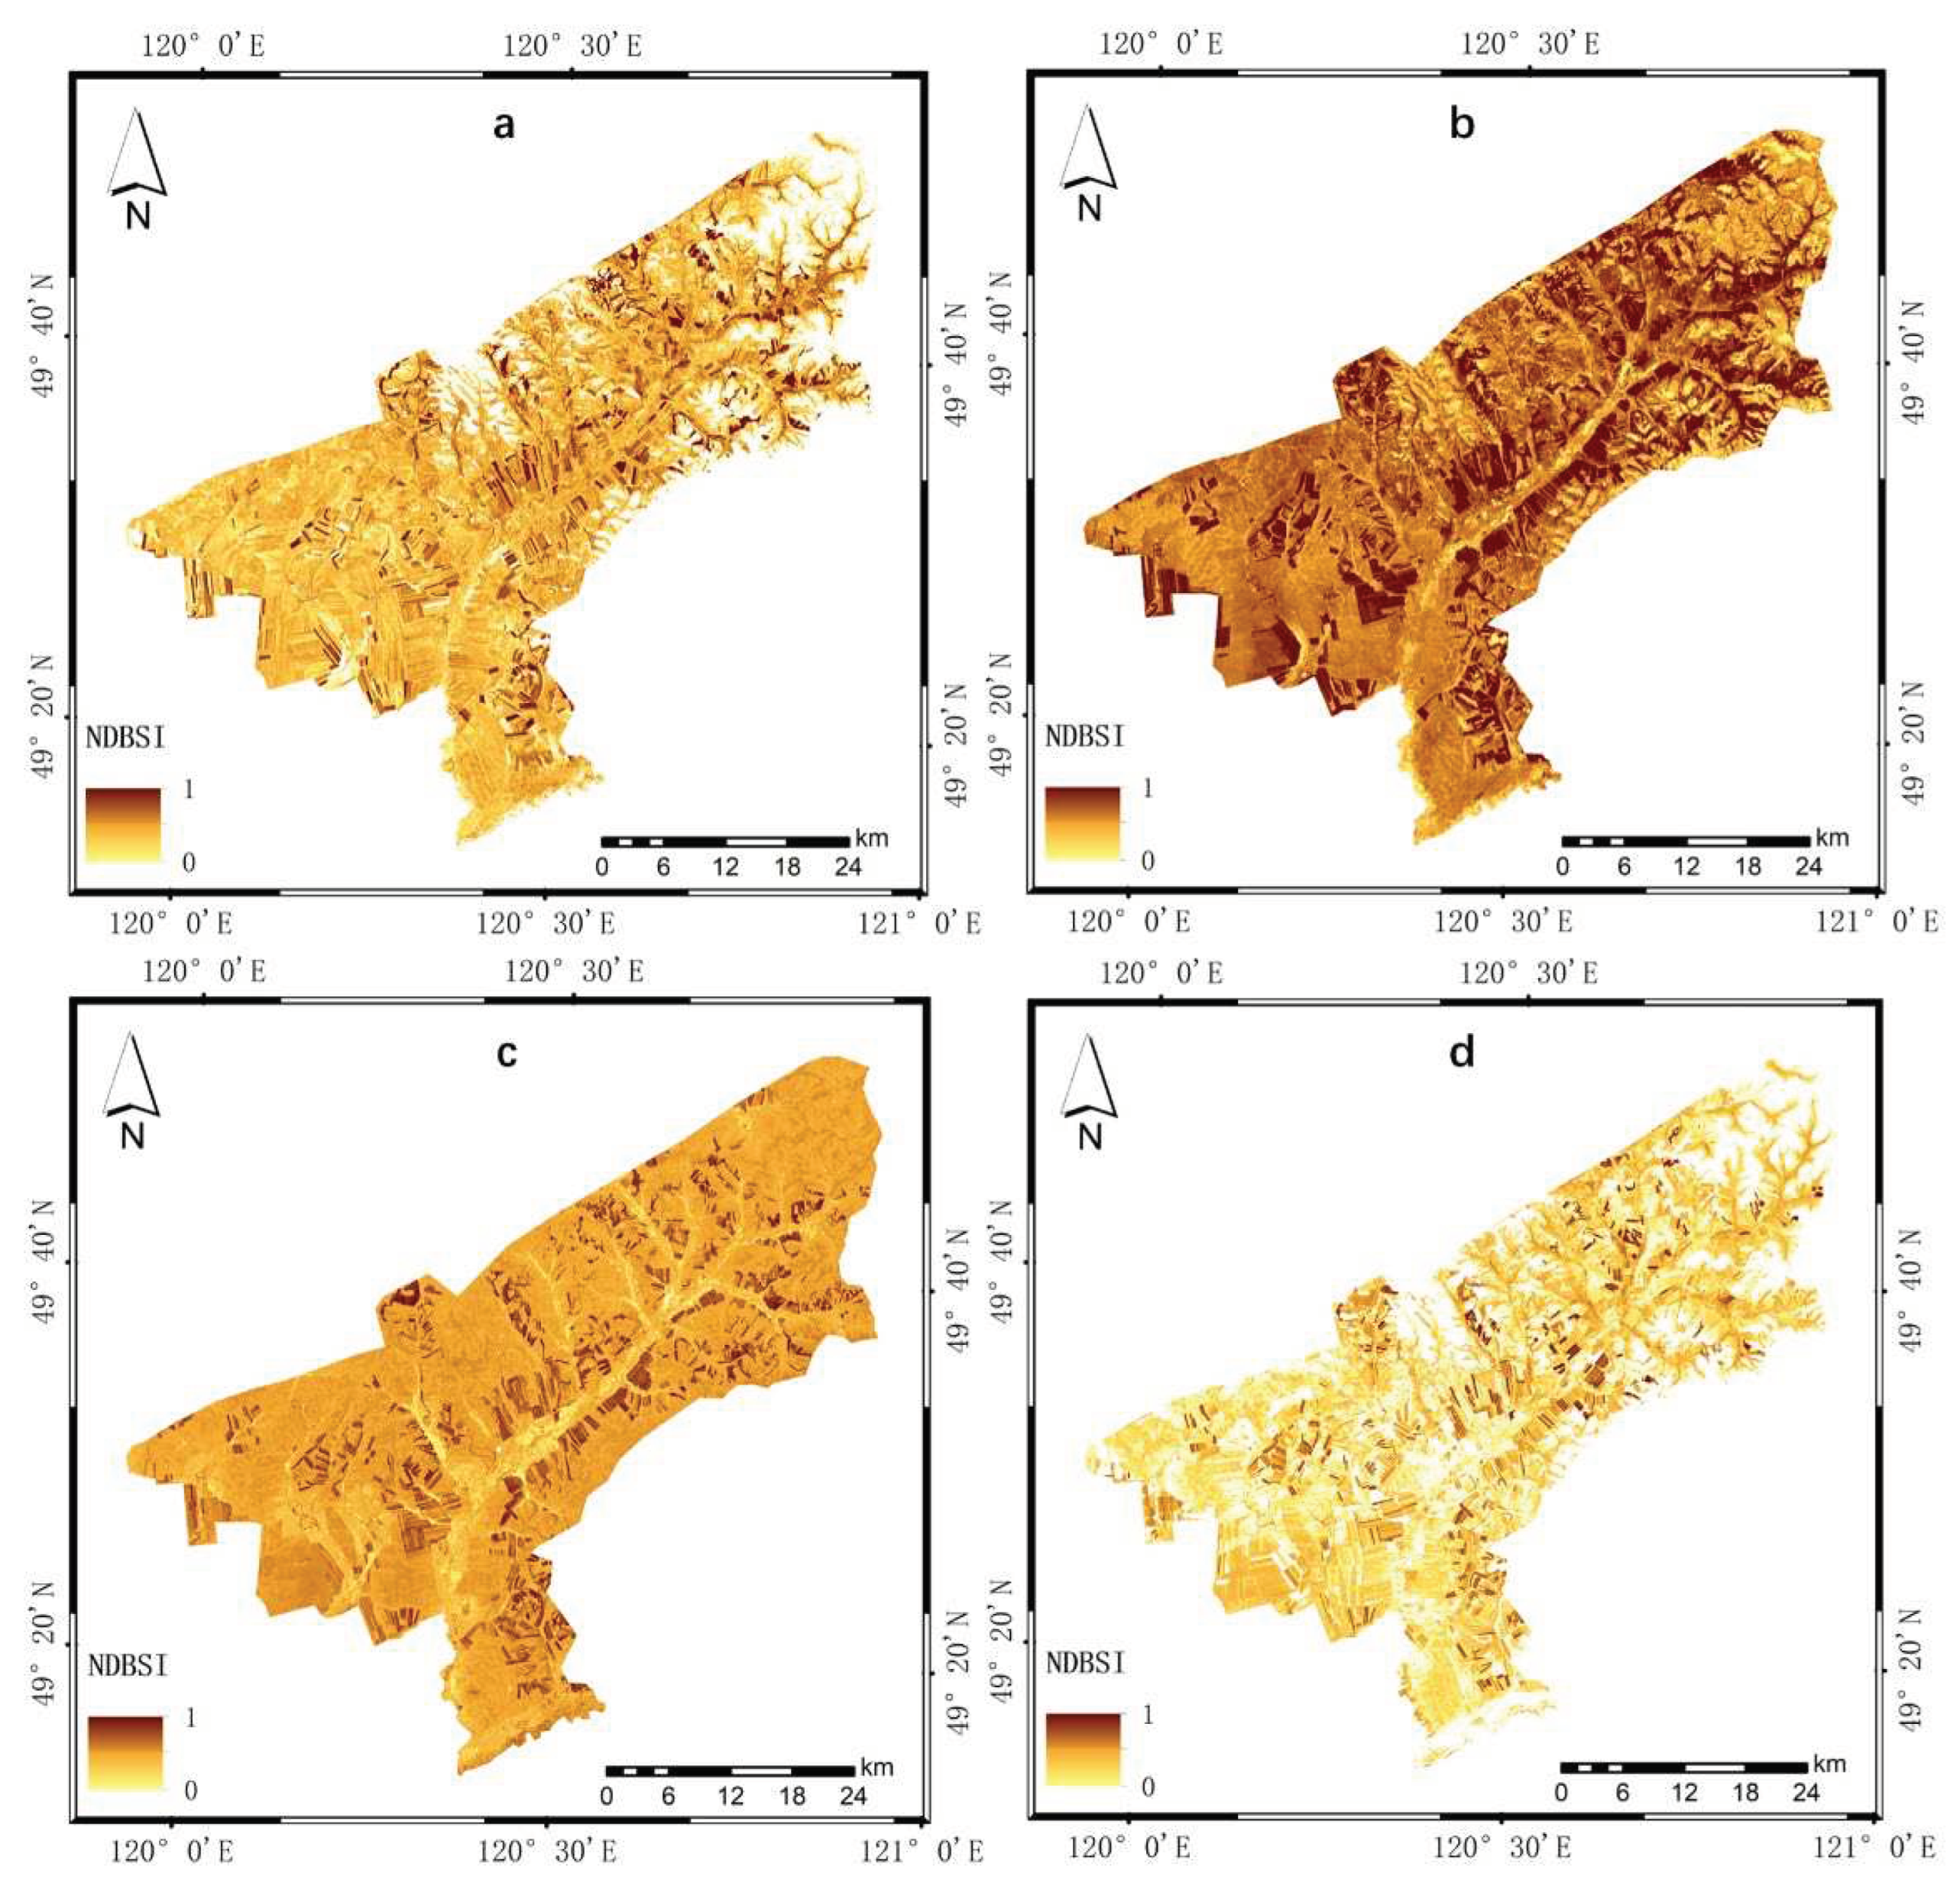
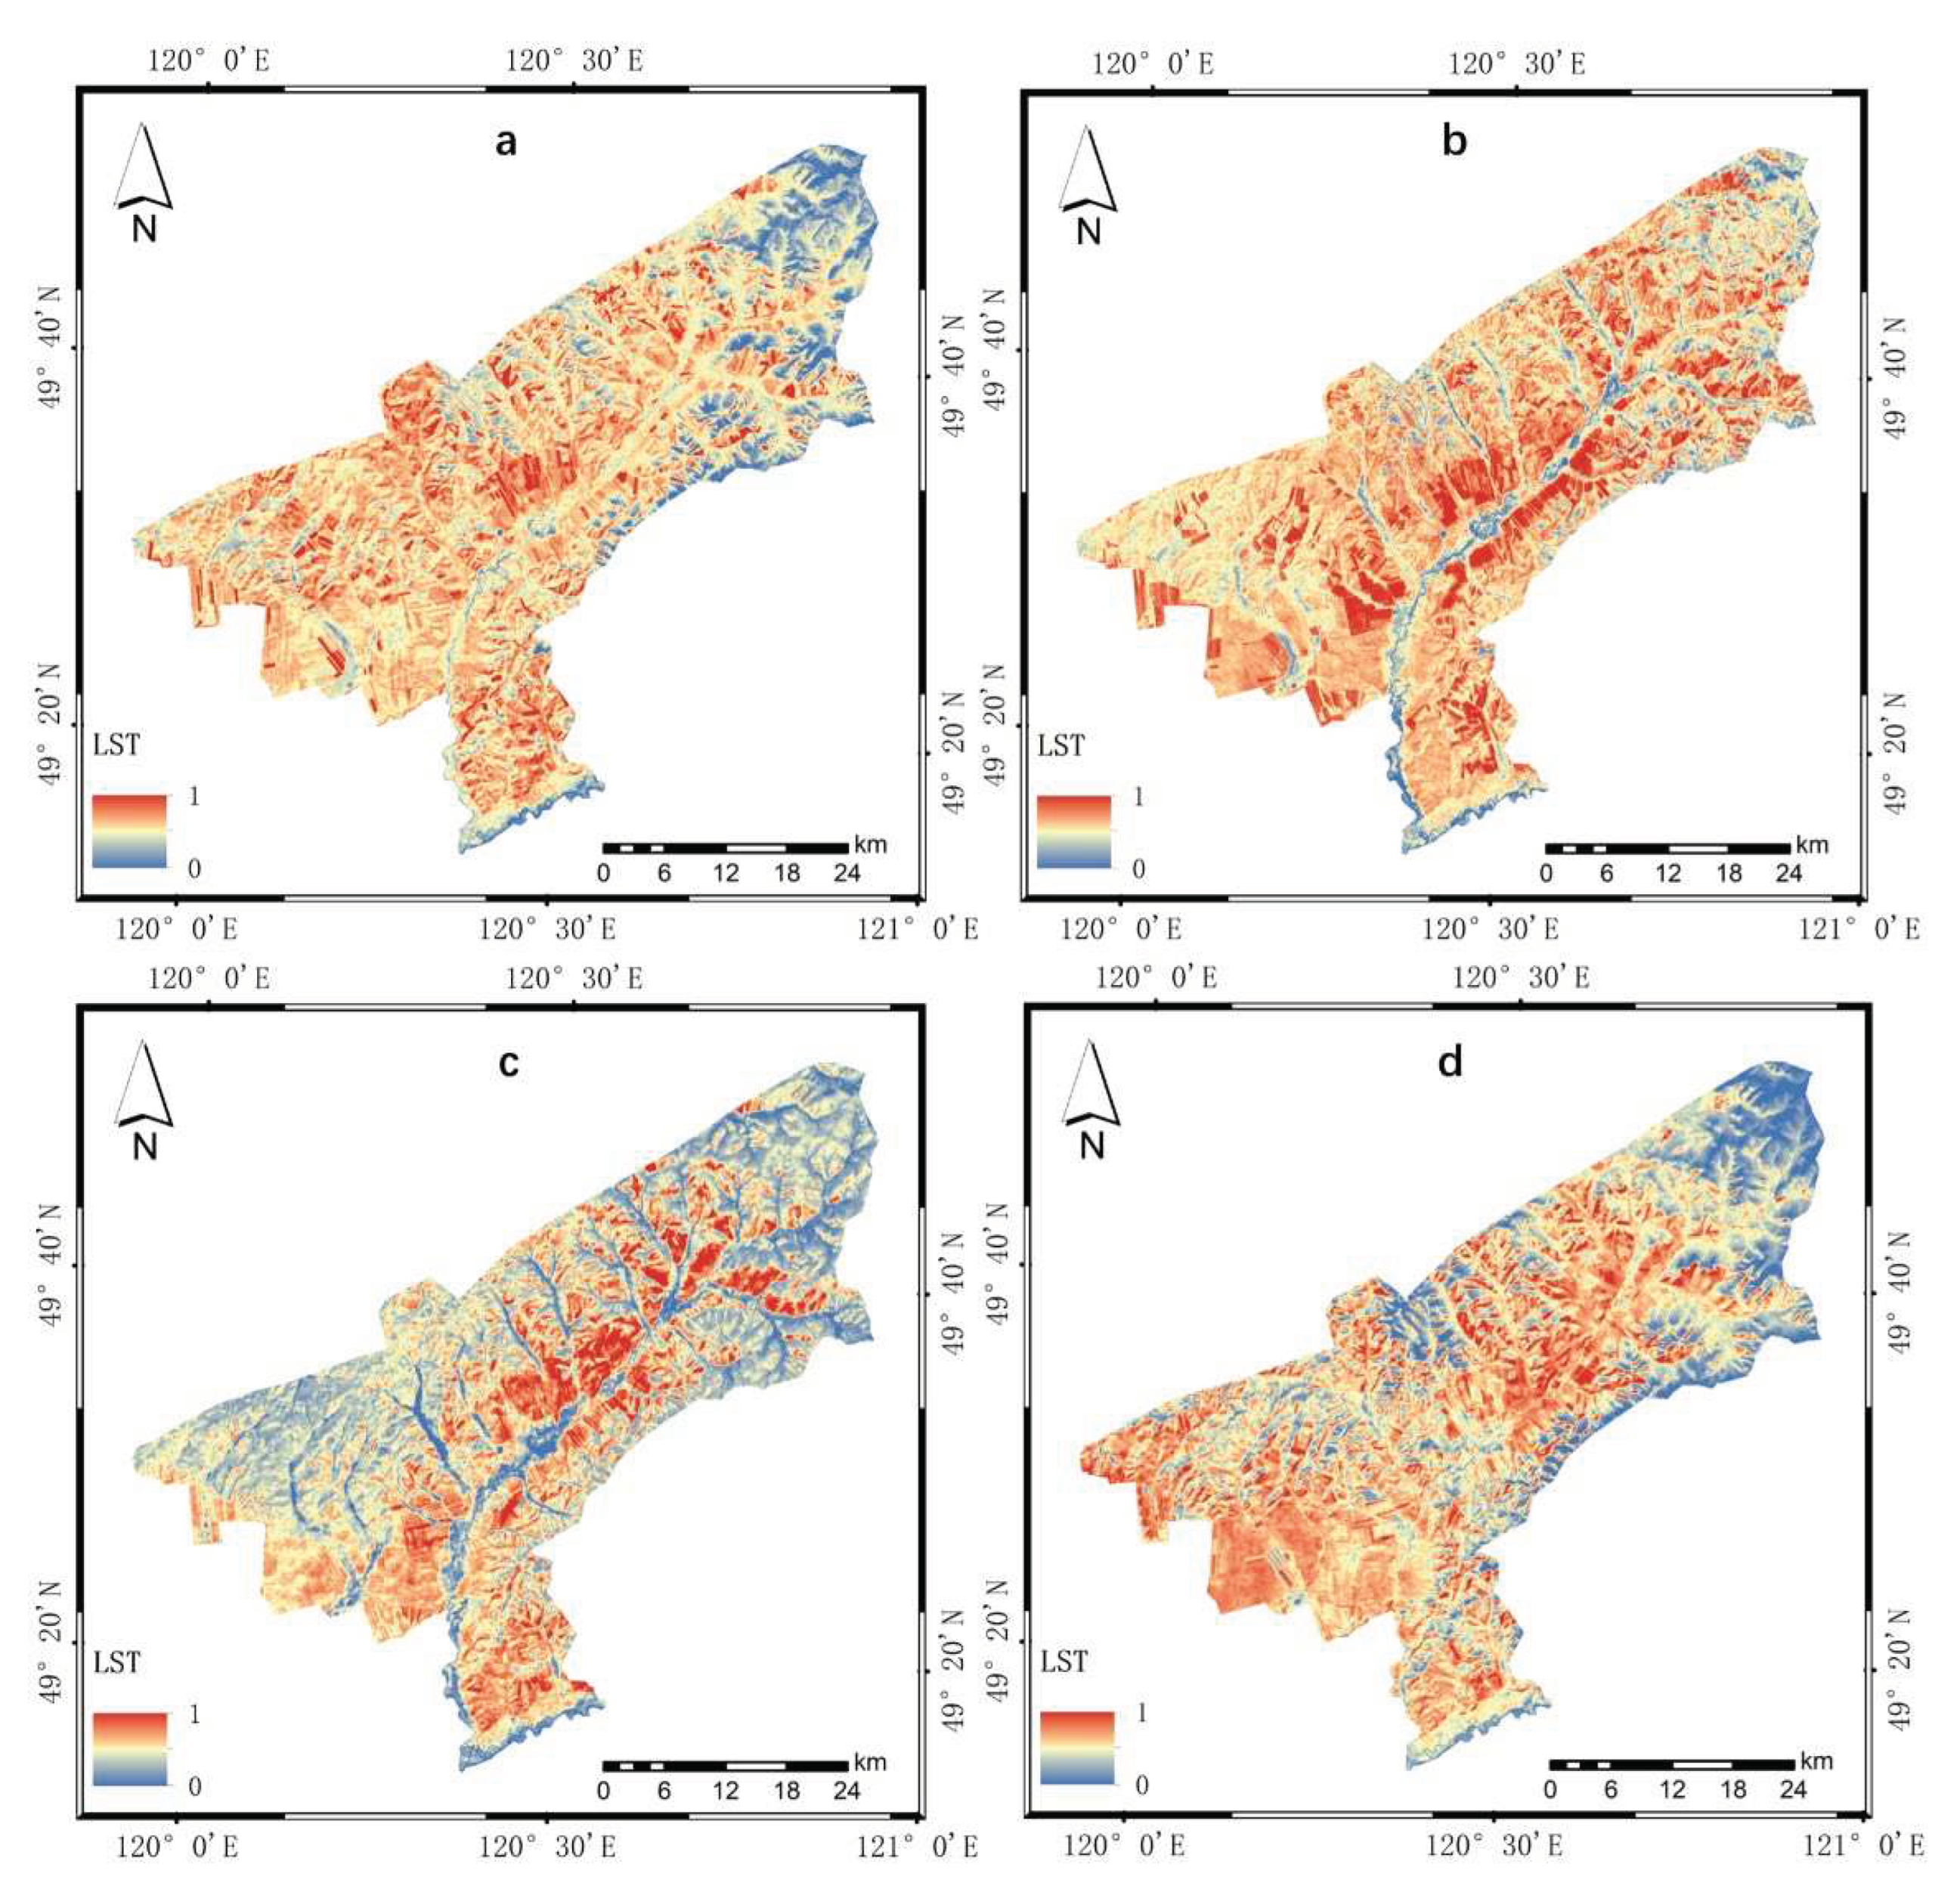

| Band | Blue | Green | Red | NIR | SWIR1 | SWIR2 | |
|---|---|---|---|---|---|---|---|
| Sensor | |||||||
| Landsat TM | 0.0315 | 0.2021 | 0.3102 | 0.1594 | 0.6806 | 0.6109 | |
| Landsat ETM+ | 0.1509 | 0.1973 | 0.3279 | 0.3406 | 0.7112 | 0.4572 | |
| Landsat OLI | 0.1511 | 0.1973 | 0.3283 | 0.3407 | 0.7117 | 0.4559 | |
| Year | t | Lu | Ld |
|---|---|---|---|
| 2010 | 0.82 | 1.28 | 2.13 |
| 2013 | 0.83 | 1.16 | 1.96 |
| 2016 | 0.96 | 0.23 | 0.44 |
| 2019 | 0.95 | 0.27 | 0.48 |
| Sensor Types | K1 | K2 |
|---|---|---|
| Landsat 5 TM (band 6) | 607.76 | 1260.56 |
| Landsat 7 ETM+ (band 6) | 666.09 | 1282.71 |
| Landsat 8 TIRS (band 10) | 774.89 | 1321.08 |
| Landsat 8 TIRS (band 11) | 480.89 | 1201.14 |
| Year | Index | PC1 | PC2 | PC3 | PC4 | PC5 |
|---|---|---|---|---|---|---|
| 2010 | Eigenvalue | 0.1214 | 0.0209 | 0.0102 | 0.0019 | 0.0000 |
| Contribution | 0.7861 | 0.1355 | 0.0660 | 0.0122 | 0.0002 | |
| 2013 | Eigenvalue | 0.1689 | 0.0282 | 0.0071 | 0.0024 | 0.0003 |
| Contribution | 0.8162 | 0.1365 | 0.0342 | 0.0115 | 0.0016 | |
| 2016 | Eigenvalue | 0.0788 | 0.0223 | 0.0024 | 0.0016 | 0.0000 |
| Contribution | 0.7491 | 0.2124 | 0.0225 | 0.0156 | 0.0004 | |
| 2019 | Eigenvalue | 0.1094 | 0.0253 | 0.0117 | 0.0017 | 0.0001 |
| Contribution | 0.7385 | 0.1706 | 0.0792 | 0.0113 | 0.0004 |
| Year | NDVI | WET | NDBSI | LST | PSI | Average correlation |
|---|---|---|---|---|---|---|
| 2010 | 0.914 | 0.920 | -0.027 | -0.899 | -0.907 | 0.733 |
| 2013 | 0.939 | 0.977 | -0.976 | -0.829 | -0.928 | 0.930 |
| 2016 | 0.363 | 0.801 | -0.434 | -0.915 | -0.313 | 0.565 |
| 2019 | 0.669 | 0.947 | -0.008 | -0.914 | -0.617 | 0.631 |
| Mean value | 0.721 | 0.911 | -0.361 | -0.889 | -0.691 | p<0.01 |
| Year | 2010 | 2013 | 2016 | 2019 |
|---|---|---|---|---|
| Mean | 0.589 | 0.534 | 0.598 | 0.573 |
| Standard deviation | 0.220 | 0.235 | 0.216 | 0.244 |
| Level | 2010 | 2013 | 2016 | 2019 | ||||
|---|---|---|---|---|---|---|---|---|
| Proportion/% | Area/ km2 |
Proportion/% | Area/ km2 |
Proportion/% | Area/ km2 |
Proportion/% | Area/ km2 |
|
| Inferior | 4.61 | 90.99 | 14.61 | 288.37 | 7.81 | 154.18 | 6.27 | 123.82 |
| Poor | 27.25 | 537.80 | 18.97 | 374.34 | 38.66 | 762.91 | 34.31 | 677.07 |
| Moderate | 47.89 | 945.08 | 47.87 | 944.62 | 37.07 | 731.58 | 36.29 | 716.09 |
| Good | 13.61 | 268.67 | 14.85 | 292.97 | 13.22 | 260.83 | 14.05 | 277.37 |
| Excellent | 6.64 | 130.97 | 3.71 | 73.21 | 3.24 | 64.01 | 9.08 | 179.16 |
| Changes | 2010-2013 | 2013-2016 | 2016-2019 | 2010-2019 | ||||
|---|---|---|---|---|---|---|---|---|
| Proportion/% | Area/ km2 |
Proportion/% | Area/ km2 |
Proportion/% | Area/ km2 |
Proportion/% | Area/ km2 |
|
| [-1, -0.1) | 33.74 | 665.85 | 38.72 | 764.13 | 22.70 | 448.03 | 23.98 | 473.19 |
| [-0.1, -0.05) | 11.13 | 219.60 | 9.80 | 193.49 | 8.34 | 164.54 | 16.02 | 316.16 |
| [-0.05, 0.05) | 27.42 | 541.18 | 17.96 | 354.43 | 21.92 | 432.64 | 30.94 | 610.69 |
| [0.05, 0.1) | 10.09 | 199.19 | 7.83 | 154.46 | 11.44 | 225.83 | 10.12 | 199.64 |
| [0.1, 1] | 17.62 | 347.68 | 25.69 | 507.00 | 35.60 | 225.83 | 18.94 | 373.83 |
Disclaimer/Publisher’s Note: The statements, opinions and data contained in all publications are solely those of the individual author(s) and contributor(s) and not of MDPI and/or the editor(s). MDPI and/or the editor(s) disclaim responsibility for any injury to people or property resulting from any ideas, methods, instructions or products referred to in the content. |
© 2023 by the authors. Licensee MDPI, Basel, Switzerland. This article is an open access article distributed under the terms and conditions of the Creative Commons Attribution (CC BY) license (http://creativecommons.org/licenses/by/4.0/).


