
You are currently viewing a beta version of our website. If you spot anything unusual, kindly let us know.
Preprint
Article
Assessing Eelgrass Wasting Disease Dynamics in California Estuaries in the Context of Climate Change
Altmetrics
Downloads
125
Views
71
Comments
0

This version is not peer-reviewed
Abstract
Climate change is a global phenomenon that exerts significant impacts on ecosystems. Estuaries, as critical aquatic habitats, are susceptible to these changes; however, our comprehension of their specific responses to climate change remains limited. Beyond temperature rise and alterations in precipitation patterns, climate change induces indirect effects, influencing a multitude of biotic and abiotic variables within aquatic ecosystems. In this study, we assess seagrass health as an indicator of estuary well-being in three estuaries located in northern to central California, USA. Our investigation focuses on the marine angiosperm Zostera marina (commonly known as eelgrass) and its associated parasite, Labyrinthula zosterae. Z. marina, a temperate marine plant, faces the threat of eelgrass wasting disease (EWD) caused by the protist L. zosterae. Notably, this pathogen demonstrates sensitivity to warming ocean temperatures, underscoring the imperative to comprehend its impacts on host health amidst climate change. Our study assessed EWD prevalence with relation to spatial and temporal patterns, the relationship, if any, between disease prevalence and eelgrass percent cover, the spatial patterns, if any, of eelgrass percent cover, and what climatic variables were most strongly correlated with EWD and eelgrass percent cover.
Keywords:
Subject: Environmental and Earth Sciences - Environmental Science
1. Introduction
Marine ecosystems are essential to the health and functioning of our global environments, but many gaps remain in our understanding of the influence of climate and anthropogenic stressors on marine health [1] (Hoegh-Guldberg and Bruno, 2010; Lamb et al. 2017). Critically, studies from the last five to ten years have started to show changes, such as rapidly rising greenhouse gas concentrations, driving marine ecosystems towards conditions not seen for millions of years, with associated risks of foundational and sometimes irremediable marine ecosystem transformation (Malhi et al., 2020). Even by 2008, Halpern et al. noted that more than 40 percent of marine areas were being negatively affected by multiple pressures and that no area was unaffected by human influence (Halpern et al., 2008). The extent of human impacts on coastal zones in comparison to deep water regions has been higher, with climate change being one of the most significant pressures (Díaz, 2019).
Specific to global coastal and estuarine ecosystems, climate is also altering these sensitive environments with severe fluctuations from decadal averages (Colombano et al., 2021), directional changes of environmental variables (i.e., sea surface temperatures, pH levels, and rising sea levels) (Cabral et al., 2019), as well as less predictable oscillations (e.g., the Pacific and Atlantic decadal oscillations) and more extreme weather events such as coastal flooding and marine heatwaves (Babcock et al., 2019; Tallam and Quang, 2023). Shallow and intertidal coastal habitats including mangroves, wetlands, saltmarshes, tidal flats, and estuaries are particularly exposed to extreme weather events such as extreme heat or cold waves, and this has in turn begun to increase the thermal stress that many of these environments are facing globally (Malhi et al., 2020).
The effects of climate change are not limited to increasing temperature and changes in precipitation. Changes in our global climate have been documented in the literature since the 1900s, evidenced by sea level rise, receding glaciers, novel temperature changes, increased frequency and intensity of extreme weather events, and more (Hoegh-Guldberg and Bruno, 2010). This has also resulted in ongoing landscape-level events. Critically, these ongoing, and increasing, changes have begun to influence the delicate balance of the host-pathogen-environment triad (Behringer et al., 2020). For many critical marine species, a shift in their environments can increase their vulnerability to disease, as seen by diseases impacting ectothermic non-mobile marine invertebrates including corals, oysters, and abalone. Climate change can also affect the water quality of shallow and intertidal coastal habitats and influence host-pathogen interactions, but the effects of our changing climate on infectious diseases is not well understood (Burge et al., 2014).
Infectious diseases are critical drivers within terrestrial and marine ecosystems (Getz et al., 2019; El-Sayed and Kamel, 2020; Tallam et al., 2021). In fact, there are many examples of ecosystems on land being reshaped by large-scale outbreaks of infectious diseases, such as chestnut blight and Dutch elm disease (Potter et al., 2011). Diseases can also impact marine ecosystems by influencing abiotic factors such as hydrodynamics, as well as elements of community structure such as age distributions, biotic structure, and trophic interactions (Burge et al., 2014), such as with reef-building corals (Aronson and Precht, 2001), sea urchins (Lauzon-Guay et al., 2009), and oysters (Powell et al., 2011). Diseases in the ocean have traditionally been studied in the context of cultured and wild harvests of commercially critical species, including salmon (such as the Ichthyophonus infection in marine and anadromous fish (Kocan, 2019) and the infections that Pacific and Atlantic salmon underwent (Thompson et al., 2011)), the withering syndrome that abalone endured (Moore et al., 2000), and the protozoan infections of aquaculture crustaceans (Sweet and Bateman, 2015).
Interactions between pathogens, hosts, and their environments not only govern disease outbreaks but changes in these components can shift ecosystem balance away from or towards high-intensity disease states (Harvell et al., 2004; 2019). Climate change can alter the likelihood of disease outbreaks given that host-pathogen interactions are highly susceptible to environmental changes. Climate change has not only altered terrestrial disease risk and human disease risk, but is now beginning to affect marine disease risk (Burge et al., 2014). We are only beginning to understand how the effects of infectious diseases in oceanic and shallow and intertidal coastal habitats can affect host-pathogen relationships in marine environments, a missing link that will be very critical in informing conservation and management effects in a rapidly changing climate (He and Silliman, 2019; Tallam et al., 2021; Harvell and Lamb in Disease Ecology book).
Estuaries are complex, critical ecotones for coastal integrity (Liu et al., 2021). These biodiversity hotspots provide up to 28,916/ha) in innumerable ecosystem services (i.e., nutrient regulation, habitat provisioning, storm surge attenuation, etc.) that support human life near and far from the coast (Costanza et al., 2014; Bradley, 2017). Estuarine food webs are tightly linked to parasites as they are prey in over half of trophic interactions (Byers, 2020; Hechinger et al., 2011). Studying marine disease dynamics offer a unique opportunity to link functional and structural indicators of estuary health in the context of the influences of climate and anthropogenic stressors on estuaries. Research on the dynamics of marine disease spread in estuaries is lacking (McLaughlin et al., 2020).
Evident reductions in seagrass populations have been documented in historical records, with early records dating back to 1889 in Chesapeake Bay (Fig X). However, scientific documentation of severe, sudden, and catastrophic declines in seagrass beds along the North Atlantic coasts (North America and Europe) was not published until the early 1930s (Cotton, 1933, Cottam, 1933). These documented accounts represented the most significant decline in global seagrass populations observed up to that point (den Hartog, 1987). The loss of seagrass due to diseases and various environmental factors continues to be reported worldwide (Short and Wyllie-Echeverria, 1996, Orth et al., 2006). Long-standing suspicions among scientists investigating seagrass population declines have pointed towards species belonging to the Labyrinthula genus (Phylum: Labyrinthulomycota; protistan supergroup: Chromoalveolata) as potential causative agents responsible for the well-known ’wasting disease’ events of the 1930s. However, it wasn’t until the late 1980s that a definitive connection between Labyrinthula and the acute declines of seagrass along the western Atlantic Coast was established. In 1991, the specific species Labyrinthula zosterae was identified and confirmed as the causative agent of ’wasting disease’ in Zostera marina (Muehlstein et al., 1991).
Following this discovery, Vergeer and den Hartog (1993) successfully isolated Labyrinthula spp. from lesions found on the leaves of seagrass species representing ten different genera worldwide, including Zostera, Heterozostera, Posidonia, Halodule, Cymodocea, Syringodium, Thalassodendron, Ruppia, Thalassia, and Halophila. Interestingly, during their investigations, they noted that the rapidly expanding brown-black lesions associated with the disease, as described by Muehlstein et al. in 1991, were not always observable in hosts from which Labyrinthula had been isolated. This finding suggests that the presence of the pathogen does not necessarily lead to disease manifestation in all cases of infection. Research conducted by Bockelmann et al. (2013), utilizing quantitative PCR to analyze the prevalence of L. zosterae in Z. marina beds in northern Europe, confirmed these observations. They discovered that L. zosterae was present in up to 89 percent of the tested beds, with significant seasonal and spatial variations. This investigation led them to speculate that L. zosterae likely persists in a chronic reservoir, with the highest prevalence occurring during the summer.
Scientific investigations have provided substantial evidence linking Labyrinthula, particularly L. zosterae, to the occurrence of ’wasting disease’ in seagrass, specifically Z. marina. However, the presence of the pathogen does not consistently result in visible disease symptoms, indicating the involvement of other factors in disease development. Ongoing studies aim to enhance our understanding of L. zosterae’s prevalence and dynamics within seagrass beds, ultimately aiming to develop effective management strategies to mitigate the impact of ’wasting disease’ on seagrass populations.
Our study examines the correlation between seagrass health and estuary health in three significant estuaries spanning from northern to central California. In particular, we focus on the eelgrass species (Zostera marina) and its parasite, Labyrinthula zosterae. The eelgrass is a temperate species that faces threats from eelgrass wasting disease (EWD), which is caused by the protist L. zosterae. Given the sensitivity of the pathogen to warming ocean temperatures, it is crucial to gain a better understanding of its impact on the health of the host species under climate change conditions and a useful sentinel integrating physical and biological change. Our investigation is carried out within the context of existing marine ecoregions worldwide. We specifically concentrate on estuaries located within the National Estuarine Research Reserve System (NERRS) in California. NERRS, a collaboration between the National Oceanic and Atmospheric Administration (NOAA) and the coastal regions of the United States, was established through the Coastal Zone Management Act. Encompassing approximately 1.4 million acres of estuaries, NERRS represents a significant portion of the global seagrass diversity, hosting around 10 out of the known 70 seagrass species (approximately 14 percent of the world’s seagrass species).
The choice to focus on these regions is driven by several factors. Firstly, it is a responsible decision in terms of scale, allowing us to effectively assess the research objectives. Secondly, NERRS sites provide ideal test beds for addressing our research questions, as they facilitate multi-faceted research projects. By studying these specific estuaries, we aim to gain valuable insights into the relationship between L. zosterae and the health of the estuaries, contributing to our understanding of the broader impacts of climate change on these critical ecosystems.
2. Materials and Methods
2.1. Field sites
Our study was conducted at three specific field sites in northern to central California: Drakes Estero (38.047° N, 122.942° W), Elkhorn Slough (36.8058° N, 121.7902° W), and Morro Bay estuary (35.3643° N, 120.8529° W) (see Figure XX). The dataset we analyzed spans three consecutive field seasons, encompassing the winter and summer of 2021 into 2022, as well as the winter and summer of 2022 into 2023. In each estuary, we established four sites following the protocol outlined by Groner et al. in 2021 and the estuary bounds defined by MacCready in 2021. At each site, we laid out and marked triplicates of 10-meter transects (yellow flags attached to rebar), which were designed for future reference. Along each transect, we collected 20-25 randomized blades with a randomization protocol (Groner et al. 2021), resulting in a total of approximately 2,000 eelgrass blades that were collected, processed, and analyzed for this study. To define an eelgrass meadow, we applied a criterion of a minimum of 3 shoots per 0.25 m² (1/4 square meter) within a 1-meter radius of any adjacent shoots, as recommended by the US Army Corps of Engineers in 2016. At each site, we laid out and marked three 10-meter transects for future reference, with GPS points denoted. Eelgrass samples were collected by hand at 2-meter intervals along three parallel 10-meter transects positioned in the intertidal region, aligned with the shoreline.
2.2. Verification of pathogen presence
Quantitative Polymerase Chain Reaction (qPCR) analysis was historically performed (in 2018 for Drakes Estero and Morro Bay and 2019 for Elkhorn Slough) at each site to confirm the presence of Labyrinthula zosterae DNA in tissue samples exhibiting visual symptoms associated with eelgrass wasting disease.
2.3. Definition of disease prevalence and severity
In the context of meadows and transects, disease prevalence was quantified as the ratio of visually observed diseased leaves to the total number of leaves sampled (Aoki et al., 2022). On an individual leaf level, disease prevalence was determined based on the presence or absence of lesions, assessed through visual examination. To evaluate disease severity, we employed a machine learning imaging model to measure the lesion area and total leaf area (Tallam et al. 2023). Disease severity was then calculated as the proportion of leaf area covered by lesions.
2.4. Percent Cover
At each quadrat sample location, the abundance of native eelgrass (Zostera marina) shoots was recorded as shoot density within a 0.25 m2 quadrat. To facilitate comparison, shoot density values were converted to the number of shoots per square meter. All other forms of vegetation, such as macroalgae, were categorized as "Other." Percent cover was assessed using categorical measures: absence or 0 percent cover, 1-10 percent cover, 11-25 percent cover, 26-50 percent cover, and greater than 50 percent cover. These percent cover categories were recorded instead of shoot density for each quadrat sample (Lefcheck et al., 2022). A total of 36 samples were collected per site within both the eelgrass and macroalgae zones, for each season. This resulted in 108 percent cover data points per site and a total of 324 data points for overall percent cover assessment.
2.5. Climatic parameters
Salinity, pH, alkalinity, sea surface temperature (SST), dissolved oxygen (DO) levels, and ambient temperature data were obtained from reputable sources. Salinity, pH, alkalinity data were acquired from the National Oceanic and Atmospheric Administration (NOAA) website specifically the Elkhorn Slough page (https://coast.noaa.gov/nerrs/reserves/elkhorn-slough.html). Sea surface temperature (SST) data was obtained from Tides4Fishing website, specifically the Elkhorn Slough location (https://tides4fishing.com/us/california/elkhorn-slough-at-elkhorn/forecast/water-temperature). Ambient temperature data was sourced from US Harbors, specifically the Elkhorn Slough weather page (https://www.usharbors.com/harbor/california/elkhorn-slough-at-elkhorn-ca/weather/). To ensure consistent analysis, all the gathered data for these parameters were downsampled to weekly intervals.
2.6. Lab processing and machine learning
Leaf blades underwent laboratory processing following a detailed protocol (see Figure XX), which was developed based on a modified version of the protocol used in the US National Science Foundation wasting disease surveys by Morgan Eisenlord and Colleen Burge (cite Aoki et al in Limnol and Oceanogr for most recent methods). The protocol was simplified and modified to streamline the processing procedures . In the lab, the blades were cleaned, measured, and placed on acetate paper in preparation for scanning using a machine learning algorithm. The acetate paper blades were then subjected to a binary pixel-based machine learning classification algorithm, specifically designed by the author , to efficiently classify each pixel on the blade image as either diseased or non-diseased. The algorithm rapidly determined the disease status of the pixels, and the resulting percentages were aggregated to quantify disease severity. These methods are well-established and will be replicated at the other two study sites. Each sampling period required approximately 1-2 days, while the processing period lasted around 1-3 days. The timing of the sampling was carefully considered, taking into account the seasonality of disease prevalence. All sampling occurred between the Fall/Winter and Spring/Summer months of 2022 and 2023.
2.7. Data Analyses
Statistical tests were conducted at a significance level of 0.05 ( = 0.05) with 95 percent confidence intervals, assuming data followed a normal distribution based on Kolmogorov-Smirnov and Shapiro-Wilk normality tests, unless otherwise specified. Google Colaboratory and Python 3.10 were used for all statistical computations, unless otherwise mentioned.
3. Results
3.1. Linear Mixed Effects Model
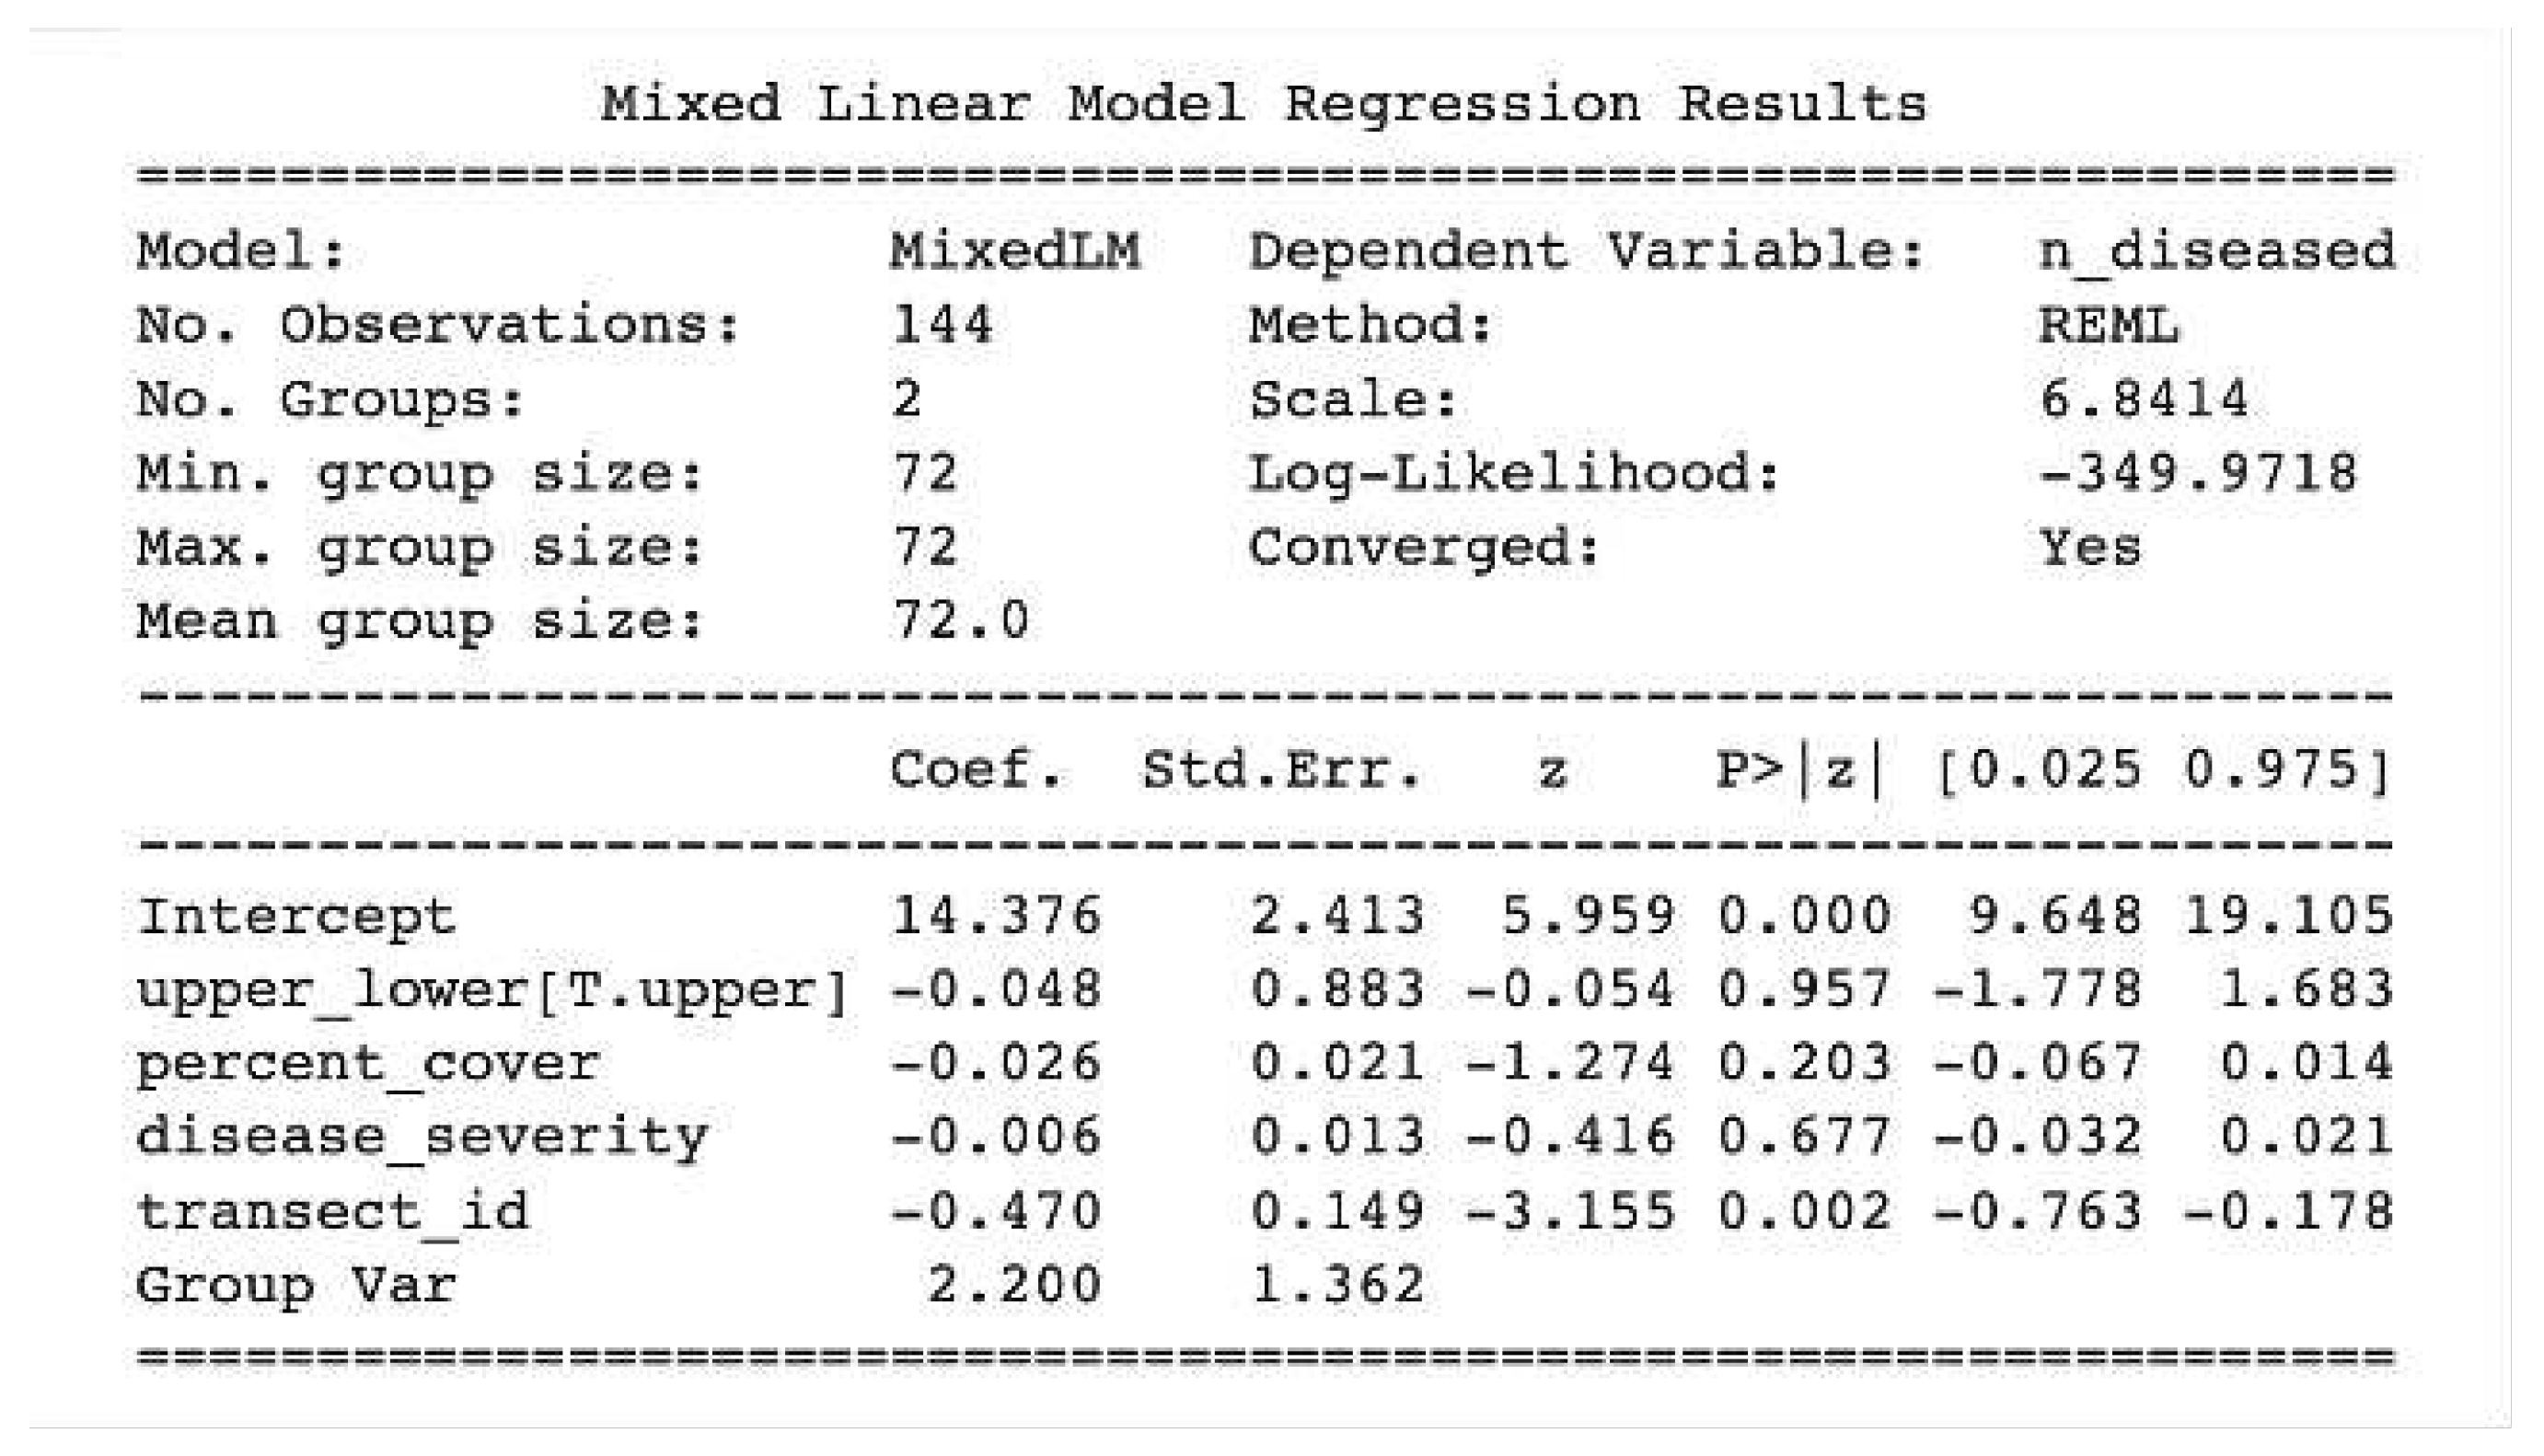
Initially, a linear mixed effects model was applied to all variables to investigate their significance in the final disease model. This analysis utilized a dataset comprising 187 observations. The results indicated that the effects of alkalinity and dissolved oxygen (DO) levels were > 0.05 in terms of both fixed effects values and confidence intervals. These variables were subsequently excluded from further analyses. Subsequently, the effects of season, ambient temperature, pH, and sea surface temperature (SST) were examined with separate linear models predicting disease severity. While these factors appeared to have notable effects, the confidence intervals associated with their relationship with disease and severity were wide (p > 0.05). This observation also applied to the relationship between season and disease severity. Therefore, it was determined that additional analyses would be necessary to gain a better understanding of the relationships between these variables and disease dynamics. Conversely, the effects of upper or lower transects, individual sub-transects (), percent cover, and year demonstrated stronger effects and narrower confidence intervals. On average, these variables exerted a substantial influence on disease and severity. However, further investigation is required to ascertain the precise strength and direction of these relationships. As for the linear mixed effects model, the following was the final “best fit model” for our purposes (Figure 1). However, the strength and direction of the relationships had to be explored further and so we developed a structural equation model (SEM) to further interrogate these relationships (Figure 8) (Pourtois, Tallam, et al. 2023).
Figure 1.
3.2. Prevalence and Severity Data: spatial relationships
Observing disease prevalence data as a function of the spatial gradient of each estuary (from mouth to watershed) over time [Figure 2A; 2B; 2C], we observed that over the course of each season of data (Spring/Summer 2022, Fall/Winter 2022, and Spring/Summer 2023), both Drakes Estero (de) and Elkhorn Slough (es) showed consistency in decreasing linear trends of EWD disease prevalence from estuary mouth to watershed, overall [Figure 1A;1B]. Morro Bay (mb) either demonstrated increasing trends of disease over this spatial gradient or a relatively consistent disease prevalence over this spatial gradient (z-test, p < 0.05) [Figure 1C].
EWD prevalence decreased from estuary mouth to watershed in Drakes Estero adn Elkhorn Slough in all seasons. EWD prevalence either increased or was unchanged over teh same gradient in Morro Bay.
Figure 2.
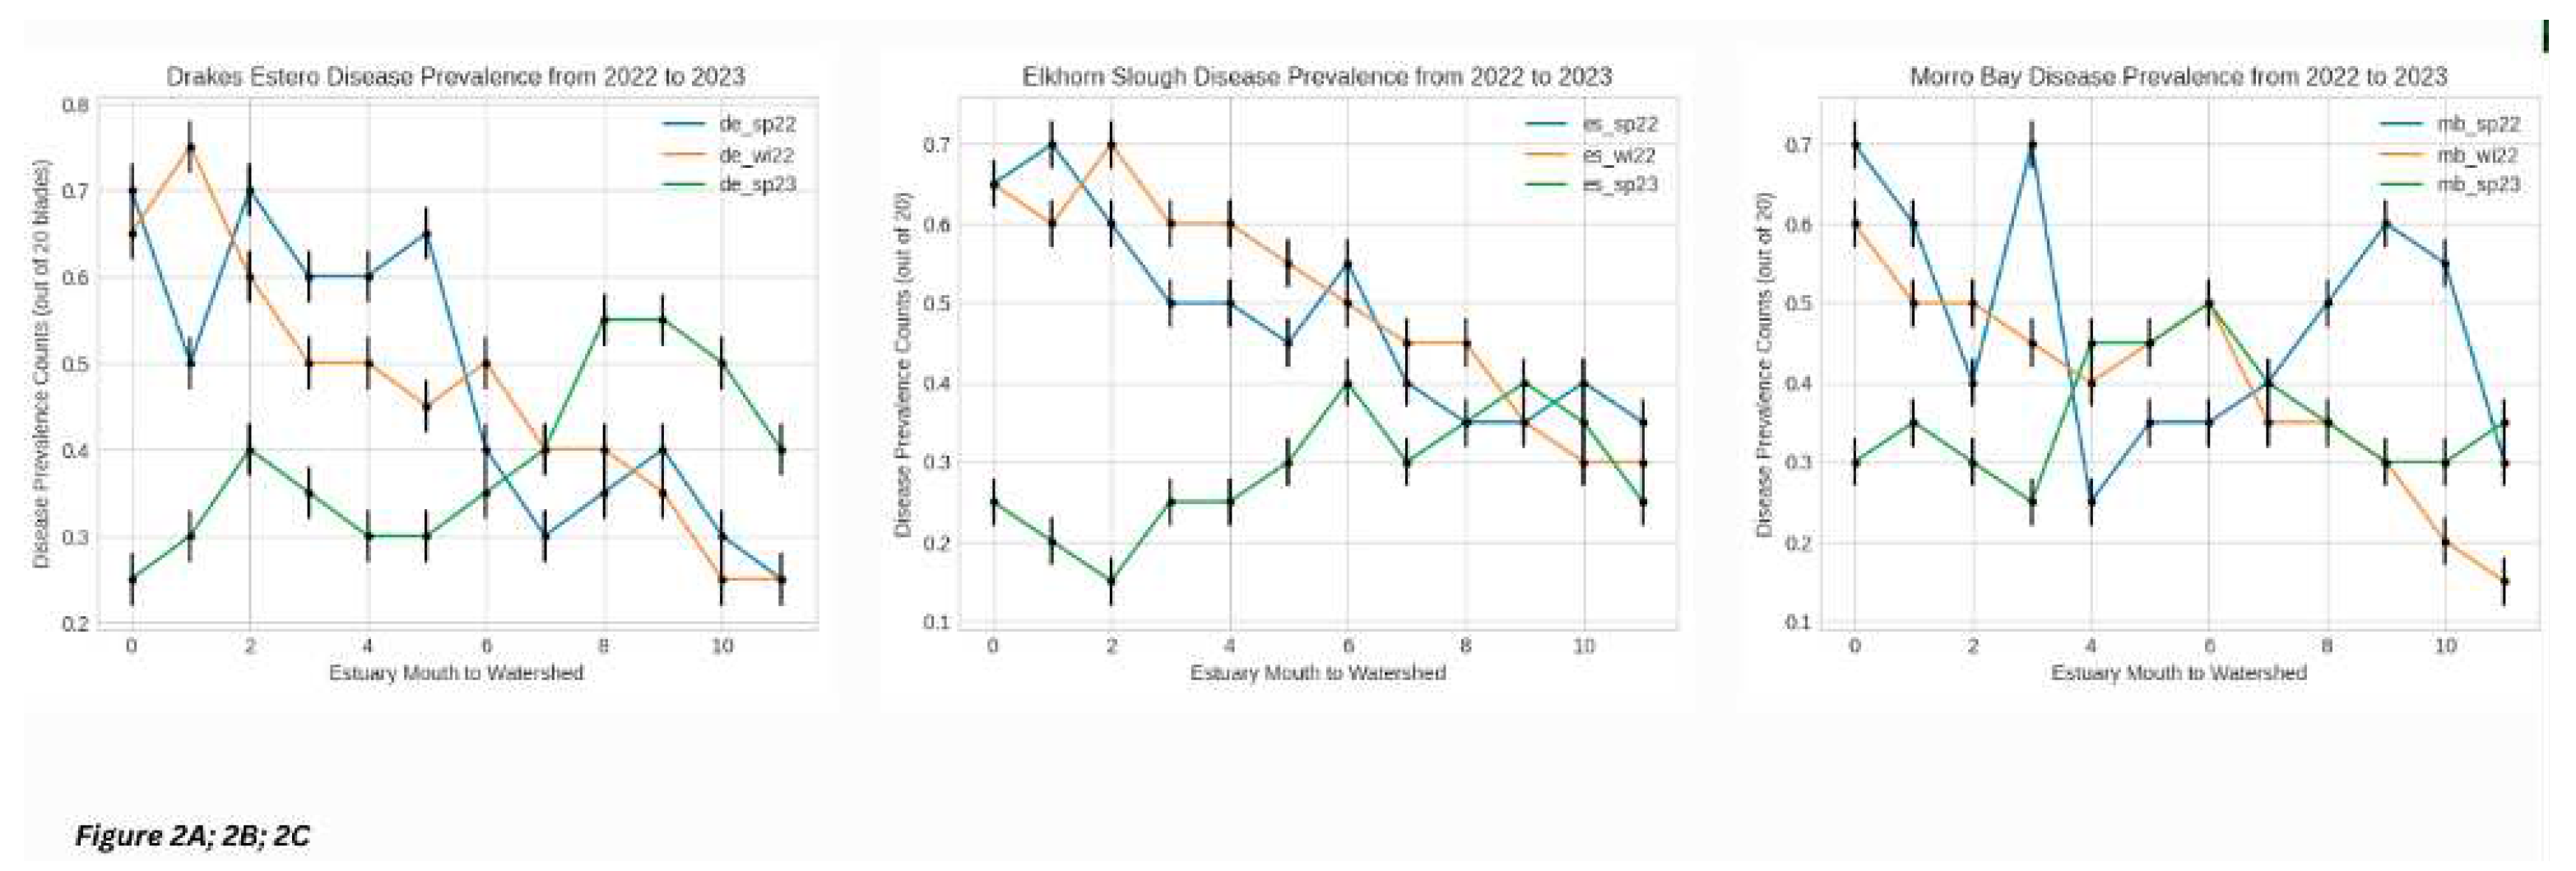
More specifically, in Morro Bay disease prevalence decreased from sub-transects four through nine, which represent the middle to tail end (watershed) of the sampled portion of the estuary, for both Spring/Summer of 2022 and of 2023 (p < 0.05). From our lab processing and subsequent machine learning algorithms, we validated this trend.
Figure 3.
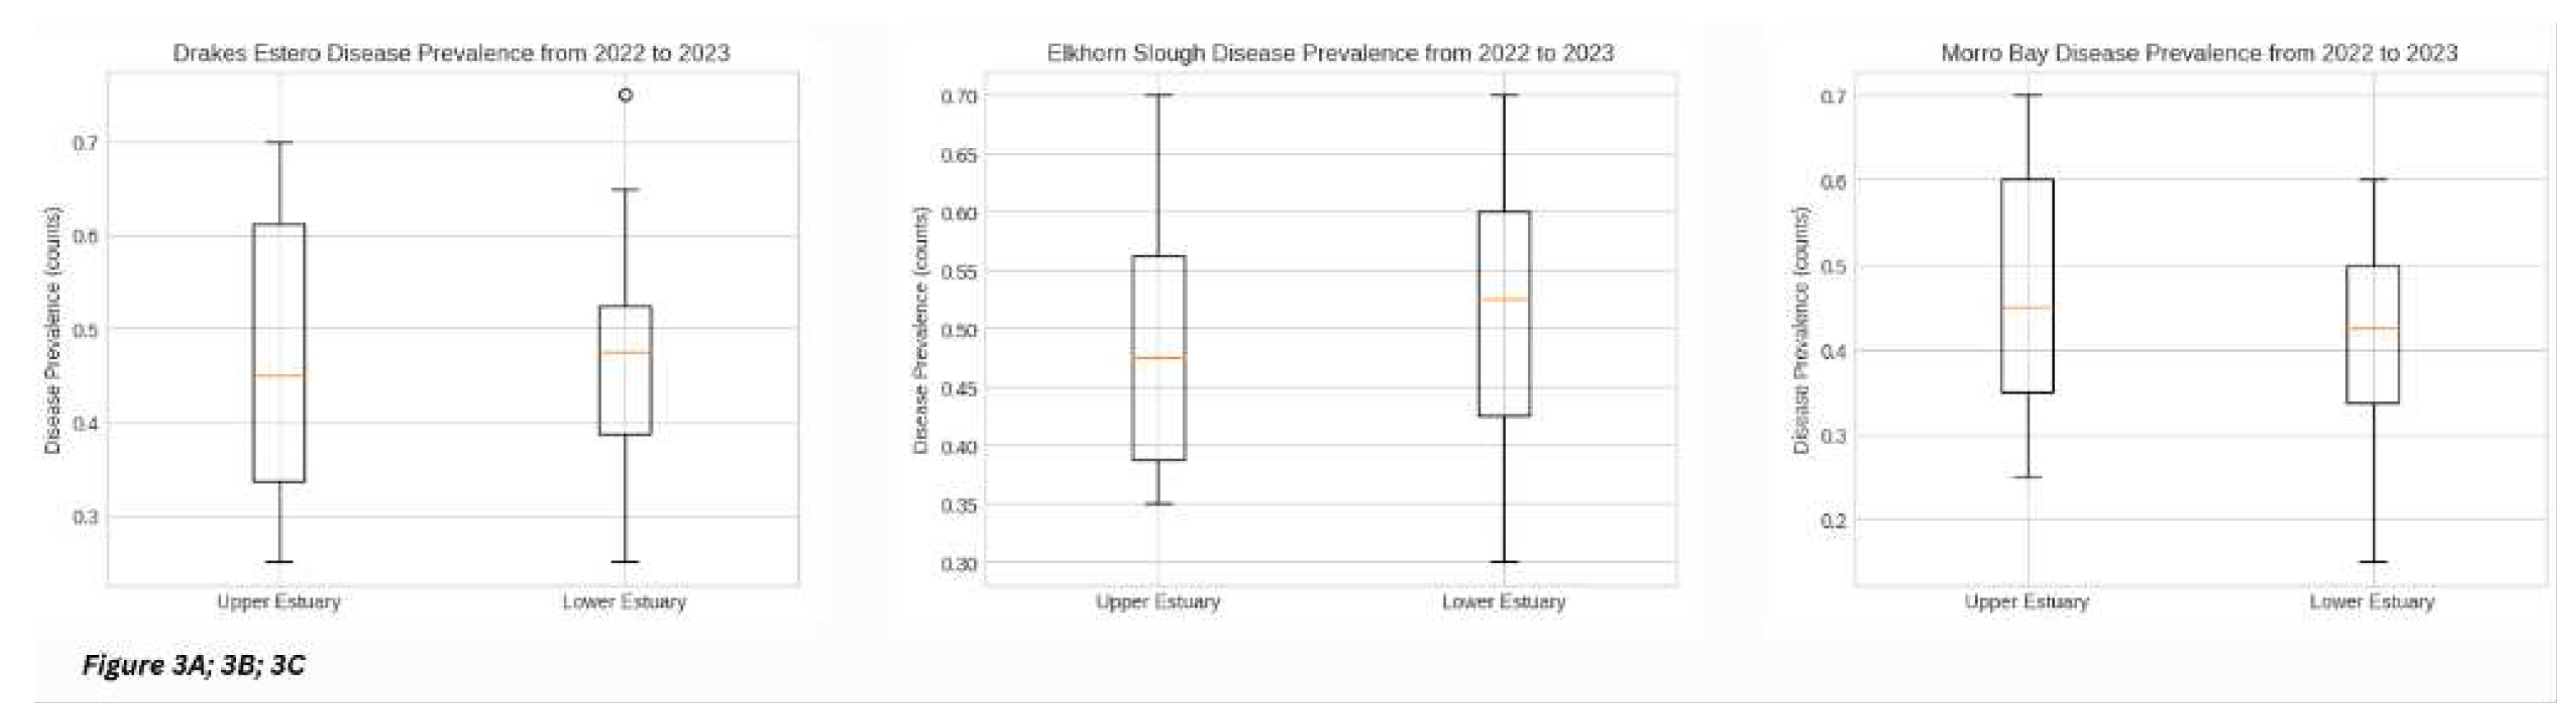
To further assess the distribution of our dataset, we compared between both upper and lower estuary spatial gradients at each site, as well as comparatively across the three sites, we can visualize the symmetry, skew, variance, and outliers in our dataset overall [Figure 2A; 2B; 2C]. We notice Drakes Estero EWD disease prevalence over the three field seasons combined, still showing significant differences in overall estuary disease prevalence with upper estuary demonstrating significantly more overall disease prevalence than the lower estuary [Figure 2A] (p < 0.05), with one exception in the lower estuary (which was in Spring 2023, sub-transect six, and interestingly, after the atmospheric rivers took place in California). We see a spike in disease prevalence two weeks after the atmospheric rivers and then disease prevalence starts to drop a little, albeit ending at a count higher than that of the mouth of the estuary (13 vs. 53 percent prevalence over the Drakes Estero estuary gradient in Spring 2023, validated by our machine learning models and ground-truth data). We measured the strength of this outlier by performing statistics on the interquartile range (IQR) and found that it was indeed a strong outlier. For Elkhorn Slough EWD disease prevalence over the three field seasons, we observe that when the data is looked at overall and not as a factor of time, there was overall more disease prevalence in the lower estuary than that of the upper estuary [Figure 2B]. The distinction is minimal (63 vs. 70 percent prevalence averages overall, p > 0.05) but remains a notable point, nonetheless. Finally, Morro Bay showed significantly higher overall disease prevalence in the upper estuary than in the lower estuary [Figure 2C], which is a slightly trend different than the impression received from Figure 1. When looking closer, we observe that Morro Bay showed a greater range of disease prevalence values, and a similar average disease prevalence compared to its lower estuary (60 vs. 53 percent prevalence averages overall, p > 0.05).
Figure 4.
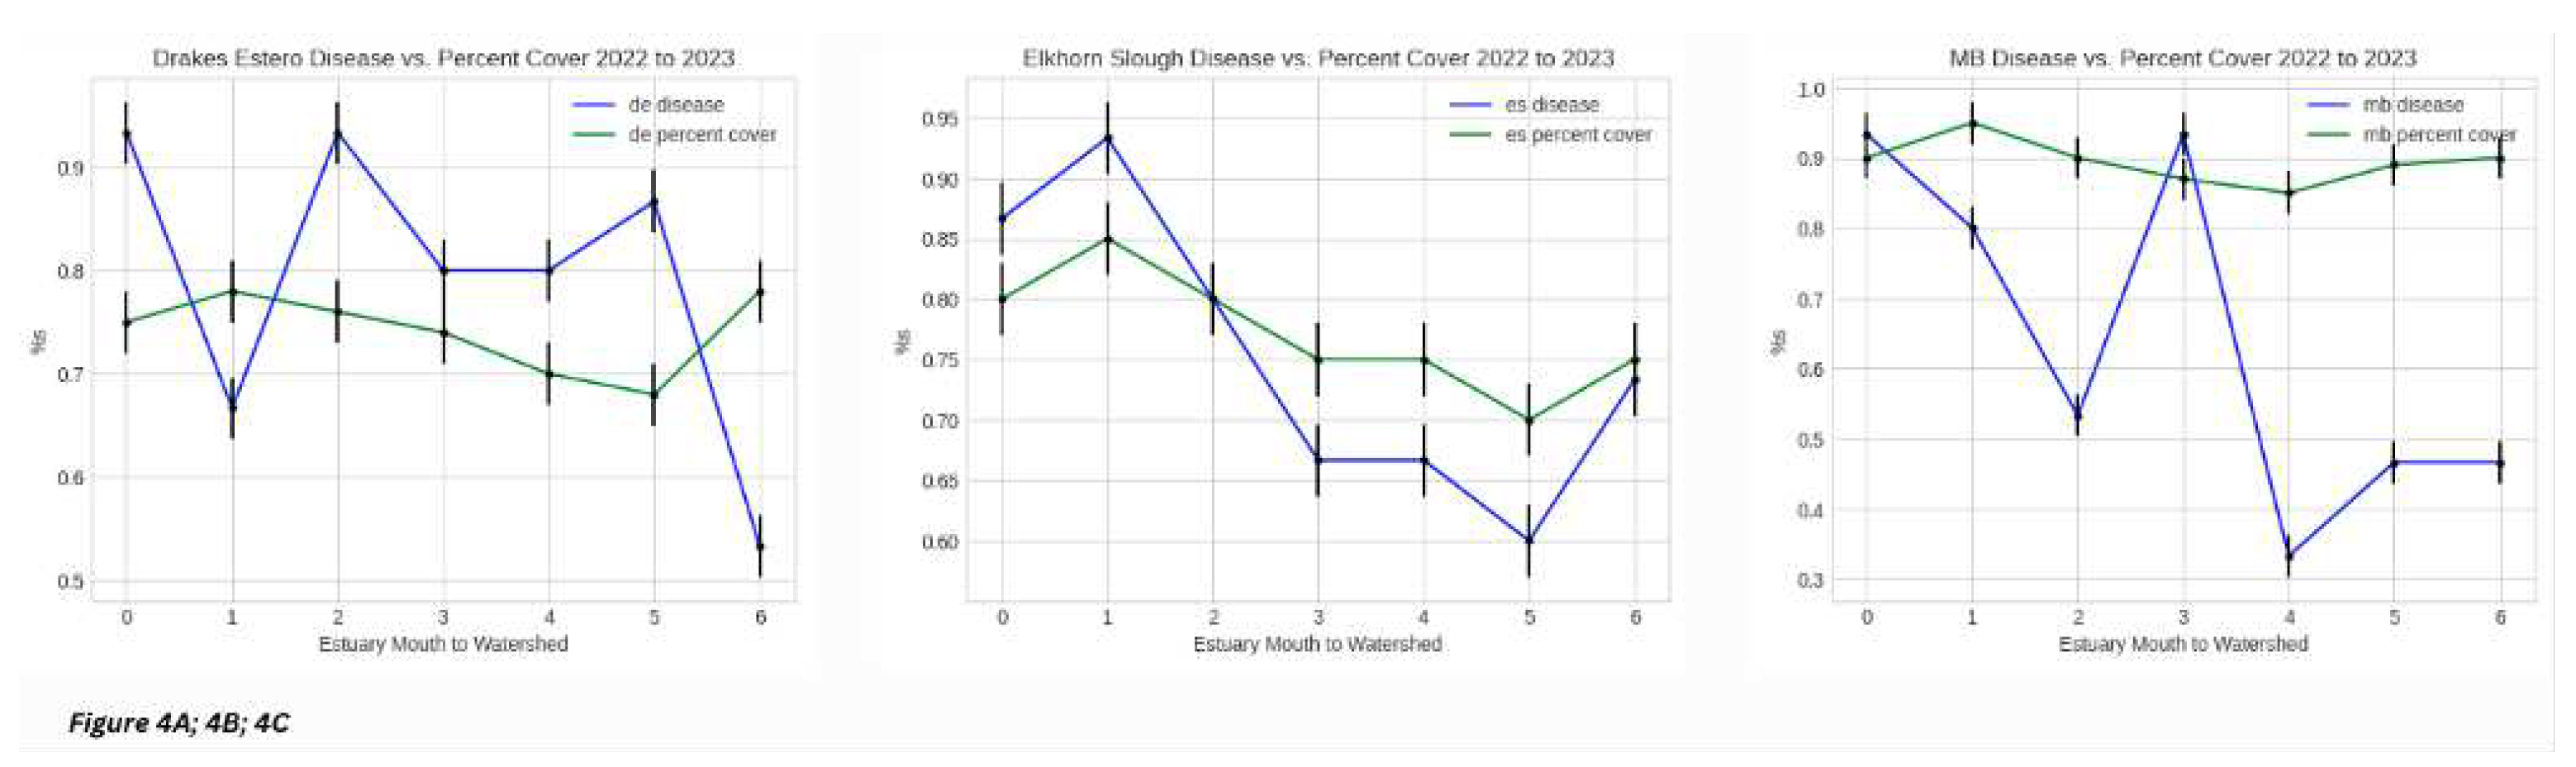
Given the observations from the dataset as a function of individual estuary gradient disease prevalence, overall disease prevalence over the three seasons and over time, and disease prevalence in comparison to the other two sites, we considered another measure, percent cover per quadrat, also called “percent cover” for the purposes of our analyses (Section 3.3) [Figure 4A; 4B; 4C]. The purpose of this portion of the study was to understand any relationship, if a meaningful relationship does exist, between disease prevalence and greenness index. We plotted disease prevalence and the Z. marina greenness index, after standardizing data values, as percentages against each other across the spatial gradient of each individual estuary with data from all three seasons combined. In Drakes Estero, we observe disease prevalence starting very high (about 93 percent prevalence) and ending at about 52 percent prevalence. Relative to this, we observe about a 75 to 80 percent greenness index throughout the estuary, overall [Figure 3A]. We notice a similar trend with Morro Bay [Figure 3C]. With Elkhorn Slough however, we observe a similar trajectory between disease prevalence and greenness index [Figure 3B]. These results led us to ask the question of whether seasonality played a role in this relationship (or lack thereof).
Figure 5.
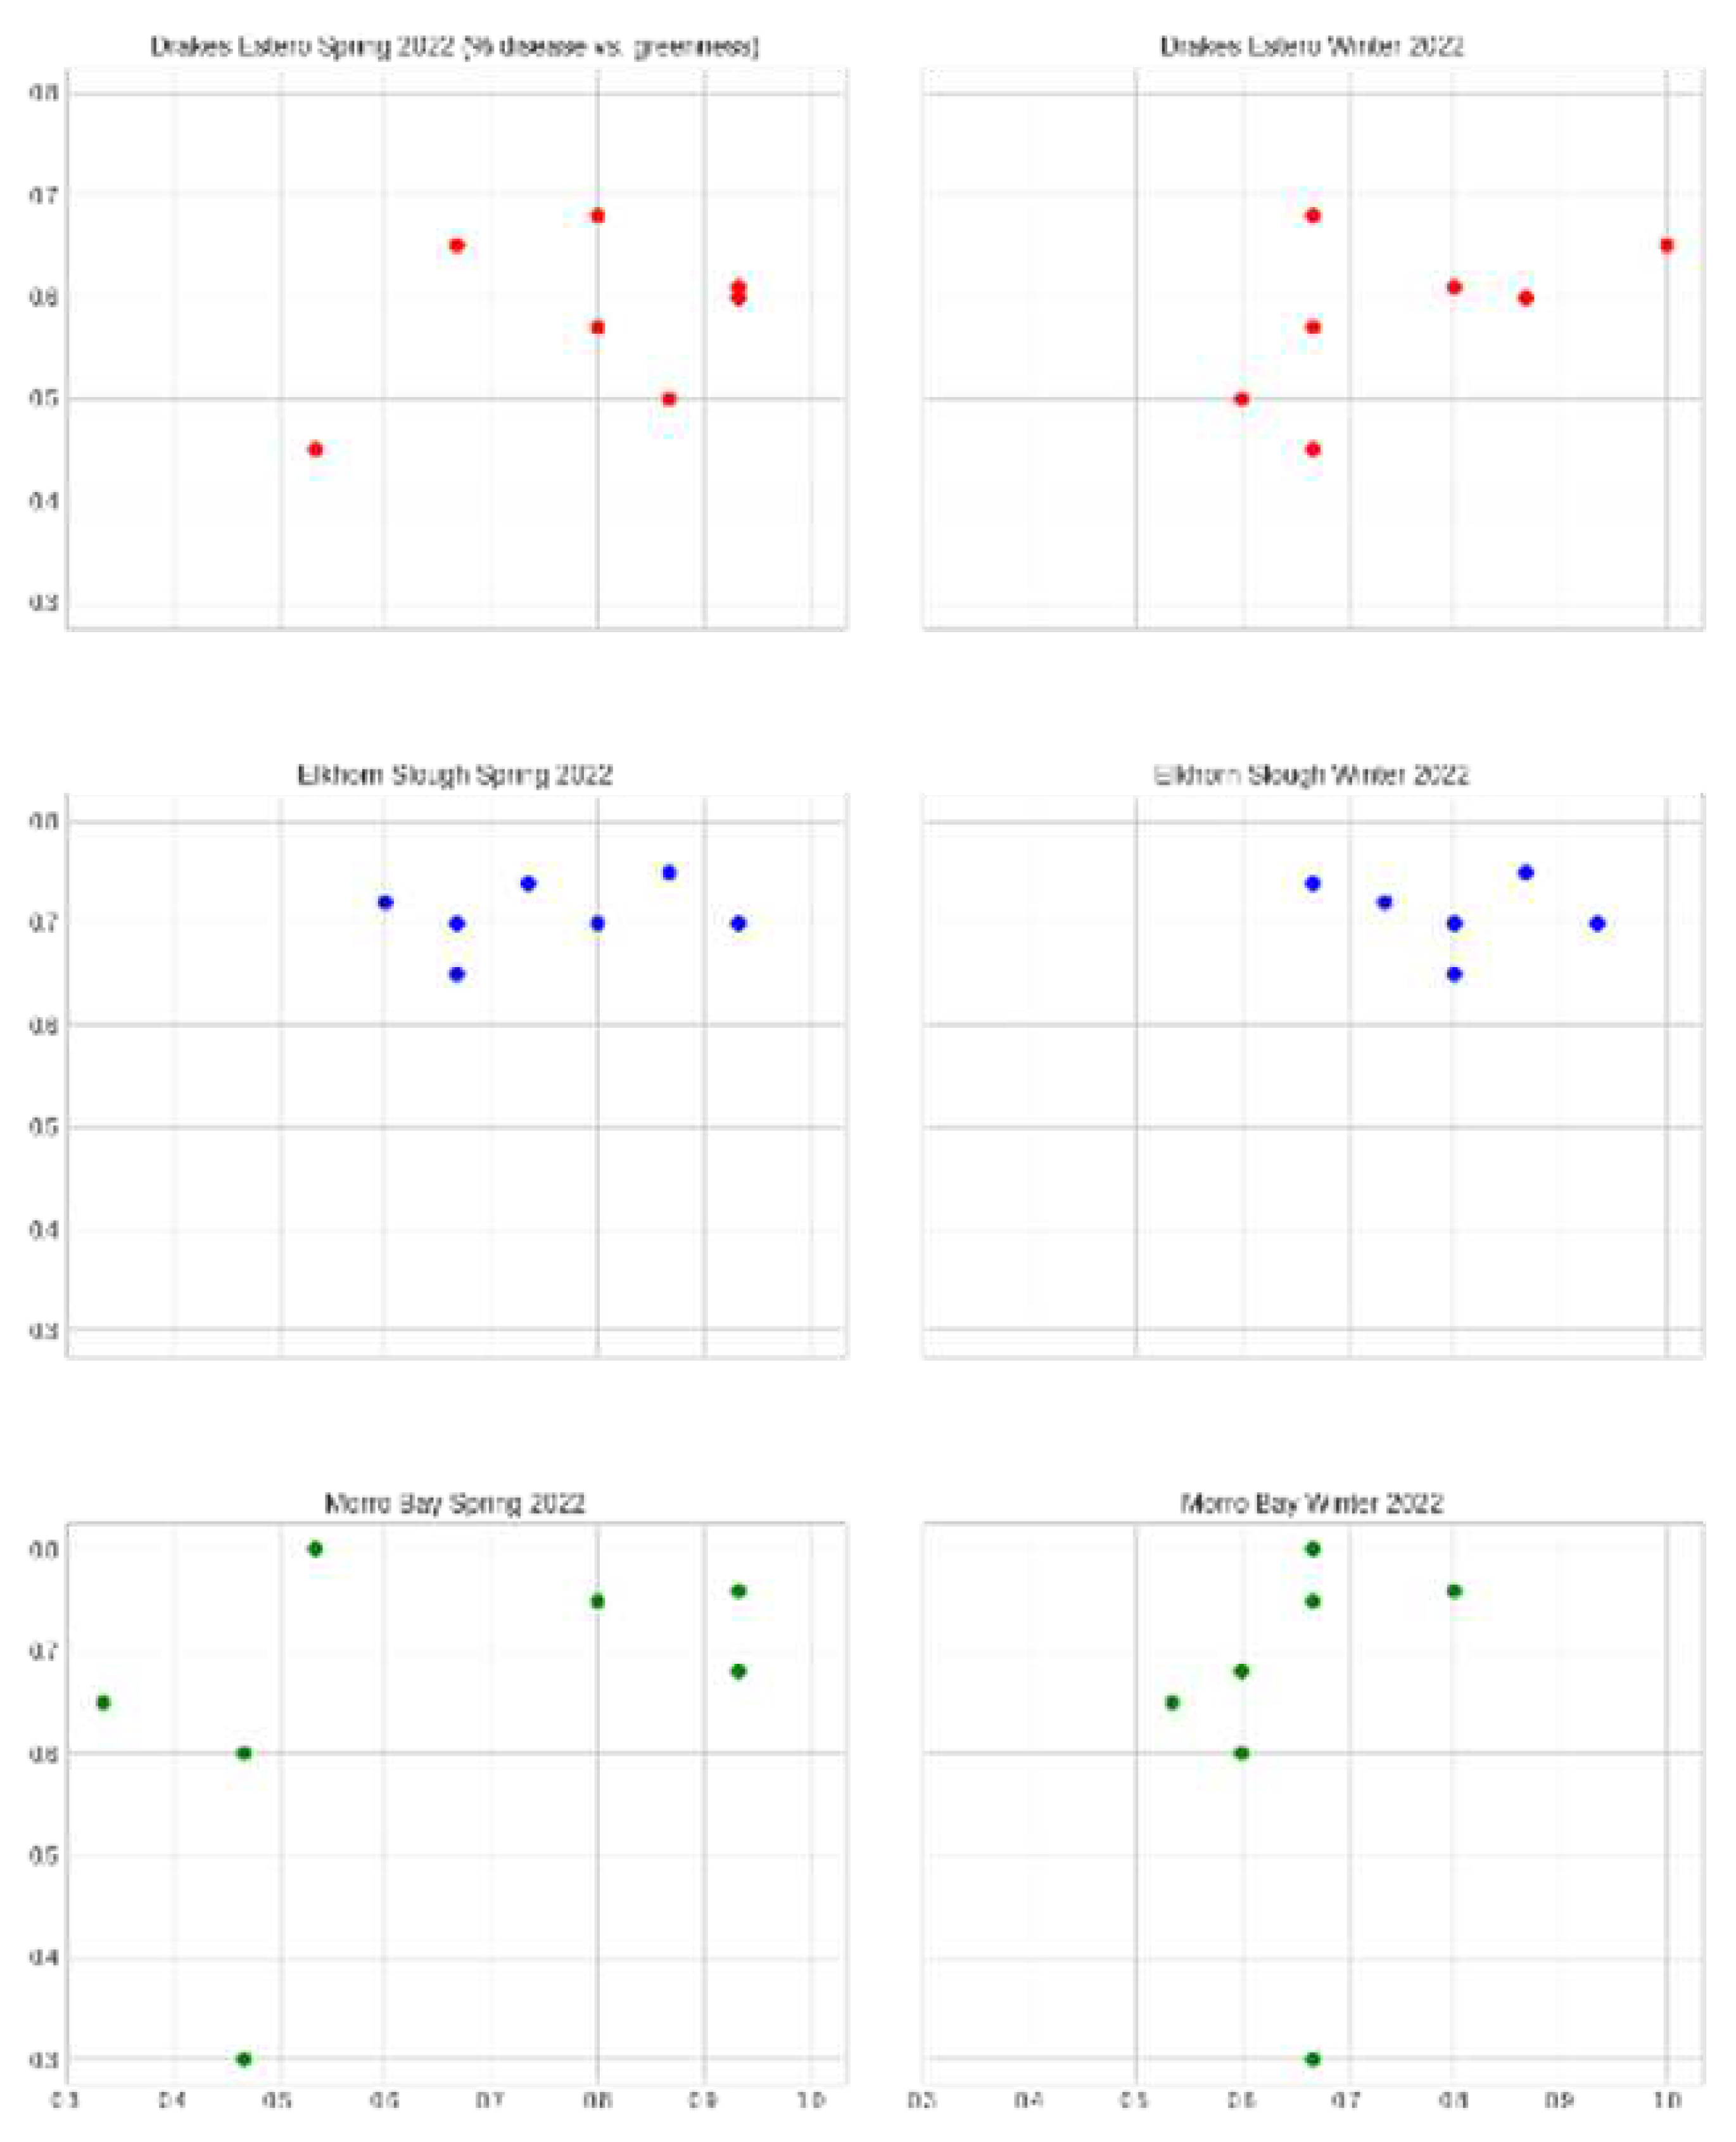
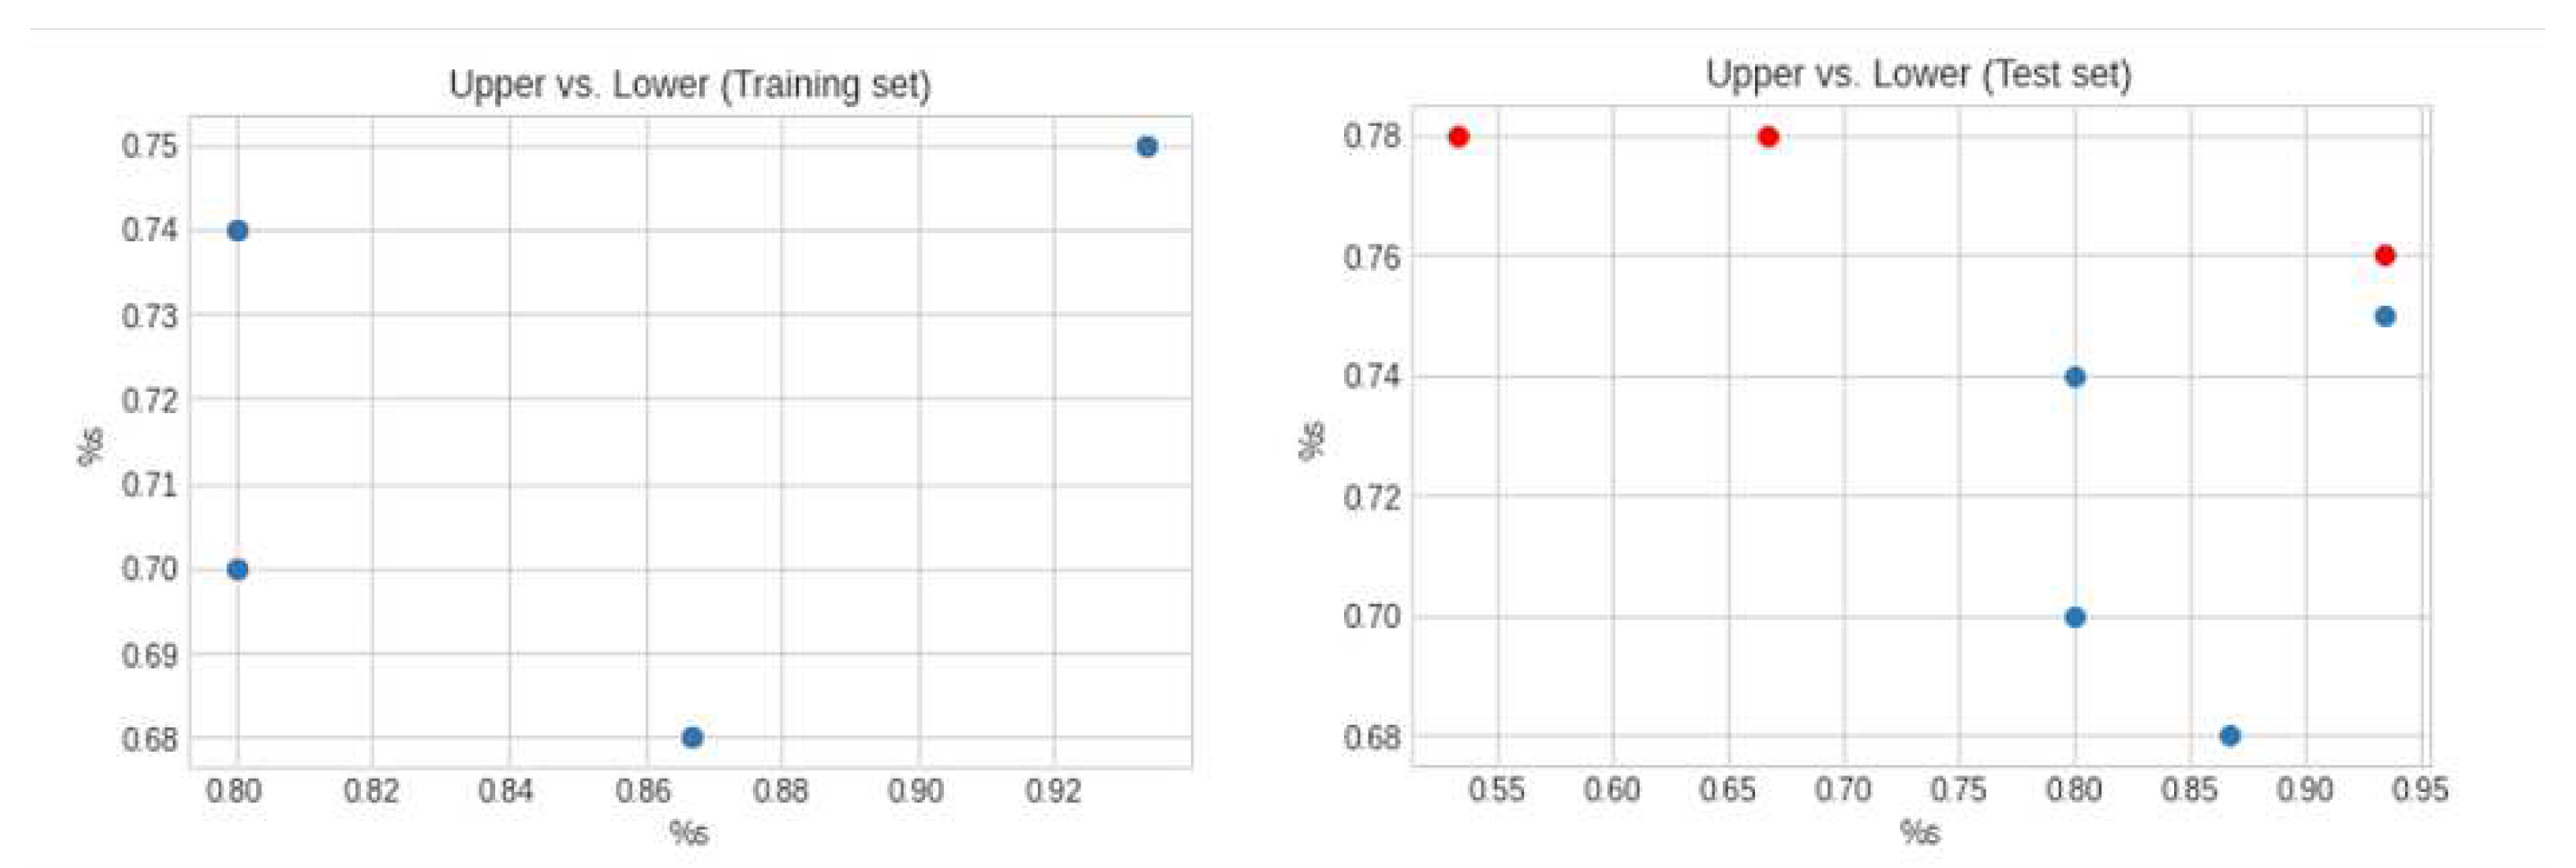
Observing disease prevalence vs. greenness index as a function of individual sites between Spring/Summer and Fall/Winter seasons, we break down scatter plots of this data as means of each sub-transect value. We see similar trends of disease prevalence vs. greenness index for Spring/Summer and Fall/Winter seasons for nearly all three sites [Figure 5A; 5B; 5C]. This trend was curious given some of our other results, so we plotted each individual transect and season against itself as a function of the spatial gradient within the estuary (i.e., upper vs. lower transect) [Figure 6].
In contrast to the significant links between extreme weather events and water temperatures and EWD, we found insignificant associations between absolute temperature metrics for both Spring/Summer and Fall/Winter seasons. Instead, we found much stronger correlations between disease prevalence and greenness index, with increasing greenness indices correlated with increased disease prevalence at the mouth of all three estuaries across all sampled seasons (p < 0.05, R2 = 0.76). Lastly, we observed the spatial gradients within estuaries against the latitudinal trend across sites. EWD prevalence and severity varied substantially without any strong latitudinal trend across northern to southern California (p > 0.05). Between sites, prevalence was overall highest in Drakes Estero, by an average 3.5 percent higher than both Elkhorn Slough and Morro Bay with overall EWD prevalence of 0.592, 0.567, and 0.546 percent respectively.
Figure 6.
In Figure 6, we note that even when observing each individual sampling season, for each site, as a function of lower vs. upper estuary disease prevalence and greenness index, we observe that Elkhorn Slough and Morro Bay show consistently similar trends of disease prevalence vs. greenness (i.e., where prevalence is high (above 60 percent), we notice that greenness indices are also above 60 percent), across all sampling periods of Spring/Summer and Fall/Winter seasons. Drakes Estero shows the opposite trend: where greenness index is high, disease prevalence is low and vice versa (p < 0.05). Morro Bay shows an exception during the Winter of 2022, where we see a trend similar to that of Drakes Estero: where greenness index is high, disease prevalence is low and vice versa.
Figure 7.
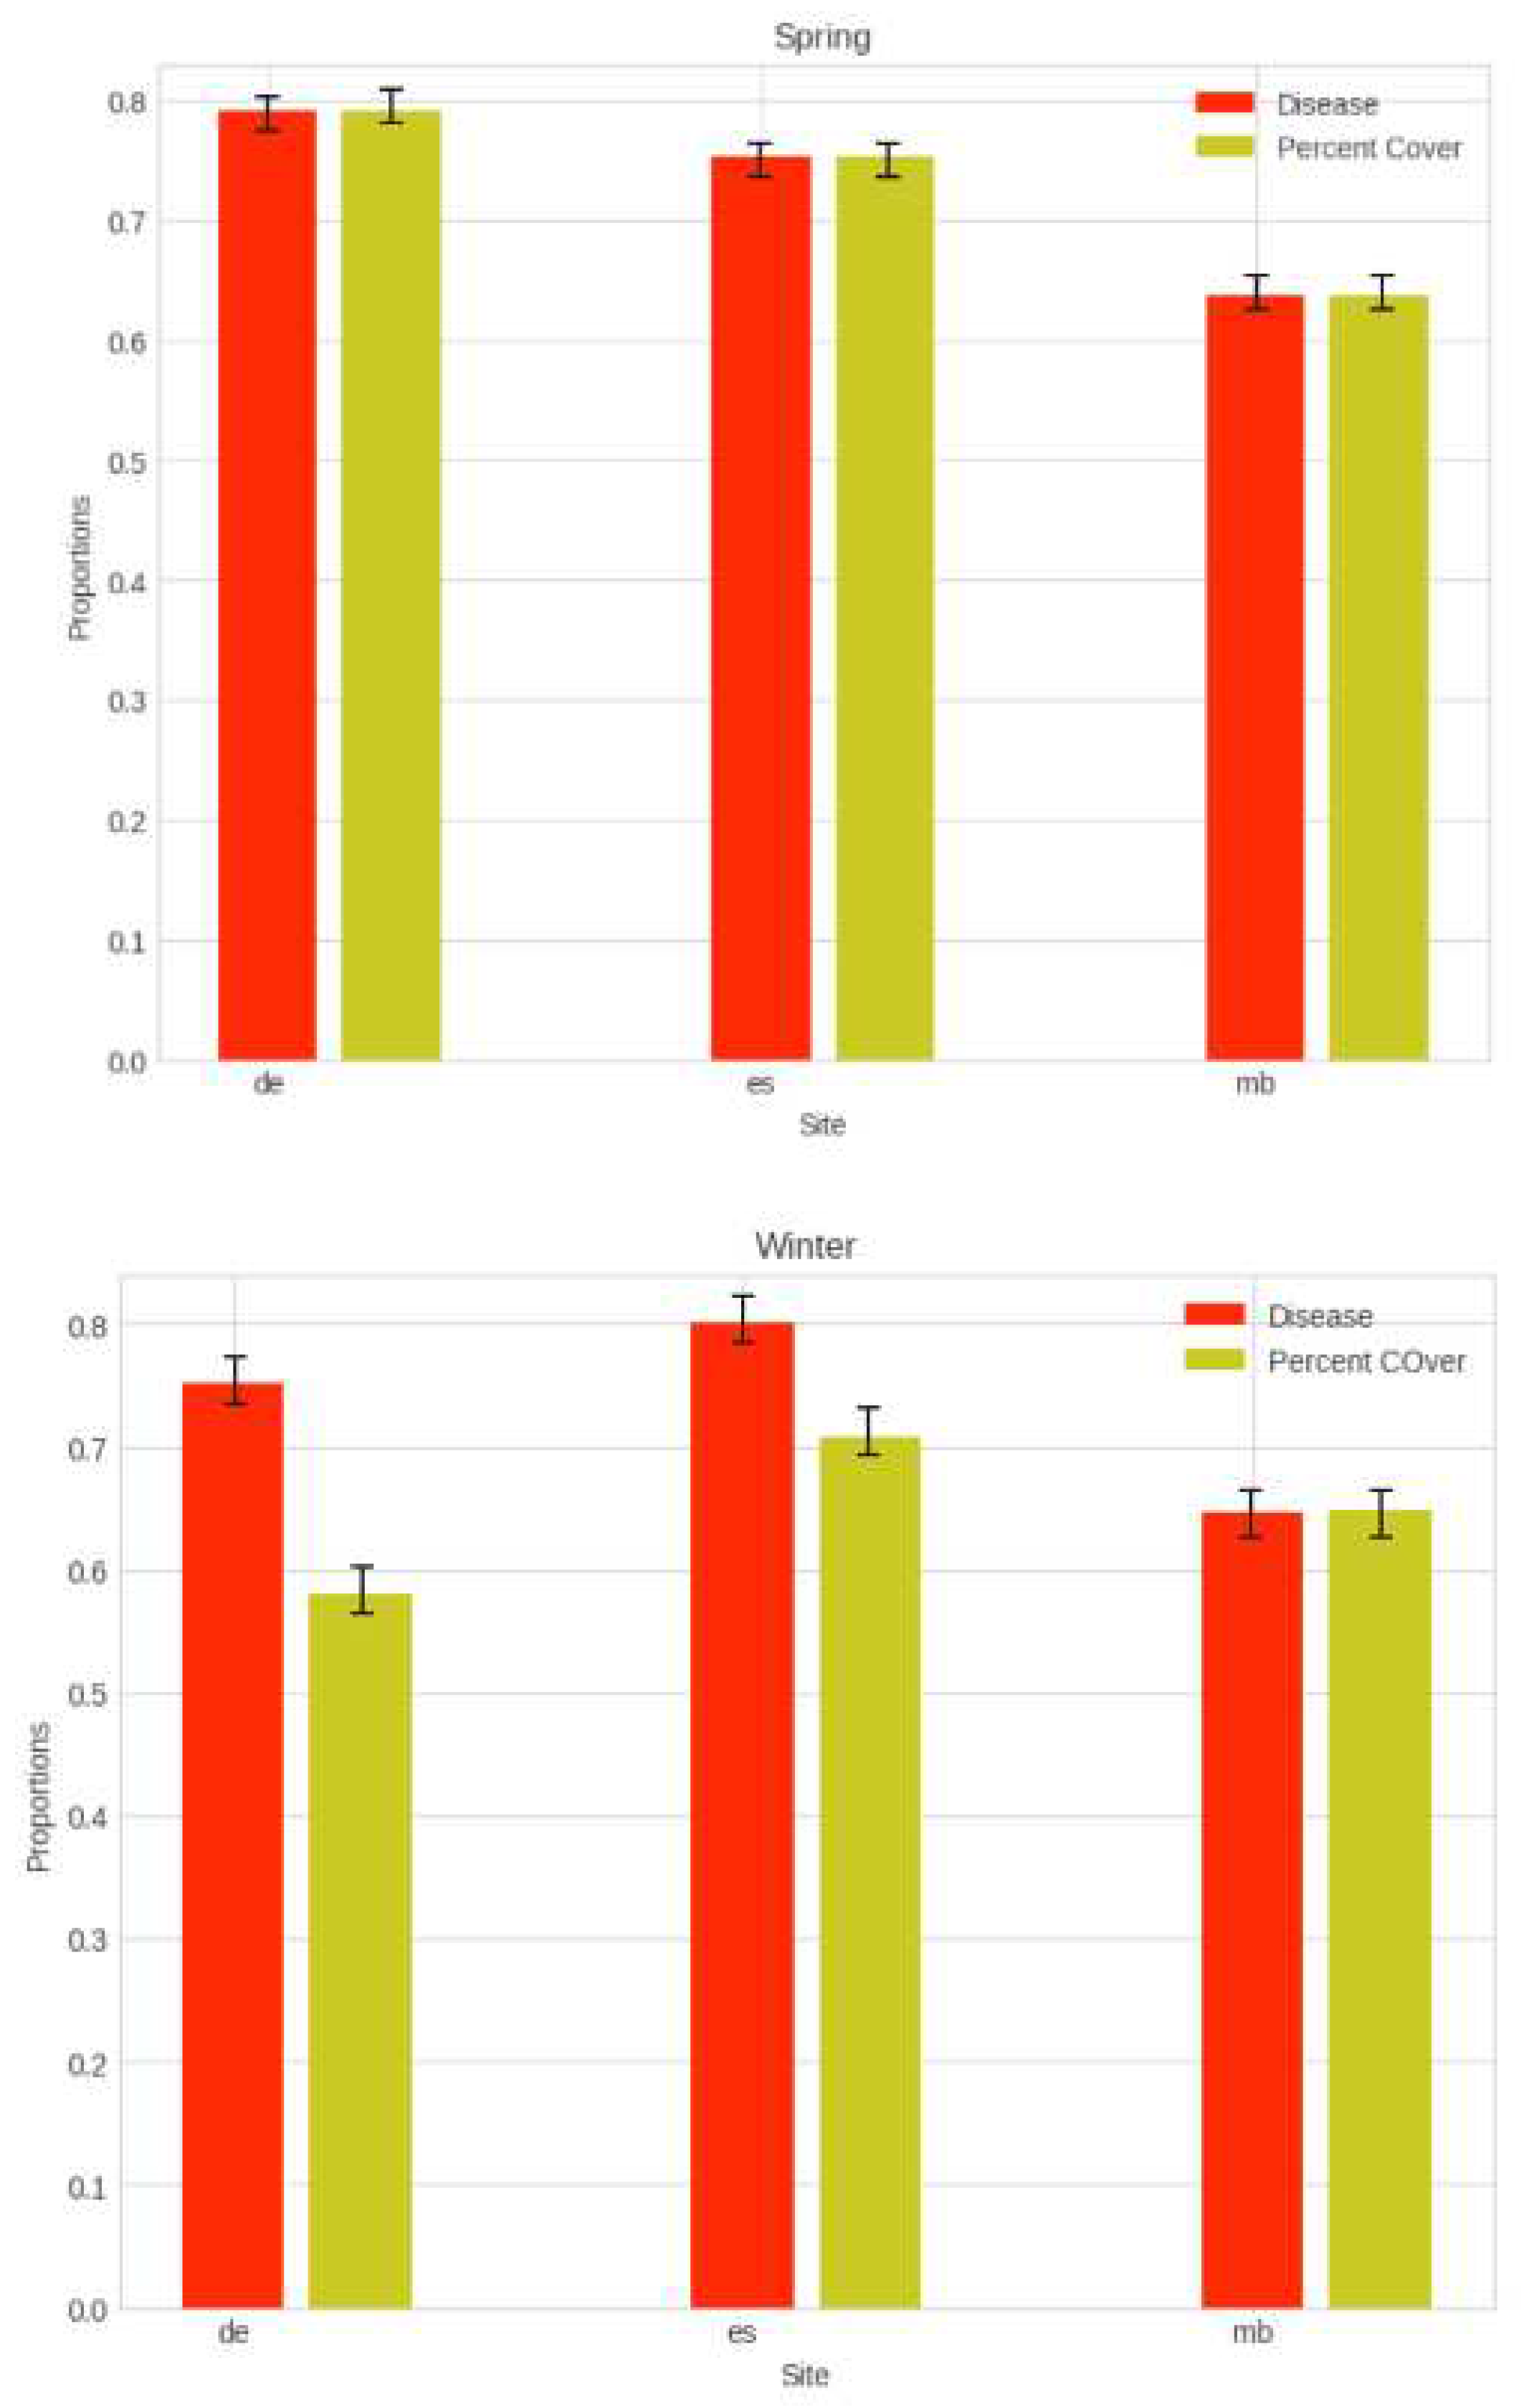
When plotted as overall estuary averages in a bar plot [Figure 6], not distinguished between upper and lower estuary, but as a function of the two distinct seasons, we observe that disease prevalence is high where greenness index is high (above 60 percent) across all sites (p < 0.05, SD = 73 percent within 1 SD).
Figure 8.
We trained several times until we ended up with our best model. Calculating the Mean Squared Error (MSE) of our actual vs. our predicted data on our best model, this resulted in an MSE of 0.026 and a correlation coefficient of 89 percent during training.
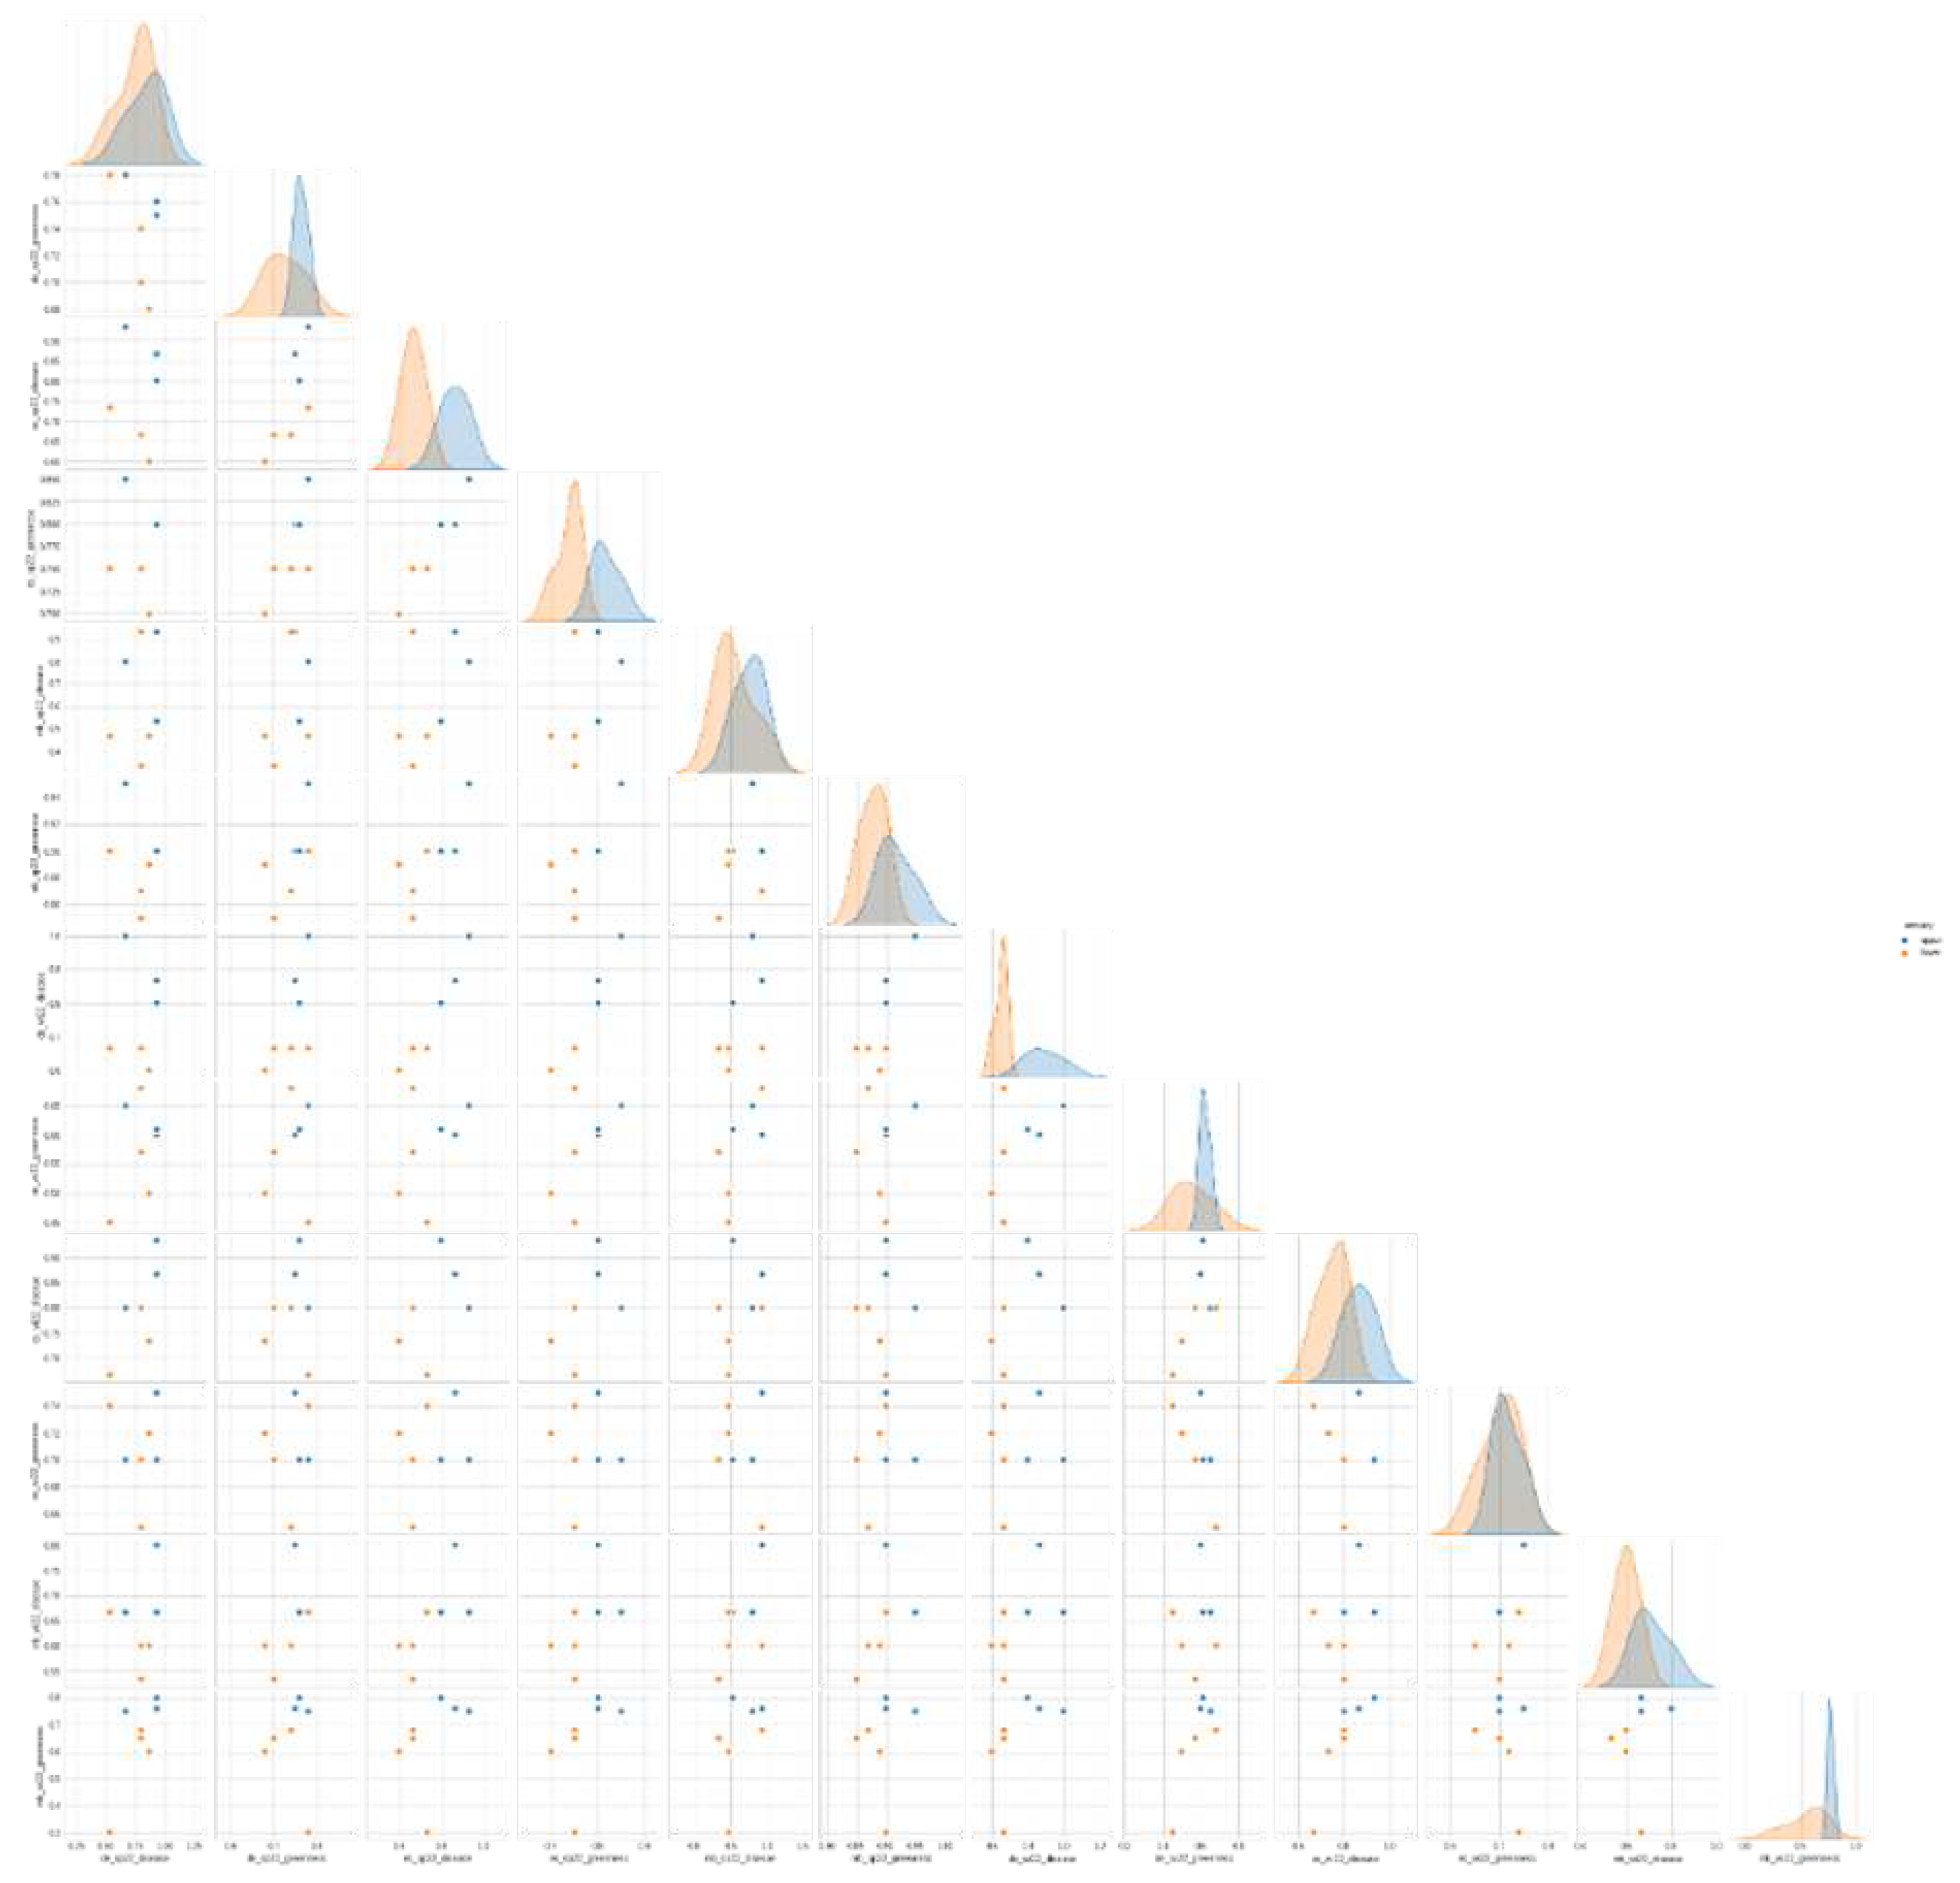
3.3. Structural Equation Model
To explore the potential relationships between predictor variables and their role in influencing eelgrass wasting disease incidence and severity, we developed the semPy package in Python. This package allowed us to account for indirect pathways and interrelationships among the explanatory variables. The approach was adapted from Pourtois, Tallam, et al. (2023). The structural equation modeling (SEM) analysis was conducted using aggregated data across multiple years, with temporal means calculated for each site. The selection of variables included in the SEM model was based on the direct paths identified in our previous Linear Mixed Effects Model analysis. SEM is a powerful statistical technique widely used in quantitative and social sciences to investigate complex relationships among variables. It allows researchers to examine the direct and indirect effects of variables on an outcome of interest, while simultaneously accounting for measurement error and interrelationships among multiple constructs. By incorporating both observed and latent variables, SEM provides a comprehensive framework for testing and refining theoretical models. Through the estimation of path coefficients, model fit indices, and overall model evaluation, SEM enables researchers to gain insights into the underlying mechanisms and causal relationships within a given system, offering a robust approach for hypothesis testing and theory development. Our hypotheses were formulated based on the variables available in our dataset and the causal relationships that could be investigated considering the spatial and temporal resolution of the data. For instance, causal relationships between transect ID and season could not be tested due to the collection of incidence and severity data at a single time point.
Figure 9.
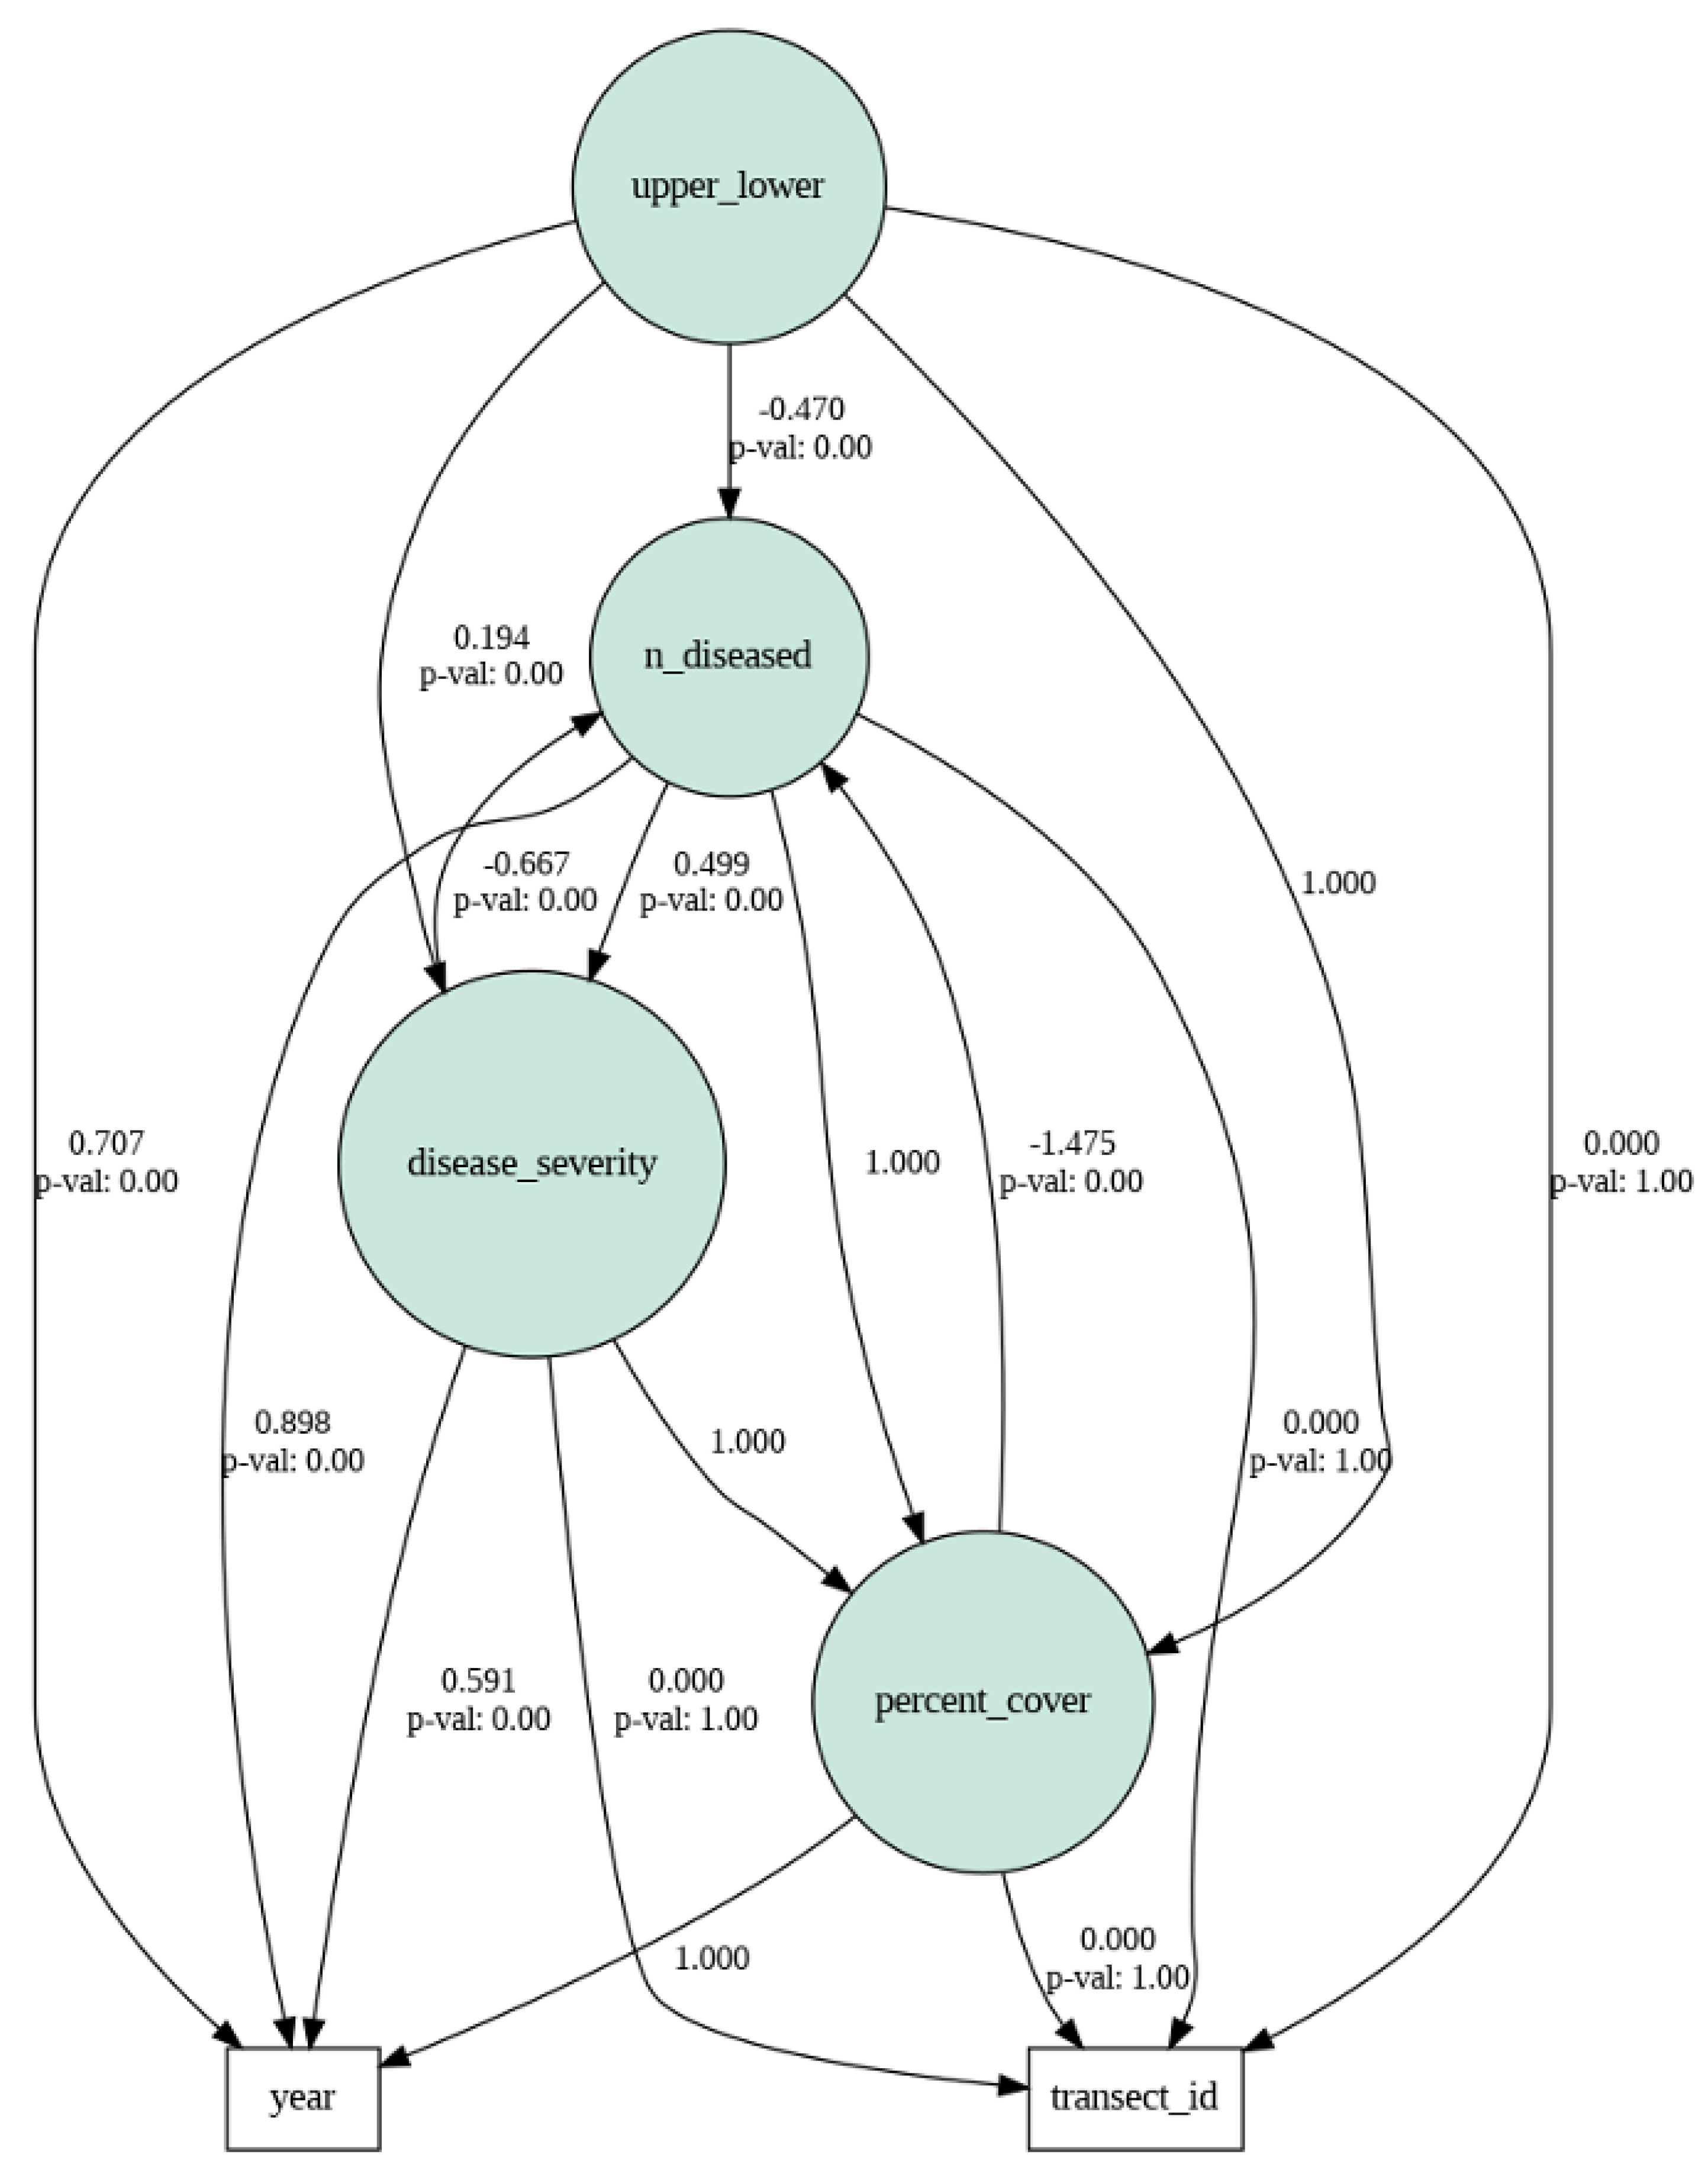
It is important to emphasize that while the SEM analysis provided complementary insights to the Linear Mixed Effects Model, our study did not aim to explicitly integrate these two models within a unified statistical framework.
4. Discussion
4.1. Estuaries hold crucial significance and face imminent threats
Estuaries are globally recognized as highly productive ecosystems, serving essential ecological and economic roles, including safeguarding shorelines, acting as vital nurseries for commercially valuable fish species, providing breeding sites, and supporting human recreational activities (Feebarani et al., 2016). Nevertheless, estuaries are currently encountering mounting pressures due to human activities, including nutrient overloads that lead to eutrophication, and the discharge of pollutants from aquaculture, agriculture, and industrial sources (Paerl et al., 2006), alongside other stressors. Additionally, they are increasingly exposed to climate-related challenges, such as extreme weather events that cause excessive nutrient enrichment during seawater exchange (Short and Wyllie-Echeverria, 1995).
4.2. Disease-induced modifications to marine ecosystems disrupt their structure and function
Outbreaks of diseases have a direct impact on the composition and operation of marine ecosystems, with notable consequences for plants, invertebrates, and vertebrates (Ward and Lafferty, 2004). Despite previous speculations on the significance of marine diseases and their potential rise, the scarcity of foundational data in many communities, particularly in plant populations, has hindered direct testing of this hypothesis (Tallam and White Jr., 2023).
4.3. Ecological repercussions of marine diseases caused by human-induced and climate-related pressures
Marine organisms can harbor a wide range of parasites and pathogens (Marcogliese, 2001; Lafferty et al., 2008). Significantly, large-scale outbreaks and subsequent mortalities not only impact host populations but also trigger cascading effects throughout entire ecosystems. For example, the disappearance of vital seagrass meadows, which play a crucial ecological role, can lead to trophic disruptions and alter community structure by eliminating top-level consumers (Lessios, 1988). Consequently, comprehending the impact of diseases and the timing of outbreaks on marine environments is becoming increasingly crucial, given the escalating human-induced and climate-related stresses affecting these ecosystems.
4.4. Insufficient understanding of host-parasite interactions hinders addressing climate change impacts on marine and estuarine invertebrates
The existing knowledge on host-parasite interactions falls short when it comes to addressing the effects of anthropogenic activities and climate change on marine and estuarine ecosystems. Therefore, our primary focus was to enhance our understanding of how diseases shape keystone populations and how these populations respond in the face of disease, particularly in spatially sensitive environments like estuaries. We believe that only by unraveling these mechanisms can we begin to explore more specific inquiries regarding the influences of anthropogenic and climate-related stressors. Consequently, our research aimed to examine the health of eelgrass (Zostera marina), a vital estuarine plant species and ecosystem engineer, and its protist parasite, Labyrinthula zosterae, which poses a threat to Z. marina through eelgrass wasting disease (EWD). By studying the relationship between L. zosterae and the health of three significant estuaries within the California coastline National Estuarine Research Reserve System (NERRS), we sought to gain insights into one critical instance of disease impacts on host health.
4.5. Discussion of Results
To address ecological inquiries and enhance our understanding of eelgrass wasting disease, we employed both ecological investigations and advanced technological tools. Through rapid and standardized surveys, we were able to quantify the occurrence of eelgrass wasting disease at an unprecedented scale across three locations spanning from northern to southern California. Additionally, we refined the quantitative narrative surrounding the correlation between disease prevalence, estuaries, and eelgrass meadows across different latitudes and within individual estuaries.
4.6. Summary of Models and Analyses
We conducted a series of models and analyses to investigate the dynamics of eelgrass wasting disease. Our sampling efforts focused on three key estuaries within the National Estuarine Research Reserve System (NERRS), consisting of four sub-transects. Over the course of three seasons, we collected data on disease prevalence and native eelgrass shoot density using percentage cover in quadrats, which we referred to as the "greenness index."
Specifically, our models and analyses included:
- -
- Assessing disease prevalence as a function of the spatial gradient within each estuary over time, considering approximately 2,000 seagrass blades and around 300 quadrat samples.
- -
- Comparing disease prevalence between the upper and lower estuary spatial gradients at each site.
- -
- Investigating the relationship between disease prevalence and percent cover (greenness index).
- -
- Analyzing disease prevalence and greenness index variations between the Spring/Summer and Fall/Winter seasons, examining individual sites.
- -
- Assessing disease prevalence and greenness index within each sub-transect and for each sampling season.
- -
- Investigating disease prevalence and greenness index variations between the lower and upper estuary, as well as between distinct seasons.
- -
- Utilizing preliminary machine learning models on our data to predict disease prevalence vs. greenness index for the next five years (2024 to 2029), obtaining validation metrics such as mean squared error (MSE) and correlation coefficient.
These comprehensive models and analyses allowed us to gain insights into the relationships and patterns between disease prevalence, eelgrass shoot density, and estuary dynamics, enabling us to make predictions for future disease trends.
4.7. Connecting the dots: Insights from the study on eelgrass wasting disease in estuaries
The study aimed to shed light on the understudied influence of spatial gradients on estuarine ecosystems, particularly when faced with the combined challenges of the climate crisis and disease. The primary focus was to investigate the prevalence of eelgrass wasting disease (EWD) across multiple estuaries and its relationship with the spatial gradient and eelgrass abundance.
One of the key motivations for the research was to explore how EWD manifests differently in estuaries compared to marine or freshwater systems. Eelgrasses, being a paraphyletic group of marine angiosperms, have a unique evolutionary history, and most EWD studies have been conducted in marine waters, leaving transitional ecosystems like estuaries less understood in this context.
We hypothesized that EWD might be more prevalent closer to the watershed due to potential influences from activities like dairy farming, low water circulation, and increased hypoxia. Therefore, they expected that eelgrass meadows near the mouth of estuaries would have lower EWD prevalence compared to those closer to the watershed. Additionally, they hypothesized an inverse correlation between EWD prevalence and the greenness index based on the theory of density dependence.
The results provided several interesting findings: - Disease Prevalence and Spatial Gradient: Overall, the study revealed a significant trend of declining disease prevalence from the mouth to the watershed in Drakes Estero and Elkhorn Slough. However, Morro Bay showed an increase in disease prevalence from the middle to the tail end of the estuary. This contrasted with the initial hypothesis. - Disease Prevalence and Percent Cover: Initially, when disease prevalence was analyzed independently from the greenness index, there seemed to be little correlation. However, when considering the data seasonally, a significant correlation between disease prevalence and greenness index was observed. - Upper vs. Lower Estuary Trends: Analyzing trends for each sub-transect, the researchers found consistent positive correlation between disease prevalence and greenness index in Elkhorn Slough and Morro Bay across most sub-transects and seasons. Higher disease prevalence (above 60 percent) corresponded to higher greenness indices. In contrast, Drakes Estero showed two statistically significant trends: an inverse correlation in the lower estuary, where high disease prevalence (above 80 percent) corresponded to low greenness indices (below 60 percent), and a positive correlation in the upper estuary, where high disease prevalence aligned with high greenness indices.
The study’s findings challenge some initial assumptions about the relationship between EWD prevalence and spatial gradients within estuaries. The correlation between disease prevalence and greenness index, particularly when considered seasonally, suggests a more complex interaction between EWD and ecosystem dynamics.
These insights will pave the way for future research in understanding the intricate connections between disease dynamics, spatial gradients, and other climate change and anthropogenic stressors within estuaries. Additionally, the findings raise questions about the potential impact of EWD in transitional ecosystems and its implications for the health and resilience of estuarine environments.
4.8. Disease prevalence gradient from estuary mouth to watershed
The study revealed that disease prevalence is generally higher at the mouth of all three studied estuaries compared to the areas closer to the watershed. Several factors contribute to the higher disease prevalence observed at the estuary mouths, which warrant further investigation through observational and experimental studies.
In all three estuaries, mouth regions exhibit distinct characteristics that may influence disease dynamics. These factors include greater water flow, reduced potential for hypoxia (low oxygen conditions), increased flushing of water, higher bird species richness (especially gulls and terns), elevated salinity levels influenced by oceanic inputs, larger sediment grain sizes, dynamic sediment budgets, and closer proximity to marine biota that may inhabit, breed within, or consume eelgrass during high tide events. Additionally, there is a possibility that other plant species could act as disease reservoirs within these areas.
Grazing animals, which are more abundant near the estuary mouth, may also play a role in disease prevalence. Their grazing activities can remove decaying eelgrass, potentially affecting the abundance of infected tissue samples collected and observed in the study.
It is important to note that salinity levels typically exhibit a gradient within temperate estuaries, with higher salinity near the mouth where ocean water enters and lower salinity upstream where freshwater inflows occur (Rice et al., 2012).
Overall, these findings highlight the need for further research to understand the specific mechanisms driving the higher disease prevalence observed at the estuary mouths. Investigating the interactions between environmental factors, grazing dynamics, and the presence of potential disease reservoirs will contribute to a more comprehensive understanding of disease dynamics in estuarine ecosystems.
4.9. Influence of temperature and dissolved oxygen levels
In line with another study investigating the relationship between eelgrass wasting disease (EWD), greenness index, and estuarine spatial gradients in the context of future climate change, we found that Labyrinthula zosterae, the pathogen causing EWD, appears to be influenced by temperature sensitivity. Across the three studied estuaries, a distinct horizontal temperature gradient was observed, with the upper reaches consistently exhibiting warmer temperatures compared to the lower estuary. Similar temperature patterns have been documented in other studies (Wooldridge and Deyzel, 2012). Thus, one possible reason for higher EWD prevalence closer to the mouth of the estuaries, compared to the watershed, could be the presence of warmer temperatures in those regions. To examine this further, we collected temperature data from the National Estuarine Research Reserve System (NERRS) and conducted an analysis, which revealed a statistically significant correlation between disease prevalence and estuary water temperature (°C) (p < 0.05).
Dissolved oxygen (DO) levels in estuaries are also influenced by water temperature (Kaiho, 1994). Higher water temperatures result in decreased oxygen solubility in the water. Therefore, as estuary water temperature increases, the capacity of the water to hold dissolved oxygen decreases. Dissolved oxygen is crucial for the survival of eelgrass meadows in the water, and thus, as the estuary warms, lower levels of dissolved oxygen can potentially impact the health of eelgrass and contribute to the occurrence of EWD.
These findings highlight the importance of considering temperature and dissolved oxygen levels in understanding the dynamics of EWD and its relationship with climate change in estuarine ecosystems. The warming of estuaries can have implications for both pathogen prevalence and eelgrass health, emphasizing the need for continued monitoring and research in this area.
Extreme weather events, such as severe storms, have been observed to correlate with the prevalence of eelgrass wasting disease (EWD) in estuaries. In the Spring/Summer season of 2023, California experienced a series of atmospheric storms, resulting in an unusually high amount of rainfall and significant impacts across the state. During this period, all three studied estuaries showed a statistically significant increase in EWD prevalence compared to the previous year. This finding suggests a potential link between extreme weather events and the occurrence of EWD.
4.10. Future Work
To further investigate this relationship, future studies could analyze multiple years of data and develop machine learning models to assess the correlation between extreme weather events and EWD over several decades. This would provide a more comprehensive understanding of the impact of such events on EWD prevalence. Additionally, as projected by the Pacific Northwest National Laboratory, the intensity of winter storms in the Western U.S. is expected to increase, emphasizing the need for regional storm-resolving simulations to assess the impacts on estuaries (Chen et al., 2023).
The sensitivity of estuarine ecosystems to climate change was also examined through the analysis of biophysical water conditions and their connection to climate variables. By comparing NERR scientific studies with the EWD study, correlations were observed between atmospheric storms and EWD prevalence in the estuaries. Overall, there was an increase in EWD prevalence, with more significant increases near the mouths of estuaries, particularly in Drakes Estero, which is the most isolated estuary.
Based on these findings, it can be concluded that all studied NERR reserves will be impacted by climate change to some degree. Biophysical sensitivity, as assessed through various climate indicators, was found to be of highest concern in isolated reserves. Each reserve will need to determine its specific vulnerabilities and management objectives in relation to climate change. It is important for reserves to consider the spatial gradient of estuaries and conduct reserve-specific analyses to better understand the patterns observed in the study, such as the higher prevalence of EWD near the mouth of estuaries compared to the watershed.
Overall, these results highlight the significance of extreme weather events and climate change in influencing the dynamics of EWD in estuarine ecosystems. Understanding these relationships is crucial for effective natural resource management and developing strategies to mitigate the impacts of climate change on estuarine health.
The analysis of disease prevalence and percent cover revealed a positive correlation between the two variables. Shoot density showed a consistent positive correlation with disease prevalence, which aligns with findings from another study on the same topic (Aoki et al., 2022). Furthermore, leaf area was identified as a significant predictor of meadow-wide disease prevalence, explaining 46 percent of the variation. In terms of the upper and lower estuary comparison, leaf area was an even stronger predictor, explaining approximately 67 percent of the variation, with the upper estuary showing higher EWD prevalence than the lower estuary at all three study sites.
While there were insignificant associations between absolute temperature metrics for the Spring/Summer and Fall/Winter seasons and EWD prevalence, stronger correlations were observed between disease prevalence and the percent cover. Increasing percent cover was found to be correlated with higher disease prevalence at the mouth of all three estuaries across all sampled seasons. In fact, the percent cover in the leaf-level model of lesion area had the largest standardized effect size on disease prevalence compared to other observed metrics. The increase in shoot density likely contributes to the higher prevalence of EWD due to the greater potential for direct transmission of the pathogen through contact with diseased eelgrass tissue (Groner et al., 2016). These plant traits, such as shoot density and leaf area, were found to be more significant in understanding the patterns of EWD at smaller spatial scales. Notably, similar findings have been reported in another survey conducted on this research question (Aoki et al., 2022).
This study demonstrates that the spatial gradient of an estuary shows a stronger correlation with eelgrass wasting disease (EWD) compared to factors like seasonality or the passage of years. Interestingly, there was no significant variation observed along the latitudinal gradient, but variations were evident within specific regions, particularly in the upper and lower estuaries, as indicated by the prevalence of EWD.
Ecosystem-scale environmental conditions play a significant role in influencing eelgrass wasting disease. Abiotic factors such as light, turbidity, and salinity may have synergistic effects on EWD, as shown in previous laboratory studies (Brakel et al., 2019; Jakobsson-Thor et al., 2020). Additionally, factors like pathogen virulence, water quality, and nutrient availability, which were not addressed in our study, could also interact with EWD, greenness indices, and rising temperatures. Further research is needed, including long-term monitoring, to collect specific and targeted data on the sensitivity of L. zosterae to various climatic, landscape, environmental, biological, and anthropogenic stressors, and to develop rapid and scalable forecasting tools and targeted management measures. Surveillance of EWD at relevant spatial and temporal scales is crucial for understanding its behavior and for mitigating and managing future EWD pandemics.
As ocean temperatures continue to rise, it becomes essential to improve our understanding of spatial and temporal relationships between diseases to develop forecasting tools aligned with conservation and management efforts (Maynard et al., 2016). By documenting correlations between warmer waters, climatic anomalies (e.g., extreme weather events), and disease metrics across a broader range of estuaries and geographic locations, we can enhance our understanding of what EWD is most sensitive to. Our study has identified the most influential parameters affecting EWD, including temperature, severity, latitudinal gradients, upper and lower estuary spatial gradients, and the greenness index. This information can guide future efforts in predicting and preventing disease outbreaks and pandemics. Other metrics that incorporate water quality, anthropogenic stressors, and temperature exposure over time can also help us understand EWD’s behavior in the face of ocean acidification (Gimenez et al., 2018).
5. Conclusions
Currently, no interventions exist for treating, managing, or preventing EWD due to limited research on this marine epidemic. Therefore, tracking and measuring outbreaks are crucial steps towards better understanding the impending decline of eelgrass meadows (Aoki et al., 2022; Tallam et al., 2023; Tallam and White 2023; Tallam and Malkovskiy 2023). Identification tools can benefit seagrass meadows with high disease prevalence or severity, informing management actions to improve water quality, reduce human impacts, and manage boat anchoring to enhance the resilience and persistence of seagrasses in the face of existing climate and anthropogenic stressors (Darling et al., 2019; Rappazzo et al., 2021).
Anthropogenic climate change, with its increasing sea surface temperature anomalies, poses a significant threat to estuaries and seagrass meadows across California and the west coast (Duarte and Krause-Jensen, 2017; Aoki et al., 2022). Even small-scale, localized warming can elevate disease risk for eelgrass populations across their entire range, not just for edge-range populations. Surprisingly, currently healthy seagrass meadows, characterized by high greenness indices and robust individual blades, are at higher risk of acquiring and spreading EWD, increasing the potential for future outbreaks.
The National Estuarine Research Reserve System (NERRS) is uniquely positioned to assess climate impacts on estuaries in the United States. With its diverse range of managed coastal ecosystems representing various biogeographic regions and estuary types, NERRS is exposed to different gradients of anthropogenic and climate-related stressors. The integrated research and training programs conducted by NERRS are crucial for empowering communities to address natural resource management issues, including the study of estuary health (Tallam and Wyllie-Echeverria, 2023).
In addition to our findings, the ability to rapidly detect disease signs and characterize disease-estuary relationships is a significant advancement. This understanding is vital for comprehending, tracking, predicting, and preventing marine disease pandemics under anthropogenic climate change. As the risk of disease outbreaks increases with warming, the development of tools for disease surveillance and forecasting at specific and broad geographic scales is essential for monitoring the health of estuarine and coastal ecosystems and supporting the diverse organisms and communities that depend on them (Tallam et al., 2023; Tallam and Wyllie-Echeverria, 2023).
Author Contributions
Conceptualization, KT; Methodology, KT; Formal analyses, KT; Writing-original draft preparation, KT; Writing-all other drafts, KT; Writing-review and editing, KT
Funding
This research received no external funding.
Data Availability Statement
The datasets used in this study are available upon reasonable request.
Acknowledgments
We would like to thank Dr. Barnabas Daru, Dr. Elliott White Jr. and Dr. Sandy Wyllie-Echeverria for their support in reviewing this manuscript. Thanks to Dr. Peay for helping the lead-author put the final touches on this manuscript. We would also like to thank the insights we received from the National Estuarian Research Reserve and the National Parks Service with regards to estuary management and diseases along United States coastlines. We would also like to thank the National Estuarian Research Reserve System for the incredible diversity of work laid out in order for us to even consider taking on such a study.
Conflicts of Interest
The authors declare no conflict of interest.
References
- Aoki, L.R., Rappazzo. Disease surveillance by artificial intelligence links eelgrass wasting disease to ocean warming across latitudes. Limnology and Oceanography 2022, 67, 1577–1589. [Google Scholar] [CrossRef]
- Aronson, R.B., Precht. White-band disease and the changing face of Caribbean coral reefs. Hydrobiologia 2001, 460, 25–38. [Google Scholar] [CrossRef]
- Babcock, R.C., Bustamante. Severe Continental-Scale Impacts of Climate Change Are Happening Now: Extreme Climate Events Impact Marine Habitat Forming Communities Along 45 percent of Australia’s Coast. Frontiers in Marine Science 6.
- Bartoloni, S.E., Walter. Spatial distribution of seawater carbonate chemistry and hydrodynamic controls in a low-inflow estuary. Estuarine, Coastal and Shelf Science 2023, 281, 108195. [Google Scholar] [CrossRef]
- Behringer, D.C., Lafferty. Marine Disease Ecology, Oxford University Press, 2020.
- Bradley, M. Hidden Components in Tropical Seascapes: Deep-Estuary Habitats Support Unique Fish Assemblages | SpringerLink [WWW Document]. URL. https://link.springer.com/article/10.1007/s12237-016-0192-z. 2017; (accessed on 31 August 2022). [Google Scholar]
- Brakel, J., Jakobsson-Thor. Modulation of the Eelgrass – Labyrinthula zosterae Interaction Under Predicted Ocean Warming, Salinity Change and Light Limitation. Frontiers in Marine Science 6. 2019. [Google Scholar]
- Burge, C.A., Mark Eakin. Climate change influences on marine infectious diseases: implications for management and society. Ann Rev Mar Sci, 2014; 6, 249–277. [Google Scholar] [CrossRef]
- Byers, J.E. Effects of climate change on parasites and disease in estuarine and nearshore environments. PLOS Biology Cabral, H., Fonseca, V., Sousa, T., Costa Leal, M., 2019. Synergistic Effects of Climate Change and Marine Pollution: An Overlooked Interaction in Coastal and Estuarine Areas. International Journal of Environmental Research and Public Health 16, 2737. https://doi.org/10.3390/ijerph16152737. 2020, 18, e3000743. [Google Scholar] [CrossRef]
- Chen, X., Leung. Sharpening of cold-season storms over the western United States. Nat. Clim. Chang. 2023, 13, 167–173. [Google Scholar] [CrossRef]
- Colombano, D.D., Litvin. Climate Change Implications for Tidal Marshes and Food Web Linkages to Estuarine and Coastal Nekton. Estuaries and Coasts 2021, 44,, 1637–1648. [Google Scholar] [CrossRef]
- Costanza, R., de Groot. Changes in the global value of ecosystem services. Global Environmental Change, 2014; 26, 152–158. [Google Scholar] [CrossRef]
- Darling, E.S., McClanahan. Social–environmental drivers inform strategic management of coral reefs in the Anthropocene. Nat Ecol Evol 2019, 3, 1341–1350. [Google Scholar] [CrossRef]
- Díaz, S. Intergovernmental science-policy platform on biodiversity and ecosystem services. , 2019. [Google Scholar]
- Duarte, C.M., Krause-Jensen. Export from Seagrass Meadows Contributes to Marine Carbon Sequestration. Frontiers in Marine Science 4. 2017. [Google Scholar]
- El-Sayed, A., Kamel. Climatic changes and their role in emergence and re-emergence of diseases. Environ Sci Pollut Res, 2020; 27, 22336–22352. [Google Scholar] [CrossRef]
- Feebarani, J., Joydas. Benthic quality assessment in a naturally- and human-stressed tropical estuary. Ecological Indicators, 2016; 67, 380–390. [Google Scholar] [CrossRef]
- Getz, W.M., Tallam. A quantitative narrative on movement, disease and patch exploitation in nesting agent groups. 2019. [Google Scholar] [CrossRef]
- Gimenez, I., Waldbusser. Ocean acidification stress index for shellfish (OASIS): Linking Pacific oyster larval survival and exposure to variable carbonate chemistry regimes. Elementa: Science of the Anthropocene 2018, 6, 51. [Google Scholar] [CrossRef]
- Graham, O.J., Aoki. Effects of Seagrass Wasting Disease on Eelgrass Growth and Belowground Sugar in Natural Meadows. Frontiers in Marine Science 2021, 8. [Google Scholar] [CrossRef]
- Groner, M.L., Maynard. Managing marine disease emergencies in an era of rapid change. Philosophical Transactions of the Royal Society B: Biological Sciences 2016, 371, 20150364. [Google Scholar] [CrossRef] [PubMed]
- Halpern, B.S., Walbridge. A Global Map of Human Impact on Marine Ecosystems. Science 2008, 319, 948–952. [Google Scholar] [CrossRef] [PubMed]
- Harvell, D., Aronson. The rising tide of ocean diseases: unsolved problems and research priorities. Frontiers in Ecology and the Environment 2004, 2, 375–382. [Google Scholar] [CrossRef]
- He, Q., Silliman. Climate Change, Human Impacts, and Coastal Ecosystems in the Anthropocene. Current Biology Hechinger, R.F., Lafferty, K.D., McLaughlin, J.P., Fredensborg, B.L., Huspeni, T.C., Lorda, J., Sandhu, P.K., Shaw, J.C., Torchin, M.E., Whitney, K.L., Kuris, A.M., 2011. Food webs including parasites, biomass, body sizes, and life stages for three California/Baja California estuaries. Ecology 92, 791–791. https://doi.org/10.1890/10-1383.1. 2019, 29, R1021–R1035. [Google Scholar] [CrossRef] [PubMed]
- Hoegh-Guldberg, O., Bruno. The Impact of Climate Change on the World’s Marine Ecosystems. Science 2010, 328, 1523–1528. [Google Scholar] [CrossRef] [PubMed]
- Jakobsson-Thor, S., Brakel. Complex Interactions of Temperature, Light and Tissue Damage on Seagrass Wasting Disease in Zostera marina. Frontiers in Marine Science 2020, 7. [Google Scholar] [CrossRef]
- Kaiho, K. Benthic foraminiferal dissolved-oxygen index and dissolved-oxygen levels in the modern ocean. Geology 1994, 22, 719–722. [Google Scholar] [CrossRef]
- Kocan, R.M. Transmission models for the fish pathogen Ichthyophonus: synthesis of field observations and empirical studies. Can. J. Fish. Aquat. Sci. 2019, 76, 636–642. [Google Scholar] [CrossRef]
- Lafferty, K.D., Allesina. Parasites in food webs: the ultimate missing links. Ecol Lett, 2008; 11, 533–546. [Google Scholar] [CrossRef]
- Laufkötter, C., Zscheischler. High-impact marine heatwaves attributable to human-induced global warming. Science 2020, 369, 1621–1625. [Google Scholar] [CrossRef] [PubMed]
- Lauzon-Guay, J.-S., Scheibling. Modelling phase shifts in a rocky subtidal ecosystem. Marine Ecology Progress Series Lessios, H.A., 1988. MASS MORTALITY OF DIADEMA ANTILLARUM IN THE CARIBBEAN: What Have We Learned? Annual Review of Ecology and Systematics 19, 371–393. https://doi.org/10.1146/annurev.es.19.110188.002103. 2009, 375. [Google Scholar] [CrossRef]
- Liu, S., Zhang. Interdecadal variability in ecosystem health of Changjiang (Yangtze) River estuary using estuarine biotic integrity index. J. Ocean. Limnol. 2021; 39, 1417–1429. [Google Scholar] [CrossRef]
- Malhi, Y., Franklin. Climate change and ecosystems: threats, opportunities and solutions. Philosophical Transactions of the Royal Society B: Biological Sciences 2020, 375, 20190104. [Google Scholar] [CrossRef]
- Marcogliese, D. Implication of climate change for parasitism of animals in the aquatic environment. Canadian Journal of Zoology-revue Canadienne De Zoologie - CAN J ZOOL 2001, 79, 1331–1352. [Google Scholar] [CrossRef]
- Maynard, J., van Hooidonk. Improving marine disease surveillance through sea temperature monitoring, outlooks and projections. Philosophical Transactions of the Royal Society B: Biological Sciences 2016, 371, 20150208. [Google Scholar] [CrossRef] [PubMed]
- McLaughlin, J.P., Morton. Parasites in marine food webs. In Marine Disease Ecology; Behringer, D.C., Silliman, B.R., Lafferty, K.D., Eds.; Oxford University Press, 2020. [Google Scholar] [CrossRef]
- Moore, J.D., Robbins. Withering Syndrome in Farmed Red Abalone Haliotis rufescens: Thermal Induction and Association with a Gastrointestinal Rickettsiales-like Prokaryote. J Aquat Anim Health 2000, 12, 26–34. [Google Scholar] [CrossRef] [PubMed]
- NERRS, 2023. National Estuarine Research Reserve System [WWW Document]. URL. https://coast.noaa.gov/nerrs/. (accessed on 27 January 2023).
- NERRS, 2013. CLIMATE SENSITIVITY OF THE NATIONAL ESTUARINE RESEARCH RESERVE SYSTEM.
- NOAA, 2022. Estuaries Tutorial: NOAA’s National Ocean Service Education [WWW Document]. URL. Available online: https://oceanservice.noaa.gov/education/tutorialestuaries/est10monitor.html (accessed on 23 March 2023).
- NY Times, 2023. Rare Tornadoes Touch Down in Southern California - The New York Times [WWW Document]. URL. Available online: https://www.nytimes.com/2023/03/21/us/california-storm-evacuations-weather.html (accessed on 23 March 2023).
- Paerl, H.W., Valdes. Anthropogenic and climatic influences on the eutrophication of large estuarine ecosystems. Limnology and Oceanography 2006, 51, 448–462. [Google Scholar] [CrossRef]
- Potter, C., Harwood. Learning from history, predicting the future: the UK Dutch elm disease outbreak in relation to contemporary tree disease threats. Philos Trans R Soc Lond B Biol Sci 2011, 366, 1966–1974. [Google Scholar] [CrossRef] [PubMed]
- Powell, E., Klinck. The Potential for Oysters, Crassostrea Virginica, to Develop Resistance to Dermo Disease in the Field: Evaluation Using a Gene-Based Population Dynamics Model; CCPO Publications, 2011. [Google Scholar] [CrossRef]
- Rappazzo, B.H., Eisenlord. EeLISA: Combating Global Warming Through the Rapid Analysis of Eelgrass Wasting Disease. Proceedings of the AAAI Conference on Artificial Intelligence 2021, 35, 15156–15165. [Google Scholar] [CrossRef]
- Rice, K.C., Hong. Assessment of salinity intrusion in the James and Chickahominy Rivers as a result of simulated sea-level rise in Chesapeake Bay, East Coast, USA. Journal of Environmental Management 2012, 111, 61–69. [Google Scholar] [CrossRef]
- Short, F.T., Wyllie-Echeverria. Natural and human-induced disturbance of seagrasses. Sullivan, B.K., Sherman, T.D., Damare, V.S., Lilje, O., Gleason, F.H., 2013. Potential roles of Labyrinthula spp. in global seagrass population declines. Fungal Ecology 1995, 6, 328–338. [Google Scholar] [CrossRef]
- Sweet, M.J., Bateman. Diseases in marine invertebrates associated with mariculture and commercial fisheries. J Sea Res 2015, 104, 16–32. [Google Scholar] [CrossRef]
- Tallam, K., Liu. Identification of Snails and Schistosoma of Medical Importance via Convolutional Neural Networks: A Proof-of-Concept Application for Human Schistosomiasis. Frontiers in Public Health 2021, 9. [Google Scholar] [CrossRef]
- Tallam, K. , Quang, M.P., 2023. Applications of artificial intelligence in predicting dengue outbreaks in the face of climate change: a case study along coastal India. [CrossRef]
- Thompson, T.M., Batts. Emergence of Viral hemorrhagic septicemia virus in the North American Great Lakes region is associated with low viral genetic diversity. Dis Aquat Organ 2011, 96, 29–43. [Google Scholar] [CrossRef] [PubMed]
- Ward, J.R., Lafferty. The Elusive Baseline of Marine Disease: Are Diseases in Ocean Ecosystems Increasing? PLOS Biology 2004, 2, e120. [Google Scholar] [CrossRef] [PubMed]
- Wissler, L., Codoñer. Back to the sea twice: identifying candidate plant genes for molecular evolution to marine life. BMC Evol Biol 2011, 11, 8. [Google Scholar] [CrossRef] [PubMed]
- Wooldridge, T., Deyzel. Variability in estuarine water temperature gradients and influence on the distribution of zooplankton: A biogeographical perspective. African Journal of Marine Science 2012, 34, 465–477. [Google Scholar] [CrossRef]
Disclaimer/Publisher’s Note: The statements, opinions and data contained in all publications are solely those of the individual author(s) and contributor(s) and not of MDPI and/or the editor(s). MDPI and/or the editor(s) disclaim responsibility for any injury to people or property resulting from any ideas, methods, instructions or products referred to in the content. |
© 2023 by the authors. Licensee MDPI, Basel, Switzerland. This article is an open access article distributed under the terms and conditions of the Creative Commons Attribution (CC BY) license (http://creativecommons.org/licenses/by/4.0/).
Copyright: This open access article is published under a Creative Commons CC BY 4.0 license, which permit the free download, distribution, and reuse, provided that the author and preprint are cited in any reuse.
Submitted:
04 December 2023
Posted:
14 December 2023
You are already at the latest version
Alerts
This version is not peer-reviewed
Submitted:
04 December 2023
Posted:
14 December 2023
You are already at the latest version
Alerts
Abstract
Climate change is a global phenomenon that exerts significant impacts on ecosystems. Estuaries, as critical aquatic habitats, are susceptible to these changes; however, our comprehension of their specific responses to climate change remains limited. Beyond temperature rise and alterations in precipitation patterns, climate change induces indirect effects, influencing a multitude of biotic and abiotic variables within aquatic ecosystems. In this study, we assess seagrass health as an indicator of estuary well-being in three estuaries located in northern to central California, USA. Our investigation focuses on the marine angiosperm Zostera marina (commonly known as eelgrass) and its associated parasite, Labyrinthula zosterae. Z. marina, a temperate marine plant, faces the threat of eelgrass wasting disease (EWD) caused by the protist L. zosterae. Notably, this pathogen demonstrates sensitivity to warming ocean temperatures, underscoring the imperative to comprehend its impacts on host health amidst climate change. Our study assessed EWD prevalence with relation to spatial and temporal patterns, the relationship, if any, between disease prevalence and eelgrass percent cover, the spatial patterns, if any, of eelgrass percent cover, and what climatic variables were most strongly correlated with EWD and eelgrass percent cover.
Keywords:
Subject: Environmental and Earth Sciences - Environmental Science
1. Introduction
Marine ecosystems are essential to the health and functioning of our global environments, but many gaps remain in our understanding of the influence of climate and anthropogenic stressors on marine health [1] (Hoegh-Guldberg and Bruno, 2010; Lamb et al. 2017). Critically, studies from the last five to ten years have started to show changes, such as rapidly rising greenhouse gas concentrations, driving marine ecosystems towards conditions not seen for millions of years, with associated risks of foundational and sometimes irremediable marine ecosystem transformation (Malhi et al., 2020). Even by 2008, Halpern et al. noted that more than 40 percent of marine areas were being negatively affected by multiple pressures and that no area was unaffected by human influence (Halpern et al., 2008). The extent of human impacts on coastal zones in comparison to deep water regions has been higher, with climate change being one of the most significant pressures (Díaz, 2019).
Specific to global coastal and estuarine ecosystems, climate is also altering these sensitive environments with severe fluctuations from decadal averages (Colombano et al., 2021), directional changes of environmental variables (i.e., sea surface temperatures, pH levels, and rising sea levels) (Cabral et al., 2019), as well as less predictable oscillations (e.g., the Pacific and Atlantic decadal oscillations) and more extreme weather events such as coastal flooding and marine heatwaves (Babcock et al., 2019; Tallam and Quang, 2023). Shallow and intertidal coastal habitats including mangroves, wetlands, saltmarshes, tidal flats, and estuaries are particularly exposed to extreme weather events such as extreme heat or cold waves, and this has in turn begun to increase the thermal stress that many of these environments are facing globally (Malhi et al., 2020).
The effects of climate change are not limited to increasing temperature and changes in precipitation. Changes in our global climate have been documented in the literature since the 1900s, evidenced by sea level rise, receding glaciers, novel temperature changes, increased frequency and intensity of extreme weather events, and more (Hoegh-Guldberg and Bruno, 2010). This has also resulted in ongoing landscape-level events. Critically, these ongoing, and increasing, changes have begun to influence the delicate balance of the host-pathogen-environment triad (Behringer et al., 2020). For many critical marine species, a shift in their environments can increase their vulnerability to disease, as seen by diseases impacting ectothermic non-mobile marine invertebrates including corals, oysters, and abalone. Climate change can also affect the water quality of shallow and intertidal coastal habitats and influence host-pathogen interactions, but the effects of our changing climate on infectious diseases is not well understood (Burge et al., 2014).
Infectious diseases are critical drivers within terrestrial and marine ecosystems (Getz et al., 2019; El-Sayed and Kamel, 2020; Tallam et al., 2021). In fact, there are many examples of ecosystems on land being reshaped by large-scale outbreaks of infectious diseases, such as chestnut blight and Dutch elm disease (Potter et al., 2011). Diseases can also impact marine ecosystems by influencing abiotic factors such as hydrodynamics, as well as elements of community structure such as age distributions, biotic structure, and trophic interactions (Burge et al., 2014), such as with reef-building corals (Aronson and Precht, 2001), sea urchins (Lauzon-Guay et al., 2009), and oysters (Powell et al., 2011). Diseases in the ocean have traditionally been studied in the context of cultured and wild harvests of commercially critical species, including salmon (such as the Ichthyophonus infection in marine and anadromous fish (Kocan, 2019) and the infections that Pacific and Atlantic salmon underwent (Thompson et al., 2011)), the withering syndrome that abalone endured (Moore et al., 2000), and the protozoan infections of aquaculture crustaceans (Sweet and Bateman, 2015).
Interactions between pathogens, hosts, and their environments not only govern disease outbreaks but changes in these components can shift ecosystem balance away from or towards high-intensity disease states (Harvell et al., 2004; 2019). Climate change can alter the likelihood of disease outbreaks given that host-pathogen interactions are highly susceptible to environmental changes. Climate change has not only altered terrestrial disease risk and human disease risk, but is now beginning to affect marine disease risk (Burge et al., 2014). We are only beginning to understand how the effects of infectious diseases in oceanic and shallow and intertidal coastal habitats can affect host-pathogen relationships in marine environments, a missing link that will be very critical in informing conservation and management effects in a rapidly changing climate (He and Silliman, 2019; Tallam et al., 2021; Harvell and Lamb in Disease Ecology book).
Estuaries are complex, critical ecotones for coastal integrity (Liu et al., 2021). These biodiversity hotspots provide up to 28,916/ha) in innumerable ecosystem services (i.e., nutrient regulation, habitat provisioning, storm surge attenuation, etc.) that support human life near and far from the coast (Costanza et al., 2014; Bradley, 2017). Estuarine food webs are tightly linked to parasites as they are prey in over half of trophic interactions (Byers, 2020; Hechinger et al., 2011). Studying marine disease dynamics offer a unique opportunity to link functional and structural indicators of estuary health in the context of the influences of climate and anthropogenic stressors on estuaries. Research on the dynamics of marine disease spread in estuaries is lacking (McLaughlin et al., 2020).
Evident reductions in seagrass populations have been documented in historical records, with early records dating back to 1889 in Chesapeake Bay (Fig X). However, scientific documentation of severe, sudden, and catastrophic declines in seagrass beds along the North Atlantic coasts (North America and Europe) was not published until the early 1930s (Cotton, 1933, Cottam, 1933). These documented accounts represented the most significant decline in global seagrass populations observed up to that point (den Hartog, 1987). The loss of seagrass due to diseases and various environmental factors continues to be reported worldwide (Short and Wyllie-Echeverria, 1996, Orth et al., 2006). Long-standing suspicions among scientists investigating seagrass population declines have pointed towards species belonging to the Labyrinthula genus (Phylum: Labyrinthulomycota; protistan supergroup: Chromoalveolata) as potential causative agents responsible for the well-known ’wasting disease’ events of the 1930s. However, it wasn’t until the late 1980s that a definitive connection between Labyrinthula and the acute declines of seagrass along the western Atlantic Coast was established. In 1991, the specific species Labyrinthula zosterae was identified and confirmed as the causative agent of ’wasting disease’ in Zostera marina (Muehlstein et al., 1991).
Following this discovery, Vergeer and den Hartog (1993) successfully isolated Labyrinthula spp. from lesions found on the leaves of seagrass species representing ten different genera worldwide, including Zostera, Heterozostera, Posidonia, Halodule, Cymodocea, Syringodium, Thalassodendron, Ruppia, Thalassia, and Halophila. Interestingly, during their investigations, they noted that the rapidly expanding brown-black lesions associated with the disease, as described by Muehlstein et al. in 1991, were not always observable in hosts from which Labyrinthula had been isolated. This finding suggests that the presence of the pathogen does not necessarily lead to disease manifestation in all cases of infection. Research conducted by Bockelmann et al. (2013), utilizing quantitative PCR to analyze the prevalence of L. zosterae in Z. marina beds in northern Europe, confirmed these observations. They discovered that L. zosterae was present in up to 89 percent of the tested beds, with significant seasonal and spatial variations. This investigation led them to speculate that L. zosterae likely persists in a chronic reservoir, with the highest prevalence occurring during the summer.
Scientific investigations have provided substantial evidence linking Labyrinthula, particularly L. zosterae, to the occurrence of ’wasting disease’ in seagrass, specifically Z. marina. However, the presence of the pathogen does not consistently result in visible disease symptoms, indicating the involvement of other factors in disease development. Ongoing studies aim to enhance our understanding of L. zosterae’s prevalence and dynamics within seagrass beds, ultimately aiming to develop effective management strategies to mitigate the impact of ’wasting disease’ on seagrass populations.
Our study examines the correlation between seagrass health and estuary health in three significant estuaries spanning from northern to central California. In particular, we focus on the eelgrass species (Zostera marina) and its parasite, Labyrinthula zosterae. The eelgrass is a temperate species that faces threats from eelgrass wasting disease (EWD), which is caused by the protist L. zosterae. Given the sensitivity of the pathogen to warming ocean temperatures, it is crucial to gain a better understanding of its impact on the health of the host species under climate change conditions and a useful sentinel integrating physical and biological change. Our investigation is carried out within the context of existing marine ecoregions worldwide. We specifically concentrate on estuaries located within the National Estuarine Research Reserve System (NERRS) in California. NERRS, a collaboration between the National Oceanic and Atmospheric Administration (NOAA) and the coastal regions of the United States, was established through the Coastal Zone Management Act. Encompassing approximately 1.4 million acres of estuaries, NERRS represents a significant portion of the global seagrass diversity, hosting around 10 out of the known 70 seagrass species (approximately 14 percent of the world’s seagrass species).
The choice to focus on these regions is driven by several factors. Firstly, it is a responsible decision in terms of scale, allowing us to effectively assess the research objectives. Secondly, NERRS sites provide ideal test beds for addressing our research questions, as they facilitate multi-faceted research projects. By studying these specific estuaries, we aim to gain valuable insights into the relationship between L. zosterae and the health of the estuaries, contributing to our understanding of the broader impacts of climate change on these critical ecosystems.
2. Materials and Methods
2.1. Field sites
Our study was conducted at three specific field sites in northern to central California: Drakes Estero (38.047° N, 122.942° W), Elkhorn Slough (36.8058° N, 121.7902° W), and Morro Bay estuary (35.3643° N, 120.8529° W) (see Figure XX). The dataset we analyzed spans three consecutive field seasons, encompassing the winter and summer of 2021 into 2022, as well as the winter and summer of 2022 into 2023. In each estuary, we established four sites following the protocol outlined by Groner et al. in 2021 and the estuary bounds defined by MacCready in 2021. At each site, we laid out and marked triplicates of 10-meter transects (yellow flags attached to rebar), which were designed for future reference. Along each transect, we collected 20-25 randomized blades with a randomization protocol (Groner et al. 2021), resulting in a total of approximately 2,000 eelgrass blades that were collected, processed, and analyzed for this study. To define an eelgrass meadow, we applied a criterion of a minimum of 3 shoots per 0.25 m² (1/4 square meter) within a 1-meter radius of any adjacent shoots, as recommended by the US Army Corps of Engineers in 2016. At each site, we laid out and marked three 10-meter transects for future reference, with GPS points denoted. Eelgrass samples were collected by hand at 2-meter intervals along three parallel 10-meter transects positioned in the intertidal region, aligned with the shoreline.
2.2. Verification of pathogen presence
Quantitative Polymerase Chain Reaction (qPCR) analysis was historically performed (in 2018 for Drakes Estero and Morro Bay and 2019 for Elkhorn Slough) at each site to confirm the presence of Labyrinthula zosterae DNA in tissue samples exhibiting visual symptoms associated with eelgrass wasting disease.
2.3. Definition of disease prevalence and severity
In the context of meadows and transects, disease prevalence was quantified as the ratio of visually observed diseased leaves to the total number of leaves sampled (Aoki et al., 2022). On an individual leaf level, disease prevalence was determined based on the presence or absence of lesions, assessed through visual examination. To evaluate disease severity, we employed a machine learning imaging model to measure the lesion area and total leaf area (Tallam et al. 2023). Disease severity was then calculated as the proportion of leaf area covered by lesions.
2.4. Percent Cover
At each quadrat sample location, the abundance of native eelgrass (Zostera marina) shoots was recorded as shoot density within a 0.25 m2 quadrat. To facilitate comparison, shoot density values were converted to the number of shoots per square meter. All other forms of vegetation, such as macroalgae, were categorized as "Other." Percent cover was assessed using categorical measures: absence or 0 percent cover, 1-10 percent cover, 11-25 percent cover, 26-50 percent cover, and greater than 50 percent cover. These percent cover categories were recorded instead of shoot density for each quadrat sample (Lefcheck et al., 2022). A total of 36 samples were collected per site within both the eelgrass and macroalgae zones, for each season. This resulted in 108 percent cover data points per site and a total of 324 data points for overall percent cover assessment.
2.5. Climatic parameters
Salinity, pH, alkalinity, sea surface temperature (SST), dissolved oxygen (DO) levels, and ambient temperature data were obtained from reputable sources. Salinity, pH, alkalinity data were acquired from the National Oceanic and Atmospheric Administration (NOAA) website specifically the Elkhorn Slough page (https://coast.noaa.gov/nerrs/reserves/elkhorn-slough.html). Sea surface temperature (SST) data was obtained from Tides4Fishing website, specifically the Elkhorn Slough location (https://tides4fishing.com/us/california/elkhorn-slough-at-elkhorn/forecast/water-temperature). Ambient temperature data was sourced from US Harbors, specifically the Elkhorn Slough weather page (https://www.usharbors.com/harbor/california/elkhorn-slough-at-elkhorn-ca/weather/). To ensure consistent analysis, all the gathered data for these parameters were downsampled to weekly intervals.
2.6. Lab processing and machine learning
Leaf blades underwent laboratory processing following a detailed protocol (see Figure XX), which was developed based on a modified version of the protocol used in the US National Science Foundation wasting disease surveys by Morgan Eisenlord and Colleen Burge (cite Aoki et al in Limnol and Oceanogr for most recent methods). The protocol was simplified and modified to streamline the processing procedures . In the lab, the blades were cleaned, measured, and placed on acetate paper in preparation for scanning using a machine learning algorithm. The acetate paper blades were then subjected to a binary pixel-based machine learning classification algorithm, specifically designed by the author , to efficiently classify each pixel on the blade image as either diseased or non-diseased. The algorithm rapidly determined the disease status of the pixels, and the resulting percentages were aggregated to quantify disease severity. These methods are well-established and will be replicated at the other two study sites. Each sampling period required approximately 1-2 days, while the processing period lasted around 1-3 days. The timing of the sampling was carefully considered, taking into account the seasonality of disease prevalence. All sampling occurred between the Fall/Winter and Spring/Summer months of 2022 and 2023.
2.7. Data Analyses
Statistical tests were conducted at a significance level of 0.05 ( = 0.05) with 95 percent confidence intervals, assuming data followed a normal distribution based on Kolmogorov-Smirnov and Shapiro-Wilk normality tests, unless otherwise specified. Google Colaboratory and Python 3.10 were used for all statistical computations, unless otherwise mentioned.
3. Results
3.1. Linear Mixed Effects Model
Initially, a linear mixed effects model was applied to all variables to investigate their significance in the final disease model. This analysis utilized a dataset comprising 187 observations. The results indicated that the effects of alkalinity and dissolved oxygen (DO) levels were > 0.05 in terms of both fixed effects values and confidence intervals. These variables were subsequently excluded from further analyses. Subsequently, the effects of season, ambient temperature, pH, and sea surface temperature (SST) were examined with separate linear models predicting disease severity. While these factors appeared to have notable effects, the confidence intervals associated with their relationship with disease and severity were wide (p > 0.05). This observation also applied to the relationship between season and disease severity. Therefore, it was determined that additional analyses would be necessary to gain a better understanding of the relationships between these variables and disease dynamics. Conversely, the effects of upper or lower transects, individual sub-transects (), percent cover, and year demonstrated stronger effects and narrower confidence intervals. On average, these variables exerted a substantial influence on disease and severity. However, further investigation is required to ascertain the precise strength and direction of these relationships. As for the linear mixed effects model, the following was the final “best fit model” for our purposes (Figure 1). However, the strength and direction of the relationships had to be explored further and so we developed a structural equation model (SEM) to further interrogate these relationships (Figure 8) (Pourtois, Tallam, et al. 2023).
Figure 1.
3.2. Prevalence and Severity Data: spatial relationships
Observing disease prevalence data as a function of the spatial gradient of each estuary (from mouth to watershed) over time [Figure 2A; 2B; 2C], we observed that over the course of each season of data (Spring/Summer 2022, Fall/Winter 2022, and Spring/Summer 2023), both Drakes Estero (de) and Elkhorn Slough (es) showed consistency in decreasing linear trends of EWD disease prevalence from estuary mouth to watershed, overall [Figure 1A;1B]. Morro Bay (mb) either demonstrated increasing trends of disease over this spatial gradient or a relatively consistent disease prevalence over this spatial gradient (z-test, p < 0.05) [Figure 1C].
EWD prevalence decreased from estuary mouth to watershed in Drakes Estero adn Elkhorn Slough in all seasons. EWD prevalence either increased or was unchanged over teh same gradient in Morro Bay.
Figure 2.
More specifically, in Morro Bay disease prevalence decreased from sub-transects four through nine, which represent the middle to tail end (watershed) of the sampled portion of the estuary, for both Spring/Summer of 2022 and of 2023 (p < 0.05). From our lab processing and subsequent machine learning algorithms, we validated this trend.
Figure 3.
To further assess the distribution of our dataset, we compared between both upper and lower estuary spatial gradients at each site, as well as comparatively across the three sites, we can visualize the symmetry, skew, variance, and outliers in our dataset overall [Figure 2A; 2B; 2C]. We notice Drakes Estero EWD disease prevalence over the three field seasons combined, still showing significant differences in overall estuary disease prevalence with upper estuary demonstrating significantly more overall disease prevalence than the lower estuary [Figure 2A] (p < 0.05), with one exception in the lower estuary (which was in Spring 2023, sub-transect six, and interestingly, after the atmospheric rivers took place in California). We see a spike in disease prevalence two weeks after the atmospheric rivers and then disease prevalence starts to drop a little, albeit ending at a count higher than that of the mouth of the estuary (13 vs. 53 percent prevalence over the Drakes Estero estuary gradient in Spring 2023, validated by our machine learning models and ground-truth data). We measured the strength of this outlier by performing statistics on the interquartile range (IQR) and found that it was indeed a strong outlier. For Elkhorn Slough EWD disease prevalence over the three field seasons, we observe that when the data is looked at overall and not as a factor of time, there was overall more disease prevalence in the lower estuary than that of the upper estuary [Figure 2B]. The distinction is minimal (63 vs. 70 percent prevalence averages overall, p > 0.05) but remains a notable point, nonetheless. Finally, Morro Bay showed significantly higher overall disease prevalence in the upper estuary than in the lower estuary [Figure 2C], which is a slightly trend different than the impression received from Figure 1. When looking closer, we observe that Morro Bay showed a greater range of disease prevalence values, and a similar average disease prevalence compared to its lower estuary (60 vs. 53 percent prevalence averages overall, p > 0.05).
Figure 4.
Given the observations from the dataset as a function of individual estuary gradient disease prevalence, overall disease prevalence over the three seasons and over time, and disease prevalence in comparison to the other two sites, we considered another measure, percent cover per quadrat, also called “percent cover” for the purposes of our analyses (Section 3.3) [Figure 4A; 4B; 4C]. The purpose of this portion of the study was to understand any relationship, if a meaningful relationship does exist, between disease prevalence and greenness index. We plotted disease prevalence and the Z. marina greenness index, after standardizing data values, as percentages against each other across the spatial gradient of each individual estuary with data from all three seasons combined. In Drakes Estero, we observe disease prevalence starting very high (about 93 percent prevalence) and ending at about 52 percent prevalence. Relative to this, we observe about a 75 to 80 percent greenness index throughout the estuary, overall [Figure 3A]. We notice a similar trend with Morro Bay [Figure 3C]. With Elkhorn Slough however, we observe a similar trajectory between disease prevalence and greenness index [Figure 3B]. These results led us to ask the question of whether seasonality played a role in this relationship (or lack thereof).
Figure 5.
Observing disease prevalence vs. greenness index as a function of individual sites between Spring/Summer and Fall/Winter seasons, we break down scatter plots of this data as means of each sub-transect value. We see similar trends of disease prevalence vs. greenness index for Spring/Summer and Fall/Winter seasons for nearly all three sites [Figure 5A; 5B; 5C]. This trend was curious given some of our other results, so we plotted each individual transect and season against itself as a function of the spatial gradient within the estuary (i.e., upper vs. lower transect) [Figure 6].
In contrast to the significant links between extreme weather events and water temperatures and EWD, we found insignificant associations between absolute temperature metrics for both Spring/Summer and Fall/Winter seasons. Instead, we found much stronger correlations between disease prevalence and greenness index, with increasing greenness indices correlated with increased disease prevalence at the mouth of all three estuaries across all sampled seasons (p < 0.05, R2 = 0.76). Lastly, we observed the spatial gradients within estuaries against the latitudinal trend across sites. EWD prevalence and severity varied substantially without any strong latitudinal trend across northern to southern California (p > 0.05). Between sites, prevalence was overall highest in Drakes Estero, by an average 3.5 percent higher than both Elkhorn Slough and Morro Bay with overall EWD prevalence of 0.592, 0.567, and 0.546 percent respectively.
Figure 6.
In Figure 6, we note that even when observing each individual sampling season, for each site, as a function of lower vs. upper estuary disease prevalence and greenness index, we observe that Elkhorn Slough and Morro Bay show consistently similar trends of disease prevalence vs. greenness (i.e., where prevalence is high (above 60 percent), we notice that greenness indices are also above 60 percent), across all sampling periods of Spring/Summer and Fall/Winter seasons. Drakes Estero shows the opposite trend: where greenness index is high, disease prevalence is low and vice versa (p < 0.05). Morro Bay shows an exception during the Winter of 2022, where we see a trend similar to that of Drakes Estero: where greenness index is high, disease prevalence is low and vice versa.
Figure 7.
When plotted as overall estuary averages in a bar plot [Figure 6], not distinguished between upper and lower estuary, but as a function of the two distinct seasons, we observe that disease prevalence is high where greenness index is high (above 60 percent) across all sites (p < 0.05, SD = 73 percent within 1 SD).
Figure 8.
We trained several times until we ended up with our best model. Calculating the Mean Squared Error (MSE) of our actual vs. our predicted data on our best model, this resulted in an MSE of 0.026 and a correlation coefficient of 89 percent during training.
3.3. Structural Equation Model
To explore the potential relationships between predictor variables and their role in influencing eelgrass wasting disease incidence and severity, we developed the semPy package in Python. This package allowed us to account for indirect pathways and interrelationships among the explanatory variables. The approach was adapted from Pourtois, Tallam, et al. (2023). The structural equation modeling (SEM) analysis was conducted using aggregated data across multiple years, with temporal means calculated for each site. The selection of variables included in the SEM model was based on the direct paths identified in our previous Linear Mixed Effects Model analysis. SEM is a powerful statistical technique widely used in quantitative and social sciences to investigate complex relationships among variables. It allows researchers to examine the direct and indirect effects of variables on an outcome of interest, while simultaneously accounting for measurement error and interrelationships among multiple constructs. By incorporating both observed and latent variables, SEM provides a comprehensive framework for testing and refining theoretical models. Through the estimation of path coefficients, model fit indices, and overall model evaluation, SEM enables researchers to gain insights into the underlying mechanisms and causal relationships within a given system, offering a robust approach for hypothesis testing and theory development. Our hypotheses were formulated based on the variables available in our dataset and the causal relationships that could be investigated considering the spatial and temporal resolution of the data. For instance, causal relationships between transect ID and season could not be tested due to the collection of incidence and severity data at a single time point.
Figure 9.
It is important to emphasize that while the SEM analysis provided complementary insights to the Linear Mixed Effects Model, our study did not aim to explicitly integrate these two models within a unified statistical framework.
4. Discussion
4.1. Estuaries hold crucial significance and face imminent threats
Estuaries are globally recognized as highly productive ecosystems, serving essential ecological and economic roles, including safeguarding shorelines, acting as vital nurseries for commercially valuable fish species, providing breeding sites, and supporting human recreational activities (Feebarani et al., 2016). Nevertheless, estuaries are currently encountering mounting pressures due to human activities, including nutrient overloads that lead to eutrophication, and the discharge of pollutants from aquaculture, agriculture, and industrial sources (Paerl et al., 2006), alongside other stressors. Additionally, they are increasingly exposed to climate-related challenges, such as extreme weather events that cause excessive nutrient enrichment during seawater exchange (Short and Wyllie-Echeverria, 1995).
4.2. Disease-induced modifications to marine ecosystems disrupt their structure and function
Outbreaks of diseases have a direct impact on the composition and operation of marine ecosystems, with notable consequences for plants, invertebrates, and vertebrates (Ward and Lafferty, 2004). Despite previous speculations on the significance of marine diseases and their potential rise, the scarcity of foundational data in many communities, particularly in plant populations, has hindered direct testing of this hypothesis (Tallam and White Jr., 2023).
4.3. Ecological repercussions of marine diseases caused by human-induced and climate-related pressures
Marine organisms can harbor a wide range of parasites and pathogens (Marcogliese, 2001; Lafferty et al., 2008). Significantly, large-scale outbreaks and subsequent mortalities not only impact host populations but also trigger cascading effects throughout entire ecosystems. For example, the disappearance of vital seagrass meadows, which play a crucial ecological role, can lead to trophic disruptions and alter community structure by eliminating top-level consumers (Lessios, 1988). Consequently, comprehending the impact of diseases and the timing of outbreaks on marine environments is becoming increasingly crucial, given the escalating human-induced and climate-related stresses affecting these ecosystems.
4.4. Insufficient understanding of host-parasite interactions hinders addressing climate change impacts on marine and estuarine invertebrates
The existing knowledge on host-parasite interactions falls short when it comes to addressing the effects of anthropogenic activities and climate change on marine and estuarine ecosystems. Therefore, our primary focus was to enhance our understanding of how diseases shape keystone populations and how these populations respond in the face of disease, particularly in spatially sensitive environments like estuaries. We believe that only by unraveling these mechanisms can we begin to explore more specific inquiries regarding the influences of anthropogenic and climate-related stressors. Consequently, our research aimed to examine the health of eelgrass (Zostera marina), a vital estuarine plant species and ecosystem engineer, and its protist parasite, Labyrinthula zosterae, which poses a threat to Z. marina through eelgrass wasting disease (EWD). By studying the relationship between L. zosterae and the health of three significant estuaries within the California coastline National Estuarine Research Reserve System (NERRS), we sought to gain insights into one critical instance of disease impacts on host health.
4.5. Discussion of Results
To address ecological inquiries and enhance our understanding of eelgrass wasting disease, we employed both ecological investigations and advanced technological tools. Through rapid and standardized surveys, we were able to quantify the occurrence of eelgrass wasting disease at an unprecedented scale across three locations spanning from northern to southern California. Additionally, we refined the quantitative narrative surrounding the correlation between disease prevalence, estuaries, and eelgrass meadows across different latitudes and within individual estuaries.
4.6. Summary of Models and Analyses
We conducted a series of models and analyses to investigate the dynamics of eelgrass wasting disease. Our sampling efforts focused on three key estuaries within the National Estuarine Research Reserve System (NERRS), consisting of four sub-transects. Over the course of three seasons, we collected data on disease prevalence and native eelgrass shoot density using percentage cover in quadrats, which we referred to as the "greenness index."
Specifically, our models and analyses included:
- -
- Assessing disease prevalence as a function of the spatial gradient within each estuary over time, considering approximately 2,000 seagrass blades and around 300 quadrat samples.
- -
- Comparing disease prevalence between the upper and lower estuary spatial gradients at each site.
- -
- Investigating the relationship between disease prevalence and percent cover (greenness index).
- -
- Analyzing disease prevalence and greenness index variations between the Spring/Summer and Fall/Winter seasons, examining individual sites.
- -
- Assessing disease prevalence and greenness index within each sub-transect and for each sampling season.
- -
- Investigating disease prevalence and greenness index variations between the lower and upper estuary, as well as between distinct seasons.
- -
- Utilizing preliminary machine learning models on our data to predict disease prevalence vs. greenness index for the next five years (2024 to 2029), obtaining validation metrics such as mean squared error (MSE) and correlation coefficient.
These comprehensive models and analyses allowed us to gain insights into the relationships and patterns between disease prevalence, eelgrass shoot density, and estuary dynamics, enabling us to make predictions for future disease trends.
4.7. Connecting the dots: Insights from the study on eelgrass wasting disease in estuaries
The study aimed to shed light on the understudied influence of spatial gradients on estuarine ecosystems, particularly when faced with the combined challenges of the climate crisis and disease. The primary focus was to investigate the prevalence of eelgrass wasting disease (EWD) across multiple estuaries and its relationship with the spatial gradient and eelgrass abundance.
One of the key motivations for the research was to explore how EWD manifests differently in estuaries compared to marine or freshwater systems. Eelgrasses, being a paraphyletic group of marine angiosperms, have a unique evolutionary history, and most EWD studies have been conducted in marine waters, leaving transitional ecosystems like estuaries less understood in this context.
We hypothesized that EWD might be more prevalent closer to the watershed due to potential influences from activities like dairy farming, low water circulation, and increased hypoxia. Therefore, they expected that eelgrass meadows near the mouth of estuaries would have lower EWD prevalence compared to those closer to the watershed. Additionally, they hypothesized an inverse correlation between EWD prevalence and the greenness index based on the theory of density dependence.
The results provided several interesting findings: - Disease Prevalence and Spatial Gradient: Overall, the study revealed a significant trend of declining disease prevalence from the mouth to the watershed in Drakes Estero and Elkhorn Slough. However, Morro Bay showed an increase in disease prevalence from the middle to the tail end of the estuary. This contrasted with the initial hypothesis. - Disease Prevalence and Percent Cover: Initially, when disease prevalence was analyzed independently from the greenness index, there seemed to be little correlation. However, when considering the data seasonally, a significant correlation between disease prevalence and greenness index was observed. - Upper vs. Lower Estuary Trends: Analyzing trends for each sub-transect, the researchers found consistent positive correlation between disease prevalence and greenness index in Elkhorn Slough and Morro Bay across most sub-transects and seasons. Higher disease prevalence (above 60 percent) corresponded to higher greenness indices. In contrast, Drakes Estero showed two statistically significant trends: an inverse correlation in the lower estuary, where high disease prevalence (above 80 percent) corresponded to low greenness indices (below 60 percent), and a positive correlation in the upper estuary, where high disease prevalence aligned with high greenness indices.
The study’s findings challenge some initial assumptions about the relationship between EWD prevalence and spatial gradients within estuaries. The correlation between disease prevalence and greenness index, particularly when considered seasonally, suggests a more complex interaction between EWD and ecosystem dynamics.
These insights will pave the way for future research in understanding the intricate connections between disease dynamics, spatial gradients, and other climate change and anthropogenic stressors within estuaries. Additionally, the findings raise questions about the potential impact of EWD in transitional ecosystems and its implications for the health and resilience of estuarine environments.
4.8. Disease prevalence gradient from estuary mouth to watershed
The study revealed that disease prevalence is generally higher at the mouth of all three studied estuaries compared to the areas closer to the watershed. Several factors contribute to the higher disease prevalence observed at the estuary mouths, which warrant further investigation through observational and experimental studies.
In all three estuaries, mouth regions exhibit distinct characteristics that may influence disease dynamics. These factors include greater water flow, reduced potential for hypoxia (low oxygen conditions), increased flushing of water, higher bird species richness (especially gulls and terns), elevated salinity levels influenced by oceanic inputs, larger sediment grain sizes, dynamic sediment budgets, and closer proximity to marine biota that may inhabit, breed within, or consume eelgrass during high tide events. Additionally, there is a possibility that other plant species could act as disease reservoirs within these areas.
Grazing animals, which are more abundant near the estuary mouth, may also play a role in disease prevalence. Their grazing activities can remove decaying eelgrass, potentially affecting the abundance of infected tissue samples collected and observed in the study.
It is important to note that salinity levels typically exhibit a gradient within temperate estuaries, with higher salinity near the mouth where ocean water enters and lower salinity upstream where freshwater inflows occur (Rice et al., 2012).
Overall, these findings highlight the need for further research to understand the specific mechanisms driving the higher disease prevalence observed at the estuary mouths. Investigating the interactions between environmental factors, grazing dynamics, and the presence of potential disease reservoirs will contribute to a more comprehensive understanding of disease dynamics in estuarine ecosystems.
4.9. Influence of temperature and dissolved oxygen levels
In line with another study investigating the relationship between eelgrass wasting disease (EWD), greenness index, and estuarine spatial gradients in the context of future climate change, we found that Labyrinthula zosterae, the pathogen causing EWD, appears to be influenced by temperature sensitivity. Across the three studied estuaries, a distinct horizontal temperature gradient was observed, with the upper reaches consistently exhibiting warmer temperatures compared to the lower estuary. Similar temperature patterns have been documented in other studies (Wooldridge and Deyzel, 2012). Thus, one possible reason for higher EWD prevalence closer to the mouth of the estuaries, compared to the watershed, could be the presence of warmer temperatures in those regions. To examine this further, we collected temperature data from the National Estuarine Research Reserve System (NERRS) and conducted an analysis, which revealed a statistically significant correlation between disease prevalence and estuary water temperature (°C) (p < 0.05).
Dissolved oxygen (DO) levels in estuaries are also influenced by water temperature (Kaiho, 1994). Higher water temperatures result in decreased oxygen solubility in the water. Therefore, as estuary water temperature increases, the capacity of the water to hold dissolved oxygen decreases. Dissolved oxygen is crucial for the survival of eelgrass meadows in the water, and thus, as the estuary warms, lower levels of dissolved oxygen can potentially impact the health of eelgrass and contribute to the occurrence of EWD.
These findings highlight the importance of considering temperature and dissolved oxygen levels in understanding the dynamics of EWD and its relationship with climate change in estuarine ecosystems. The warming of estuaries can have implications for both pathogen prevalence and eelgrass health, emphasizing the need for continued monitoring and research in this area.
Extreme weather events, such as severe storms, have been observed to correlate with the prevalence of eelgrass wasting disease (EWD) in estuaries. In the Spring/Summer season of 2023, California experienced a series of atmospheric storms, resulting in an unusually high amount of rainfall and significant impacts across the state. During this period, all three studied estuaries showed a statistically significant increase in EWD prevalence compared to the previous year. This finding suggests a potential link between extreme weather events and the occurrence of EWD.
4.10. Future Work
To further investigate this relationship, future studies could analyze multiple years of data and develop machine learning models to assess the correlation between extreme weather events and EWD over several decades. This would provide a more comprehensive understanding of the impact of such events on EWD prevalence. Additionally, as projected by the Pacific Northwest National Laboratory, the intensity of winter storms in the Western U.S. is expected to increase, emphasizing the need for regional storm-resolving simulations to assess the impacts on estuaries (Chen et al., 2023).
The sensitivity of estuarine ecosystems to climate change was also examined through the analysis of biophysical water conditions and their connection to climate variables. By comparing NERR scientific studies with the EWD study, correlations were observed between atmospheric storms and EWD prevalence in the estuaries. Overall, there was an increase in EWD prevalence, with more significant increases near the mouths of estuaries, particularly in Drakes Estero, which is the most isolated estuary.
Based on these findings, it can be concluded that all studied NERR reserves will be impacted by climate change to some degree. Biophysical sensitivity, as assessed through various climate indicators, was found to be of highest concern in isolated reserves. Each reserve will need to determine its specific vulnerabilities and management objectives in relation to climate change. It is important for reserves to consider the spatial gradient of estuaries and conduct reserve-specific analyses to better understand the patterns observed in the study, such as the higher prevalence of EWD near the mouth of estuaries compared to the watershed.
Overall, these results highlight the significance of extreme weather events and climate change in influencing the dynamics of EWD in estuarine ecosystems. Understanding these relationships is crucial for effective natural resource management and developing strategies to mitigate the impacts of climate change on estuarine health.
The analysis of disease prevalence and percent cover revealed a positive correlation between the two variables. Shoot density showed a consistent positive correlation with disease prevalence, which aligns with findings from another study on the same topic (Aoki et al., 2022). Furthermore, leaf area was identified as a significant predictor of meadow-wide disease prevalence, explaining 46 percent of the variation. In terms of the upper and lower estuary comparison, leaf area was an even stronger predictor, explaining approximately 67 percent of the variation, with the upper estuary showing higher EWD prevalence than the lower estuary at all three study sites.
While there were insignificant associations between absolute temperature metrics for the Spring/Summer and Fall/Winter seasons and EWD prevalence, stronger correlations were observed between disease prevalence and the percent cover. Increasing percent cover was found to be correlated with higher disease prevalence at the mouth of all three estuaries across all sampled seasons. In fact, the percent cover in the leaf-level model of lesion area had the largest standardized effect size on disease prevalence compared to other observed metrics. The increase in shoot density likely contributes to the higher prevalence of EWD due to the greater potential for direct transmission of the pathogen through contact with diseased eelgrass tissue (Groner et al., 2016). These plant traits, such as shoot density and leaf area, were found to be more significant in understanding the patterns of EWD at smaller spatial scales. Notably, similar findings have been reported in another survey conducted on this research question (Aoki et al., 2022).
This study demonstrates that the spatial gradient of an estuary shows a stronger correlation with eelgrass wasting disease (EWD) compared to factors like seasonality or the passage of years. Interestingly, there was no significant variation observed along the latitudinal gradient, but variations were evident within specific regions, particularly in the upper and lower estuaries, as indicated by the prevalence of EWD.
Ecosystem-scale environmental conditions play a significant role in influencing eelgrass wasting disease. Abiotic factors such as light, turbidity, and salinity may have synergistic effects on EWD, as shown in previous laboratory studies (Brakel et al., 2019; Jakobsson-Thor et al., 2020). Additionally, factors like pathogen virulence, water quality, and nutrient availability, which were not addressed in our study, could also interact with EWD, greenness indices, and rising temperatures. Further research is needed, including long-term monitoring, to collect specific and targeted data on the sensitivity of L. zosterae to various climatic, landscape, environmental, biological, and anthropogenic stressors, and to develop rapid and scalable forecasting tools and targeted management measures. Surveillance of EWD at relevant spatial and temporal scales is crucial for understanding its behavior and for mitigating and managing future EWD pandemics.
As ocean temperatures continue to rise, it becomes essential to improve our understanding of spatial and temporal relationships between diseases to develop forecasting tools aligned with conservation and management efforts (Maynard et al., 2016). By documenting correlations between warmer waters, climatic anomalies (e.g., extreme weather events), and disease metrics across a broader range of estuaries and geographic locations, we can enhance our understanding of what EWD is most sensitive to. Our study has identified the most influential parameters affecting EWD, including temperature, severity, latitudinal gradients, upper and lower estuary spatial gradients, and the greenness index. This information can guide future efforts in predicting and preventing disease outbreaks and pandemics. Other metrics that incorporate water quality, anthropogenic stressors, and temperature exposure over time can also help us understand EWD’s behavior in the face of ocean acidification (Gimenez et al., 2018).
5. Conclusions
Currently, no interventions exist for treating, managing, or preventing EWD due to limited research on this marine epidemic. Therefore, tracking and measuring outbreaks are crucial steps towards better understanding the impending decline of eelgrass meadows (Aoki et al., 2022; Tallam et al., 2023; Tallam and White 2023; Tallam and Malkovskiy 2023). Identification tools can benefit seagrass meadows with high disease prevalence or severity, informing management actions to improve water quality, reduce human impacts, and manage boat anchoring to enhance the resilience and persistence of seagrasses in the face of existing climate and anthropogenic stressors (Darling et al., 2019; Rappazzo et al., 2021).
Anthropogenic climate change, with its increasing sea surface temperature anomalies, poses a significant threat to estuaries and seagrass meadows across California and the west coast (Duarte and Krause-Jensen, 2017; Aoki et al., 2022). Even small-scale, localized warming can elevate disease risk for eelgrass populations across their entire range, not just for edge-range populations. Surprisingly, currently healthy seagrass meadows, characterized by high greenness indices and robust individual blades, are at higher risk of acquiring and spreading EWD, increasing the potential for future outbreaks.
The National Estuarine Research Reserve System (NERRS) is uniquely positioned to assess climate impacts on estuaries in the United States. With its diverse range of managed coastal ecosystems representing various biogeographic regions and estuary types, NERRS is exposed to different gradients of anthropogenic and climate-related stressors. The integrated research and training programs conducted by NERRS are crucial for empowering communities to address natural resource management issues, including the study of estuary health (Tallam and Wyllie-Echeverria, 2023).
In addition to our findings, the ability to rapidly detect disease signs and characterize disease-estuary relationships is a significant advancement. This understanding is vital for comprehending, tracking, predicting, and preventing marine disease pandemics under anthropogenic climate change. As the risk of disease outbreaks increases with warming, the development of tools for disease surveillance and forecasting at specific and broad geographic scales is essential for monitoring the health of estuarine and coastal ecosystems and supporting the diverse organisms and communities that depend on them (Tallam et al., 2023; Tallam and Wyllie-Echeverria, 2023).
Author Contributions
Conceptualization, KT; Methodology, KT; Formal analyses, KT; Writing-original draft preparation, KT; Writing-all other drafts, KT; Writing-review and editing, KT
Funding
This research received no external funding.
Data Availability Statement
The datasets used in this study are available upon reasonable request.
Acknowledgments
We would like to thank Dr. Barnabas Daru, Dr. Elliott White Jr. and Dr. Sandy Wyllie-Echeverria for their support in reviewing this manuscript. Thanks to Dr. Peay for helping the lead-author put the final touches on this manuscript. We would also like to thank the insights we received from the National Estuarian Research Reserve and the National Parks Service with regards to estuary management and diseases along United States coastlines. We would also like to thank the National Estuarian Research Reserve System for the incredible diversity of work laid out in order for us to even consider taking on such a study.
Conflicts of Interest
The authors declare no conflict of interest.
References
- Aoki, L.R., Rappazzo. Disease surveillance by artificial intelligence links eelgrass wasting disease to ocean warming across latitudes. Limnology and Oceanography 2022, 67, 1577–1589. [Google Scholar] [CrossRef]
- Aronson, R.B., Precht. White-band disease and the changing face of Caribbean coral reefs. Hydrobiologia 2001, 460, 25–38. [Google Scholar] [CrossRef]
- Babcock, R.C., Bustamante. Severe Continental-Scale Impacts of Climate Change Are Happening Now: Extreme Climate Events Impact Marine Habitat Forming Communities Along 45 percent of Australia’s Coast. Frontiers in Marine Science 6.
- Bartoloni, S.E., Walter. Spatial distribution of seawater carbonate chemistry and hydrodynamic controls in a low-inflow estuary. Estuarine, Coastal and Shelf Science 2023, 281, 108195. [Google Scholar] [CrossRef]
- Behringer, D.C., Lafferty. Marine Disease Ecology, Oxford University Press, 2020.
- Bradley, M. Hidden Components in Tropical Seascapes: Deep-Estuary Habitats Support Unique Fish Assemblages | SpringerLink [WWW Document]. URL. https://link.springer.com/article/10.1007/s12237-016-0192-z. 2017; (accessed on 31 August 2022). [Google Scholar]
- Brakel, J., Jakobsson-Thor. Modulation of the Eelgrass – Labyrinthula zosterae Interaction Under Predicted Ocean Warming, Salinity Change and Light Limitation. Frontiers in Marine Science 6. 2019. [Google Scholar]
- Burge, C.A., Mark Eakin. Climate change influences on marine infectious diseases: implications for management and society. Ann Rev Mar Sci, 2014; 6, 249–277. [Google Scholar] [CrossRef]
- Byers, J.E. Effects of climate change on parasites and disease in estuarine and nearshore environments. PLOS Biology Cabral, H., Fonseca, V., Sousa, T., Costa Leal, M., 2019. Synergistic Effects of Climate Change and Marine Pollution: An Overlooked Interaction in Coastal and Estuarine Areas. International Journal of Environmental Research and Public Health 16, 2737. https://doi.org/10.3390/ijerph16152737. 2020, 18, e3000743. [Google Scholar] [CrossRef]
- Chen, X., Leung. Sharpening of cold-season storms over the western United States. Nat. Clim. Chang. 2023, 13, 167–173. [Google Scholar] [CrossRef]
- Colombano, D.D., Litvin. Climate Change Implications for Tidal Marshes and Food Web Linkages to Estuarine and Coastal Nekton. Estuaries and Coasts 2021, 44,, 1637–1648. [Google Scholar] [CrossRef]
- Costanza, R., de Groot. Changes in the global value of ecosystem services. Global Environmental Change, 2014; 26, 152–158. [Google Scholar] [CrossRef]
- Darling, E.S., McClanahan. Social–environmental drivers inform strategic management of coral reefs in the Anthropocene. Nat Ecol Evol 2019, 3, 1341–1350. [Google Scholar] [CrossRef]
- Díaz, S. Intergovernmental science-policy platform on biodiversity and ecosystem services. , 2019. [Google Scholar]
- Duarte, C.M., Krause-Jensen. Export from Seagrass Meadows Contributes to Marine Carbon Sequestration. Frontiers in Marine Science 4. 2017. [Google Scholar]
- El-Sayed, A., Kamel. Climatic changes and their role in emergence and re-emergence of diseases. Environ Sci Pollut Res, 2020; 27, 22336–22352. [Google Scholar] [CrossRef]
- Feebarani, J., Joydas. Benthic quality assessment in a naturally- and human-stressed tropical estuary. Ecological Indicators, 2016; 67, 380–390. [Google Scholar] [CrossRef]
- Getz, W.M., Tallam. A quantitative narrative on movement, disease and patch exploitation in nesting agent groups. 2019. [Google Scholar] [CrossRef]
- Gimenez, I., Waldbusser. Ocean acidification stress index for shellfish (OASIS): Linking Pacific oyster larval survival and exposure to variable carbonate chemistry regimes. Elementa: Science of the Anthropocene 2018, 6, 51. [Google Scholar] [CrossRef]
- Graham, O.J., Aoki. Effects of Seagrass Wasting Disease on Eelgrass Growth and Belowground Sugar in Natural Meadows. Frontiers in Marine Science 2021, 8. [Google Scholar] [CrossRef]
- Groner, M.L., Maynard. Managing marine disease emergencies in an era of rapid change. Philosophical Transactions of the Royal Society B: Biological Sciences 2016, 371, 20150364. [Google Scholar] [CrossRef] [PubMed]
- Halpern, B.S., Walbridge. A Global Map of Human Impact on Marine Ecosystems. Science 2008, 319, 948–952. [Google Scholar] [CrossRef] [PubMed]
- Harvell, D., Aronson. The rising tide of ocean diseases: unsolved problems and research priorities. Frontiers in Ecology and the Environment 2004, 2, 375–382. [Google Scholar] [CrossRef]
- He, Q., Silliman. Climate Change, Human Impacts, and Coastal Ecosystems in the Anthropocene. Current Biology Hechinger, R.F., Lafferty, K.D., McLaughlin, J.P., Fredensborg, B.L., Huspeni, T.C., Lorda, J., Sandhu, P.K., Shaw, J.C., Torchin, M.E., Whitney, K.L., Kuris, A.M., 2011. Food webs including parasites, biomass, body sizes, and life stages for three California/Baja California estuaries. Ecology 92, 791–791. https://doi.org/10.1890/10-1383.1. 2019, 29, R1021–R1035. [Google Scholar] [CrossRef] [PubMed]
- Hoegh-Guldberg, O., Bruno. The Impact of Climate Change on the World’s Marine Ecosystems. Science 2010, 328, 1523–1528. [Google Scholar] [CrossRef] [PubMed]
- Jakobsson-Thor, S., Brakel. Complex Interactions of Temperature, Light and Tissue Damage on Seagrass Wasting Disease in Zostera marina. Frontiers in Marine Science 2020, 7. [Google Scholar] [CrossRef]
- Kaiho, K. Benthic foraminiferal dissolved-oxygen index and dissolved-oxygen levels in the modern ocean. Geology 1994, 22, 719–722. [Google Scholar] [CrossRef]
- Kocan, R.M. Transmission models for the fish pathogen Ichthyophonus: synthesis of field observations and empirical studies. Can. J. Fish. Aquat. Sci. 2019, 76, 636–642. [Google Scholar] [CrossRef]
- Lafferty, K.D., Allesina. Parasites in food webs: the ultimate missing links. Ecol Lett, 2008; 11, 533–546. [Google Scholar] [CrossRef]
- Laufkötter, C., Zscheischler. High-impact marine heatwaves attributable to human-induced global warming. Science 2020, 369, 1621–1625. [Google Scholar] [CrossRef] [PubMed]
- Lauzon-Guay, J.-S., Scheibling. Modelling phase shifts in a rocky subtidal ecosystem. Marine Ecology Progress Series Lessios, H.A., 1988. MASS MORTALITY OF DIADEMA ANTILLARUM IN THE CARIBBEAN: What Have We Learned? Annual Review of Ecology and Systematics 19, 371–393. https://doi.org/10.1146/annurev.es.19.110188.002103. 2009, 375. [Google Scholar] [CrossRef]
- Liu, S., Zhang. Interdecadal variability in ecosystem health of Changjiang (Yangtze) River estuary using estuarine biotic integrity index. J. Ocean. Limnol. 2021; 39, 1417–1429. [Google Scholar] [CrossRef]
- Malhi, Y., Franklin. Climate change and ecosystems: threats, opportunities and solutions. Philosophical Transactions of the Royal Society B: Biological Sciences 2020, 375, 20190104. [Google Scholar] [CrossRef]
- Marcogliese, D. Implication of climate change for parasitism of animals in the aquatic environment. Canadian Journal of Zoology-revue Canadienne De Zoologie - CAN J ZOOL 2001, 79, 1331–1352. [Google Scholar] [CrossRef]
- Maynard, J., van Hooidonk. Improving marine disease surveillance through sea temperature monitoring, outlooks and projections. Philosophical Transactions of the Royal Society B: Biological Sciences 2016, 371, 20150208. [Google Scholar] [CrossRef] [PubMed]
- McLaughlin, J.P., Morton. Parasites in marine food webs. In Marine Disease Ecology; Behringer, D.C., Silliman, B.R., Lafferty, K.D., Eds.; Oxford University Press, 2020. [Google Scholar] [CrossRef]
- Moore, J.D., Robbins. Withering Syndrome in Farmed Red Abalone Haliotis rufescens: Thermal Induction and Association with a Gastrointestinal Rickettsiales-like Prokaryote. J Aquat Anim Health 2000, 12, 26–34. [Google Scholar] [CrossRef] [PubMed]
- NERRS, 2023. National Estuarine Research Reserve System [WWW Document]. URL. https://coast.noaa.gov/nerrs/. (accessed on 27 January 2023).
- NERRS, 2013. CLIMATE SENSITIVITY OF THE NATIONAL ESTUARINE RESEARCH RESERVE SYSTEM.
- NOAA, 2022. Estuaries Tutorial: NOAA’s National Ocean Service Education [WWW Document]. URL. Available online: https://oceanservice.noaa.gov/education/tutorialestuaries/est10monitor.html (accessed on 23 March 2023).
- NY Times, 2023. Rare Tornadoes Touch Down in Southern California - The New York Times [WWW Document]. URL. Available online: https://www.nytimes.com/2023/03/21/us/california-storm-evacuations-weather.html (accessed on 23 March 2023).
- Paerl, H.W., Valdes. Anthropogenic and climatic influences on the eutrophication of large estuarine ecosystems. Limnology and Oceanography 2006, 51, 448–462. [Google Scholar] [CrossRef]
- Potter, C., Harwood. Learning from history, predicting the future: the UK Dutch elm disease outbreak in relation to contemporary tree disease threats. Philos Trans R Soc Lond B Biol Sci 2011, 366, 1966–1974. [Google Scholar] [CrossRef] [PubMed]
- Powell, E., Klinck. The Potential for Oysters, Crassostrea Virginica, to Develop Resistance to Dermo Disease in the Field: Evaluation Using a Gene-Based Population Dynamics Model; CCPO Publications, 2011. [Google Scholar] [CrossRef]
- Rappazzo, B.H., Eisenlord. EeLISA: Combating Global Warming Through the Rapid Analysis of Eelgrass Wasting Disease. Proceedings of the AAAI Conference on Artificial Intelligence 2021, 35, 15156–15165. [Google Scholar] [CrossRef]
- Rice, K.C., Hong. Assessment of salinity intrusion in the James and Chickahominy Rivers as a result of simulated sea-level rise in Chesapeake Bay, East Coast, USA. Journal of Environmental Management 2012, 111, 61–69. [Google Scholar] [CrossRef]
- Short, F.T., Wyllie-Echeverria. Natural and human-induced disturbance of seagrasses. Sullivan, B.K., Sherman, T.D., Damare, V.S., Lilje, O., Gleason, F.H., 2013. Potential roles of Labyrinthula spp. in global seagrass population declines. Fungal Ecology 1995, 6, 328–338. [Google Scholar] [CrossRef]
- Sweet, M.J., Bateman. Diseases in marine invertebrates associated with mariculture and commercial fisheries. J Sea Res 2015, 104, 16–32. [Google Scholar] [CrossRef]
- Tallam, K., Liu. Identification of Snails and Schistosoma of Medical Importance via Convolutional Neural Networks: A Proof-of-Concept Application for Human Schistosomiasis. Frontiers in Public Health 2021, 9. [Google Scholar] [CrossRef]
- Tallam, K. , Quang, M.P., 2023. Applications of artificial intelligence in predicting dengue outbreaks in the face of climate change: a case study along coastal India. [CrossRef]
- Thompson, T.M., Batts. Emergence of Viral hemorrhagic septicemia virus in the North American Great Lakes region is associated with low viral genetic diversity. Dis Aquat Organ 2011, 96, 29–43. [Google Scholar] [CrossRef] [PubMed]
- Ward, J.R., Lafferty. The Elusive Baseline of Marine Disease: Are Diseases in Ocean Ecosystems Increasing? PLOS Biology 2004, 2, e120. [Google Scholar] [CrossRef] [PubMed]
- Wissler, L., Codoñer. Back to the sea twice: identifying candidate plant genes for molecular evolution to marine life. BMC Evol Biol 2011, 11, 8. [Google Scholar] [CrossRef] [PubMed]
- Wooldridge, T., Deyzel. Variability in estuarine water temperature gradients and influence on the distribution of zooplankton: A biogeographical perspective. African Journal of Marine Science 2012, 34, 465–477. [Google Scholar] [CrossRef]
Disclaimer/Publisher’s Note: The statements, opinions and data contained in all publications are solely those of the individual author(s) and contributor(s) and not of MDPI and/or the editor(s). MDPI and/or the editor(s) disclaim responsibility for any injury to people or property resulting from any ideas, methods, instructions or products referred to in the content. |
© 2023 by the authors. Licensee MDPI, Basel, Switzerland. This article is an open access article distributed under the terms and conditions of the Creative Commons Attribution (CC BY) license (http://creativecommons.org/licenses/by/4.0/).
Copyright: This open access article is published under a Creative Commons CC BY 4.0 license, which permit the free download, distribution, and reuse, provided that the author and preprint are cited in any reuse.
A Case Study of a Prymnesium parvum Harmful Algae Bloom in the Ohio River Drainage: Impact, Recovery and Potential for Future Invasions/Range Expansion
Kyle Hartman
et al.
Water,
2021
The Seasonality of Fecal Coliform Bacteria Pollution and its Influence on Closures of Shellfish Harvesting Areas in Mississippi Sound
Paulinus Chigbu
et al.
IJERPH,
2005
How Much Recurrent Outbreaks of the Moon Jellyfish May Impact the Dynamics of Bacterial Assemblages in Coastal Lagoons?
Loredana Stabili
et al.
Water,
2022


MDPI Initiatives
Important Links
© 2024 MDPI (Basel, Switzerland) unless otherwise stated