1. Introduction
Leukopenia and neutropenia require a specific diagnostic work-up to rule out a number of malignant and non-malignant disorders. Although benign and self-limiting autoimmune/idiopathic neutropenia is often reported in the first years of life, cases lasting more than 2 years and/or showing after 5 years of age, in particular if associated with leukopenia, have recently been shown to be secondary to underlying congenital disorders in a considerable number of patients due to reduced production and/or peripheral destruction [
1,
2,
3]. Serine/arginine-rich splicing factor (SRSF) proteins are a family of proteins involved in RNA metabolism, including pre-mRNA constitutive and alternative splicing. These mechanisms are tightly regulated: while pre-mRNA splicing allows to maintain cellular and tissue homeostasis, alternative splicing provides cells with multiple transcripts to respond to physiological and environmental stress. Deregulated splicing is common in cancer, and altered expression of SRSF proteins has been described in several tumours and metastasis. Furthermore, heterozygous mutation of SRSF2 induced increased proliferation of hematopoietic stem and progenitor cells (HSPC) with altered differentiation, cytopenia, and myelodysplasia [
4]. Among these protein family, the involvement of serine/arginine-rich splicing factor 4 (SRSF4) has already been reported in the setting of haematological diseases. Two patients with Autoimmune Lymphoproliferative Syndrome (ALPS) were shown to have an abnormal splicing of exon 6 of the FAS gene, secondary to a reduced expression of SRSF4, and leading to the impairment of the FAS transmembrane domain encoding [
5]. Moreover, mice with hypomorphic mutations in dyskerin (DKC1) showed reduced expression of SRSF4, bone marrow hypo-cellularity, and cancer predisposition [
6]. In addition , the role of SRSF proteins on mitochondria activity has already been reported for SRSF6. Recently, Wagner et al. described that loss of SRSF6 increased mitochondrial fragmentation and reduced Oxygen Consumption Rate (OCR), oxidative phosphorylation, and ATP synthesis in Mouse Embryonic Fibroblasts (MEFs)[
7]. It is well known that mitochondrial function is crucial for HSC maintenance [
8], and mitochondrial defects have been described in some genetic BMF syndromes [
9,
10,
11]. Germline mutations of the SRSF4 gene have never been reported as disease-causing. Herein, we describe a case of a boy with leuko-neutropenia secondary to bone marrow failure carrying a variant of the SRSF4 gene. To investigate whether this mutation in the SRSF4 gene may also have an impact on mitochondrial metabolism, we evaluated the expression of proteins involved in mitochondrial biogenesis and dynamics as well as the aerobic metabolism function in a cell line derived from the patient itself and in a cell line derived from his mother affected by a mild leukopenia.
2. Materials and Methods
Patients
A 8-year-old patient (referred in the result section as Pt 2), was admitted to the Hematology Unit because of leukopenia with history of lymphopenia and neutropenia lasting for 3 years. Two ancestors from the maternal branch had died due to bone marrow failure and leukemia, respectively The mother herself (referred as Pt 1), suffered from chronic leuko-neutropenia with a White Blood Cell (WBC) and Neutrophil count of 2900/mmc (range 2100-3700/mmc) and 1200/mmc (range 1000-1500/mmc), respectively, over a period of 30 years with no relevant infection history.
The patient (Pt2) had neither malformations, nor development or growth delay . At the age of five, Full Blood Count (FBC) performed after a Cytomegalocirus (CMV) infection showed leukopenia (WBC 2800/mmc) and moderate neutropenia (N 660/mmc) that, although attenuated, persisted at the age of 8 (WBC 3560/mmc, N 1390/mmc) along with raised vitamin B12 (1043 pg/ml). Anti-Neutrophil Antibody testing and other immune-dysregulation diagnostic work-up resulted negative. Initial bone marrow aspiration, cytogentics trephine biopsy were normal and so did telomere length measurement in granulocytes and lymphocytes, DEB test and cell cycle and cell survival after exposition to mytomycin C. During further 6 year follow-up, Leuko/neutropenia persisted and trephyne biopsy showed a progressive reduction of haematopoietic cellularity (30-40%).
Genetic Analysis
A targeted analysis on the coding regions of 315 genes related to Bone Marrow Failure and Primary Immunodeficiencies [
12], was initially performed but no pathogenic variants were found. Then, Whole Genome Sequencing (WGS) on the proband and his mother was performed. The whole coding part of the genome, including 100bps flanking all the exons, has been taken into consideration as second tier of analysis.
Given the maternal transmission of the clinical phenotype, both an autosomal dominant and an X-linked inheritance were considered. Heterozygous non-synonymous and splicing variants at ±2bp, present in both patients, were taken into account and selected based on their allele frequency (variants unreported or reported with a frequency <1% in the general healthy population). The identified SRSF4 variant was validated by Sanger sequencing both in the proband and in his mother.
Cell Culture and Transfection
Primary lymphocytes and EBV-immortalized lymphoblast from patients and healthy donor were cultured in RPMI medium with 10% FCS. Lymphoblast cells were transfected with SRSF4 cDNA-containing expression vector or empty vector using Lipofectamine 3000 (Invitrogen)according to the manufacturer instructions. Sample derived from the 8-year-old patient and his mother have been named SRSF4 Pt2 and SRSF Pt1, respectively; samples derived from healthy donor, used as control, have been named as HD. Cells were harvested after 24h for subsequent RNA extraction, after 48h for metabolic and biochemical analysis.
RNA Extraction, Retrotranscription and Expression of the SRSF4 Gene
Efficiency of transfection was determined by real-time PCR testing the SRSF4 expression level in transfected lymphoblasts. For this purpose, RNA from transfected cells was extracted using the RNeasy mini kit (Qiagen), RNA was reverse-transcribed using the SuperScript VILO IV cDNA Synthesis Kit (Invitrogen). The expression of the SRSF4 gene was evaluated using a specific TaqMan MicroRNA Assay as described by the manufacturer (Applied Biosystems). Gene expression was normalized to the GAPDH expression. Experiments were performed in triplicate.
Assessment of the Cellular Energy Status
To evaluate the cells’ energy status, the intracellular ATP and AMP concentration were assayed on 50 μg of total protein to calculate the ATP/AMP ratio. ATP content spectrophotometric analysis was performed following the NADP reduction at 340 nm. The assay solution contained: 100 mM Tris-HCl (pH 8.0), 0.2 mM NADP, 5 mM MgCl2, 50 mM glucose, and 3 μg of pure hexokinase and glucose-6-phosphate dehydrogenase.
AMP was measured spectrophotometrically following the NADH oxidation at 340 nm. The reaction medium was composed of 100 mM Tris-HCl (pH 8.0), 5 mM MgCl
2, 0.2 mM ATP, 10 mM phosphoenolpyruvate, 0.15 mM NADH, 10 IU adenylate kinase, 25 IU pyruvate kinase, and 15 IU lactate dehydrogenase [
9].
Evaluation of Lipid Peroxidation
The thiobarbituric acid reactive substances (TBARS) assay was used to measure the malondialdehyde (MDA) concentration as a lipid peroxidation marker. The TBARS solution was composed of 0.25 N HCl, 0.25 mM tri-chloroacetic acid (TCA), and 26 mMthiobarbituric acid. 50 μg of total protein dissolved in 300 l of Milli-Q water was added along with 600 l of TBARS solution. For 1 h, the mixture was incubated at 95 °C and evaluated spectrophotometrically at 532 nm. MDA standard solutions with concentrations between 1 and 20 μM were employed for the calibration [
15].
Assay of the ETC Complexes
All assays were performed on 50 μg of cell homogenate. Complex I (NADH-ubiquinone oxidoreductase) and Complex II (Succinate-coenzyme Q reductase) activities were measured spectrophotometrically following the ferricyanide reduction at 420 nm. For both assays the medium contained: 50 mM Tris–HCl pH 7.4, 50 mMKCl, 5 mM MgCl2, 1 mM EGTA, 0.8 mM ferricyanide, and 50 μM Antimycin A. The reaction was started by the addition of 0.6 mM NADH or 10 mM succinate for Complex I or Complex II, respectively.
Complex III (cytochrome c reductase) activity was measured spectrophotometrically following the reduction of oxidized cytochrome c (Cyt c) at 550 nm. The assay medium contained: 50 mM Tris-HCl pH 7.4, 5 mMKCl, 2 mM MgCl2, 0.5 M NaCN, 0.03% oxidized Cyt c, 0.6 mM NADH, and 20 mM succinate.
Complex IV (cytochrome c oxidase) activity was measured spectrophotometrically following the oxidation of reduced Cyt c at 550 nm. The assay medium contained: 50 mM Tris-HCl pH 7.4, 5 mMKCl, 2 mM MgCl2, 0.03% reduced Cyt c, 0.6 mM NADH, and 20 mM succinate.
Western Blot Analysis
Denaturing electrophoresis (SDS-PAGE) was performed on 30 μg of proteins employing a 4-20% gradient gel (#4561094, BioRad, USA). The following primary antibodies were used: anti-SRSF4 (#PA5-36366, ThermoFisher Scientific, Waltham. MA, USA), anti-phospho-mammalian target of rapamycin (mTOR, #5536S, Cell Signaling Technology, Danvers, MA, USA), anti-mTOR (#2983S, Cell Signaling Technology, Danvers, MA, USA), anti-clustered mitochondria homolog (CLUH, (#A301-764A, Bethyl Laboratories, Montgomery, TX, USA), anti-OPA1 (#HPA036926, Merck, Darmstadt, Germany), anti-DRP1 (#ab184247, Abcam, Cambridge, UK), and anti-Actin (#MA1-140, ThermoFisher Scientific, Waltham. MA, USA). All primary antibodies were diluted following the manufacturer’s instructions in PBS plus 0.15% tween (PBSt, Tween was from Roche, Basel, Switzerland, #11332465001). Specific secondary antibodies were employed (#A0168 and # SAB3700870, Merck, Darmstadt, Germany), all diluted 1:10,000 in PBSt. Bands were detected in the presence of an enhanced chemiluminescence substrate (ECL, # 1705061, BioRad, Hercules, USA), by a chemiluminescence system (Alliance 6.7 WL 20M, UVITEC., Cambridge, UK). Band intensity was evaluated by UV1D software (UVITEC, Cambridge, UK). All the bands of interest were normalized versus the Actin signal detected on the same membrane.
Statistical Analysis
Data were analyzed using one-way ANOVA followed by Tukey’s multiple comparison test by Prism 8 Software. Data are expressed as mean ± standard deviation (SD) and are representative of at least three independent experiments. An error with a probability of p<0.05 was considered significant.
3. Results
Genetic Analysis
WGS detected a the missense variant c.703C>T in the
SRSF4 gene (NM_005626.5) shared between the proband and his mother at the heterozygous state. This variant affects codon Arg235 and induces the change p.R235W in the Arg/Ser (RS) rich domain that drives the activity, localization, and interactions of SRSF proteins [
16]. It is classified as a VUS according to Franklin software (Genoox). However other scores like CADD of 28.3, PROVEAN and SIFT4G predictions of pathogenicity (pathogenic supporting; score-5.27 and 0.001 respectively), a DANN of 0.9937 and a quite high conservation score (5.77 for PhyloP and 4.16 for GERP++), suggest its possible pathogenic role. In addition, the affected domain (the RS rich domain) is critical for the SRSF4 protein , and this along with the low frequency in the GnomAD database (6.6x10E-6) can further support an effect of the p.R235W variant.
The SRSF4 Mutation Causes a Reduction in mTOR Phosphorylation and Expression and an Alteration in Mitochondrial Dynamics
To understand the causes of OxPhos dysfunction, the phosphorylation level and expression of mTOR, a serine that plays a pivotal role in regulating mitochondrial function[
17], was assessed. Data reported in
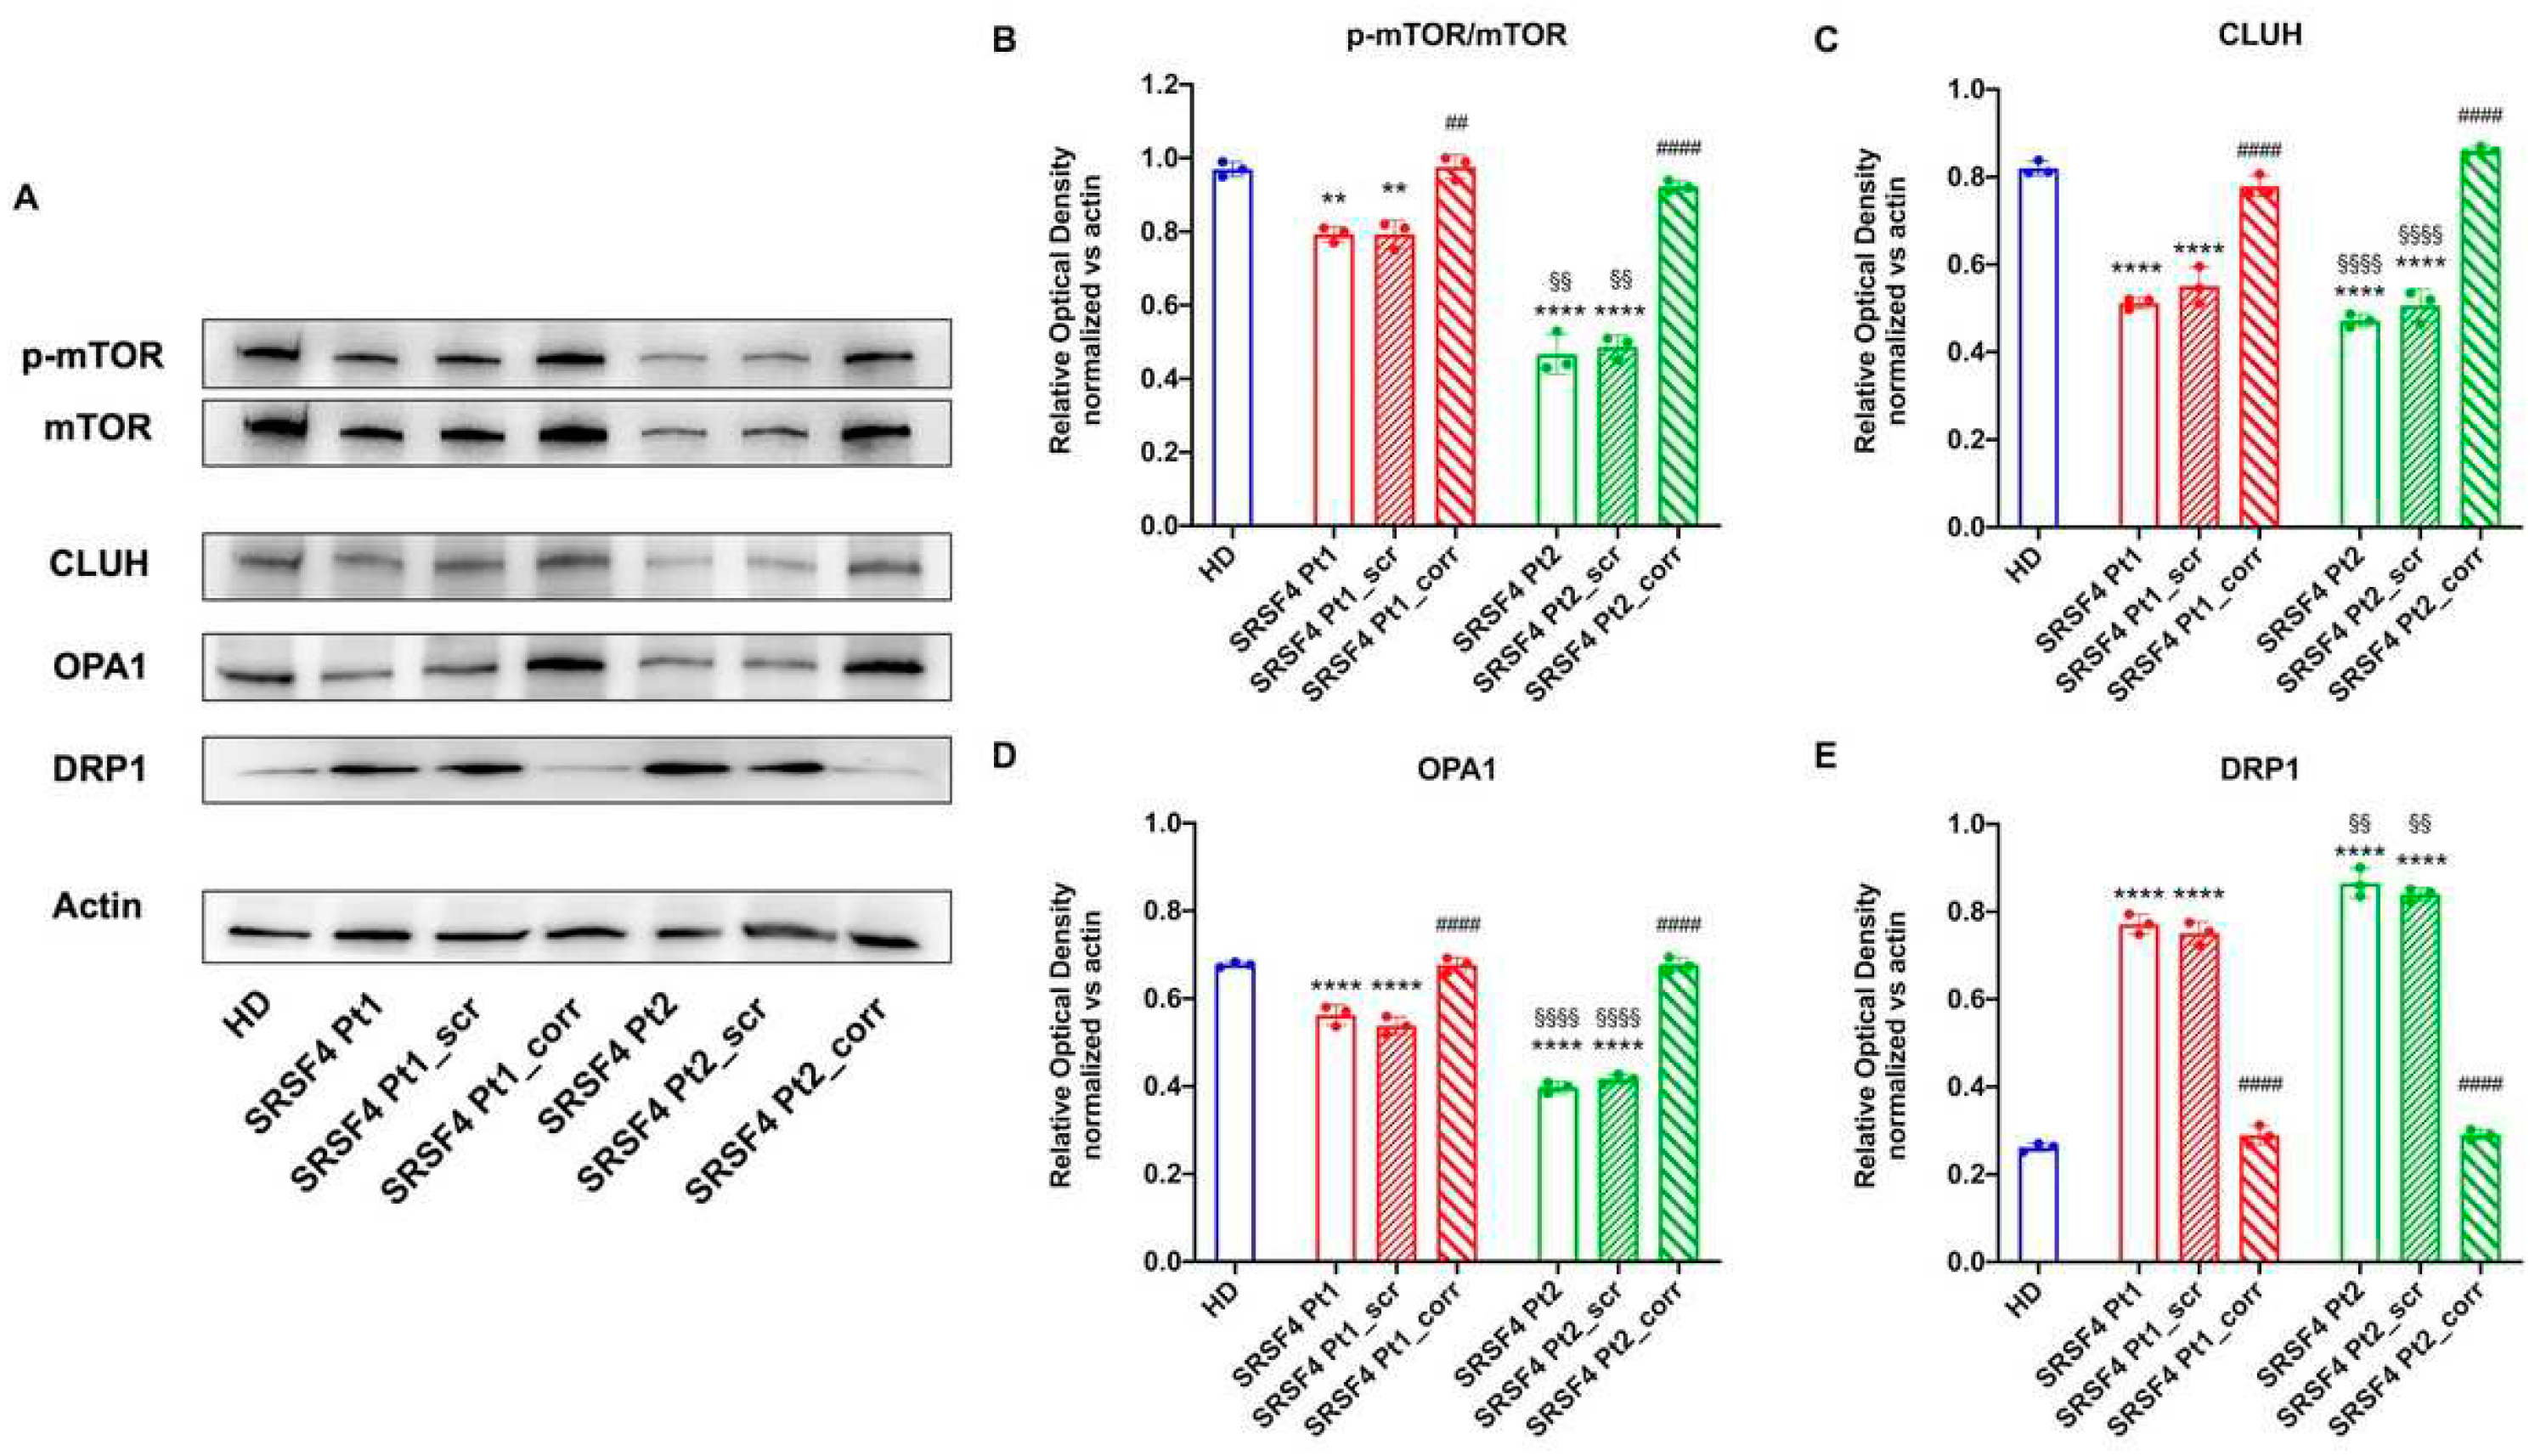
Figure 6 show that in both lines derived from patients mutated for SRSF4, mTOR phosphorylation appears lower than in healthy controls and corrected cells, although Pt2 shows significantly lower values than Pt1. In addition, Pt2 also shows a marked decrease in total mTOR expression, which is much less evident in Pt1. In other words, the SRSF4 mutation appears to cause decreased activation of the mTOR-regulated pathway due to the low phosphorylation and lower expression.
Since the OxPhos functionality also depends on the modulation of mitochondrial network dynamic, the expressions of CLUH, an RNA binding protein that regulates the expression of proteins involved in mitochondrial fusion and fission (i.e., OPA1, a fusion regulatory protein, and DRP1, a protein involved in fission [
18]) were evaluated. The data show that both patients, especially Pt2, are characterized by low expression of CLUH and OPA1 and high expression of DRP1 (
Figure 6), suggesting an altered regulation of mitochondrial dynamics in favor of fission, recovered by the correction with the wild-type SRSF4 gene.
Figure 6.
Expression of mTOR and proteins involved in the mitochondrial network dynamic in SRSF4 cell lines All data were evaluated in healthy donor samples (HD), cell lines mutated for SRSF4 (Pt1 and Pt2), and mutated cell lines corrected with wild-type SRSF4 (Pt1_corr and Pt2_corr). (A) WB signals and (B) relative densiometric analysis of phosphorylated and total mTOR, CLUH, OPA1, and DRP1. Each signal was normalized on the actin signal. Data are reported as mean ± SD and are representative of 4 independent experiments. ** and **** indicate a p<0.01 or 0.0001, respectively, between Pt1 or Pt2 and HD. ## and #### indicate a p<0.01 or 0.0001, respectively, between the mutated sample and the corrected cell within the same patient. §§ and §§§§ indicate a p<0.01 or 0.0001, respectively, between Pt1 and Pt2.
4. Discussion
In addition to the classical congenital MF (cMF), several germline defects predisposing to MF and potentially evolving to MDS and leukemia have been increasingly discovered (GATA2, SAMD9, DADA2) in the last few years [
19,
20,
21,
22,
23]. In some cases, overlapping clinical features of immune dysregulation with concomitant peripheral blood cell destruction have been shown, thus representing a considerable group of non-classical cMFs in children3. In this setting, long-lasting leukopenia and neutropenia may represent a pivotal sign of such disorders [
24] and therefore deserve a specific and accurate haematological and immunological work-up [
25]. In our patient, the strongly suggestive family history and a long-lasting leuko-neutropenia induced us to perform a deep genetic work-up, revealing the presence of an variant in SRSF4 never reported in subjects with haematological diseases.
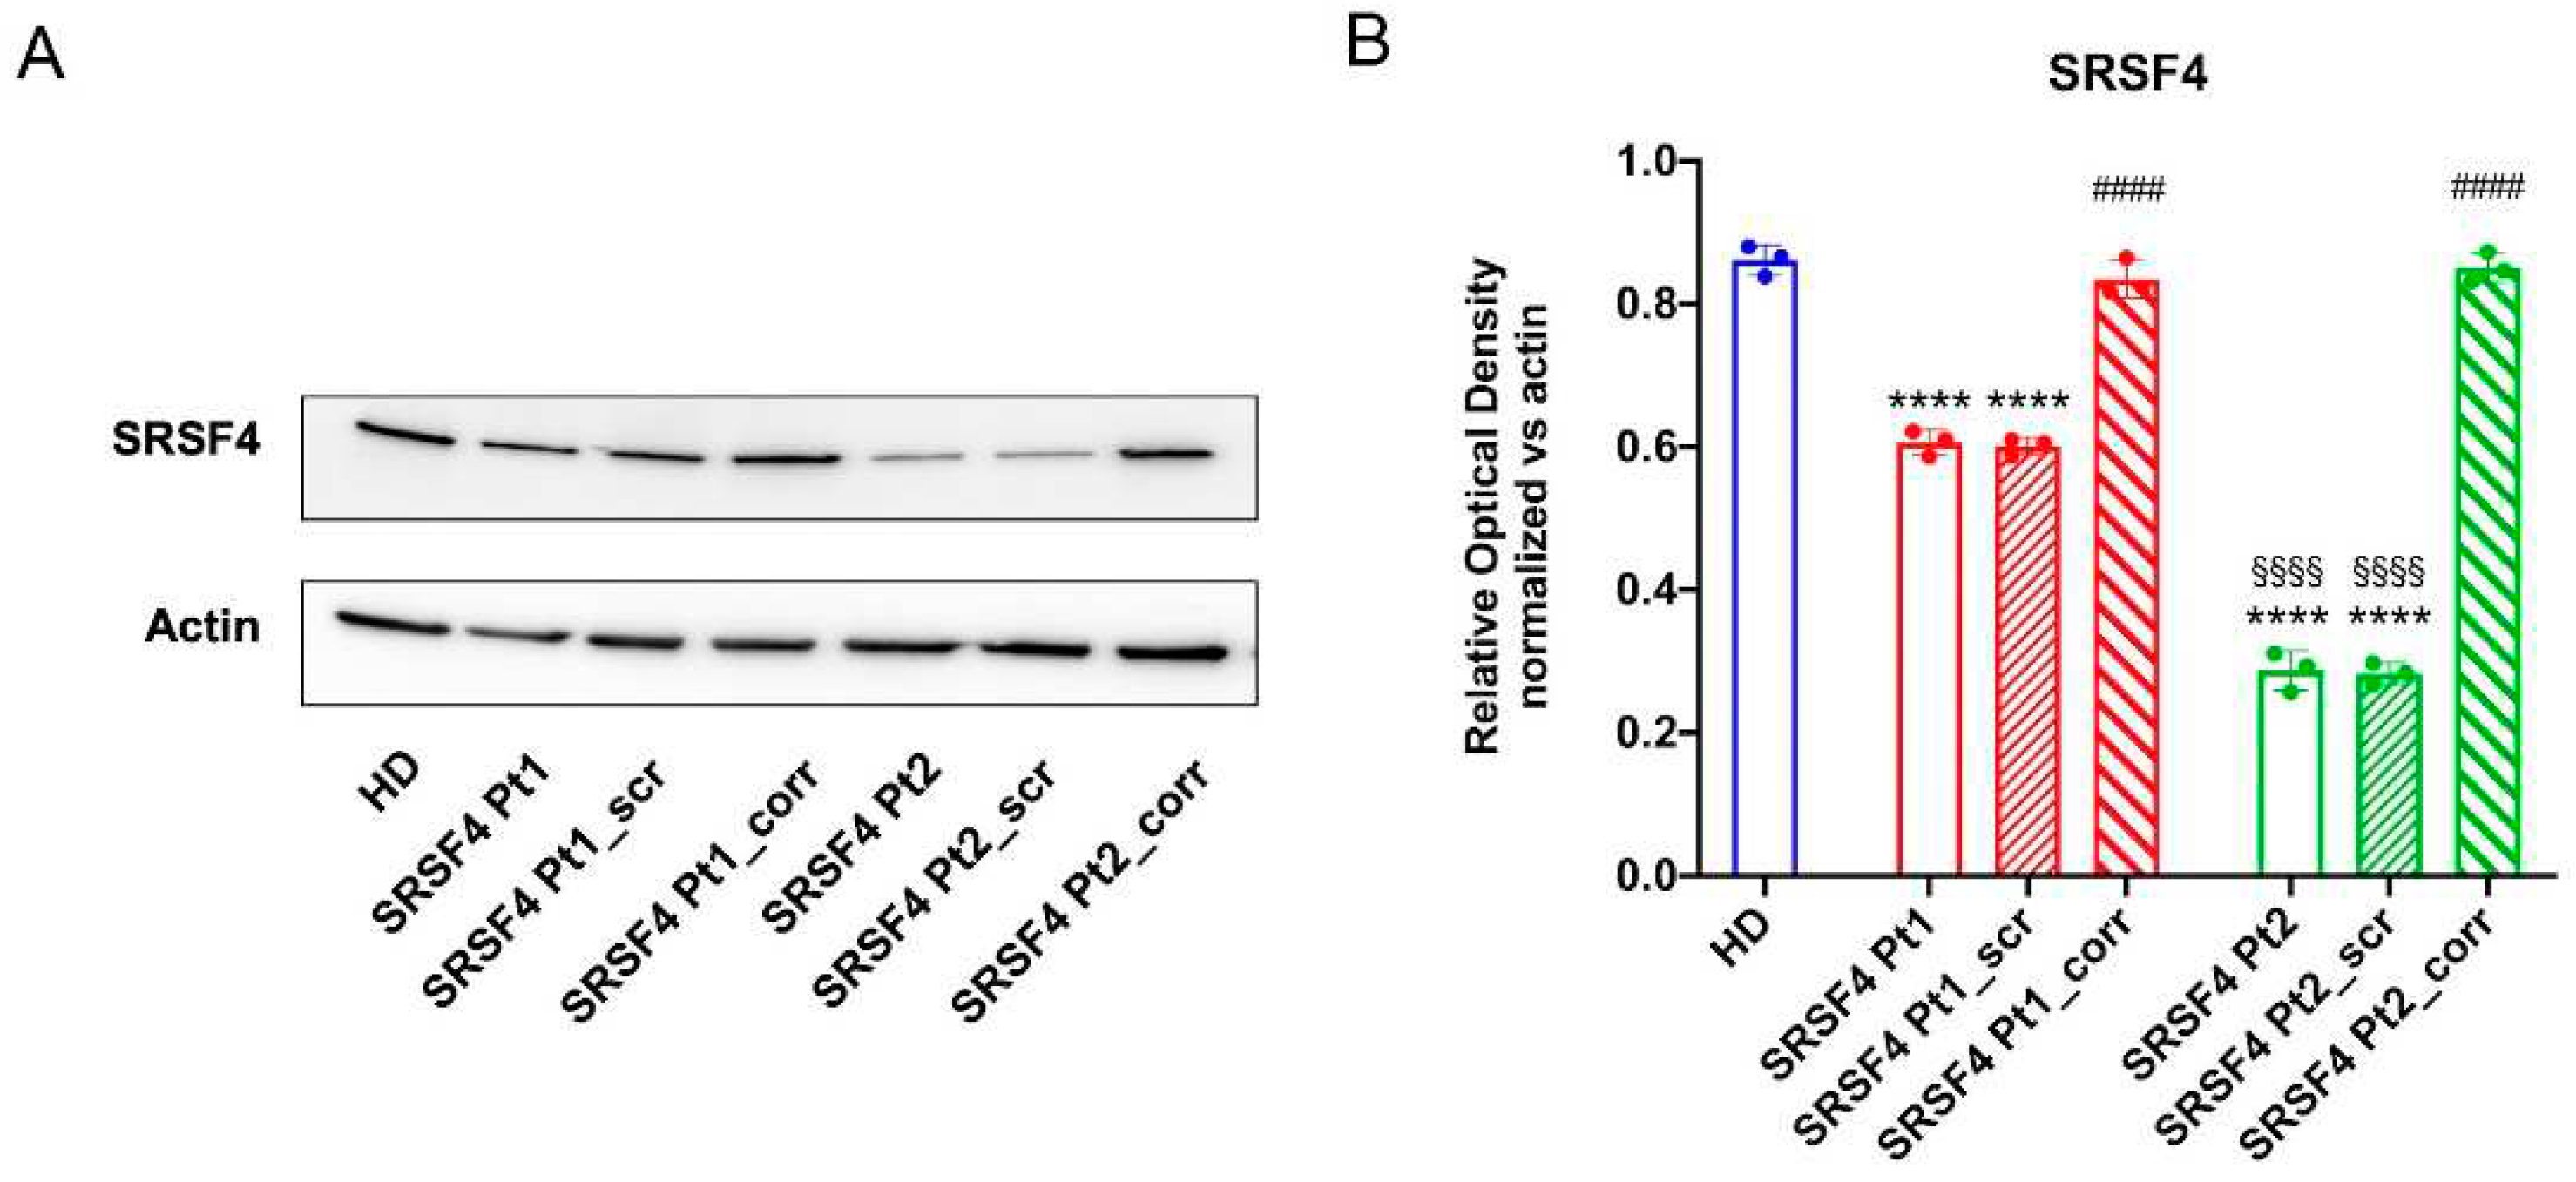
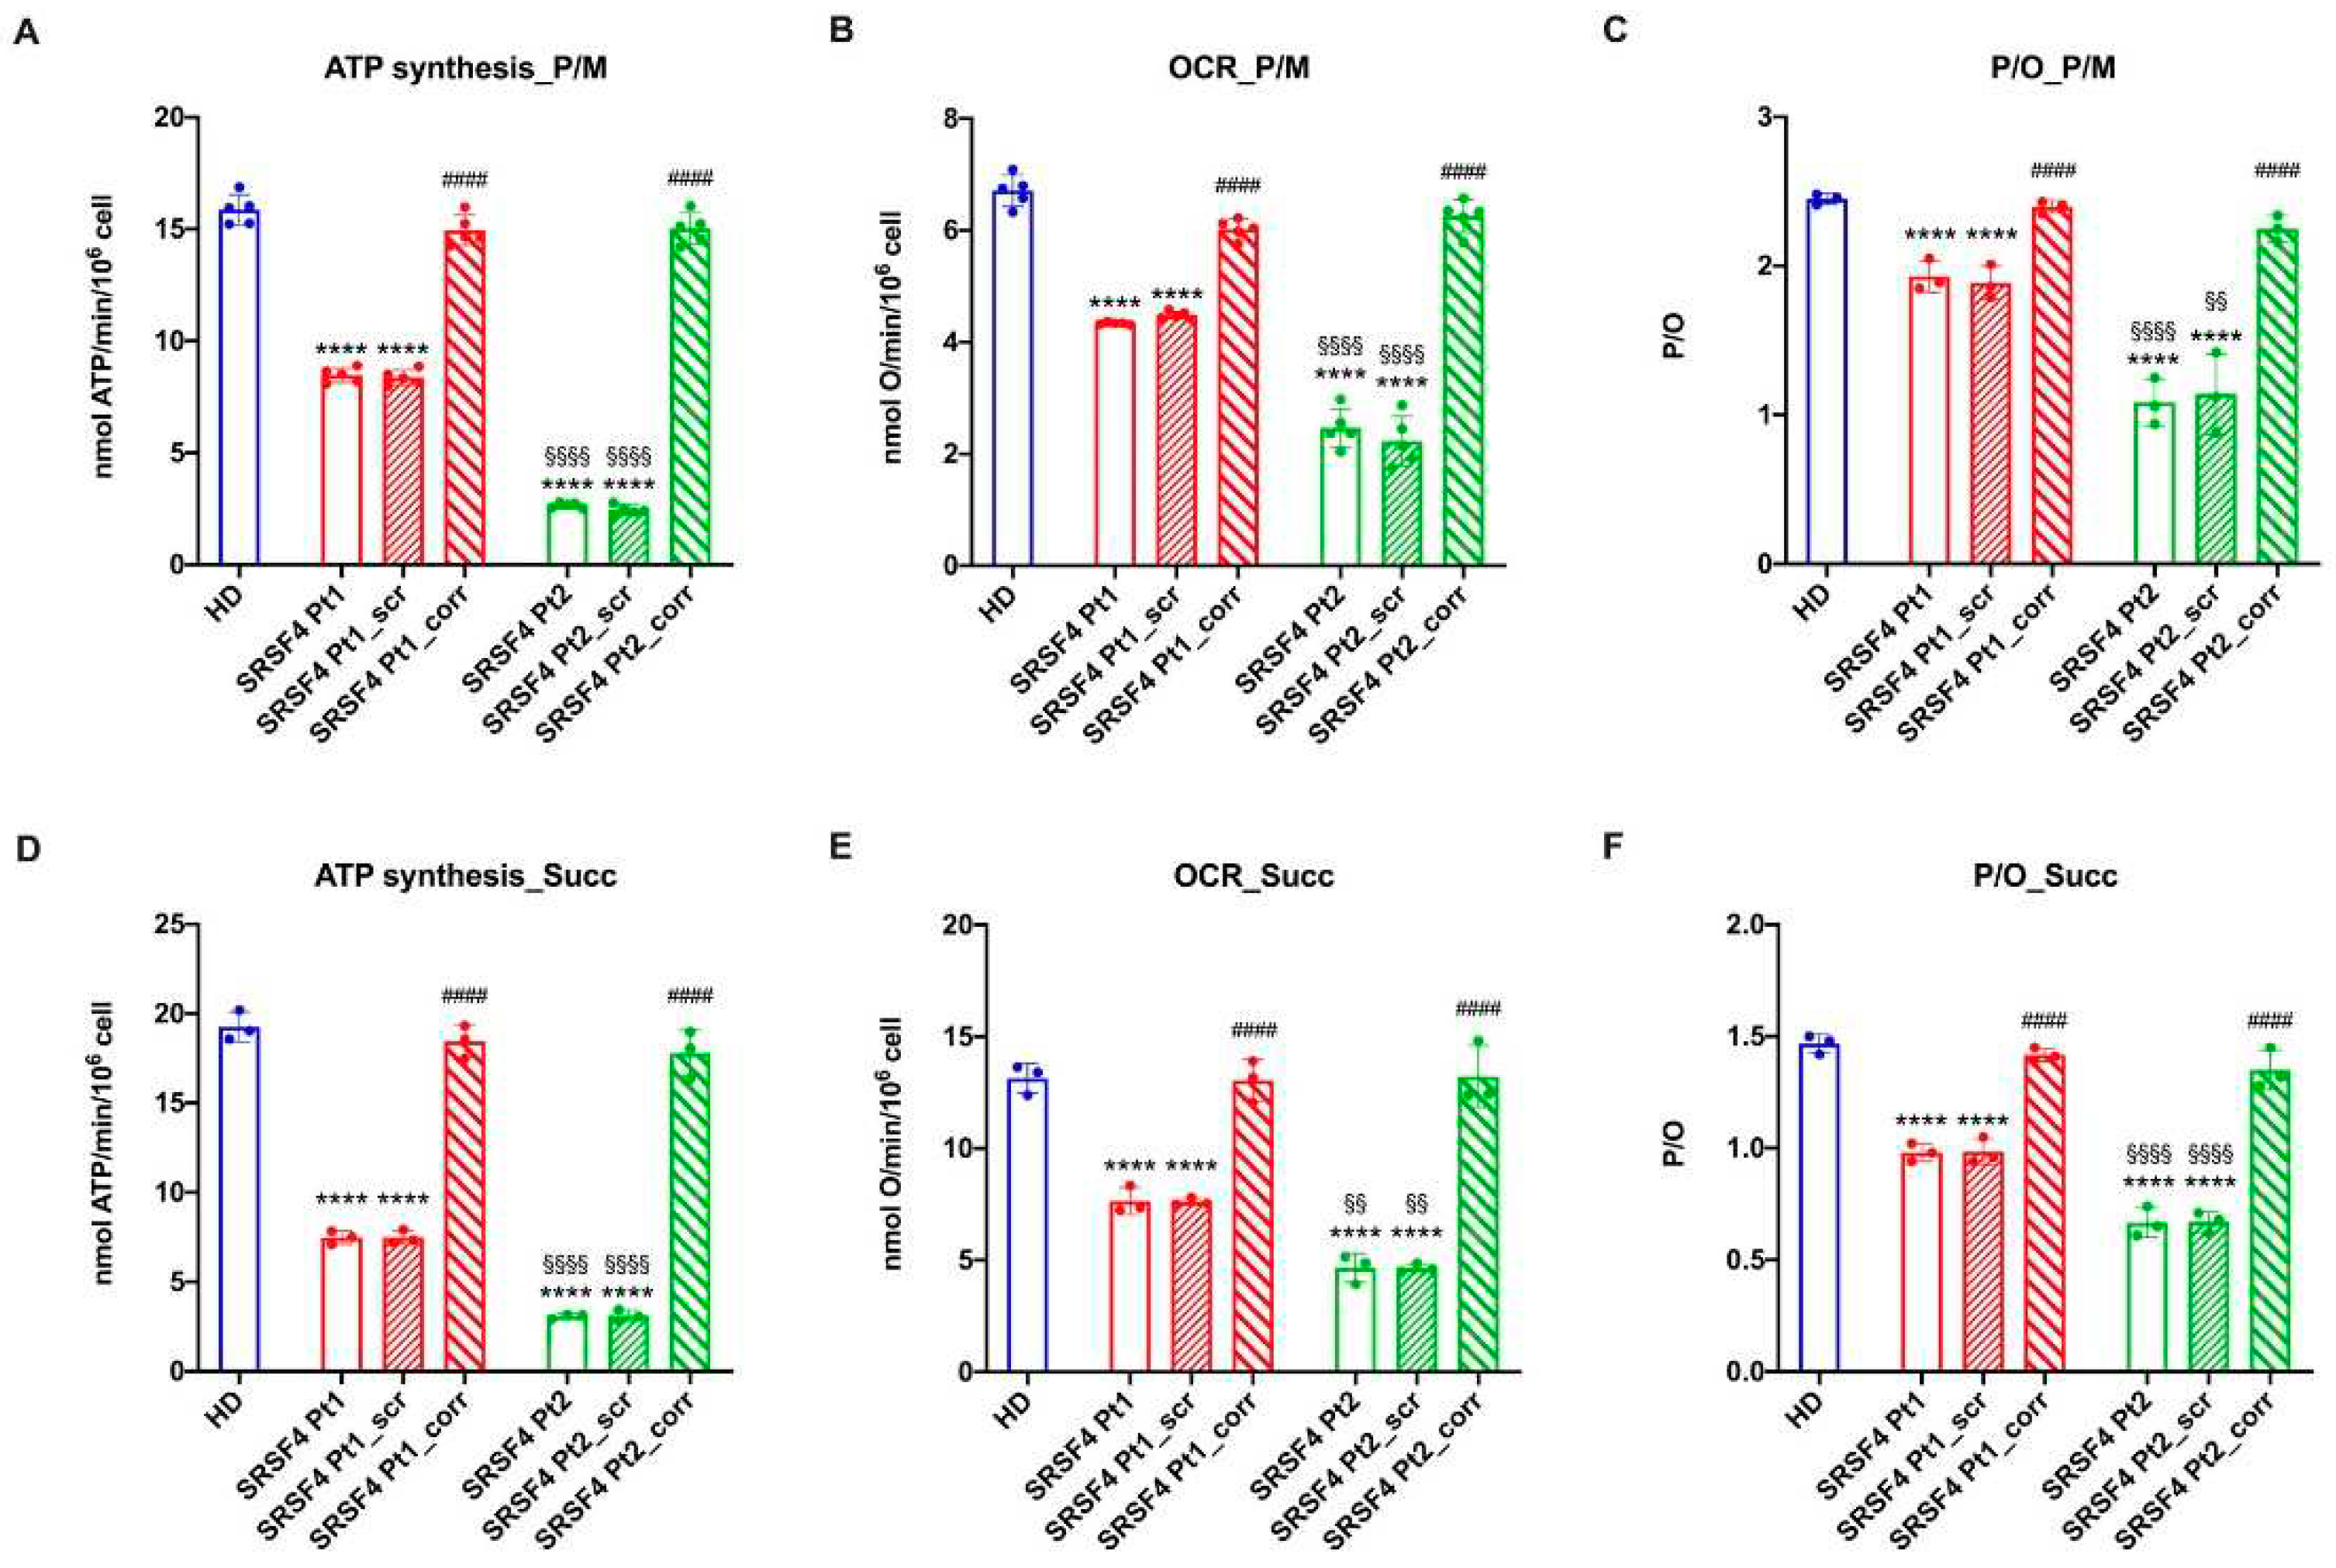
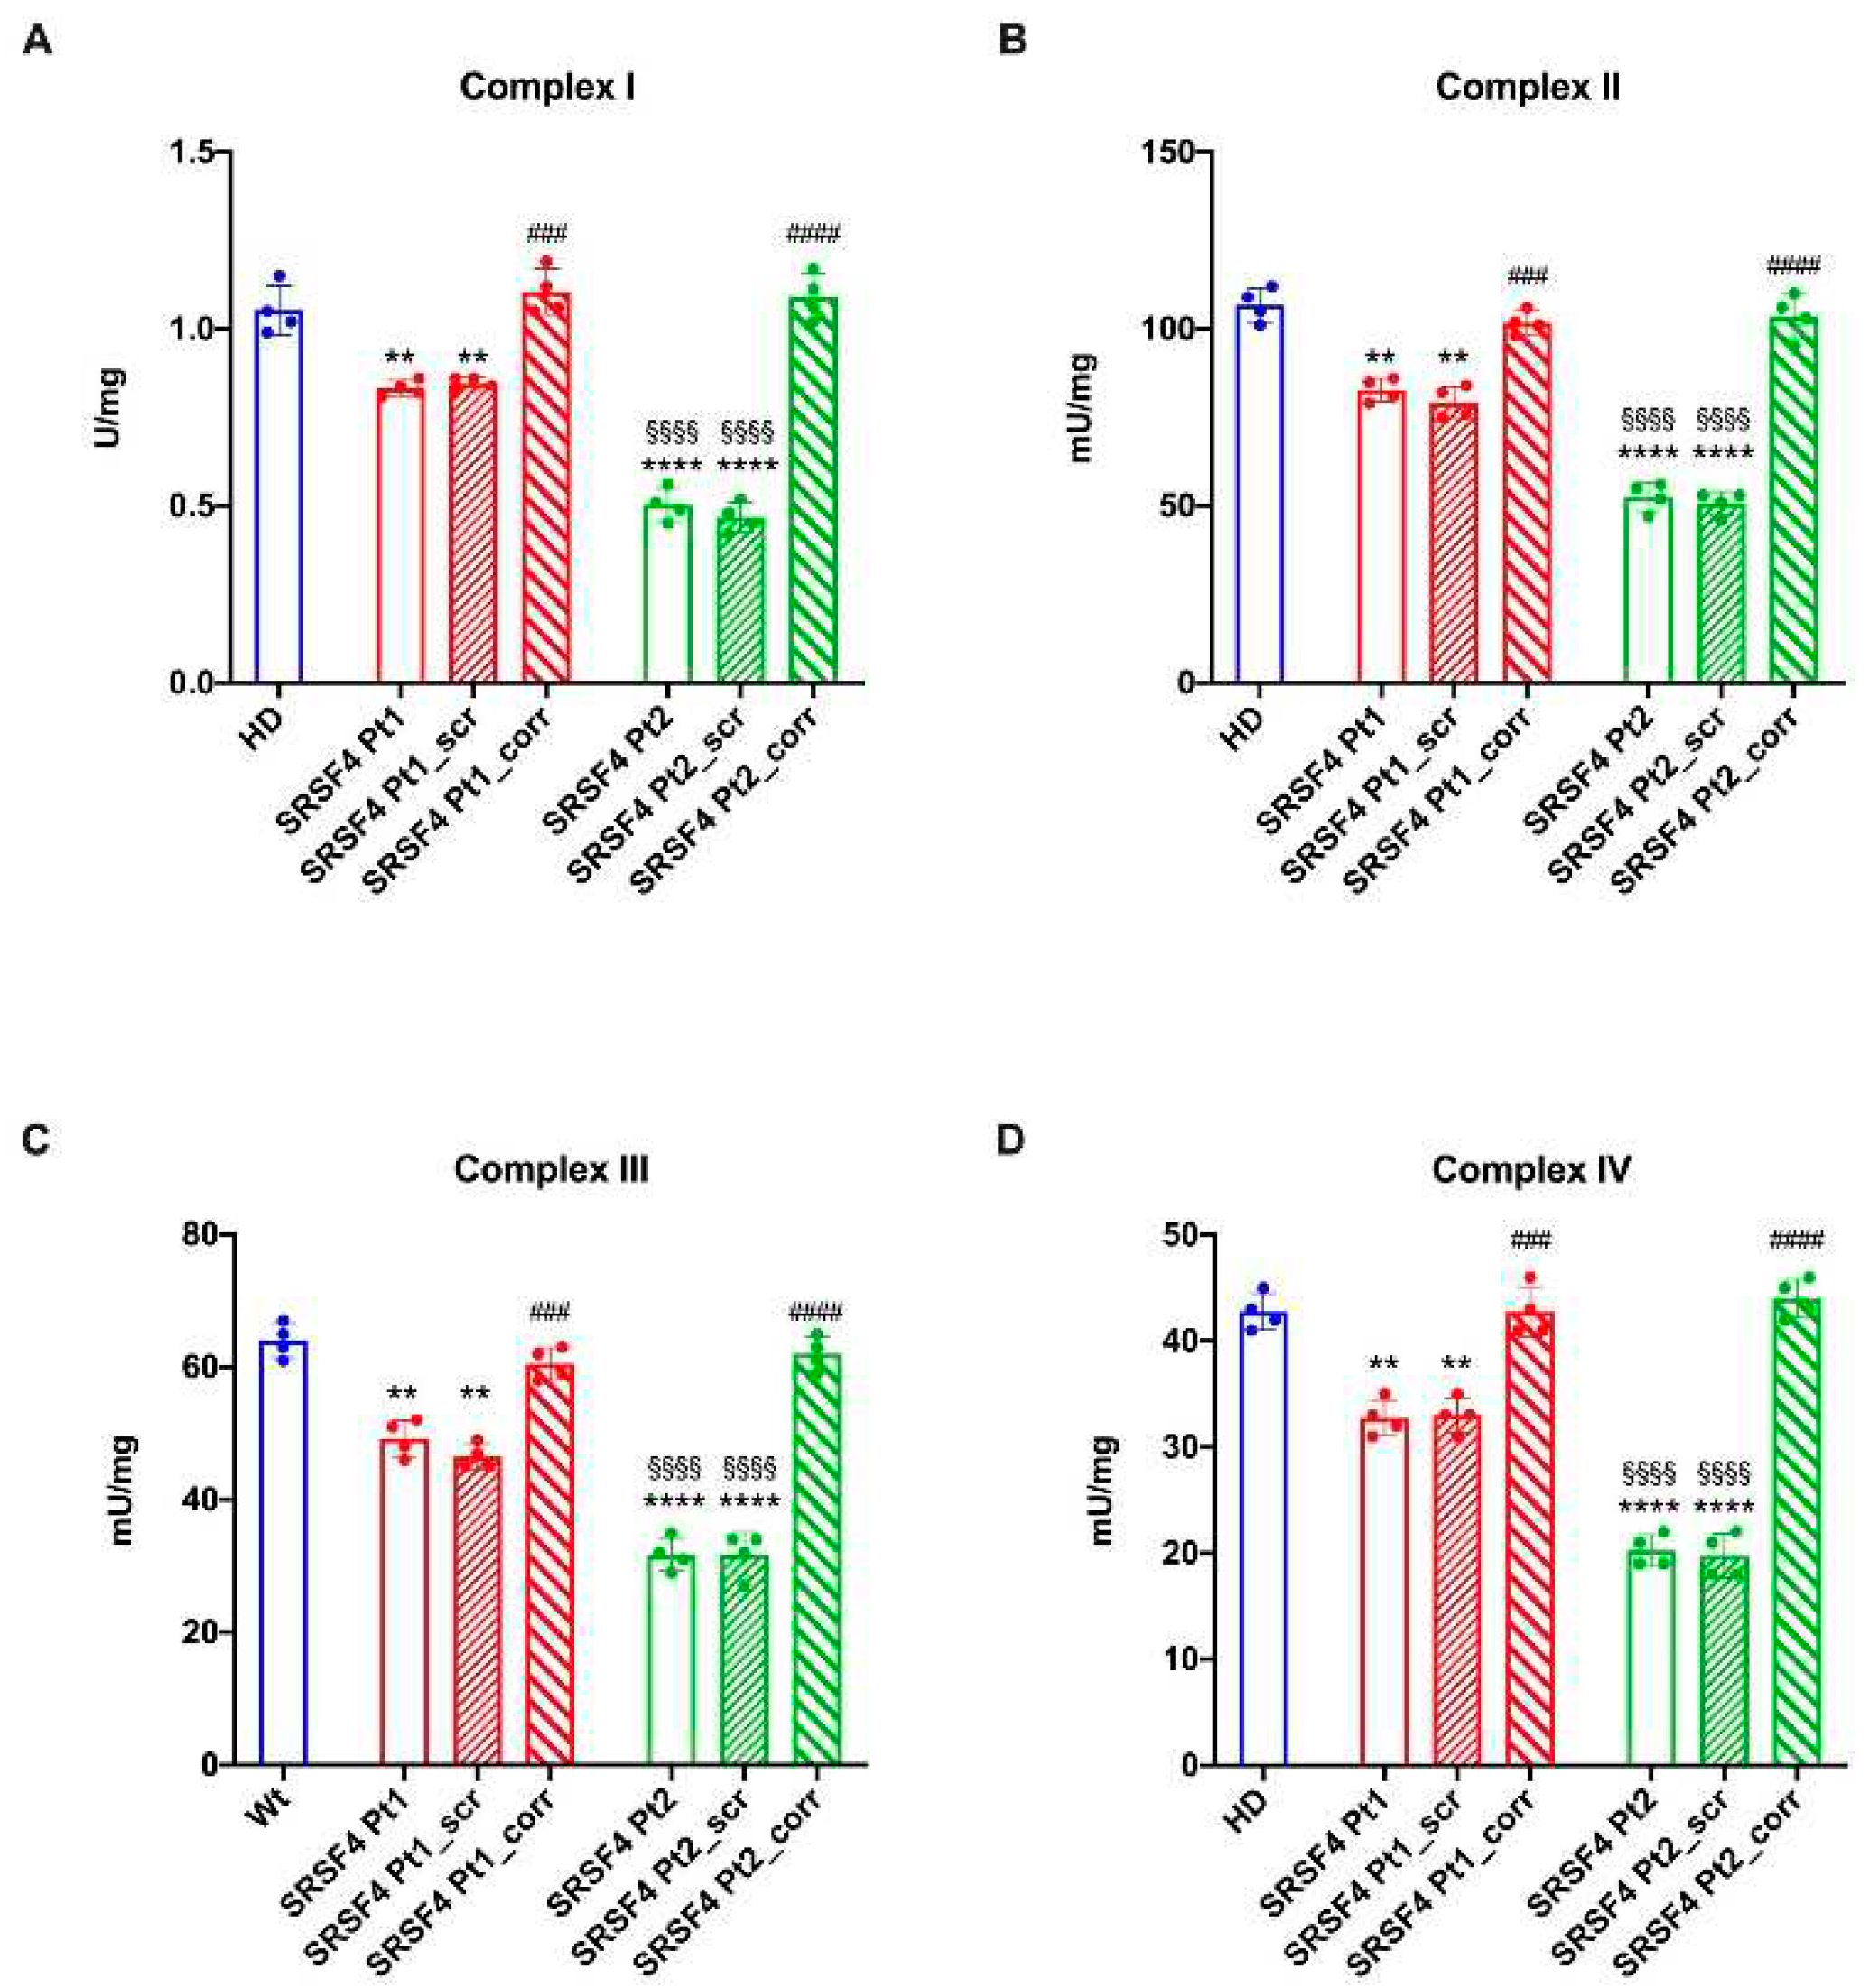
The cell lines derived from the eight-years-old patient and his mother affected by mild MF and leukopenia, respectively, show a mTOR hypo-phosphorylation, an altered dynamicity of the mitochondrial network, and an aerobic metabolism derangement. The active role of the SRSF4 mutated gene in these molecular dysfunctions is confirmed by both the observation that the severity of the alterations is inversely proportional to the SRSF4 protein expression and that the wild-type SRSF4 gene transfection in patients’ cells completely reverses all the dysfunctions. Moreover, defects in splicing machinery could induce alternative splicing in proteins that regulate epigenetics signals causing a different phenotype between mother and child [
26].
The dysfunctional OxPhos activity seems triggered by the unbalance between mitochondrial fusion and fission, which, in turn, could depend on the altered mTOR phosphorylation and CLUH expression, two proteins involved in the mitochondrial function regulation [
17,
18]. On the other hand, the phosphorylation of eukaryotic initial factor 4E-binding protein (eIF4E-BP) by mTOR induces mRNA translation of several genes that control mitochondrial activity and biogenesis, including the balance between fusion and fission dynamics [
27,
28]. Moreover, cells depleted for CLUH show clustering of the mitochondrial network near the nucleus, ultrastructural abnormalities, and deficiencies in the enzymatic activities of respiratory complexes and Krebs cycle enzymes. CLUH also regulates the expression of several proteins involved in the mitochondrial fusion and fission processes [
29], which, in turn, influence OxPhos activity and efficiency [
30]. In fact, aerobic metabolism is most efficient when single mitochondria are organized in a network [
29] that follows the course of the endoplasmic reticulum. Conversely, an imbalance towards mitochondrial fission, as observed in our patients’ models due to the high DRP1 expression, results in a decreased capacity to synthesize ATP and increased production of reactive oxygen species [
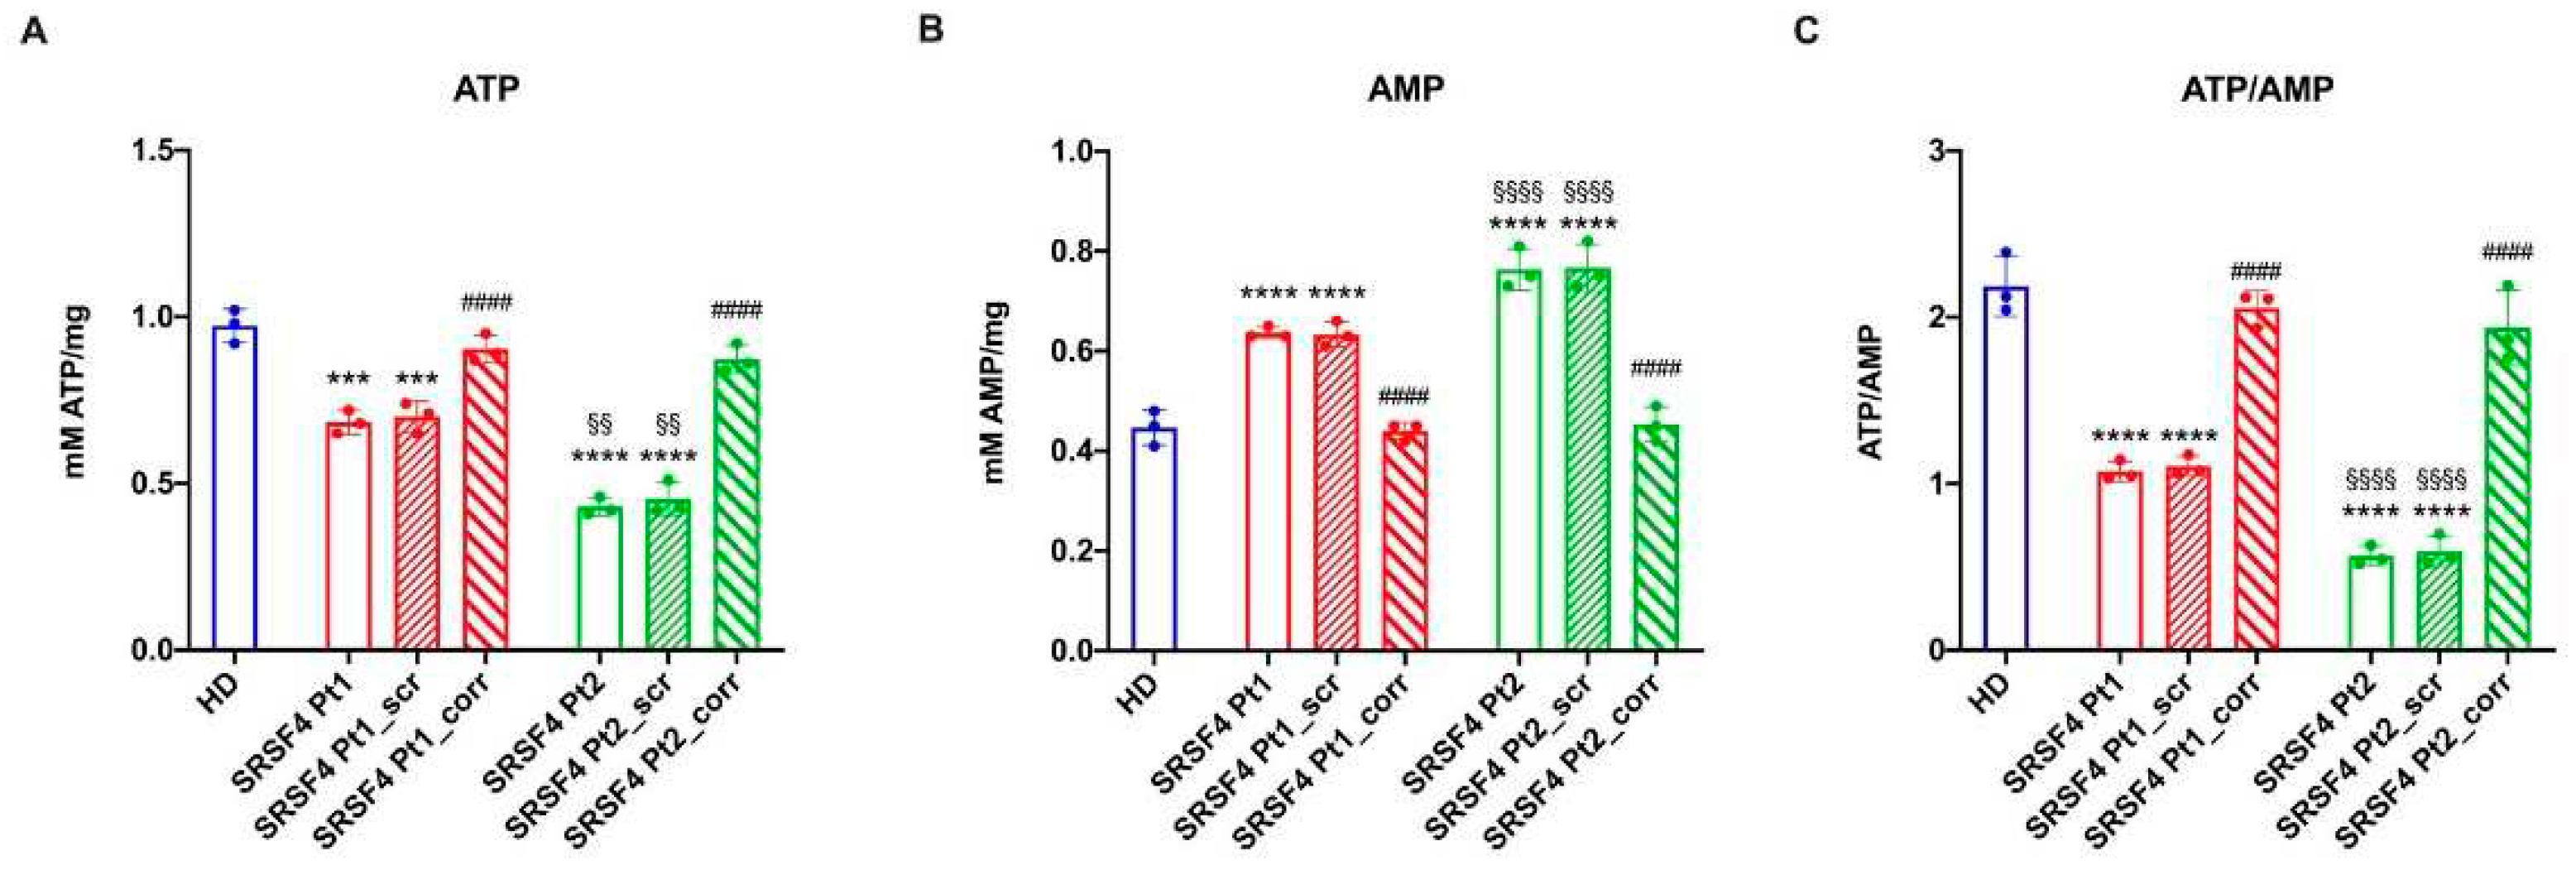
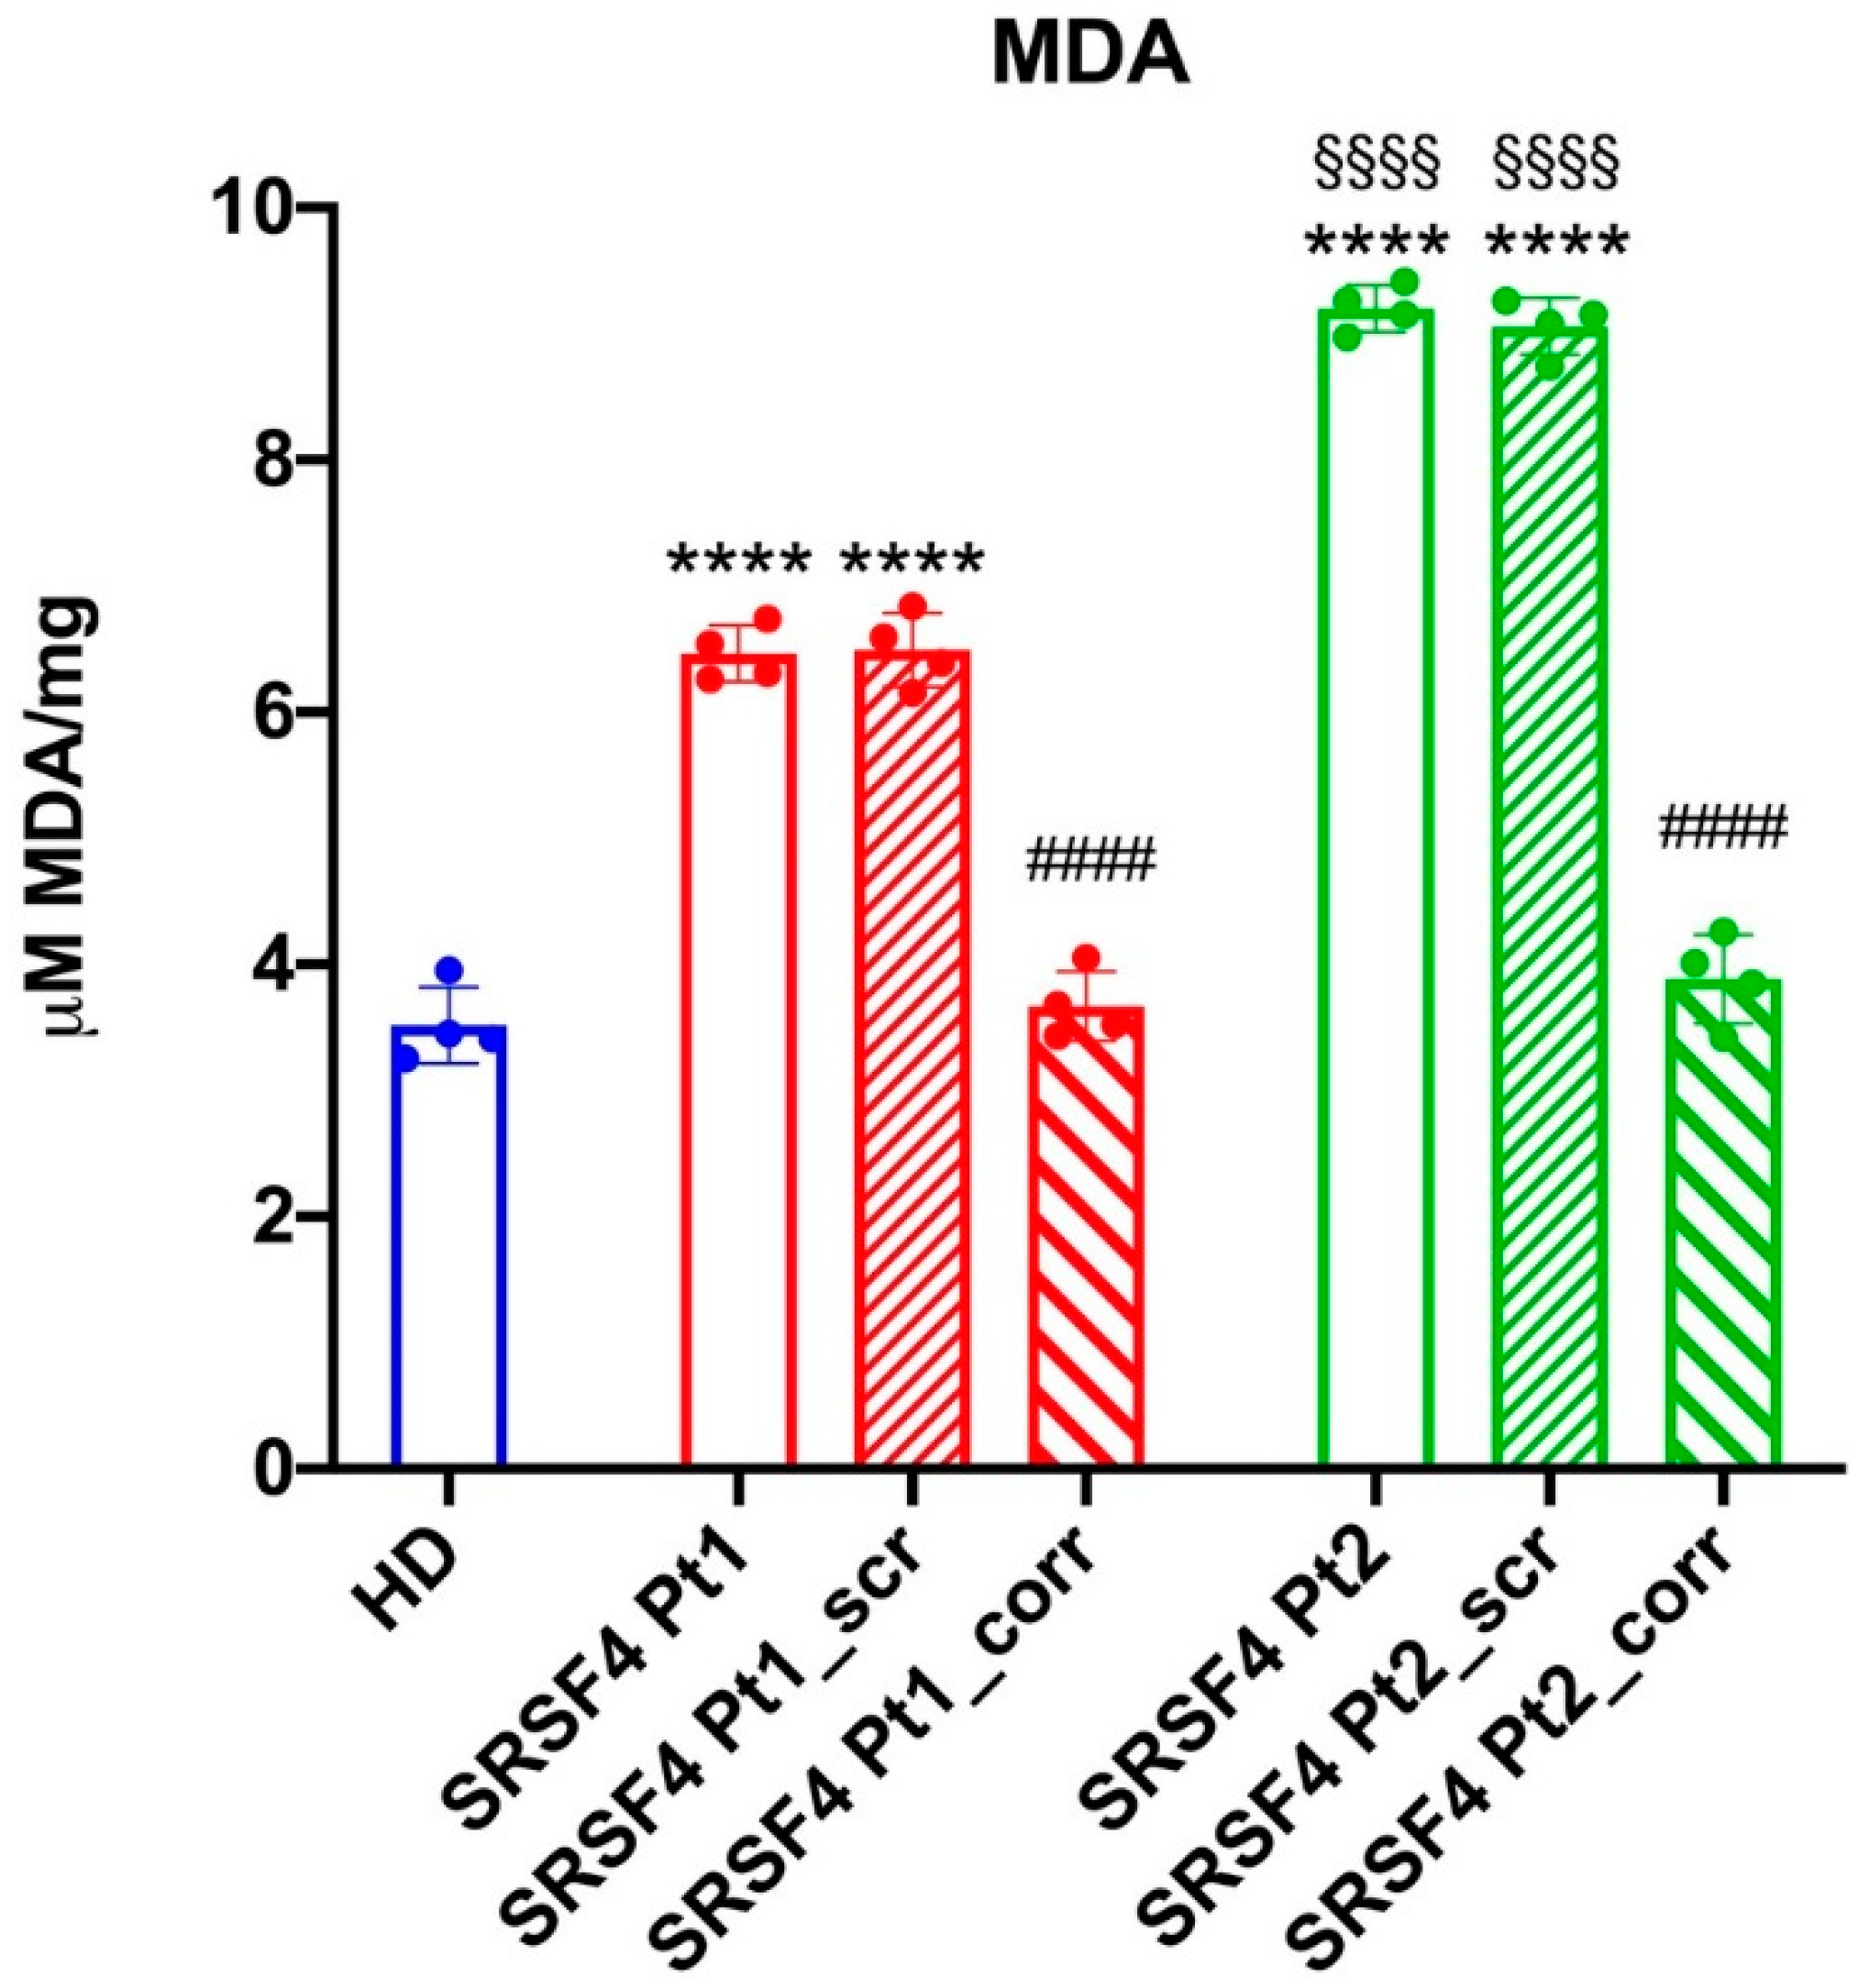
31]. In fact, both cell lines show a lower energy status compared to the HD and corrected cells and an increased accumulation of peroxided lipids.
Interestingly, mitochondria dysfunction has already been shown after loss of SRSF6 [
7] and has also been reported in other cMF syndromes (Pearson, FA, SDS) [
9,
10,
11]. Therefore, it may be speculated that the SRSF4 related mitochondria and mTOR defects may contribute to marrow failure observed in the two reported patients.
Indeed mitochondrial function is critical in HSC maintenance, self-renew and differentiation[
32]. Ansò et al. demonstrated that impaired oxidative phosphorylation modifies DNA in HSCs and progenitors and that this alters the expression of proteins involved in HSC renewal and differentiation [
33]. In addition an impaired OxPhos by reducing beta oxidation, may negatively affect in self-renewal and asymmetric division of HSC [
29] and thus differentiation.
In conclusion, this study shows that the described variant of the SRSF4 gene causes a reduced protein expression that leads to the impairment of mitochondria biogenesis and dynamic. Although we do not have a direct relation between this genetic defect and bone marrow failure, our results support the hypothesis that the SRSF4 mutation could substantially contribute to the clinical phenotype observed in our patients.
Author Contributions
Conceptualization, E.C., S.R. and M.M.; methodology, E.C., N.B. and S.R.; software, P.U. and D.V.; validation, E.C., S.R. and S.RE.; formal analysis, G.D., M.R. and S.R.; investigation, A.G., S.RE., M.L., M.LA., F.G., N.B., F.C., I.C. and S.R.; resources, C.D., M.M. and S.R.; data curation, E.C. and S.R.; clinical data curation and followed the patients F.F., E.P., L.A. and MC.G.; writing—original draft preparation, E.C., S.R. and M.M.; writing—review and editing, E.C., S.R., G.D. and M.M.; visualization, S.R.; supervision, C.D.; project administration, M.M.; funding acquisition, M.M.
Funding
This research was supported by Grant 5XMILR19 to MM, by Italian Ministry of Health “Ricerca Finalizzata” (grant number RF-2018-12366314) to IC, and Italian Ministry of Health “Ricerca corrente 2023” to the Haematology Unit of IRCCS Istituto Giannina Gaslini.
Acknowledgments
We acknowledge ERG S.p.A., Rimorchiatori Riuniti (Genoa), Cambiaso Risso Marine (Genoa), Saar Depositi Oleari Portuali (Genoa), ONLUS Nicola Ferrari for supporting the activity of Hematology Unit of IRCCS Istituto Giannina Gaslini.
Conflicts of Interest
The authors declare no conflict of interest.
References
- Fioredda, F.; Rotulo, G.A.; Farruggia, P.; Dagliano, F.; Pillon, M.; Trizzino, A.; Notarangelo, L.; Luti, L.; Lanza, T.; Terranova, P.; et al. Late-onset and long-lasting autoimmune neutropenia: an analysis from the Italian Neutropenia Registry. Blood Adv. 2020, 4, 5644–5649. [Google Scholar] [CrossRef] [PubMed]
- Chianucci, B.; Grossi, A.; Dell'Orso, G.; Palmisani, E.; Lanciotti, M.; Terranova, P.; Pierri, F.; Lupia, M.; Arcuri, L.; Laurino, M.; et al. Autoimmune Neutropenia and Immune-Dysregulation in a Patient Carrying a TINF2 Variant. Int. J. Mol. Sci. 2022, 23, 14535. [Google Scholar] [CrossRef] [PubMed]
- Miano M, Grossi A, Dell’Orso G, et al. Genetic screening of children with marrow failure. The role of primary Immunodeficiencies. American journal of hematology [Epub ahead of print]. [CrossRef]
- Kim, E.; Ilagan, J.O.; Liang, Y.; Daubner, G.M.; Lee, S.C.W.; Ramakrishnan, A.; Li, Y.; Chung, Y.R.; Micol, J.-B.; Murphy, M.E.; et al. SRSF2 Mutations Contribute to Myelodysplasia by Mutant-Specific Effects on Exon Recognition. Cancer Cell 2015, 27, 617–630. [Google Scholar] [CrossRef] [PubMed]
- Jang HN, Liu Y, Choi N, et al. Binding of SRSF4 to a novel enhancer modulates splicing of exon 6 of Fas pre-mRNA. Biochemical and Biophysical Research Communications 2018;506(3):703–708. [CrossRef]
- Lucena-Araujo, A.R.; A Santana-Lemos, B.; Thome, C.H.; A Ferreira, G.; Ruggero, D.; Faça, V.M.; Rego, E.M. Early Hematopoietic Progenitors of Dkc1 Hypomorphic Mutant Mice Display Decreased Proliferation Rate and an Impaired Control of Serine/Arginine-Rich Splicing Factor 4 (Srsf4) Translation. Blood 2014, 124, 2937. [Google Scholar] [CrossRef]
- Wagner AR, Weindel CG, West KO, Scott HM, Watson RO, Patrick KL. SRSF6 balances mitochondrial-driven innate immune outcomes through alternative splicing of BAX. eLife;11. [CrossRef]
- Filippi, M.-D.; Ghaffari, S. Mitochondria in the maintenance of hematopoietic stem cells: new perspectives and opportunities. Blood 2019, 133, 1943–1952. [Google Scholar] [CrossRef] [PubMed]
- Cappelli, E.; Cuccarolo, P.; Stroppiana, G.; Miano, M.; Bottega, R.; Cossu, V.; Degan, P.; Ravera, S. Defects in mitochondrial energetic function compels Fanconi Anaemia cells to glycolytic metabolism. Biochim. et Biophys. Acta (BBA) - Mol. Basis Dis. 2017, 1863, 1214–1221. [Google Scholar] [CrossRef] [PubMed]
- Cappelli, E.; Degan, P.; Bruno, S.; Pierri, F.; Miano, M.; Raggi, F.; Farruggia, P.; Mecucci, C.; Crescenzi, B.; Naim, V.; et al. The passage from bone marrow niche to bloodstream triggers the metabolic impairment in Fanconi Anemia mononuclear cells. Redox Biol. 2020, 36, 101618. [Google Scholar] [CrossRef]
- Ravera, S.; Dufour, C.; Cesaro, S.; Bottega, R.; Faleschini, M.; Cuccarolo, P.; Corsolini, F.; Usai, C.; Columbaro, M.; Cipolli, M.; et al. Evaluation of energy metabolism and calcium homeostasis in cells affected by Shwachman-Diamond syndrome. Sci. Rep. 2016, 6, 25441. [Google Scholar] [CrossRef] [PubMed]
- Grossi, A.; Miano, M.; Lanciotti, M.; Fioredda, F.; Guardo, D.; Palmisani, E.; Terranova, P.; Santamaria, G.; Caroli, F.; Caorsi, R.; et al. Targeted NGS Yields Plentiful Ultra-Rare Variants in Inborn Errors of Immunity Patients. Genes 2021, 12, 1299. [Google Scholar] [CrossRef]
- Hinkle, P.C. P/O ratios of mitochondrial oxidative phosphorylation. Biochimica et Biophysica Acta (BBA) - Bioenergetics 2005;1706(1–2):1–11. [CrossRef]
- Ravera, S.; Podestà, M.; Sabatini, F.; Dagnino, M.; Cilloni, D.; Fiorini, S.; Barla, A.; Frassoni, F. Discrete Changes in Glucose Metabolism Define Aging. Sci. Rep. 2019, 9, 10347. [Google Scholar] [CrossRef]
- Colla, R.; Izzotti, A.; De Ciucis, C.; Fenoglio, D.; Ravera, S.; Speciale, A.; Ricciarelli, R.; Furfaro, A.L.; Pulliero, A.; Passalacqua, M.; et al. Glutathione-mediated antioxidant response and aerobic metabolism: two crucial factors involved in determining the multi-drug resistance of high-risk neuroblastoma. Oncotarget 2016, 7, 70715–70737. [Google Scholar] [CrossRef] [PubMed]
- Manley, J.L.; Krainer, A.R. A rational nomenclature for serine/arginine-rich protein splicing factors (SR proteins): Table 1. Genes Dev. 2010, 24, 1073–1074. [Google Scholar] [CrossRef] [PubMed]
- Morita, M.; Gravel, S.-P.; Hulea, L.; Larsson, O.; Pollak, M.; St-Pierre, J.; Topisirovic, I. mTOR coordinates protein synthesis, mitochondrial activity and proliferation. Cell Cycle 2015, 14, 473–480. [Google Scholar] [CrossRef] [PubMed]
- Gao, J.; Schatton, D.; Martinelli, P.; Hansen, H.; Pla-Martin, D.; Barth, E.; Becker, C.; Altmueller, J.; Frommolt, P.; Sardiello, M.; et al. CLUH regulates mitochondrial biogenesis by binding mRNAs of nuclear-encoded mitochondrial proteins. J. Cell Biol. 2014, 207, 213–223. [Google Scholar] [CrossRef] [PubMed]
- Dell’orso, G.; Grossi, A.; Penco, F.; Caorsi, R.; Palmisani, E.; Terranova, P.; Schena, F.; Lupia, M.; Ricci, E.; Montalto, S.; et al. Case Report: Deficiency of Adenosine Deaminase 2 Presenting With Overlapping Features of Autoimmune Lymphoproliferative Syndrome and Bone Marrow Failure. Front. Immunol. 2021, 12, 12754029. [Google Scholar] [CrossRef] [PubMed]
- Sahoo SS, Kozyra EJ, Wlodarski MW. Germline predisposition in myeloid neoplasms: Unique genetic and clinical features of GATA2 deficiency and SAMD9/SAMD9L syndromes. Best Practice & Research Clinical Haematology 2020;33(3):101197. [CrossRef]
- Meyts, I.; Aksentijevich, I. Deficiency of Adenosine Deaminase 2 (DADA2): Updates on the Phenotype, Genetics, Pathogenesis, and Treatment. J. Clin. Immunol. 2018, 38, 569–578. [Google Scholar] [CrossRef] [PubMed]
- Ganapathi, K.A.; Townsley, D.M.; Hsu, A.P.; Arthur, D.C.; Zerbe, C.S.; Cuellar-Rodriguez, J.; Hickstein, D.D.; Rosenzweig, S.D.; Braylan, R.C.; Young, N.S.; et al. GATA2 deficiency-associated bone marrow disorder differs from idiopathic aplastic anemia. Blood 2015, 125, 56–70. [Google Scholar] [CrossRef] [PubMed]
- Yoshida M, Tanase-Nakao K, Shima H, et al. Prevalence of germline GATA2 and SAMD9/9L variants in paediatric haematological disorders with monosomy 7. Br J Haematol 2020;191(5):835–843. [CrossRef]
- Dufour, C.; Miano, M.; Fioredda, F. Old and new faces of neutropenia in children. Haematologica 2016, 101, 789–791. [Google Scholar] [CrossRef] [PubMed]
- Miano M, Cappelli E, Pezzulla A, et al. FAS-mediated apoptosis impairment in patients with ALPS/ALPS-like phenotype carrying variants on CASP10 gene. Br J Haematol. 2019;187(4):502-508. [CrossRef]
- Gimeno-Valiente F, López-Rodas G, Castillo J, Franco L. Alternative Splicing, EpigeneticModifications and Cancer: A Dangerous Triangle, or a Hopeful One? Cancers 2022;14(3):560. [CrossRef]
- Morita, M.; Prudent, J.; Basu, K.; Goyon, V.; Katsumura, S.; Hulea, L.; Pearl, D.; Siddiqui, N.; Strack, S.; McGuirk, S.; et al. mTOR Controls Mitochondrial Dynamics and Cell Survival via MTFP1. Mol. Cell 2017, 67, 922–935.e5. [Google Scholar] [CrossRef]
- Morita, M.; Gravel, S.-P.; Chénard, V.; Sikström, K.; Zheng, L.; Alain, T.; Gandin, V.; Avizonis, D.; Arguello, M.; Zakaria, C.; et al. mTORC1 Controls Mitochondrial Activity and Biogenesis through 4E-BP-Dependent Translational Regulation. Cell Metab. 2013, 18, 698–711. [Google Scholar] [CrossRef]
- Ravera, S.; Podesta, M.; Sabatini, F.; Fresia, C.; Columbaro, M.; Bruno, S.; Fulcheri, E.; Ramenghi, L.A.; Frassoni, F. Mesenchymal stem cells from preterm to term newborns undergo a significant switch from anaerobic glycolysis to the oxidative phosphorylation. Cell. Mol. Life Sci. 2018, 75, 889–903. [Google Scholar] [CrossRef] [PubMed]
- Westermann, B. Bioenergetic role of mitochondrial fusion and fission. Biochimica et Biophysica Acta (BBA) - Bioenergetics 2012;1817(10):1833–1838. [CrossRef]
- Marchi S, Patergnani S, Pinton P. The endoplasmic reticulum–mitochondria connection: One touch, multiple functions. Biochimica et Biophysica Acta (BBA) - Bioenergetics 2014;1837(4):461–469. [CrossRef]
- Nasr, W.; Filippi, M.-D. Acquired and hereditary bone marrow failure: A mitochondrial perspective. Front. Oncol. 2022, 12, 1048746. [Google Scholar] [CrossRef] [PubMed]
- Ansó, E.; Weinberg, S.E.; Diebold, L.P.; Thompson, B.J.; Malinge, S.; Schumacker, P.T.; Liu, X.; Zhang, Y.; Shao, Z.; Steadman, M.; et al. The mitochondrial respiratory chain is essential for haematopoietic stem cell function. Nature 2017, 19, 614–625. [Google Scholar] [CrossRef] [PubMed]
|
Disclaimer/Publisher’s Note: The statements, opinions and data contained in all publications are solely those of the individual author(s) and contributor(s) and not of MDPI and/or the editor(s). MDPI and/or the editor(s) disclaim responsibility for any injury to people or property resulting from any ideas, methods, instructions or products referred to in the content. |
© 2023 by the authors. Licensee MDPI, Basel, Switzerland. This article is an open access article distributed under the terms and conditions of the Creative Commons Attribution (CC BY) license (http://creativecommons.org/licenses/by/4.0/).
