Submitted:
13 December 2023
Posted:
14 December 2023
You are already at the latest version
Abstract
Keywords:
1. Introduction
2. Literature review
3. Methods


4. Case study
| Group of vehicles, i | Street network section, j | |||||
| i | types of vehicles | average number of passengers, Ni, people |
j=1, N-S |
j=2, S-N |
j=3, W-E |
j=4, E-W |
| 1 | passenger cars | 2 | 1171 | 913 | 1454 | 860 |
| 2 | minibuses | 15 | 2196 | 1712 | 2727 | 1613 |
| 3 | trucks | 1 | 20 | 15 | 24 | 14 |
| 4 | trams | 65 | 1903 | 1484 | 2363 | 1398 |
| Total | 5290 | 4125 | 6569 | 3886 | ||
| Group of vehicles, i | Street network section, j | ||||
| i | types of vehicles |
j=1, N-S |
j=2, S-N |
j=3, W-E |
j=4, E-W |
| 1 | passenger cars | 5.9381 | 4.6300 | 7.3739 | 4.3623 |
| 2 | minibuses | 1.1134 | 0.8681 | 1.3826 | 0.8179 |
| 3 | trucks | 0.3711 | 0.2894 | 0.4609 | 0.2726 |
| 4 | trams | 0 | 0 | 0 | 0 |
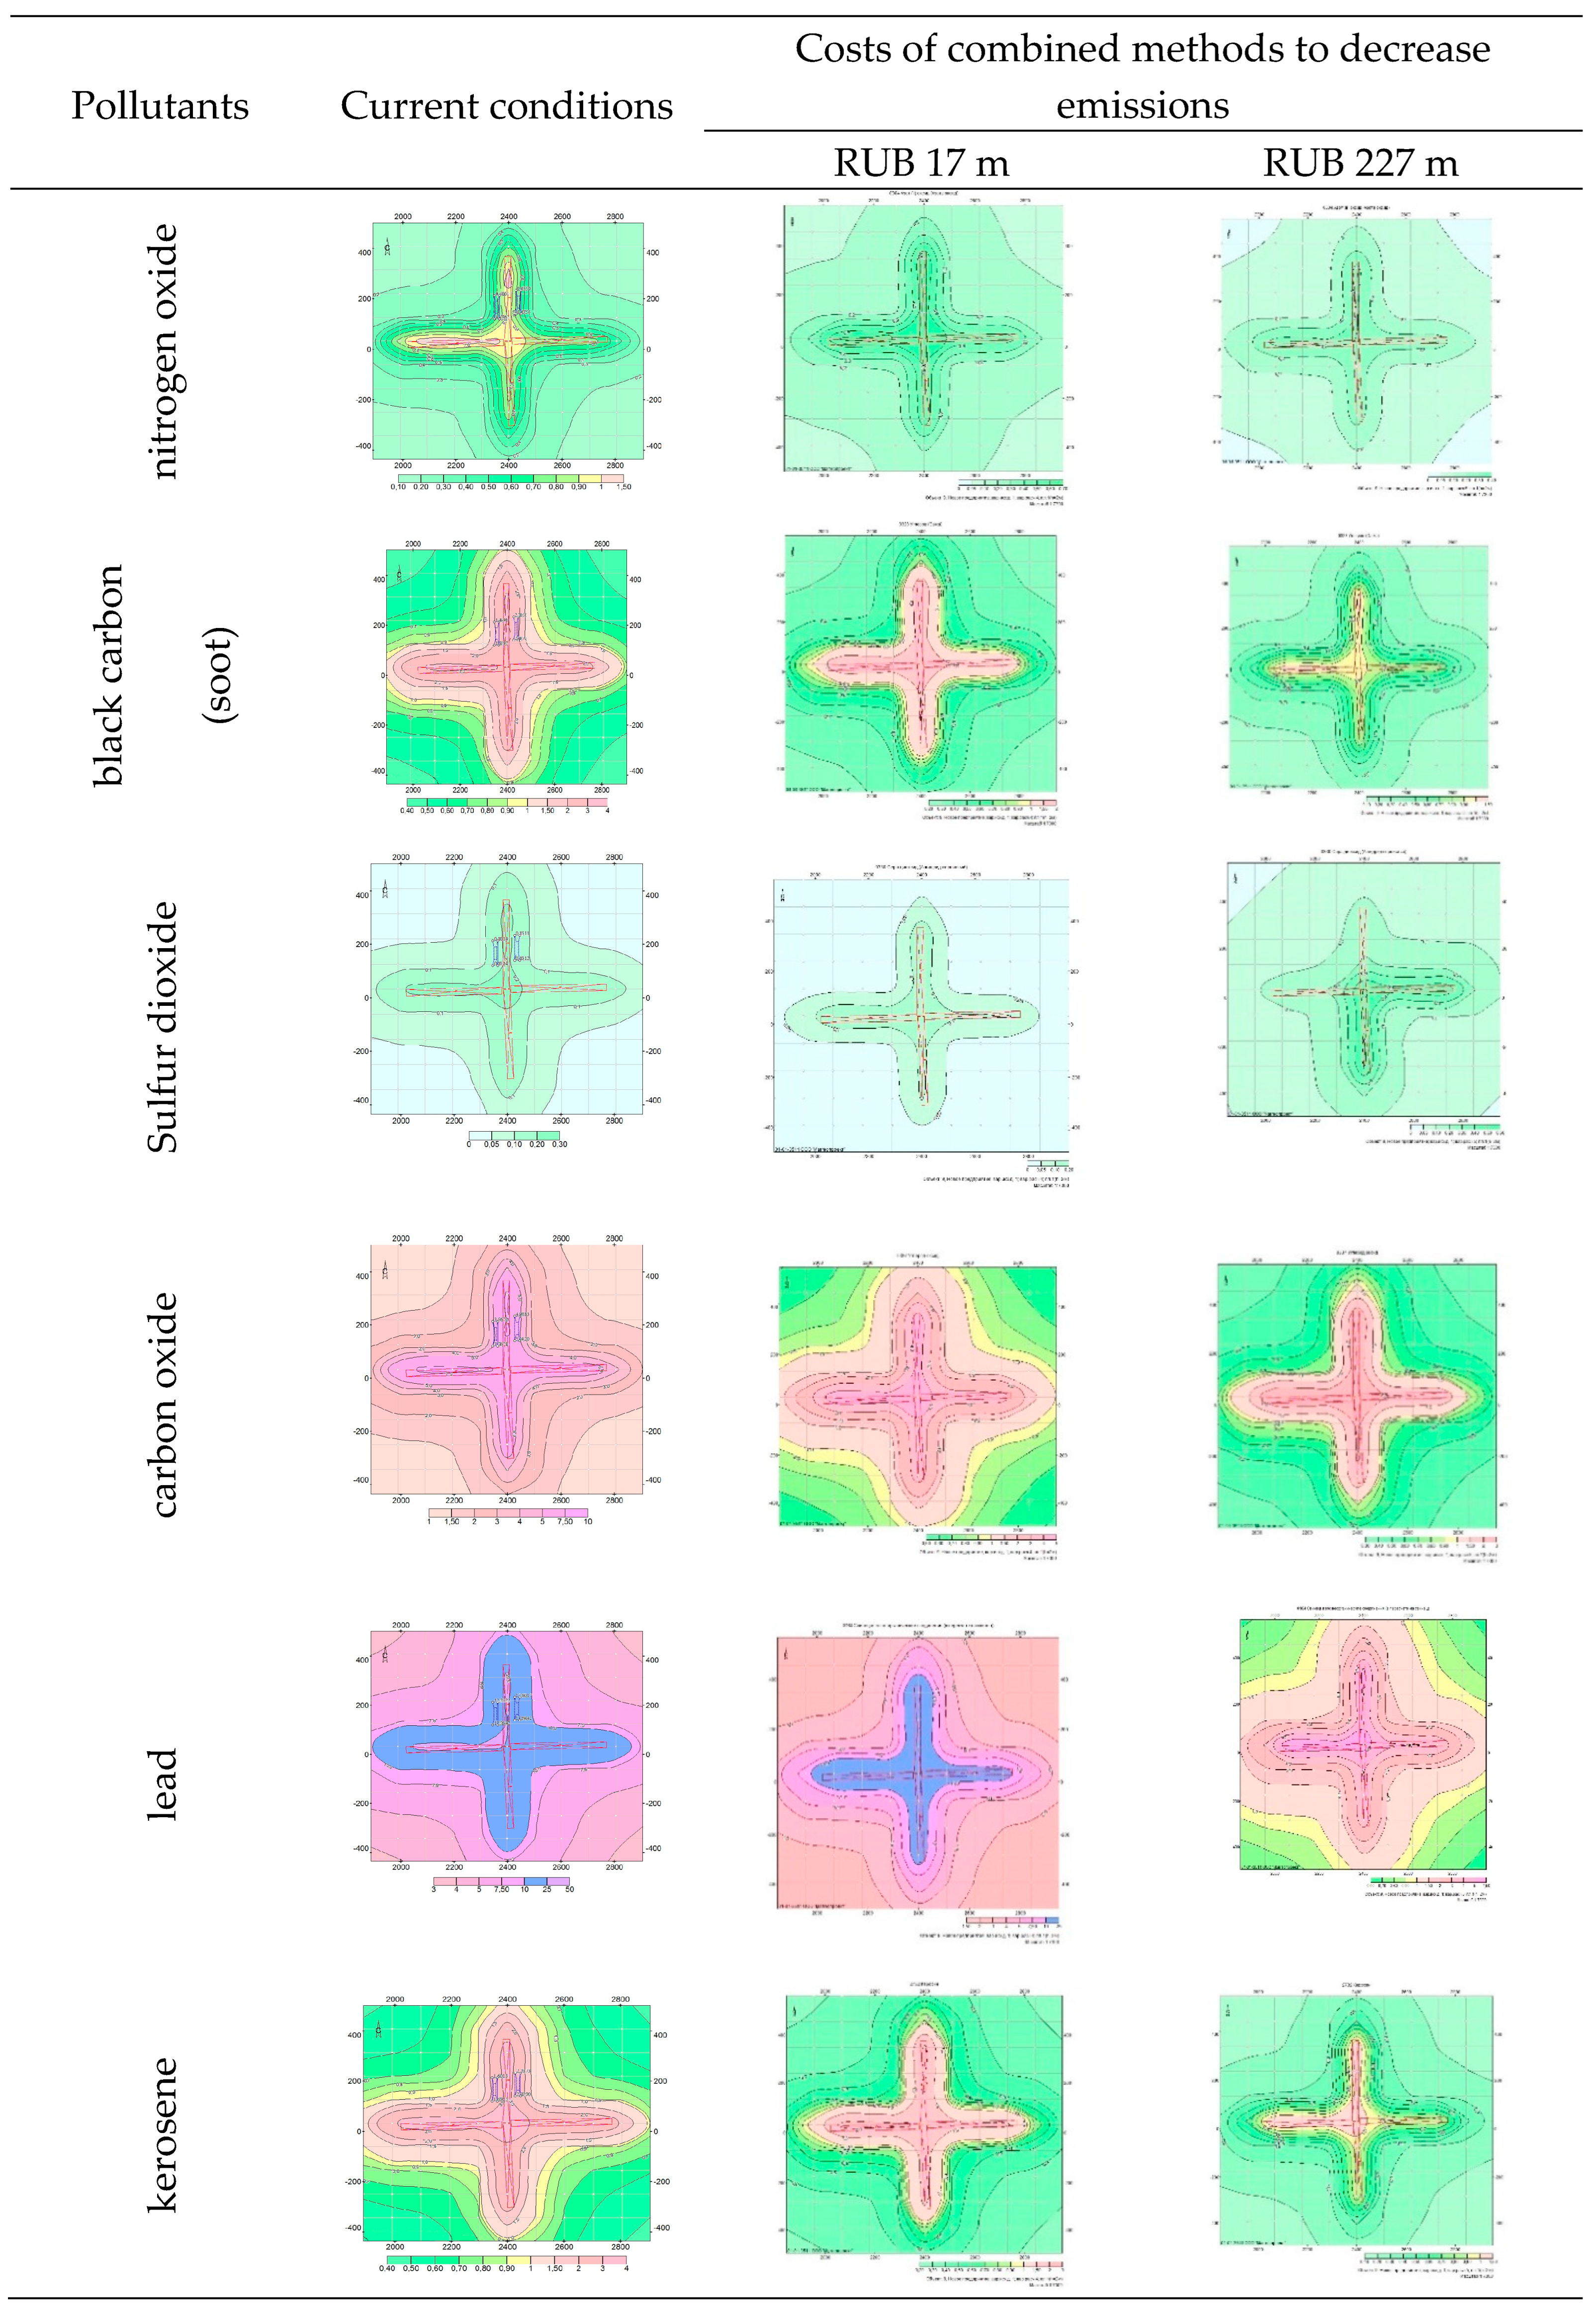 |
5. Conclusions
Author Contributions
Funding
Institutional Review Board Statement
Informed Consent Statement
Data Availability Statement
Conflicts of Interest
References
- The state report “On the state of the environment and environmental protection in Russian Federation in 2017”, Russian Federation ministry of natural resources and ecology. Moscow. 2018. 152 p.
- Trofimenko Y.V., Vorozhnin V.S. Method for environmental safety assessment of road users, Transport of the Urals,. 2015. № 1 (44). P. 73-78.
- The report “On the environmental situation in Chelyabinsk Region in 2017”. Chelyabinsk Region Ministry of Ecology. Chelyabinsk. 2018. 132 p.
- Pytaleva O. A., Fridrikhson O.V., Berdashkevich S.M. Justification for necessity to develop a set of activities to reduce vehicular air pollution in cities (on the example of Magnitogorsk), Ural industrialist. 2015. 1. 2015. №3 (3). P. 14-17.
- The state report “On the sanitary and epidemiologic well-being of population in Magnitogorsk in 2018”, Chelyabinsk Region Department of Russian Agency for Health and Consumer Rights in Magnitogorsk. Magnitogorsk. 2017. 106 p.
- Gladskikh V.I., Drobny O.F., Las’kov S.A., Cherchintsev V.D. Modernization of industrial and ecological safety systems at OJSC Magnitogorsk Iron and Steel Works as an obligatory condition for sustainable development, Vestnik of Nosov Magnitogorsk State Technical University. 2014. № 1(45). Р. 107-111.
- Maiorova T.V., Ponomareva O. S. Economic efficiency assessment methodology of metallurgical industry environmental management, Vestnik of Nosov Magnitogorsk State Technical University. 2015. № 4 (52). P. 112-116.
- Antropov V. A., Morozova E. N. Environmental management as a scientific sector of modern knowledge, Herald of the Ural State University of Railway Transport. 2015. № 1 (25). P. 56-62.
- Pytaleva O.A., Pytalev I.A. Transport system problems of Magnitogorsk, Modern problems of Russian transport complex. 2012. №2. P. 128-133.
- Kornilov S.N., Rakhmangulov A.N., Osintsev N.A., Cyganov A.V., Pytaleva O.A. Methodology for urban passenger transport route development (on the example of Magnitogorsk), Vestnik of Nosov Magnitogorsk State Technical University. 2011. №2. P. 49-58.
- Construction norms and regulations II-60-75. Planning and development of cities, villages and rural population centers, USSR State Committee for Construction. M.: USSR Central Institute of Model Design. 1985. 67 p.
- Bulaev V.G., Ryabukhin E. A. Identification of environmental aspects using Pareto and Ishikawa diagrams, Transport of the Urals. 2015. № 1 (44). P. 67-72.
- Kuznetsova E. Yu., Akulova А. А. Organization of the recycling in the Russian complex of automobile transport, Herald of the Ural State University of Railway Transport. 2015. № 4 (28). P. 81-90.
- Rakhmangulov A.N., Kornilov S.N., Pytaleva O.A. Safety and quality of passenger transport improvement in Magnitogorsk, Autotransportnoie predpriyatie 2009. №6. P. 41-44.
- Analytical Portal «TransSport». URL: http://transspot.ru/2013/03/05/skorost-avtomobilya-i-okruzhayushha ya-sreda-chast-2/?ocom=727http://mvf.klerk.ru/f1otchet/forma5_r7.htm (Access Date: 20.11.2021).
- The list and codes of air pollutants [Text]. SPb.: JSC “Scientific research institute Atmosphere”. 2012. 423 p.
- Bobrova Z.M., Somova YU.V., Somov V.A. Effects of industrial environment on people // Ural industrialist. 2015. №1 (1). P. 42-44.
- Rinku Roy Chowdhury, Kelli Larson, Morgan Grove, Colin Polsky, Elizabeth Cook, Jeffrey Onsted, Laura Ogden (2011). A Multi-Scalar Approach to Theorizing Socio-Ecological Dynamics of Urban Residential Landscapes. Cities and the Environment (CATE): Vol. 4: Iss. 1.
- Amudapuram Mohan Rao, Kalaga Ramachandra Rao. Measuring urban traffic congestion – a review, International Journal for Track and Transport Engineering, 2012, 2(4): 286 – 305.
- Adam Torok. Monte-Сarlo simulation of road transport emission. International Journal for Traffic and Transport Engineering, 2015, 5(3): 278 – 285. [CrossRef]
- Luka Novačko, Marjana Petrović, Danijela Barić. Application of macroscopic modelling in assessing noise level in urban areas. International Journal for Traffic and Transport Engineering, 2014, 4(1): 117 – 127. [CrossRef]
- Ljupko Šimunović, Davor Brčić, Huska Sadić. Choice of an optimal management strategy of transport demand using multi-criteria analysis: city of Zagreb case study. International Journal for Traffic and Transport Engineering, 2013, 3(1): 54 – 63. [CrossRef]
- Ádám Török. Investigation of road environment effects on choice of urban and interurban driving speed. International Journal for Traffic and Transport Engineering, 2011, 1(1): 1 – 9 p.
- Surendra Kukadapwar1, Dhananjay Parbat. Estimation of optimal path on urban road networks using AHP algorithm. International Journal for Traffic and Transport Engineering, 2016, 6(1): 13 – 24. [CrossRef]
- Md. Mahmud Hasan. Investigation of the effect of traffic parameters on road hazard using classification tree model. International Journal for Traffic and Transport Engineering, 2012, 2(3): 271 – 285.
- Giulio Materninia, Stefano Riccardia, Margherita Cadeia. Zero emission mobility systems in cities. inductive recharge system planning in urban areas. Eighth International Conference INPUT. Smart City - Planning for Energy, Transportation and Sustainability of the Urban System. Naples, 4-6 June 2014. 659-669.
- Davide Scannapieco, Vincenzo Naddeo, Vincenzo Belgiorno Trimestrale del Laboratorio, Territorio Mobilità e Ambiente. Dispersion models to forecast traffic-related emissions in urban areas. TeMALab. Vol 4 - No 3 - Settembre 2011 - p. 7-14.
- Jinjoo Bok, Youngsang Kwon. Comparable measures of accessibility to public transport using the general transit feed specification. Sustainability 2016, 8, 224-234. [CrossRef]
- Alok Bhushan Mukherjee, Nilanchal Patel, Akhouri Pramod Krishna. Development of heterogeneity index for assessment of relationship between land use pattern and traffic congestion. International Journal for Traffic and Transport Engineering, 2014, 4(4): 397 – 414.
- Y. Choi. The impact of satellite-adjusted NOx emissions on simulated NOx and O3 discrepancies in the urban and outflow areas of the Pacific and Lower Middle US Atmospheric Chemistry and Physics Atmos. Chem. Phys., 14, 675–690, 2014.
- Jianjun Wu, Xin Guo, Huijun Sun, Bo Wang. Topological effects and performance optimization in transportation continuous network design. Mathematical Problems in Engineering Volume 2014, Article ID 490483, 7 pages. [CrossRef]
- Michele Pezzagno, Marco Rosini. Smart City - Planning for Energy, Transportation and Sustainability of the Urban System. Eighth International Conference INPUT. Journal of Land Use, Mobility and Environment. Naples, 4-6 June 2014 817-828.
- Willem Salet. The quest for the regional city. New identities and institutional conditions in a context of metropolitan fragmentation. Geographica Helvetica Jg. 56 2001/Heft4 289-295. ISSN 0016-7312.
- Plakhotich S.А., Chemodanova К.Е. New technologies of population’s transport service in industrial and urban agglomeration // Herald of the Ural State University of Railway Transport. 2010. № 2. Р. 14-21.
- Pytaleva O.A., Pytalev I.A., Gridina YU.A. Prospects for establishing of a rapid passenger transport system in Magnitogorsk // Transport development in Russian regions: problems and prospects: Materials of II All-Russian academic and research conference with international participation. Branch of Moscow State Industrial University in Kirov, . / Edited by V.A Rozhina, V.M. Popov. Kirov. 2012. P. 68-72. 30 October.
- Study Guide on calculating, regulation and control of pollutant emissions into the atmospheric air (augmented and revised). SPb.: JSC “Scientific research institute Atmosphere”. 2012. 223 p.
- Unified program for air pollution control [Electronic resource]. URL: https://integral.ru/shop/cargo/372.html?yclid=3361483280743681847 (Access Date: 20.01.2021).
- The order of the Ministry of Natural Resources №273 dated 06.06.2017 “On the calculation method approval of harmful substance emission dispersion into the atmospheric air. URL: http://www.garant.ru/products/ipo/prime/doc/71642906/ (Access Date: 02.12.2021).
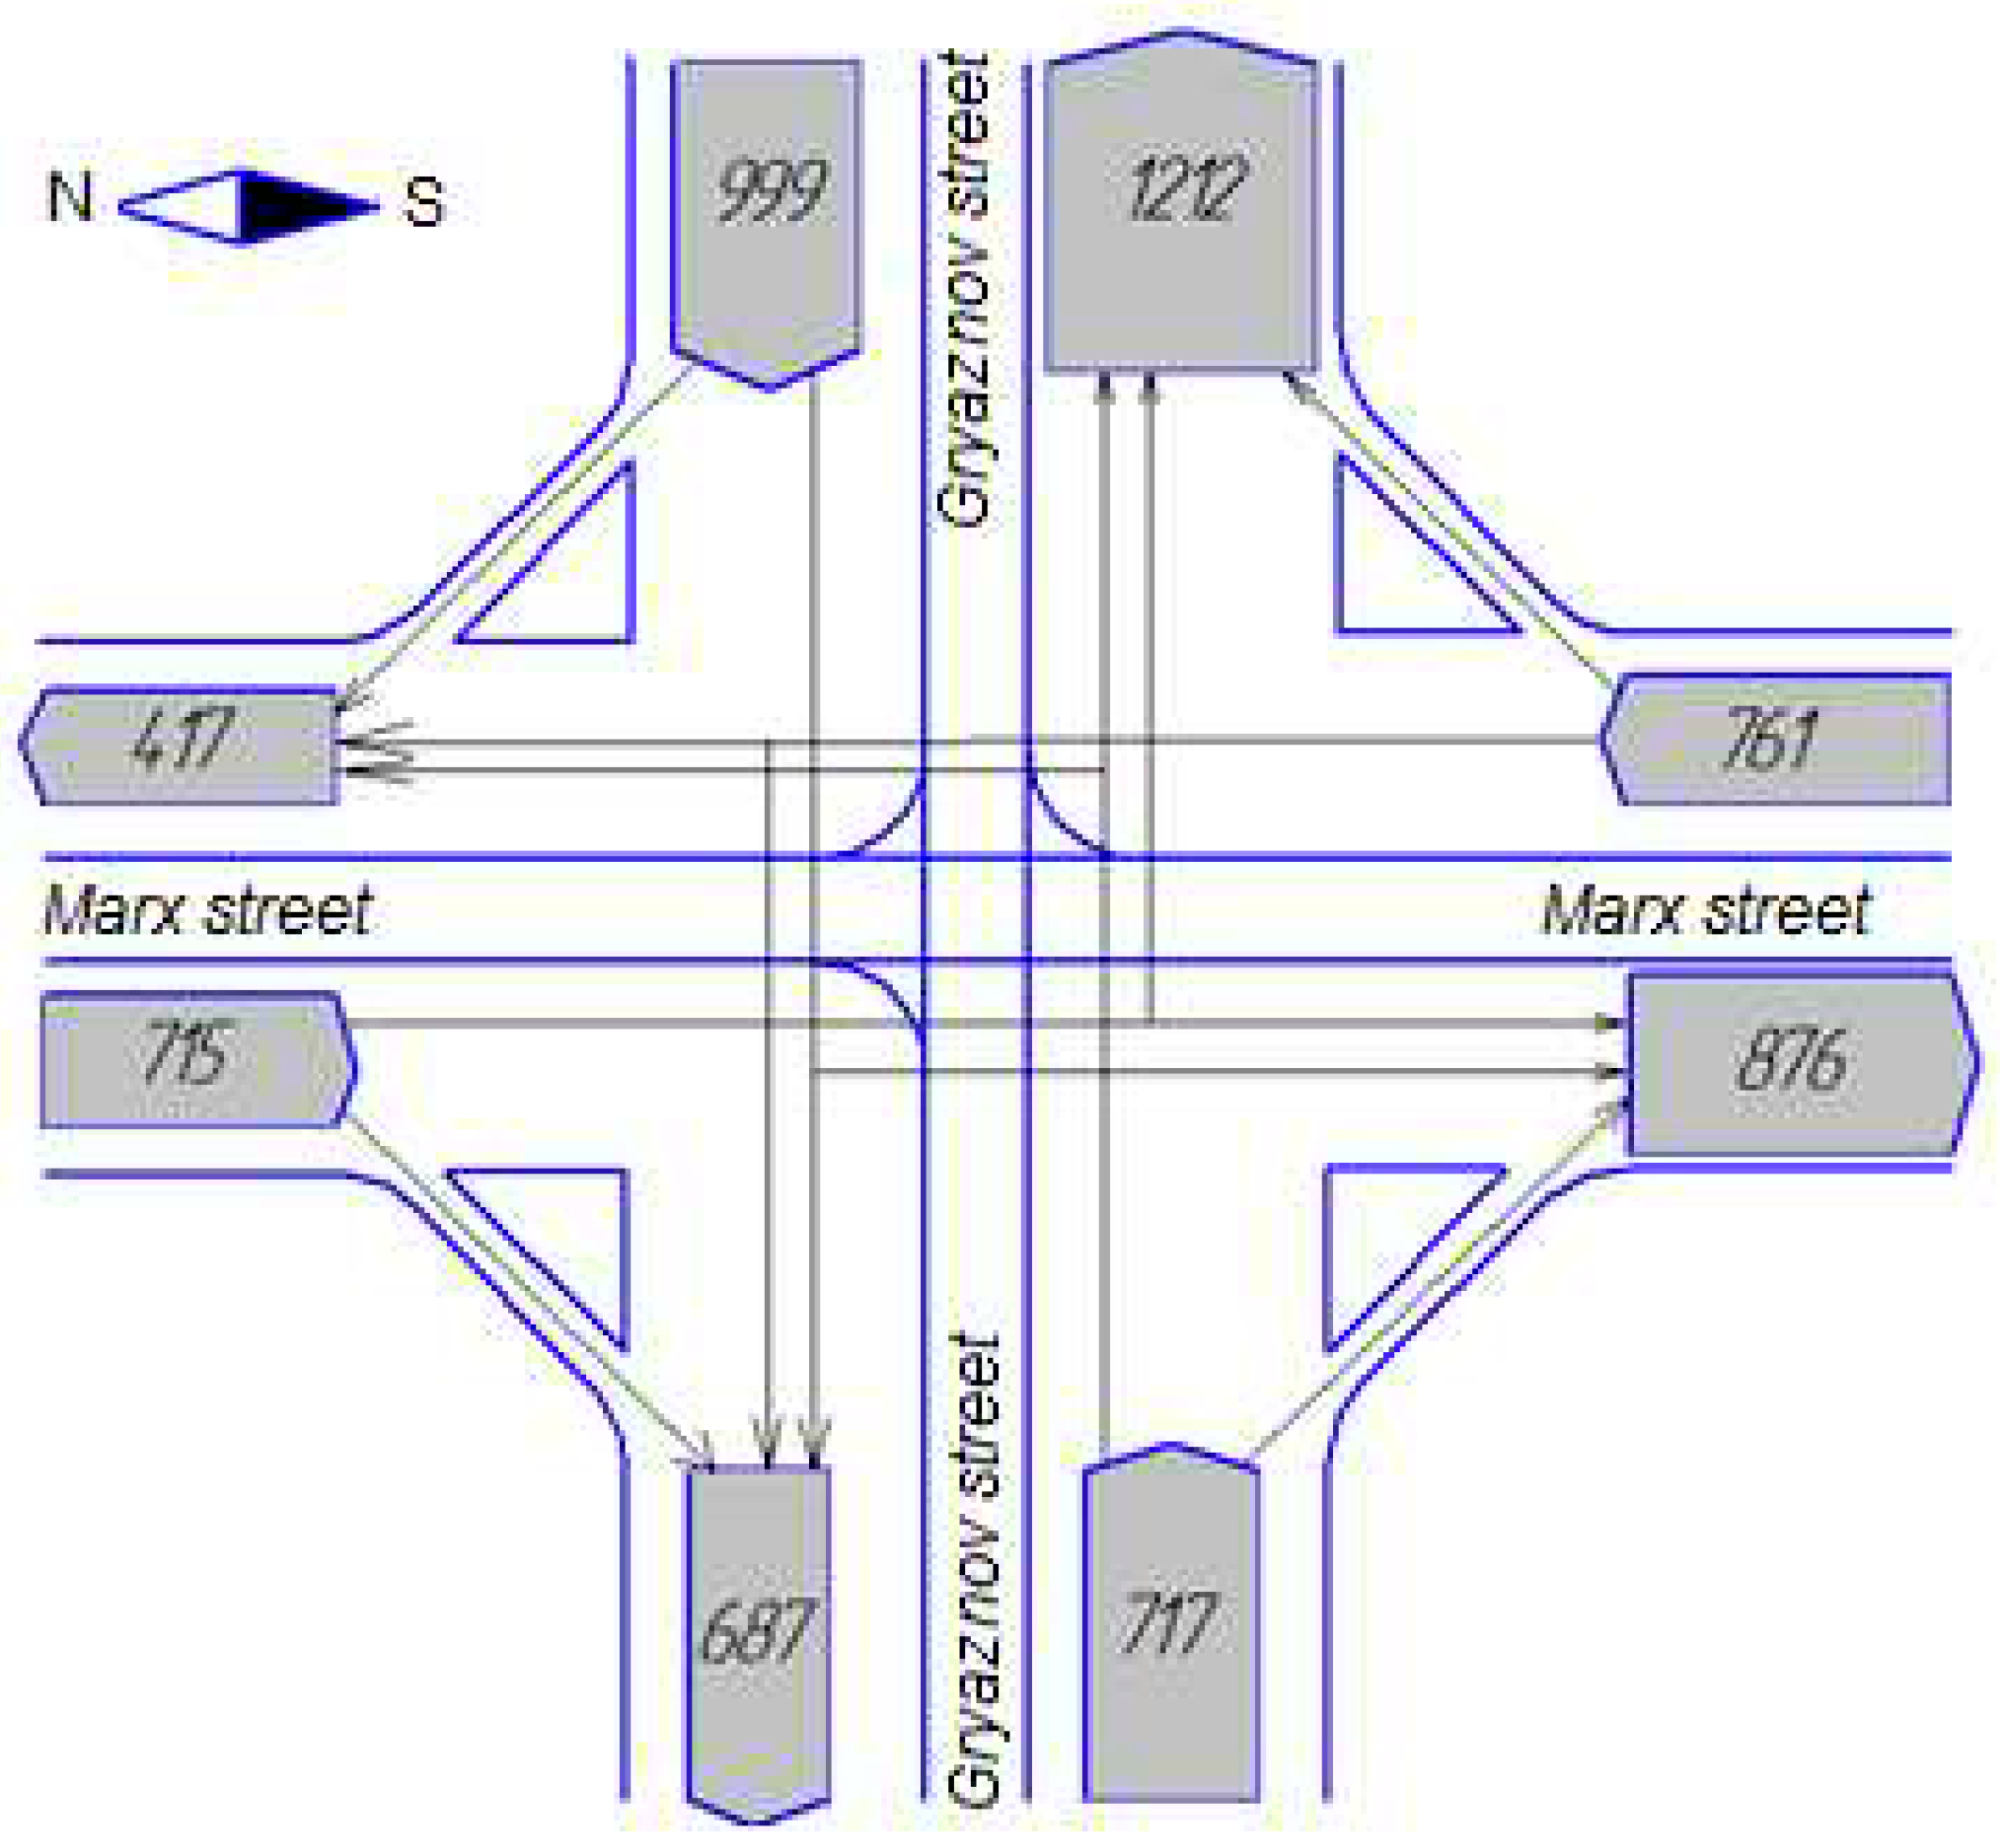
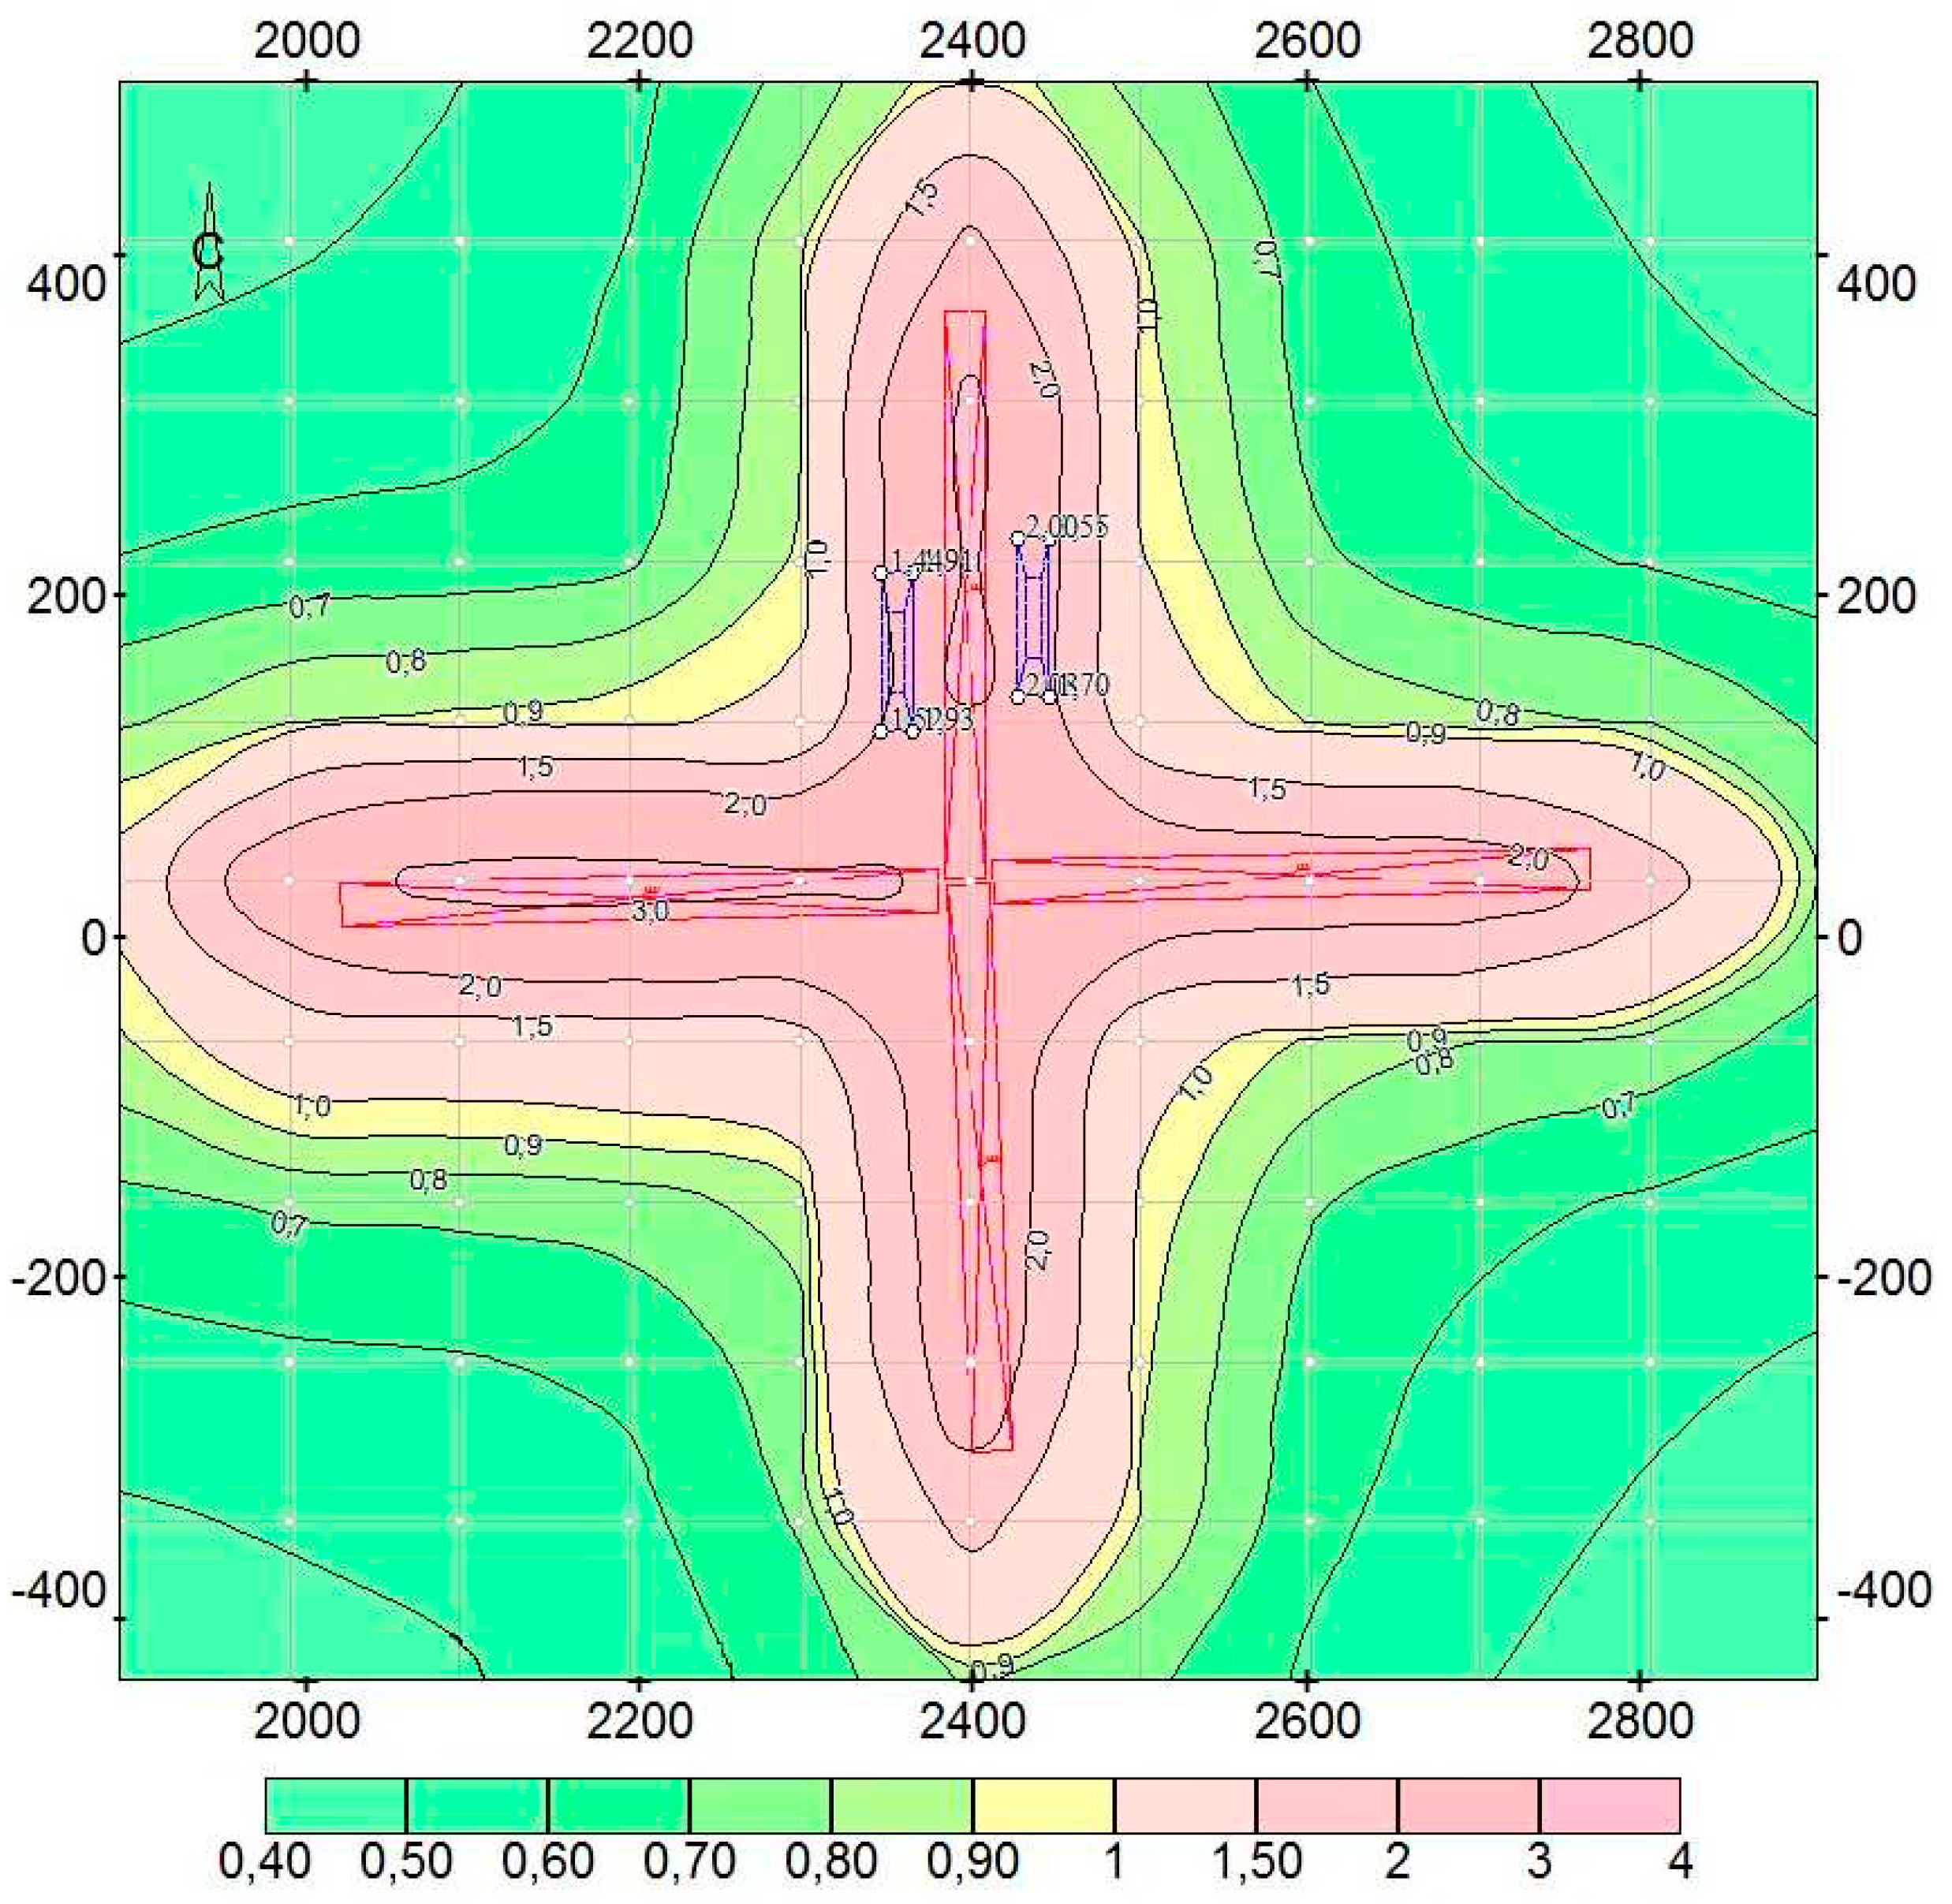
| Traffic direction, number of cars |
Pollutants | Specific emissions in various operation modes, g/min | Engine idling time, min | Emission reduction factor | Emission rate, g/s | |
|---|---|---|---|---|---|---|
| Marx street (north–south), 876 |
Carbon oxide | 3.1 | 4.5 | 10 | 0.9 | 11.35 |
| Nitrogen dioxide | 0.064 | 0.04 | 1 | 0.11 | ||
| Nitrogen oxide | 0.0104 | 0.0065 | 1 | 0.01 | ||
| Kerosene | 1.1 | 0.45 | 0.9 | 1.23 | ||
| Soot | 0.470 | 0.04 | 0.8 | 0.13 | ||
| Sulfur dioxide | 0.019 | 0.012 | 0.95 | 0.03 | ||
| Lead | 0.004 | 0.003 | 0.9 | 0.01 | ||
| Marx street (south–north), 761 |
Carbon oxide | 3.1 | 4.5 | 10 | 0.9 | 8.85 |
| Nitrogen dioxide | 0.064 | 0.04 | 1 | 0.09 | ||
| Nitrogen oxide | 0.0104 | 0.0065 | 1 | 0.01 | ||
| Kerosene | 1.1 | 0.45 | 0.9 | 0.96 | ||
| Soot | 0.470 | 0.04 | 0.8 | 0.11 | ||
| Sulfur dioxide | 0.019 | 0.012 | 0.95 | 0.03 | ||
| Lead | 0.004 | 0.003 | 0.9 | 0.01 | ||
| Gryaznov street (west–east), 1212 |
Carbon oxide | 3.1 | 4.5 | 10 | 0.9 | 14.10 |
| Nitrogen dioxide | 0.064 | 0.04 | 1 | 0.14 | ||
| Nitrogen oxide | 0.0104 | 0.0065 | 1 | 0.02 | ||
| Kerosene | 1.1 | 0.45 | 0.9 | 1.53 | ||
| Soot | 0.470 | 0.04 | 0.8 | 0.17 | ||
| Sulfur dioxide | 0.019 | 0.012 | 0.95 | 0.04 | ||
| Lead | 0.004 | 0.003 | 0.9 | 0.01 | ||
| Gryaznov street (east–west), 999 |
Carbon oxide | 3.1 | 4.5 | 10 | 0.9 | 8.34 |
| Nitrogen dioxide | 0.064 | 0.04 | 1 | 0.09 | ||
| Nitrogen oxide | 0.0104 | 0.0065 | 1 | 0.01 | ||
| Kerosene | 1.1 | 0.45 | 0.9 | 0.91 | ||
| Soot | 0.470 | 0.04 | 0.8 | 0.10 | ||
| Sulfur dioxide | 0.019 | 0.012 | 0.95 | 0.02 | ||
| Lead | 0.004 | 0.003 | 0.9 | 0.01 | ||
| Code | Pollutants | Applied criteria | Criterion value, mg/m3 | Hazard classes | Emission rate | |
|---|---|---|---|---|---|---|
| g/s | t/year | |||||
| 301 | Nitrogen (IV) oxide (nitrogen dioxide) | Maximum single MAC |
0.2 | 2 | 0.43 | 0.25 |
| 304 | Nitrogen (II) oxide (nitrogen oxide) | 0.4 | 3 | 0.07 | 0.04 | |
| 328 | Black carbon (soot) | 0.15 | 3 | 0.51 | 0.29 | |
| 330 | Sulfur dioxide | 0.5 | 3 | 0.12 | 0.07 | |
| 337 | Carbon oxide | 5 | 4 | 42.66 | 24.57 | |
| 184 | Lead | 0.001 | 1 | 0.02 | 0.01 | |
| 2732 | Kerosene | TSEL1 | 1.2 | 0 | 4.62 | 2.66 |
| Total pollutants: 8 | 48.47 | 27.92 | ||||
| Including solid pollutants: 2 | 0.54 | 0.31 | ||||
| Liquid/gaseous pollutants: 6 | 47.92 | 27.60 | ||||
| Substances | General biological effects, diseases, symptoms |
|---|---|
| Nitrogen (IV) oxide (nitrogen dioxide) | It has general toxic action, causes damage to the respiratory organs and mucous membranes (from mild irritation of mucous membranes of the eyes and the nose to pulmonary edema). It leads to a change in blood composition (reduces hemoglobin). It promotes central nervous system depression, hemolysis, bilirubinemia, dilates blood vessels, lowers blood pressure, and raises blood sugar. |
| Nitrogen (II) oxide (nitrogen oxide) | It stimulates sensitivity to broncho stenosis (narrowing the bronchial lumen). It entails negative pulmonary effects for people with respiratory diseases. It causes headaches, heart palpitations, drops in blood pressure. It triggers poisoning, indigestion, nausea, weakness. |
| Black carbon (soot) | It is an adsorbent of carcinogens. It contributes to skin cancer. It leads to chronic respiratory diseases, development of asthma, bronchitis, pulmonary emphysema. It accelerates development of occupational diseases (silicosis, asbestosis, etc.). |
| Sulfur dioxide | It has general toxic action. It causes constant headaches, cough, runny nose, sore throat, nausea, vomiting, leads to pulmonary edema, gives rise to development of malignant tumors. It promotes allergic reactions. |
| Carbon oxide | It triggers development of diseases of lungs and bronchi, mucous membranes of the eyes, the cardiovascular system, anemia, inactivates hemoglobin, causes oxygen deficiency of tissues, nervous system disorder, leads to necrosis of brain cells and damage to the central nervous system. Intoxication is accompanied by headache, dizziness, irritability, memory impairment. |
| Lead | It leads to metabolic disorders, inhibits enzyme activity, triggers mental retardation and chronic brain disease among children, replaces calcium in bones, causes biochemical disorders in the myocardium and leads to hyperexcitability, depression and irritability. It has a negative effect on reproductive ability. |
| Kerosene | It causes surface inflammation of skin with erythema, swelling, infiltration, inflammation of deep layers of skin and folliculitis, vesicular hand dermatitis. It has resorptive effect and is manifested as a decrease in blood pressure. In case of a long-term contact, it triggers asthenic syndrome, nosebleeds, headaches, blood disorder. |
| Group of methods | Method description | Efficiency factor of the k-th method used to decrease the concentration of air pollutant, Ek | Costs of implementation of the k-th method used to decease the concentration of pollutants on the j-th section of the city street network, RUB m, Cjk |
Feasibility of the k-th method on the j-th section, xk |
| Organizational methods | traffic flow control using modern computer systems of traffic light control and dynamic message signs; introduction of intelligent transport systems | 0.06 | 10 | 1 |
| one-lane traffic on urban areas with narrow roads | 0.02 | 0.1 | 0 | |
| traffic ban or limitation for heavy trucks on some sections of the street network | 0.02 | 0.1 | 1 | |
| organization of lanes allocated for city passenger transport | 0.03 | 20 | 1 | |
| organization of cycle paths to motivate citizens to stop using private cars | 0.04 | 0.2 | 1 | |
| ban on parking vehicles on traffic ways of roads and streets | 0.04 | 0.2 | 1 | |
| creation and development of the environmental education system to form environmental awareness and behavior | 0.07 | 10 | 1 | |
| development of the system of priorities for public transport, when limiting the use of private cars | 0.07 | 20 | 1 | |
| ban on access of cars to some parts of the city | 0.03 | 0.5 | 1 | |
| organization of routes for traffic flows bypassing residential areas | 0.06 | 50 | 1 | |
| Architectural and construction methods | construction of interchanges on different levels | 0.06 | 200 | 0 |
| construction of pedestrian overpasses and underpasses | 0.05 | 30 | 1 | |
| improvement of the street network to increase traffic flow movement steadiness: organization of circular motion; removal of narrow entrances and exits from motorways, etc. | 0.06 | 7 | 0 | |
| greening of residential areas | 0.03 | 5 | 1 | |
| improvement of the road surface quality | 0.02 | 5 | 1 | |
| construction of protective screens | 0.03 | 5 | 1 | |
| construction of intercept parking lots | 0.04 | 100 | 0 | |
| placing zones of attraction of passenger flows (shopping centers, stadiums, etc.) outside residential areas | 0.05 | 70 | 1 | |
| Engineering and technical methods | timely replacement of air filters | 0.01 | 100 | 0 |
| introduction of motors using compressed natural gas or electrical energy as a source of energy | 0.01 | 100 | 0 | |
| installation of exhaust gas neutralizers, filters | 0.02 | 10 | 0 | |
| use of fuel additives | 0.01 | 10 | 0 | |
| use of automated driving systems | 0.01 | 10 | 0 | |
| introduction of a car engine operation mode control system using the “stop and go” technology | 0.02 | 100 | 0 | |
| step-by-step replacement of vehicles equipped with internal combustion engines with electric cars or cars with an engine displacement of less than 1799 cc | 0.02 | 100 | 0 | |
| Regulatory methods | tougher requirements for a periodic technical condition inspection of vehicles using diagnostic tools to maintain ecological parameters of driven vehicles at an acceptable level | 0.02 | 100 | 0 |
| introduction of tougher uniform standards Euro 4 and Euro 5 for cars manufactured in the country | 0.03 | 100 | 0 | |
| tougher requirements for petroleum fuel quality | 0.04 | 100 | 0 | |
| ban on driving vehicles lower than the approved ecological class in the city area | 0.03 | 1 | 1 |
Disclaimer/Publisher’s Note: The statements, opinions and data contained in all publications are solely those of the individual author(s) and contributor(s) and not of MDPI and/or the editor(s). MDPI and/or the editor(s) disclaim responsibility for any injury to people or property resulting from any ideas, methods, instructions or products referred to in the content. |
© 2023 by the authors. Licensee MDPI, Basel, Switzerland. This article is an open access article distributed under the terms and conditions of the Creative Commons Attribution (CC BY) license (http://creativecommons.org/licenses/by/4.0/).


