Preprint
Article

Entropy of Difference

Altmetrics

Downloads

62

Views

18

Comments

0

A peer-reviewed article of this preprint also exists.

This version is not peer-reviewed

Submitted:

24 November 2023

Posted:

14 December 2023

You are already at the latest version

Alerts
Abstract
{Here, we propose a new tool to estimate the complexity of a time series: the entropy of difference (ED). The method is based solely on the sign of the difference between neighbouring values in a time series. This makes it possible to describe the signal as efficiently as prior proposed parameters such as permutation entropy (PE) or modified permutation entropy (mPE), but (1) reduces the size of the sample that is necessary to estimate the parameter value, and (2) enables the use of the Kullback-Leibler divergence to estimate the "distance" between the time series data and random signals.
Keywords: 
Subject: Computer Science and Mathematics  -   Applied Mathematics

1. Introduction

Permutation entropy (PE), introduced by Bandt and Pompe [1], as well as its modified version [2], are both efficient tools to measure the complexity of chaotic time series. Both methods propose to analyze time series: X = ( x 1 , x 2 , x k ) by first choosing an embedding dimension m to split the original data in a subset of m-tuples: ( ( x 1 , x 2 x m ) , ( x 2 , x 3 , x 1 + m ) , ) , then to substitute to the m-tuples values by the rank of the values, resulting in a new symbolic representation of the time series. For example, consider the time series X = ( 0.2 , 0.1 , 0.6 , 0.4 , 0.1 , 0.2 , 0.4 , 0.8 , 0.5 , 1 . , 0.3 , 0.1 , ) . Choosing, for example, an embedding dimension m = 4 , will split the data in a set of 4-tuples: X 4 = ( ( 0.2 , 0.1 , 0.6 , 0.4 ) , ( 0.1 , 0.6 , 0.4 , 0.1 ) , ( 0.6 , 0.4 , 0.1 , 0.2 ) , ) . The Bandt-Pompe method will associate the rank of the value with each 4-tuples. Thus, in ( 0.2 , 0.1 , 0.6 , 0.4 ) the lowest element 0.1 is in position 2, the second element 0.2 is in position 1, 0.4 is in position 4 and finally 0.6 is in position 3. Thus the 4-tuple ( 0.2 , 0.1 , 0.6 , 0.4 ) is rewritten as ( 2 , 1 , 4 , 3 ) . This procedure thus results in each X 4 to be rewritten as a symbolic list: ( ( 2 , 1 , 4 , 3 ) , ( 1 , 4 , 3 , 2 ) , ( 3 , 4 , 2 , 1 ) ) . Each element is then a permutation π of the set ( 1 , 2 , 3 , 4 ) . Next, the probability of each permutation π in X m is then computed: p m ( π ) , and finally the PE for the embedding dimension m, is defined as PE m ( X ) = π p m ( π ) log ( p m ( π ) ) . The modified permutation entropy (mPE) just deals with those cases in which equal quantities may appear in the m-tuples. For example for the m-tuple ( 0.1 , 0.6 , 0.4 , 0.1 ) , computing PE will produce ( 1 , 4 , 3 , 2 ) while computing mPE will associate ( 1 , 1 , 3 , 2 ) . Both methods are widely used due to their conceptual and computational simplicity [3,4,5,6,7,8]. For random signals, PE leads to a constant probability q m ( π ) = 1 / m ! (for white Gaussian noise), which does not make it possible to evaluate the “distance" between the probability found in the signal: p m ( π ) and the probability produced by a random signal: q m , with the Kullback-Leibler (KL) divergence [9,10]: KL m ( p q ) = π p m ( π ) log 2 ( p m ( π ) / q m ( π ) ) . Furthermore, the number K m of m-tuples are m ! for PE and even greater for mPE [2], thus requiring then a large data sample to perform significant statistical estimation of p m .

2. Entropy of difference-method

The entropy of difference (ED) method proposes to substitute to the m-tuples with strings s containing the sign (“+" or “-"), representing of the difference between subsequent elements in the m-tuples. For the same X 4 : ( ( 0.2 , 0.1 , 0.6 , 0.4 ) , ( 0.1 , 0.6 , 0.4 , 0.1 ) , ( 0.6 , 0.4 , 0.1 , 0.2 ) , ) this leads to the representation: ( ` ` + " , ` ` + " , ` ` + " , ) . For an m value, we have 2 m 1 strings s from ` ` + + + + " to ` ` " . Again we compute, in the time series, the probability distribution q m ( s ) of these strings s and define the entropy of difference of order m as: ED m = s q m ( s ) log 2 q m ( s ) . The number of elements: K m to be treated, for an embedding m, are smaller for ED compared with the number of permutations π in PE or to the elements in mPE (see Table 1).
Furthermore the probability distribution for a string s, in a random signal: q m ( s ) is not constant and could be computed through the recursive equation. Indeed let’s P ( X t = x ) = p ( x ) be the probability density for the signal variable X t at time t, and let’s F ( x ) the corresponding cumulative distribution function ( F ( x ) = x p ( x ) d x ). Let’s make the hypothesis that the signal is not correlated in time, which means that the join probability is just the product of probability: P ( X t 1 = x 1 , X t 2 = x 2 ) = P ( X = x 1 ) P ( X = x 2 ) . Under these conditions, we can easily evaluate the q m ( s ) . For example for m = 3 , we have 4 probabilities: q 3 ( + , + ) , q 3 ( + , ) , q 3 ( , + ) and q 3 ( , ) . These give respectively:
q 3 ( + , + ) = d x 1 d x 2 d x 3 p ( x 1 ) p ( x 2 ) p ( x 3 ) θ ( x 3 x 2 ) θ ( x 2 x 1 ) = d x 3 p ( x 3 ) x 3 d x 2 p ( x 2 ) x 2 d x 1 p ( x 1 ) = d x 3 p ( x 3 ) x 3 d x 2 p ( x 2 ) F ( x 2 ) = d x 3 p ( x 3 ) 1 2 F ( x 3 ) 2 = 1 6
and
q 3 ( + , ) = d x 1 d x 2 d x 3 p ( x 1 ) p ( x 2 ) p ( x 3 ) θ ( x 3 x 2 ) θ ( x 1 x 2 ) = d x 2 d x 3 p ( x 2 ) p ( x 3 ) θ ( x 3 x 2 ) q 3 ( + , + ) = d x 3 p ( x 3 ) F ( x 3 ) 1 6 = d x 3 F ( x 3 ) F ( x 3 ) 1 6 = 1 2 1 6 = 2 6
This result is totally independent of the probability density p ( x ) provided that the signal is not correlated in time. We can proceed in the same way for any q m ( s ) and thus obtain a recurrence on the q m ( s )  1 (in the following equations x and y are strings made of “+" and “-"):
q 2 ( + ) = q 2 ( ) = 1 2 q m + 1 ( + , + , + , , + m ) = 1 ( m + 1 ) ! q m + 1 ( , x ) = q m ( x ) q m + 1 ( + , x ) q m + 1 ( x , ) = q m ( x ) q m + 1 ( x , + ) q m + 1 ( x , , y ) = q a + 1 ( x ) q b + 1 ( y ) q m + 1 ( x , + , y ) with a + b + 1 = m
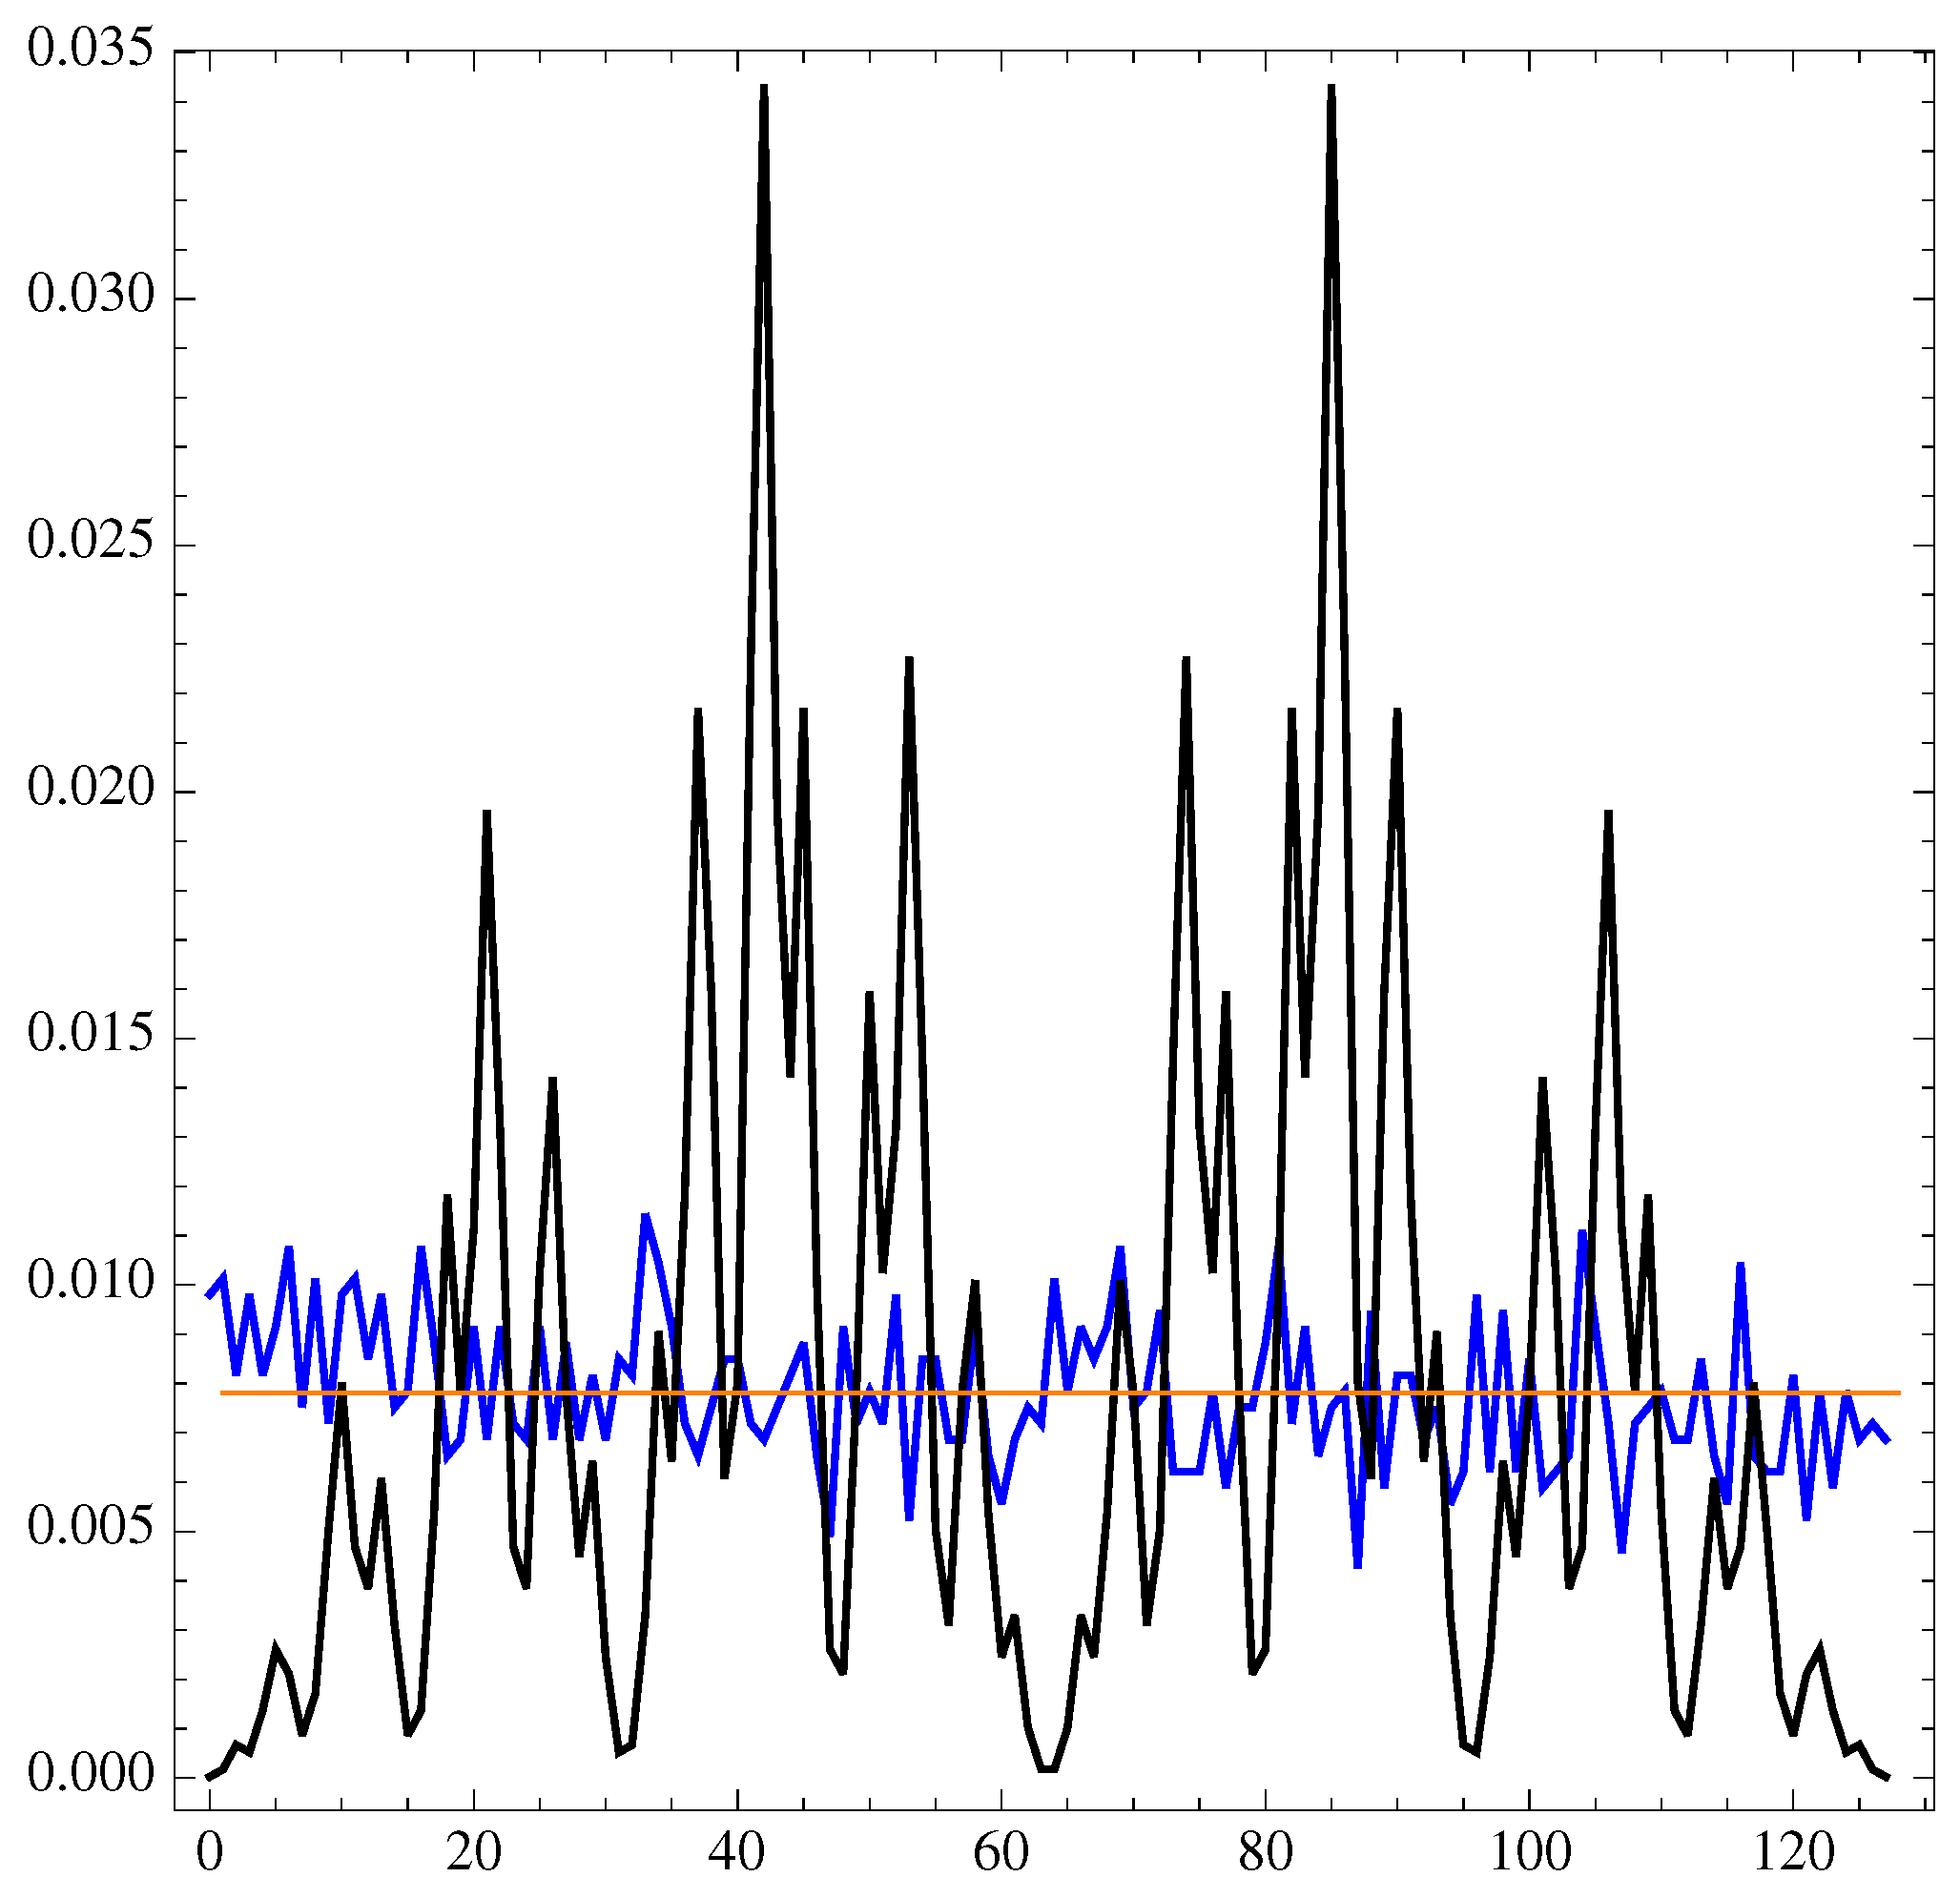
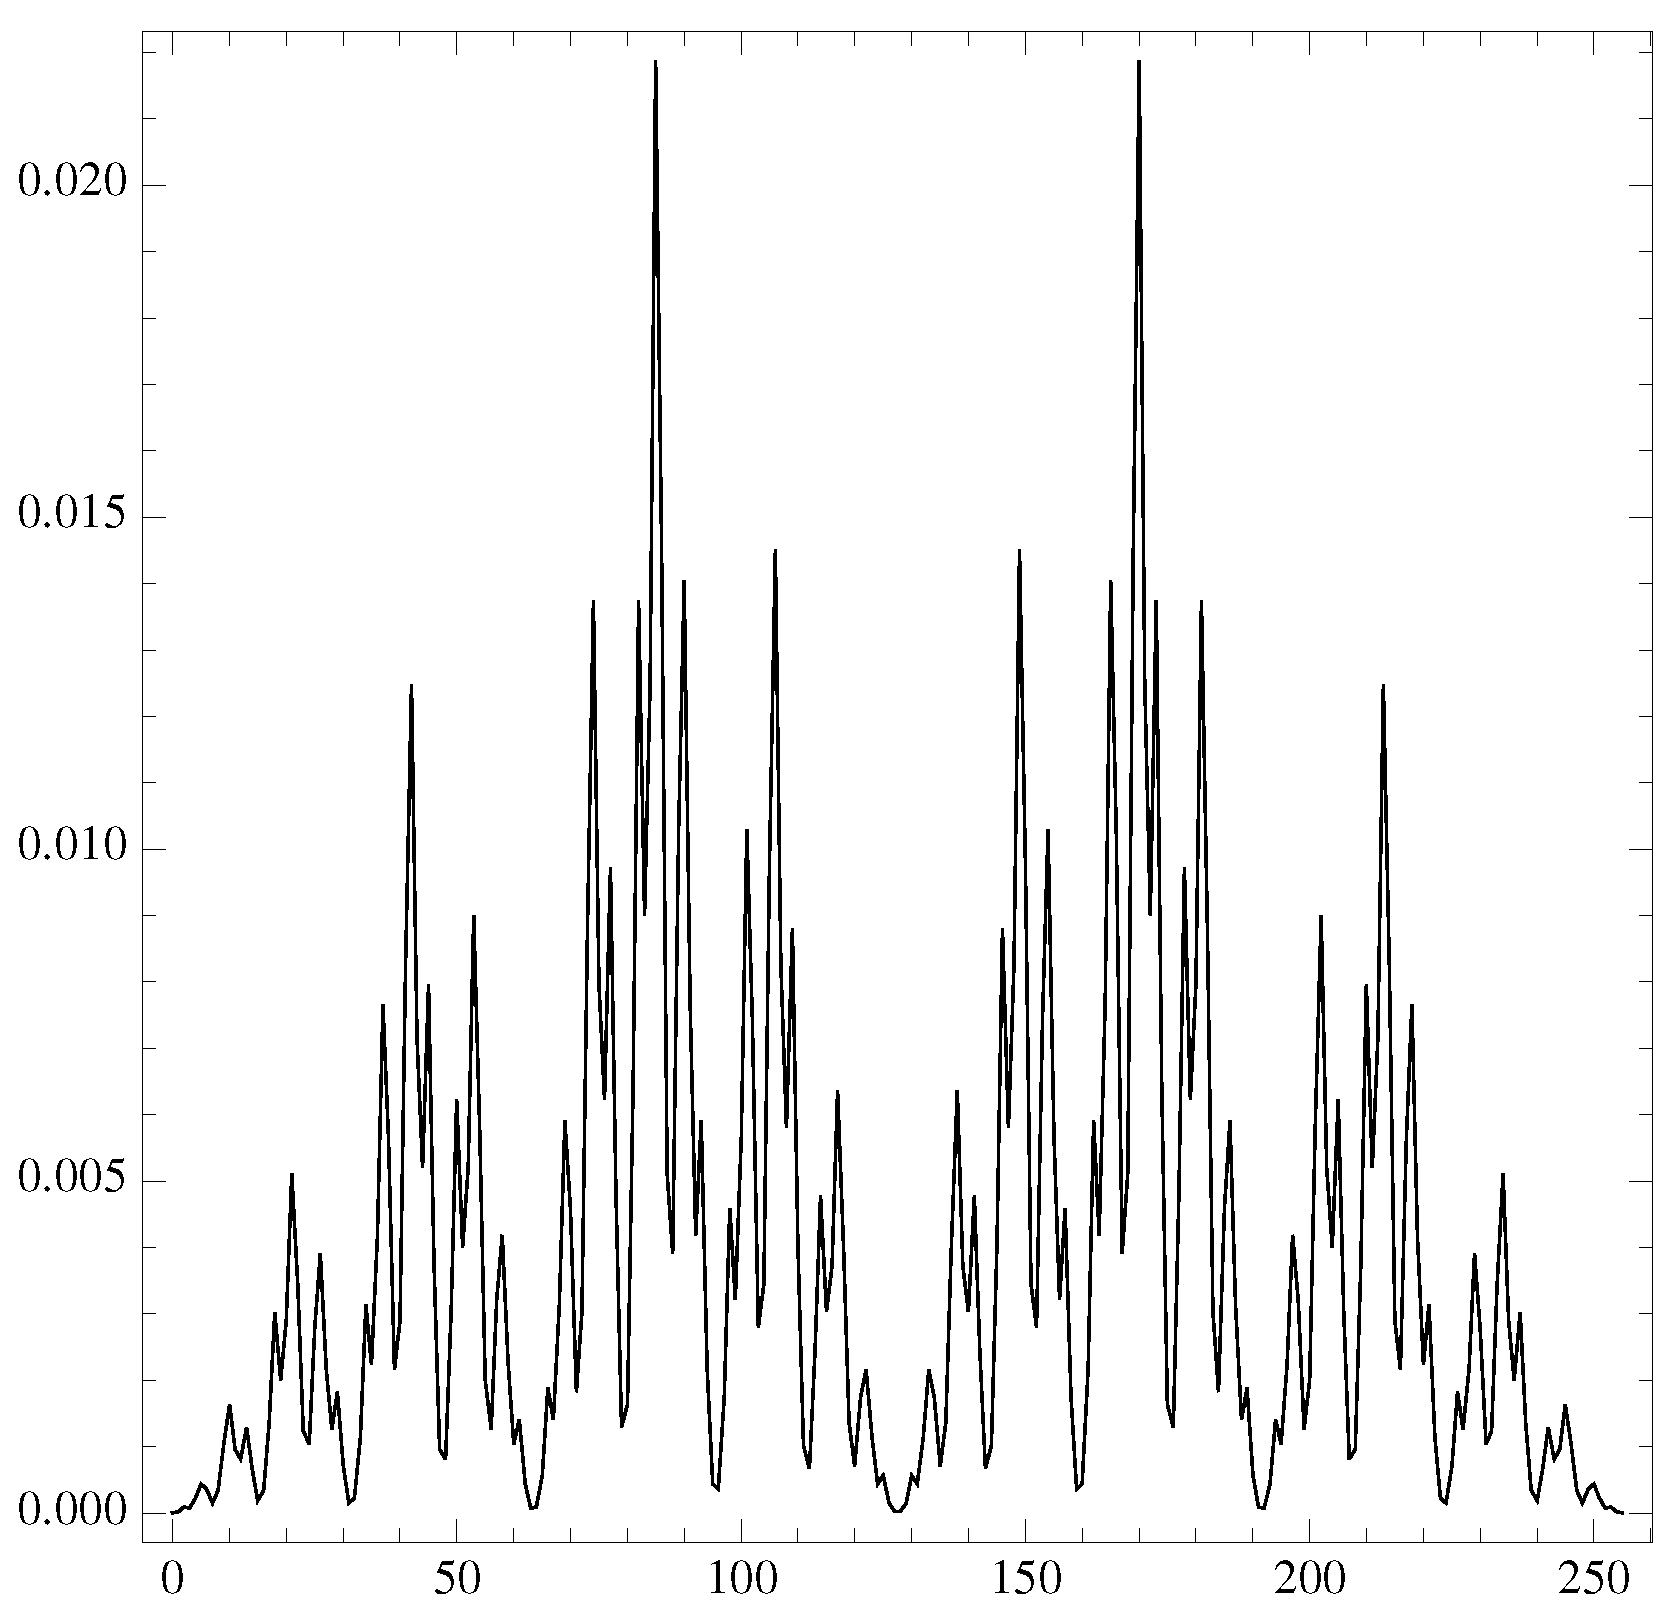
leading to a complex probability distribution for the q m ( s ) . For example for m = 9 we have 2 8 = 256 strings with the highest probability for the ` ` + + + + " string (and its symmetric ` ` + + + + " ): q 9 ( max ) = 62 2835 0.02187 (see Figure 1). These probabilities q m ( s ) could then be used to determine the KL-divergence between the time series probability p m ( s ) and the random uncorrelated signal.
To each string s we can associate an integer number, it’s binary representation, through the substitutions 0 , + 1 . So, for m = 4 we have ` ` " = 0 , ` ` + " = 1 , " + " = 2 , ` ` + + " = 3 and so on up to ` ` + + + " = 7 .
Table 3. ED m values, for different m-embedding.
ED 2 = 1
ED 3 = 1 3 + log 2 ( 3 ) = 1.9183
ED 4 = 3 + 1 2 log 2 ( 3 ) 5 12 log 2 ( 5 ) = 2.82501
ED 5 = 47 30 + 3 10 log 2 ( 3 ) + log 2 ( 5 ) 11 60 log 2 ( 11 ) = 3.72985
The recurrence gives some specific q m . To simplify the notations, let’s write a + a set of a successive “+". For example the second and third rules gives
q m + 1 ( a + , ) = q m ( a + ) q m + 1 ( a + , + ) = 1 m ! 1 ( m + 1 ) ! q m + 1 ( a + , ) = q m + 1 ( , a + ) = m ( m + 1 ) !
then
q m + 1 ( a + , , b + ) = q a + 1 ( a + ) q b + 1 ( b + ) q m + 1 ( a + , + , b + ) = q m + 1 ( a + , , b + ) = 1 ( m + 1 ) ! C a + 1 m + 1 1 with : b + a + 1 = m
We can also write
q m + 1 ( a + , , b + , , c + ) = q a + 1 ( a + ) q b + c + 2 ( b + , , c + ) q m + 1 ( a + , + , b + , , c + ) = a + b + c + 2 = m q m + 1 ( a + , , b + , , c + ) = 1 ( a + 1 ) ! 1 ( m a ) ! C b + 1 m a 1 1 ( m + 1 ) ! C m c m + 1 1 = = 1 ( a + 1 ) ! ( b + 1 ) ! ( c + 1 ) ! 1 ( c + 1 ) ! ( a + b + 2 ) ! 1 ( a + 1 ) ! ( b + c + 2 ) ! + 1 ( a + b + c + 3 ) !
This equation is also valid when b = 0 so for q m + 1 ( a + , , , c + ) (with m = a + c + 2 ) or for c = 0 . We can continue in this way and determine the general values of q m + 1 ( a + , , b + , , c + , , d + ) and so on.
In the case where the data are integers, we can avoid the situation where two successive data are equal ( x i = x i + 1 ) by adding a small amount of random noise. For example, we take the first 10 4 decimal of π (and we add a small noise ϵ [ 0.01 , 0.01 ] ) and we have:
Table 4. q m values for π , for different m-embedding.
6 q 3 = 0.982 2.01 2.01 0.991
24 q 4 = 0.924 3.00 5.05 3.00 3.00 5.05 3.00 0.960
120 q 5 = 0.756 3.86 9.10 5.92 9.23 16.0 11.0 4.03 3.86 11.1 16.2 9.10
5.78 9.22 4.03 0.768
Table 5. ED m values for π , for different m-embedding.
ED 2 = 0.999998
ED 3 = 1.91361
ED 4 = 2.81364
ED 5 = 3.71059
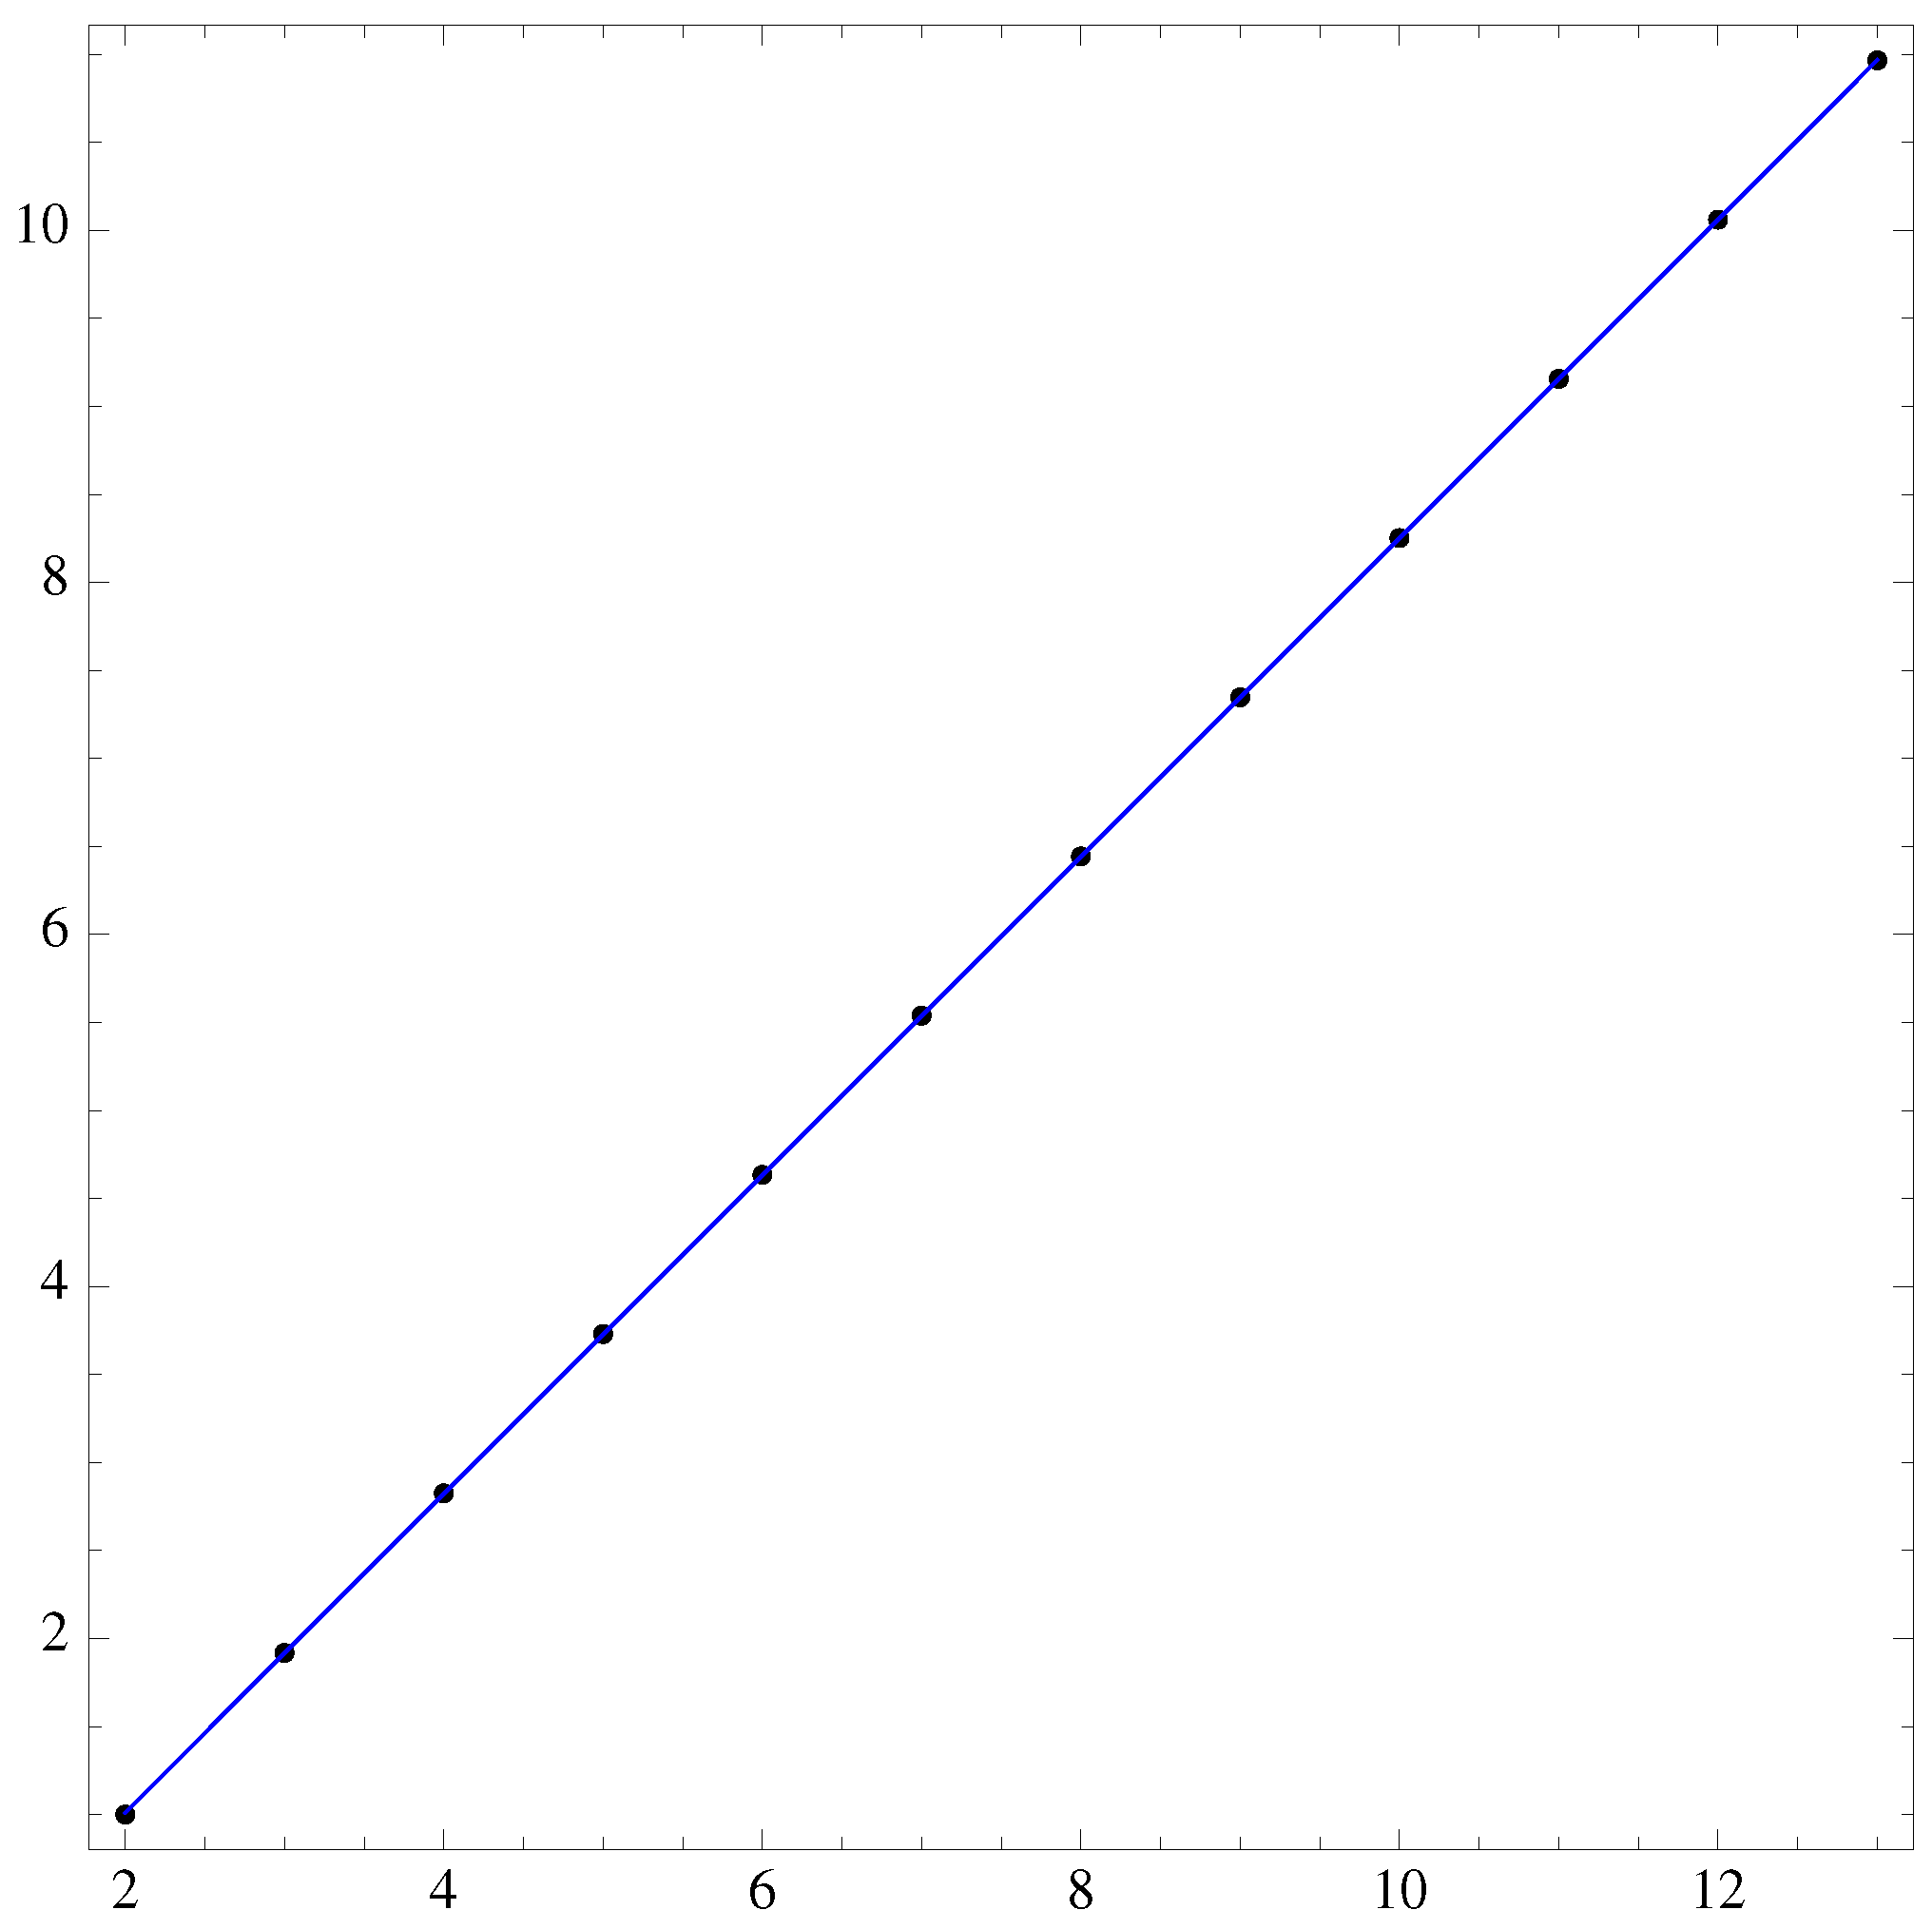
Despite the complexity of q m ( s ) , the Shannon entropy for a random signal: ED m = s q m ( s ) log 2 q m ( s ) increases linearly with m (see Figure 2): ED m = 0.799574 + 0.905206 m . If the m-tuples where equiprobable it will leads to log 2 ( 2 ) + m log 2 ( 2 ) = m 1 .

3. Periodic signal

Let’s see what happens with a period 3 data X = ( x 1 , x 2 , x 3 , x 1 , x 2 , x 3 , ) . To evaluate the q m we only have 3 types of 2-tuples. For example for q 2 we have ( ( x 1 , x 2 ) , ( x 2 , x 3 ) , ( x 3 , x 1 ) ) . We have only two possible string “+" or “-", so the probabilities mustt be q 2 ( + ) = 2 / 3 , q 2 ( ) = 1 / 3 or q 2 ( + ) = 1 / 3 , q 2 ( ) = 2 / 3 . For q 3 again we have only 3 types of 3-tuples: ( ( x 1 , x 2 , x 3 ) , ( x 2 , x 3 , x 1 ) , ( x 3 , x 1 , x 2 ) ) . We have 2 2 possible string ( + , + ) , ( + , ) , ( , + ) and ( , ) . The consistency of the inequalities between x 1 , x 2 and x 3 reduces the number of possible strings to 3. For example, if ( x 1 , x 2 , x 3 ) gives ( + , + ) , then ( x 2 , x 3 , x 1 ) must be ( + , ) and ( x 3 , x 1 , x 2 ) must be ( , + ) . Due to period 3 these ( x , y ) will appear 1 / 3 times. To evaluate q 4 we have again only 3 types of 4-tuples: ( ( x 1 , x 2 , x 3 , x 1 ) , ( x 2 , x 3 , x 1 , x 2 ) , ( x 3 , x 1 , x 2 , x 3 ) ) and again these will appear 1 / 3 times in the data. This reasoning can be generalised to a signal of period p: q p = 1 / p , consequently ED p = log 2 ( p ) and remains constant for m p . Obviously, since we are only using the differences between the x i ’s, the periodicity in terms of signs x i + 1 x i , may be smaller than the periodicity p of the data, so ED p log 2 ( p ) .

4. Chaotic logistic map example

Let us illustrate the use of ED on the well know logistic map [13] Lo ( x , λ ) driven by the parameter  λ .
x n + 1 = Lo ( x n , λ ) = λ x n ( 1 x n )
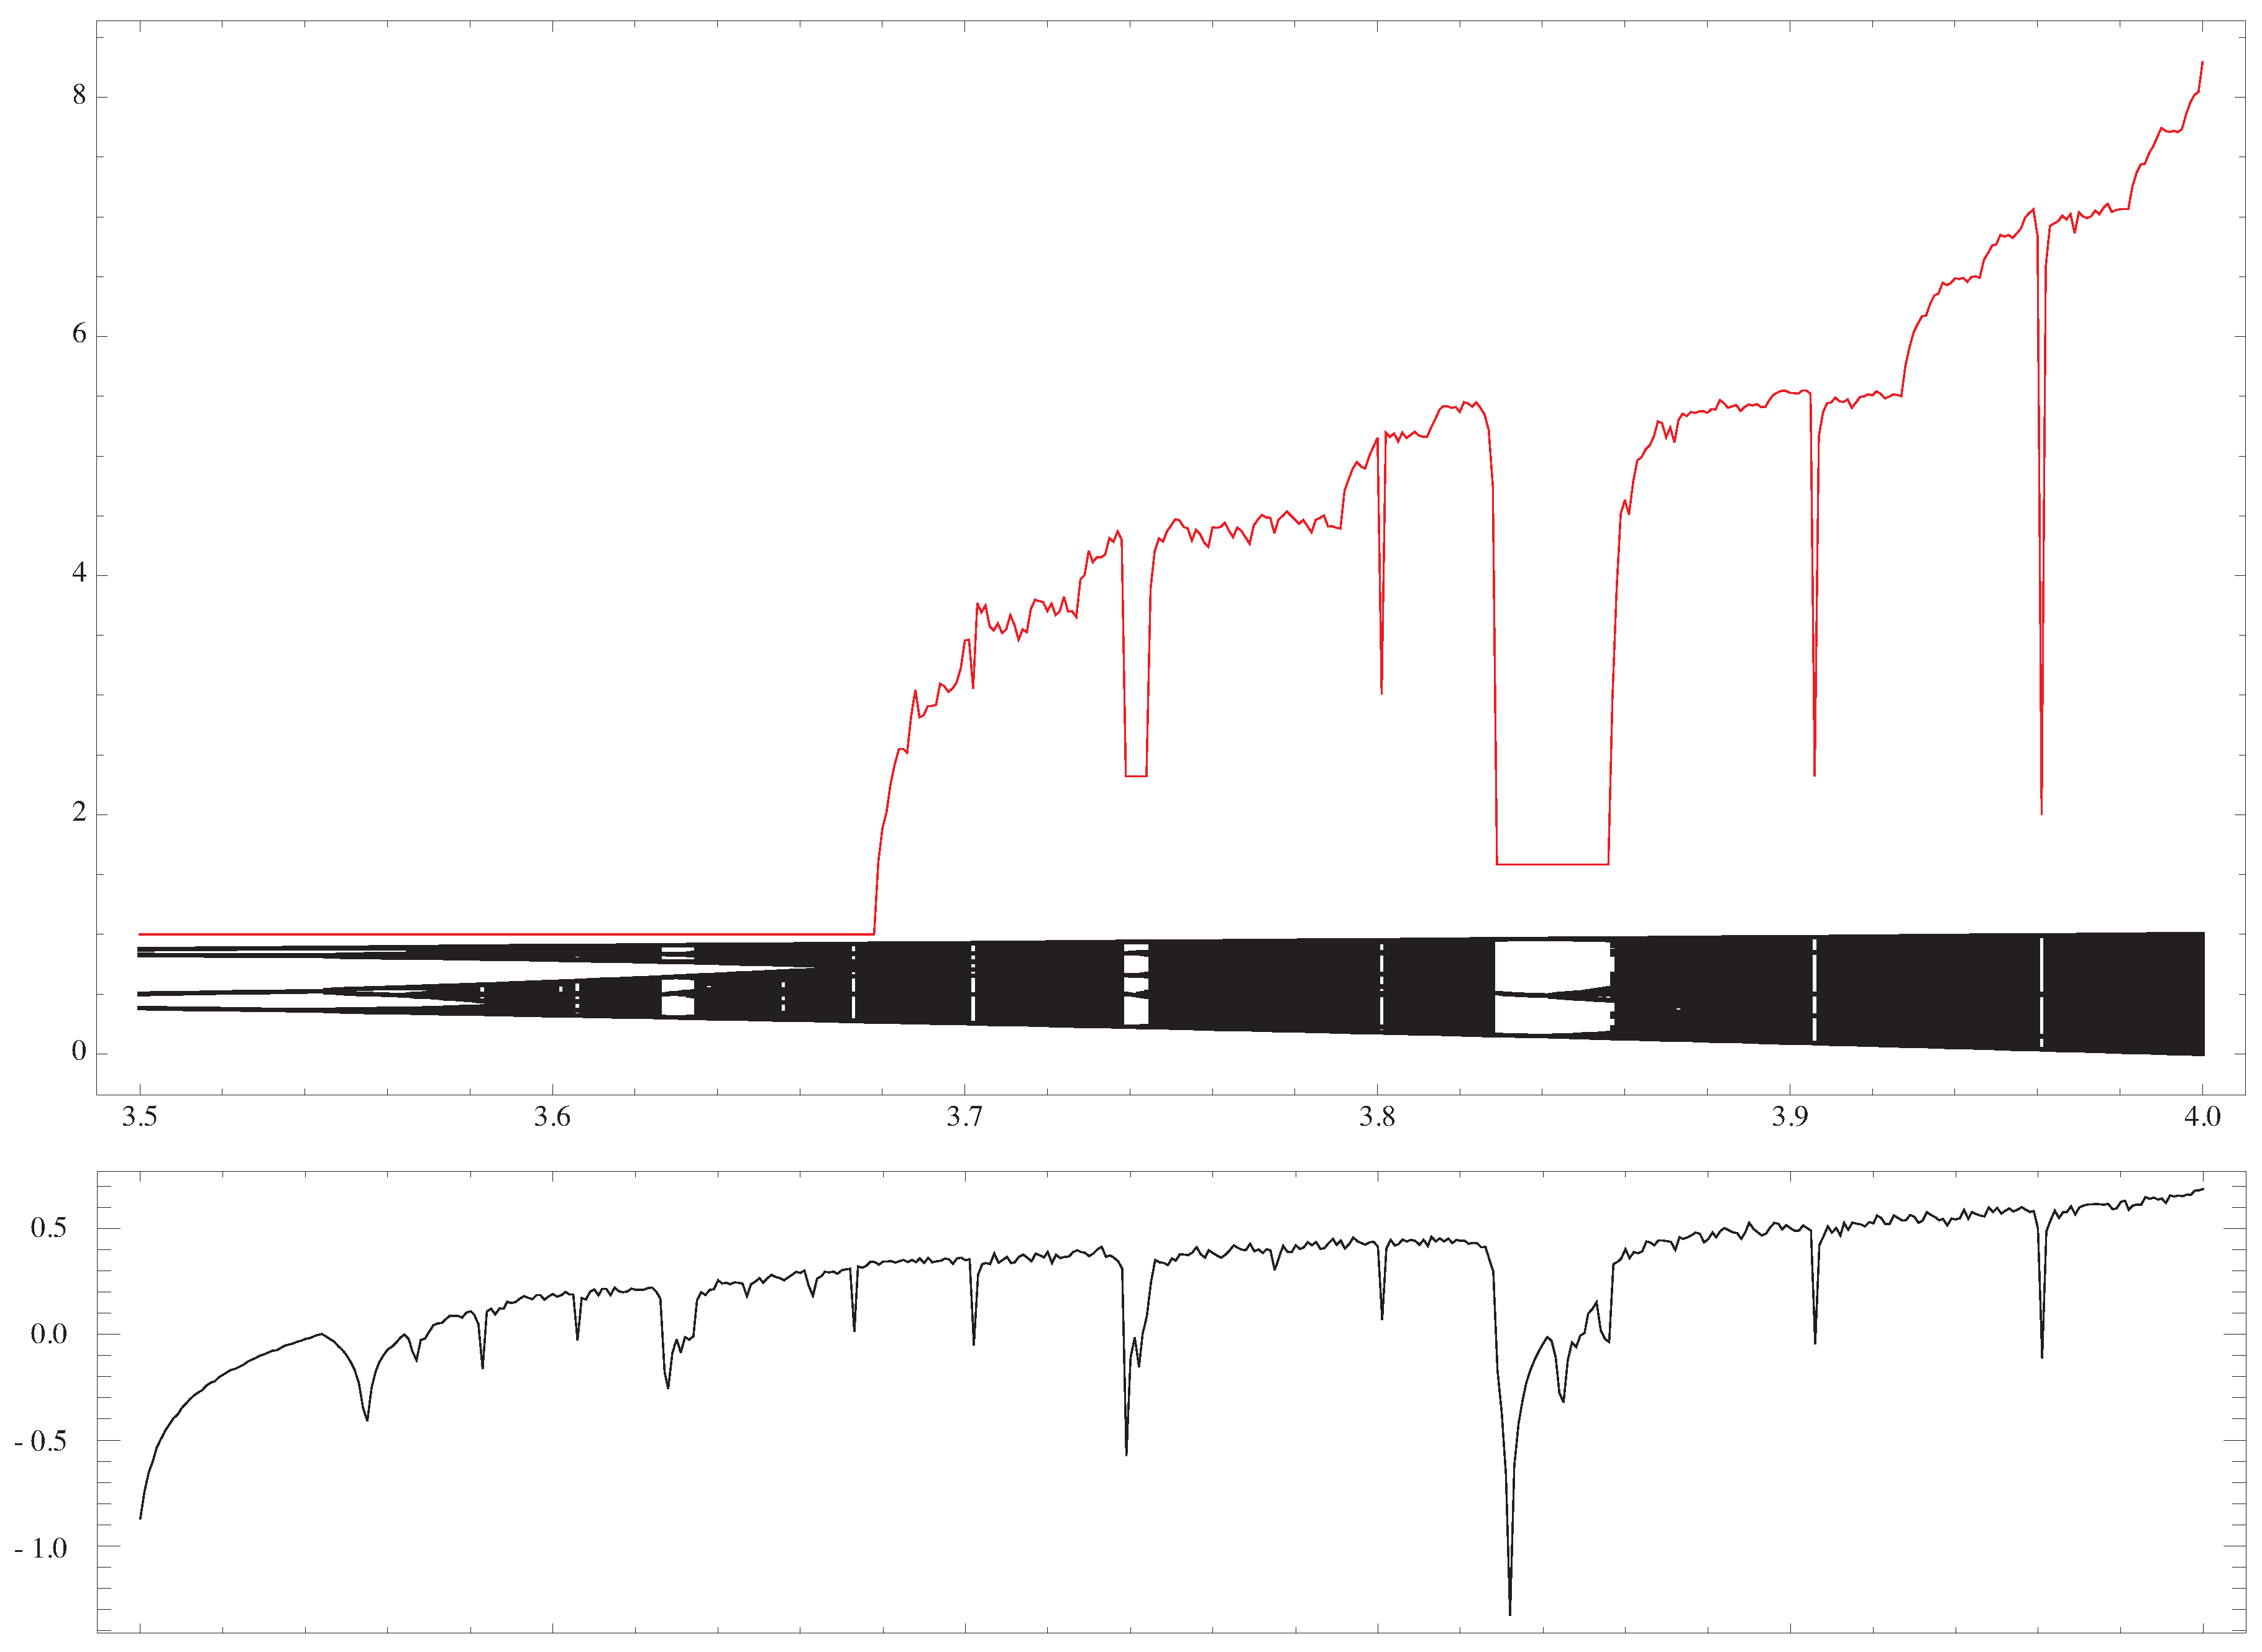
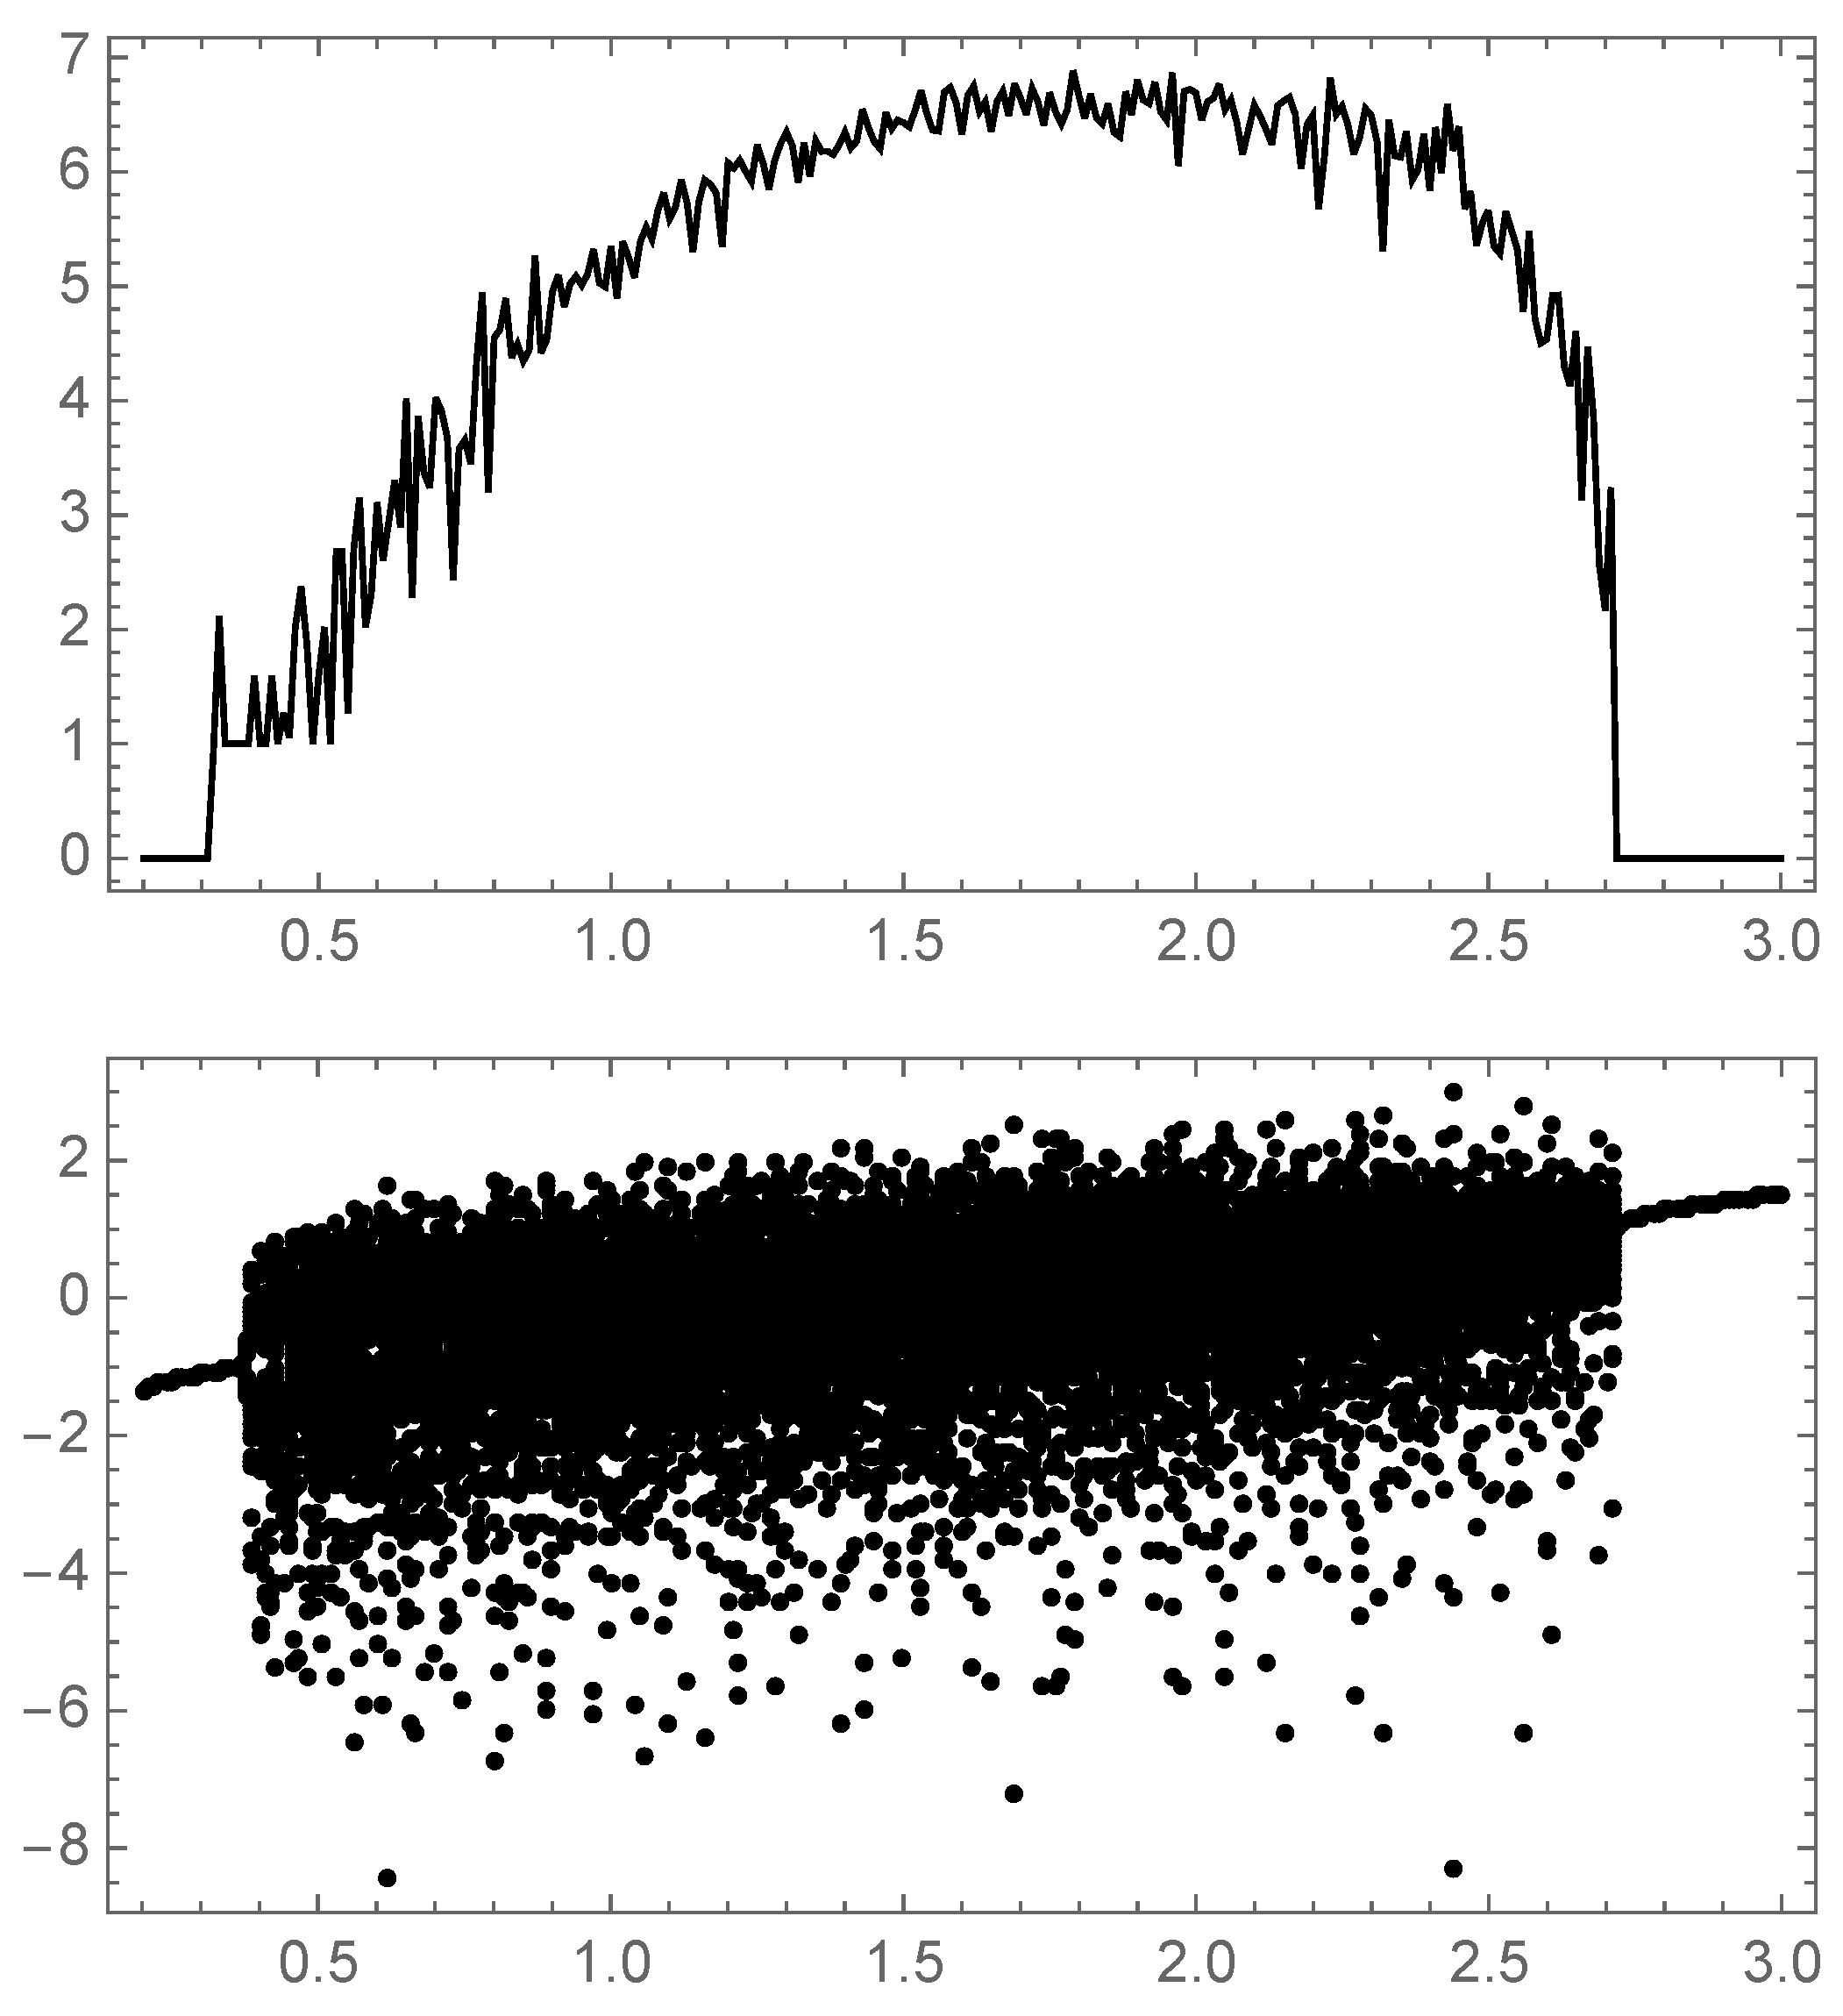
It is obvious that for a range of values of λ where the time series reaches a periodic behavior (any cyclic oscillation between n different values), the ED will remain constant. The evaluation of the ED could thus be used as a new complexity parameter to determine the behavior of the time series (see Figure 3).
For λ = 4 we know that the data are randomly distributed with a probability density given by [14]
p Lo ( x ) = 1 π ( 1 x ) x
But the logistic map produce correlations in the data, so we expect a deviation from the uncorrelated random q m .
We can then compute exactly the ED for an m-embedding, and the KL-divergence from a random signal. For example, for m = 2 , we can determine the q 2 Lo ( + ) and q 2 Lo ( ) by solving the inequality x < Lo ( x ) and x > Lo ( x ) respectively which implies that 0 < x < 3 / 4 and 3 / 4 < x < 1 , and then
q 2 Lo ( + ) = 0 3 / 4 d x p Lo ( x ) = 2 3 q 2 Lo ( ) = 3 / 4 1 d x p Lo ( x ) = 1 3
In this case the logistic map produces a signal that contains twice as many increasing pairs ` ` + " than decreasing pairs ` ` " . So:
ED 2 = ( 2 3 log 2 2 3 + 1 3 log 2 1 3 ) = log 2 3 2 2 / 3 0.918 KL 2 = 1 3 log 2 32 27 0.082
For m = 3 we can perform the same calculation, we have respectively:
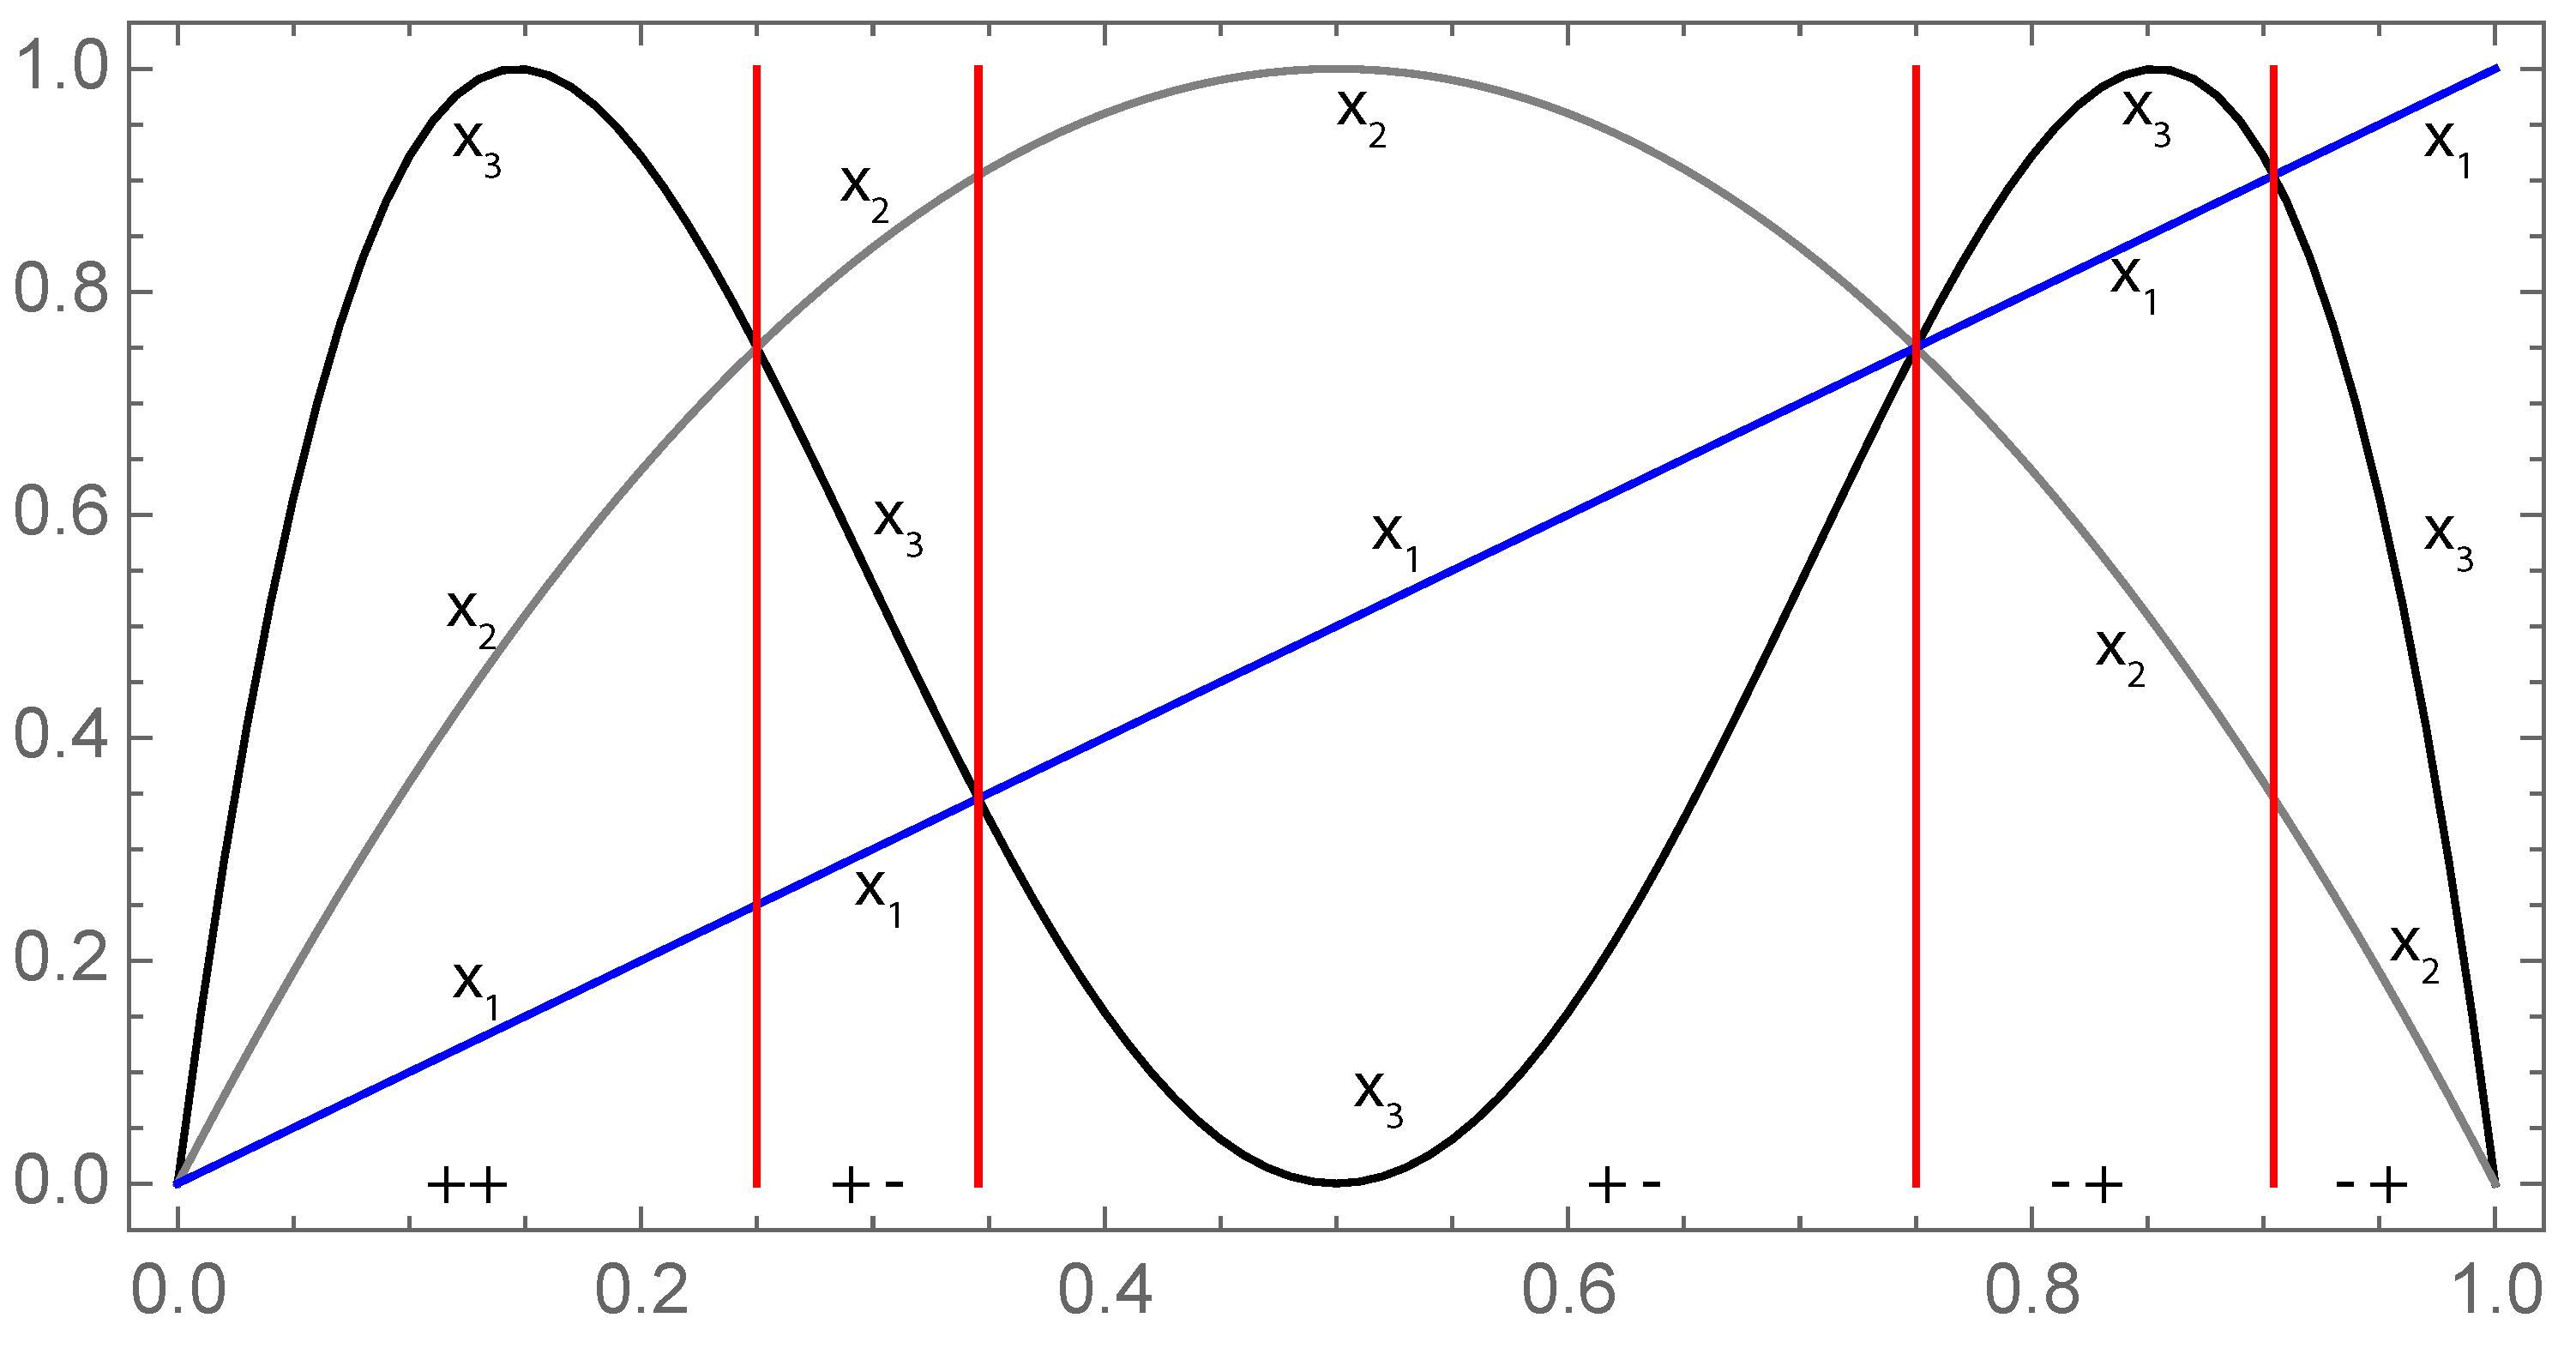
x 1 < x 2 < x 3 ( + , + ) : 0 < x < 1 4 x 1 < x 3 < x 2 ( + , ) : 1 4 < x < 1 8 ( 5 5 ) x 3 < x 1 < x 2 ( + , ) : 1 8 ( 5 5 ) < x < 3 4 x 2 < x 1 < x 3 ( , + ) : 3 4 < x < 1 8 ( 5 + 5 ) x 2 < x 3 < x 1 ( , + ) : 1 8 ( 5 + 5 ) < x < 1
Graphically we have:
q 3 Lo ( + + ) = 1 3 q 3 Lo ( + ) = 1 3 q 3 Lo ( + ) = 1 3 q 3 Lo ( ) = 0 ED 3 = log 2 3 1.58 KL 3 = 1 3 0.33
Effectively the logistic map with λ = 4 forbids the string “- -" where x 1 > x 2 > x 3 . For strings of length 3 we have:
q 4 Lo ( + + + ) = q 4 Lo ( + + ) = q 4 Lo ( + + ) = q 4 Lo ( + ) = 1 6 q 4 Lo ( + + ) = 2 6 ED 4 = log 2 108 1 3 2.25 KL 4 = log 2 16384 1125 1 / 6 0.64
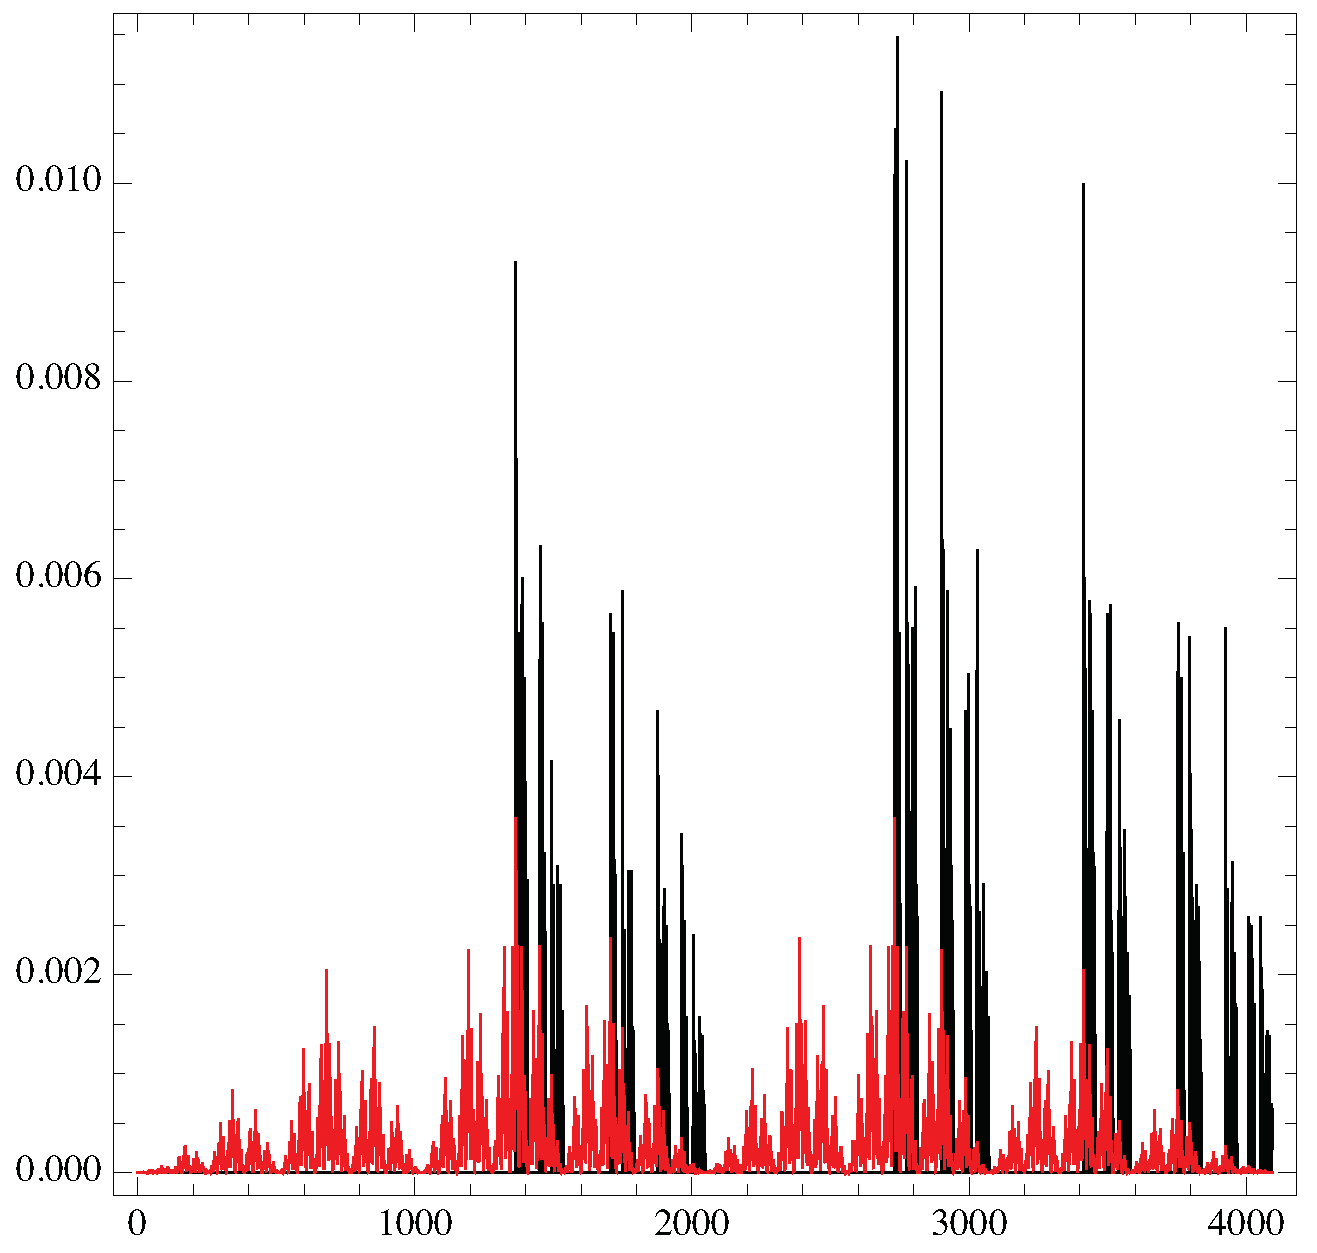
The probability of difference q m ( s ) for some string length m versus s the string binary value, where “+" 1 and “-" 0 , give us the “spectrum of difference" for the distribution q (see Figure 4).

5. KL m ( p | q ) divergences versus m on real data and on maps
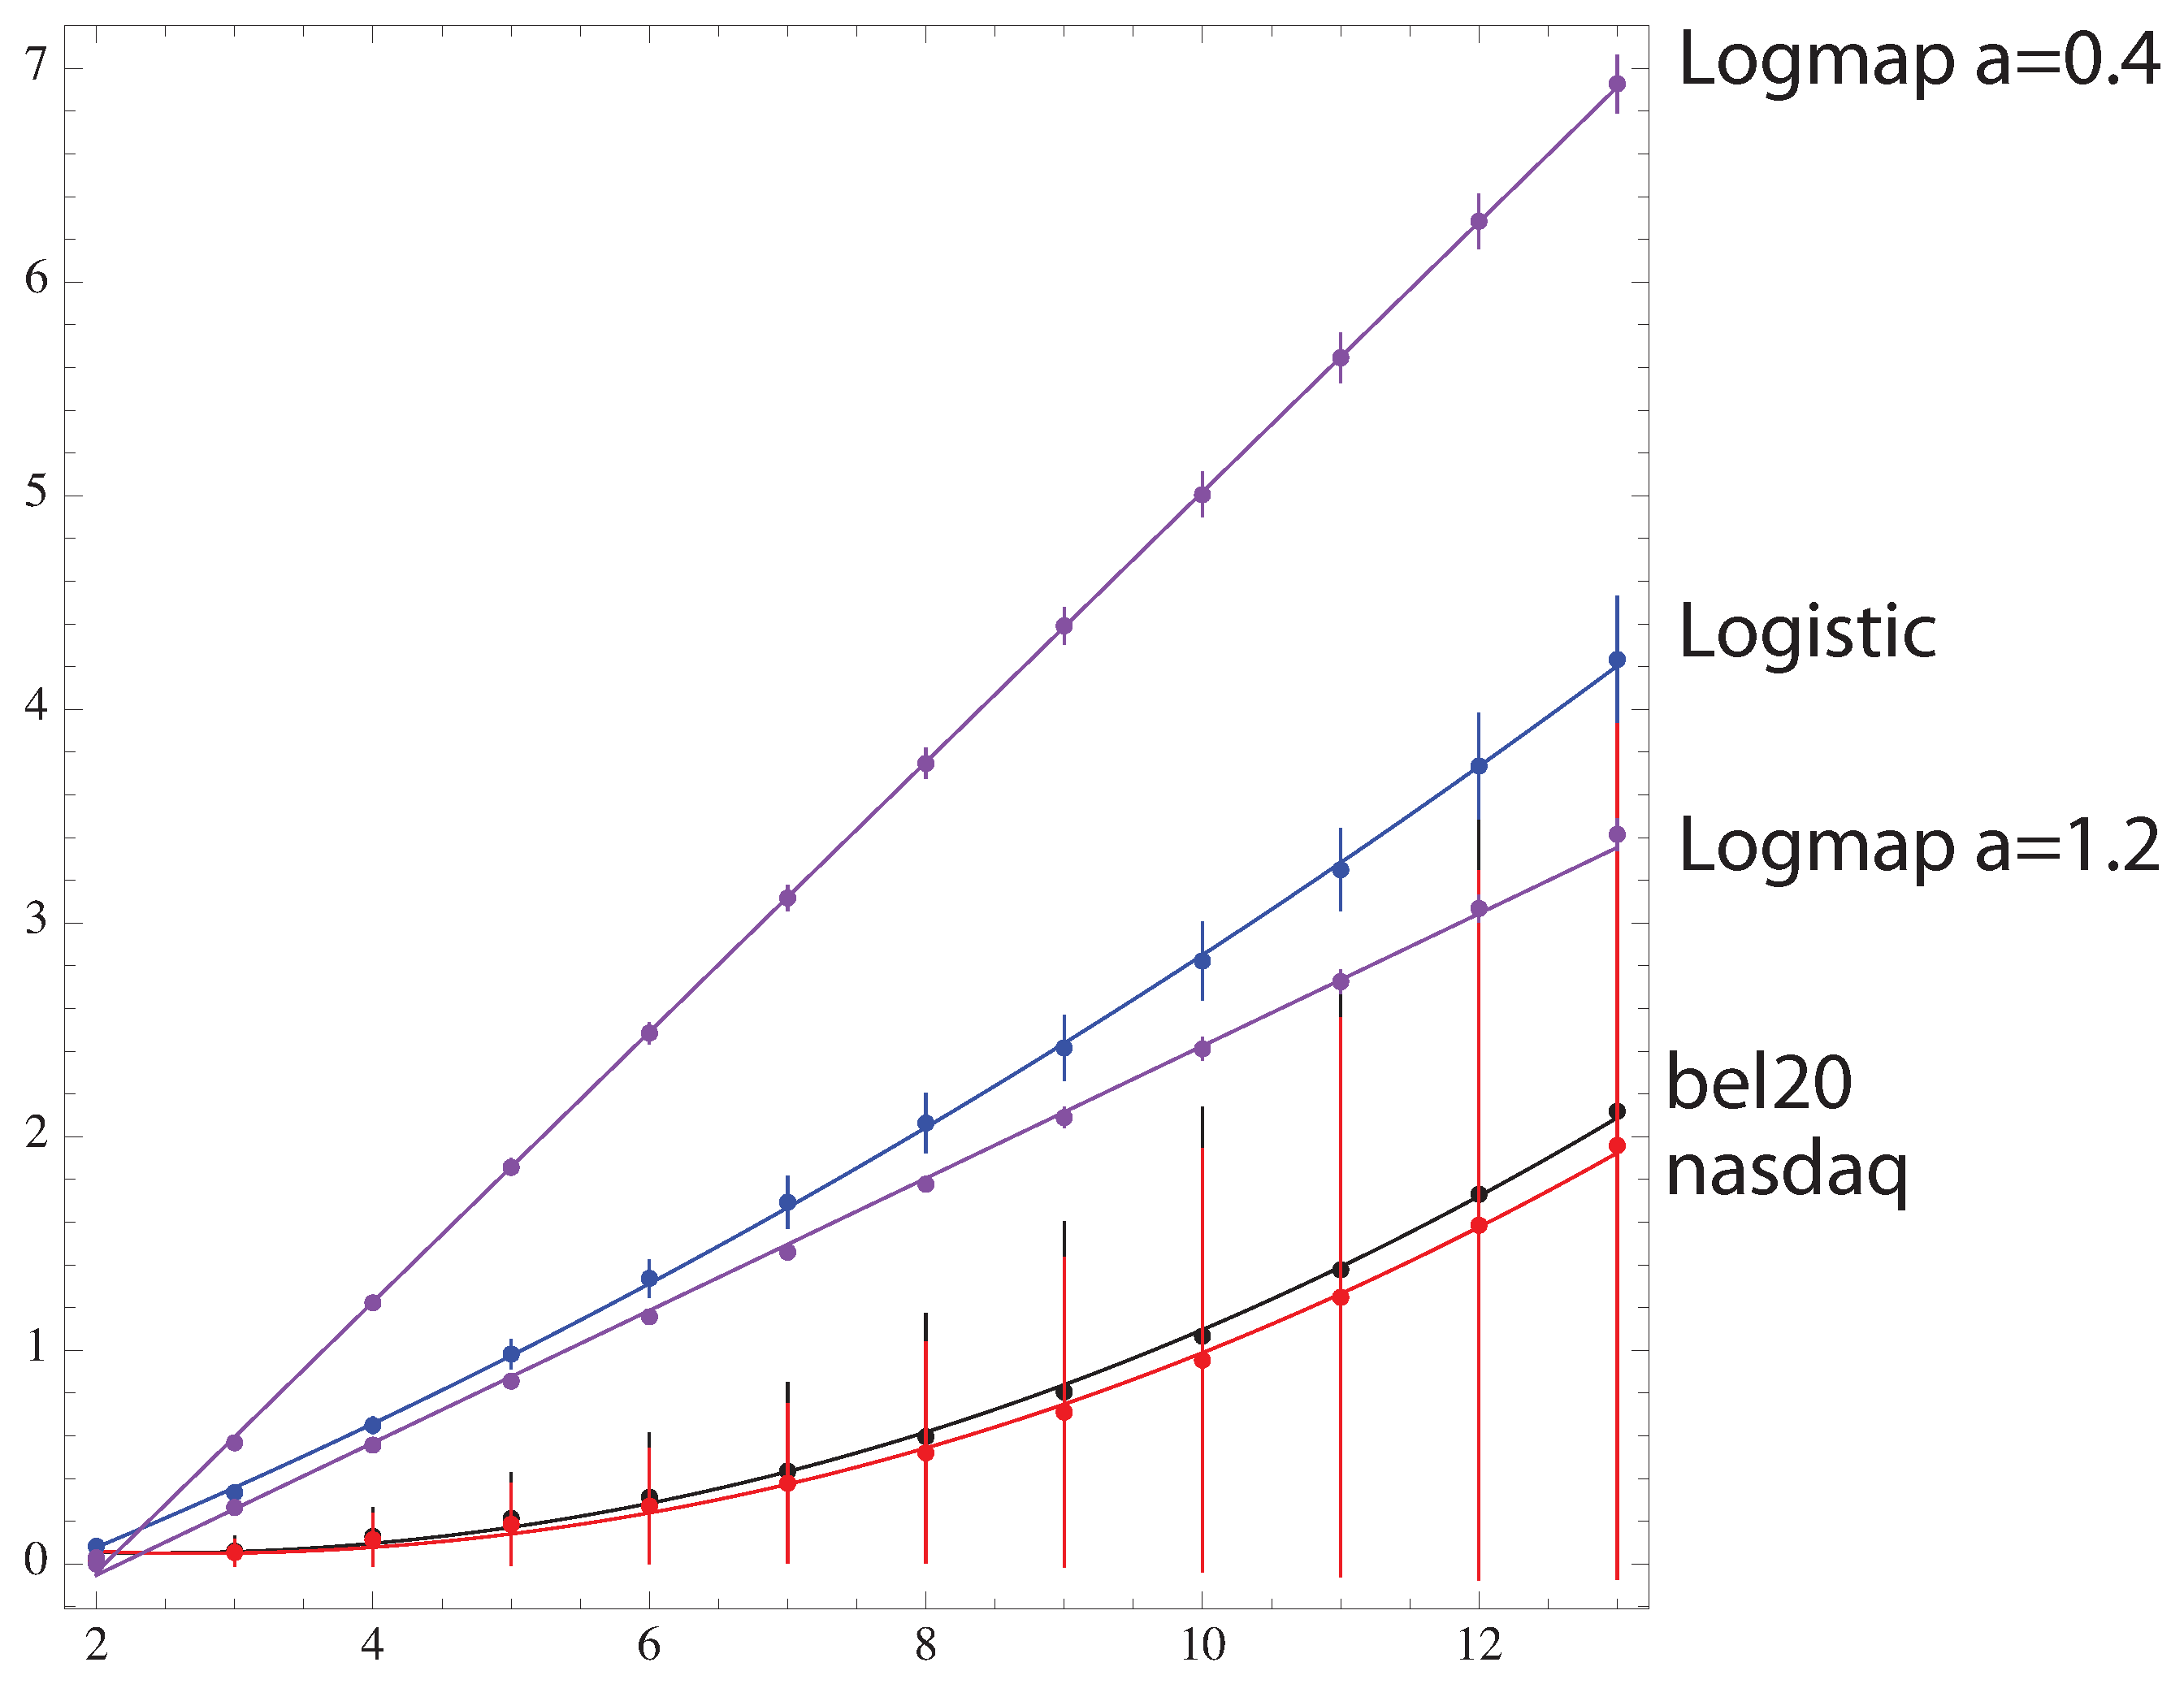
The manner in which the KL m ( p | q ) evolves with m is another parameter of the complexity measure. KL m ( p | q ) measures the loss of informations when the random distribution q m is used to predict the distribution p m . Increasing m introduces more bits information in the signal and the behavior versus m shows how the data diverges from a random distribution.
The graphics (see Figure 6) shows the behavior of KL m versus m for two different chaotic maps and for real financial data [15]: the opening value of the nasdaq100, bel20 everyday from 2000 to 2013. For maps, the logarithmic map x n + 1 = ln ( a | x n | ) and logistic map are shown (see Figure 6 for the logarithmic map).
For maps the simulation starts with a random number between 0 and 1, then first iterate 500 times to avoid transients. Starting with that seeds, 720 iterates where kept on which the KL m where computed. It can be seen that the Kullback-Leibler divergence from the logistic map at λ = 4 to the random signal is fitted by a quadratic function of m: KL m = 0.4260 + 0.2326 m + 0.0095 m 2 (p-value 2 10 7 for all the parameter), while the logarithmic map behavior is linear in the range a [ 0.4 , 2.2 ] . Financial data are also quadratic KL m ( nasdaq ) = 0.1824 0.0973 m + 0.0178 m 2 , KL m ( bel 20 ) = 0.1587 0.0886 m + 0.0182 m 2 with a higher curvature than the logistic map due to the fact that the spectrum of the probability p m is compatible with a constant distribution (see Figure 6) rendering the prediction of increase or decrease signal completely random, which is not the case in any true random signal.
Figure 8. The KL-divergence for the data.
Preprints 91354 g008
Figure 9. The spectrum of q 8 versus the string binary value (from 0 to 2 7 1 ) for the bel20 financial data.
Preprints 91354 g009

6. Conclusions

The simple property of increases or decreases in a signal makes it possible to introduce the entropy of difference ED m as a new efficient complexity measure for chaotic time series. The probability distribution of string q m for random signal is used to evaluate the Kullback-Leibler divergence versus the number of data m used to build the difference string. This KL m shows different behavior for different types of signal and can also be used also to characterize the complexity of a time series.

Conflicts of Interest

The authors declare no conflict of interest.

Appendix A

P["+"]= P["-"] = 1/2;
P["-", x__] := P[x] - P["+", x];
P[x__, "-"] := P[x] - P[x, "+"];
P[x__, "-", y__] := P[x] P[y] - P[x, "+", y];
P[x__] :=1/(StringLength[StringJoin[x]] + 1)!

References

  1. C. Bandt and B. Pompe, Phys. Rev. Lett. 88, 174102 (2002).
  2. Chunhua Bian, Chang Qin, Qianli D. Y. Ma and Qinghong Shen Phys. Rev. E 85, 021906 (2012).
  3. L. Zunino, D. G. Pérez, M. T. Martín, M. Garavaglia, A. Plastino, and O. A. Rosso, Phys. Lett. A 372, 4768 (2008).
  4. X. Li, G. Ouyang, and D. A. Richards, Epilepsy Res. 77, 70 (2007).
  5. X. Li, S. Cui, and L. J. Voss, Anesthesiology 109, 448 (2008).
  6. B. Frank, B. Pompe, U. Schneider, and D. Hoyer, Med. Biol. Eng. Comput. 44, 179 (2006).
  7. E. Olofsen, J. W. Sleigh, and A. Dahan, Br. J. Anaesth. 101, 810 (2008).
  8. O. A. Rosso, L. Zunino, D. G. Perez, A. Figliola, H. A. Larrondo, M. Garavaglia, M. T. Martin and A. Plastino, Phys. Rev. E 76, 061114 (2007).
  9. S. Kullback and R. A. Leibler Ann. Math. Statist., 22, 1, 79, (1951).
  10. Édgar Roldán and Juan M. R. Parrondo Phys. Rev. E, 85, 3, 031129, (2012).
  11. F. Ginelli, P. Poggi, A. Turchi, H. Chate, R. Livi, and A. Politi Phys. Rev. Lett. 99, 130601 (2007).
  12. J. Theilerb and P. E. Rapp, Electroencephalography and Clinical Neurophysiology, 98, 3, 213 (1996).
  13. R.M. May, Nature 261, 459 (1976).
  14. M. Jakobson,Communications in Mathematical Physics, 81, 39-88 (1981).
  15. data are provided by http://www.wessa.net/.
1
Figure 1. The 2 8 values for the probability of q 9 ( s ) , from s = . . . 0 to s = + + + . . . 255 .
Preprints 91354 g001
Figure 2. The 2 8 values for the probability of q 9 ( s ) , for π decimal (blue) and for a random distribution (red).
Preprints 91354 g002
Figure 3. The Shannon entropy of q m ( s ) : ED m , increases linearly with m, the fit 0.799574 + 0.905206 m gives a sum of squared residuals of 1.7 10 4 and a p-value= 1.57 10 12 and 1.62 10 30 on the fit parameter respectively.
Preprints 91354 g003
Figure 4. The ED 13 (strings of length 12) is plotted versus λ , with the bifurcation diagram, and the value of the Lyapunov exponent respectively. The constant value appears when the logistic map enters into a periodic regime.
Preprints 91354 g004
Figure 5. From x 1 (blue), the first iteration of logistic map (gray) gives x 2 and second iteration (black) gives x 2 , the respective positions of x 1 , x 2 , x 3 allow us to determine q 3 .
Preprints 91354 g005
Figure 6. The spectrum of q 13 Lo (black) versus the string binary value (from 0 to 2 12 1 ) for the logistic map at λ = 4 and the one from a random distribution q 13 (red).
Preprints 91354 g006
Figure 7. The E D 13 versus a for the logarithm map x n + 1 = ln ( a | x n | ) .
Preprints 91354 g007
Table 1. K values, for different m-embedding.
m 3 4 5 6 7
K P E 6 24 120 720 5040
K m P E 13 73 501 4051 37633
K E D 4 8 16 32 64
Table 2. q m values, for different m-embedding, ordered by the binary representation of the string.
s = 0 1 2 3 4 5 6 7 8 9 10 11 12 13 14 15
6 q 3 = 1 2 2 1
24 q 4 = 1 3 5 3 3 5 3 1
120 q 5 = 1 4 9 6 9 16 11 4 4 11 16 9 6 9 4 1
Disclaimer/Publisher’s Note: The statements, opinions and data contained in all publications are solely those of the individual author(s) and contributor(s) and not of MDPI and/or the editor(s). MDPI and/or the editor(s) disclaim responsibility for any injury to people or property resulting from any ideas, methods, instructions or products referred to in the content.
Copyright: This open access article is published under a Creative Commons CC BY 4.0 license, which permit the free download, distribution, and reuse, provided that the author and preprint are cited in any reuse.
Prerpints.org logo

Preprints.org is a free preprint server supported by MDPI in Basel, Switzerland.

Subscribe

© 2024 MDPI (Basel, Switzerland) unless otherwise stated