
Submitted:
13 December 2023
Posted:
14 December 2023
You are already at the latest version
Abstract
This paper presents the experimental campaign conducted near the Condoroma dam at 4075 m a.s.l. in an experimental setup consisting of a series of standard profile spillways with a vertical upstream face of up to five different dimensionless heights (P/Hd). The experimental results indicate that for all P/Hd ratios studied, the discharge coefficients adjusted to the Condoroma altitude are lower than those reported by classical formulations used in conventional spillway design. As a result, a generalized equation is proposed to estimate the discharge coefficient for standard spillways located in dams at similar elevations above sea level.
Keywords:
Ogee profile
; discharge coefficients
; atmospheric pressure
; high altitude
1. Introduction and objective
Generally, dams in Andean countries such as Peru are built at high altitudes, approximately 4000 m a.s.l., because most of the rainfall occurs there, and the topography of these regions allows for the storage of larger volumes of water.
The classic hydraulic design of these structures is based on previous experimental investigations carried out at lower altitudes, mainly near sea level. However, the atmospheric pressure at sea level is usually considered 1013 millibars, corresponding to a piezometric head of 10.33 m of water column, which decreases as altitude increases. Thus, at 4075 m a.s.l., it is 621 millibars or 6.33 m of water column. It has been shown that low atmospheric pressure decreases the performance of turbines and hydraulic pumps.
This work aims to fill the knowledge gap on the hydraulic behavior of discharge coefficients in standard spillways at high altitudes.
For this purpose, an experimental hood has been designed to test five standard spillway profiles designed according to the United States Bureau of Reclamation criteria [1], for a wide range of approach depths and for head conditions less than ( and greater than the design head (.
The standard spillway literature is reviewed, and the test facilities and instrumentation used are described. The results are discussed, and the conclusions are presented.
As a summary of the current study, new formulations are developed for the discharge coefficients as a function of different approach depths. These equations present a good fit, considering the large amount of data on which they are based. They also highlight the need for further research on the hydraulic behavior of spillways under more unfavorable conditions than usual.
2. Previous studies
The discharge coefficient for standard spillways (ogee) is based on a broad-crested profile that corresponds to the design head, , on which its shape and dimensions depend [1,2].
In early 1717, Poleni derived equation (1) for sharp-crested weirs:
The form of the equation is similar to the one commonly used today but does not consider velocity head [3,4,5]. Weisbach, in 1841, extended the equation and considered the approach velocity to the weir as an independent variable [6,7].
Equation (1) is the general equation that describes the capacity of an overflow spillway [8].
where is the dimensionless discharge coefficient, is the spillway length, is the gravity acceleration, is the mean approach velocity at the measurement station, and is the height above the spillway crest (Figure 1).
Several authors group the coefficient with the discharge coefficient M, resulting in the relationship used in the present article for the adjustment of these coefficients ; furthermore, from equation (2), the velocity head is omitted [1]:
Equation (3) is also commonly presented grouping the discharge coefficient , the integration term (2/3), and the gravity acceleration in a dimensional discharge coefficient .
If the flow rate on a spillway is lower than the designed , positive relative pressures will occur on its bed, and the value of the discharge coefficient will decrease. On the contrary, if the flow rate is higher than the designed , subatmospheric pressures will occur on the spillway bed, and the discharge coefficient will tend to increase.
Numerous researchers have studied the characteristics of standard spillway profiles. A historical synthesis is made, with emphasis on contributions related to discharge coefficients.
In 1907, Horton of the United States Geological Survey reported on the discharge coefficients and formulas used in spillways [9]; however, it was Mueller, in 1908, who emphasized the importance of adapting the spillway profile on its downstream face to match the lower nappe of a sharp-crested weir to ensure atmospheric pressure [10]. This recommendation was adopted by Morrison and Brodie in 1916 [11] and by Creager in 1917 [12].
In 1930, Nagler and Davis, from their analysis of the Keokuk Dam, reported that the discharge coefficients between the model and prototype were similar, and that the percentage of error found was a result of the inherent inaccuracies of the experimental measurements. These inaccuracies, relative to the roughness of the crest of the model and prototype, produced differences that could be considered insignificant [13].
Dillmann, in 1933, conducted experiments for a design head of m and, in reference to the discharge coefficients, showed that could be exceeded by up to 300% while the flow remained stable [14,15]. In 1935, Rouse and Reid demonstrated that the flow characteristics of a spillway operating at the design head are essentially the same as those of the corresponding sharp-crested weir, showing that the discharge coefficients obtained were in agreement with those obtained by Dillman [15]. In the same year, Doland introduced a new formula for the coefficient that included a constant K and the radius of curvature of the crest [16].
Several authors proposed abacuses or potential-type equations:
or
that related the operation and the design heads ( to the discharge coefficient, with or representing the corresponding value of the coefficient for the design head .
Brudenell, while discussing Doland's work, proposed a formula for the discharge coefficient of equation (4) [17,18].
Vitols, in 1936, introduced in Bernoulli's equation the centrifugal force, which accompanies curvilinear motion and reduces pressure between the flow and the spillway bed. The result is suction in that region and an increase in the discharge coefficient [19].
In 1937, Randolph Jr., in the Madden Dam studies, established a formula for the coefficient similar to Brudenell's equation [20].
In 1938, Borland formulated a procedure for fitting the discharge coefficients of a sharp-crested weir to a round-crest spillway (ogee) [21]. Bradley, in 1947, made improvements in the design of spillway sections at the University of Illinois- Urbana [22]. In 1948, the Bureau of Reclamation (USBR) proposed a shape for standard-profile spillways [23].
In 1959, Webster reported that the spillway crests in Chief Joseph and The Dalles dams were designed with 75% of the maximum expected head (), and that if the maximum head was reached, negative relative pressures would occur on the spillway crest, increasing the discharge coefficient. This result allowed for significant cost savings in the structures by reducing the lengths of the spillways [24]. Later, in 1964, Cassidy performed experimental tests with a design load of m and ratios of 2.5 and 3.3 and compared them with the results from the potential flow theory. The analytical results were 2% higher than the experimental ones [25]. In 1970, Cassidy extended his experiments to include ratios of 2, 3.70, and 6.6, reaching 3.25, and concluded that designing spillways based on a certain percentage of would increase the discharge coefficient, especially when considering the suctions that would occur [26]. In the same year, Abecasis concluded that the value of this percentage of should not be fixed, but that the design should be carried out according to the suction values produced on the spillway crest [27].
Also in 1970, Melsheimer and Murphy of the Waterways Experiment Station (WES) analyzed various shapes of the upstream face of the spillway, designing four spillways with a head m in a channel of width 0.73 m, with ratios of 2.5 and 3.4, where they estimated the discharge coefficients and recorded pressures at the spillway [28]. In 1977, Senturk adjusted a value for the coefficient [29].
In 1985, Maynord conducted measurements in a channel of width 0.762 m, with heads m and 0.4 to 1.5, and values of 0.25, 0.50, 1.00, and 2.00, to adjust his discharge coefficients [30].
In 1991, Hager investigated the main flow characteristics experimentally in two spillways of different geometries, with a face height m, in a channel of width of 0.50 m, and with different design heads, obtaining discharge coefficients for different operating heads [31].
In 2018, Erpicum et al. [32] investigated four high-head standard spillways. They evaluated the discharge coefficients of these spillways up to head ratios of five and reported that the discharge coefficient increases monotonically with the head. Three of the spillways fulfilled the following potential function:
In 2019, Aguilera and Jimenez [33] applied 3D numerical model for flow simulation in spillways. Their results show that the discharge coefficients present a difference of less than 1% with respect to those recommended by USBR, for ratios higher than 1.0. For lower values, the software calculates a higher discharge capacity, which increases as the ratio decreases.
More recently, in 2022, Salmasi and Abraham [34] analyzed the influence of the upstream slope of the spillway and the downstream submergence. Their results showed that for all standard ogee spillways, the discharge coefficient increases with increasing , and then reaching a constant value. Regarding the value of the discharge coefficient, it decreases from 2.25 under free-flow conditions to 2.15 under submerged flow conditions.
In the same year, Stilmant et al. [35] studied the derivation of a theoretical model that relates , independently of empirical coefficients and whose predictions have a wide range of heights. They used potential flow theory, integrated in a curvilinear frame of reference, and critical flow theory. The results show a good fit with the experimental data for ratios between 0 and 5.
Moreover, different studies have been carried out in the last five years regarding the analysis of discharge coefficients over particular spillway types, such as: the studies to increase the discharge coefficient in lateral triangular labyrinth weirs by implementing antivortices [36]; the effects of geometric parameters in trapezoidal-triangular labyrinth weirs [37]; the behavior in horizontal crested weirs under free-flow conditions [38]; the variation with respect to discharge coefficients in round-crested weirs [39]; the impact of upstream orientation angle on the discharge coefficient in wide-crested trapezoidal weirs [40]; or, the appropriate use of modeling approaches for the determination of discharge coefficients in lateral rectangular weirs [41] and predictive models [42]. Nevertheless, neither the past or the recent empirical investigation has been studied at high-altitudes, as Condorama.
Table 1 presents the main characteristics of the tests carried out in the classical study of the discharge coefficient in ogee spillways and the altitude where the experiments were conducted. The table also includes the parameters studied in the present investigation at 4075 m a.s.l.
3. Materials and methods
3.1. Experimental facility
The tests carried out in this paper were conducted in a 21-meter-long channel located at the toe of Condoroma dam (Figure 2) in southern Peru, in the Department of Arequipa, at an altitude of 4075 m a.s.l. The channel is divided into three sections (b).
Figure 3: the water intake zone is 1.83 m wide, 9.00 m long, and 1.10 m high; the test zone is 0.915 m wide, 8.10 m long, and 0.75 m high; and finally, the outlet reach presents a difference in level of 0.70 m over a length of 3.90 m. It is 0.915 m wide and 0.75 m high.
Five ogee spillways were tested, each designed according to USBR criteria [1], with different upstream face heights . The assumed design head is m for faces m, 0.20 m, 0.10 m, and 0.05 m, and m for face m. These values correspond to 2, 1.50, 1, 0.5, and 0.25. Figure 4a shows the spillway for , and Figure 4b shows the spillway for .
3.2. Instrumentation
The experimental model is equipped with a Sontek-IQ Plus current meter (Figure 5a), which measures velocity in the range of 0 to 5 m/s with an accuracy of ±0.005 m/s, depth with an accuracy of ±0.003 m, and temperature with ±0.2% of full scale.
The flume is fed by a pumping system (Figure 5b) that draws water from the head chamber of the Condoroma dam hydroelectric power plant and can supply up to 415 l/s.
3.3. Operating conditions
The different spillways were set up according to their different face heights (), as mentioned above, and they operated with flow rates between 49 l/s and 415 l/s. Each test was performed by measuring the flow rate and water depth at a frequency of 0.1 Hz for at least 5 minutes.
For each case, it was ensured that the head in the measurement zone (Figure 1) exceeded m to ensure that the head at the spillway crest always remained above 0.05 m . This was done to prevent scale effects produced by viscosity and surface tension, as recommended by Schoder and Turner ( m) [44], Eisner ( m) [45], Ghetti ( m) [46], and Vischer and Hager ( m) [47], with Hager et al. subsequently indicating at least values of m [48] and Carrillo et al. (h>0.045 m) [49].
4. Results
Equation (2) was used for the different flow rates tested. Likewise, the discharge coefficient , was adjusted from equation (5). The following subsections present the adjusted coefficients for the different spillway heights and the different rates /.
4.1. Spillway (P = 0.35 m and m)
Froude numbers between 0.062 and 0.25 were tested, corresponding to flow rates ranging from 53 l/s to 363 l/s, with water heights in the measurement zone ranging from 0.45 m to 0.634 m. The water depths over the spillway crest vary between 0.073 m and 0.214 m, with Froude numbers of 0.96 and 1.28, respectively.
4.2. Spillway (P = 0.30 m and m)
Froude numbers between 0.068 and 0.313 were tested, corresponding to discharges between 49 l/s and 400 l/s and water heights in the measurement zone from 0.399 m to 0.607 m. The water depths over the spillway crest ranged between 0.074 m and 0.24 m, corresponding to Froude numbers of 0.85 and 1.18, respectively. Figure 7 shows the experimental results obtained from the Condoroma data.
4.3. Spillway (P = 0.20 m and m)
Froude numbers between 0.11 and 0.42 were analyzed, resulting in variable flow rates between 52 l/s and 415 l/s and water depths in the measurement zone between 0.301 m and 0.492 m. Over the spillway crest, the water depths were 0.074 m and 0.233 m, with Froude numbers of 0.89 and 1.29, respectively. In Figure 8, the Condoroma data are compared with those obtained by S. Maynord [30] for .
4.4. Spillway (P = 0.10 m and m)
The Froude numbers in this case ranged between 0.22 and 0.62, obtained from flow rates between 56 l/s and 391 l/s with depths in the measurement zone between 0.20 m and 0.368 m. Over the weir crest, the water depth ranged between 0.086 m and 0.212 m, corresponding to Froude numbers of 0.78 and 1.40, respectively. Figure 9 shows the comparison of the results obtained from the Condoroma data with those obtained by Maynord [30] for .
4.5. Spillway (P = 0.05 m and m)
The Froude numbers analyzed fluctuated between 0.37 and 0.93, corresponding respectively to 61 l/s and 345 l/s flow rates, with depths in the measurement zone between 0.15 m and 0.28 m. On the other hand, over the spillway crest, the water depths ranged from 0.10 m to 0.223 m, corresponding to Froude numbers of 0.63 and 1.15, respectively. Figure 10 shows the data obtained at Condoroma compared with those shown by Maynord [30] for the same .
Table 2 summarizes for each , the values of , , and , obtained from the experimental campaign conducted at Condoroma and compares them with those corresponding to different authors who have used the same or similar relationships between sill height () and design head ().
4.6. Aggregated analysis P/Hd
Figure 11 shows the coefficient of equation (6) for the design head of the five tested spillways at Condoroma, in addition to the curve proposed by USBR [1].
In Figure 12, the Condoroma experimental data are plotted for all ratios , showing the relationship between the operating and design heads on the horizontal axis and the discharge coefficient on the vertical axis. This data is compared in Figure 12a with the values fitted from the equations proposed by Brudenell [17], Randolph [20], and Senturk [29]. Similarly, in Figure 12b, the data is compared with the results by Hager [31], Dillman [14], Rouse and Reid [15], and Montes [5].
Table 3 condenses the adjustment coefficients ( and ) of the discharge coefficient () of equation (5) obtained by the different authors analyzed.
As previously indicated, often in the works referenced in this paper, the discharge coefficients were fitted from the dimensional coefficient of equation (4). Figure 13, shows the comparison of the values of the dimensional discharge coefficient obtained from the Condoroma experimental data with those shown by USBR [1], Maynord [30], Murphy [28], and Cassidy [26].
Table 4 summarizes the coefficients ( and ) of the discharge coefficient () of equation (5).
5. Discussion
The values of the discharge coefficient for the dimensionless design head (equations (3) and (5)) obtained from the Condoroma data are consistently lower than those reported by Maynord [30], with a maximum difference of 6.5% for and a minimum difference of 1.5% for . In relation to Cassidy [26], for , the difference is 10.8%. Regarding the exponent , the values at Condoroma, when compared with those of Maynord [30], are higher for and , varying between 17% and 49%, and lower by 8.5% for .
When analyzing all the values obtained for the ratios tested at Condoroma, it is evident that they are lower by 5% and 10% than the values presented by Randolph Jr [20] and Cassidy [26], respectively.
Table 3 shows that the values presented by the different authors analyzed vary between 0.49 [20] and 0.518 [26], while the Condoroma results show a value of 0.466. It is known that the discharge coefficient arises from flow energy losses due to roughness, the non-uniform distribution of the velocity profile in the access channel, and the contraction of the streamlines when accessing the spillway [4].
Regarding the coefficients of determination , for , the lowest value is 0.719, which is high considering the number of data points on which it is based.
For , the is 0.623, higher than the one evaluated for the data from S. Maynord [30]. With respect to , the is 0.483, the lowest value processed in Condoroma, and lower than that of S. Maynord. Both relationships , are not recommended for design because, as reported by S. Maynord, they exhibit many instabilities.
The scatter of the data at Condoroma is greater for lower ratios, regardless of the approach depths . This is because subcritical flow occurred at the spillway crest, where disturbances travel upstream. In addition, some of this dispersion may be due to the fact that when the test flow rate increases, the viscous forces are more important than when the flow rate decreases. Although it should be noted that, since the flow is turbulent, it is natural for the velocity and pressure at a fixed point to fluctuate randomly around the mean value.
In the tests carried out in Condoroma, in relation to the boundaries roughness, the same material used by Maynord [30] was used; as for the velocity distribution in the access channel, this has a greater effect on the spillway as the channel narrows due to the disturbances introduced by the sidewalls [4]. Considering that the width of the Condoroma channel is 0.915 m, its velocity distribution is more homogeneous compared to the other channels shown in Table 1; and, finally, the contraction of the streamlines in Condoroma has greater curvature as demonstrated by the results of previous sharp-crested weirs tests, which are affected by the low atmospheric pressure in the area.
Regarding Figure 11, which plots the relationship and (design head coefficient), the curve reported by USBR does not contain the data on which it was based. But assuming that the curve represents the data and can be described by a potential function, its is 0.89, and for Condoroma is 0.88.
With respect to the location of the measurement zone in Condoroma, it can be specified that the whole cross-section participates uniformly in the discharge. No significant vertical accelerations are observed, so it can be accepted that the pressure distribution follows, approximately, a hydrostatic behavior. It is known that in a flow with a free fall, the measuring section should be located between and upstream of the fall [50]. In Rouse [51], in sharp-crested weirs with 62.5 l/s, it is reported that the curvature of the nappe reached up to 0.90 m upstream of the spillway crest. Therefore, it is considered appropriate, in the present experimental campaign, to measure at 2.85 m from the spillway crest, even for the higher flow rate tested.
The Froude number in the measurement area was subcritical for all the spillway heights analyzed, while at the spillway crest, values were obtained for both subcritical and supercritical flow.
Finally, it is observed that the dimensionless height ratio has a significant influence on the discharge coefficients adjusted in Condoroma. Experimentally, it has been verified that in the case of heights , the streamlines of the flow presented greater regularity and stability, being of more predictable behavior. On the other hand, at dimensionless heights , a somewhat more unstable flow behavior is observed with the appearance of waves that are difficult to attenuate, which makes it difficult to measure the water depths and ends up introducing uncertainty in the adjustment of the respective discharge coefficients.
In view of the experimental results shown in the present paper on a family of spillways of dimensionless height of values 2, 1.5, 1, 1, 0.5, and 0.25 at heights of approximately 4000 m a.s.l., for values of ranging between 0.54 and 1.65, it is suggested to adjust the discharge coefficient from the next relations:
and:
6. Conclusions
This work explores the influence of atmospheric pressure on the discharge coefficients in the design of ogee spillways. To achieve this objective, an experimental campaign was carried out at an altitude of 4075 m a.s.l., and the recorded data have been compared with those obtained previously. The main conclusions drawn are the following:
- −
- At altitudes above 4000 m a.s.l., the discharge coefficients show substantial differences compared to those obtained in other environments, resulting in consistently lower values than those obtained to date in previous works developed at lower altitudes above sea level.
- −
- The coefficient has a greater influence on the value of the discharge coefficient . The difference of at least 5% reflects fundamentally the influence of the greater curvature of the nappe over the spillway due to the reduction of atmospheric pressure in the zone.
- −
- The ratio influences the discharge coefficients in Condoroma, and values are recommended for the design of the spillway profile.
- −
- The equations to determine the discharge coefficients, equations (10), (11), and (12), for Condoroma could be used in areas with similar altitudes in the absence of experimental data.
Author Contributions
Conceptualization, V.R. and M.S.-J; methodology, V.R. and M.S.-J.; software, V.R., M.S.-J,S.E. and M.S.-R.; validation, V.R.,M.S.-J,S.E., M.S.-R. and A.H.P; formal analysis, V.R, M.S.J,S.E., M.S.-R., P.R. and A.H.P. and; investigation, V.R, M.S.J,S.E., M.S.-R., P.R. and A.H.P.; resources, V.R, M.S.J,S.E., M.S.-R., P.R. and A.H.P. data curation, V.R.,M.S.-J; writing—original draft preparation, V.R, M.S.J,S.E., M.S.-R., P.R. and A.H.P.; writing—review and editing, V.R, M.S.J,S.E., M.S.-R., P.R. and A.H.P.; visualization, V.R, M.S.J,S.E., M.S.-R., P.R. and A.H.P.; supervision, V.R. and M.S.-J; project administration, V.R. and M.S.-J; funding acquisition, V.R. All authors have read and agreed to the published version of the manuscript.
Funding
This research was financed by the Universidad Nacional de San Agustín de Arequipa - Peru, through financing contract No. 0042-2016-UNSA.
Data Availability Statement
Some or all data, models, or codes that support the findings of this study are available from the corresponding author upon reasonable request.
Acknowledgments
We would like to thank Universidad Nacional de San Agustín de Arequipa, UNSA, Arequipa, Perú. This article was supported by a Research Project under the contract IBA-IB- 0042-2016-UNSA.
Conflicts of Interest
The authors declare no conflict of interest.
References
- U.S.B.R. Design of Small Dams, 1960, 1973, 1977 ed.; Bureau of Reclamation: 1987.
- Sotelo, G. Diseño hidráulico de obras; Facultad de Ingeniería - UNAM: Mexico, 1994.
- Poleni, G. De motu acque mixto; Raccolta di autori che affrontano il movimento dell'acqua, 2a edizione, Firenze, Italia. 1767: Patavii-Padua, 1717.
- Naudascher, E. Hidraulica de canales; Limusa: Mexico, 2002.
- Montes, S. Hydraulics of open channel flow; ASCE Press: 1998.
- Weisbach, J. Allgemeine maschinen enzyklopadie. 1841.
- Rouse, H. Fluid mechanics for hydraulic engineers, First ed.; McGraw-Hill Book Company: New York - London, 1938.
- Russell, G. Hydraulics, 5th ed.; Henry Holt and Company, 1948.
- Horton, R.E. Weir experiments, coefficients, and formulas. 1907.
- Mueller, R. Development of Practical Type of Concrete Spillway Dam. Engineering Records 1908, 58, 461.
- Morrison, E.; Brodie, O. Mansory dam design., John Wiley & Sons, Inc. ed.; John Wiley & Sons, I., Ed.; John Wiley & Sons, Inc.: 1916.
- Creager, W. Engineering for masonry dams, Jhon Wiley and Sons, New York, 1917,pp 105-110 New York, 1917.
- Nagler, F.; Davis, A. Experiments on discharge over spillway and models, Keokuk Dam. 1930; pp. 777-820, 844. [CrossRef]
- Dillmann, O. Untersuchungen an ueberfallen Mitteilungen des hydraulics institus der T.H. Munchen 1933, 7.
- Rouse, H.; Reid, L. Model research on spillway crest. Civil Engineering 1935, 5, 10.
- Doland, J. Flow over rounded crests. Engineering News Record 1935, 114, 551.
- Brudenell, R. Flow over rounded crests Engineering News Record 1935, 115, 95.
- Chow, V. Open-Channel Hydraulics; McGraw-Hill Book Company: 1959.
- Vitols, A. Vacuumless dam profiles. Wasserkraft und wasserwirtschaft 1936, 31, 207.
- Randolph, R.J. Hydraulic tests on the spillway of the Madden Dam. In Proceedings of the ASCE, 1937. [CrossRef]
- Borland, W. Flow over crest weirs. Civil Engineering - Colorado State, 1938.
- Bradley, J. Refinements in the design of overfall spillway sections; Bureau Reclamation United States: 1947.
- U.S.B.R. Studies of crests for overflow dams - Bulletin 3 Bureau of Reclamation: 1948; pp. 1 - 5.
- Webster, M. Spillway Design for Pacific Northwest Projects. Journal of the Hydraulics Division 1959, 85, 63-85. [CrossRef]
- Cassidy, J. Spillway discharge at other than design head. State Univesity of Iowa, 1964.
- Cassidy, J. Designing spillway crests for high head operation. Journal of Hydraulics, ASCE 1970, HY3, 745 - 753. [CrossRef]
- Abecasis, F. Discussion of Designing spillway crests for high head operation. Journal of Hydraulics Division ASCE 1970, 96, 2654 - 2658. [CrossRef]
- Melsheimer, E.; Murphy, T. Investigations of various shapes of the upstream quadrant of the crest of a high spillway; Hidraulic Laboratory Investigation; Vicksburg, Miss, 1970.
- Senturk, F. Hydraulics of dams and reservoirs; Water Resouces Publications: 1994.
- Maynord, S. General Spilway Investigation; 1985.
- Hager, W. Experiments on standard spillway flow. In Proceedings of the Institute Civil Engineers, 1991; pp. 399 - 416.
- Erpicum, S.; Blancher, B.; Vermeulen, J.; Peltier, Y.; Archambeau, P. Experimental study of ogee crested weir operation above the design head and influence of the upstream quadrant geometry. In Proceedings of the 7th International Symposium on Hydraulic Structures, Aachen, Germany 2018.
- Aguilera, E.; Jimenez, O. Applicability of a 3D numerical model for flow simulation of spillways. In Proceedings of the 38th IAHR World Congress, Panama Cyti, Panama, September 1-6, 2019; p. 11.
- Salmasi, F.; Abraham, J. Discharge coefficients for ogee spillways. Water Suply 2022, 22, 17. [CrossRef]
- Stilmant, F.; Erpicum, S.; Peltier, Y.; Archambeau, P.; Dewals, B.; Pirotton, M. Flow at an Ogee Crest Axis for a Wide Range of Head Ratios: Theoretical Model. Water 2022, 14. [CrossRef]
- Abbasi, S.; Fatemi, S.; Ghaderi, A.; Di Francesco, S. The Effect of Geometric Parameters of the Antivortex on a Triangular Labyrinth Side Weir. Water 2021, 13. [CrossRef]
- Ghaderi, A.; Daneshfaraz, R.; Dasineh, M.; Di Francesco, S. Energy Dissipation and Hydraulics of Flow over Trapezoidal–Triangular Labyrinth Weirs. Water 2020, 12. [CrossRef]
- Zerihun, Y.T. Free Flow and Discharge Characteristics of Trapezoidal-Shaped Weirs. Fluids 2020, 5. [CrossRef]
- Gong, J.; Deng, J.; Wei, W. Discharge Coefficient of a Round-Crested Weir. Water 2019, 11. [CrossRef]
- Jiang, L.; Diao, M.; Sun, H.; Ren, Y. Numerical Modeling of Flow Over a Rectangular Broad-Crested Weir with a Sloped Upstream Face. Water 2018, 10. [CrossRef]
- Di Bacco, M.; Scorzini, A.R. Are We Correctly Using Discharge Coefficients for Side Weirs? Insights from a Numerical Investigation. Water 2019, 11. [CrossRef]
- Granata, F.; Di Nunno, F.; Gargano, R.; de Marinis, G. Equivalent Discharge Coefficient of Side Weirs in Circular Channel—A Lazy Machine Learning Approach. Water 2019, 11. [CrossRef]
- Rouse, H. Discharge characteristics of the free overfall. Civil Engineering 1936, 6, 257 - 260.
- Schoder, E.T., B. Precise weir measurements. In Proceedings of the Trasactions, ASCE, 1929; p. 93.
- Eisner, F. Overfall tests to various model scales. Traslation WES 1933, 42.
- Ghetti, A. Effects of surface tension on the shape of liquid jets. Advanced Study Institute: Padova 1966, 424-475.
- Vischer, D., Hager, W. Dam Hydraulics Wiley Series: 1998.
- Hager W., S.A., Boes R. y Pfister M. Hydraulic Engineering of dams; 2021.
- Carrillo, J.; Ortega, P.; Castillo, L.; Garcia, J. Experimental Characterization of Air Entrainment in Rectangular Free Falling Jets. Water 2020, 12. [CrossRef]
- Henderson, F. Open Channel Flow; The Macmillan Company New York, 1966; p. 522.
- Rouse, H. The distribution of hydraulic energy in weir flow with relation to spillway design. Massachusetts Institute of Tecnology, 1932.
Figure 1.
Sketch of a standard spillway.
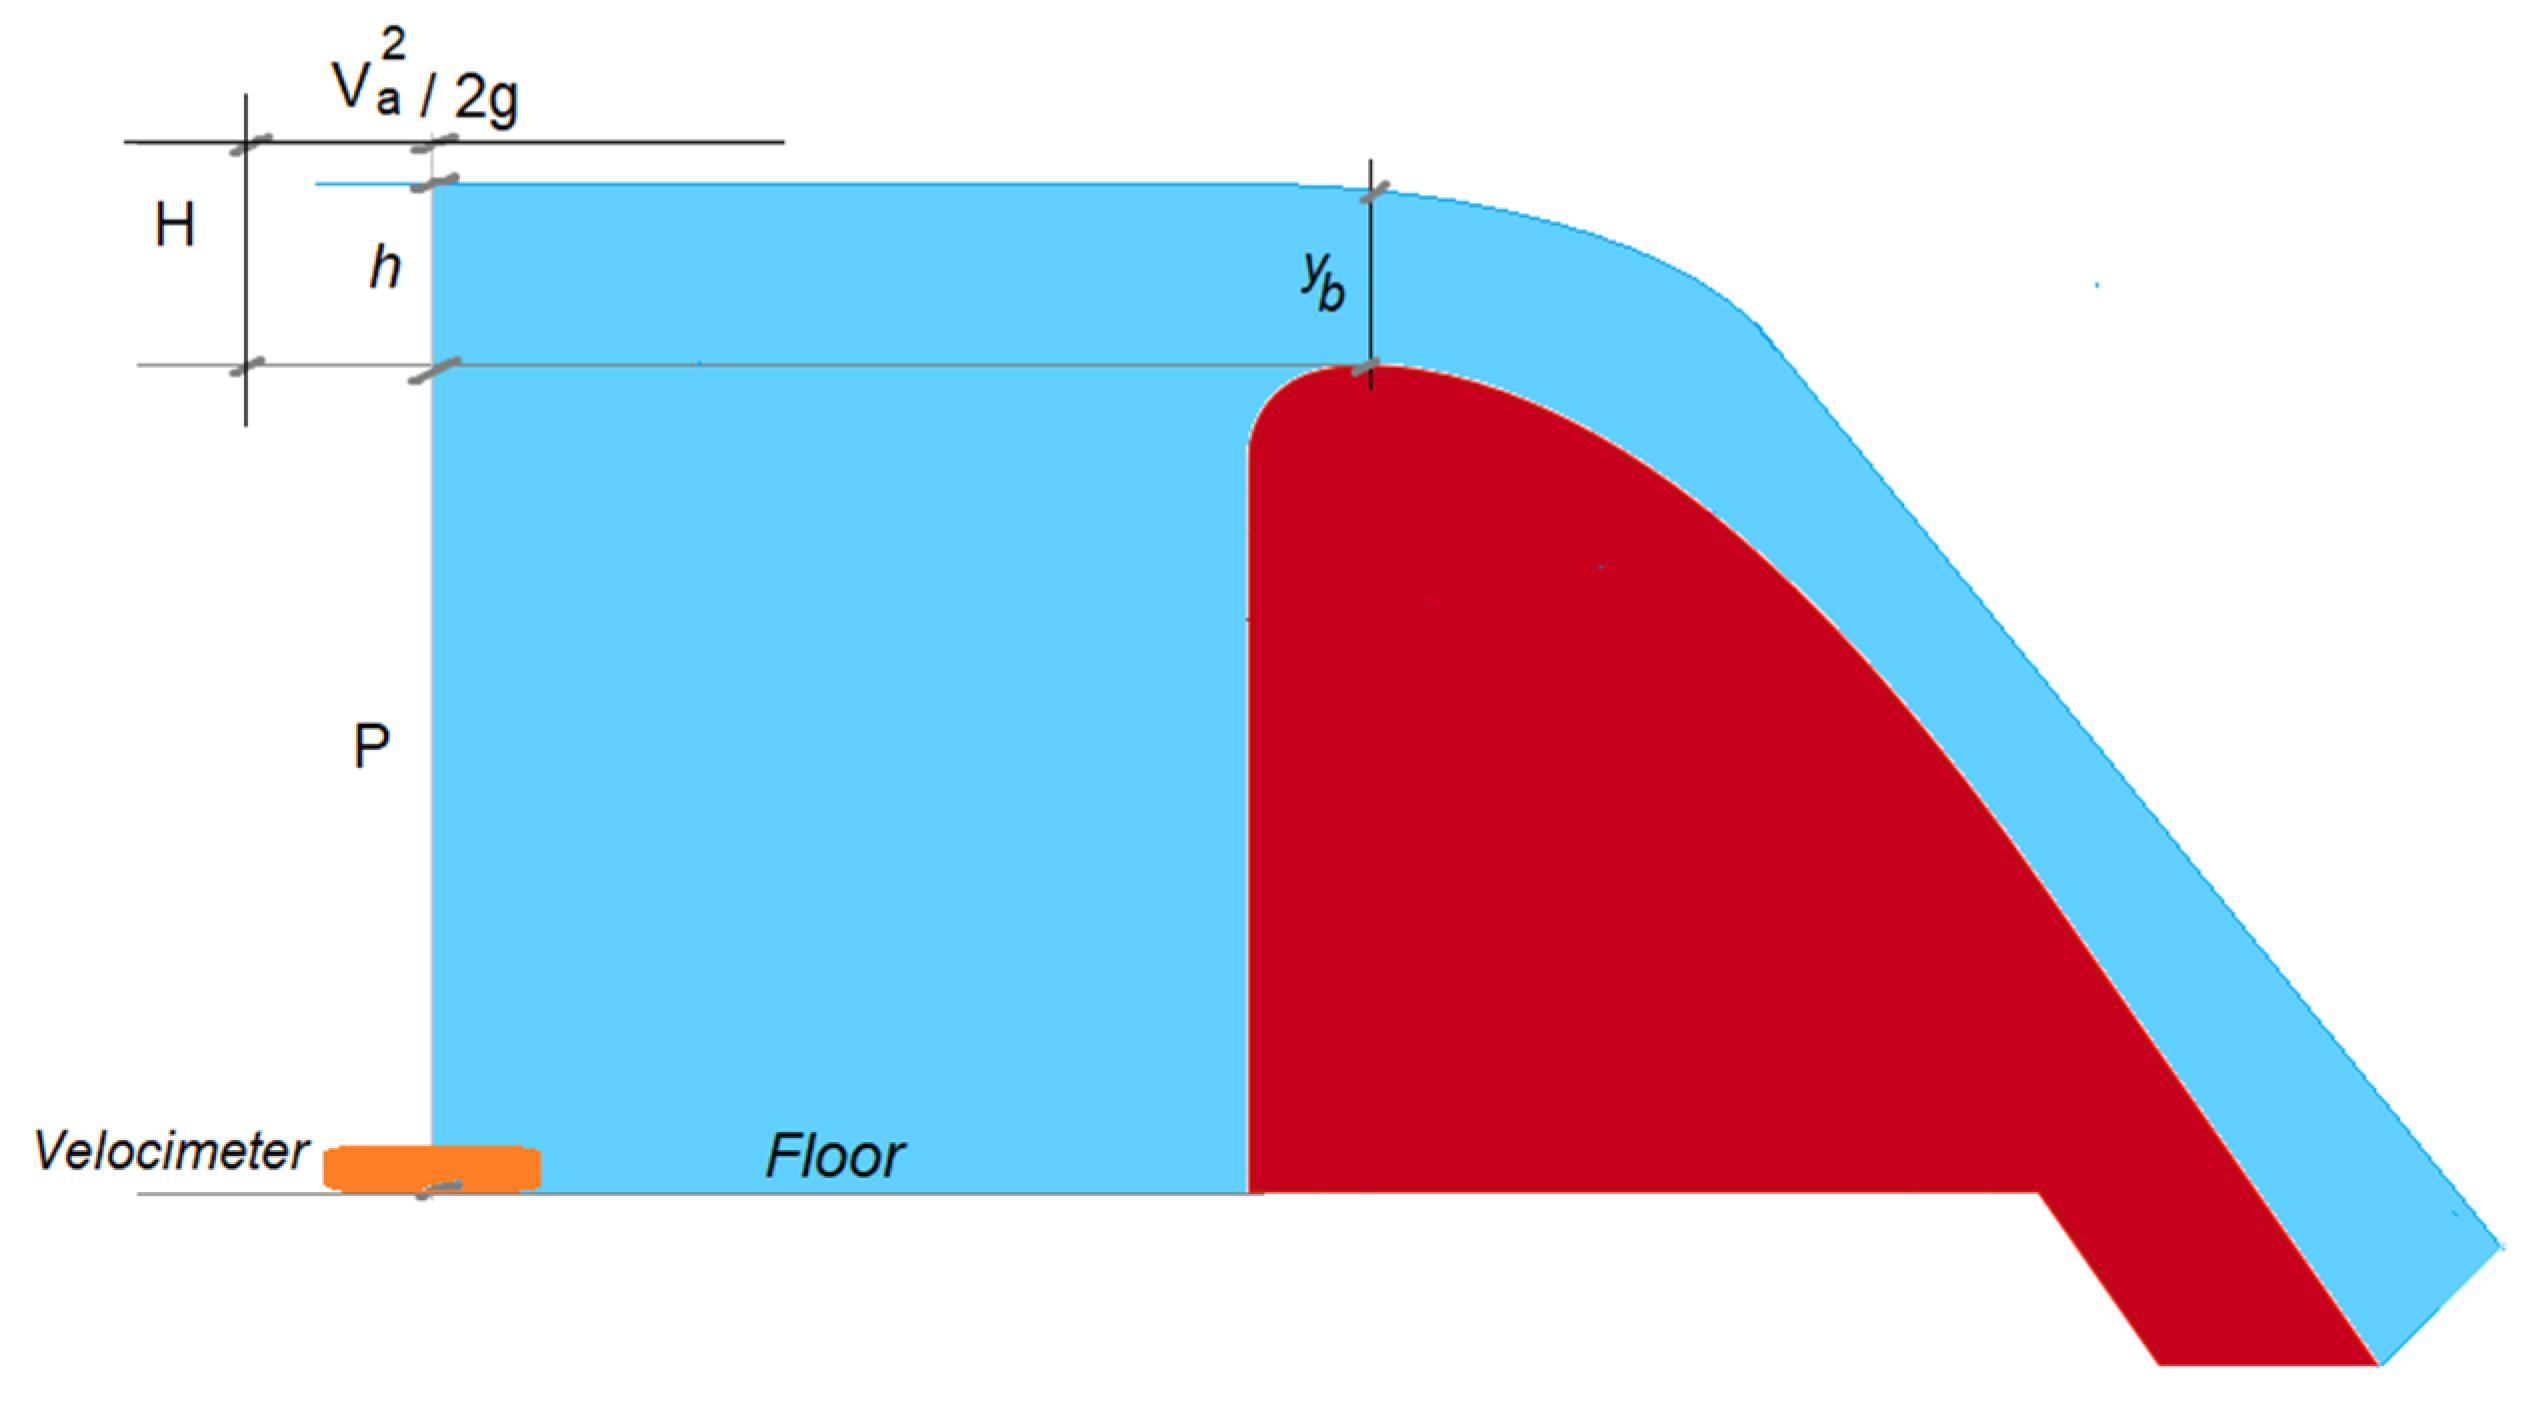
Figure 2.
General view of the 21-meter-long experimental channel located close to Condoroma dam at 4075 m a.s.l.
Figure 2.
General view of the 21-meter-long experimental channel located close to Condoroma dam at 4075 m a.s.l.
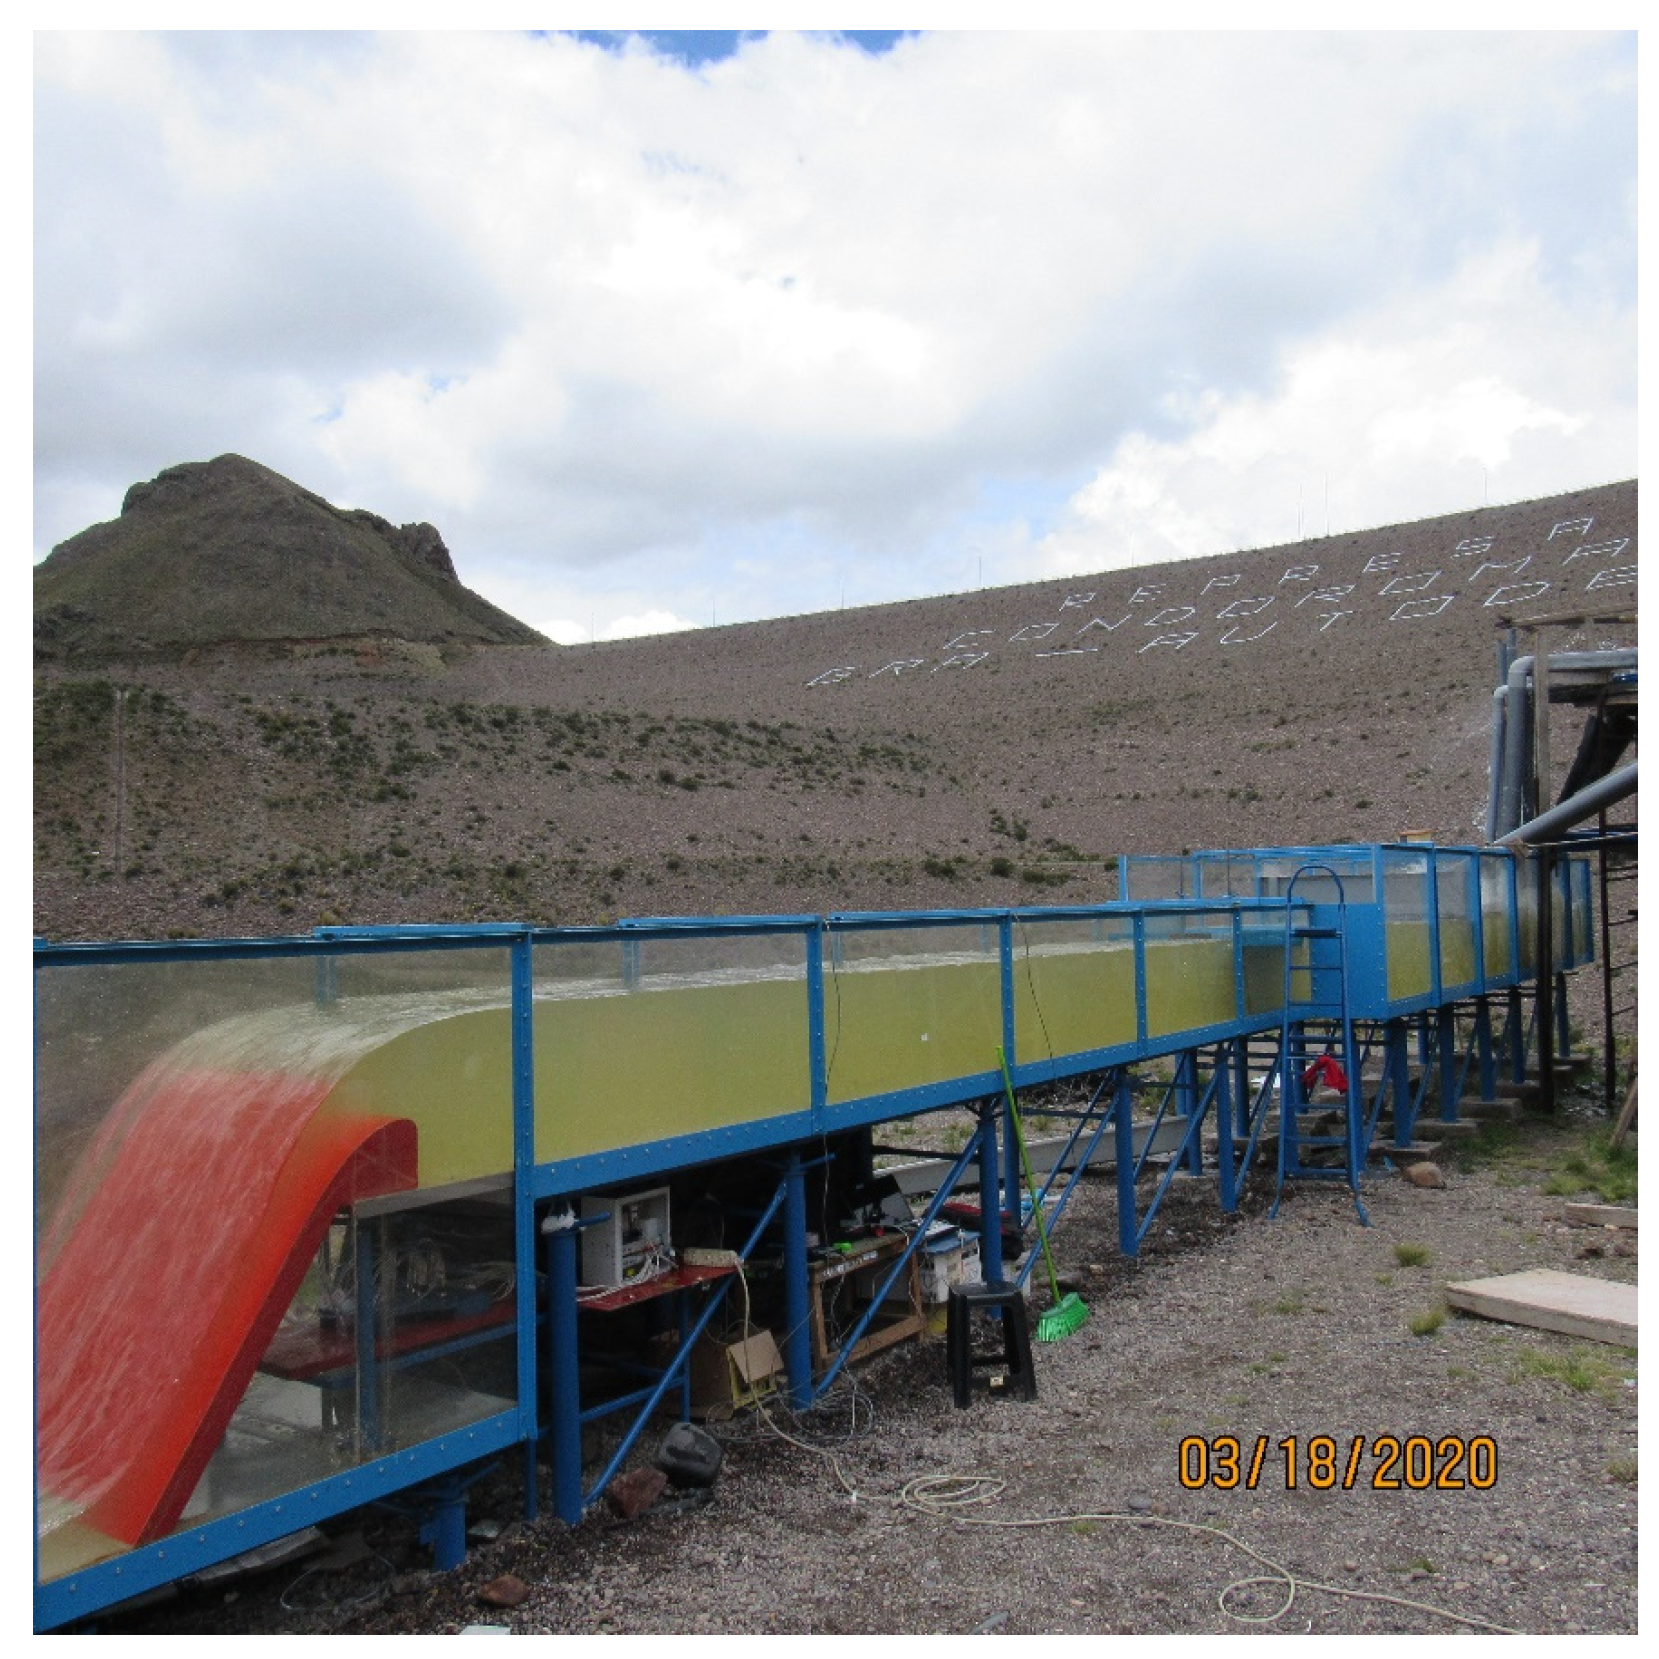
Figure 3.
Plan view and profile of the hydrodynamic channel.
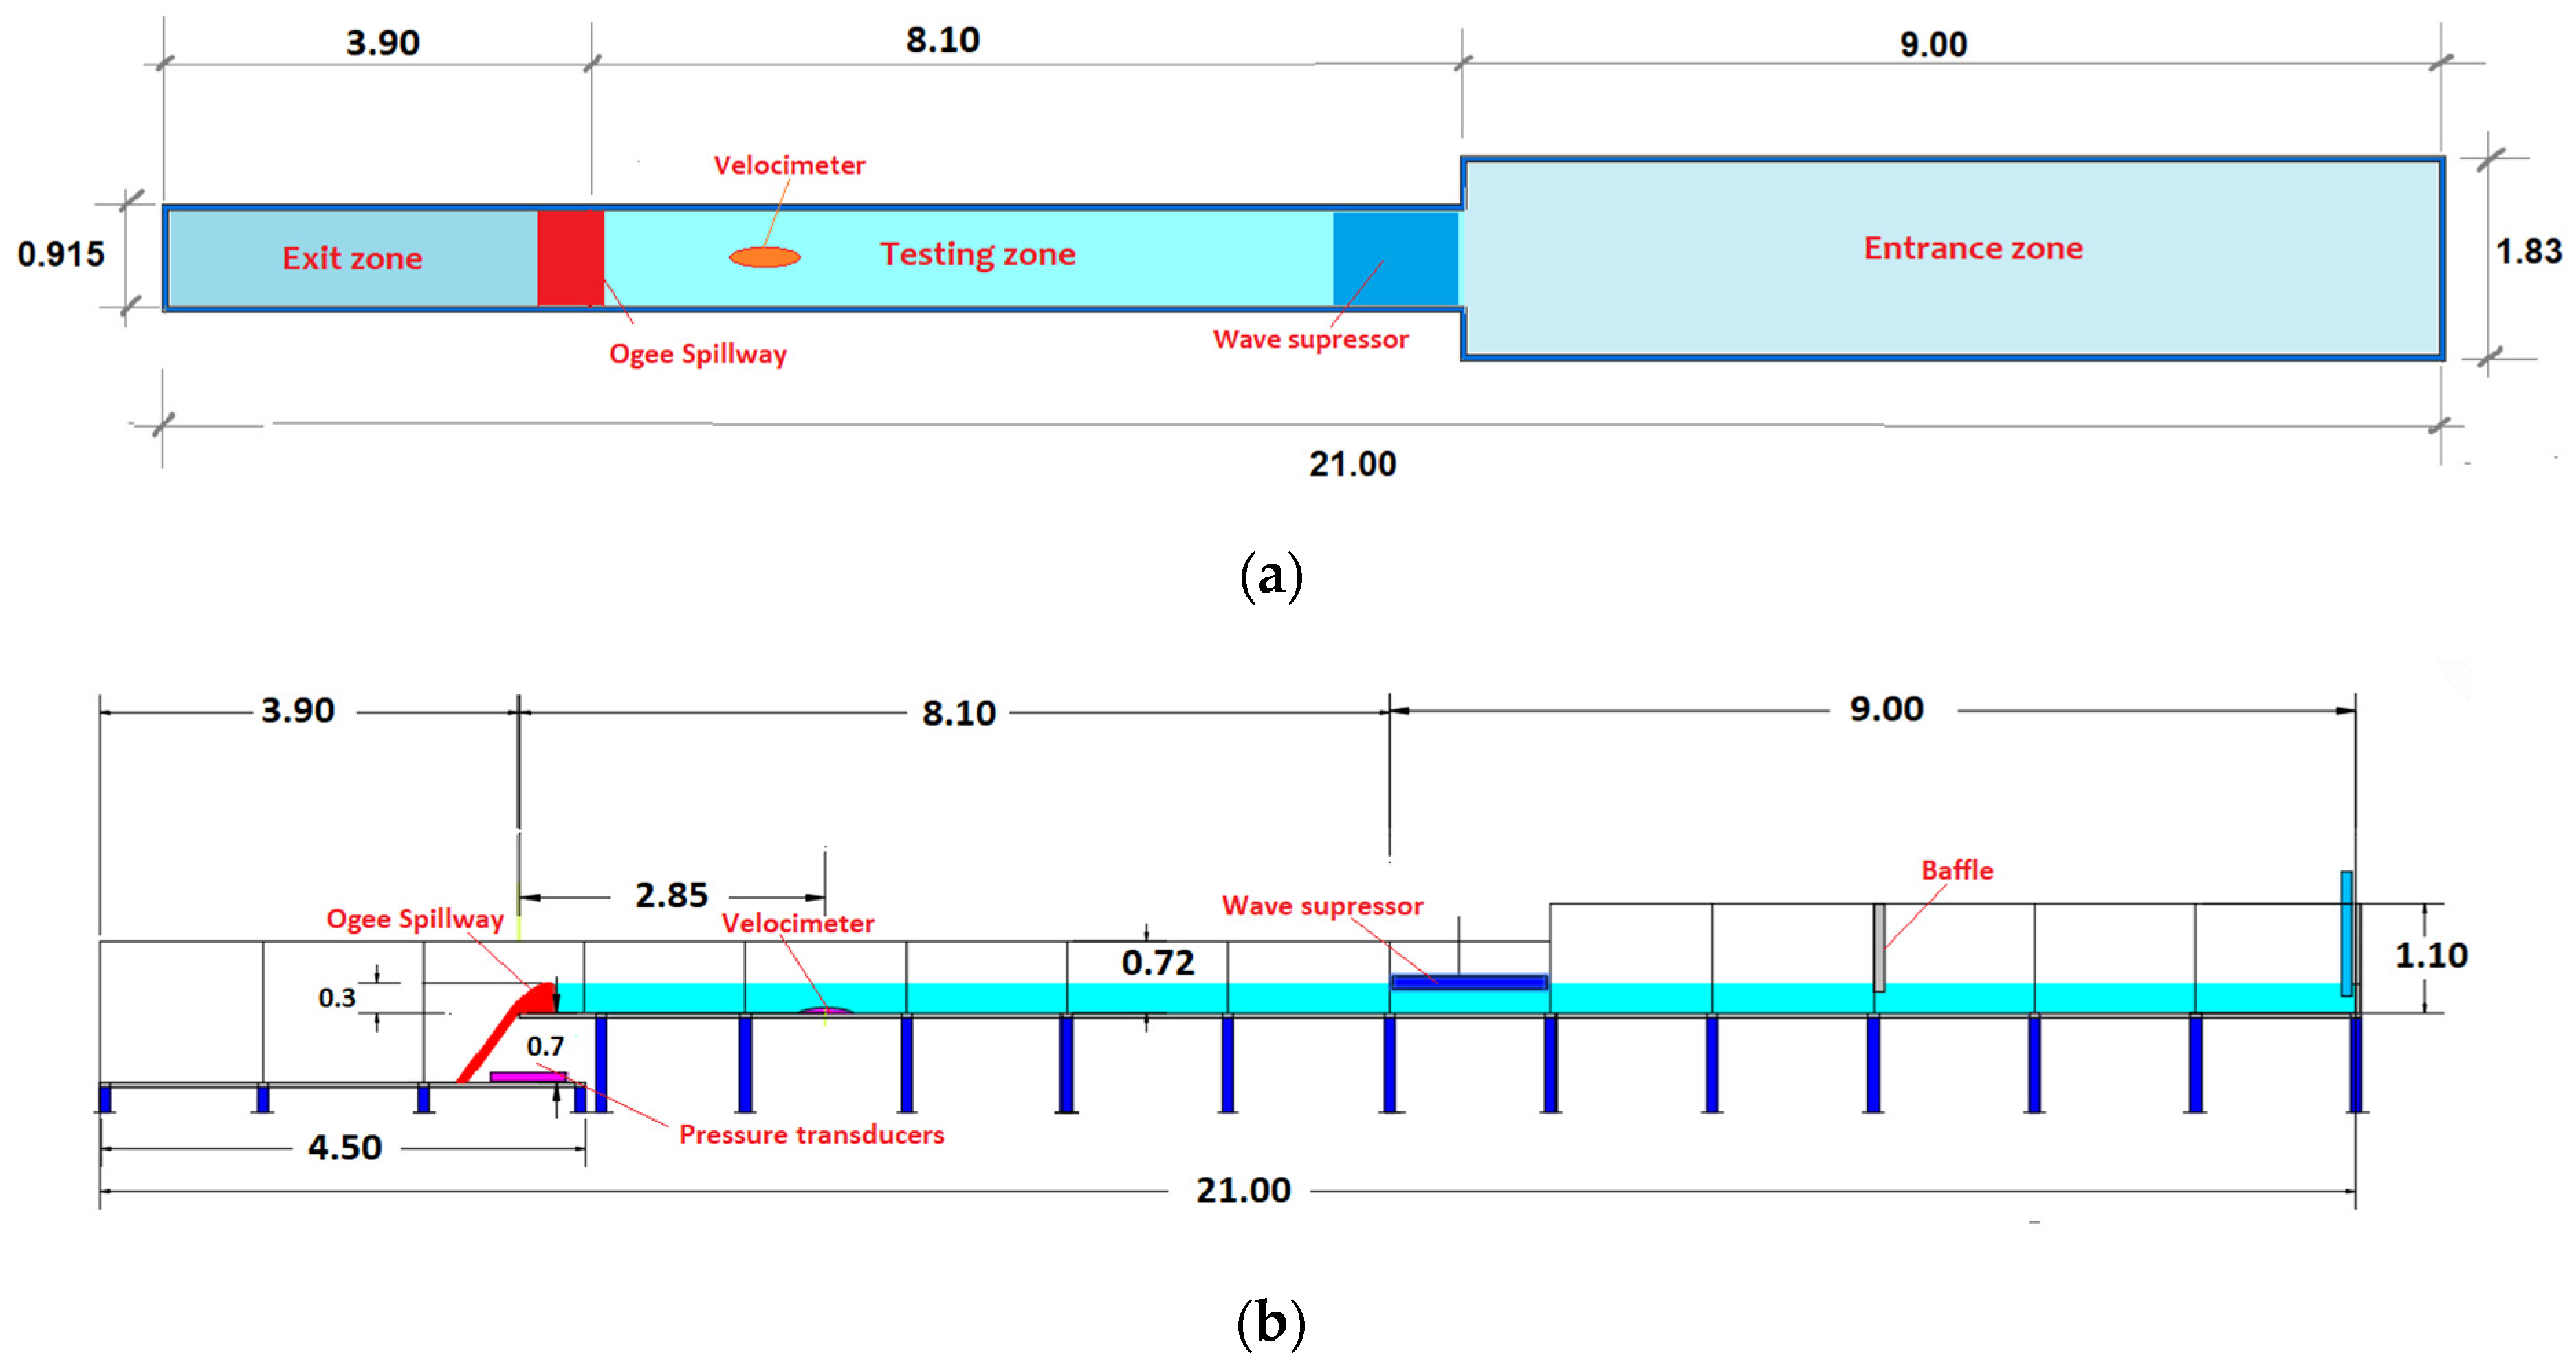
Figure 4.
View of two of the ogee-tested profiles: (a) ; (b) . Additionally, 1.5, 1, and 0.25 were tested.
Figure 4.
View of two of the ogee-tested profiles: (a) ; (b) . Additionally, 1.5, 1, and 0.25 were tested.
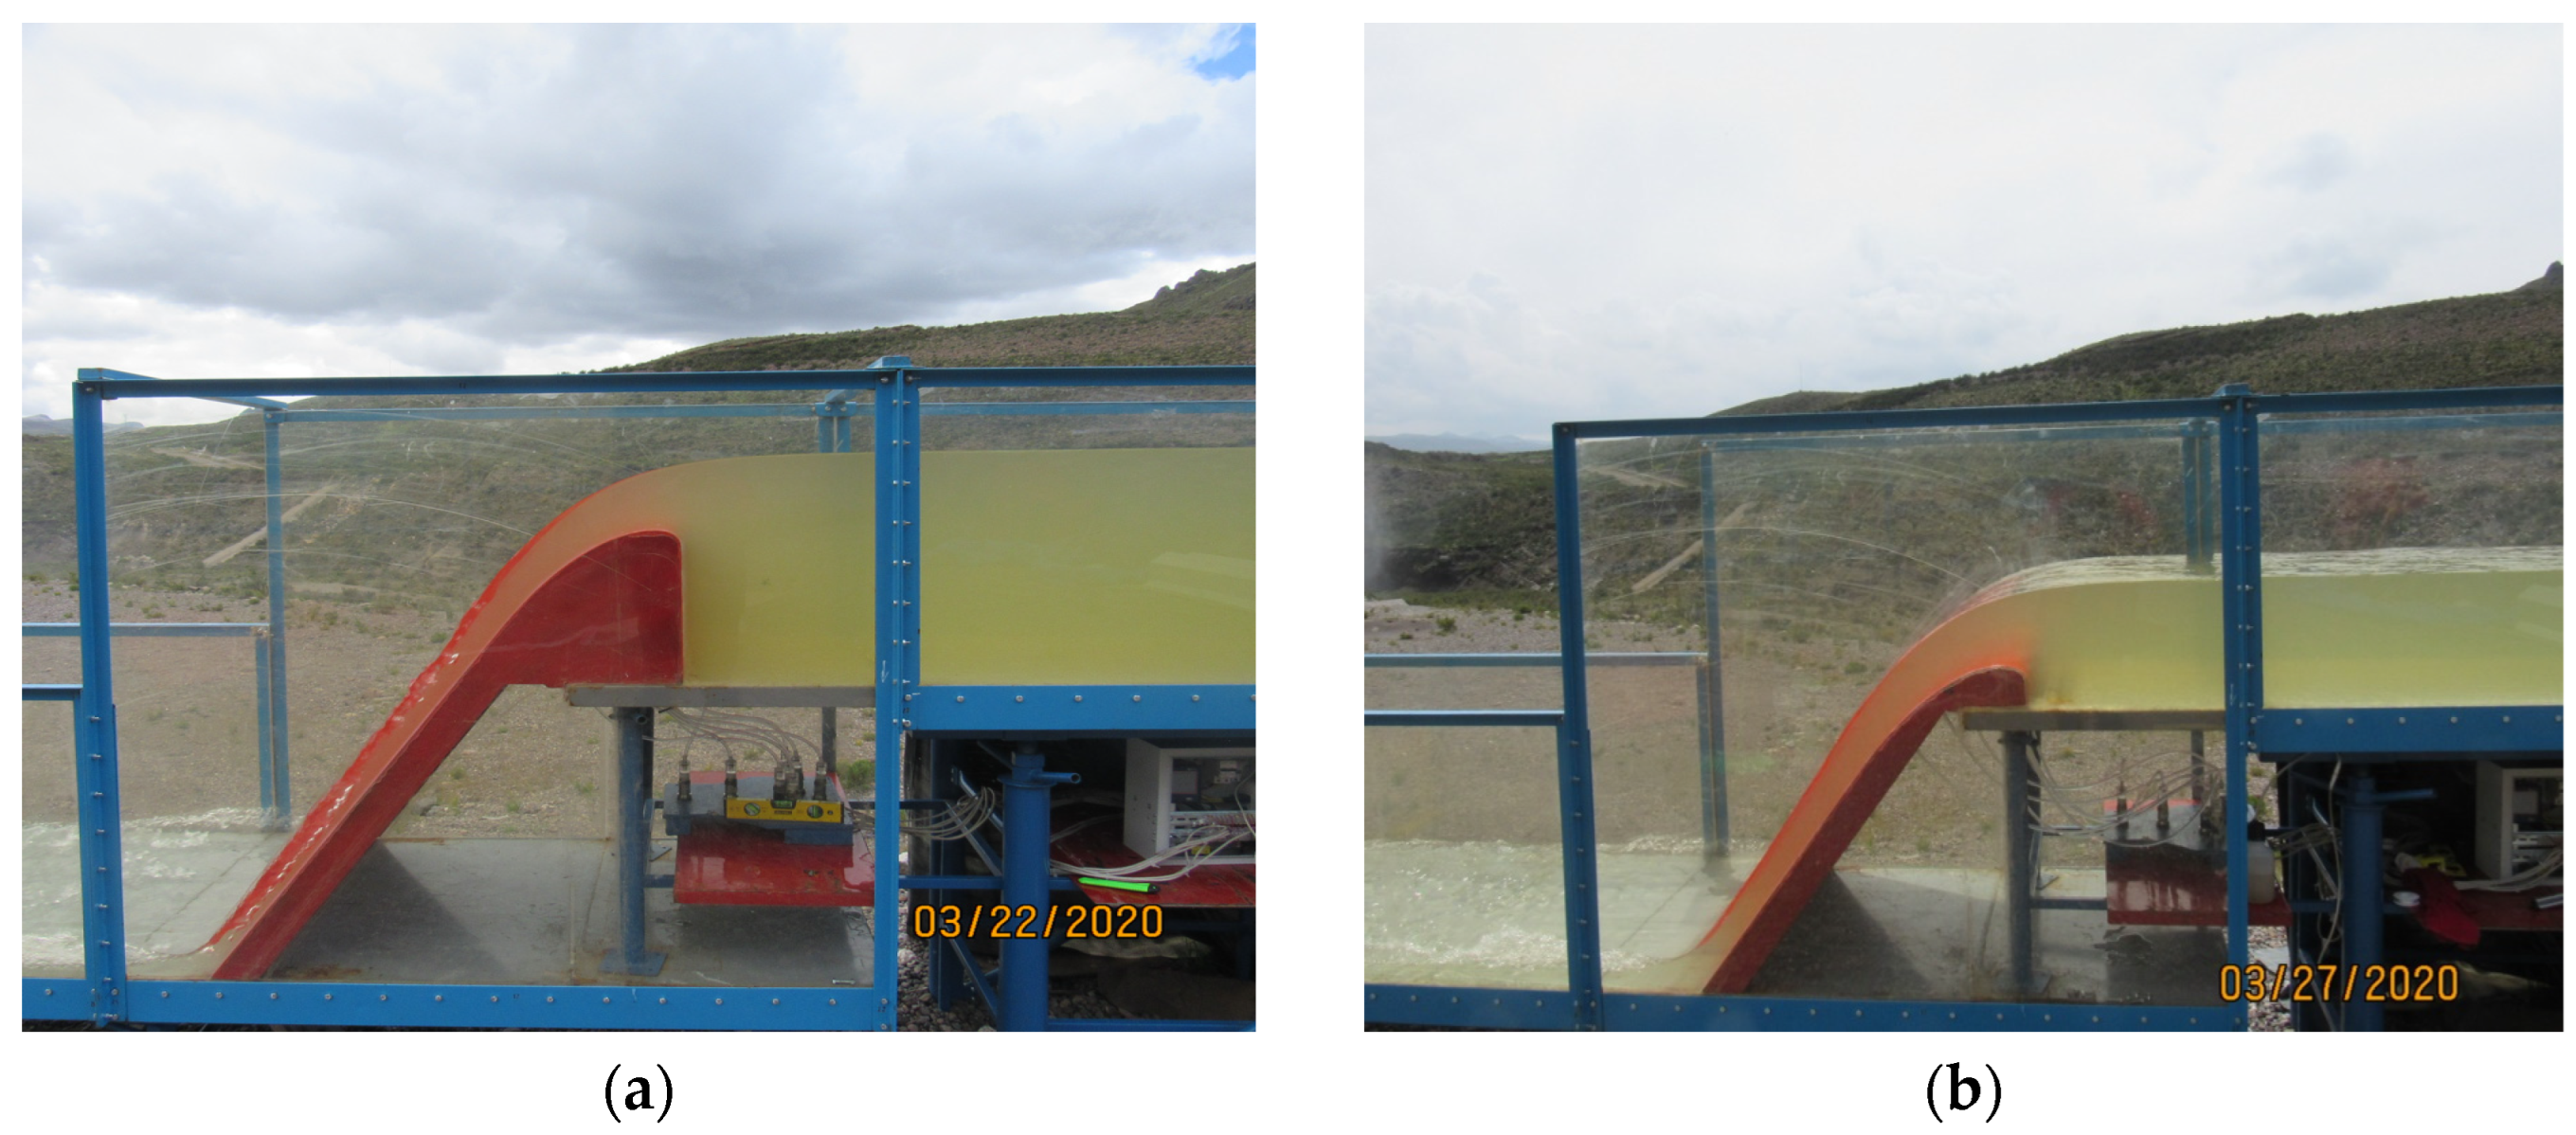
Figure 5.
(a) Sontek current meter – IQ plus; (b) pumping system.
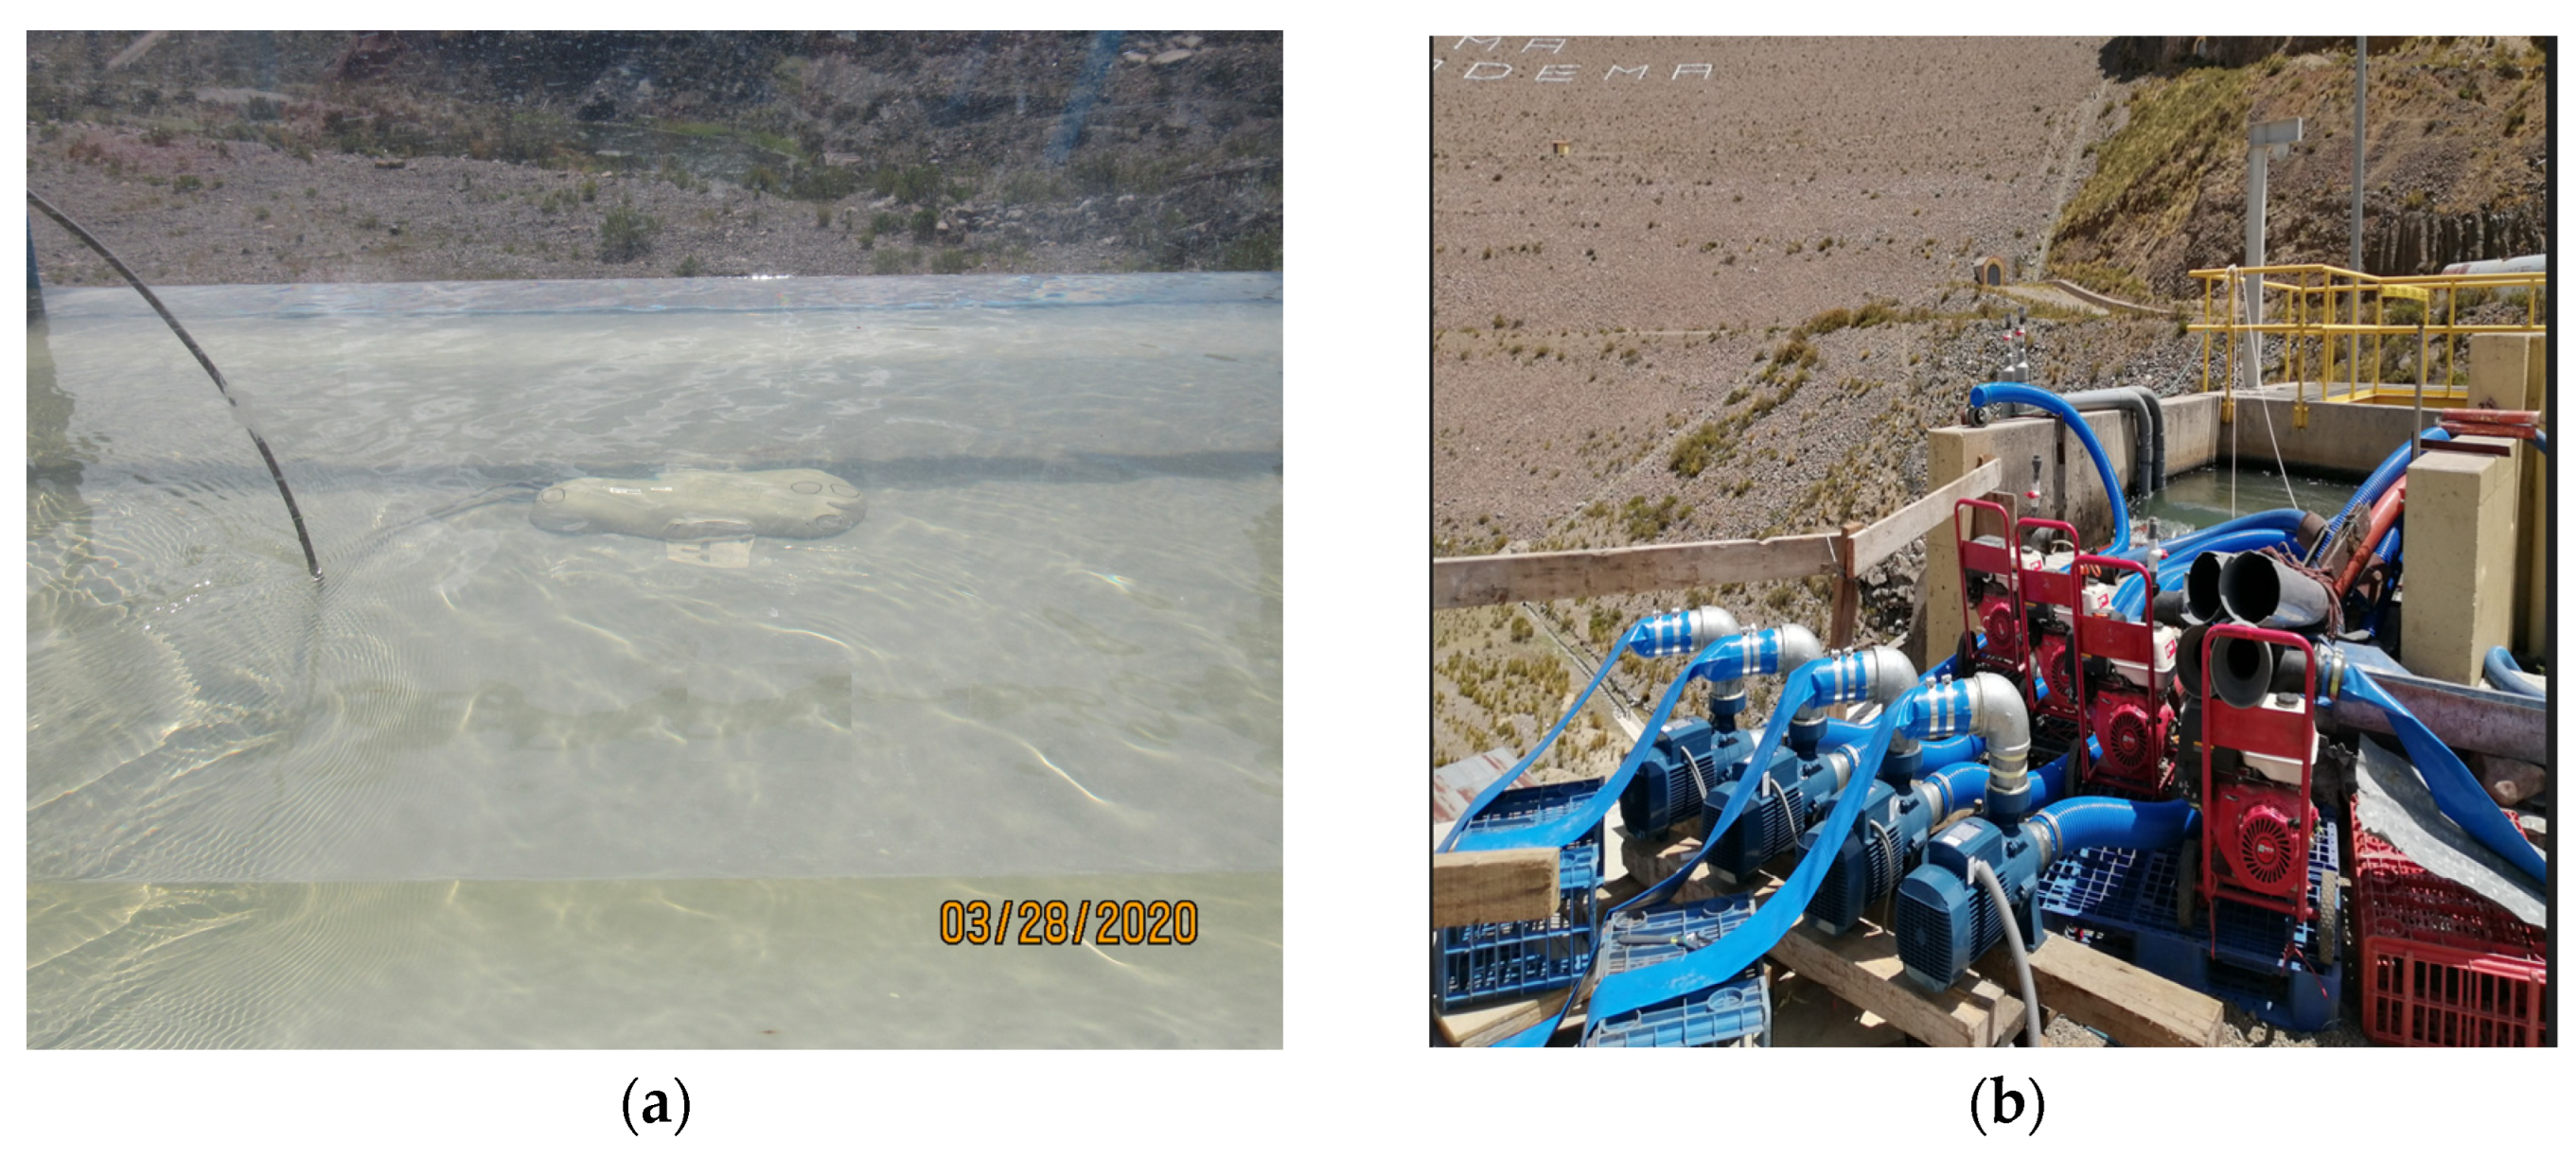
Figure 6.
Adjustment of the dimensionless discharge coefficient for the case and comparison with the results of Maynord et al. [30], Cassidy [26], Murphy et al. [28], and Hager [31].

Figure 7.
Dimensionless discharge coefficient adjustment of the d for the case of
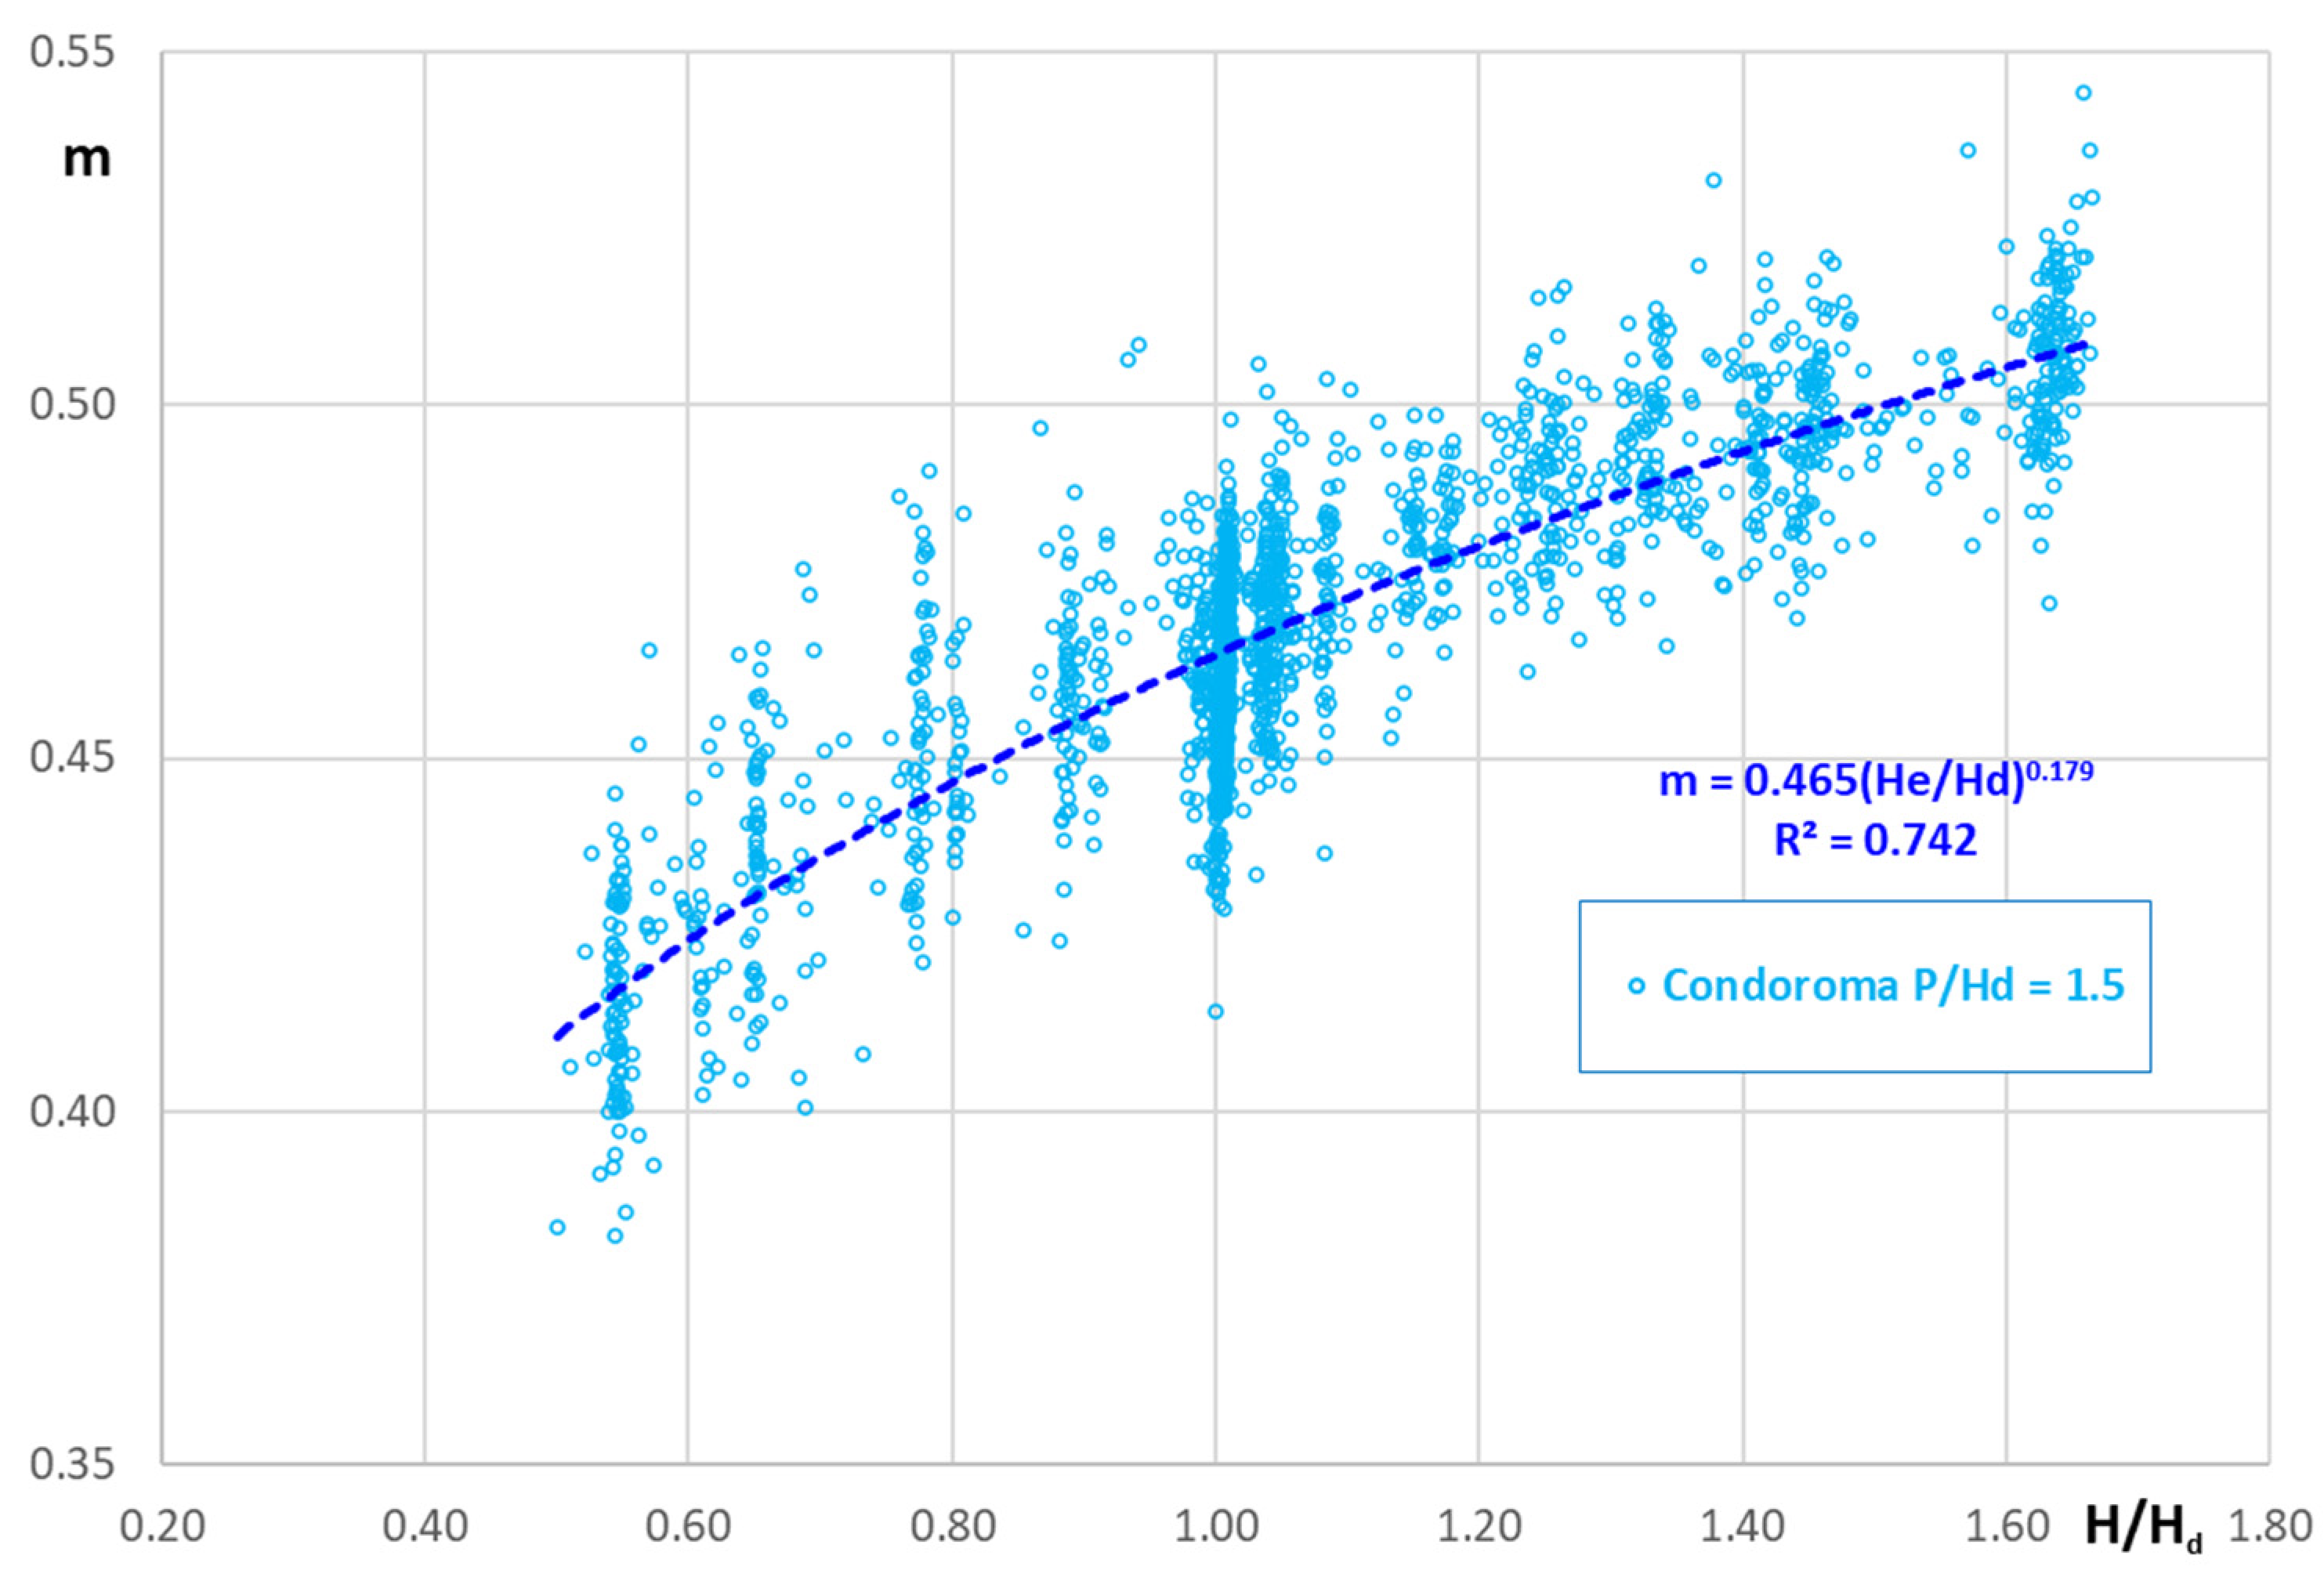
Figure 8.
Adjustment of the dimensionless discharge coefficient for the case and comparison with the results obtained by Maynord [30].
Figure 8.
Adjustment of the dimensionless discharge coefficient for the case and comparison with the results obtained by Maynord [30].
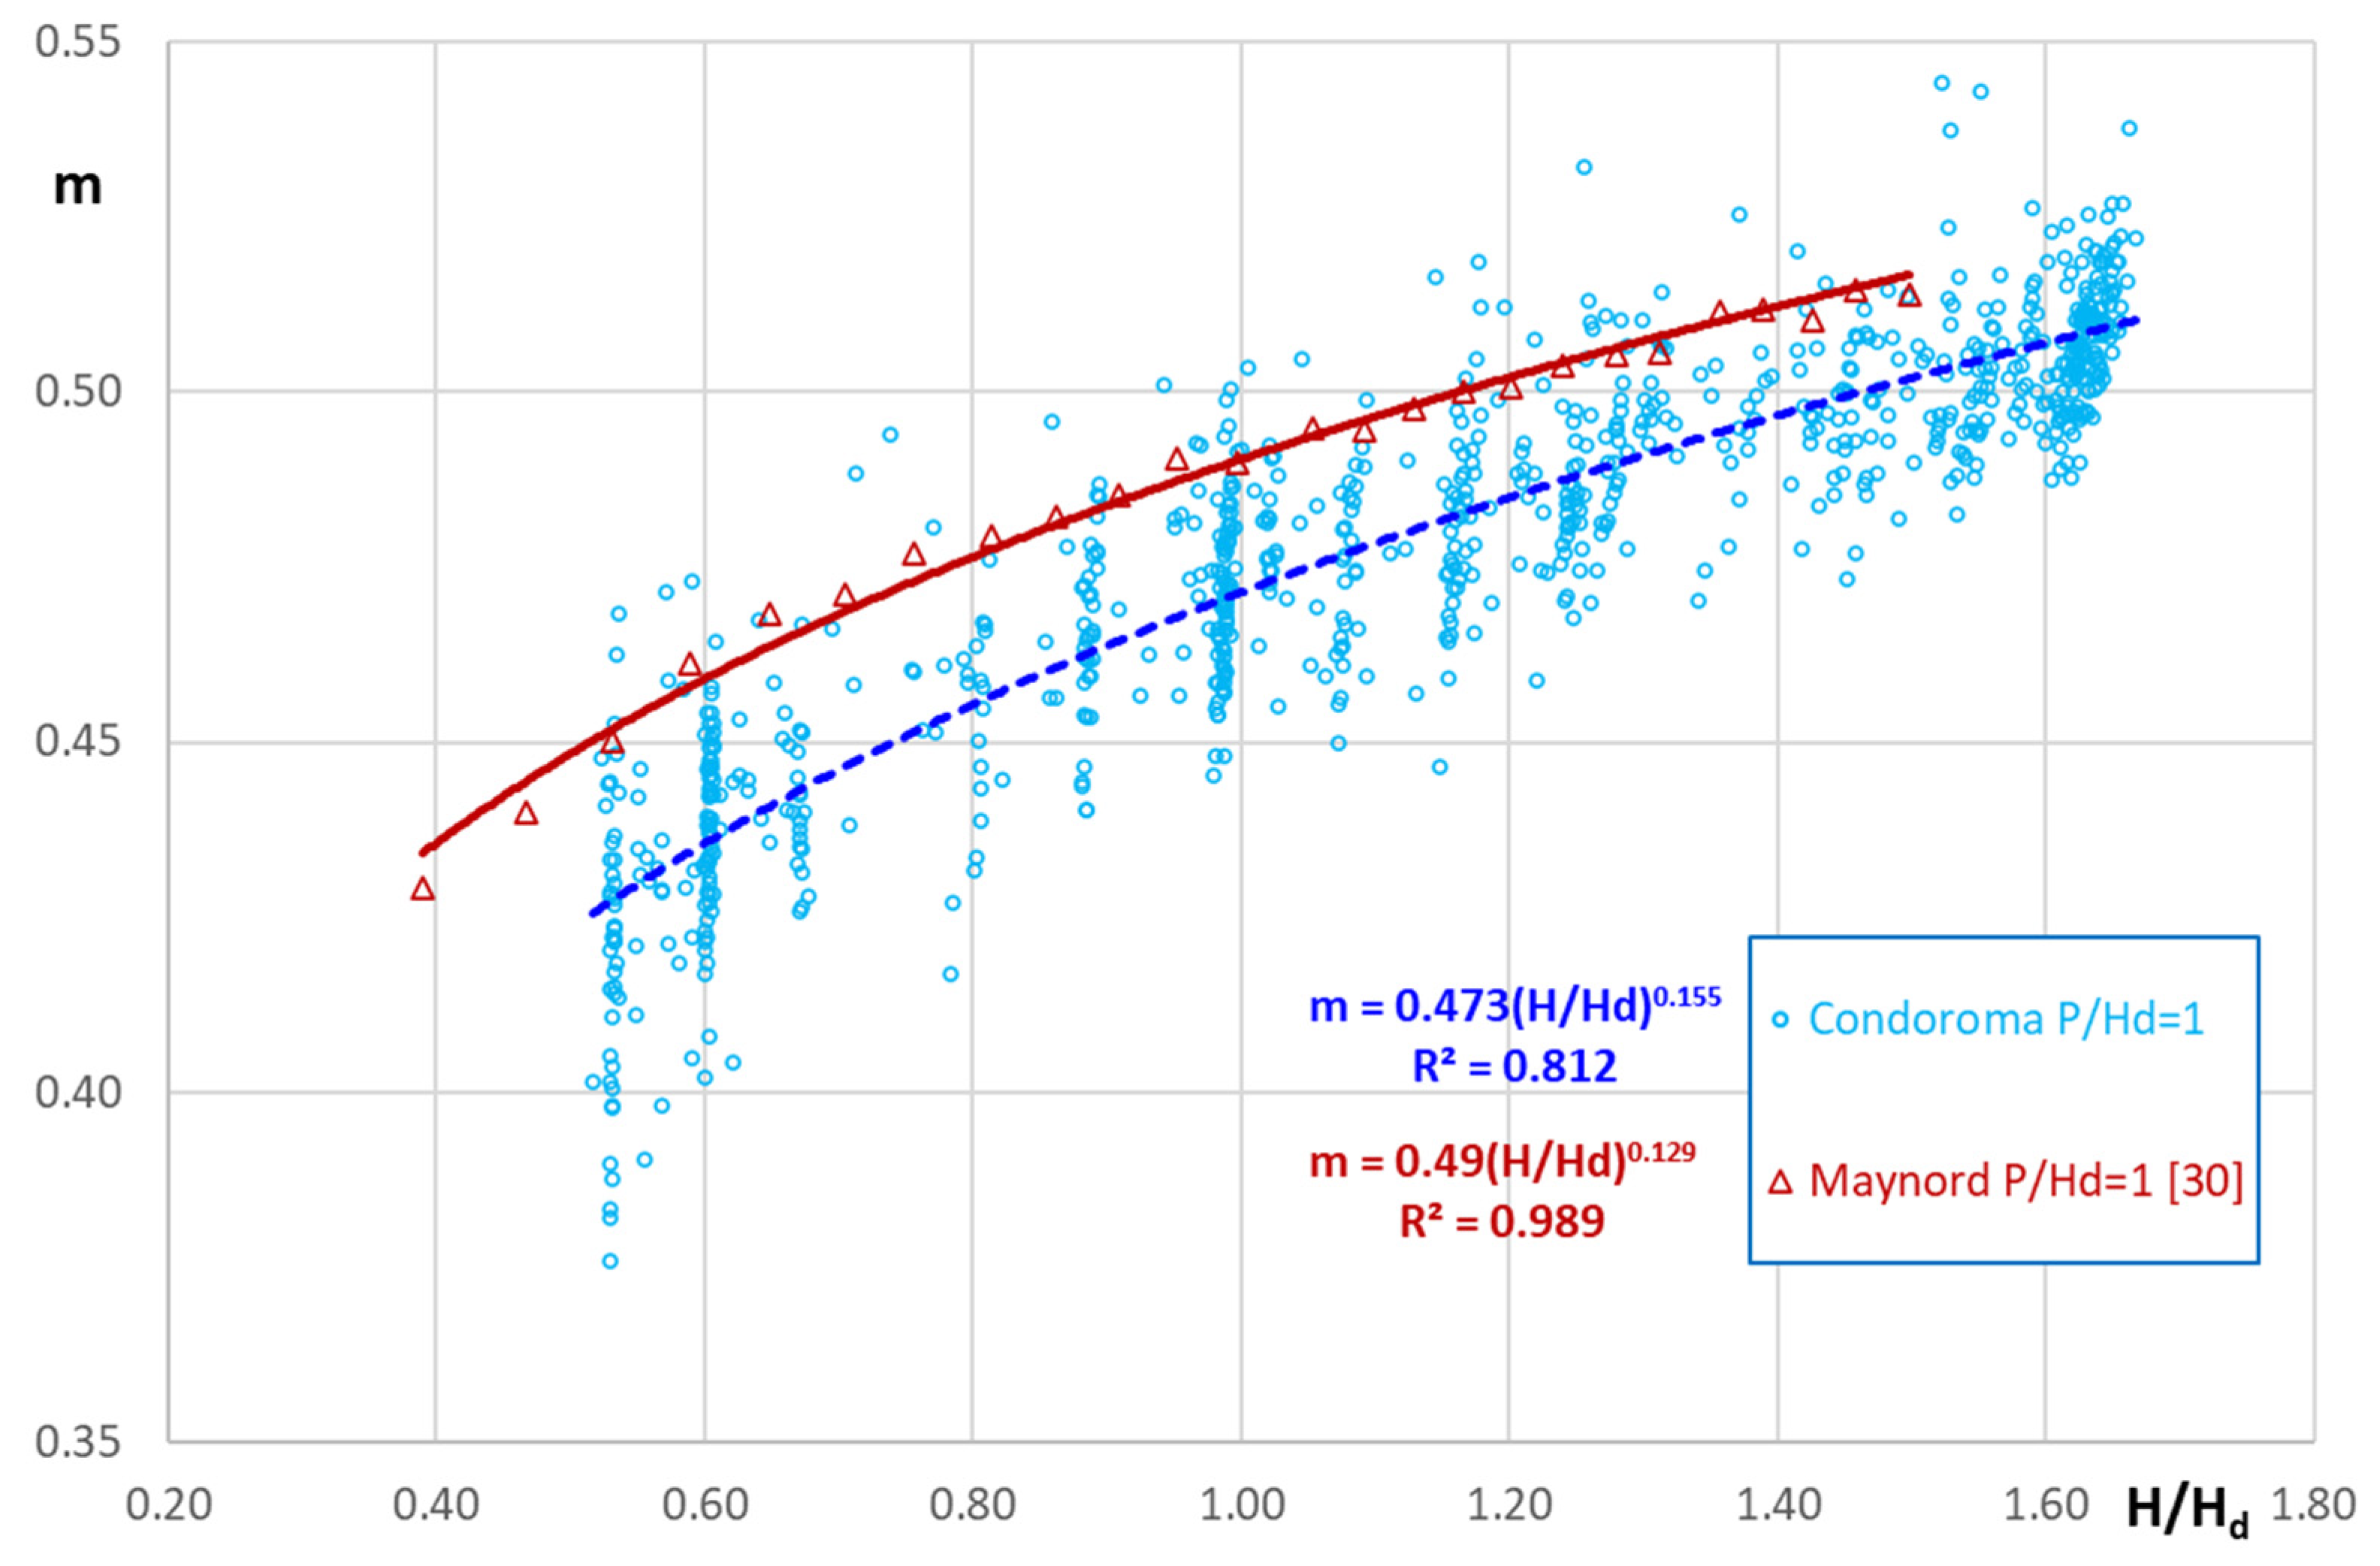
Figure 9.
Adjustment of the dimensionless discharge coefficient for the case and comparison with the results obtained by Maynord [30].
Figure 9.
Adjustment of the dimensionless discharge coefficient for the case and comparison with the results obtained by Maynord [30].
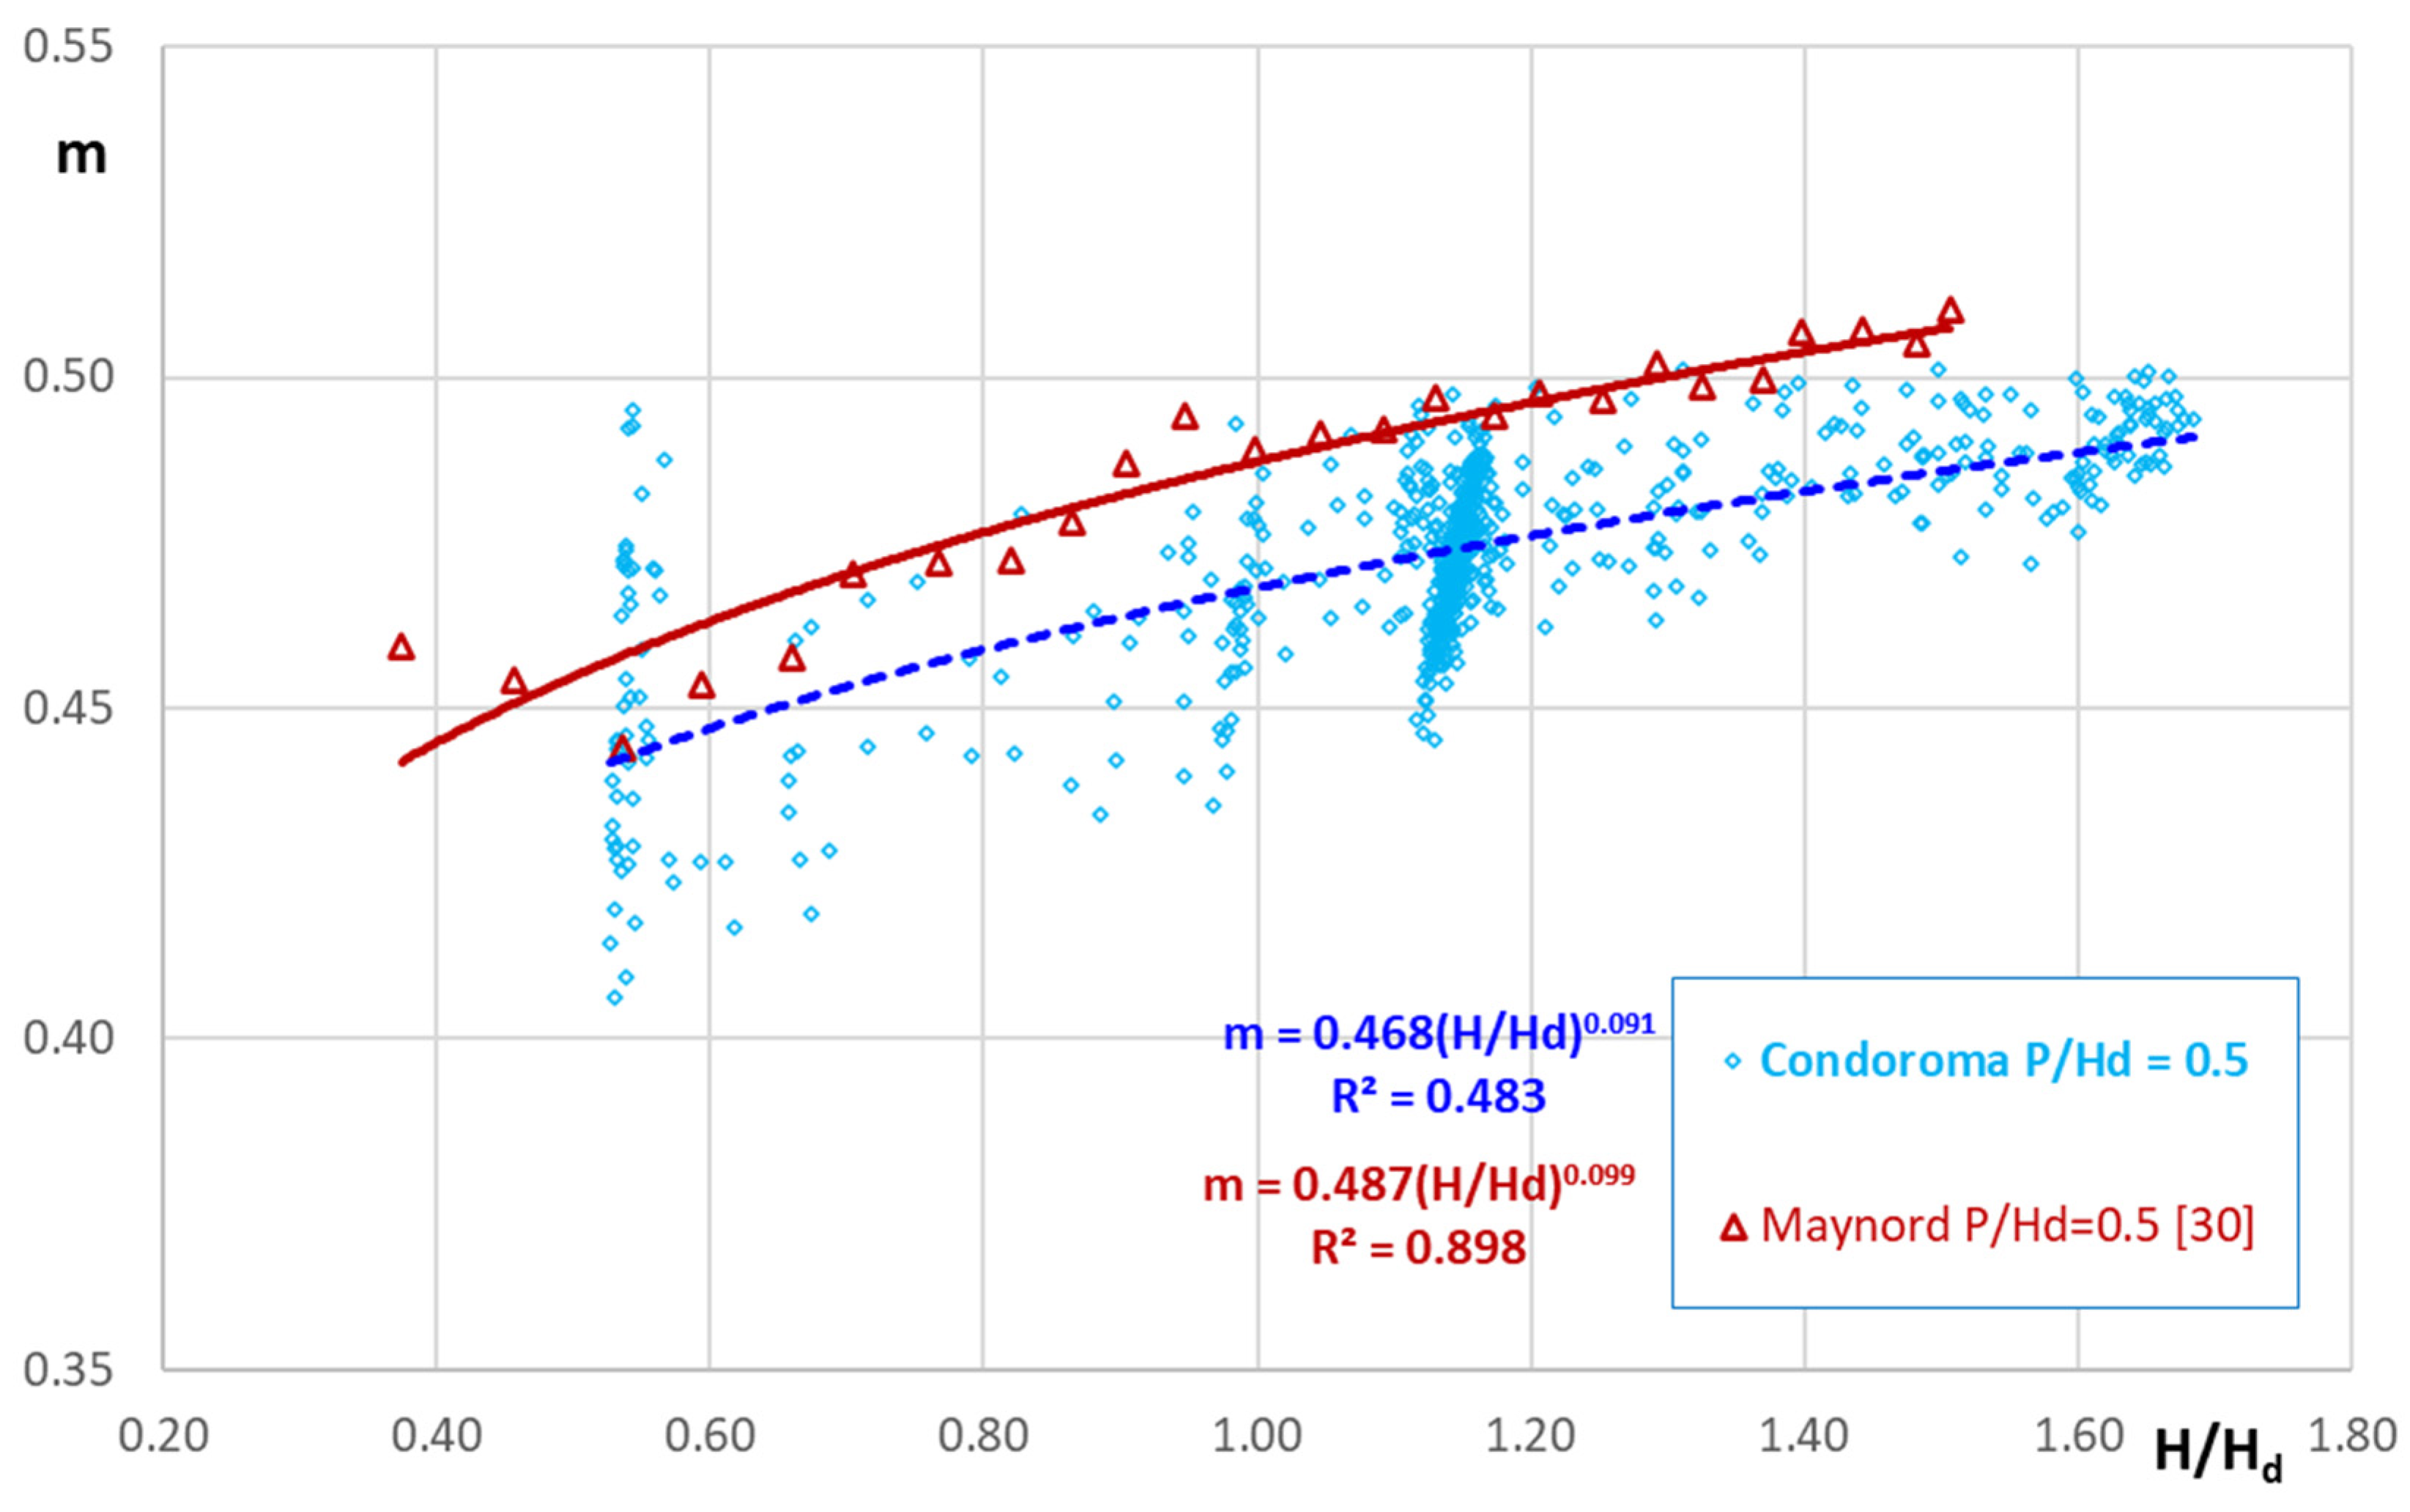
Figure 10.
Adjustment of the dimensionless discharge coefficient for the case and comparison with the results obtained by Maynord [30].
Figure 10.
Adjustment of the dimensionless discharge coefficient for the case and comparison with the results obtained by Maynord [30].
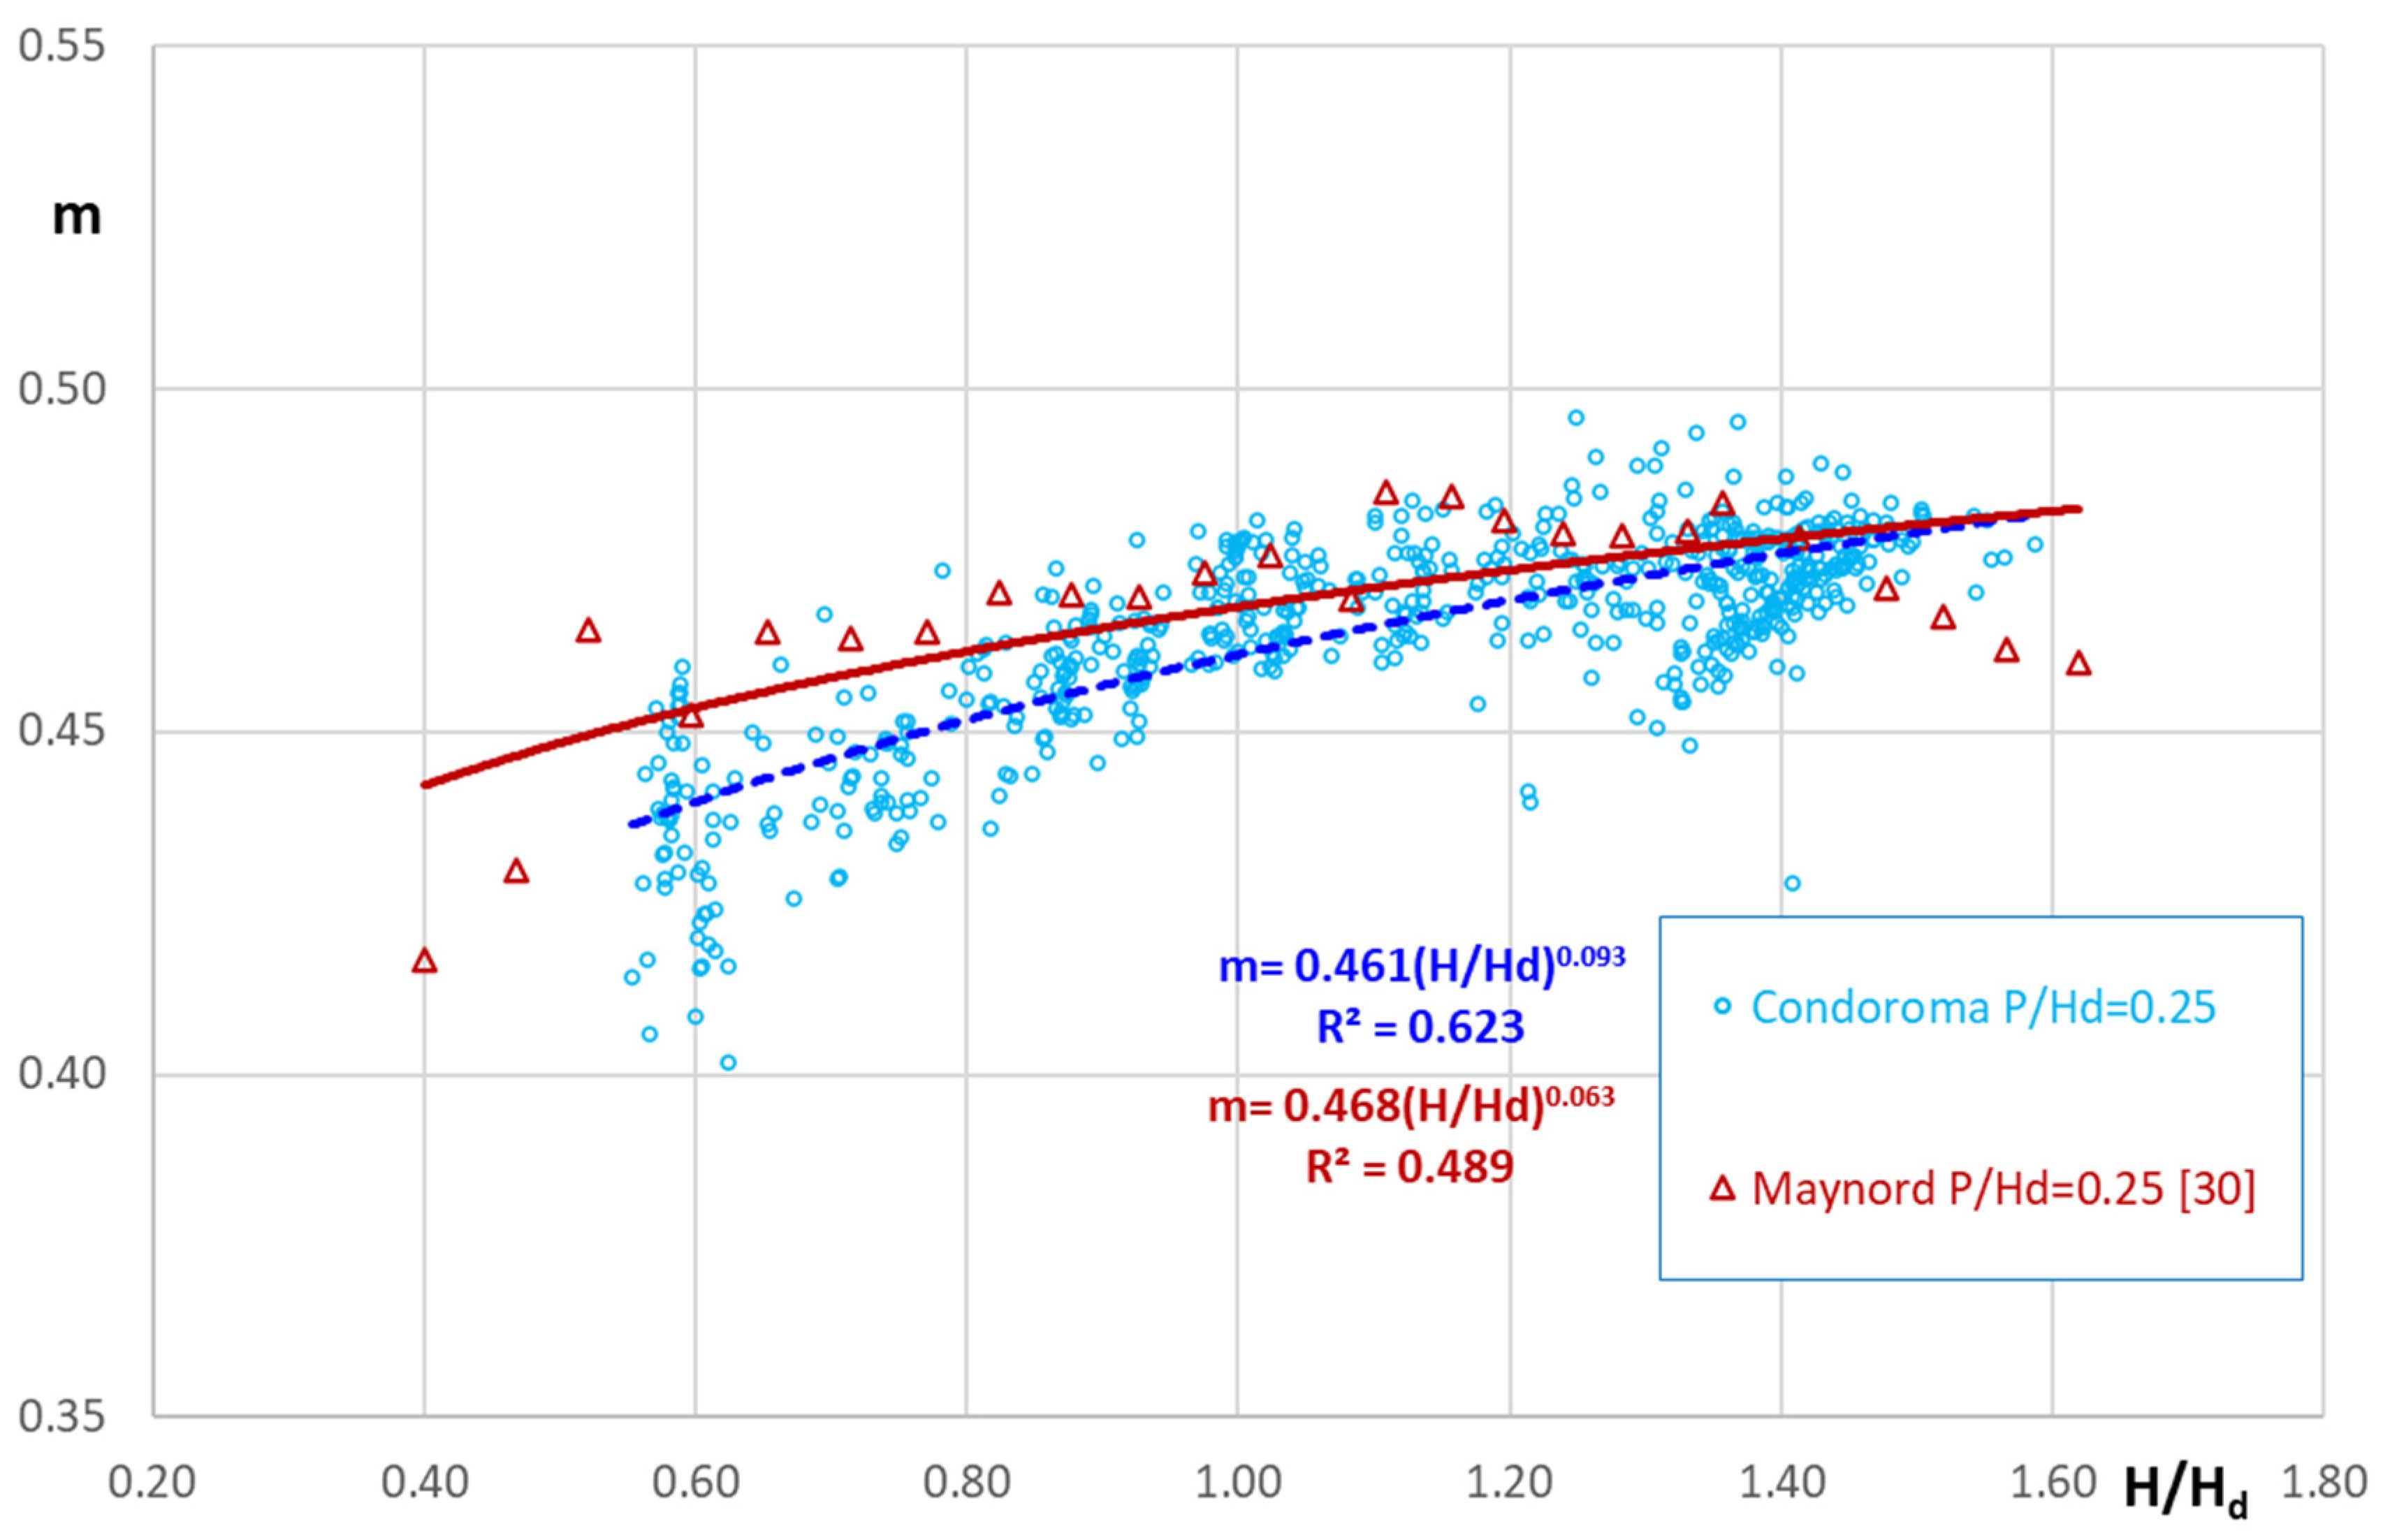
Figure 11.
coefficient of equation (6) for the Condoroma design head compared with that proposed by USBR [1].
Figure 11.
coefficient of equation (6) for the Condoroma design head compared with that proposed by USBR [1].
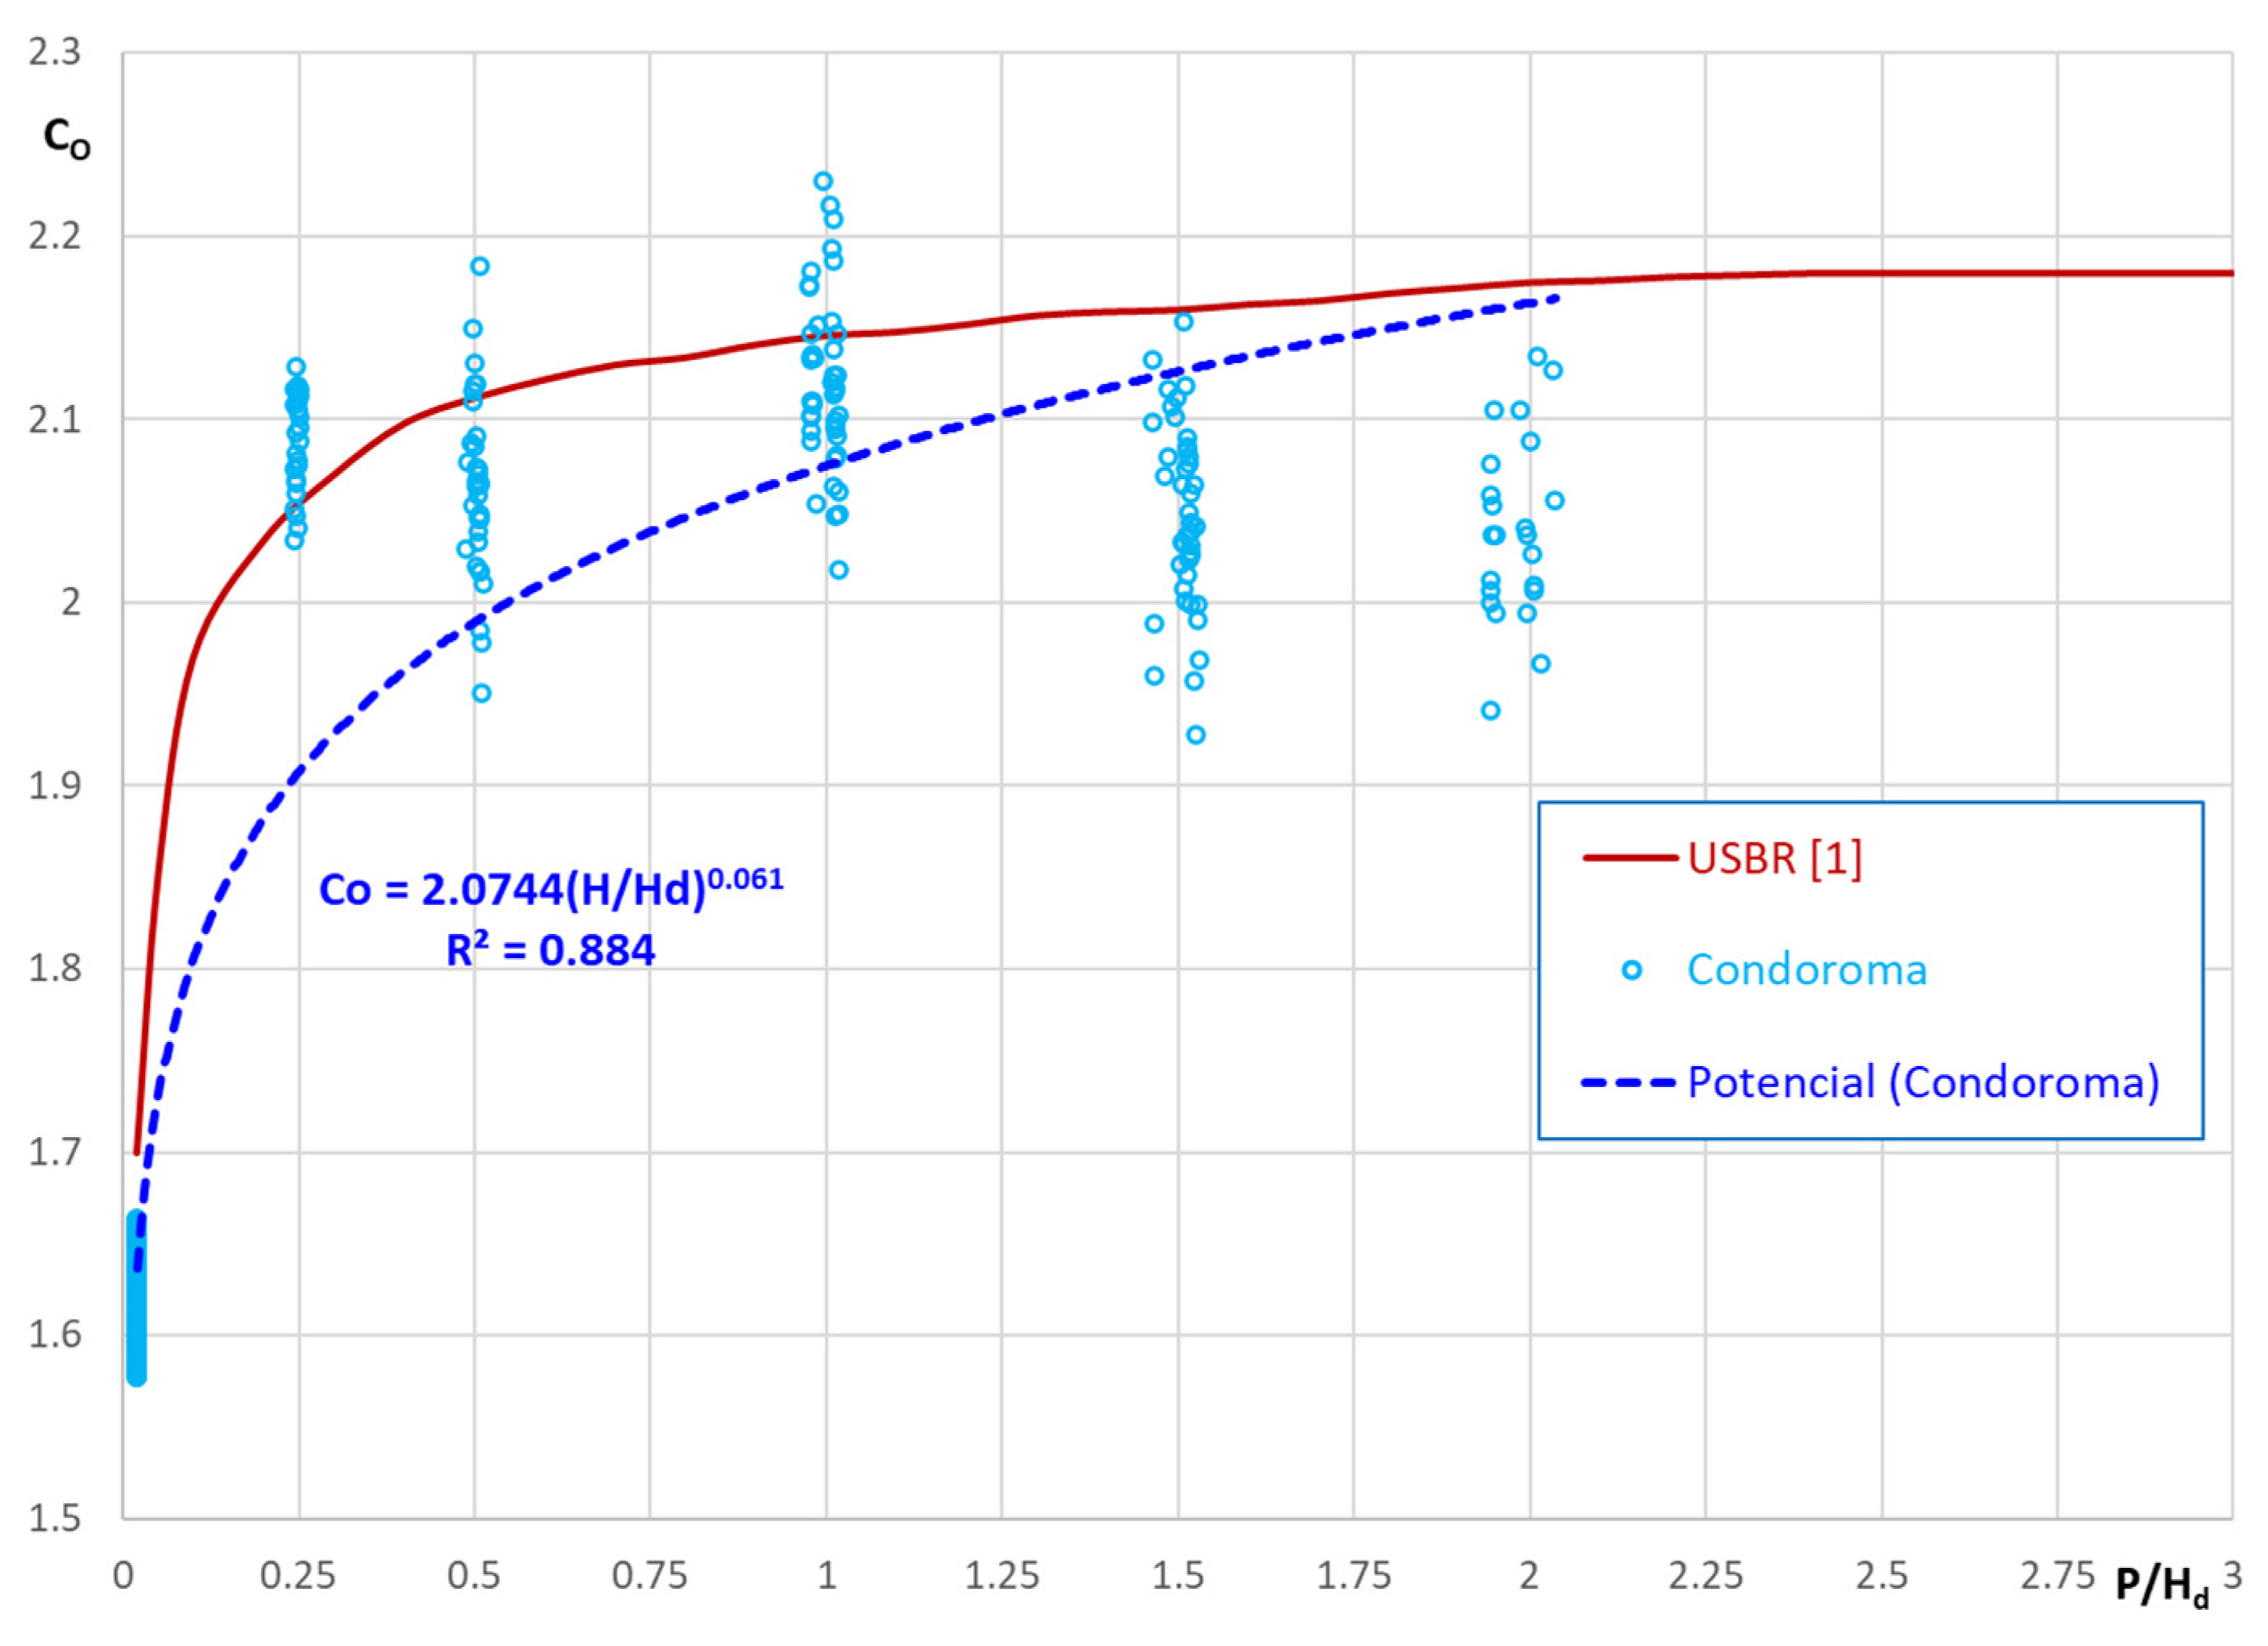
Figure 12.
(a) Comparison of the values of the dimensionless discharge coefficient obtained from experimental results at Condoroma with those by Brudenell [17], Randolph [20], Senturk [29], and Erpicum [32]; (b) Generalized equations for the dimensionless discharge coefficient by Hager [31], Dillman [14], Rouse and Reid [15], and Montes [5].
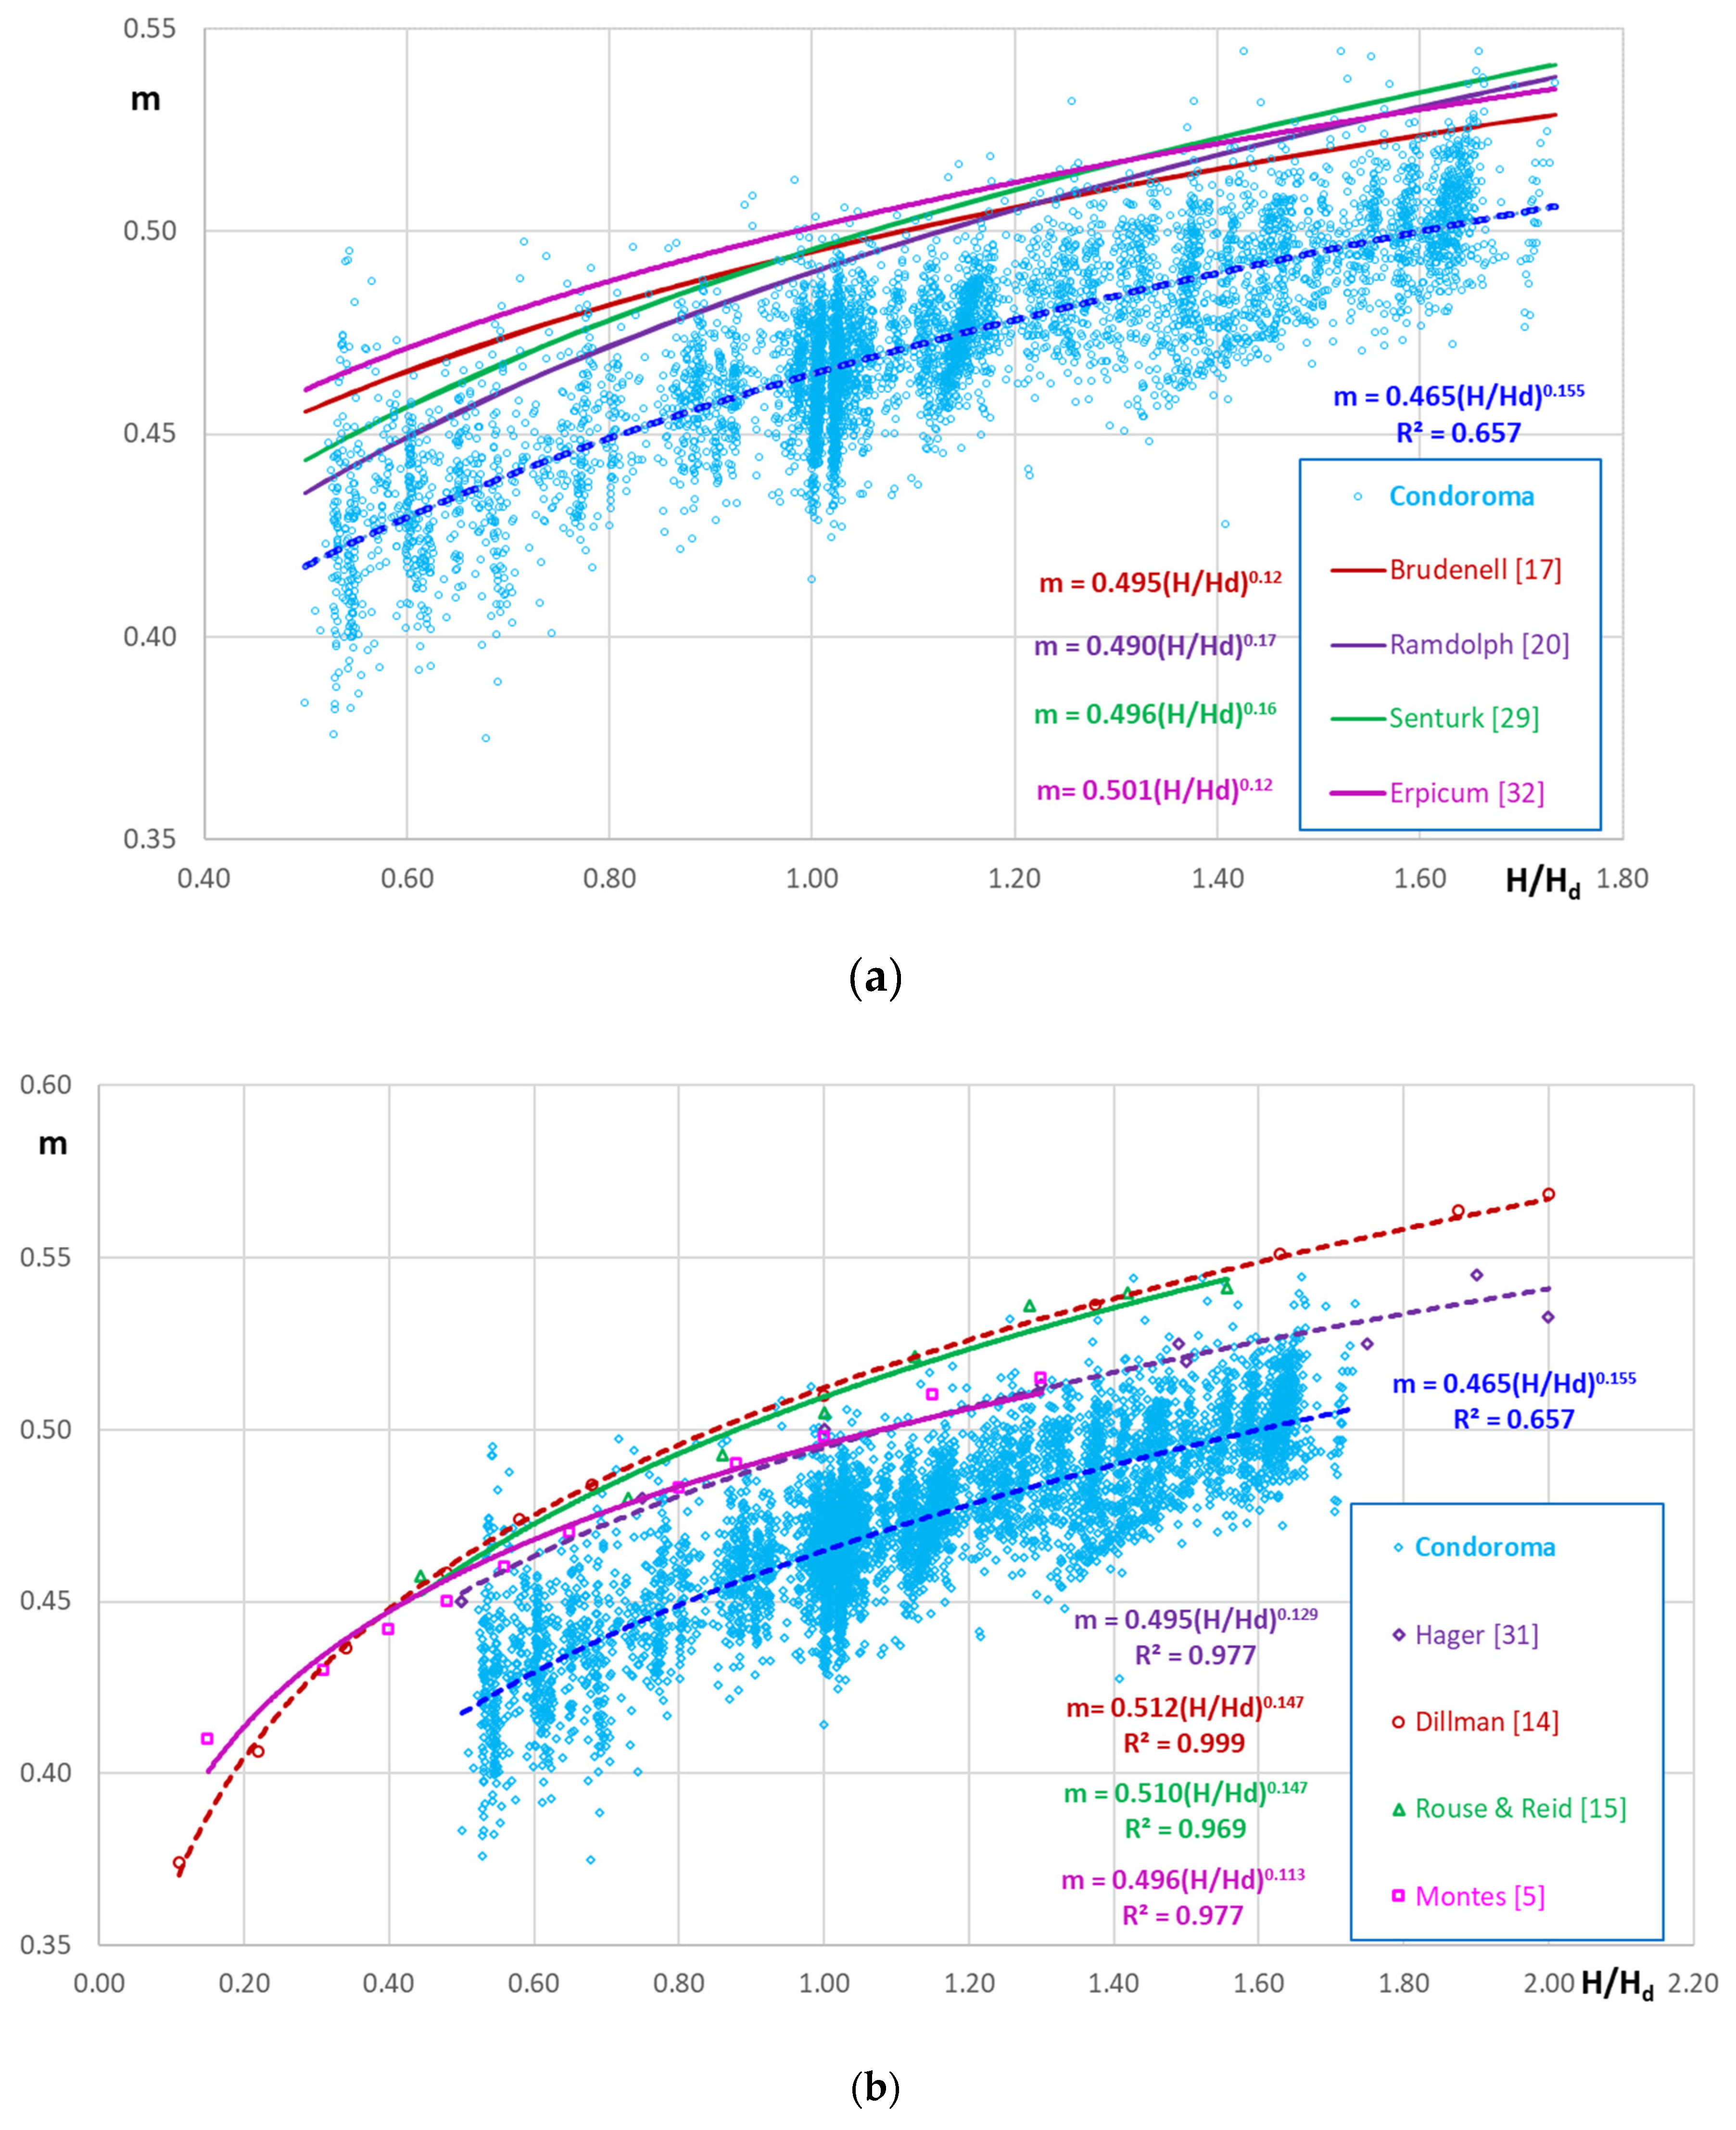
Figure 13.
Comparison of the generalized equations for the dimensionless discharge coefficient of U.S.B.R [1], T. Murphy [28], Maynord [30], and Cassidy [26] with the results obtained from Condoroma.
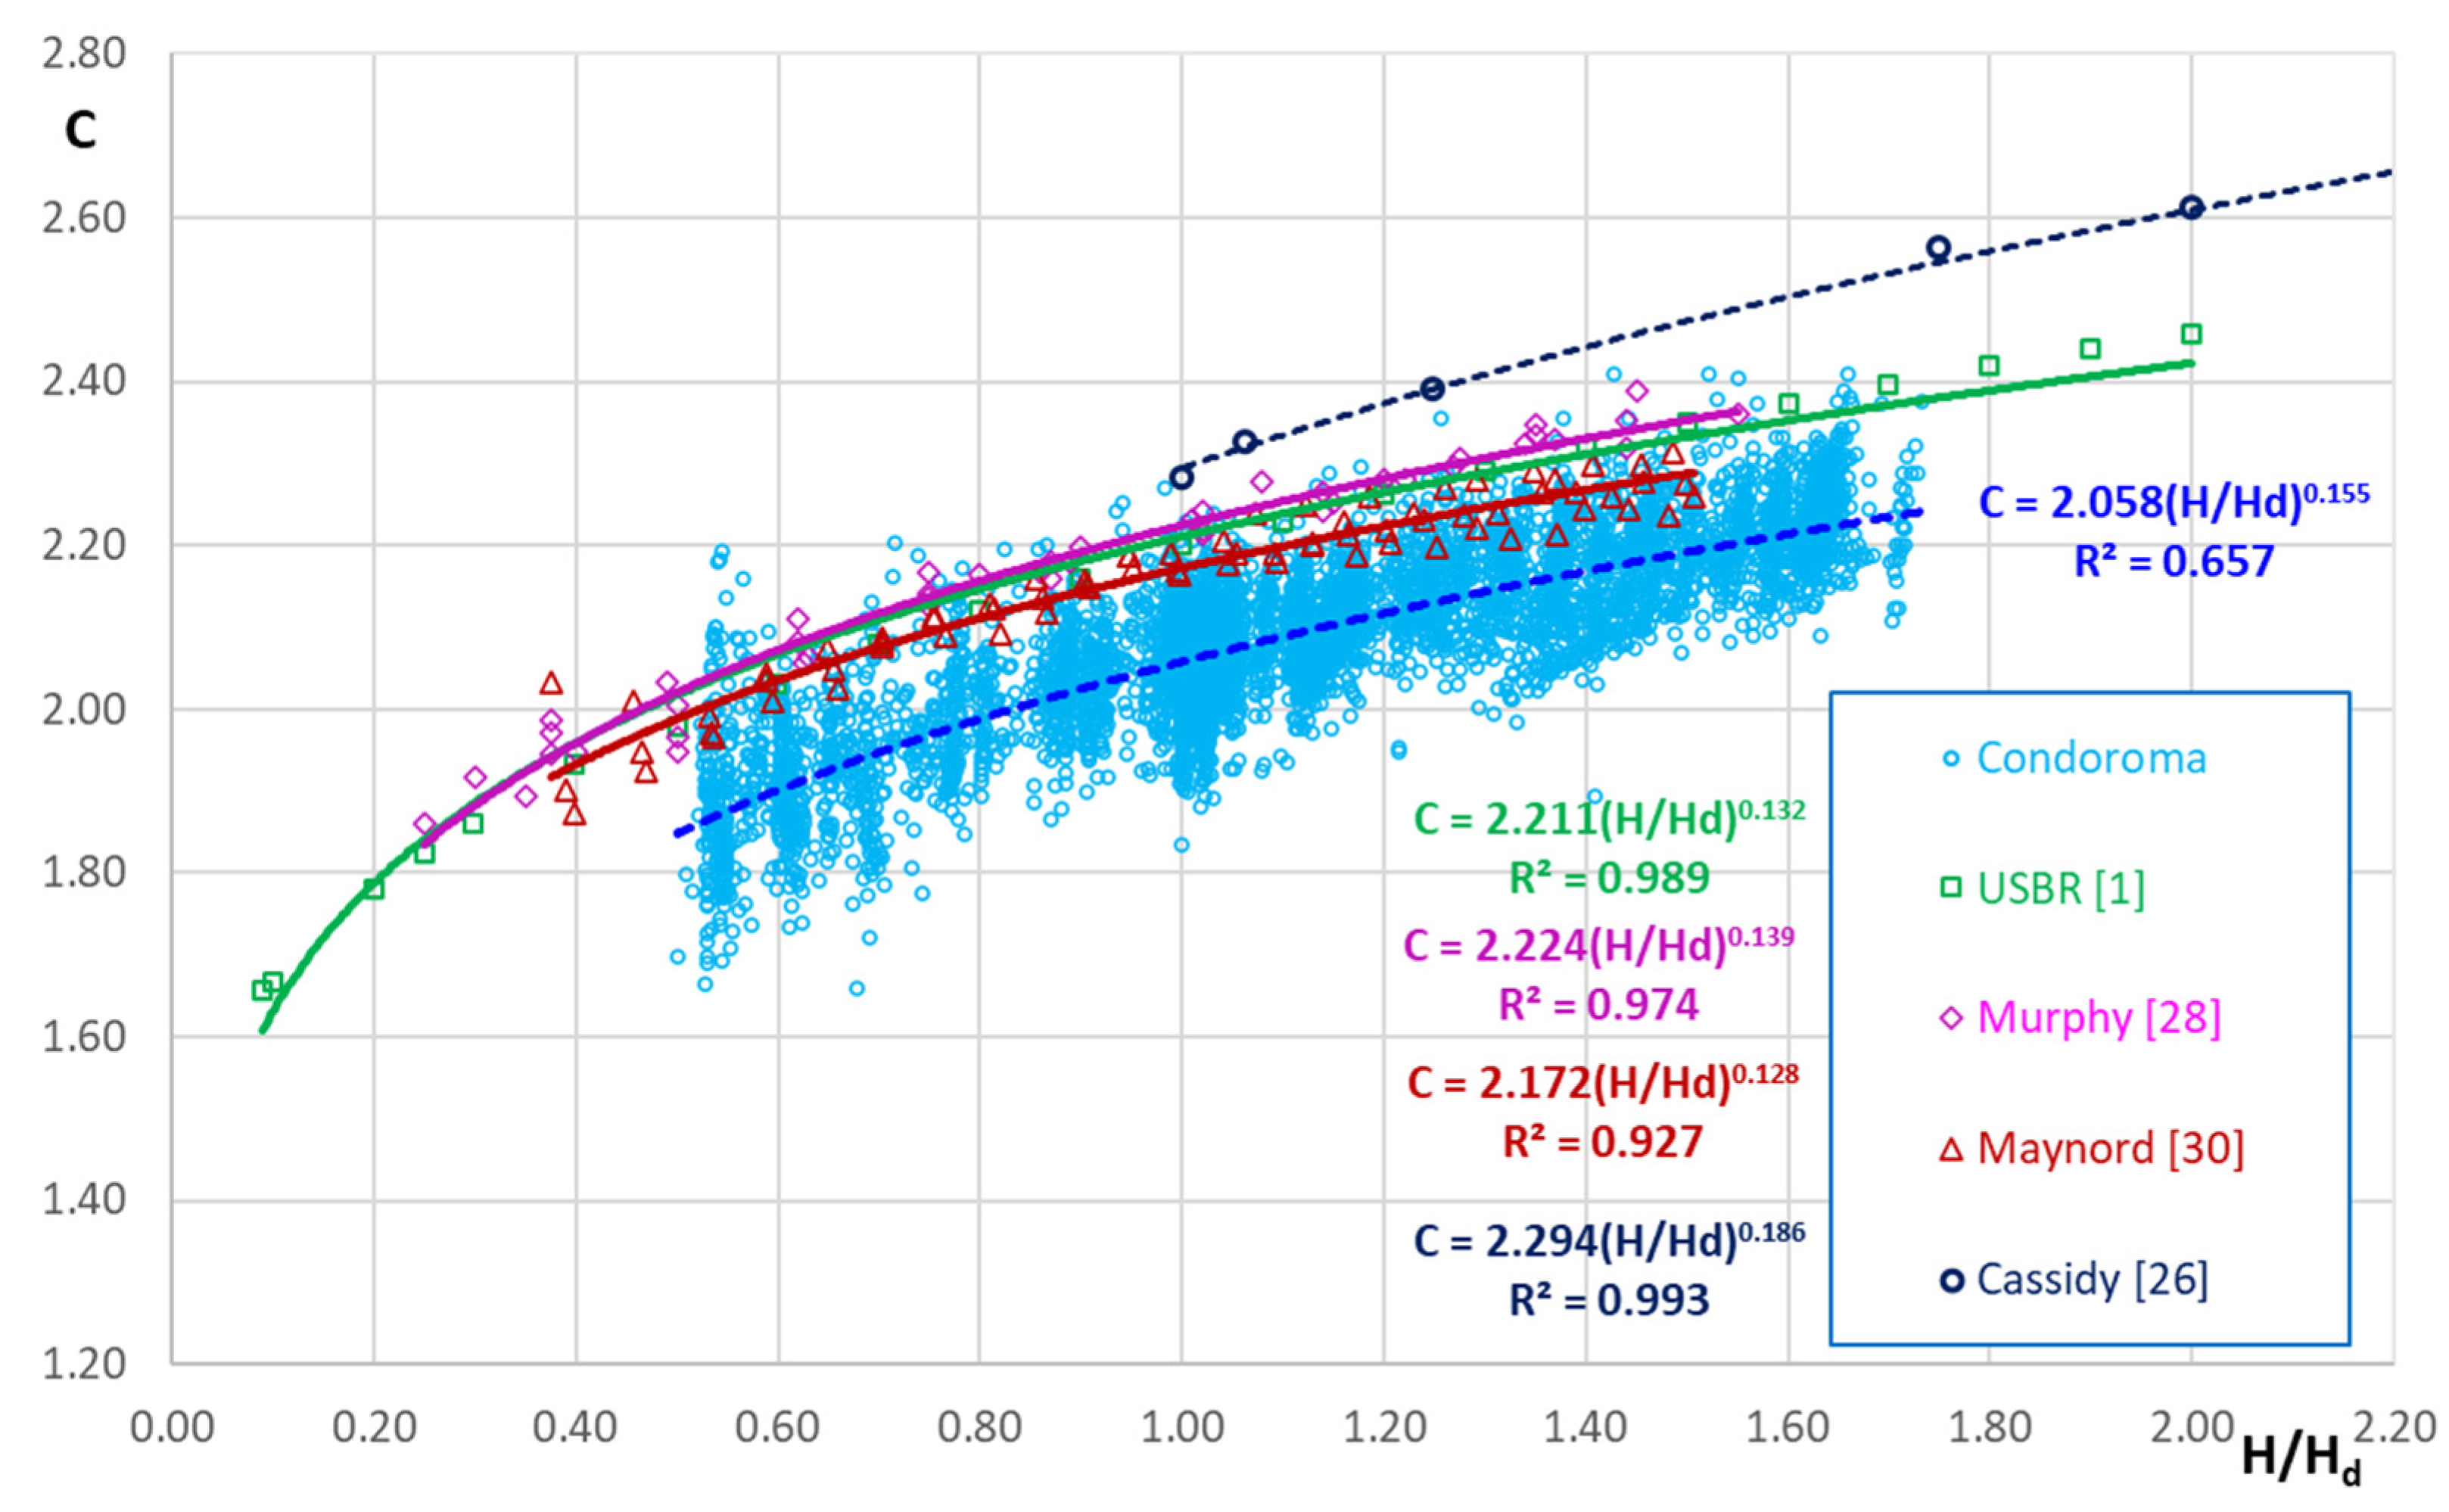

Table 1.
Main characteristics of the tests documented in the present work.
| Autor |
Length (m) |
Hd (m) |
P/Hd | Q (l/s) |
Elevation m a.s.l. |
| Dillman [14] | ------- | 0.05 | ----------- | ------ | 520 |
| Cassidy [26] | ------- | ------- | 2;2.5;3.7;6.6 | ------ | 210 |
| Rouse [43] | 0.500 | ------- | ---------- | 62 | 115 |
| Murphy [28] | 0.732 | 0.305 | 3.5;7.0 | 560 | 1600 |
| Maynord [30] | 0.762 | 0.249 | 0.25;0.5;1.0;2.0 | 385 | 1600 |
| Hager [31] | 0.500 | 0.20/0.1 | 3.5/7.0 | 375 | 495 |
| Erpicum [32] | 0.200 | 0.10/0.15 | ---------- | 358 | 65 |
| Condoroma dam | 0.915 | 0.20/0.175 | 0.25;0.5;1;1.5/2 | 415 | 4075 |
Table 2.
ratio and discharge coefficient adjustment factors of equation (5).
| Author | mo | n | R2 | |
|---|---|---|---|---|
| 2.0 | Condoroma | 0.462 | 0.184 | 0.719 |
| 2.0 | Maynord [30] | 0.494 | 0.157 | 0.984 |
| 2.0 | Cassidy [26] | 0.518 | 0.186 | 0.993 |
| 2.5 | Murphy [28] | 0.503 | 0.139 | 0.974 |
| 3.5 | Hager [31] | 0.493 | 0.122 | 0.988 |
| 1.5 | Condoroma | 0.465 | 0.179 | 0.742 |
| 1 | Condoroma | 0.472 | 0.155 | 0.812 |
| 1 | Maynord [30] | 0.490 | 0.129 | 0.989 |
| 0.5 | Condoroma | 0.468 | 0.091 | 0.483 |
| 0.5 | Maynord [30] | 0.487 | 0.099 | 0.849 |
| 0.25 | Condoroma | 0.461 | 0.093 | 0.623 |
| 0.25 | Maynord [30] | 0.468 | 0.063 | 0.489 |
Table 3.
Fitting factors corresponding to equation (5) for the discharge coefficient proposed by different authors.
Table 3.
Fitting factors corresponding to equation (5) for the discharge coefficient proposed by different authors.
| Autor | mo | n |
|---|---|---|
| Dillman [14] | 0.512 | 0.147 |
| Rouse [15] | 0.510 | 0.147 |
| Brudenell [17] | 0.495 | 0.120 |
| Randolph [20] | 0.490 | 0.170 |
| Cassidy [26] | 0.518 | 0.186 |
| Montes [5] | 0.496 | 0.113 |
| Murphy [28] | 0.502 | 0.139 |
| Senturk [29] | 0.496 | 0.160 |
| Maynord [30] | 0.491 | 0.128 |
| Hager [31] | 0.495 | 0.129 |
| Erpicum [32] | 0.501 | 0.120 |
| Condoroma | 0.465 | 0.155 |
Disclaimer/Publisher’s Note: The statements, opinions and data contained in all publications are solely those of the individual author(s) and contributor(s) and not of MDPI and/or the editor(s). MDPI and/or the editor(s) disclaim responsibility for any injury to people or property resulting from any ideas, methods, instructions or products referred to in the content. |
© 2023 by the authors. Licensee MDPI, Basel, Switzerland. This article is an open access article distributed under the terms and conditions of the Creative Commons Attribution (CC BY) license (http://creativecommons.org/licenses/by/4.0/).
Copyright: This open access article is published under a Creative Commons CC BY 4.0 license, which permit the free download, distribution, and reuse, provided that the author and preprint are cited in any reuse.


