1. Introduction
Climate-induced changes contribute to the thawing of ice-rich permafrost in the Arctic, which leads to the release of large volumes of organic carbon into the atmosphere and oceans. The mobilization of extra carbon in the modern biogeochemical cycle leads to an excess of greenhouse gases in the atmosphere, contributing to positive feedback [
1]. Ice-rich permafrost, predominantly located in Russia, Canada, and Alaska, is distinguished by widespread ground ice: constitutional ice, ice wedges, and tabular ground ice. Thawing of ground ice in response to contemporary climate conditions leads to the active layer deepening, thermokarst, thermo-erosion, and slope processes, along with the release of carbon into the surrounding permafrost environments. The ground ice-bond carbon reservoir includes pre-formed carbon-bearing greenhouse gases (GHGs, mainly CH4 and CO2) and pre-aged organic matter (OM), represented by dissolved (dissolved organic matter, DOM) and particulate (particulate organic matter, POM) forms. The tabular ground in West Siberia has been reported to contain an enormously high amount of trapped microbial methane, which is responsible for the direct GHG emission upon the thawing of ground ice [
2,
3,
4]. Although recent simulations have estimated the GHG emissions from the Yedoma deposits as only about 1% of the total permafrost GHG emissions [
5], the impact of ground ice thawing on the carbon cycle is undoubtedly critical for both the local and regional ecosystems of the Arctic.
The ancient permafrost-derived organic matter has been reported for a relative enrichment in biochemically labile fraction. It is assumed that the rapid biochemical immobilization of the source OM as a result of the freezing contributed to a lower degree of the immobilized OM mineralization and, consequently, to a higher biochemical quality of the resulting permafrost-bound organic carbon reservoir [
6]. The ground ice itself indicates the particular importance of dissolved organic carbon (DOC) as a storage form for trapped carbon. It has been reported that the Yedoma ice wedges store significant pools of DOC (45.2 Tg) and dissolved inorganic carbon (DIC) (33.6 Tg) [
7]. Although DOM is involved in close interaction with POM, the most labile compounds, which are immediately available for microbial consumption, are dissolved in water. The ground ice DOC vulnerability to a modern transformation, finalized as GHG emissions, is obviously determined by the DOM composition, suggesting that more biolabile constituent is readily mineralized, but refractory/recalcitrant one is rather accumulated in the solution within the certain time scale, thus having a longer residence time. In the incubation experiments, the IW meltwater addition indicated the sizable increase of the DOC loss in Yedoma samples, suggesting that the low-molecular weight biolabile DOM of IW promoted the mineralization of predominantly high molecular weight recalcitrant Yedoma OM by co-metabolizing effect [
8]. The excitation–emission matrix (EEM) fluorescence coupled with parallel factor analysis (PARAFAC) of the measured fluorophores is a conventional tool for investigating the molecular fractions of highly heterogeneous DOM composition in natural waters [
9,
10]. It allows extractions of the components of fluorescent DOM which can be assigned to whether allochthonous, recalcitrant/biorefractory, or autochthonous biolabile DOM fractions. The negative correlation between the DOC loss (biodegradable DOC, BDOC) and content of the most labile fraction of protein-like DOM has been detected as a result of the incubation tests, involving ground ice and permafrost samples [
8,
11]. The distribution of fluorescent DOM fractions might, to some extent, reflect the partitioning of the DOC pool into the portions with various vulnerability to microbial transformation, finally resulting in different amounts and ratios of the gaseous products: CO2 and CH4. This can be applicable to the modeling of GHG generation from permafrost soils and deposits, implying the indication of biochemical quality of the OM subject to mineralization upon thawing. Summarizing all the above, we may infer that the fluorescent DOM analysis is undoubtedly, very promising approach in studying the DOC and DOM biogeochemistry of the ground ice. Another application of the fluorescent DOM fractions data is paleoclimate reconstructions. This is based on the assumption that DOM composition reflects hydrological and climate conditions as well as local vegetation of the paleo environments. As it was shown in the previous work, the PARAFAC-DOM components distribution in the Faddevsky IWs (Kotelny Island, New Siberian archipelago) correlated with the age of the IW formation (Holocene and Late Pleistocene) and distinguished between the ice wedges and tabular ground ice within the sample collection [
12].
In this study, we integrate data on water-soluble compounds in ground ice samples from various locations with significant geographic extents, including Kotelny Island (East Siberian Sea) and the Yamal Peninsula (Kara Sea). We address the following tasks in our work:
To describe the variations of the available water-soluble compounds, including the carbon bearing gases (CH4 and CO2) within the dataset in terms of carbon cycling;
To compose and validate PARAFAC model for the fluorescent DOM components in the database on ground ice from various locations in the Arctic;
To trace the relationship between the dissolved organic carbon and the molecular fractions of DOM (PARAFAC components) and establish possible sources of the fluorescent DOM molecular fractions using available geochemical indicators;
To estimate the water-dissolved/water-soluble geochemical parameters interrelation, sample variability and intrinsic diversity using a multivariate statistic (PCA).
2. Study area and dataset design
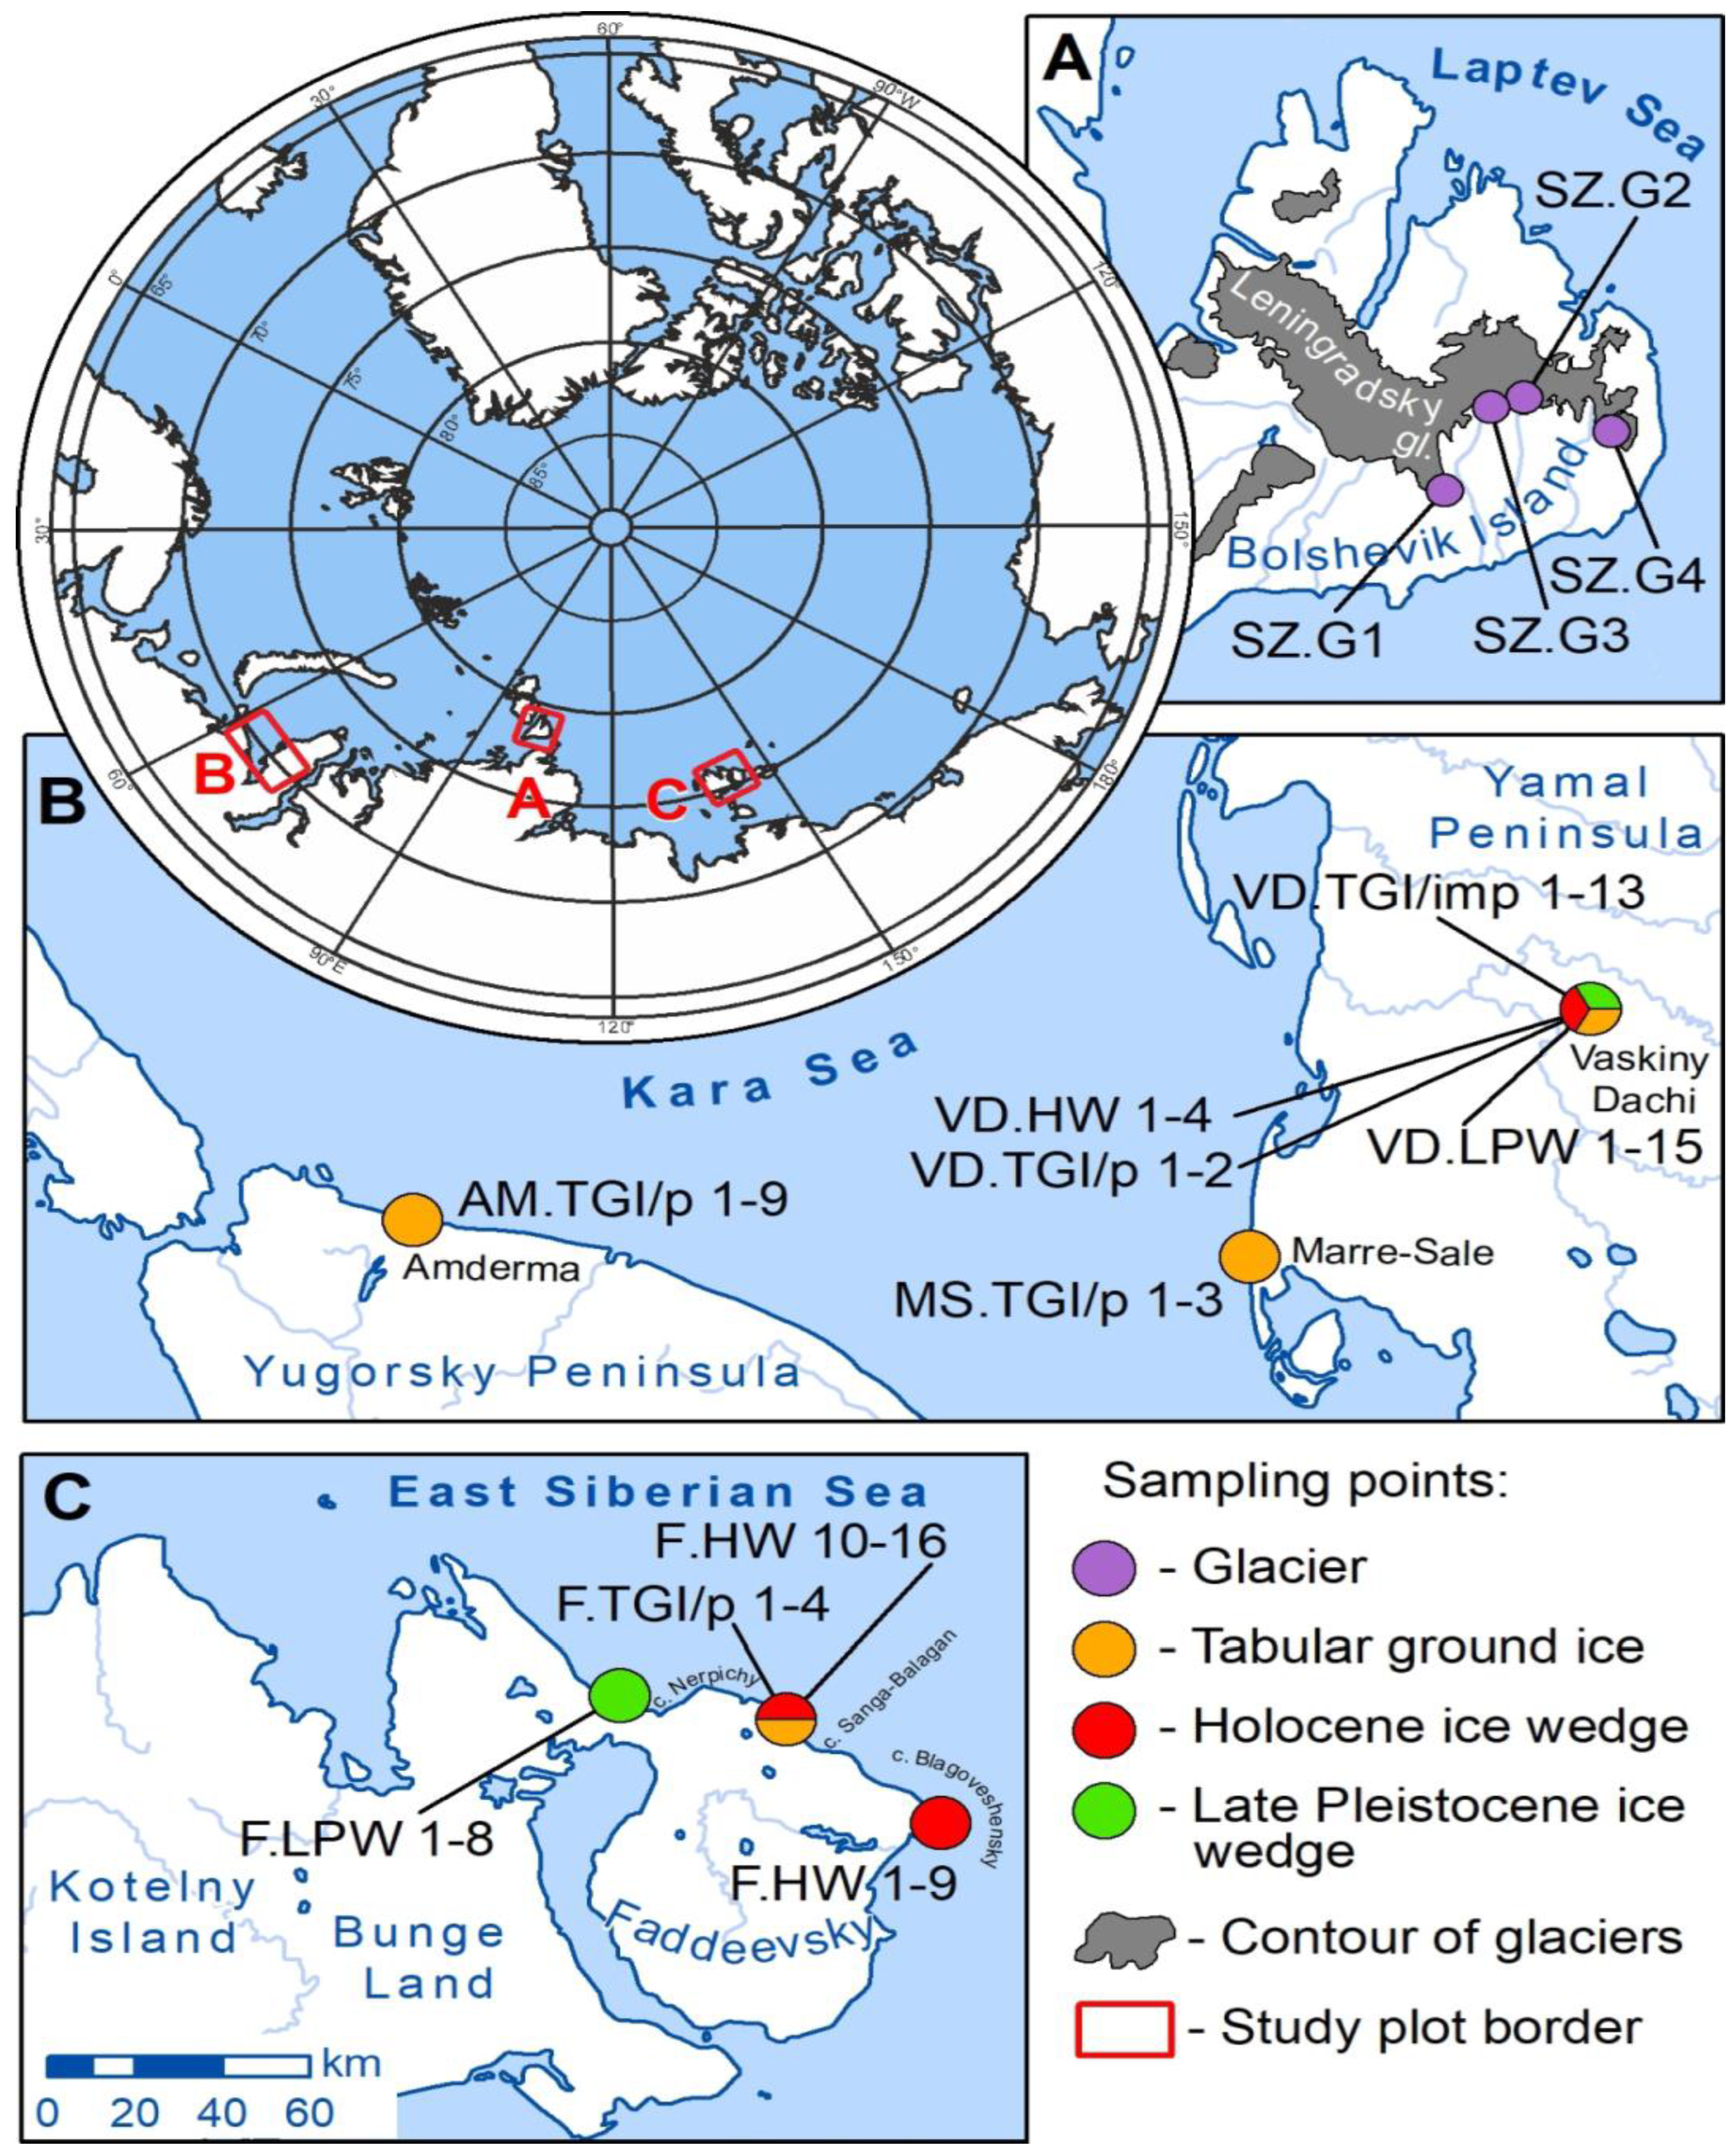
This article presents research conducted in the Russian Arctic, based on field data collected from five distinct key sites (
Figure 1). The selection of these sites was driven by their geographical location, landscape features, and the type of ice. In total, we collected samples, comprising tabular ground ice (TGI) and ice wedges of various ages from Northwestern Russia, Western and Eastern Siberia. Furthermore, additional samples were taken from the Leningradsky glacier on Bolshevik Island in the Severnaya Zemlya archipelago to represent the reference for ground ice samples.
The westernmost site, located 5 km east of Amderma settlement on the Kara Sea coast, exposes the TGI in a retrogressive thaw slump (RTS) [
13]. The stratified TGI is over 4.5 meters thick and is covered with loamy sediments containing fragments of mollusk shells. The stratification observed in the TGI arises from variations in the composition of soil and air inclusions within the ice. In the uppermost 1.5 meters of the TGI, the sediment content is notably high, including particles of silty, sandy, and pebble sizes. Pure ice layers tend to be rather thin, typically measuring less than 1 centimeter in thickness. The lower part of the TGI, located at depths ranging from 6 to 9 meters below the surface, represents interlayering of pure transparent ice, pure bubbly ice, and stratified ice. For this study samples (
Table 1, AM.TGI/p 1 – 9) were collected from depths ranging between 6 and 7 meters beneath the surface.
In West Siberia, our research focused on the TGI and ice wedges at the Marre-Sale and Vaskiny Dachi research stations. At Marre-Sale, in 2022, we examined the TGI (TGI 1 type) [
14] within a 25-meter-high coastal cliff along the Kara Sea (
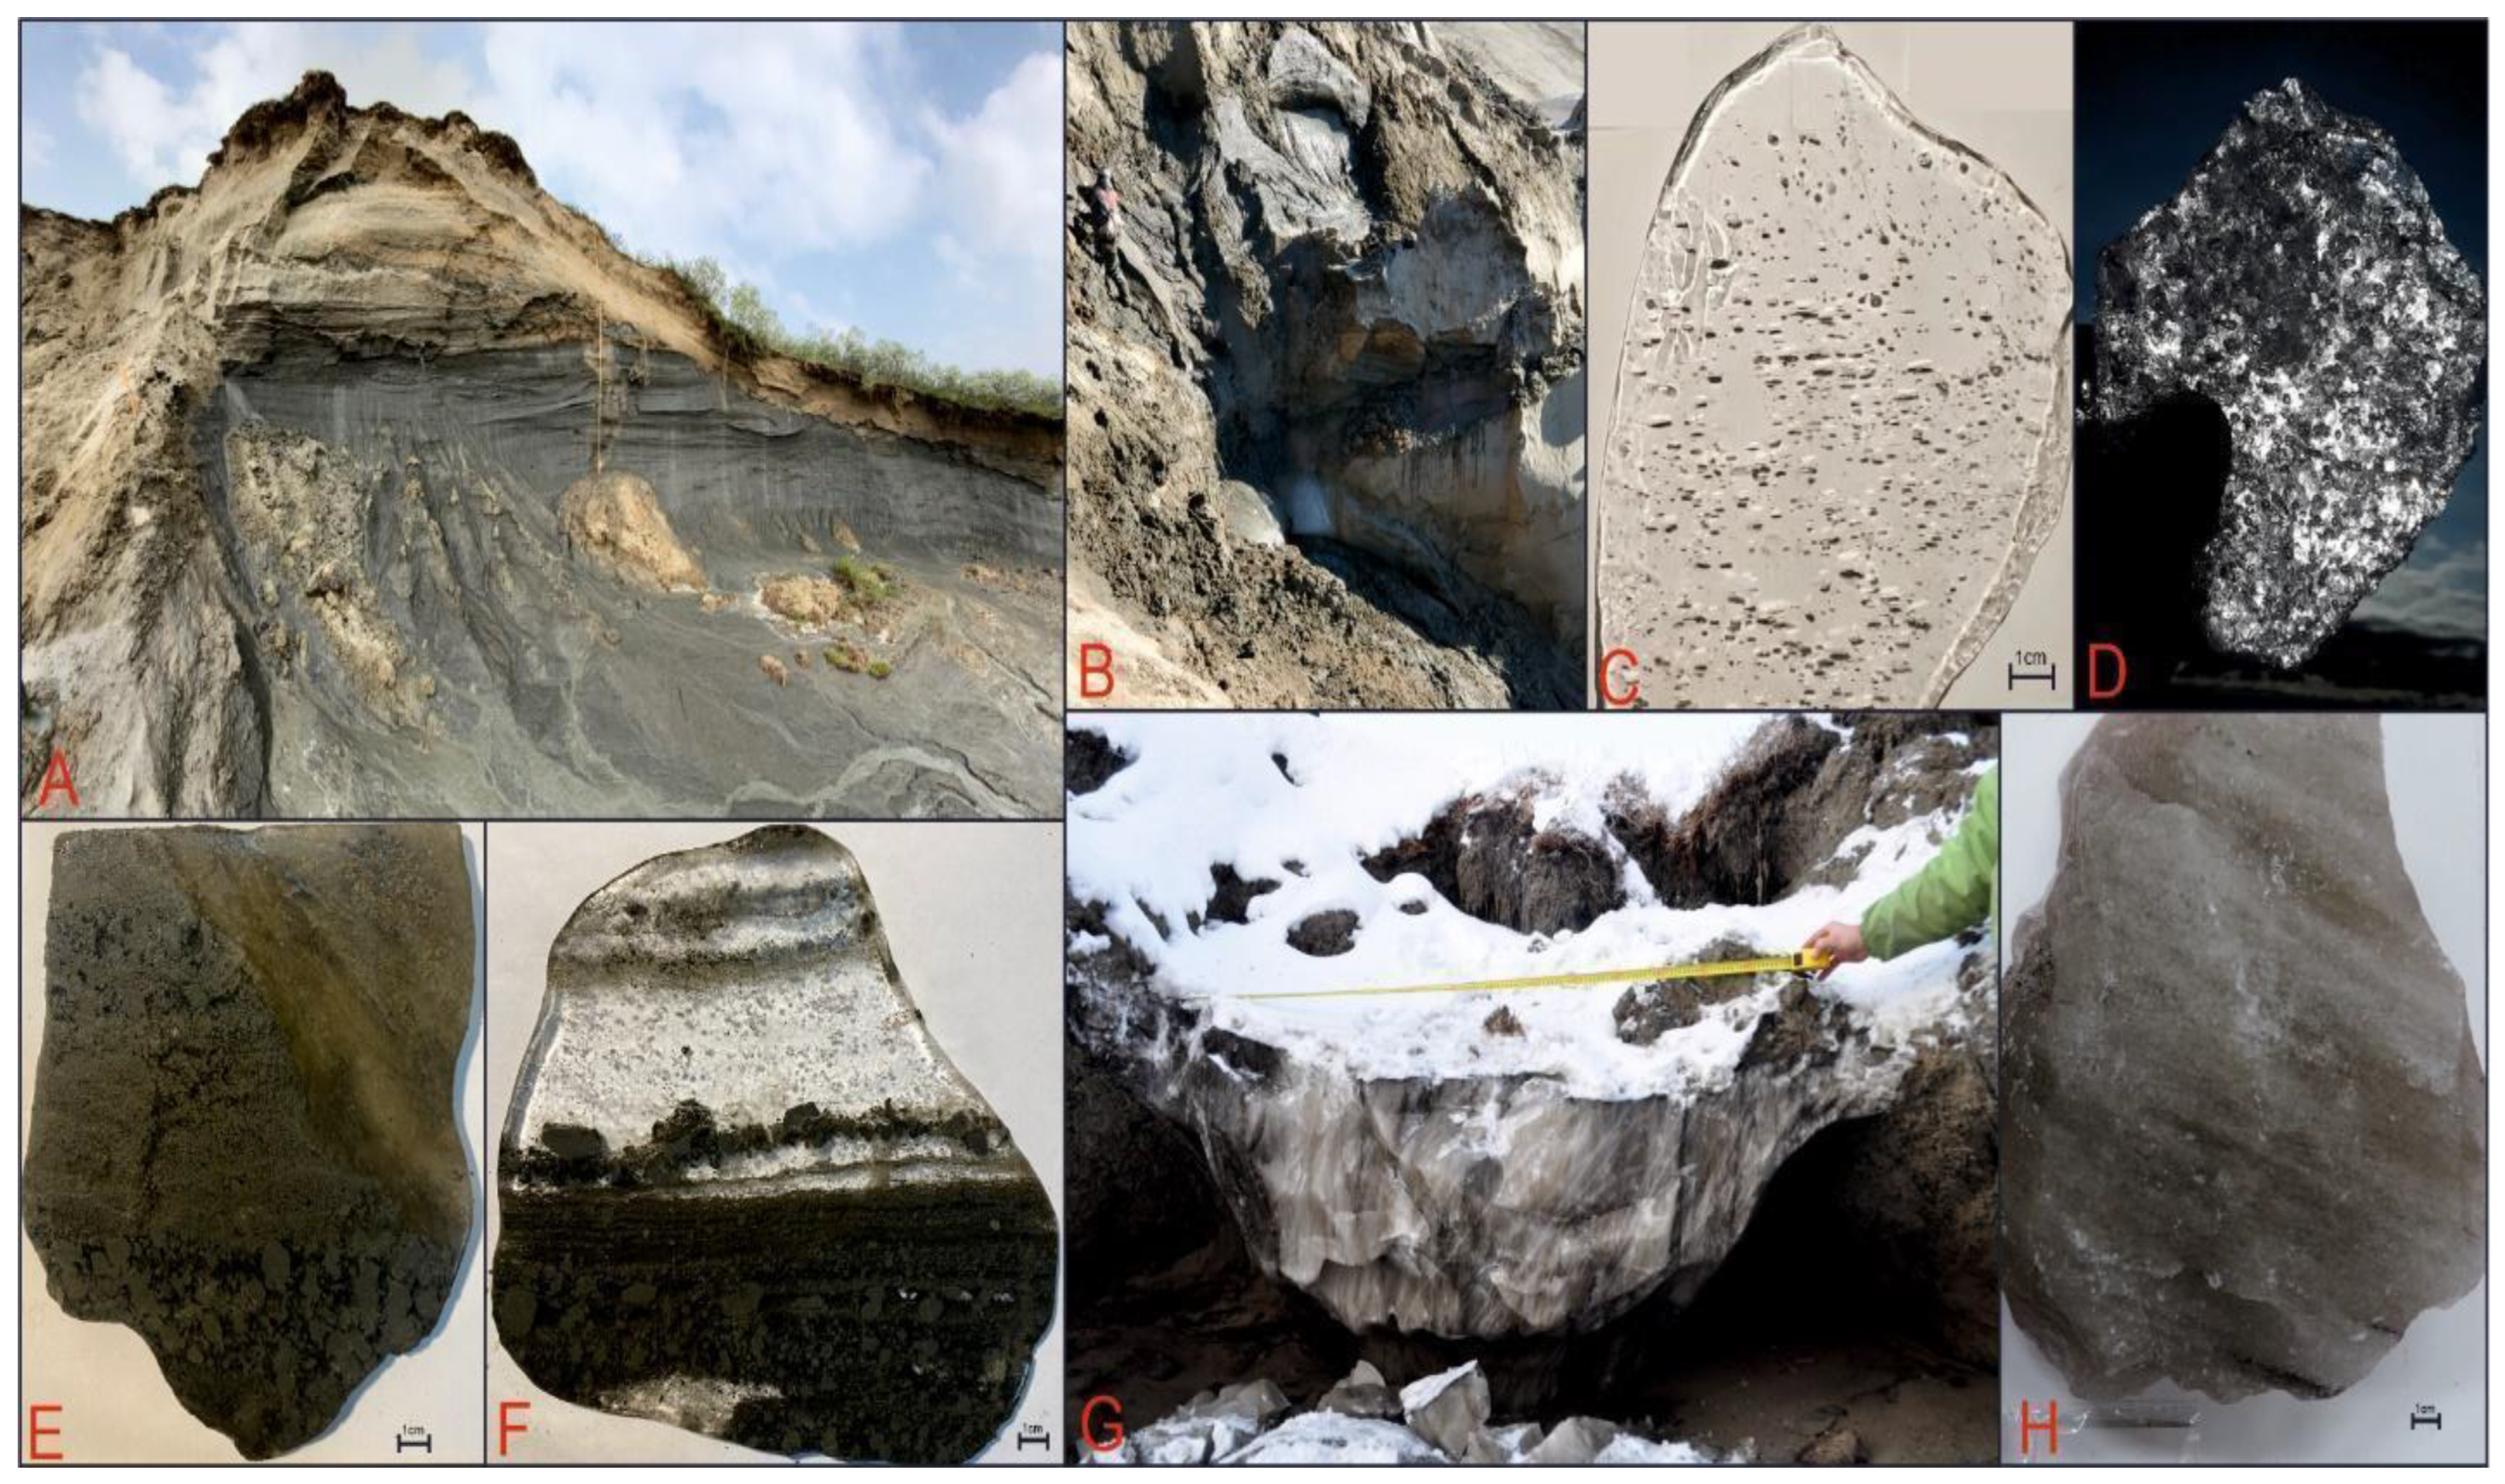
Figure 2 - B). The upper part of this cliff is composed of continental sandy deposits, which contain syngenetic ice wedges. The TGI is exposed at a depth of 11–12 m from the surface and consists of two adjacent lenses, measuring 0.4 and 0.75 m in thickness. The TGI samples (
Table 1, MS.TGI/p 1 – 3) we collected do not contain any ground inclusions, and the ice is coarse-crystalline (
Figure 2 - C), with individual crystals exceeding 10 cm in size, indicating a relatively slow freezing process.
At the Vaskiny Dachi Research Station, located on the watershed of the Se-Yakha and Mordy-Yakha rivers in the central part of the Yamal Peninsula, we studied TGI and IWs found within a retrogressive thaw slump (RTS) headwall in 2021 (
Figure 2 - A). The upper border of the TGI lies at a depth of 3.0 meters (at an absolute height of 22 m) beneath the surface and is covered by Late Pleistocene-Holocene continental deposits. The TGI is characterized by layers of transparent ice intermixed with dark sandy loam (
Figure 2 - F). In the middle segment of the section, the pure ice layers measure over 5 cm thick (
Table 1, VD.TGI/p 1 – 2). The TGI is interrupted by Late Pleistocene IW (
Figure 2 - E) with a visible height of 3.5 m and a width of 0.7 m in the upper part. We collected samples from both the IW (
Table 1, VD.LPW 1 – 15) and the TGI (
Table 1, VD.TGI/imp 1—13) throughout the entire depth of the ice wedges. Additionally, we examined Holocene ice wedges from the Vaskiny Dachi Research Station, located within the polygonal peatland. The polygons can reach sizes of up to 10 m in diameter, surrounded by polygonal troughs 0.3 – 0.5 m wide. Within the polygonal troughs, starting from depths of 0.5-0.6 meters, we sampled the top of Holocene IW (
Table 1, VD.HW 1 – 4). The wedge ice is transparent with characteristic sub-vertical layering and peat inclusions in lateral parts.
In the East-Siberian Arctic, we investigated ground ice on the Faddeevsky Peninsula, Kotelny Island, and the New Siberian Archipelago described in [
12]. Briefly, we collected Yedoma IW samples (
Table 1, F.LPW 1 – 8) near the Cape Nerpichy from the upper part of a 12-meter cliff. Close to Cape Sanga-Balagan and Blagoveshensky, we sampled Holocene ice wedges (
Table 1, F.HW 1 – 16) found in coastal cliffs ranging from 3 to 6 m in height (
Figure 2 – G; H). The Holocene continental complex of deposits containing ice wedges is underlain by marine clays formed before MIS 3. In proximity to Cape Sanga-Balagan, we also investigated transparent tabular ground ice (
Table 1, F.TGI/p 1 – 5) with some mineral inclusions at the height of 9 m. The origin of the TGI remains unclear [
12].
To compare our ground ice results with glacier ice, we collected four surface samples from the South-Eastern part of the Leningradsky glacier, located along its southern border on Bolshevik Island in the Severnaya Zemlya archipelago. Leningradsky is a complex glacier with an approximate area of 2300 km², comprising 4 ice caps, 11 outlet glaciers, and 3 slope glaciers [
15]. The age of the glacier remains uncertain. Ice core dating for the Akademii Nauk glacier suggests an age of 2.5 ka BP [
16], while another study by [
17] proposes an age of 12 ka BP. The Vavilova glacier is reported to have an age of 8-9 ka BP [
17]. The sampling site SZ.G1 is situated in the southernmost part of shield #56 (for further reference, glacier numbers are from [15; P.36-37]). The sample was obtained from the glacier's edge. Sample SZ.G2 was taken from ice cap #57, 270 meters inward from the glacier's border. Sample SZ.G3 was collected from outlet glacier #68, 700 meters inward from the glacier's border. Sample SZ.G4 was obtained from ice cap #59, which became separated from the complex Leningradsky glacier due to melting over the past 40 years. SZ.G4 is located in the vicinity of the glacier's highest point, approximately 2 km inward from its nearest border. All ice samples were transparent with a light-blue tint (
Figure 2 - D), containing air bubbles, and were collected from depths of 10-15 cm.
While some of the sampling points have been previously documented by authors [
12,
13], this article introduces a new dataset and sampling structure based on the location and the type of ice. We have assigned different names to these sampling points and samples, thus, additional details regarding their former names can be found in
Tables S1 and S2. Sample names have been designed to convey maximum information about each sample, including its location (e.g., SZ - Severnaya Zemlya, Bolshevik Island; AM - Yugorsky Peninsula, Amderma site; VD - Yamal, Vaskiny Dachi site; MS - Yamal, Marre-Sale site; F - New Siberian Islands, Faddevsky). The ice type is indicated by G for glacier ice, W for ice wedges, and TGI for tabular ground ice. In the case of TGI samples, the sediment content, which significantly influences DOM composition, is specified. Ice samples are classified as pure when the sediment content is less than 10% (by mass) of the solid fraction (TGI/p) and as impure when the sediment content exceeds 10% (TGI/imp). Additionally, ice wedge samples are further categorized by age into Late Pleistocene (LP) and Holocene (H). An overview of this new dataset structure is provided in
Table 1.
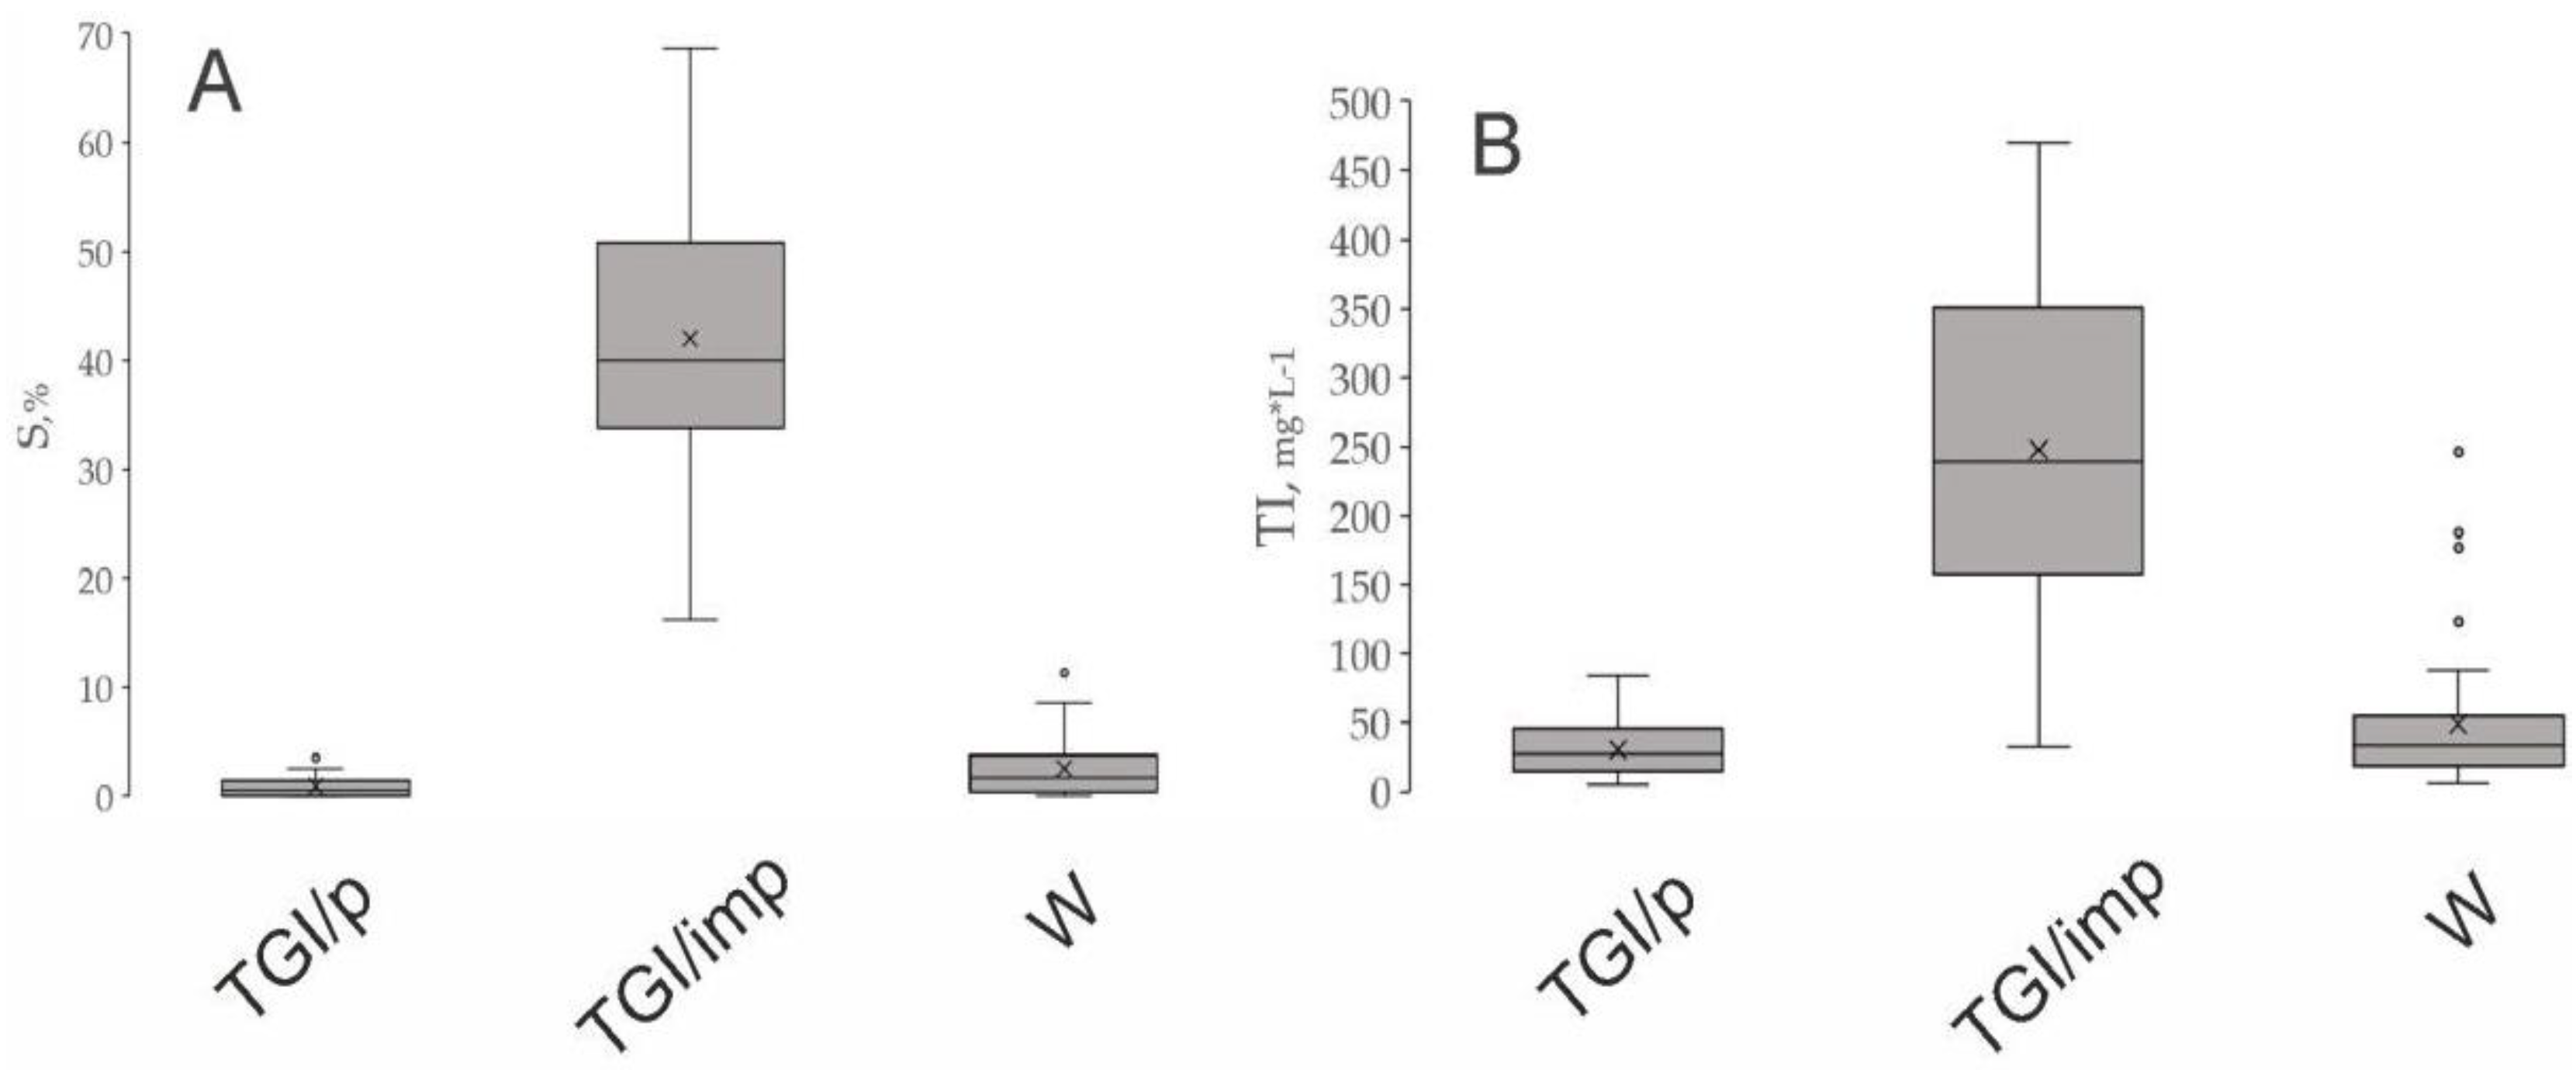
For box-plots representation we split our dataset in 3 categories: impure TGI (TGI/imp, n=13), pure TGI (TGI/p, n=18) and IW (W, n=43) by combining the distinct groups of the ground ice samples.
4. Results
4.1. Solid fraction content and ion composition of the ground ice
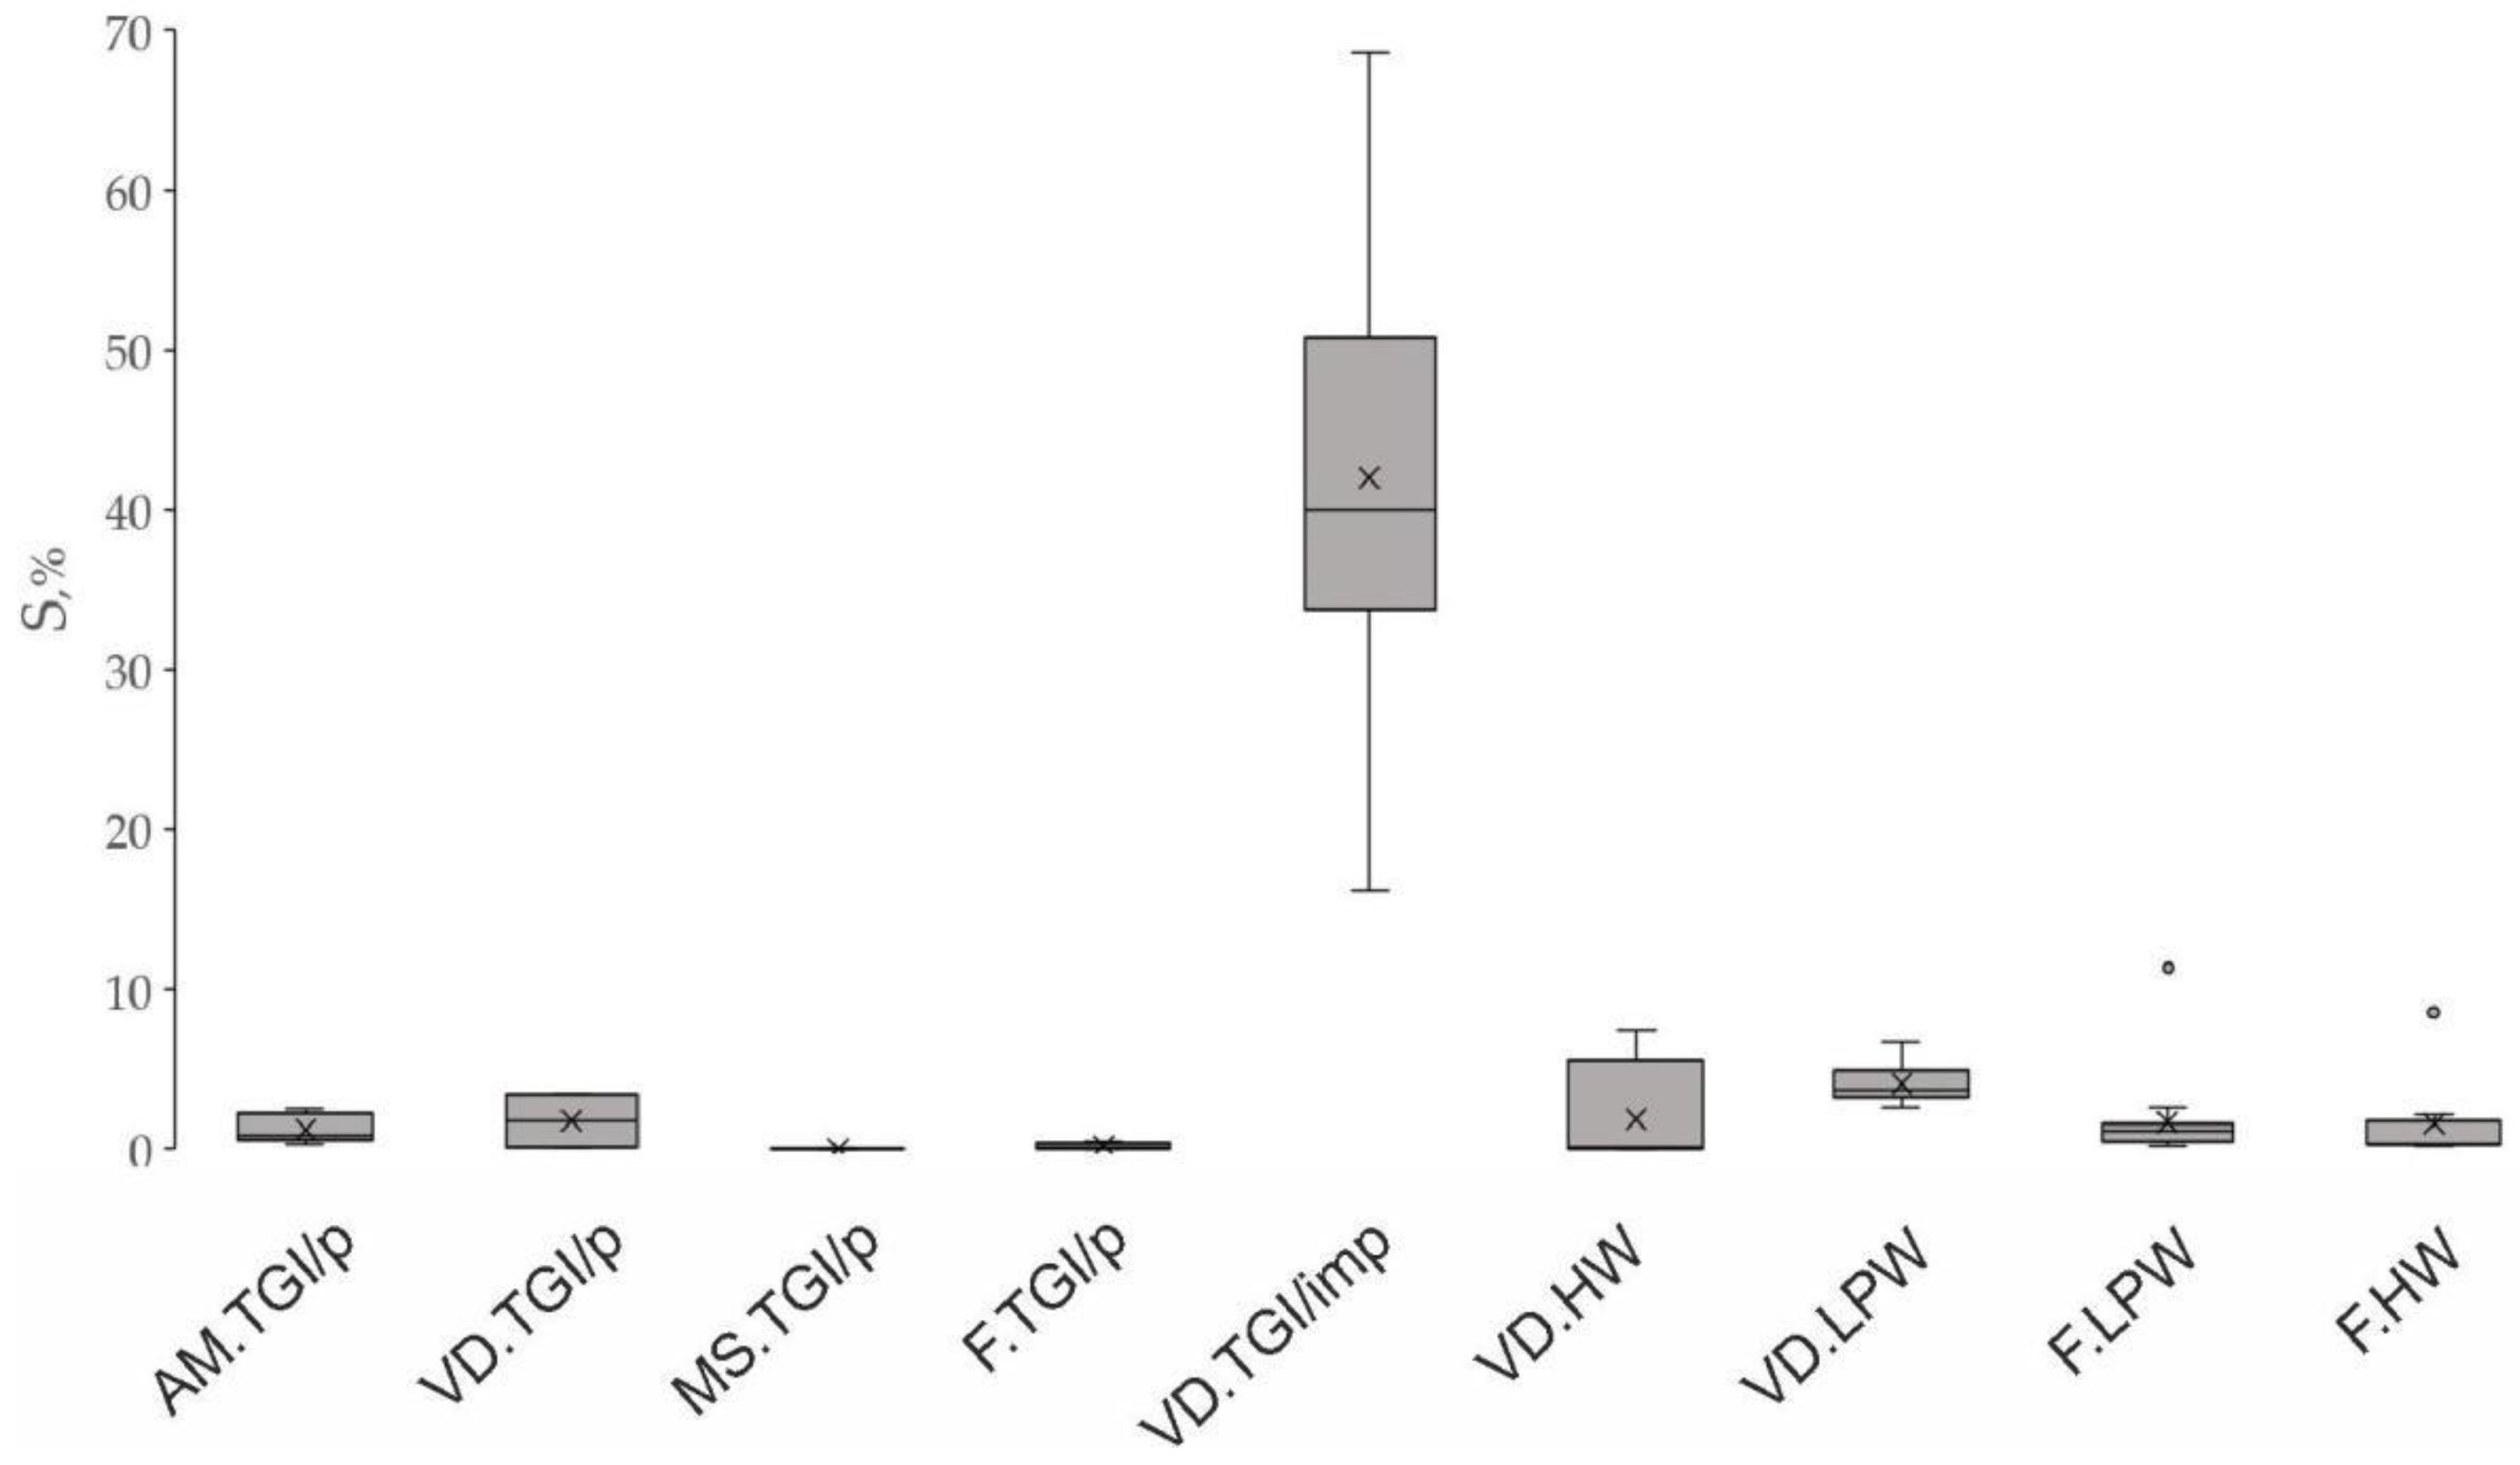
The solid fraction content (S%) exhibits significant variability within our ground ice dataset as approved by the coefficient of variation (CV) of 189.0%. The highest S value (68.65%) indicating the extremely high solid fraction content in the ground ice sample is detected in the impure TGI (VD.TGI/imp 9) sampled from the ground ice exposure of the Vas’kiny Dachi site (Central Yamal). The lowest S values, suggesting insignificant solid matter inclusions in the ice body (<0.01 %), are characteristic of pure TGI from Marre sale site (Western Yamal). On the box plot (
Figure 3) there is an obvious separation of the impure TGI in which the ice content is minor relative to the solid one (S%), represented either by soil or sediment particles in the thawed ground ice monoliths. The statically confident difference in solid fraction percentage is demonstrated between each of the three sample categories (TGI/p, TGI/imp, W) by the Kruskall-Wallis multiple test, with p value of 0.048 for the pair TGI/p and W, and p < 0.0000 for the pairs TGI/imp, TGI/p and TGI/imp, W respectively. The sequence of the sample categories with decreasing median values of solid fraction content (S, %) is TGI/imp (39.96%) > W (1.6%) > TGI/p (0.6%). The sequence of individual sample groups with decreasing S (%): VD.TGI/imp (39.96%) > VD.LPW (3.74%)> VD.TGI/p (1.81%) > F.HW (1.15%) > AM.TGI/p (0.86%) > F.LPW (0.35 ppmV) > F.TGI/p (0.14%) > MS.TGI/p (0.01%).
The median ions concentrations as well as basic descriptive statistics for each group of the samples are given in the
Tables S1 and S2. The most abundant ions in our ground ice sample collection (n=78) are Na+ and Cl-, respectively constituting 31.85 and 42.90 % of a sum of the ions (excluding HCO3- and CO32-) marked as Total ion, TI (mg/L). The sequence of decreasing median values of the ion percentage for a whole dataset is: Cl-(42.90%) > Na+(31.85%) > SO42-(8.06%) > Ca2+(4.50%) > K+(3.48%) > Mg2+(3.30%) > NH4+(1.30%) > NO32-(0.34%) > PO43-(0.12%). In this work we use the individual ions concentrations along with their sum (TI, mg/L) in multivariate statistics analysis for better separation of the sample groups on a PCA biplot as described in the Section. Thus, we do not address the particular distribution of each ion in our dataset. The ions abundance (TI, mg/L) is of great variation samples, indicated by CV=132.08%. The distribution of TI in the categories of ground ice is illustrated by box plot (
Figure 4). The statistically reliable variance (p=0.0000) is marked for TGI/imp with both TGI/p and IW.
4.2. Bulk dissolved biogeochemical parameters (DOC, DIC, DIN) concentrations and distribution
Data on bulk biogeochemical parameters concentrations (DOC, DIC, DIN), including the descriptive statistics, are listed in the
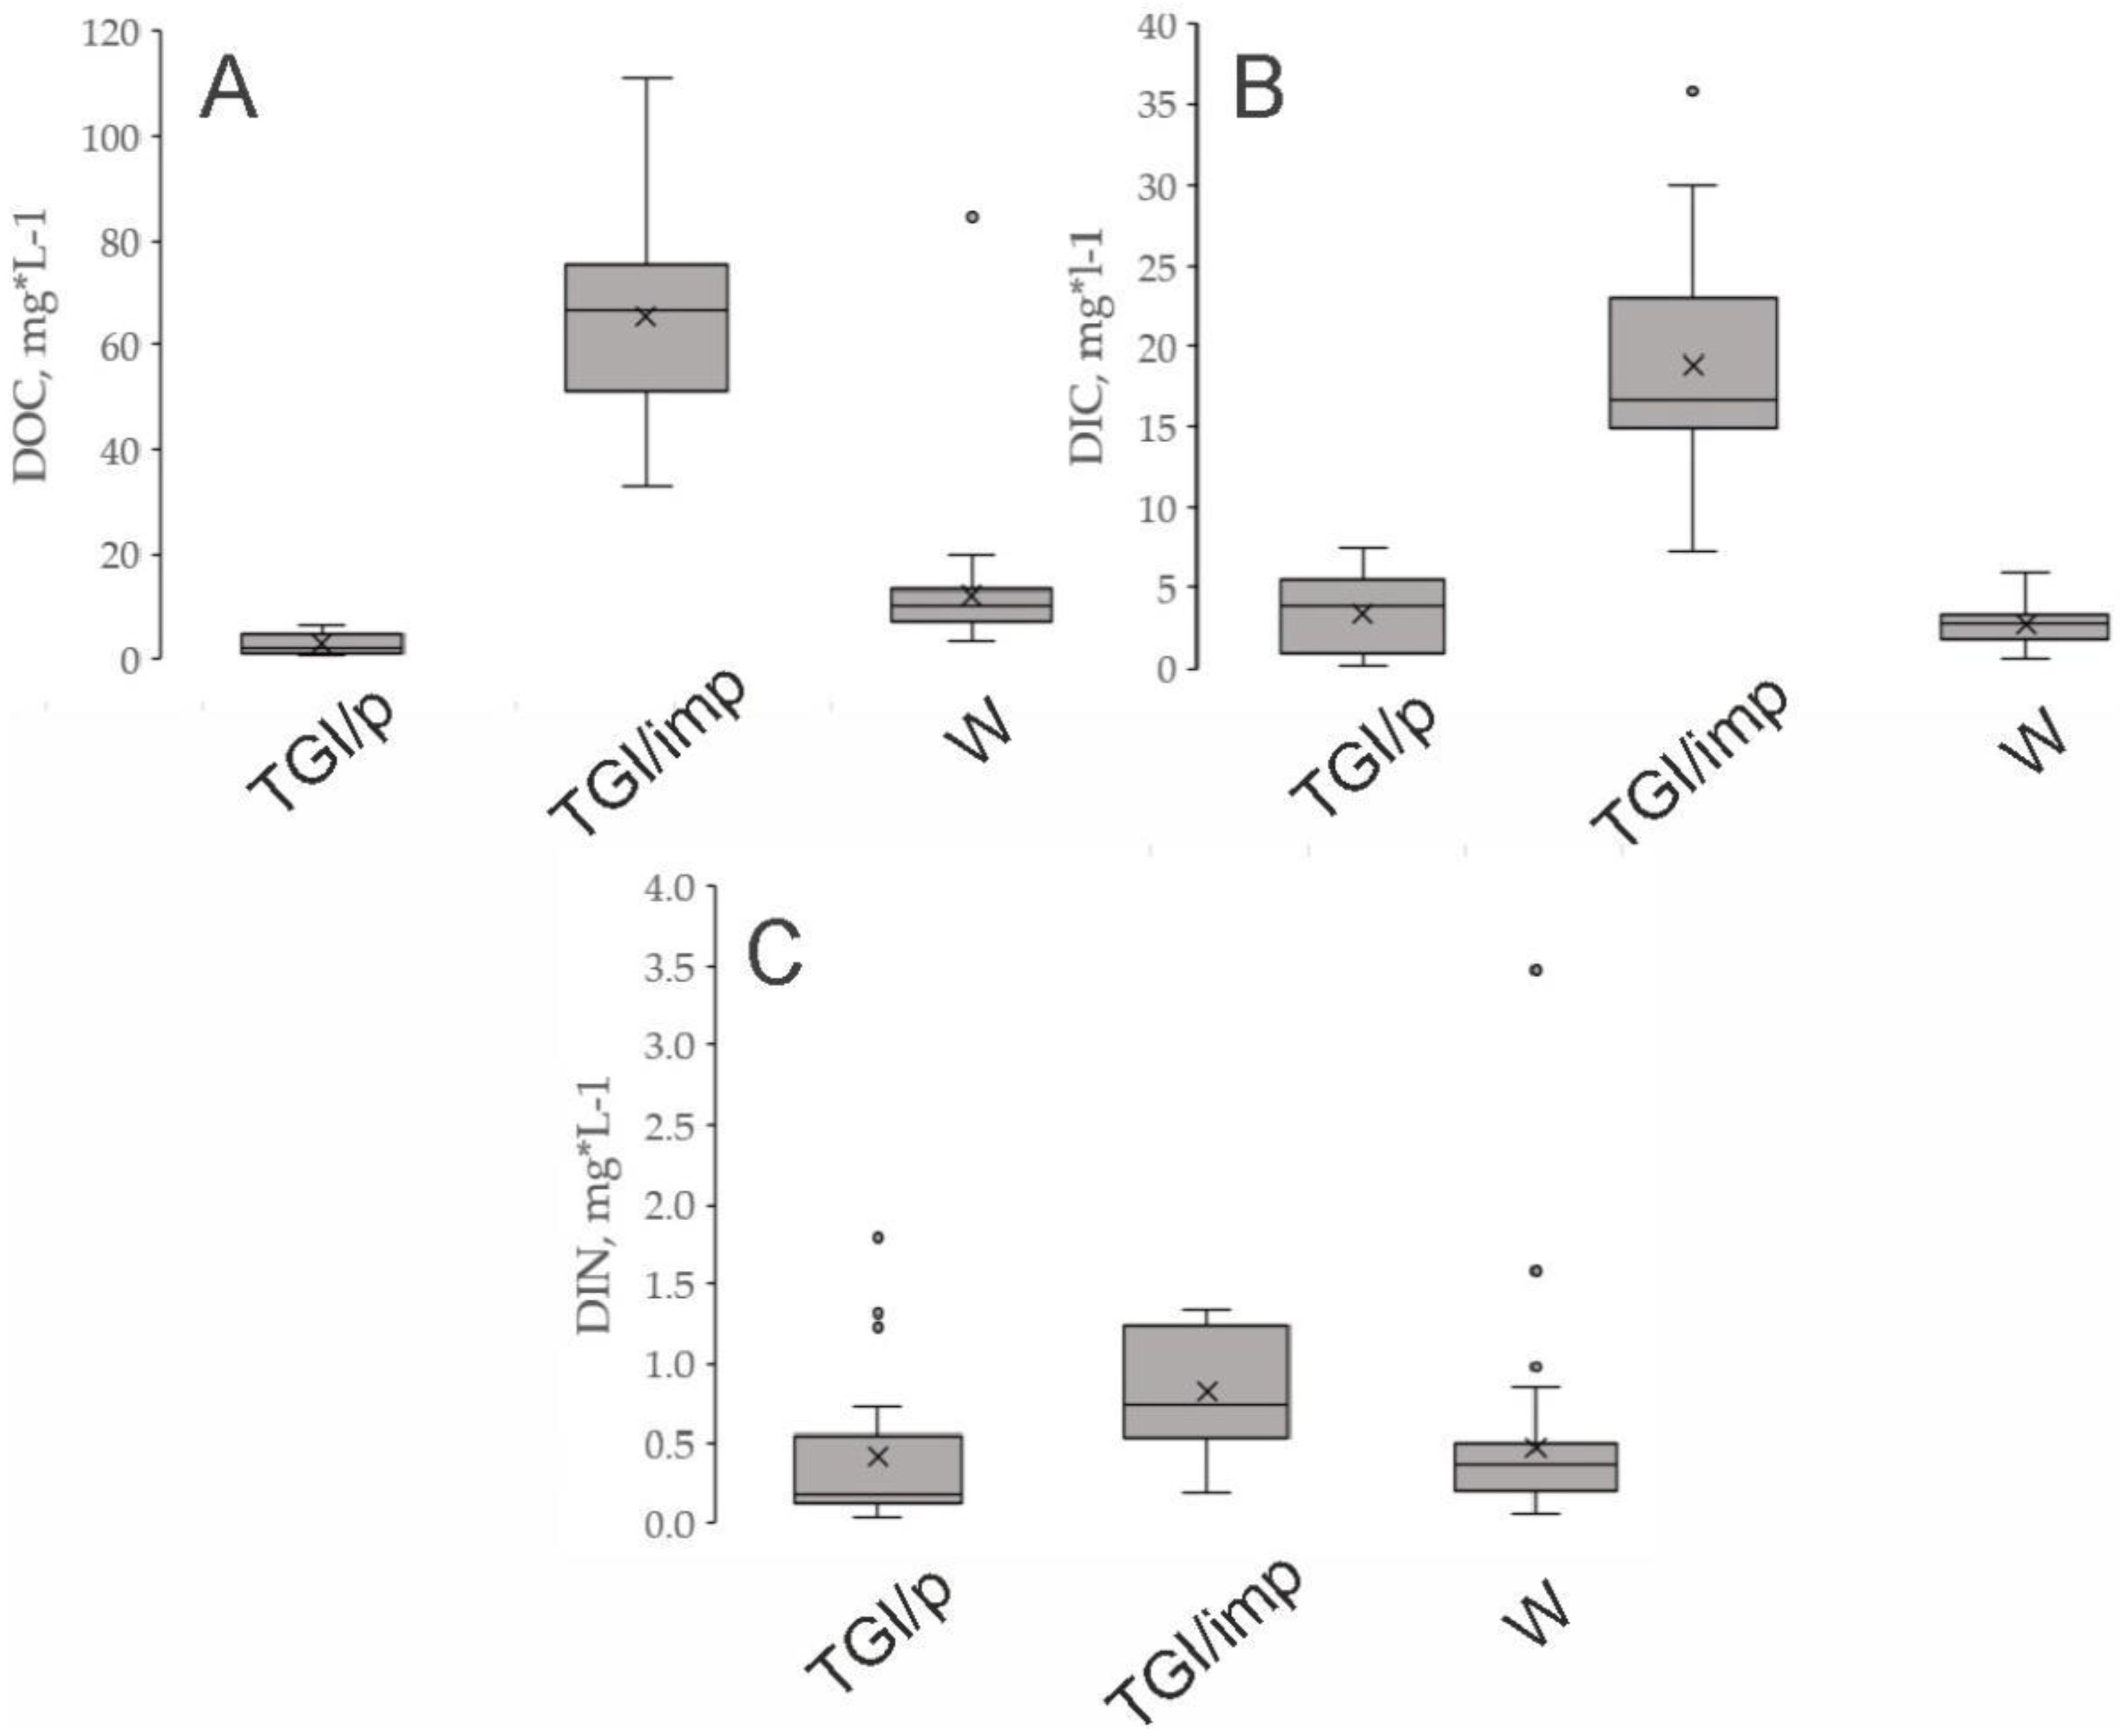
Tables S1 and S2. Regarding DOC content, the sample categories make up a sequence of decreasing values: TGI/imp>W>TGI/p (
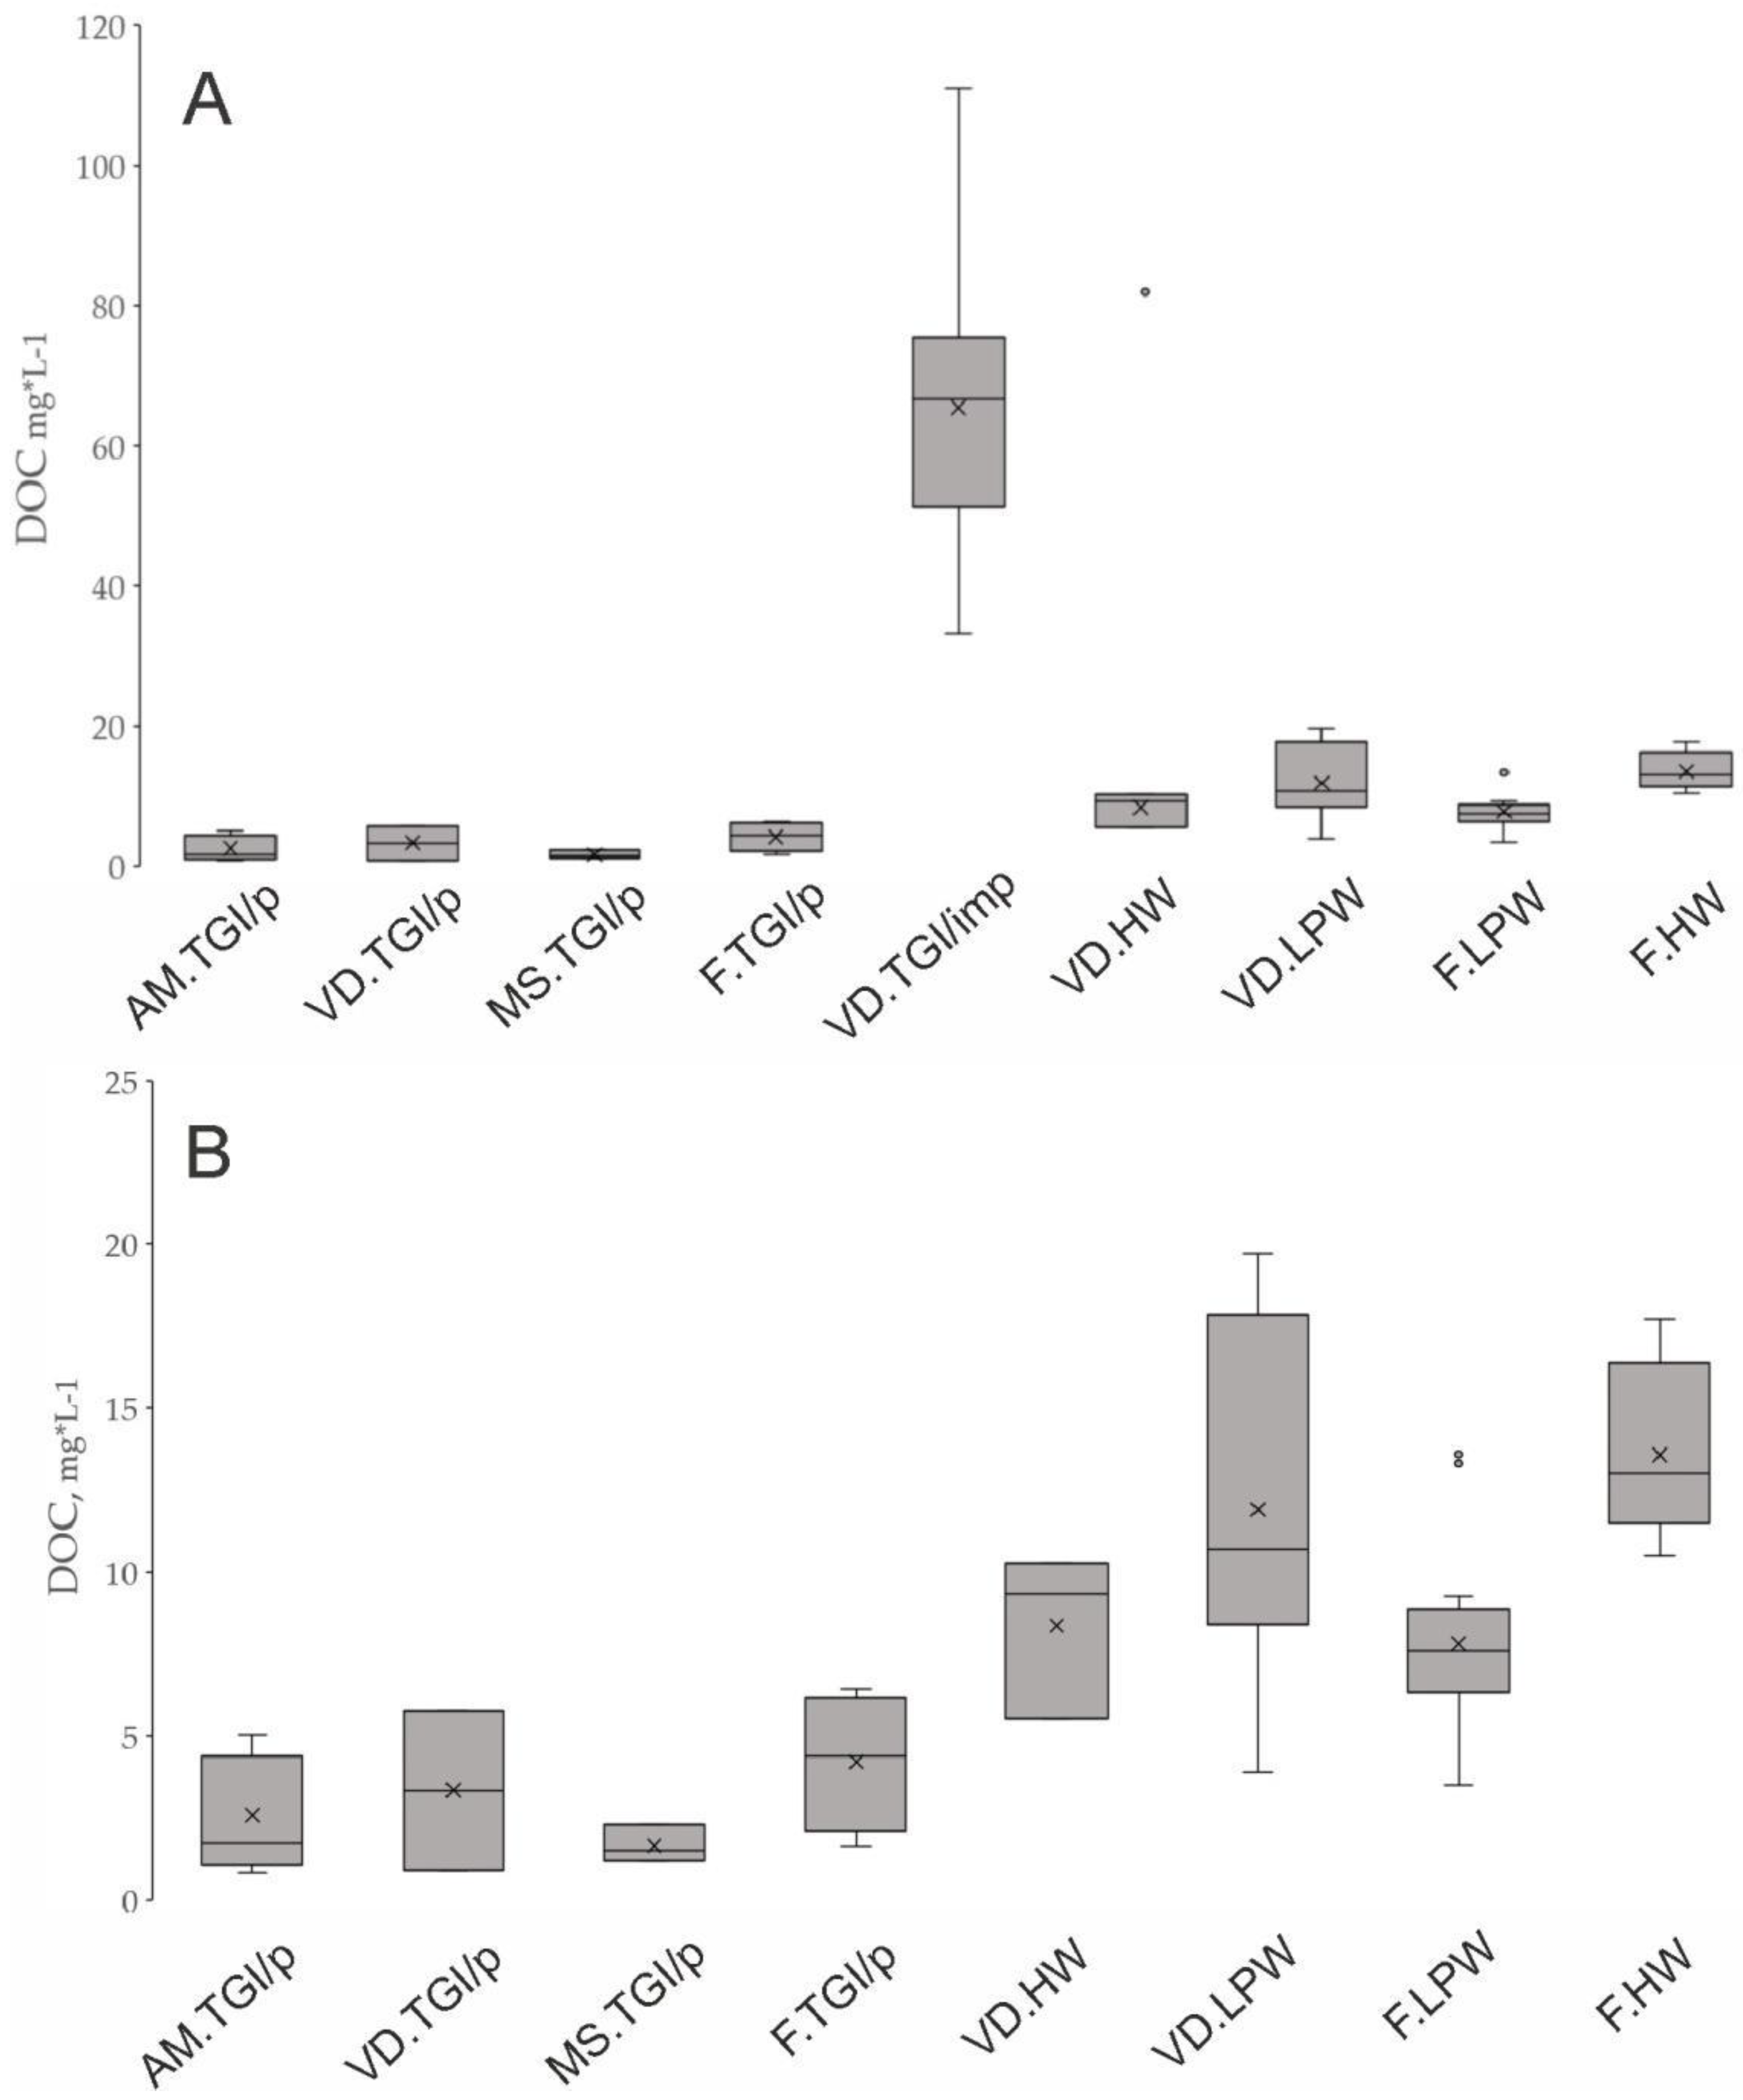
Figure 5) with a reliable inercategory variability approved by the non-parametric Kruskall-Wallis multiple comparison test at p<0.0002. The median DOC level (66.65 mg/L) in the impure TGI samples from Vaskiny Dachi site (VD.TGI/imp) is about 33 times higher than those of the pure TGI (TGI/p) combined group. The detected maximum of DOC concentration is as high as 111.00 mg/L in the impure TGI sample (VD.TGI/imp 11), while minimum one is as low as 0.85 mg/L in the pure TGI from Amderma site (AM.TGI/p 2). Variation of DOC level between the individual groups of samples naturally reveals that impure TGI samples from Yamal are sufficiently enriched in DOC relative to other groups (
Figure 6). The sequence of decreasing DOC median values in the groups of the samples is VD.TGI/imp (66.65 mg/L) > F.LPW (13.01 mg/L) > VD.LPW (10.71 mg/L) > VD.HW (9.81 mg/L) > F.HW (7.60 mg/L) > F.TGI/p (4.4 mg/L) > VD.TGI/p (3.35 mg/L) > AM.TGI/p (1.74 mg/L) > MS.TGI/p (1.51 mg/L) > SZ.G (1.38 mg/L). To illustrate the variation of DOC in the sample groups, the anomalous VD.TGI/imp were excluded from the box-plot on
Figure 6 - B. The Holocene IWs from Vaskiny Dachi are notable for the extreme outlier (VD.HW 3) with DOC value (84.39 mg/L), whereas other VD.HW samples have DOC content below 10 mg/L.
Maximum DIC concentration (35.50 mg/L) is also detected in the impure TGI sample (VD.TGI/imp 11), the minimum – in the pure TGI from Vaskiny Dachi site (VD.TGI/p 2). The median values in TGI/imp, TGI/p and W sample categories constitute 16.73, 3.97 and 2.82 mg/L respectively. The variance between TGI/imp and other sample categories (TGI/p and W) is statistically significant at p<0.0002. Maximum DIN level (3.47 mg/L) is observed in the Holocene IW from Vaskiny Dachi site (VD.HW 3), the minimum of 0.029 mg/L, close to the instrumental detection limit, is recorded in the pure TGI from Amderma site (AM.TGI/p 9). The median DIN values in TGI/imp, TGI/p and W sample categories constitute 0.73, 0.18 and 0.36 mg/L respectively. The increased level of DIN in TGI/imp samples is statistically significant, relative to both TGI/p and W (p<0.05).
4.3. Carbon-bearing gases (CH4 and CO2) concentrations and distribution
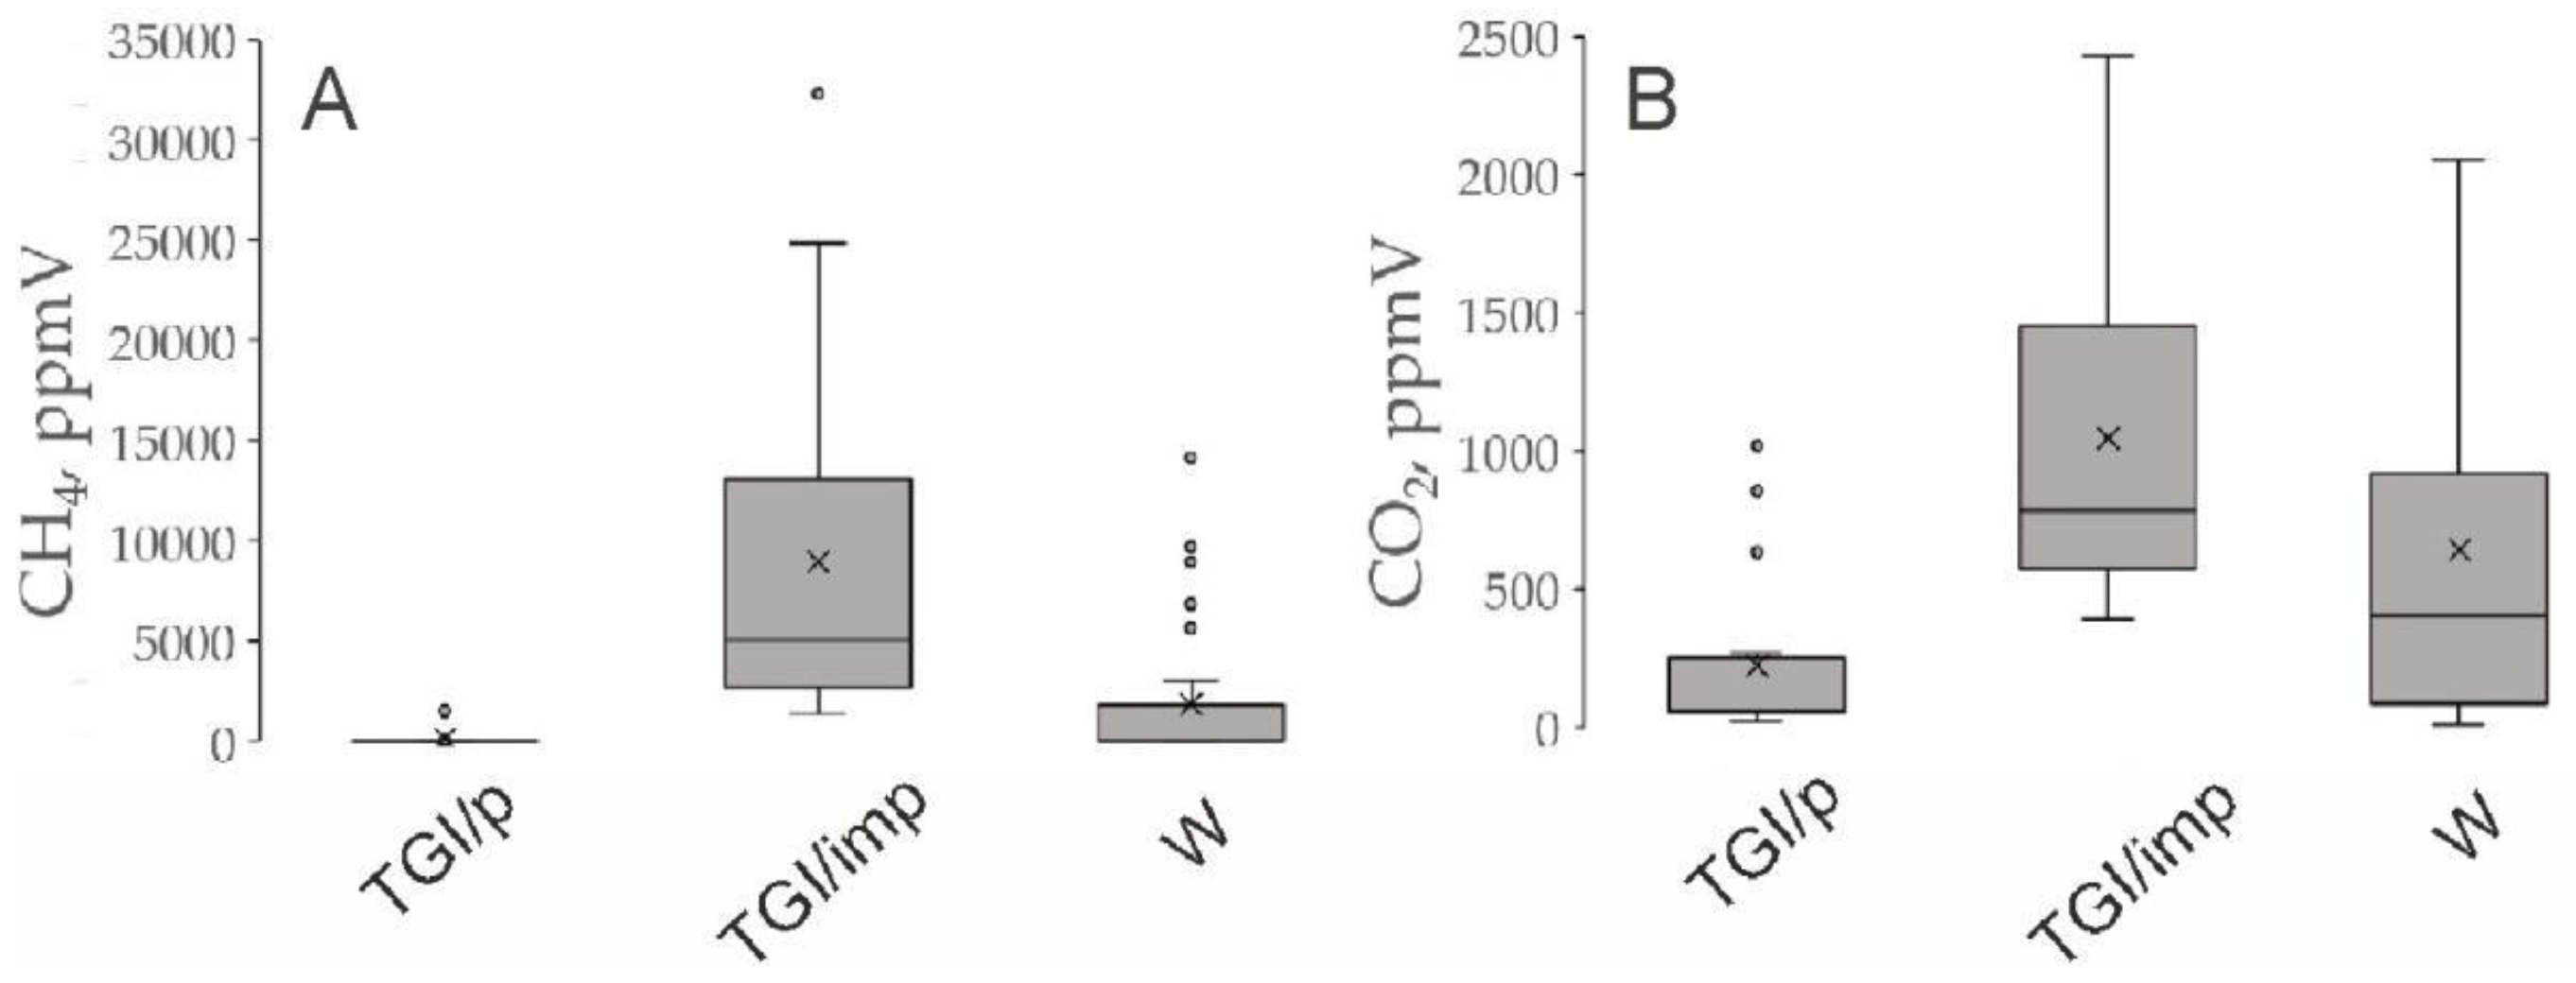
Methane (CH4) concentration variations are highest among the analyzed geochemical variables as indicated by the coefficient of variation (CV) as high as 244%. The maximum CH4 concentration (32281.65 ppmV) is detected in the impure TGI from Yamal (VD.TGI/imp 13) and the lowest (0.391 ppmV) in the Late Pleistocene IW from Faddeevsky (F.LPW 6). The median methane concentrations in the ground ice samples categories make up a row: TGI/imp (5075.57 ppmV) > W (3009.ppmV) > TGI/p (5.14 ppmV). The corresponding box-plot diagram is represented on
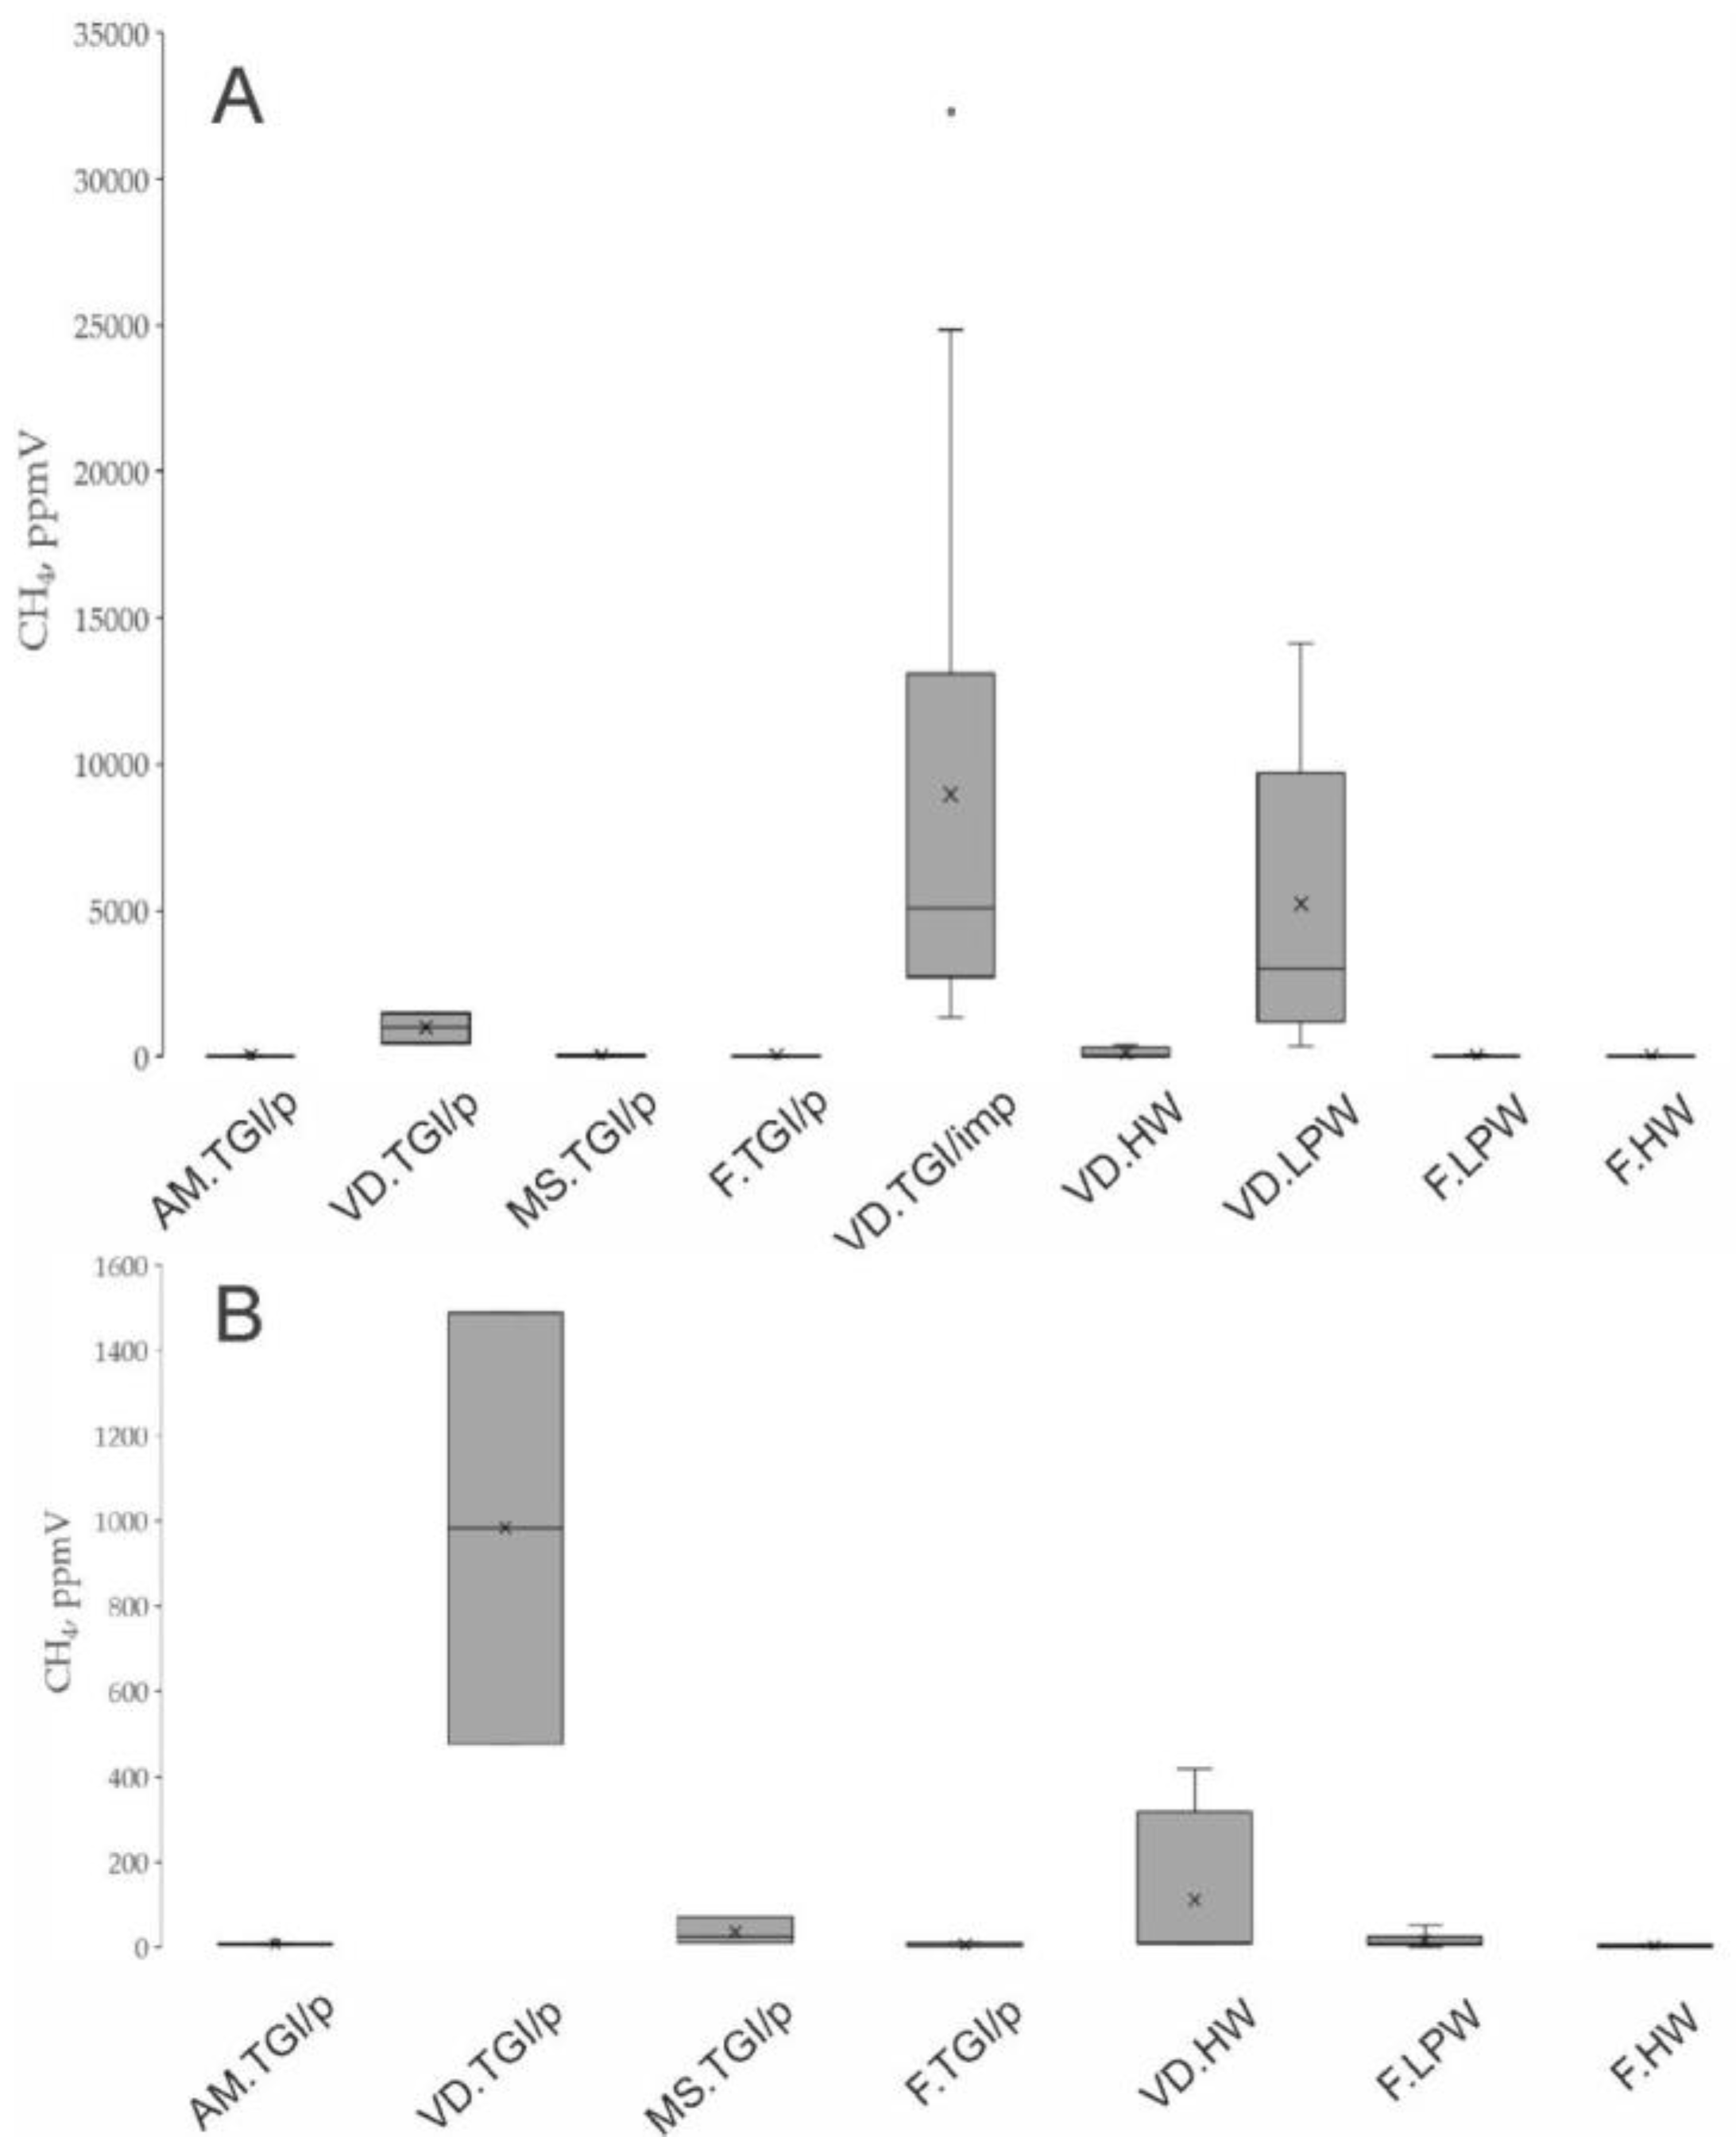
Figure 7. The Kruskall-Wallis multiple test reveals a significant variance between the TGI/imp and other categories (TGI/p and W) at level of p<0.001. However, a comparison between the individual groups of the ground ice samples shows that Late Pleistocene IWs from Yamal are reliably enriched in CH4, compared to the other groups (p<0.001) with the single outlier. The Holocene IW from Yamal (Vaskiny Dach site) are remarkable for a single outlier value (418.14 ppm) in the sample VD.HW 3, while other samples of this group express the CH4 concentration below 10 ppmV. The sequence of decreasing median values of methane content in the individual group is: VD.TGI/imp (5075.57 ppmV) > VD.LPW (3009.33 ppmV) > F.TGI/p (983.66 ppmV) > VD.TGI/p (23.72 ppmV) > VD.HW (8.66 ppmV) > F.HW (5.46 ppmV) > AM.TGI/p (4.55 ppmV) > F.TGI/p (1.79 ppmV) > F.LPW (1.29 ppmV).
The carbon dioxide (CO2) concentrations vary from 43.120 ppmV (a minimum value) in the pure TGI of the Amderma site (AM.TGI/p 8) to a maximum of 3539 ppmV in the Holocene IW of the Vaskiny Dachi site (VD.HW 3). The median CO2 concentrations in the ground ice samples categories indicate the row: TGI/imp (786.35 ppmV) > W (403.74 ppmV) > TGI/p (59.19 ppmV). The box-plots of CH4 variation in the individual groups are shown on
Figure 8. To illustrate the variation of DOC in the sample groups, the anomalous VD.TGI/imp were excluded from the box-plot on
Figure 8 - B.
The box plots of the CH4 and CO2 median concentrations variations in the categories of samples are shown on
Figure 7.
4.4. Fluorescent dissolved organic matter composition and distribution
The employed EEM dataset is composed of 252 samples, including the ground ice (TGI, IW), glacier ice and other natural water samples from adjacent areas (thaw water streams and thermokarst lakes), which are not included in our dataset of geochemical variables. Four fluorescence components were extracted from EEM spectra and validated for the dataset by PARAFAC analysis. Three components (P1, P2, P3) were recognized as humic-like DOM, and one is protein-like (tryptophan-like DOM). In
Table 2 the spectral characteristics of the extracted fluorophores are indicated as well as the results of the library search using the EFC software. The representative EEM matrices illustrating the typical EEM fingerprints of the different ground ice types are exhibited on
Figure 9. Among the obtained components, the humic ones (P1, P2, P3, P4) quite well correlate to each other (as indicated by the Pearson’s correlation values indicated in the
Table 2), but the protein-like component (P4) was equally not related to any of the other fractions.
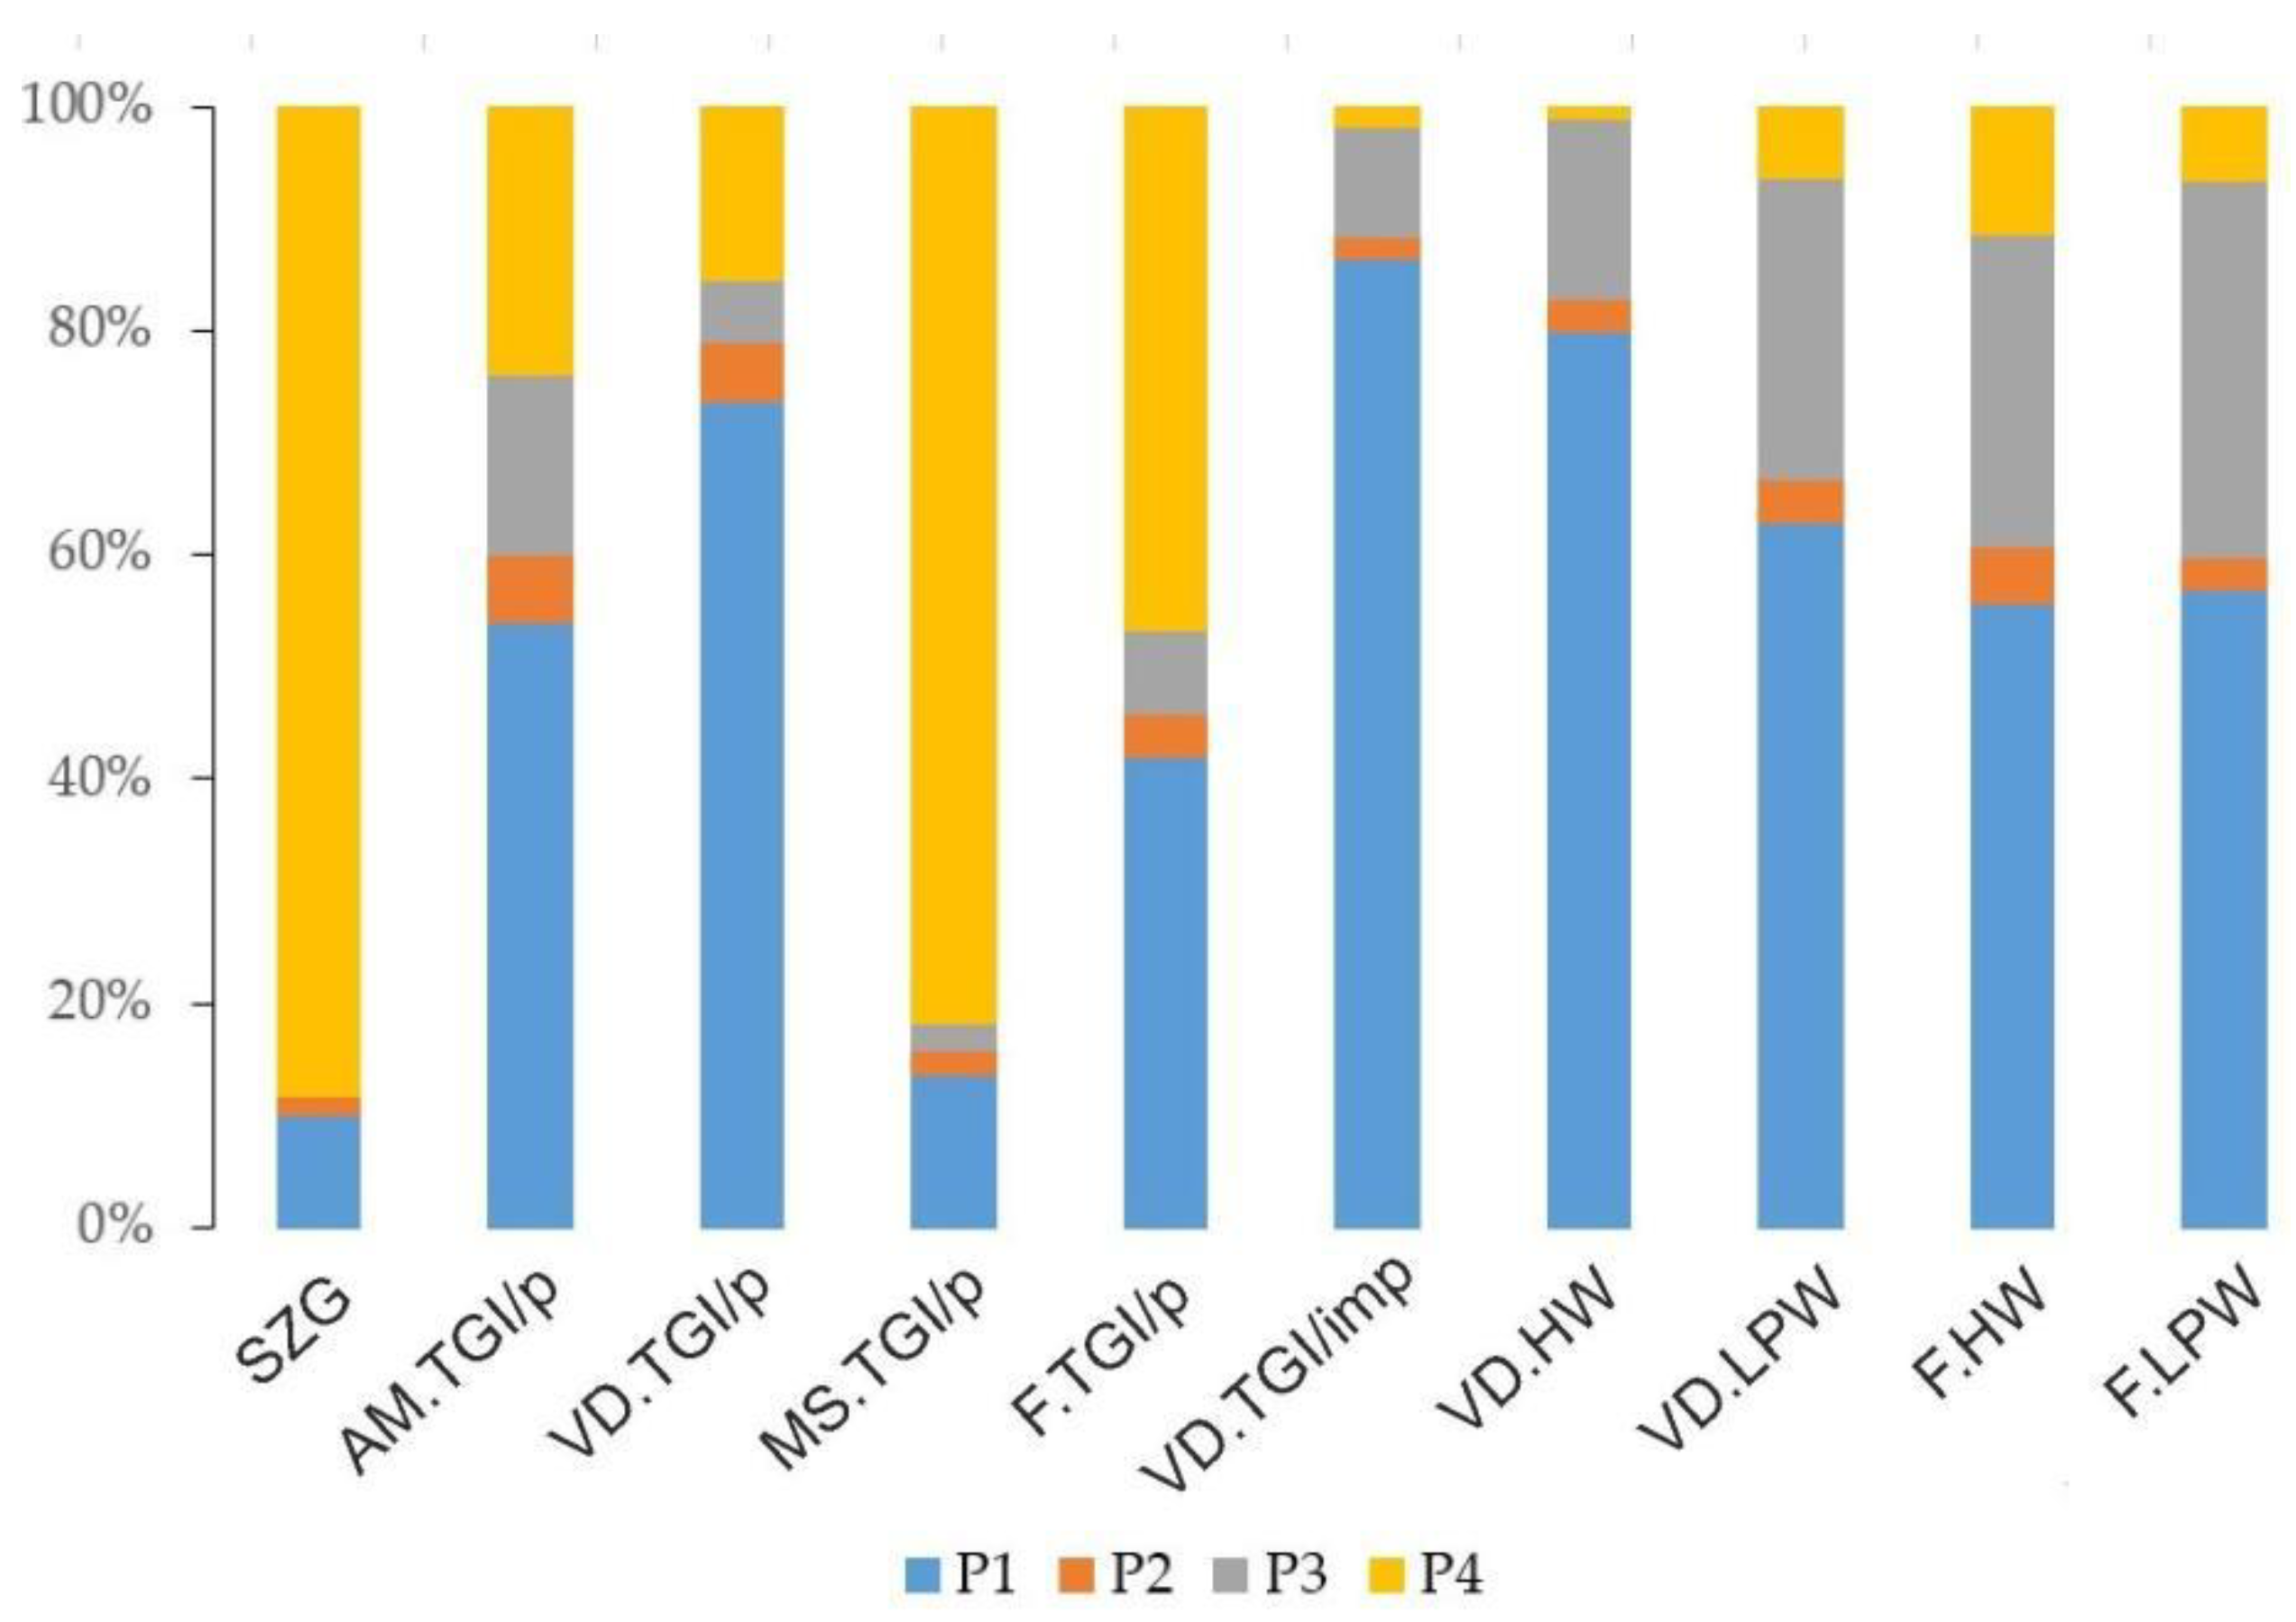
The relative abundances of the EEM PARAFAC compounds (%) based on their median concentrations (RU) clearly indicate the character of the fluorescent DOM composition intergroup variability (
Figure 10). Thus, the protein-like component P4 is making up >88% of the net DOM in the samples of Leningradsky glacier, Bolshevik island (SZ.G) DOM; > 81% of the pure TGI DOM from Marre-Sale (MS.TGI/p); > 46% of the pure TGI from the Fadeevsky Peninsula (New Siberian Island, F.TGI/p); > 15% of the pure TGI from the Yugorsky peninsula (Amderma site, AM.TGI/p). In the other groups of the analyzed ground ice samples, the contribution of P4 varies from 11.53 % in the Holocene IWs of Faddeevsky (F.HW) to the minimum value of 1.1% in the Holocene IW from the Vaskiny Dachi site. Among the humic-like DOM, the component P1 is the most ubiquitous in the majority of the sample groups, excluding the SZ.G, and MS.TGI/p, reported for outstanding abundance of P4. The maximum rate of P1 (83.2%) is characteristic of the impure TGI from Central Yamal (VD.TGI/imp). The P2 DOM is the minor humic-like species with contribution ranging from 1.73% in the samples of Leningradsky glacier, Bolshevik Island to 6.03% in the pure TGI of Marre Sale site (MS.TGI/p). The component P3 is a second number in abundance after P1 and the first number for a fluorescent DOM composition in the scope of a variation (CV=167.4%), reaching its maximum (33%) in the Late Pleistocene IW of Faddeevsky (Kotelny, New Siberian Islands), while drops to 0.3% in SZ.G.
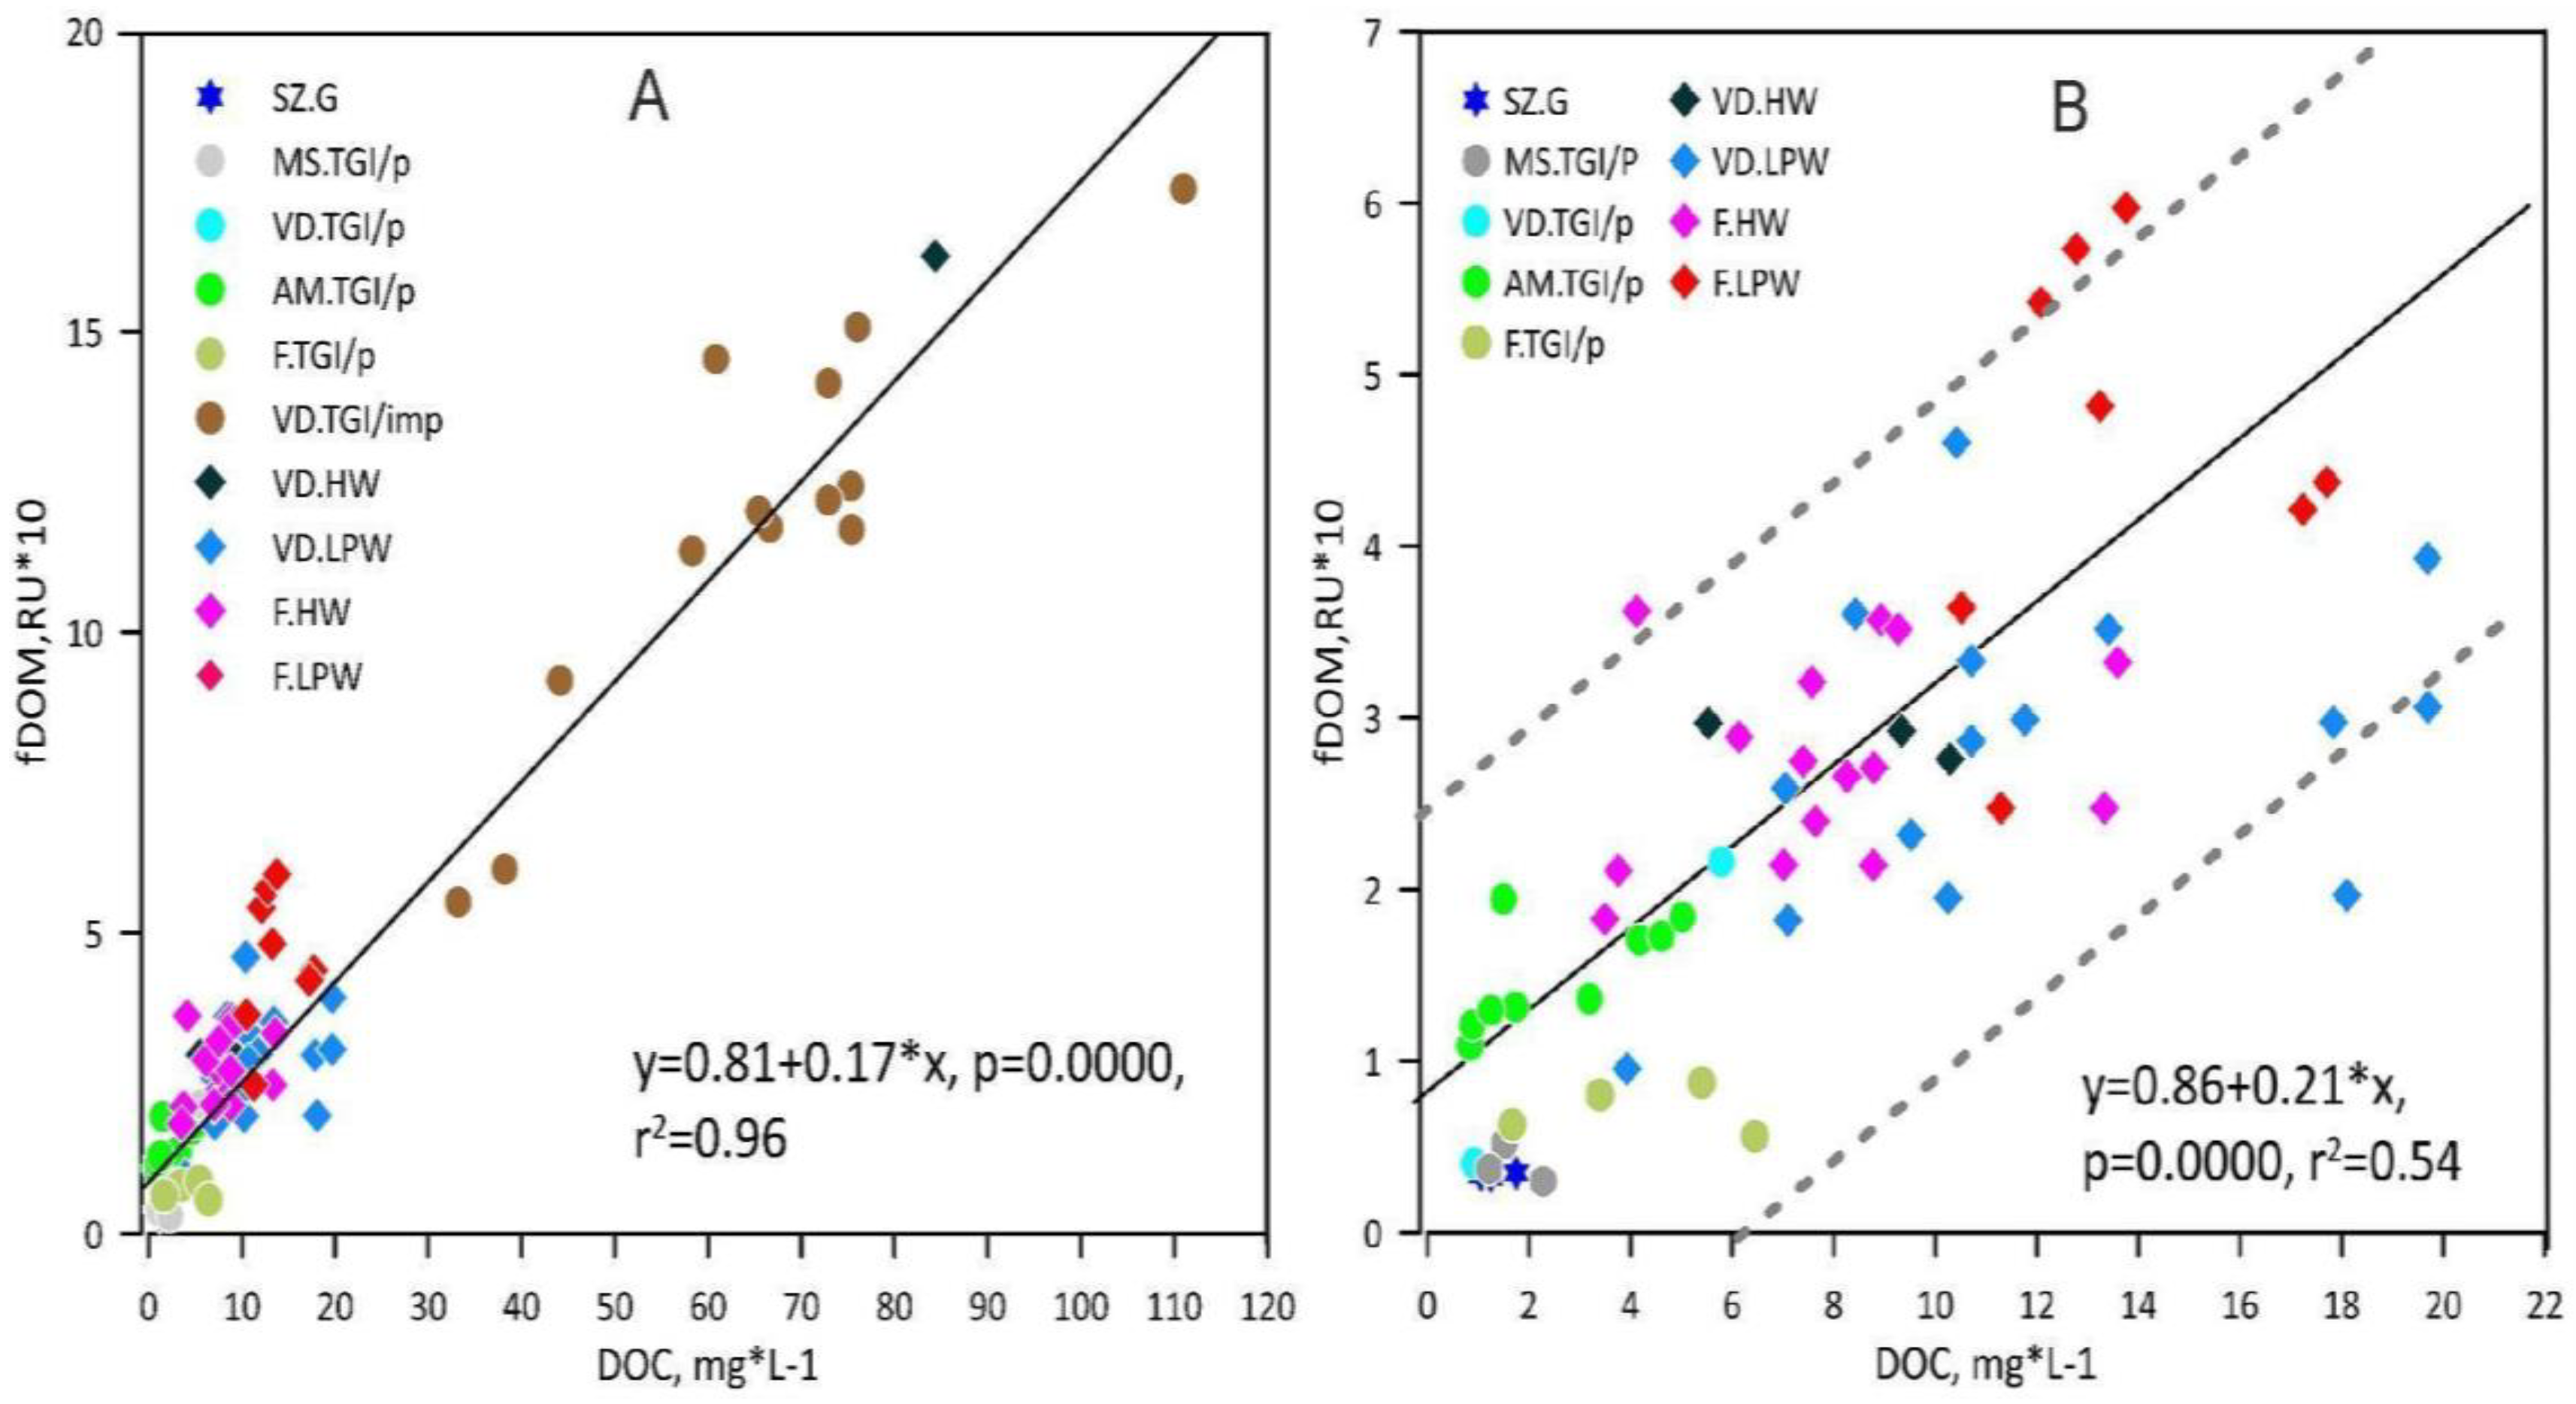
A linear regression between the fluorescent DOM content (as sum of the P1-P4) and DOC concentration indicates a good fit between these parameters (r2=0.96, p=0.0000). On the plot (
Figure 11) we observe a clear separation of the samples extremely enriched in both DOC and fluorescent DOM, including all the impure TGI (VD.TGI/imp) and one Holocene IW sample (VD.HW). Other samples form a cloud of data points with visible scattering around the regression line. When examined separately the samples with DOC concentrations below 30 mg/L show the lower correlation between DOC and fluorescent DOM (r2=0.54, p=0.0000) (
Figure 11).
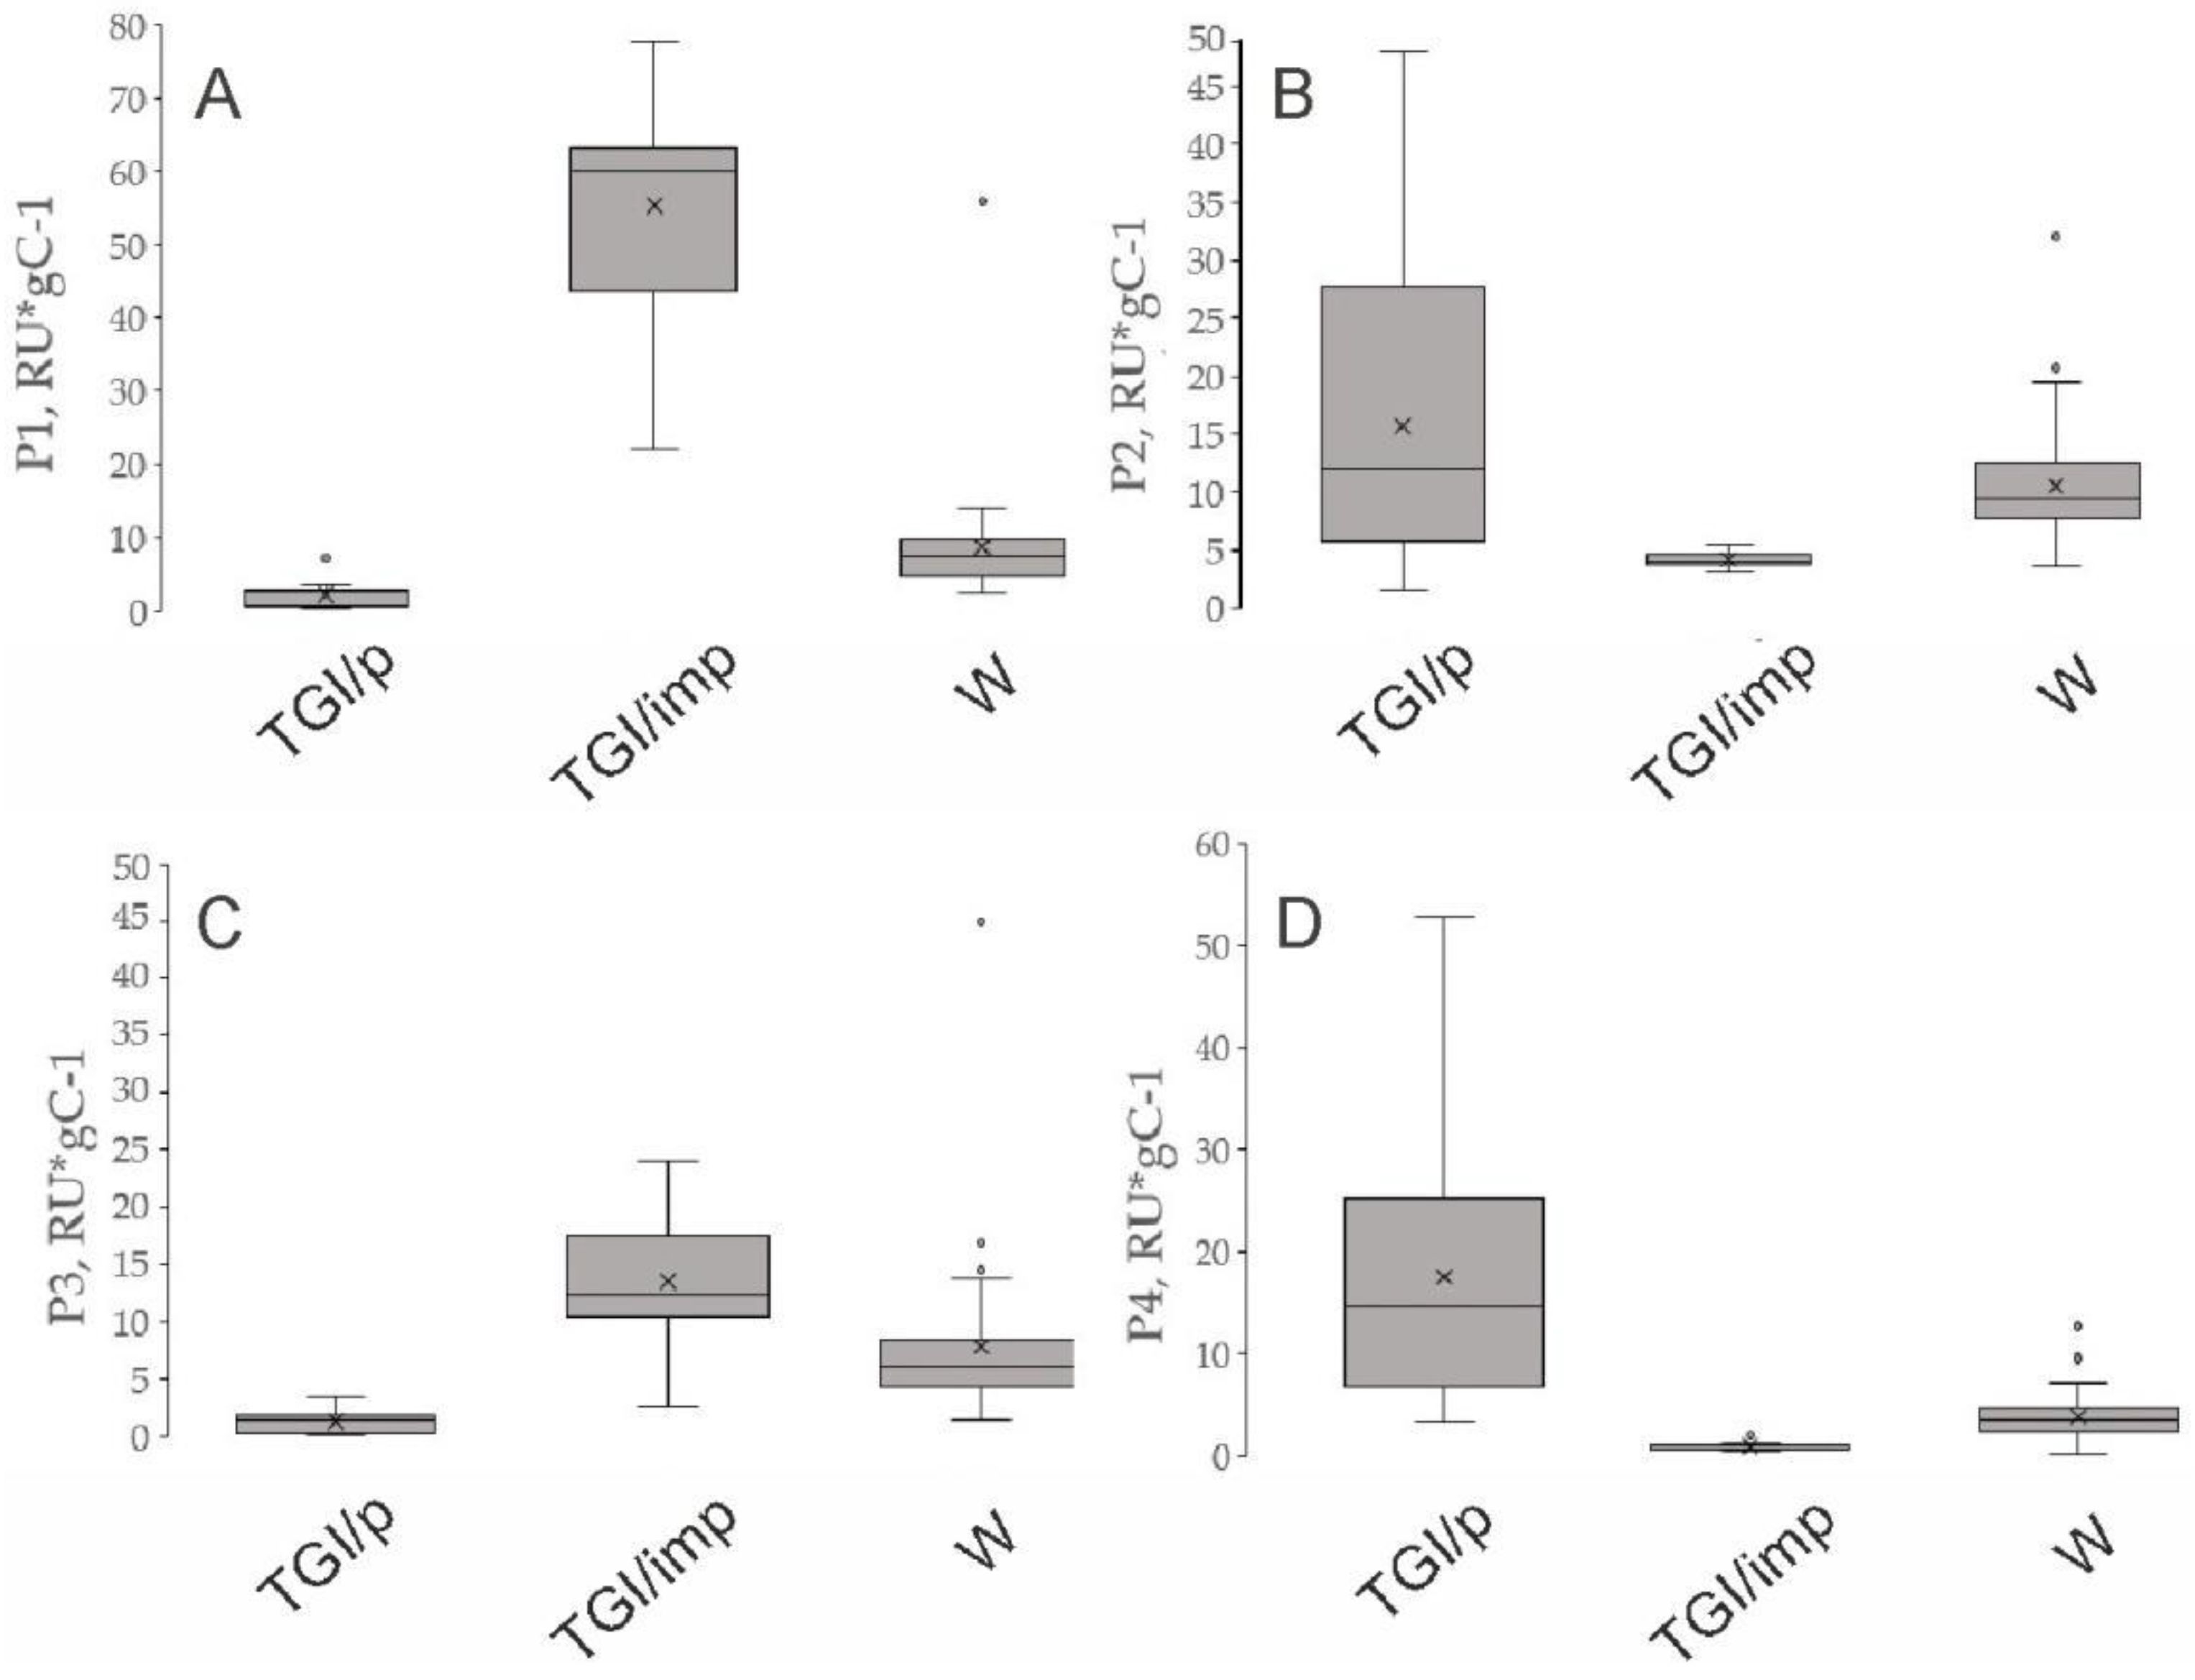
Concerning the P1 component each of the categories reveals the statistically significant variation (p<0.005) from any other as approved by the Kruskall-Wallis ANOVA test. The sequence of the decreasing P1 contents is impure TGI (TGI/imp) > Ice wedges (IW) > pure TGI (TGI/p).
The P2 component is highly variable in the TGI/p and quite homogenous in the TGI/imp samples. There is a significant difference (p<0.005) between TGI/imp and both TGI/p and IW. TGI/p and IW are not statistically distinct, however TGI/p shows higher average value than IW. The component P3 indicates the sequence of decreasing values: TGI/p > IW > TGI/imp, identical to the defined d for P2. The TGI/p samples appear to be especially enriched in protein-like DOM, represented by the P4 component. The observed order of decreasing values of P4 is TGI/p > IW > TGI/imp with all the inercategory differences statistically approved by Kruskall-Wallis ANOVA. The box plots of the CH4 and CO2 median concentrations variations in the categories of samples are shown on
Figure 7. The box-plots of the EEM PARAFAC components variation in the categories of the ground ice samples are shown on
Figure 12.
4.5. Results of principal component analysis: the variables interrelation and data classification
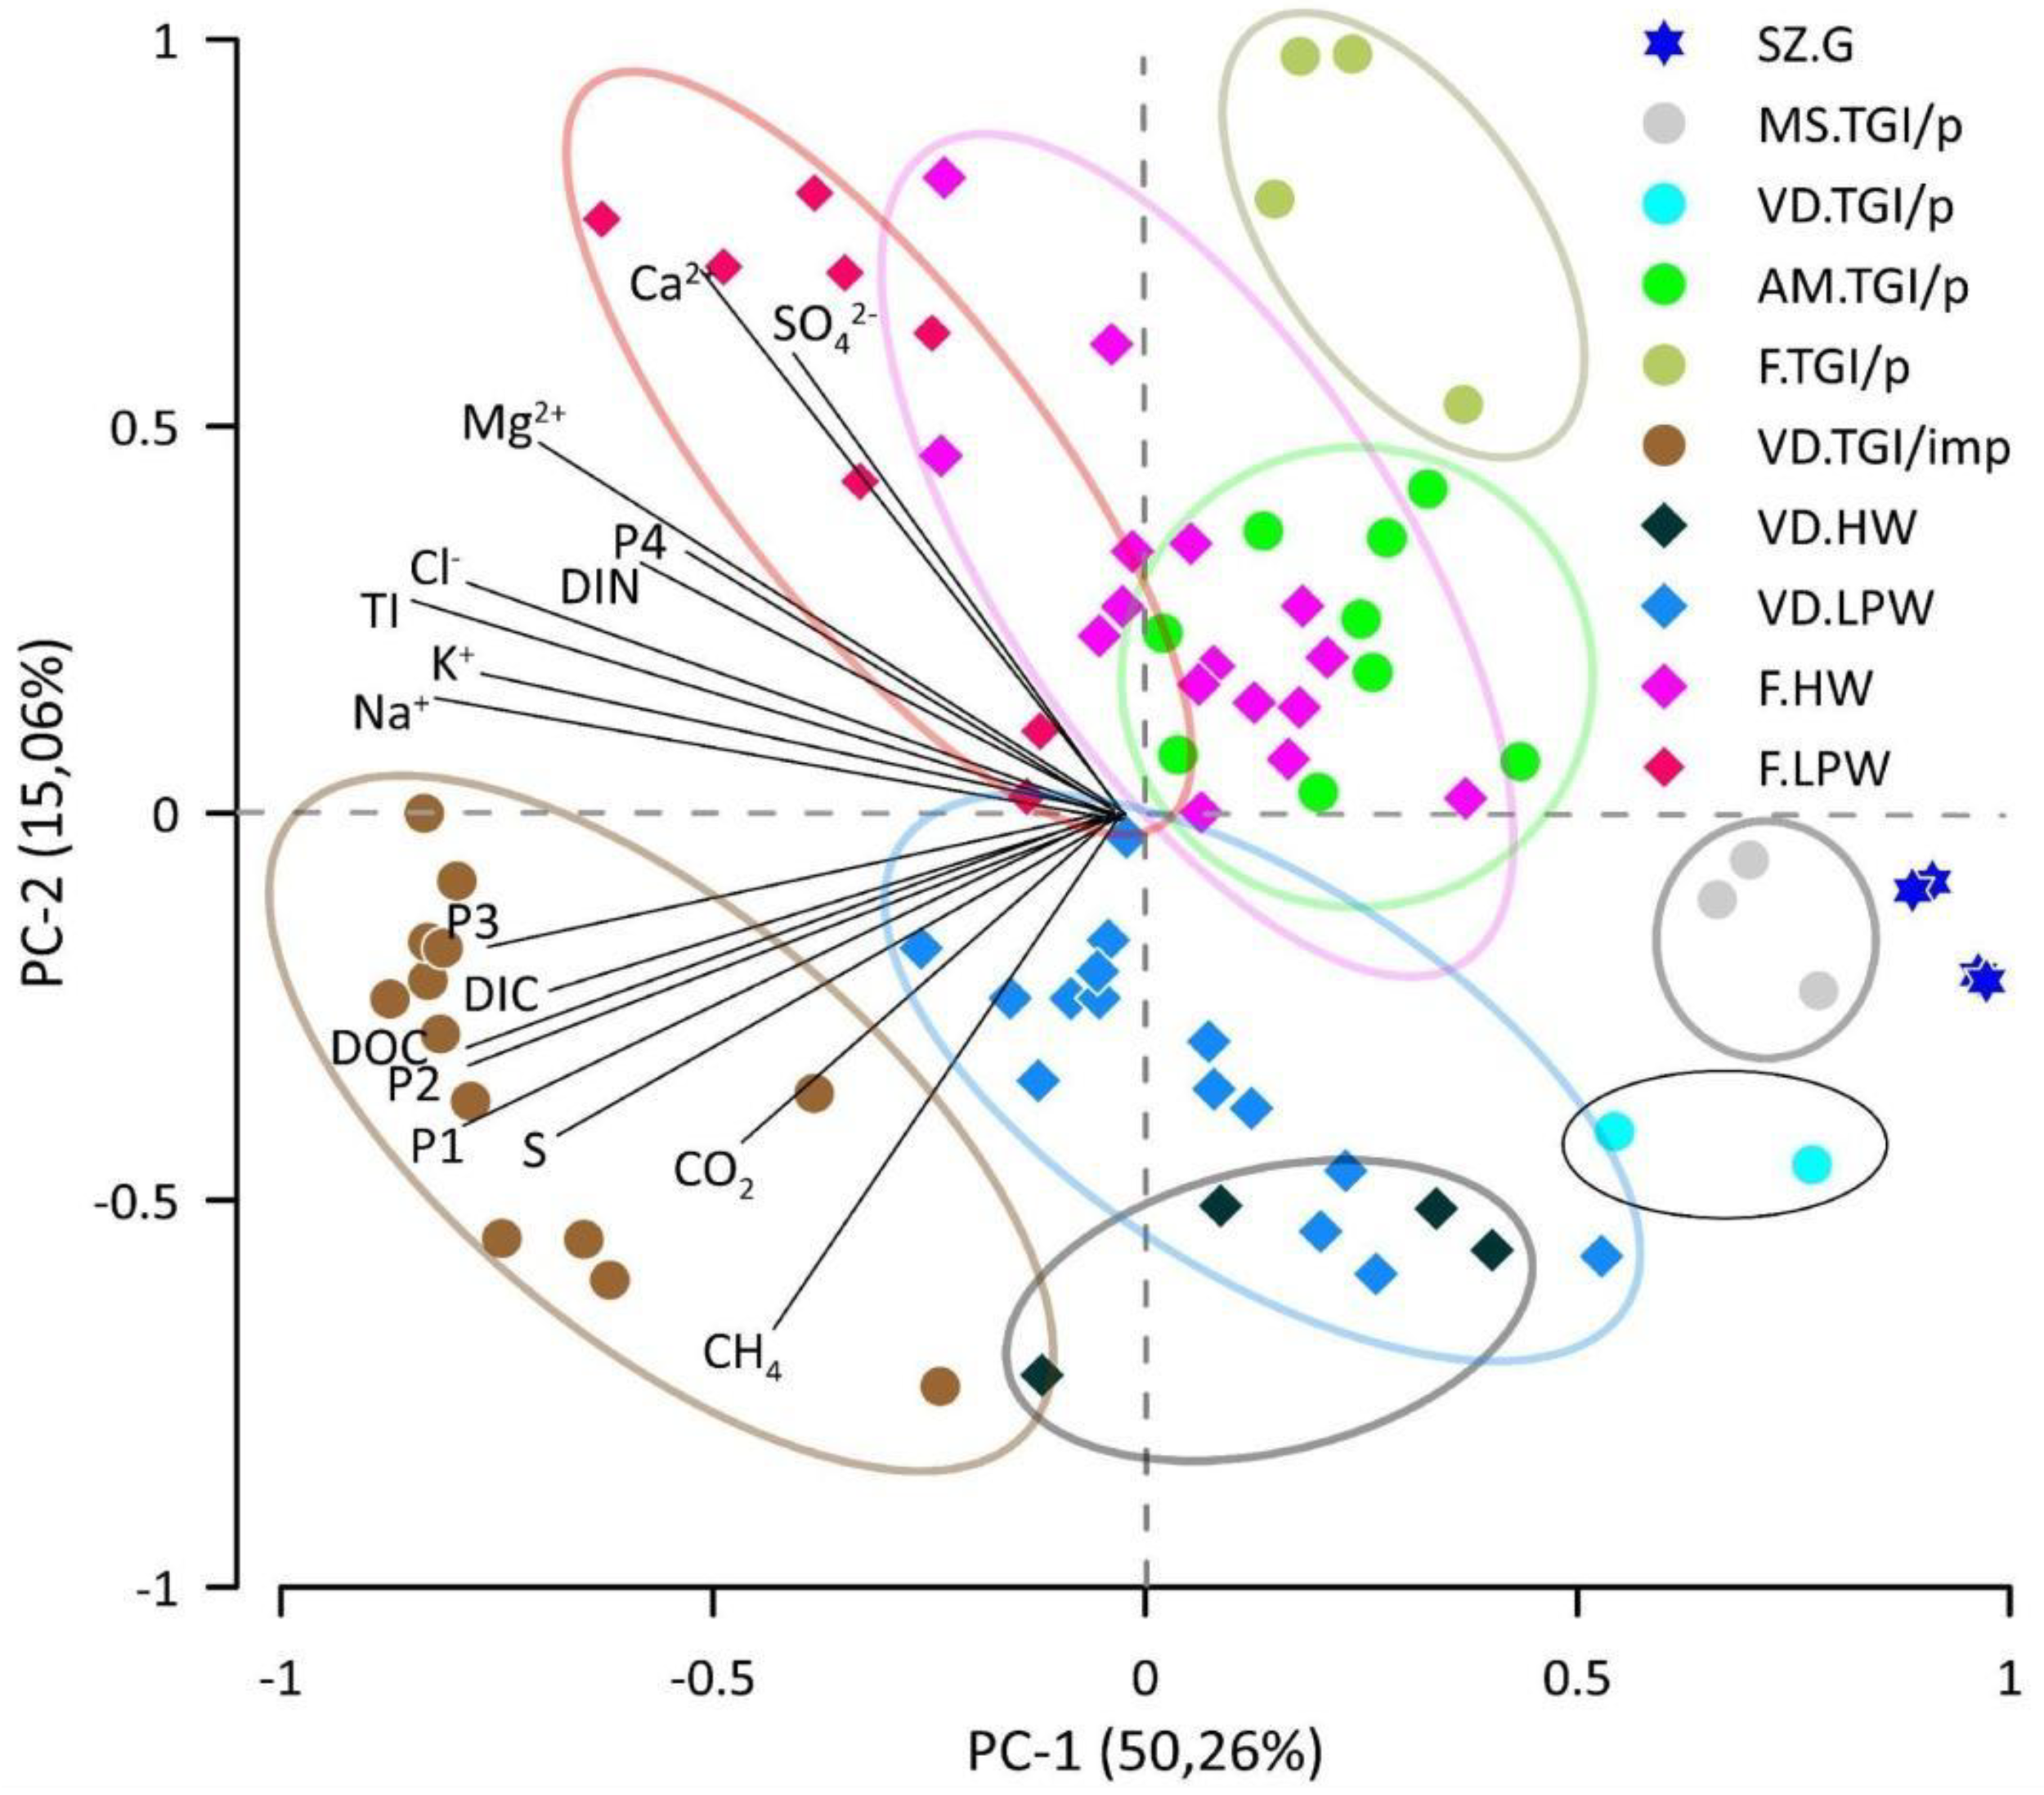
The first 2 principal components explained the 83.61% of the total variance in the dataset with 50.26% and 15.06% covered by PC1 and PC2 correspondingly. It can be seen from the PCA biplot on
Figure 13, that all the variables positively correlate to each other as detected by their similarly negative loadings in respect of PC1, ranging from -0.431 (SO42-) to -0.93 (TDS). Among the examined dissolved compounds SO42-and CH4 showed the least correlation with PC1 as indicated by loading values slightly below 0.5.
Relative to the PC2 axis the variables fall in two groups, characterized by negative and positive loadings respectively. The group of variables with negative PC2 loadings includes DIC, DOC, CO2, CH4, EEM PARAFAC components P1-P3, solid fraction . The PC2 loadings within this group vary from -0.66 (CH4) to -0.16 (EEM PARAFAC component P3). We denote this group of variables as “carbon-dominated”, because it contains all the bulk carbon cycle parameters examined in this work. The group of positive PC2 loadings includes Na+, Cl-, SO42-, TDS, FI, EEM PARAFAC component P4, K+, DIN+, Ca2+, Mg2+. The PC2 loadings within this group are ranging from 0.14 (Na+) to 0.69 (Ca2+). We denote this group of variables as “salt-dominated”, because it contains all the ionic compounds, except for HCO3- and CO32-, summarized as DIC. Within the “salt-dominated group” we observe a more or less pronounced relation in terms of PC2 loadings between K+, Na+ and Cl- as well as between Ca2+ and SO42-. Cl- as a major ion is closely related to TDS.
The humic-like DOM components P1, P2, P3 exhibit clear correlations among themselves, as well as to DOC, and S (%). In contrast, the protein-like component P4, representing freshly-derived autochthonous DOM, expresses no correlation neither to other EEM PARAFAC components, nor to any of the bulk dissolved carbon species. However, it weakly or moderately correlates to Mg2+, DIN and FI. Generally, the protein-like component P4 is associated with a “salt-dominated” group of variables on the PCA biplot as opposed to the humic-like components P1-P3 which are closely linked to the “carbon-dominated” group.
The analyzed ice samples are widely scattered across the biplot. The glacier ice samples from Severnaya Zemlya (SZ.G), included in the sample set as reference group for ground ice are remarkable for the highest positive loadings on PC1 at moderately negative values on PC2. The pure TGI samples from Marre-sale site in the Western Yamal (MS.TGI/p) appear to be quite similar to the glacier ice by the distribution of data points indicating the highest positive loadings on PC1 among the analyzed ground ice samples.
The pure TGI sampled near Amderma, Yugorsky peninsula (AM.TGI/p) are entirely located within the positive field of PC2 loadings indicating lower values on PC1 and higher on PC2 compared to the previous group of TGI (MS.TGI/p). Ice wedges sampled from the Fadeevsky Peninsula (F.TGI/p) have a range of the PC1 loadings similar to those of AM.TGI/p. samples, but considerably higher loadings on PC2 with maximum values in all the dataset. The last distinct group of TGI combines the samples from Vaskiny Dachi site, central Yamal (VD.TGI/imp), being referred to as impure ice, containing > 5% (42.01% on the average) of the solid fraction (S,%). Those samples are most divergent from the rest of the data points and characterized by the negative ranges of loadings on both PCs. VD.TGI/imp samples show minimum values on PC1 loadings in the dataset and vast scattering along the PC2 axis. PC1 and PC2 loadings for a sufficient part of the samples in this group are likely to be negatively correlated suggesting the simultaneous drop of PC1 and growth of PC2 loading values. The single samples VD.TGI/imp 6 and VD.TGI/imp 10 are most deviant from the other samples of this group, where the first one is notable for highest loading on PC1, but the second shows the highest value on PC2. Assuming the variables eigenvectors position on the biplot, the variation within the VD.TGI/imp sample set depends mainly on parameters of the “carbon-dominated” group of variables (DIC, DOC, CO2, CH4, EEM PARAFAC components P1-P3, solid fraction content).
The Late Pleistocene IWs sampled from retrogressive thaw slump of Vaskiny Dachi site, Central Yamal (VD.LPW), are distinguished by highly variable values of PC1 loadings (from medium positive to medium negative) and exclusively negative loadings of PC2. There is likely an inverse correlation between PC1 and PC2 loading values within this group as follows from the data clouds orientation on the biplot. Quite similar distribution pattern was observed for the samples VD.TGI/imp, but within the range of higher negative loadings on PC1. Four samples of Holocene IW (VD.HW) obtained in Vaskiny Dachi site are partly mixed on the biplot with Late Pleistocene IW (VD.LPW), but likely to be distinguished by slightly lower values of PC2 loadings. The sample VD.HW 3, remarkable for enormously high (for IW) solid fraction content (7.44%) and NH4+ concentration (5.15 mg/L), is highly divergent from other samples of the group and appears on the biplot closely to impure TGI sample VD.TGI/imp 10 with highest loading on PC1 in the VD.TGI/imp group. The IWs from the Fadeevsky Peninsula represent the last two groups of IWs in the dataset, both located on the biplot within the range of positive PC2 values, unlike the Yamal IW examined above. Holocene IWs (F.HW) are mostly falling into a positive range of PC1 axis, except for the samples F.HW 5 (803-5G), F.HW 9 and F.HW 10, indicating the negative loadings on PC1 coupled to elevated (positive) loadings on PC2. All of these samples are comparably enriched in major ions, especially in SO42-, while having an average level of DOC, DIC and fluorescent DOM components The most of the Late Pleistocene IWs samples from Faddeevsky (F.LPW) are characterized by the low (high negative) loadings on PC1 and high (positive) loadings on PC2, excluding the samples F.LPW 2 and F.LPW 6, notably depleted in solid fraction content (S,%), as well as in dissolved ions. The Holocene and Late Pleistocene IWs from Faddeevsky (F.HW. and F.LPW) are well separated by the PCs loadings distribution on the biplot.
6. Conclusions
This study has revealed a high degree of variability in ground and glacier ice samples from various geographic locations when assessed through various geochemical parameters.
While material might be transported into the source water by various means, such as aerosol transport (particularly in the case of ice wedges), it appears that the interaction with solid material—such as sediments, detritus, and vegetation—is likely the overriding process in the ground ice enrichment in all the analyzed dissolved components.
Methane exhibits sporadic and contrasting distributions in the ground ice deposits, yet Yamal ground ice samples consistently show higher levels of methane compared to those from other geographical areas. Notably, methane concentrations are significantly high in both impure tabular ground ice (TGI), reaching up to 32281.65 ppmV, and Late Pleistocene ice wedges (IW), up to 14138.08 ppmV. This suggests that methane may be actively transported as bubbles or in solution from the surrounding sediments into the IW source water, subsequently becoming trapped during ice formation. The putative thawing of this methane-rich ground ice deposits should cause a detectable portion of methane as direct emission upon putative thawing.
The highest DOC concentration (up to 111 mg/L) was detected in the impure TGI from Yamal with extremely high gravimetric solid fraction content (>50%), the lower DOC content was encountered in the IW and the lowest in the pure TGI.
Excitation-Emission Matrix (EEM) Parallel Factor Analysis (PARAFAC) of Dissolved Organic Matter (DOM) allowed for the deconvolution of 4 components of fluorescent DOM (fDOM), which, as a sum, satisfactorily correlate to DOC. Terrigenous humic-like DOM, normally constituting the largest measured DOC pool, was predominant in all the analyzed ice samples except for glacier ice and pure TGI from Mare Sale (Western Yamal). The labile protein-like DOM, indicating an autochthonous source, showed no correlation to humic components and is proposed to be associated with microbial abundance in the ground ice [
40]. The DOC of pure TGI samples exhibits the highest biogeochemical quality which may be responsible for the putative amplification of permafrost OM decomposition upon thawing [
8,
11].
The geochemical variables composition allows us to discern between Late Pleistocene and Holocene ice wedges from the Faddeevsky Peninsula, as well as to differentiate the Yamal ground ice from ground ice in other locations. However, there is a convergence in the geochemical composition between the tabular ground ice of Amderma and the Late Pleistocene ice wedges of the Faddeevsky Peninsula as well as between the glacial ice samples from Bolshevik Island. These results suggest the high potential of the applied methodology for both reconstructing paleoclimate conditions of the freezing environment and data classification for carbon cycle modeling.
Author Contributions
Conceptualization, P.S. and A.P.; methodology, P.S., A.K., E.S., S.M., N.B. , A.L. and I.T.; software, W.H., P.S; writing—original draft preparation, P.S., A.P., A.K., E.S , N.B., P.G.; writing—review and editing; visualization, P.S., P.G., A.P.; supervision, I.S. and M.L. All authors have read and agreed to the published version of the manuscript.
Figure 1.
Study plots with sampling points. A - Bolshevik Island, Leningradsky glacier (4 samples - SZ.G 1-4). B - Yugorsky peninsula, Amderma (9 samples - AM.TGI/p 1-9); Yamal peninsula, Marre Sale (3 samples - MS.TGI/p 1-3), Vaskiny Dachi (34 samples - VD.TGI/imp 1-13, VD.HW 1-4, VD.TGI/p 1-2, VD.LPW 1-15). C - New Siberian Islands, Kotelny Island (28 samples - F.HW 10-16, F.TGI/p 1-4, F.LPW 1-8, F.HW 1-9).
Figure 2.
Typical examples of ground ice exposures and samples. A – tabular ground ice (TGI) and ice wedge (IW) in RTS in Central Yamal (Vaskiny Dachi); B – TGI in the coastal outcrop (Marre-Sale, Yamal); C – pure TGI sample (Marre-Sale, Yamal); D – Glacier ice (Bolshevik, Severnaya Zemlya); E – the contact of the IW and impure TGI (Vaskiny Dachi, Yamal); F – TGI sample (Vaskiny Dachi, Yamal); G – Holocene IW (Faddeevsky, New Siberian Islands); H – Holocene IW sample (Faddeevsky, New Siberian Islands).
Figure 3.
Box-plot of the solid fraction content, S (A) and total ion content TI (B) in the ground ice samples categories (TGI/p, TGI/imp and W).
Figure 3.
Box-plot of the solid fraction content, S (A) and total ion content TI (B) in the ground ice samples categories (TGI/p, TGI/imp and W).
Figure 4.
Box-plot of the solid fraction content (S,%) in the groups of the ground ice samples.
Figure 4.
Box-plot of the solid fraction content (S,%) in the groups of the ground ice samples.
Figure 5.
Box-plots of bulk biogeochemical parameters distribution: DOC (A) , DIC (B) , DIN (C) in the ground sample categories.
Figure 5.
Box-plots of bulk biogeochemical parameters distribution: DOC (A) , DIC (B) , DIN (C) in the ground sample categories.
Figure 6.
Box - plots of DOC distribution in the individual groups of the ground ice samples: A - all the groups of ground ice samples, B - the groups of the samples, excluding the anomalous values (VD.TGI/imp).
Figure 6.
Box - plots of DOC distribution in the individual groups of the ground ice samples: A - all the groups of ground ice samples, B - the groups of the samples, excluding the anomalous values (VD.TGI/imp).
Figure 7.
Distribution of carbon-bearing gases: CH4 (A) and CO2 (B) in the categories of the ground ice samples.
Figure 7.
Distribution of carbon-bearing gases: CH4 (A) and CO2 (B) in the categories of the ground ice samples.
Figure 8.
Distribution of methane (CH4) in the groups of the ground ice samples. A - all the groups of ground ice samples, B - the groups of the samples, excluding the anomalous values (VD.TGI/imp, VD.LPW).
Figure 8.
Distribution of methane (CH4) in the groups of the ground ice samples. A - all the groups of ground ice samples, B - the groups of the samples, excluding the anomalous values (VD.TGI/imp, VD.LPW).
Figure 9.
Representative EEM PARAFAC fluorograms of the various samples (pure TGI, obtained through random initialization of the 4 components PARAFAC model. a - pure TGI (AM.TGI/p 7); b - Late Pleistocene IW (VD.LPW); c - impure TGI (VD.TGI/imp).
Figure 9.
Representative EEM PARAFAC fluorograms of the various samples (pure TGI, obtained through random initialization of the 4 components PARAFAC model. a - pure TGI (AM.TGI/p 7); b - Late Pleistocene IW (VD.LPW); c - impure TGI (VD.TGI/imp).
Figure 10.
Relative abundance of the EEM PARAFAC compounds in various groups of the ice samples.
Figure 10.
Relative abundance of the EEM PARAFAC compounds in various groups of the ice samples.
Figure 11.
Linear regression of the fluorescent DOM (fDOM) content (as sum of all PARAFAC components) and DOC concentration. A - all the groups of ground ice samples, B - the groups of the samples, excluding the anomalous VD.TGI/imp.
Figure 11.
Linear regression of the fluorescent DOM (fDOM) content (as sum of all PARAFAC components) and DOC concentration. A - all the groups of ground ice samples, B - the groups of the samples, excluding the anomalous VD.TGI/imp.
Figure 12.
Box-plots of DOC-normalized values of the EEM-PARAFAC components, P1 (A), P2 (B), P3 (C), P4 (D).
Figure 12.
Box-plots of DOC-normalized values of the EEM-PARAFAC components, P1 (A), P2 (B), P3 (C), P4 (D).
Figure 13.
Biplot for the first two principal components, resulting the PCA analysis of the ground ice dataset. The ovals outline the data clouds of corresponding groups of the samples.
Figure 13.
Biplot for the first two principal components, resulting the PCA analysis of the ground ice dataset. The ovals outline the data clouds of corresponding groups of the samples.
Figure 14.
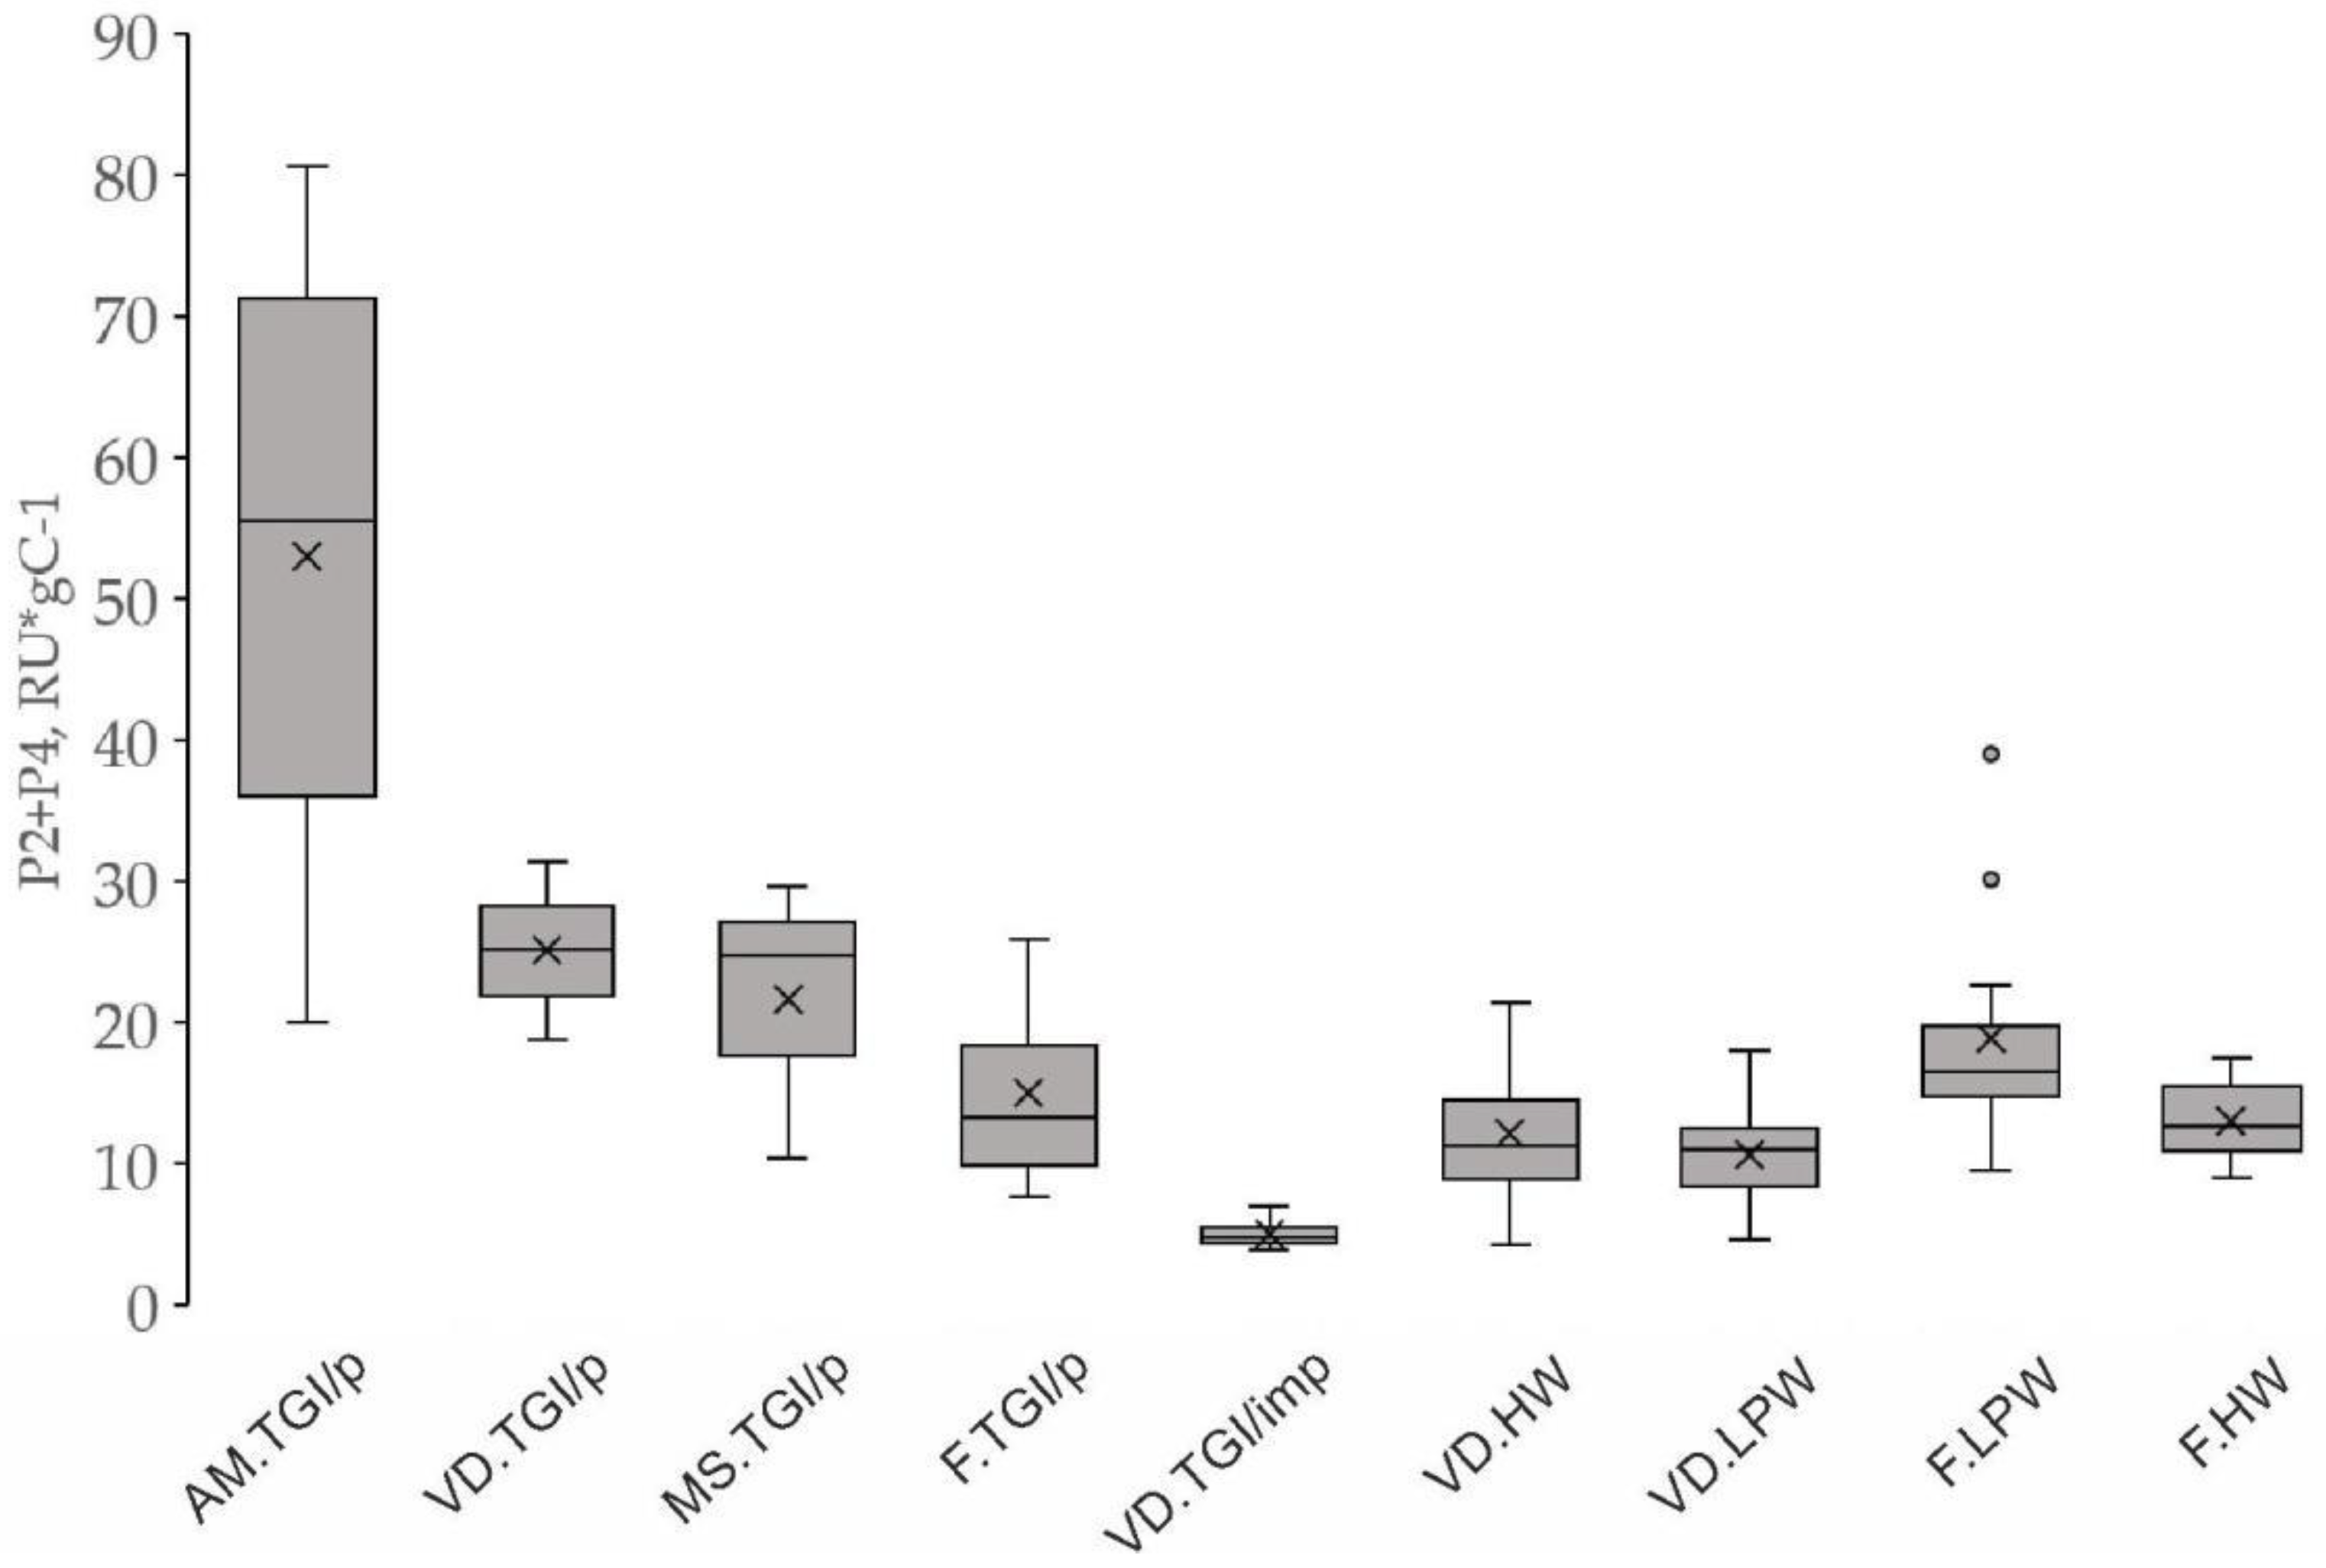
Boxplot of the biolabile fluorescent DOM (as sum of the components P2 and P4).
Figure 14.
Boxplot of the biolabile fluorescent DOM (as sum of the components P2 and P4).
Table 1.
Sampling points and dataset design.
Table 1.
Sampling points and dataset design.
| Region |
Location |
Type of Ice |
Age of Ice Wedges |
Solid fraction content |
Group of samples |
| Yugorsky Peninsula |
Amderma
69°44′53″N
61°47′17″E |
TGI |
|
pure |
AM.TGI/p 1 — 9 |
| Yamal Peninsula |
Vaskiny dachi
70°16′03″N
68°55′22″E |
TGI |
|
pure |
VD.TGI/p 1 — 2 |
| TGI |
|
impure |
VD.TGI/imp 1 — 13 |
| IW |
Late-Pleistocene |
|
VD.LPW 1 — 15 |
| IW |
Holocene |
|
VD.HW 1 — 4 |
Marre-Sale
69°42′14″N
66°48′30″E |
TGI |
|
pure |
MS.TGI/p 1 — 3 |
| New Siberian Islands |
Faddeevsky,
Kotelny Island
75°46′23″N
144°8′18″E |
TGI |
|
pure |
F.TGI/p 1 — 5 |
75°50′10″N
142°47′37″E |
IW |
Late-Pleistocene |
|
F.LPW 1 — 8 |
75°31′03″N
145°20′49″E |
IW |
Holocene |
|
F.HW 1 — 16 |
| Severnaya Zemlya |
Leningradsky glacier, Bolshevik
78°24′42″N
103°17′54″E |
Glacier |
|
|
SZ.G1 |
78°37′44″N
104°4′36″E |
|
|
SZ.G2 |
78°36′21″N
103°45′05″E |
|
|
SZ.G3 |
78°32′39″N
104°54′60″E |
|
|
SZ.G4 |
Table 2.
Spectral characteristic of the extracted PARAFAC compounds including results of the comparison with previous studies through EEM library search (EFC software). The mTCC is a modified Tucker's congruence coefficient values [
10,
23].
Table 2.
Spectral characteristic of the extracted PARAFAC compounds including results of the comparison with previous studies through EEM library search (EFC software). The mTCC is a modified Tucker's congruence coefficient values [
10,
23].
| Component |
Emission maxima |
Excitation, max |
Description |
Comparison with previous study (library search) |
| P1 |
470 |
370 |
Humic like |
mTCC=0.97; humic-like,but not quinone-like [26] |
| P2 |
425 |
310 |
Humic like |
mTCC=0.99, terrestrial or ubiquitous humic-like components, a photoproduct or a photorefractory component [27] |
| P3 |
470 |
260 |
Humic like |
mTCC =0.97, humic-like, UV and visible, terrestrial, a bio-refractory component [28] |
| P4 |
340 |
270 |
Protein-like |
mTCC=0.90. tryptophan-like, more biodegradable [27] |
