1. Introduction
Since its rediscovery in 2004, isolation and investigation by a Manchester team (very particularly by A.K. Geim and K.S. Novoselov, see Refs. [
1,
2]) graphene is offering to physicists and chemists an ever larger and richer field where to test the body of knowledge developed by researchers during the last one hundred years. Graphene, besides the expectations regarding technological applications, is defying the community of condensed matter physicists up to limits by no means anticipated [
3]. Almost all experimental and theoretical tools developed in that period are finding a place in the flourishing field of graphene. Starting from its Dirac character at energies near the Fermi level, the novel superconductivity observed in twisted bi-layers [
3,
4] along with zero-width bands which suggests the high relevance of electron-electron interaction in defining what points to be a non-BCS superconductivity, as in high temperature superconductors.
Changes in the chemical potential and a rearrangement of the low-energy excitations at each integer filling of the Moiré flat bands are being identified. These spectroscopic features are a direct consequence of Coulomb interactions, which split the degenerate flat bands into Hubbard sub-bands. The cascade of transitions reported up to now characterizes the correlated high-temperature parent phase from which various insulating and superconducting ground-state phases emerge at low temperatures in MATBG[
5,
6]. After the discovery of these effects in twisted layered samples, experimental and theoretical efforts are being addressed to characterize the samples trying to find out how this behavior depends on filling, the number of layers and the twisting angle, the three variables that seem to be crucial. The story, however, seems to be at the beginning, as recent experimental work clearly indicates that there is no need to twist the layered sample[
3] to produce the superconductivity and other effects similar to those observed in twisted samples.
The first evidences of topological states in junctions of arm-chair graphene nanoribbons (AGNR) of different width grown on Au(111) surfaces were reported in 2018 [
7,
8]. It was also shown that these states can be described following a tight-binding model proposed by Su, Schrieffer and Heeger (SSH) [
8,
9,
10]. Combining theoretical analyses with already developed bottom-up techniques they were able to produce and characterize graphene samples with and without topological defects. Taking as unit cell the junction 7/9-AGNR, they studied various configurations ranging from an isolated 7-9 junction up to an infinite linear arrangement of 7-9 units (See
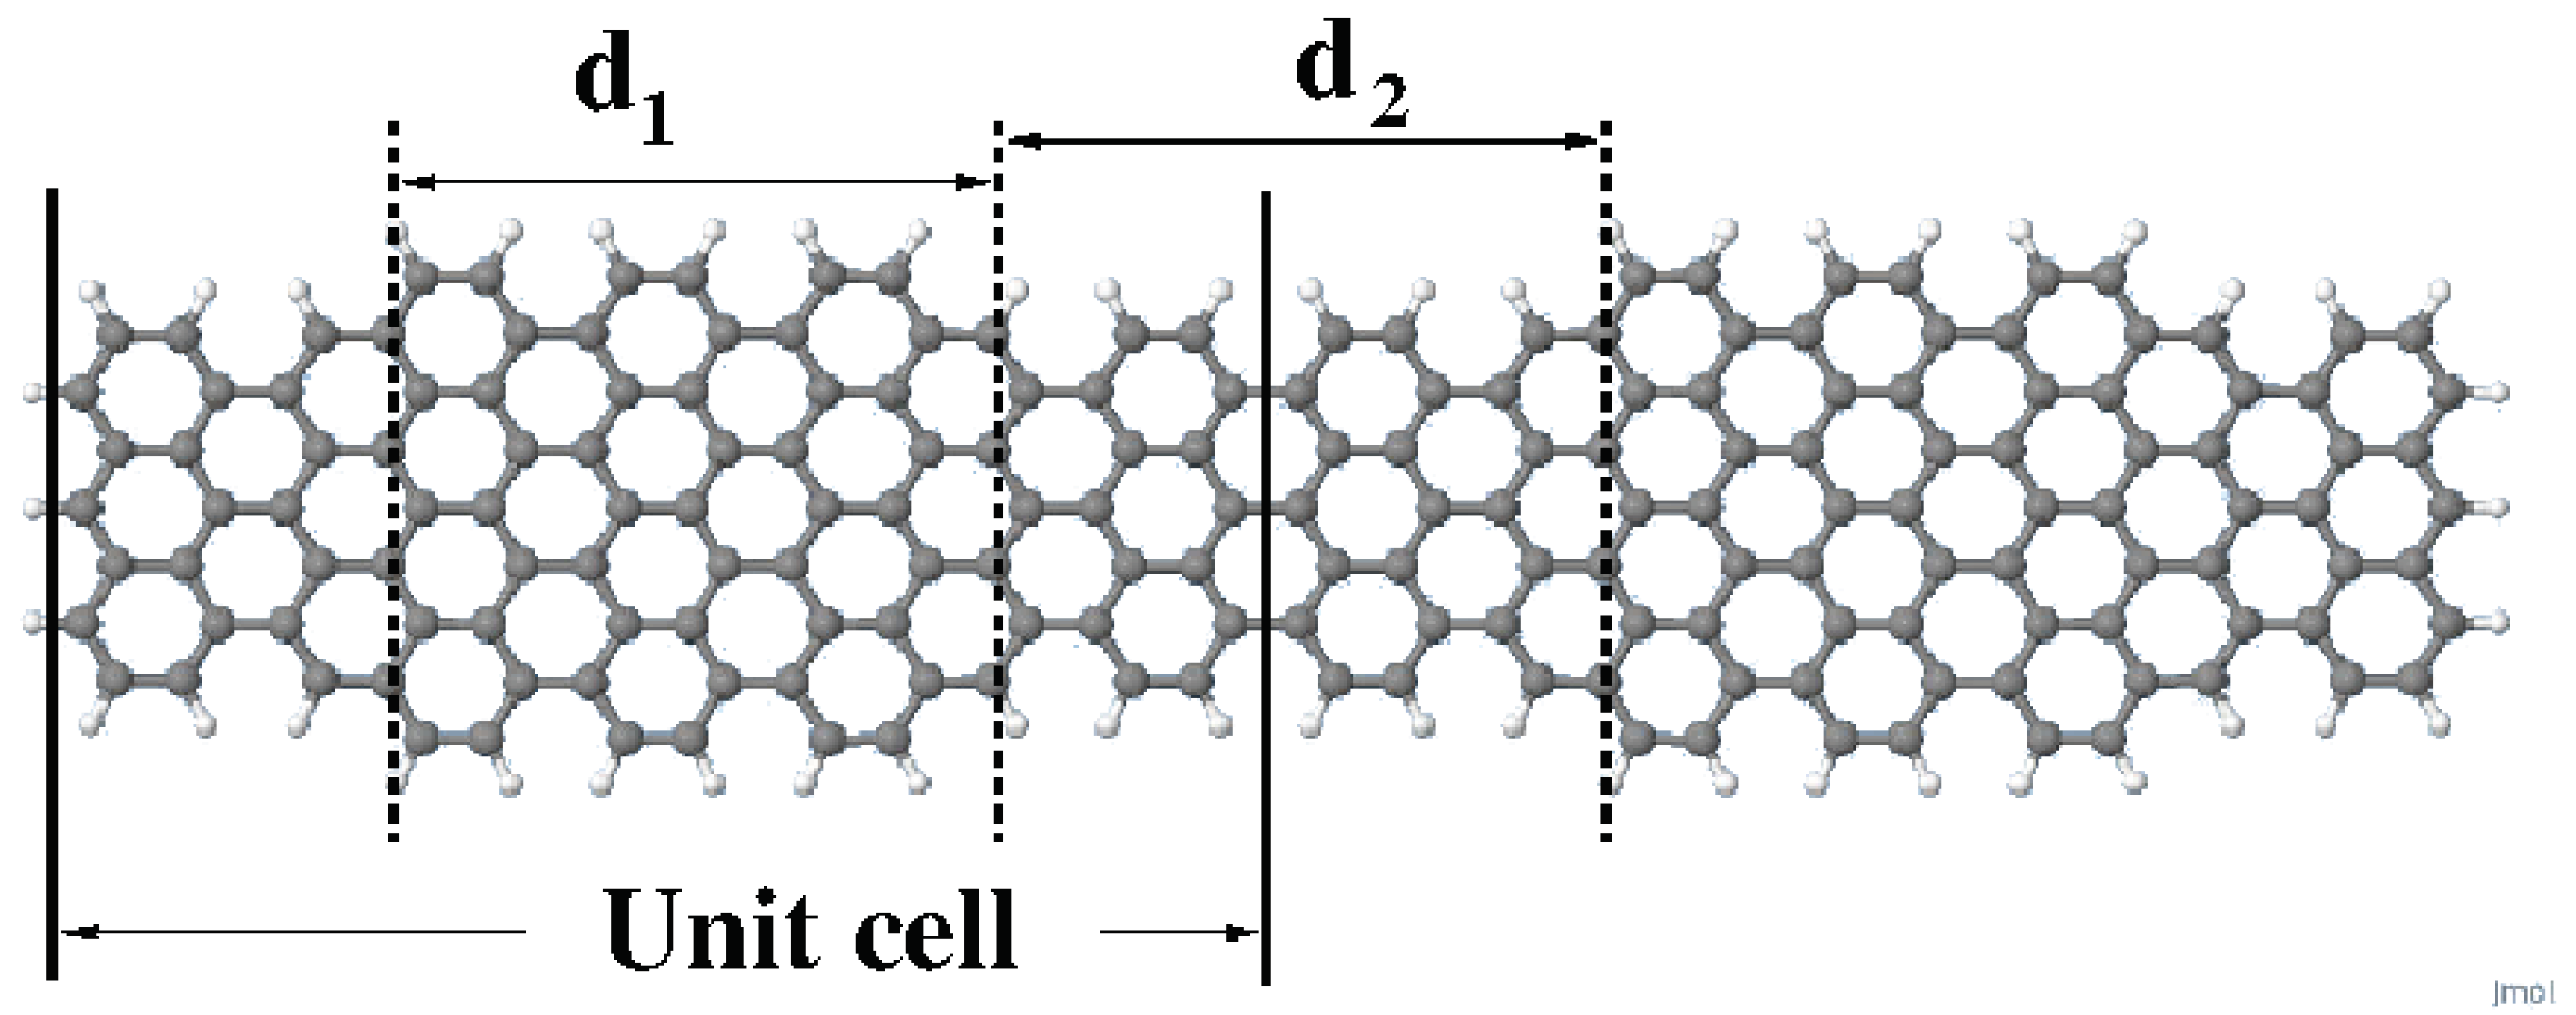
Figure 1 as an example containing four 7-9 junctions). They choose the 7-9 unit because one of the two possible ways to join the two ribbons (just the one showed in
Figure 1) hosts an electronic topological state. Analysis of the effect of interactions on these 7/9-AGNR superlattices deposited on Au(111) surfaces was also done in the context of Hu model [
11].
In this work, we focus on the effects of long-range electronic interactions on the coupling between topological states raised on free standing 7/9-AGNRs superlattices. More concretely, we consider finite 7/9-AGNR superlattices (as the own shown in
Figure 1) that are known to show topological defects at each 7-9 interface. Extensive calculations of the electronic structure of 7/9-AGNR superlattices with up to eight unit cells using PPP[
12,
13], Hu[
14] (specifically, just to check the local limit of previous model) and B3LYP DFT[
15,
16,
17,
18] schemes have been undertaken. From the comparison of calculated density of states (DOS) around the Fermi level, the need of improving the long-range interactions of the approximate PPP model Hamiltonian arises. We have been able to propose a model of topological first-neighbors interacting states that correctly describes the DOS in the neighborhood of the Fermi level. Using this simplified model, the electronic structure of much larger systems can be precisely obtained.
2. Computational Methods
The Hamiltonians we shall use are the B3LYP
ab initio DFT and the Pariser, Parr and Pople (PPP). Both, spreadly used methods, incorporate short and long-range electron-electron interaction and were handled within the restricted or unrestricted approximations that have been intensively applied to investigate the electronic structure of polycyclic aromatic hydrocarbon (PAH) [
19].
DFT calculations were carried out using the B3LYP exchange-correlation functional[
15,
16,
17,
18] and the basis set 6-31G*[
20,
21], using the Gaussian-16 computational package[
22]. All geometries have been optimized at B3LYP/6-31G* level. In order to obtain the polarized solutions, we work with the unrestricted approximation of both methods. The densities of states (DOS) were calculated by adding to the energy an imaginary part of 0.05 eV, independent of size, energy or whatever. They were obtained either by means of Green functions (PPP) or with Gaussian-16 and with the help of GausSum[
23] and Multiwfn[
24] programs. The PPP model Hamiltonian contains, besides the standard kinetic energy, both local on-site and long-range Coulomb interactions and a single
orbital per carbon atom. The non-interacting term incorporates two standard parameters, the orbital energy
and the hopping between nearest neighbor pairs
, namely,
where the operator
creates an electron at site
i with spin
,
N is the number of orbitals and
is the hopping between nearest neighbor pairs
.
In cases where the distance
between nearest neighbors pairs significantly deviates from standard value,
Å, due, for instance, to defects or impurities, the hopping parameter may be scaled using the following scaling law adequate for
orbital [
25] namely,
As regards the values of the model parameters we use the well-tested set reported in Ref. [
26].
Within the Hartree-Fock approximation (HF), the interacting term of the PPP Hamiltonian is approximated by:
Here and is the occupation number in the site i with spin . The first line of this equation is the HF version of the Hubbard Hamiltonian (Hu), which only retains local interactions. It is interesting to note the presence of non-diagonal terms in the third parenthesis of the last equation. These terms introduce frustration in non-frustrated lattices. This is surely the reason why the staggered polarization in the polarized configuration is always smaller in the PPP than in the Hu model.
In incorporating the interaction
in the PPP model, one may choose the unscreened Coulomb interaction [
27] although it is a common practice the use of interpolating formulae. In the case of PAHs, that proposed by Ohno [
28] has wide acceptance. We use that formula, modified to incorporate a parameter
that allows to control the extent of the long-range interactions. When
the unscreened Coulomb interaction is recovered:
where
eV,
is the distance between
i and
j atoms, in Angstroms and
e is the electron charge. The parameter
will be fixed in order to better reproduce
ab initio DFT results with the PPP model.
Supercells containing 2, 4, 6 and 8 unit cells were in most cases used to illustrate our findings (see
Figure 1 for a schematic representation of the unit cell). Other geometries were occasionally used to reinforce a given argument. Geometries were optimized for non-polarized wavefunctions at the B3LYP/6-31G* level. Optimized geometries do not differ much from the bulk geometry of graphene and very slightly depend on number of cells considered as can be seen in
Table 1, where d
and d
are the lengths of the ribbons having widths 7 and 9, respectively.
3. Results and Discussion
3.1. Checking Computational Approach
To guarantee the robustness of our results four combinations of exchange-correlation functional/basis sets were investigated. Specifically, an alternative PBEPBE[
29] functional and an extended 6-311G*[
30] basis set were considered. Results are shown in
Table 2.
In the context of the present work the most interesting property is the forbidden gap. The results for four combinations of functional/basis set are all within the range 0.344-0.440 eV. We guess that other sources of errors are more important than this difference. Therefore, from this point on, DFT calculations carried out in this work have been done with the B3LYP/6-31G* choice. The relevance of solutions with global polarization (total
greater than 0) versus those with
, as well as the variation of the gap when the 7/9 interfaces are formed or not, has been analyzed for the case of two unit cells and their equivalents without interfaces (7/7 and 9/9). Hereafter we called ’ polarized ’ the solutions with
and non-polarized the solutions with
.
Table 3 summarizes our results.
It is clear that our calculations indicate that polarized solutions are more stable (see
Table 3) but the difference in stability with the non-polarized solutions is much smaller when topological defects (7/9 interfaces) are present. This suggests that topological defects tend to stabilize this solutions even at DFT level. Also, polarized solutions in general exhibit larger gaps due to an overestimation of exchange in the mean field solutions. Therefore, hereafter as the number of cells increases we shall focus on non-polarized DFT solutions, which also could exhibit local polarization greater than 0 [
31]. Likewise, the defect-free solutions with
show a much larger gap than solutions for 7/9-AGNR system, and while the
of the 7/7 and 9/9 hardly show any gap, the
for 7/9-AGNR shows a moderate gap (see
Table 3). However we will show below that this gap closes when the size is increased.
3.2. Characterizing Edge and Topological States
In order to study the effect of topological states raising up in the frontiers of 7/9-AGNR superlattices we calculate the partial density of states (PDOS) in the vicinity of the Fermi level spatially discriminating the unit cells of the sample. Summing up all these PDOS gives the total DOS of the system.
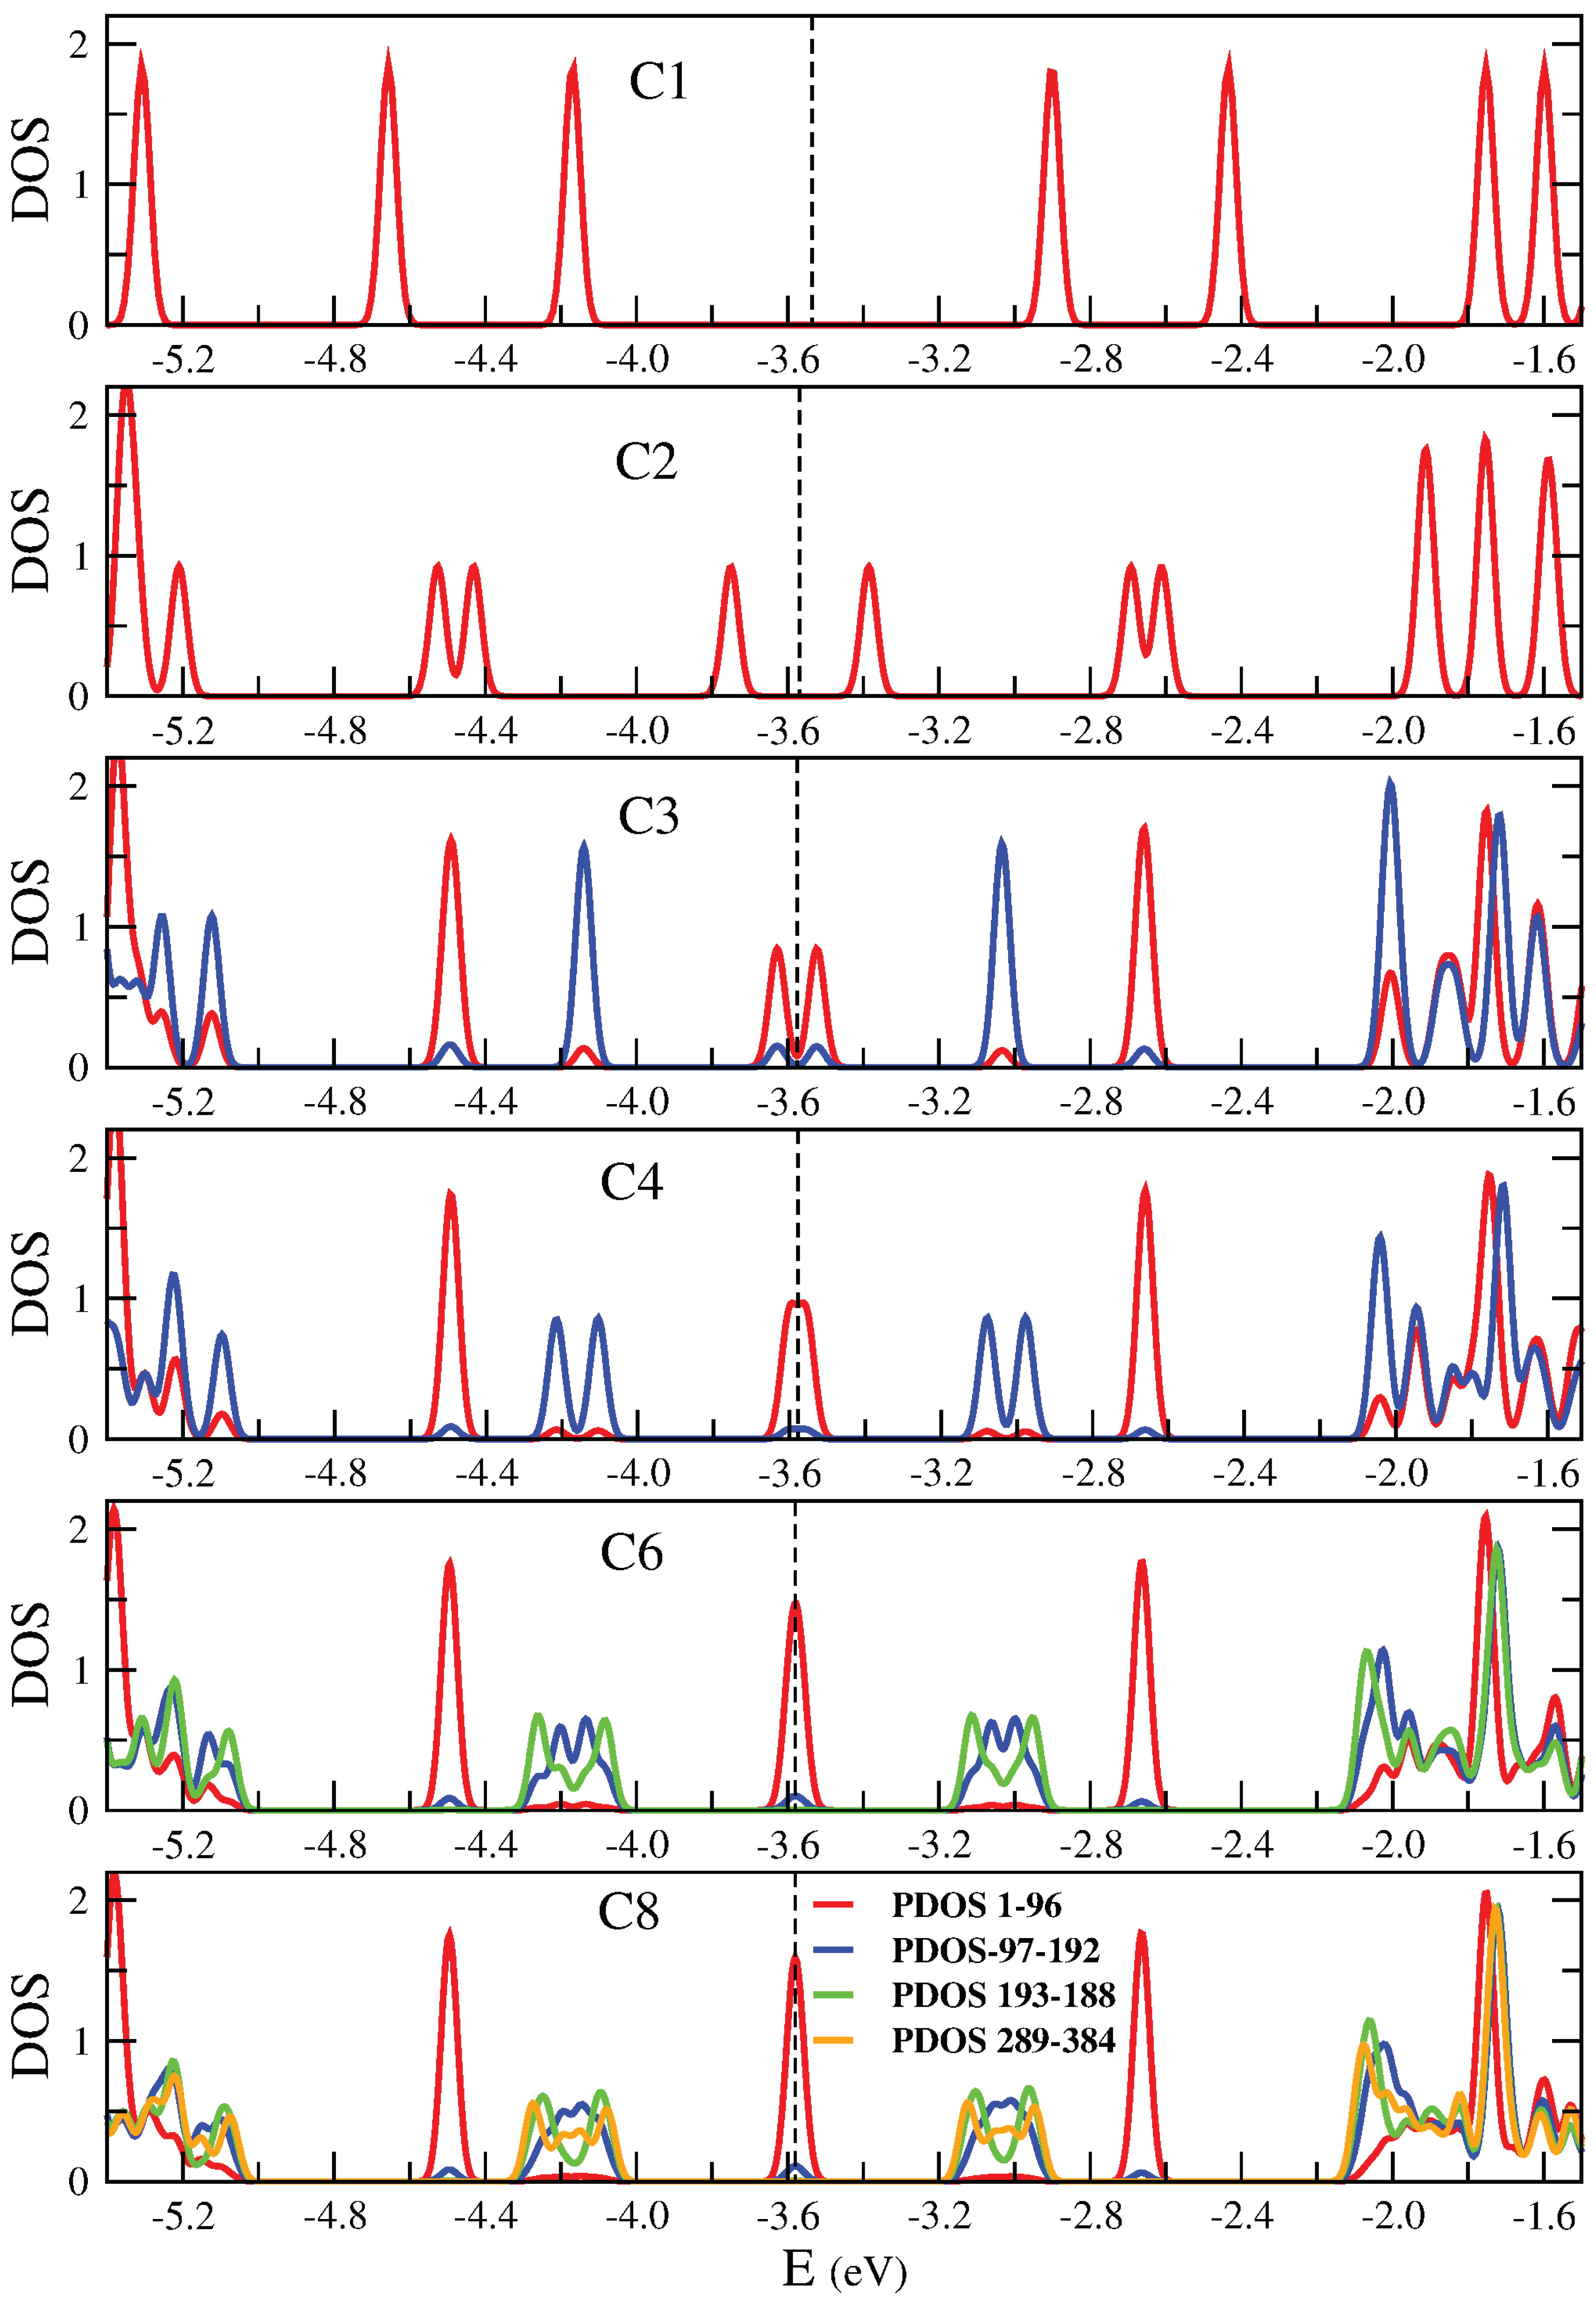
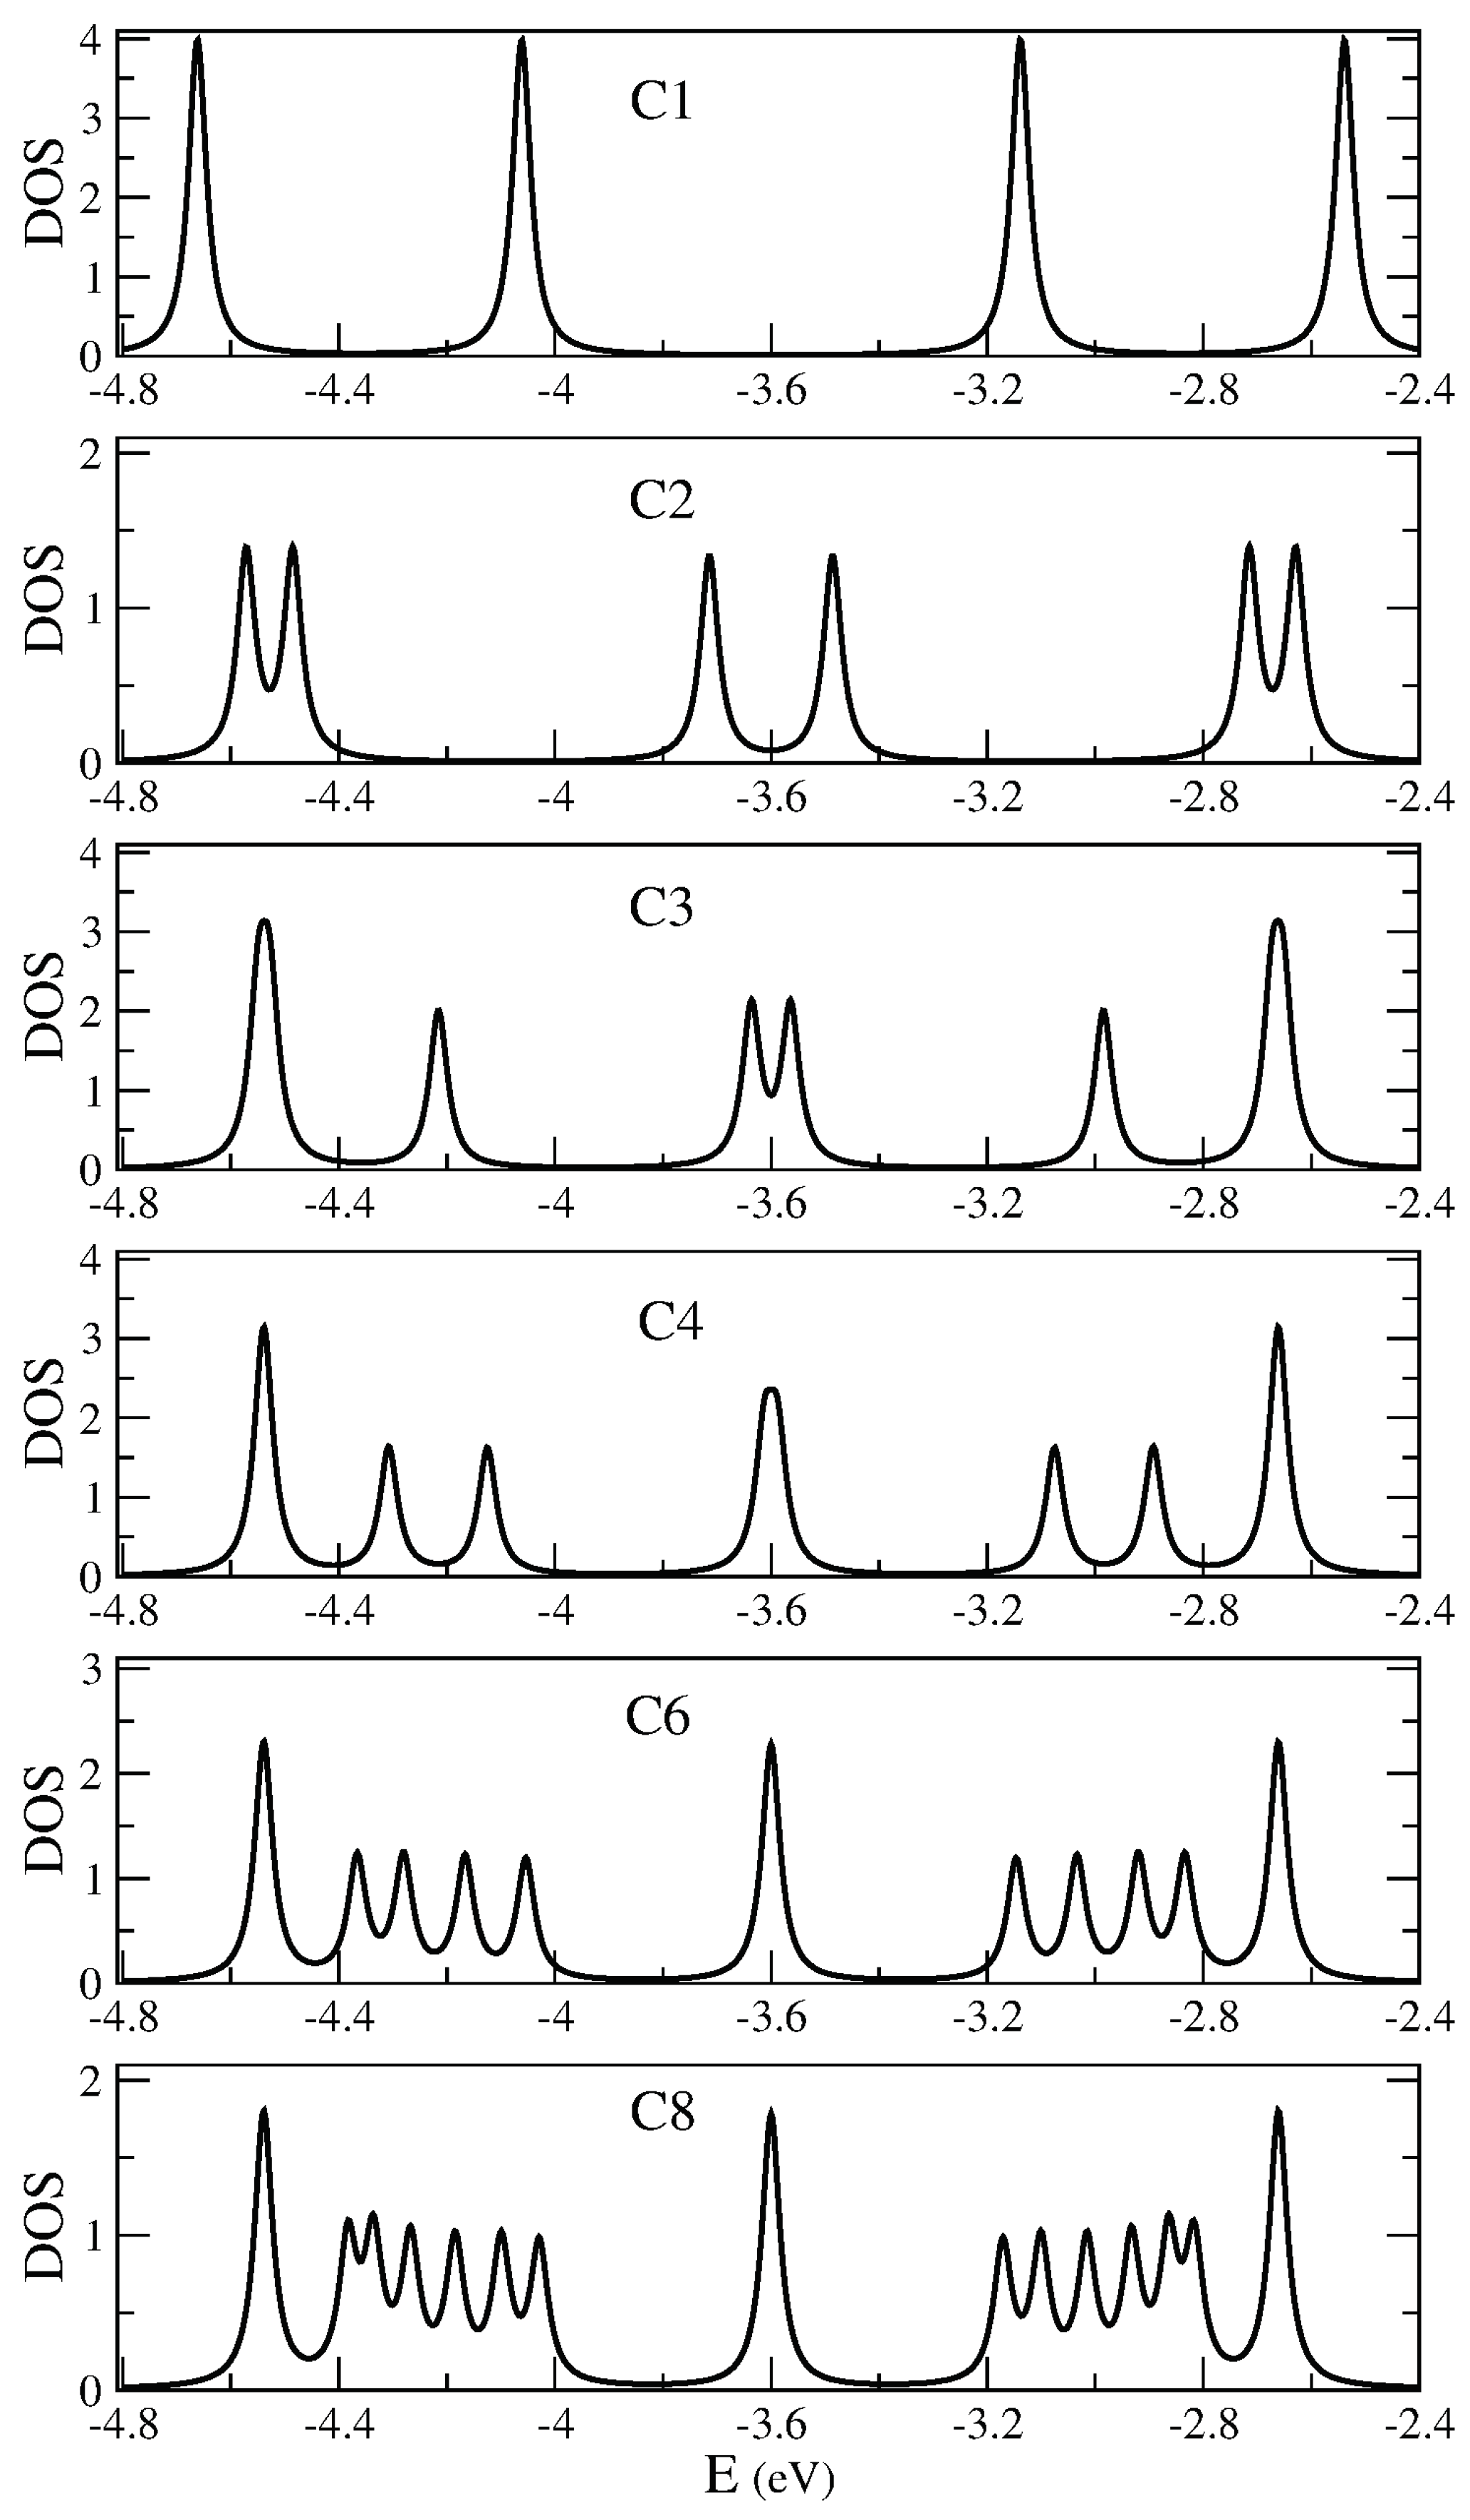
Figure 2 shows PDOS for superstructures C1 to C8. Note that C1, the unit cell, includes 96 atoms. Partial densities of states for different C’s were obtained by adding up local density of states corresponding to each unit cell (a layer with 96 atoms) and its symmetrical relative to the center of the sample. Therefore red curves in
Figure 2 gives the PDOS for the first cell in the sample and its symmetrical (the last unit cell). Blue curves gives the PDOS for the second cell and its symmetrical. Green curves for the third cell and its symmetrical and orange curve for the fourth cell and its symmetrical.
The picture raising after this study is that we have three localized states corresponding to topological edge states, one just at, one below and one above the Fermi level (red lines in the figure), which would be model as a three initially degenerated level system at Fermi level with an effective coupling between them that breaks the degeneracy. In addition we have two broader bands, below and above the Fermi level, corresponding to topological bulk states. No gap is present for the larger systems.
It is worth discussing in detail how the DOS around the Fermi level evolves with size. For this purpose, we will use a tight-binding model consisting of localized states around 7/9 frontiers (topological states) plus one more localized state at each of the system ends.The existence of localized states at the end of some GNR segments and at the junction between two GNRs was already proposed based on a topological analysis [
31,
32]. We start with the smallest superstructure C1. Although it is special case because the ends of the system are relatively close to each other, it is useful to describe it within the kind of ideas that will later be used to analyze larger sizes. A unit cell contains two 7/9 frontiers and two edges. There are four states, two coming from the edge states, and two from states localized at the frontiers, which split by interactions amongst them due to the long-range term of the Coulomb interaction, raising the four peaks seeing in the first panel of
Figure 2. Two peaks correspond to states that are localized at edges (at Fermi level
eV) and two more that are localized around the 7/9 interfaces and appear closer to the Fermi level.
Going back to the results of
Figure 2, we apply the same scheme to analyze C2. This superstructure contains two unit cells, each one with two topological states, and each one now brings only one edge state. So we have six states that split into pairs below and above the Fermi level. The pair of peaks far away the Fermi level correspond to states more localized at edges of the sample so we call them edge states. Next there are two pairs of peaks, the first corresponding to states more localized at the first 7/9 frontier and the pair of states closer to the Fermi level correspond to states localized around the two more internal frontiers of C2. The structure of peaks (red peaks in all panels) that raises from it will stay for larger samples. In larger samples it represent the DOS corresponding to the edge units of the sample. But the edge units will become less interacting as the sample becomes more larger, then the peaks associated with its evolve to a three peaks structure, doubly degenerated, one at the Fermi level and two additional peaks, one below and another above it, like two isolated three sites open chain. We suggest that these peaks correspond to topological edge states. From C3 to C8 the peak feature around
and
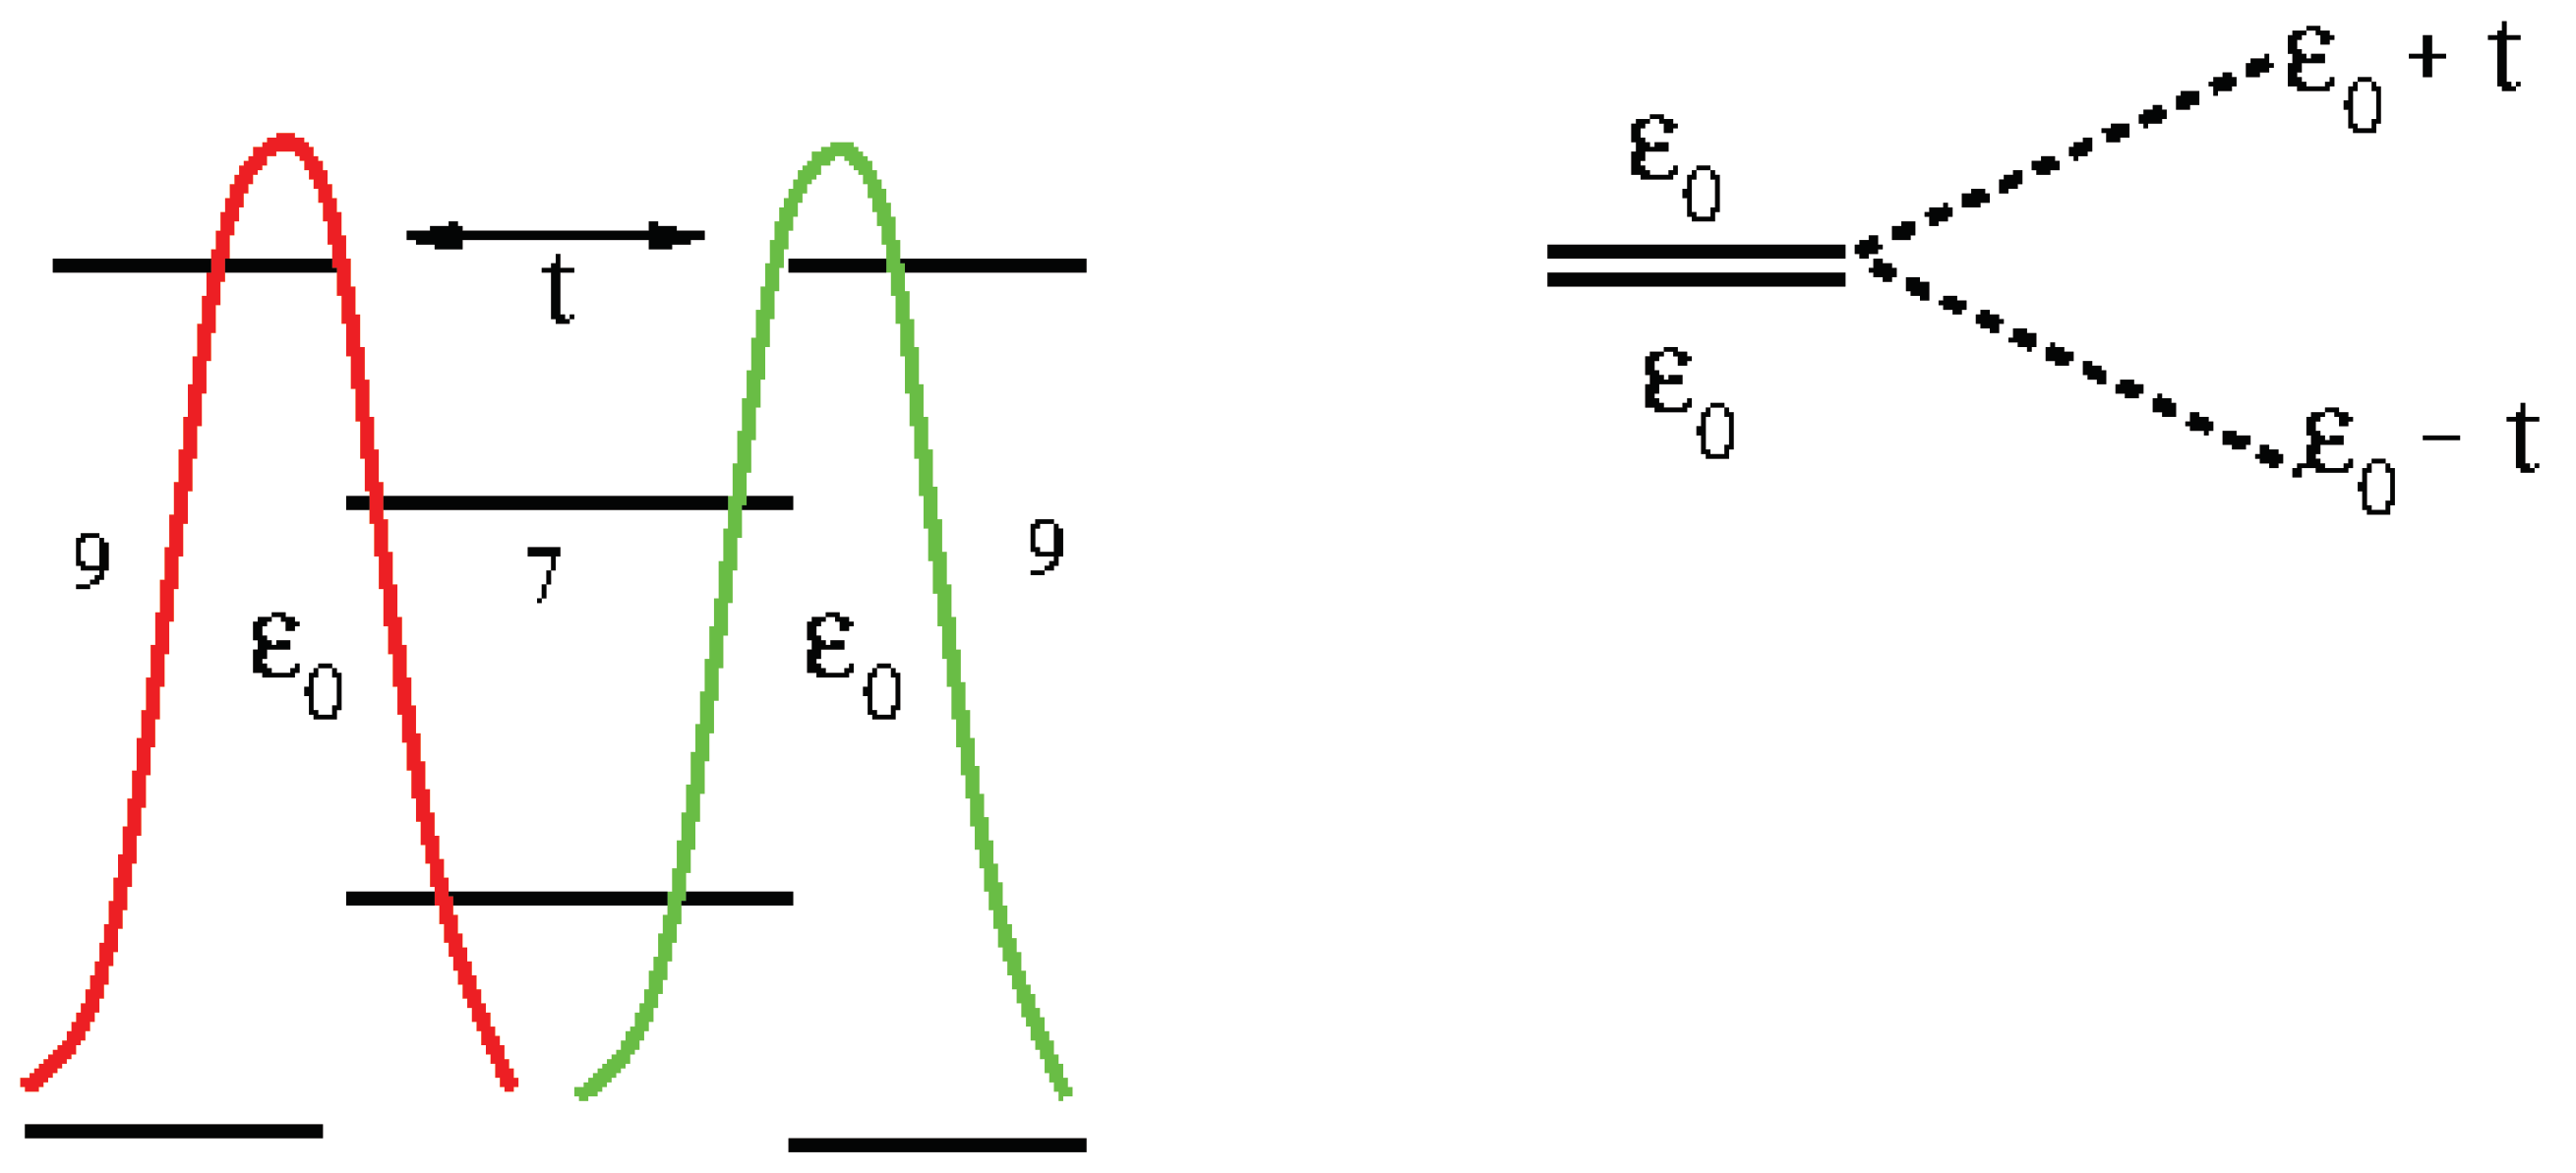
eV can be separated in pieces by the location of the states in the sample, following the same ideas. For C3 we have three unit cells. Therefore we will see two edge units, that provide the red peaks. In addition we have two topological states in the central unit, which gives the blue peaks. These two states are split by interactions between them and with edge units. We call these states topological bulk states (See
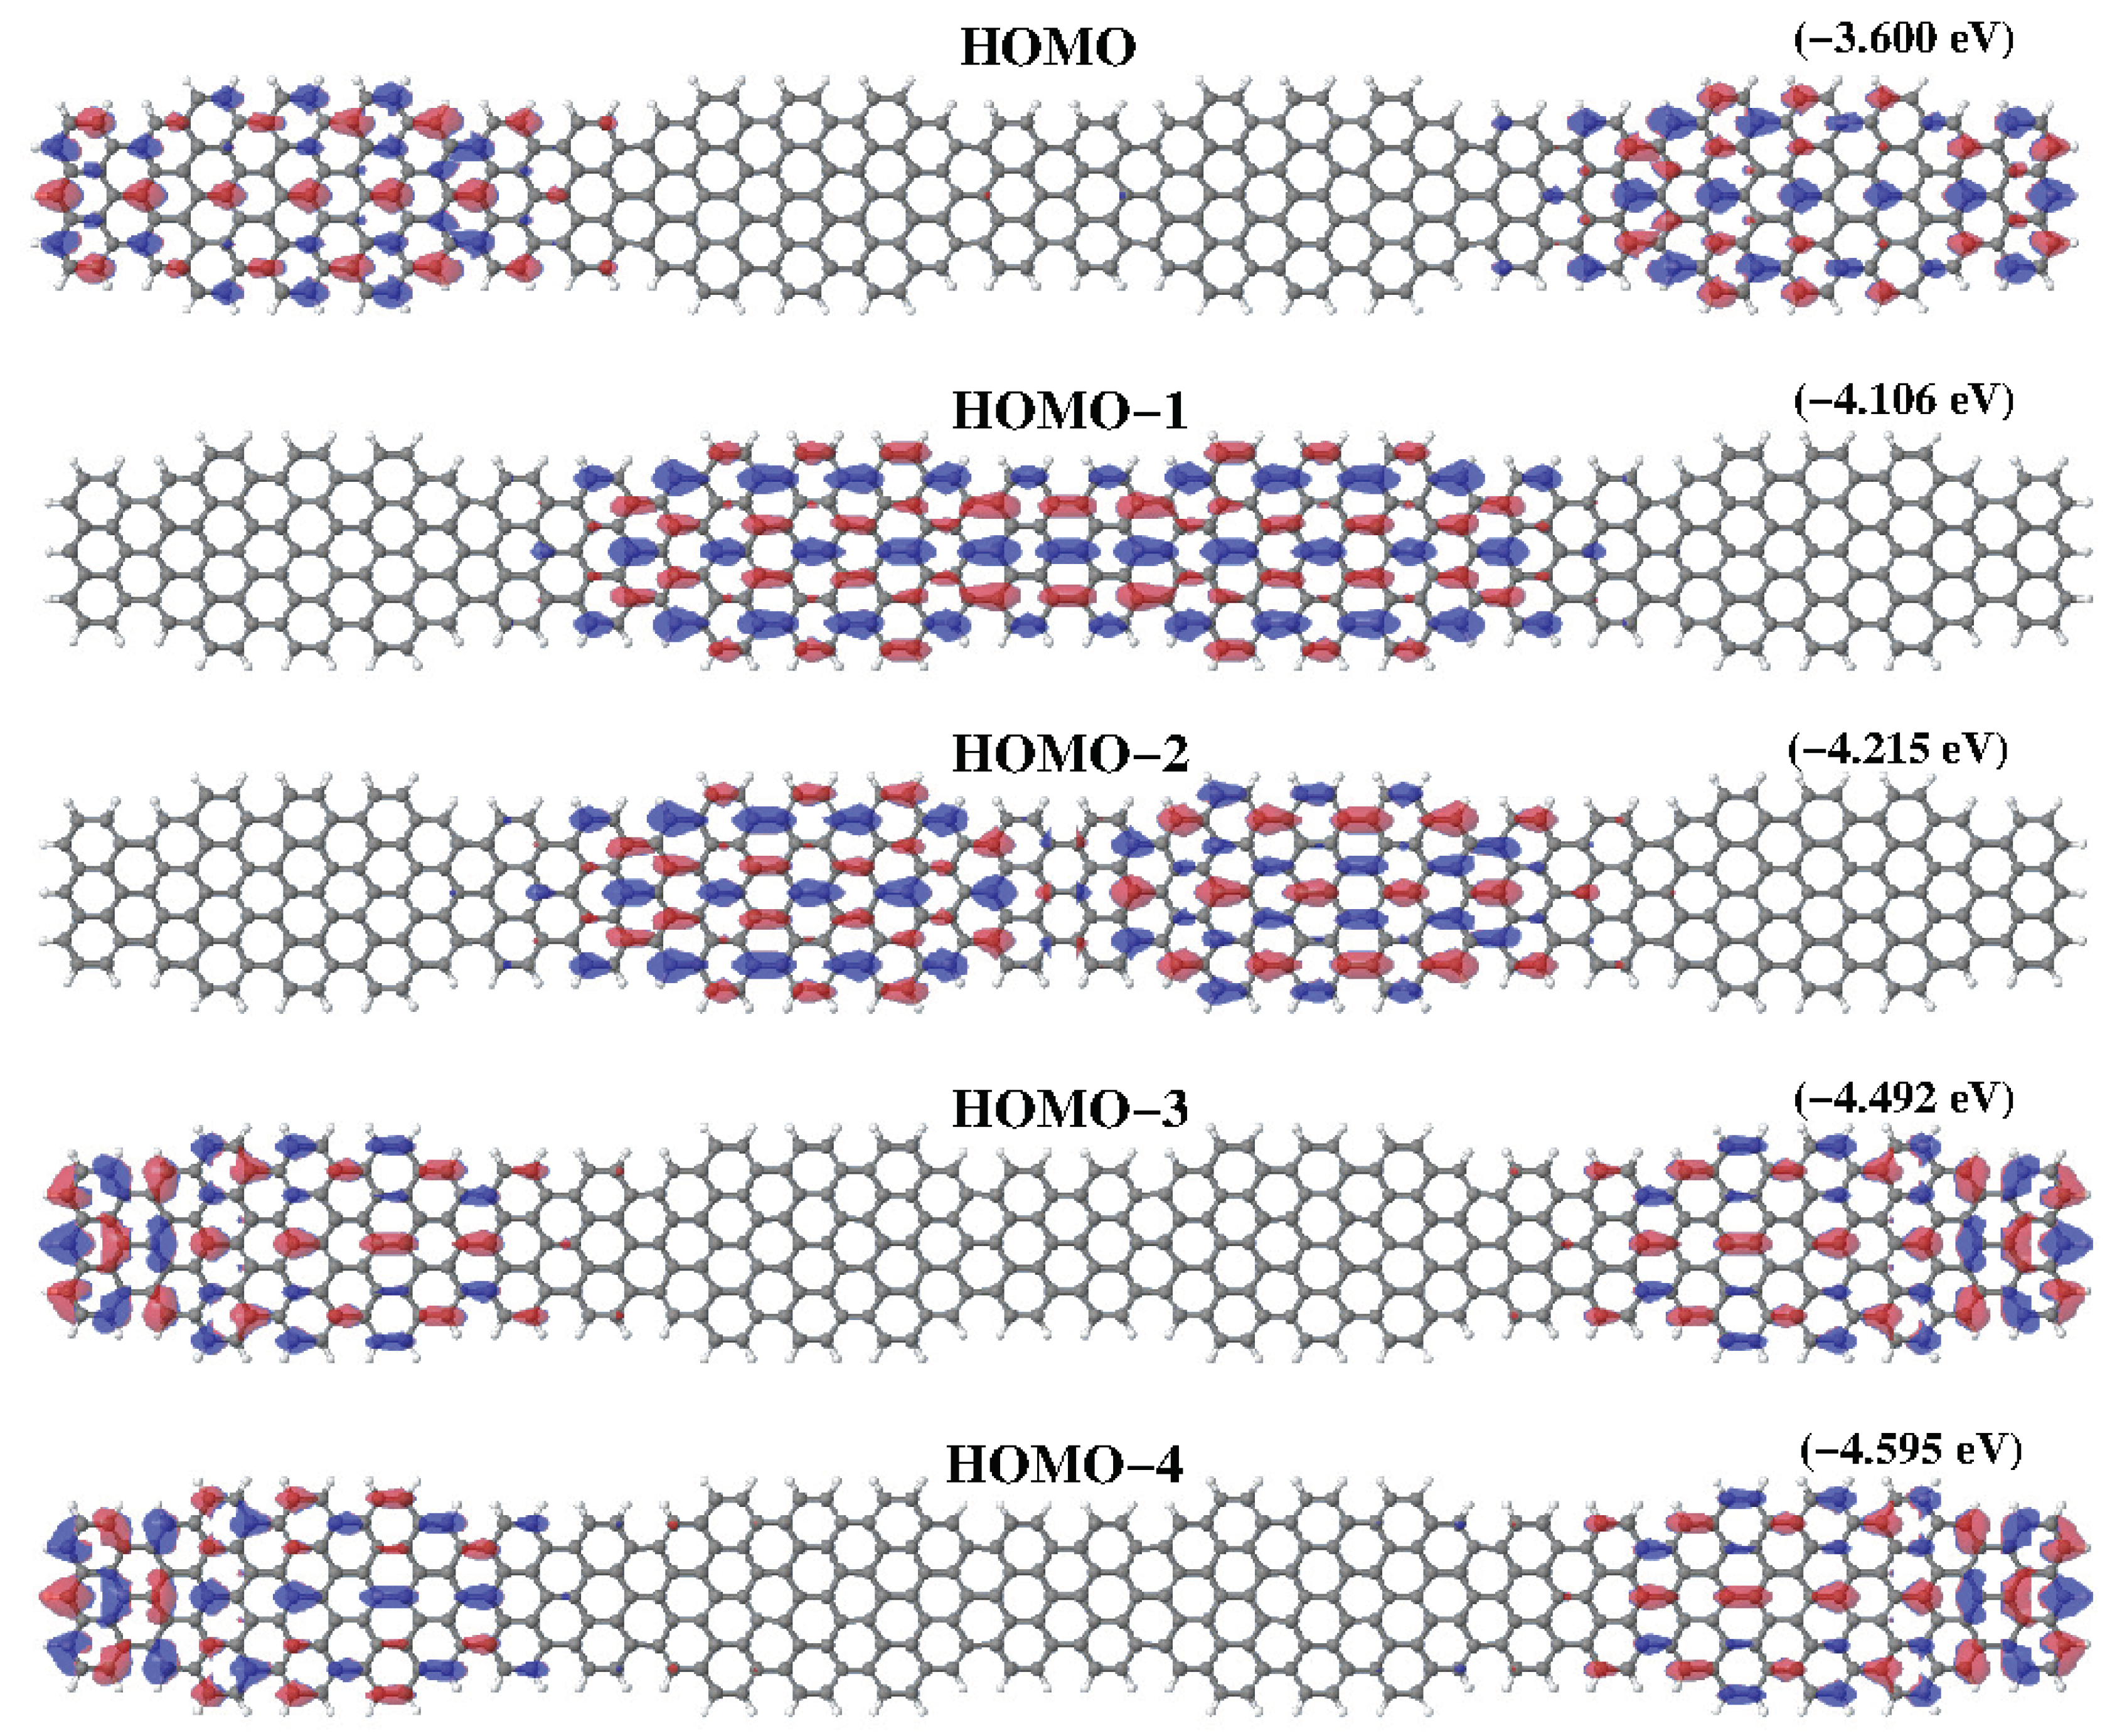
Figure 3). For C4, the peaks coming from the edge units close to the Fermi level are already merged in only one peak at the Fermi level because the weakness of the interaction they suffer. And therefore it will be so for larger strips. Now we have four topological bulk states at the two central units. This four topological bulk states can be described like a two sites chain, and each site representing a unit with two interacting levels. This correspond to the four split blue peaks around the Fermi level. The characteristics of the molecular orbitals close to the Fermi level will help present analysis of local densities of states. DFT results for the five HOMO of higher energy in C4 are depicted in
Figure 4. All them contribute to different peaks of the PDOS. Fourth (
) and fifth states (
) are clearly edge states that correspond to red peak in
Figure 2 with energy around
. The first state (
) correspond also to an edge state with energy around the Fermi level (
, red peak). Second and third states (
and
) correspond to blue peaks with energy around
, which are bulk states. For C6 and C8 the analysis follows the same way. The edge states, red lines, remain almost unchanged in C6 (C8). Now we have more central units that can be model like a tight-binding chain with two level sites that provide peaks blue, green and orange. Results for C8 compare qualitatively well with results shown in [
7] for a similar superlattice grown on gold. Nevertheless, in our free standing system bands are broader and localized peaks become separated.
3.3. Tight-Binding Model for Localized States
A tight-binding scheme has been employed in previous subsection to analyse
ab initio DFT results. Here the whole simple model describing topological states will we given, following the idea of SSH model [
8,
9]. In our model, superlattices present two states
and
in bulk cells (see
Figure 5) and three states
B,
and
at both system ends. The energy of all these states is the same
and they interact only with their first neighbors (in fact, as stated below, the correct description of DOS using PPP requires the screening of the Coulomb interaction up to distances of the order of a lattice parameter). In order to reproduce the results of
Figure 2, we take
eV,
and
eV.
Figure 6 shows results for the total DOS corresponding to
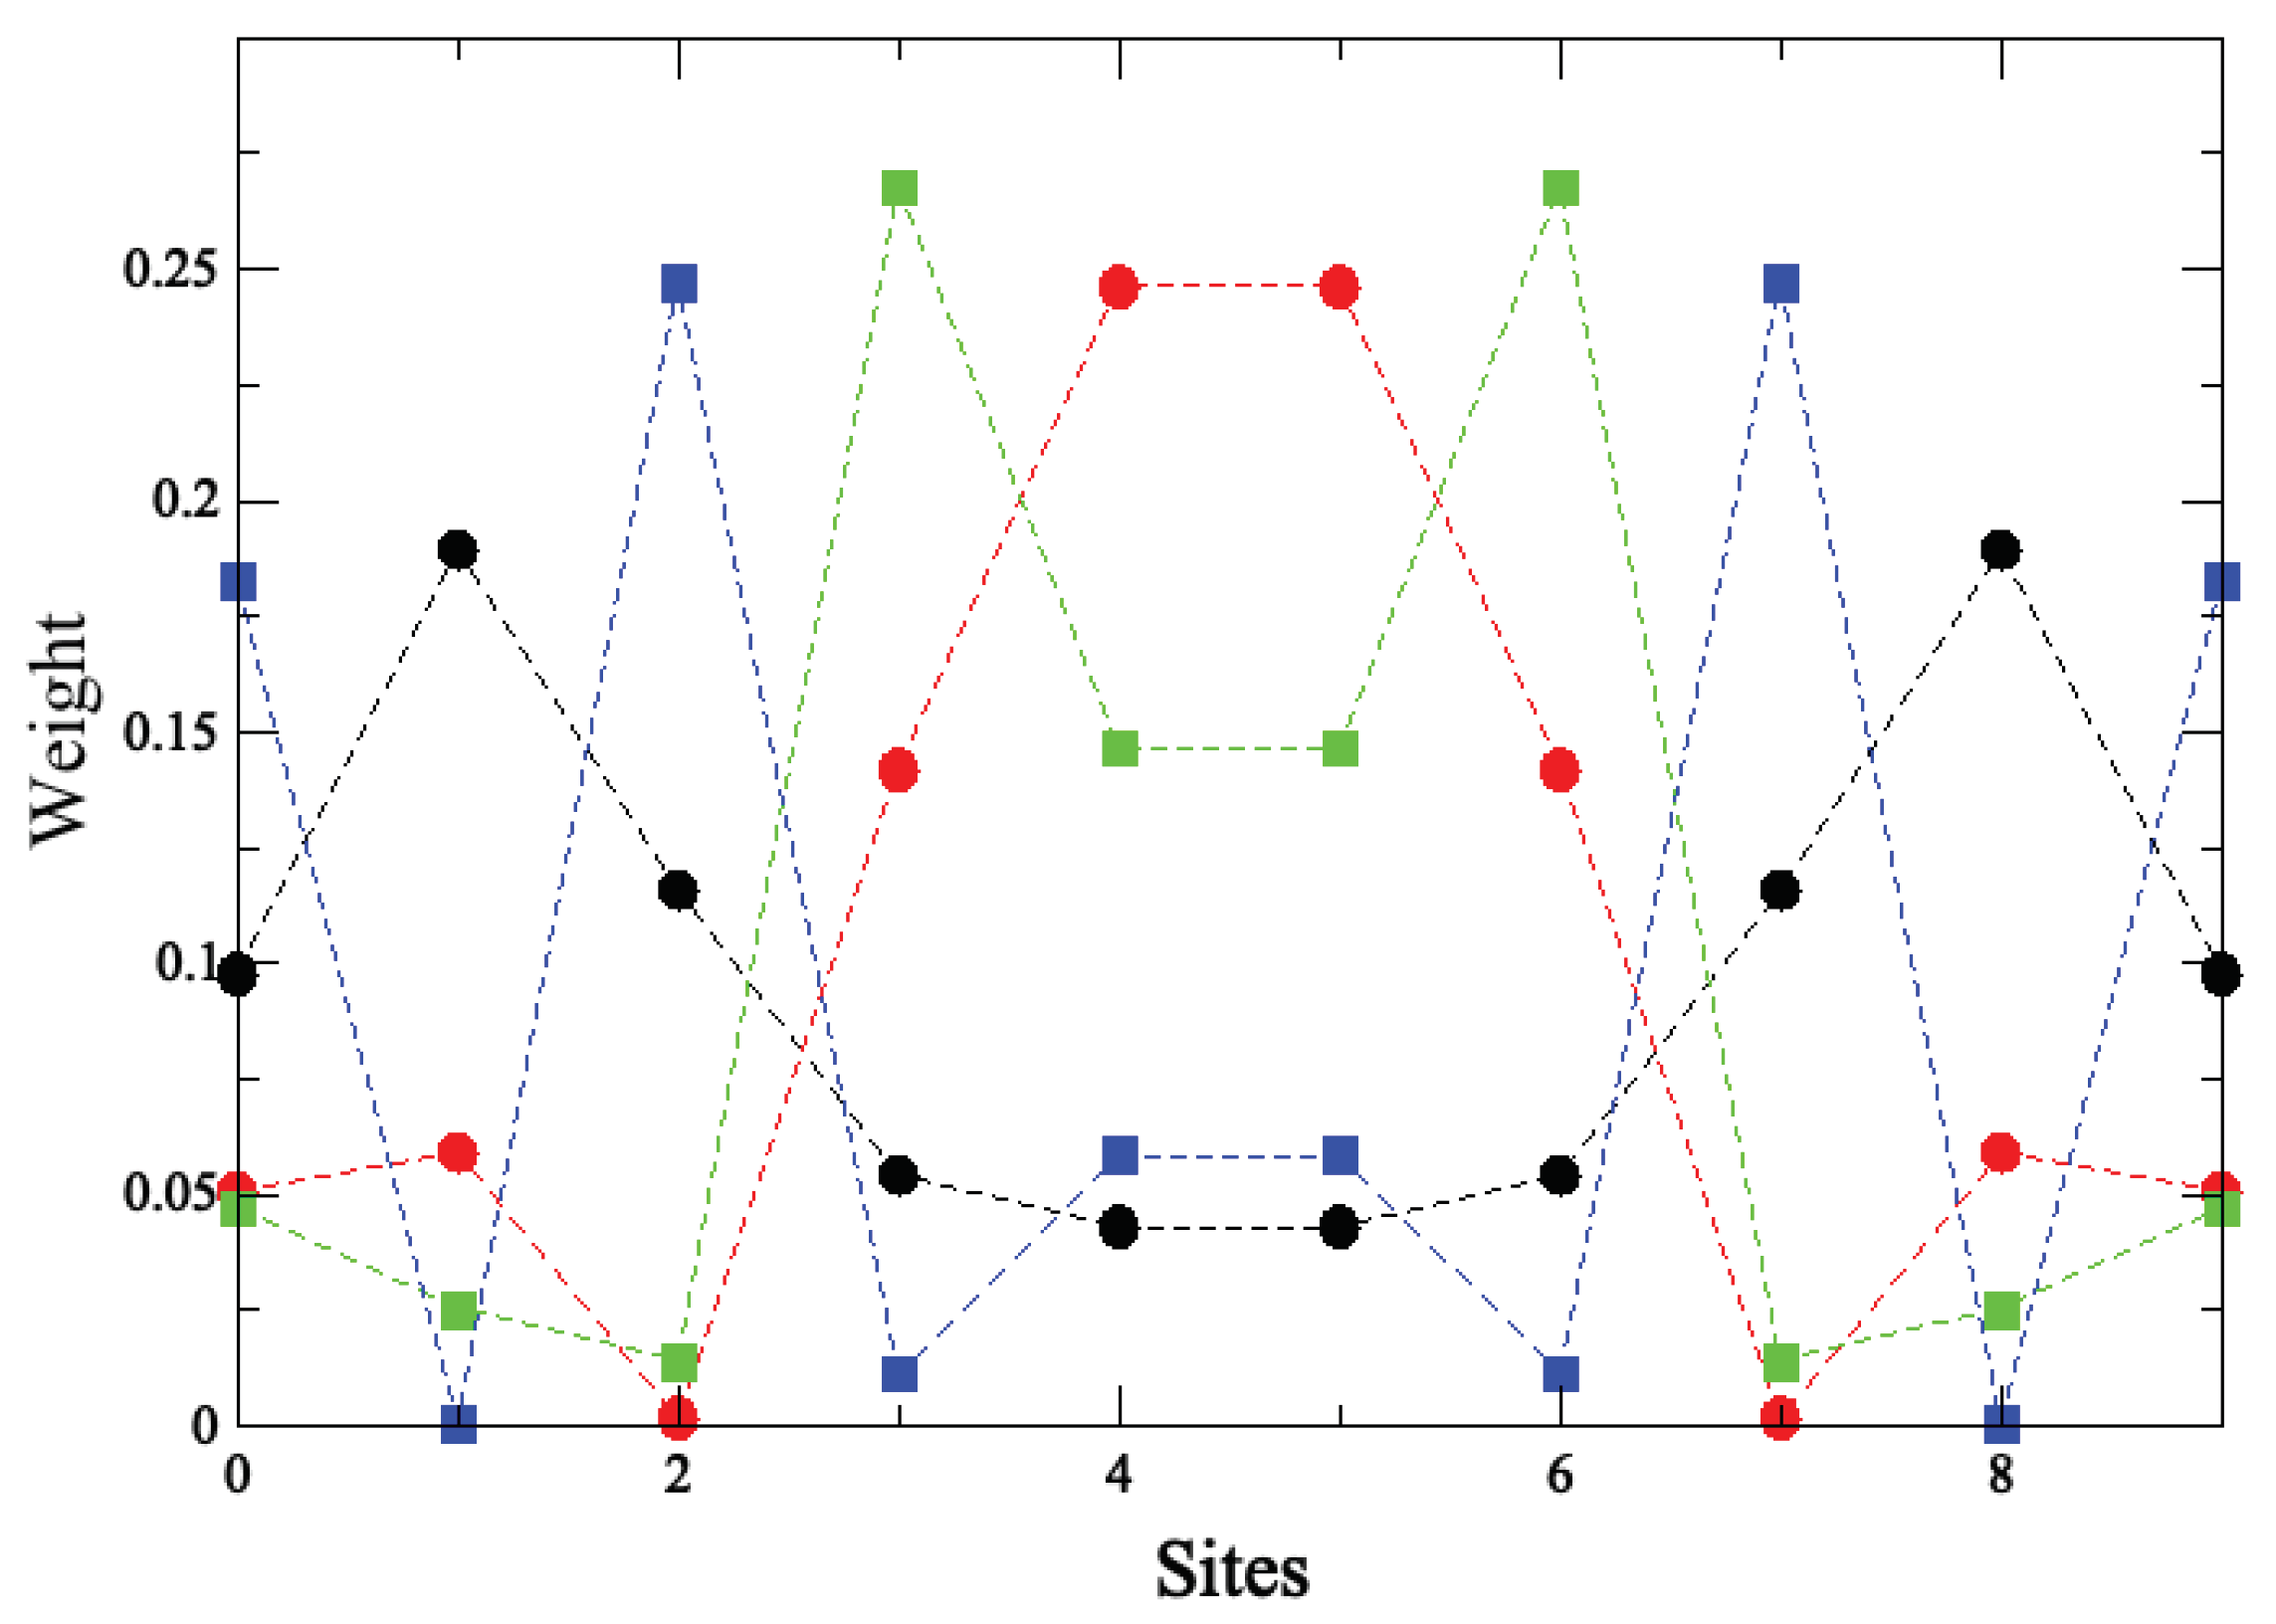
superlattices as it is obtained using this tight-binding description of localized states. Also, we plot the weights of the molecular orbitals in the tight binding model in order to compare them with results shown in
Figure 4 for the C4 superlattice (See
Figure 7). Black circles and blue squares correspond to states in the border with energies around
and
like
or
and
in
Figure 4. Red circles and green squares correspond to states in the bulk with energies around
and
, like
and
in
Figure 4.
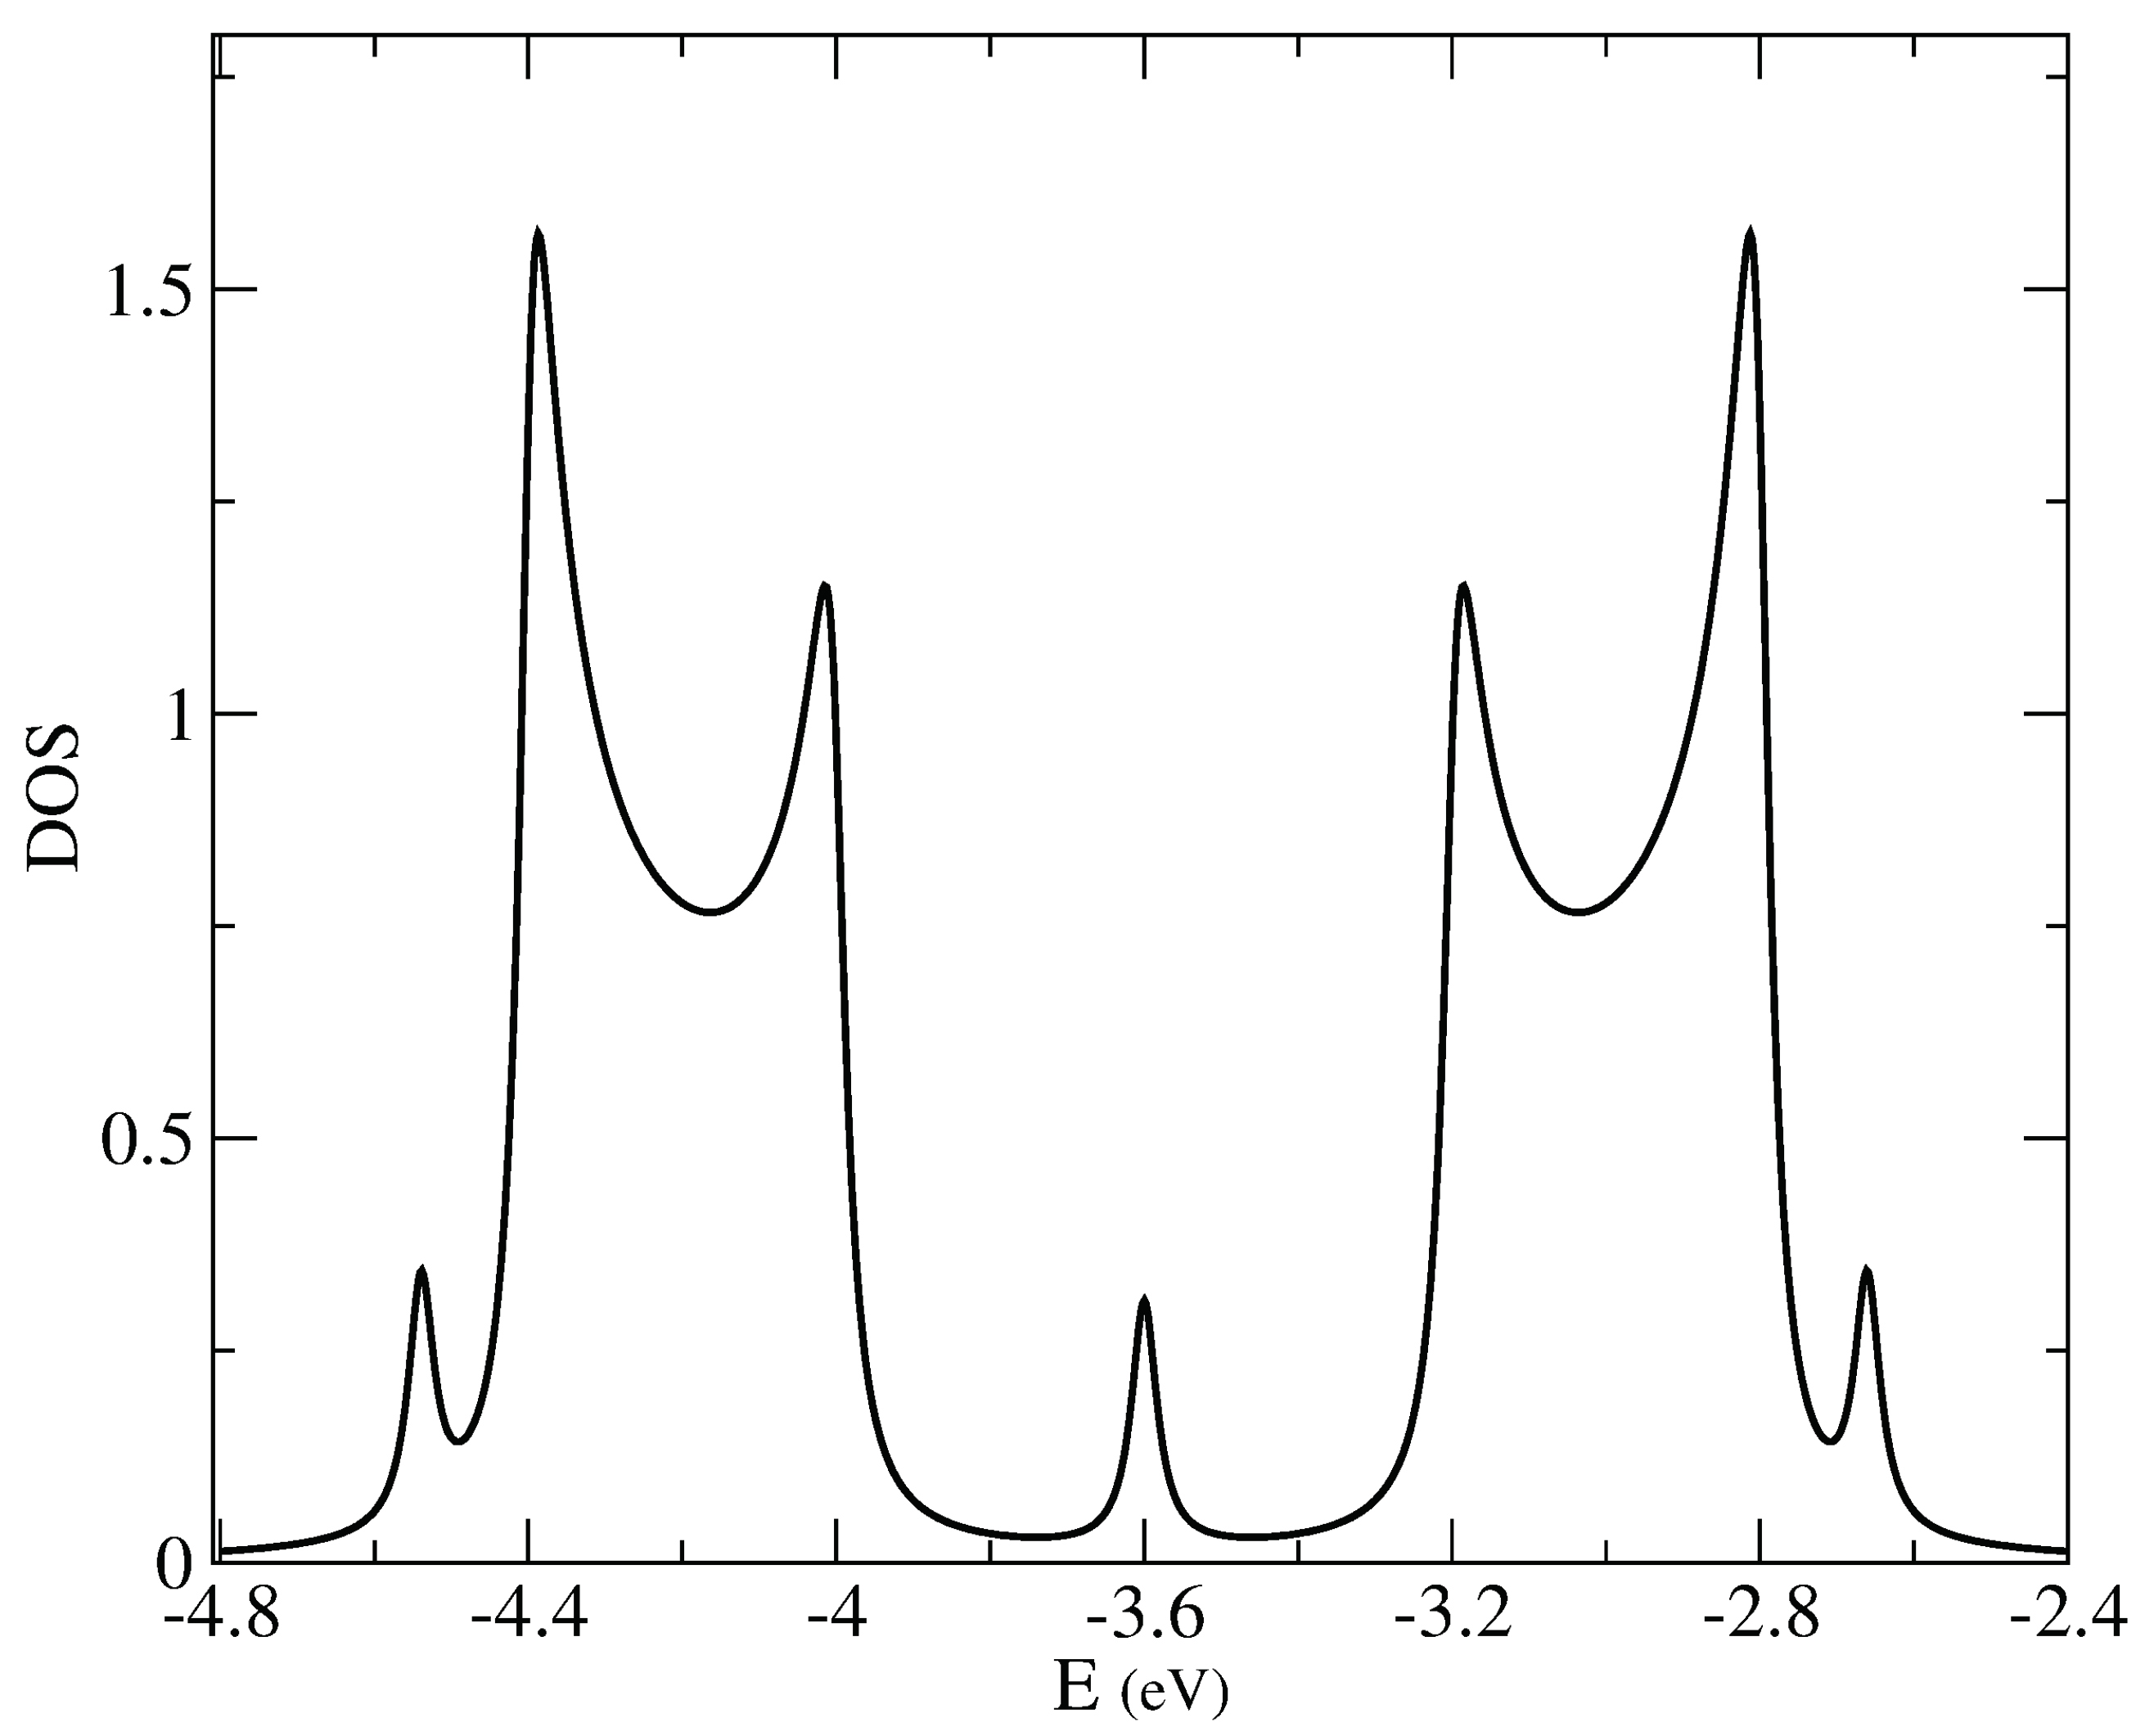
The limit of DOS for larger superlattices can be obtained using the topological tight-binding model.
Figure 8 shows the DOS for a
superlattice, where the bands of topological states are clearly developed.
3.4. A screened PPP model
It is interesting to wonder if this picture can be supported by the PPP model, mainly concerning the electronic structure near to the Fermi level.
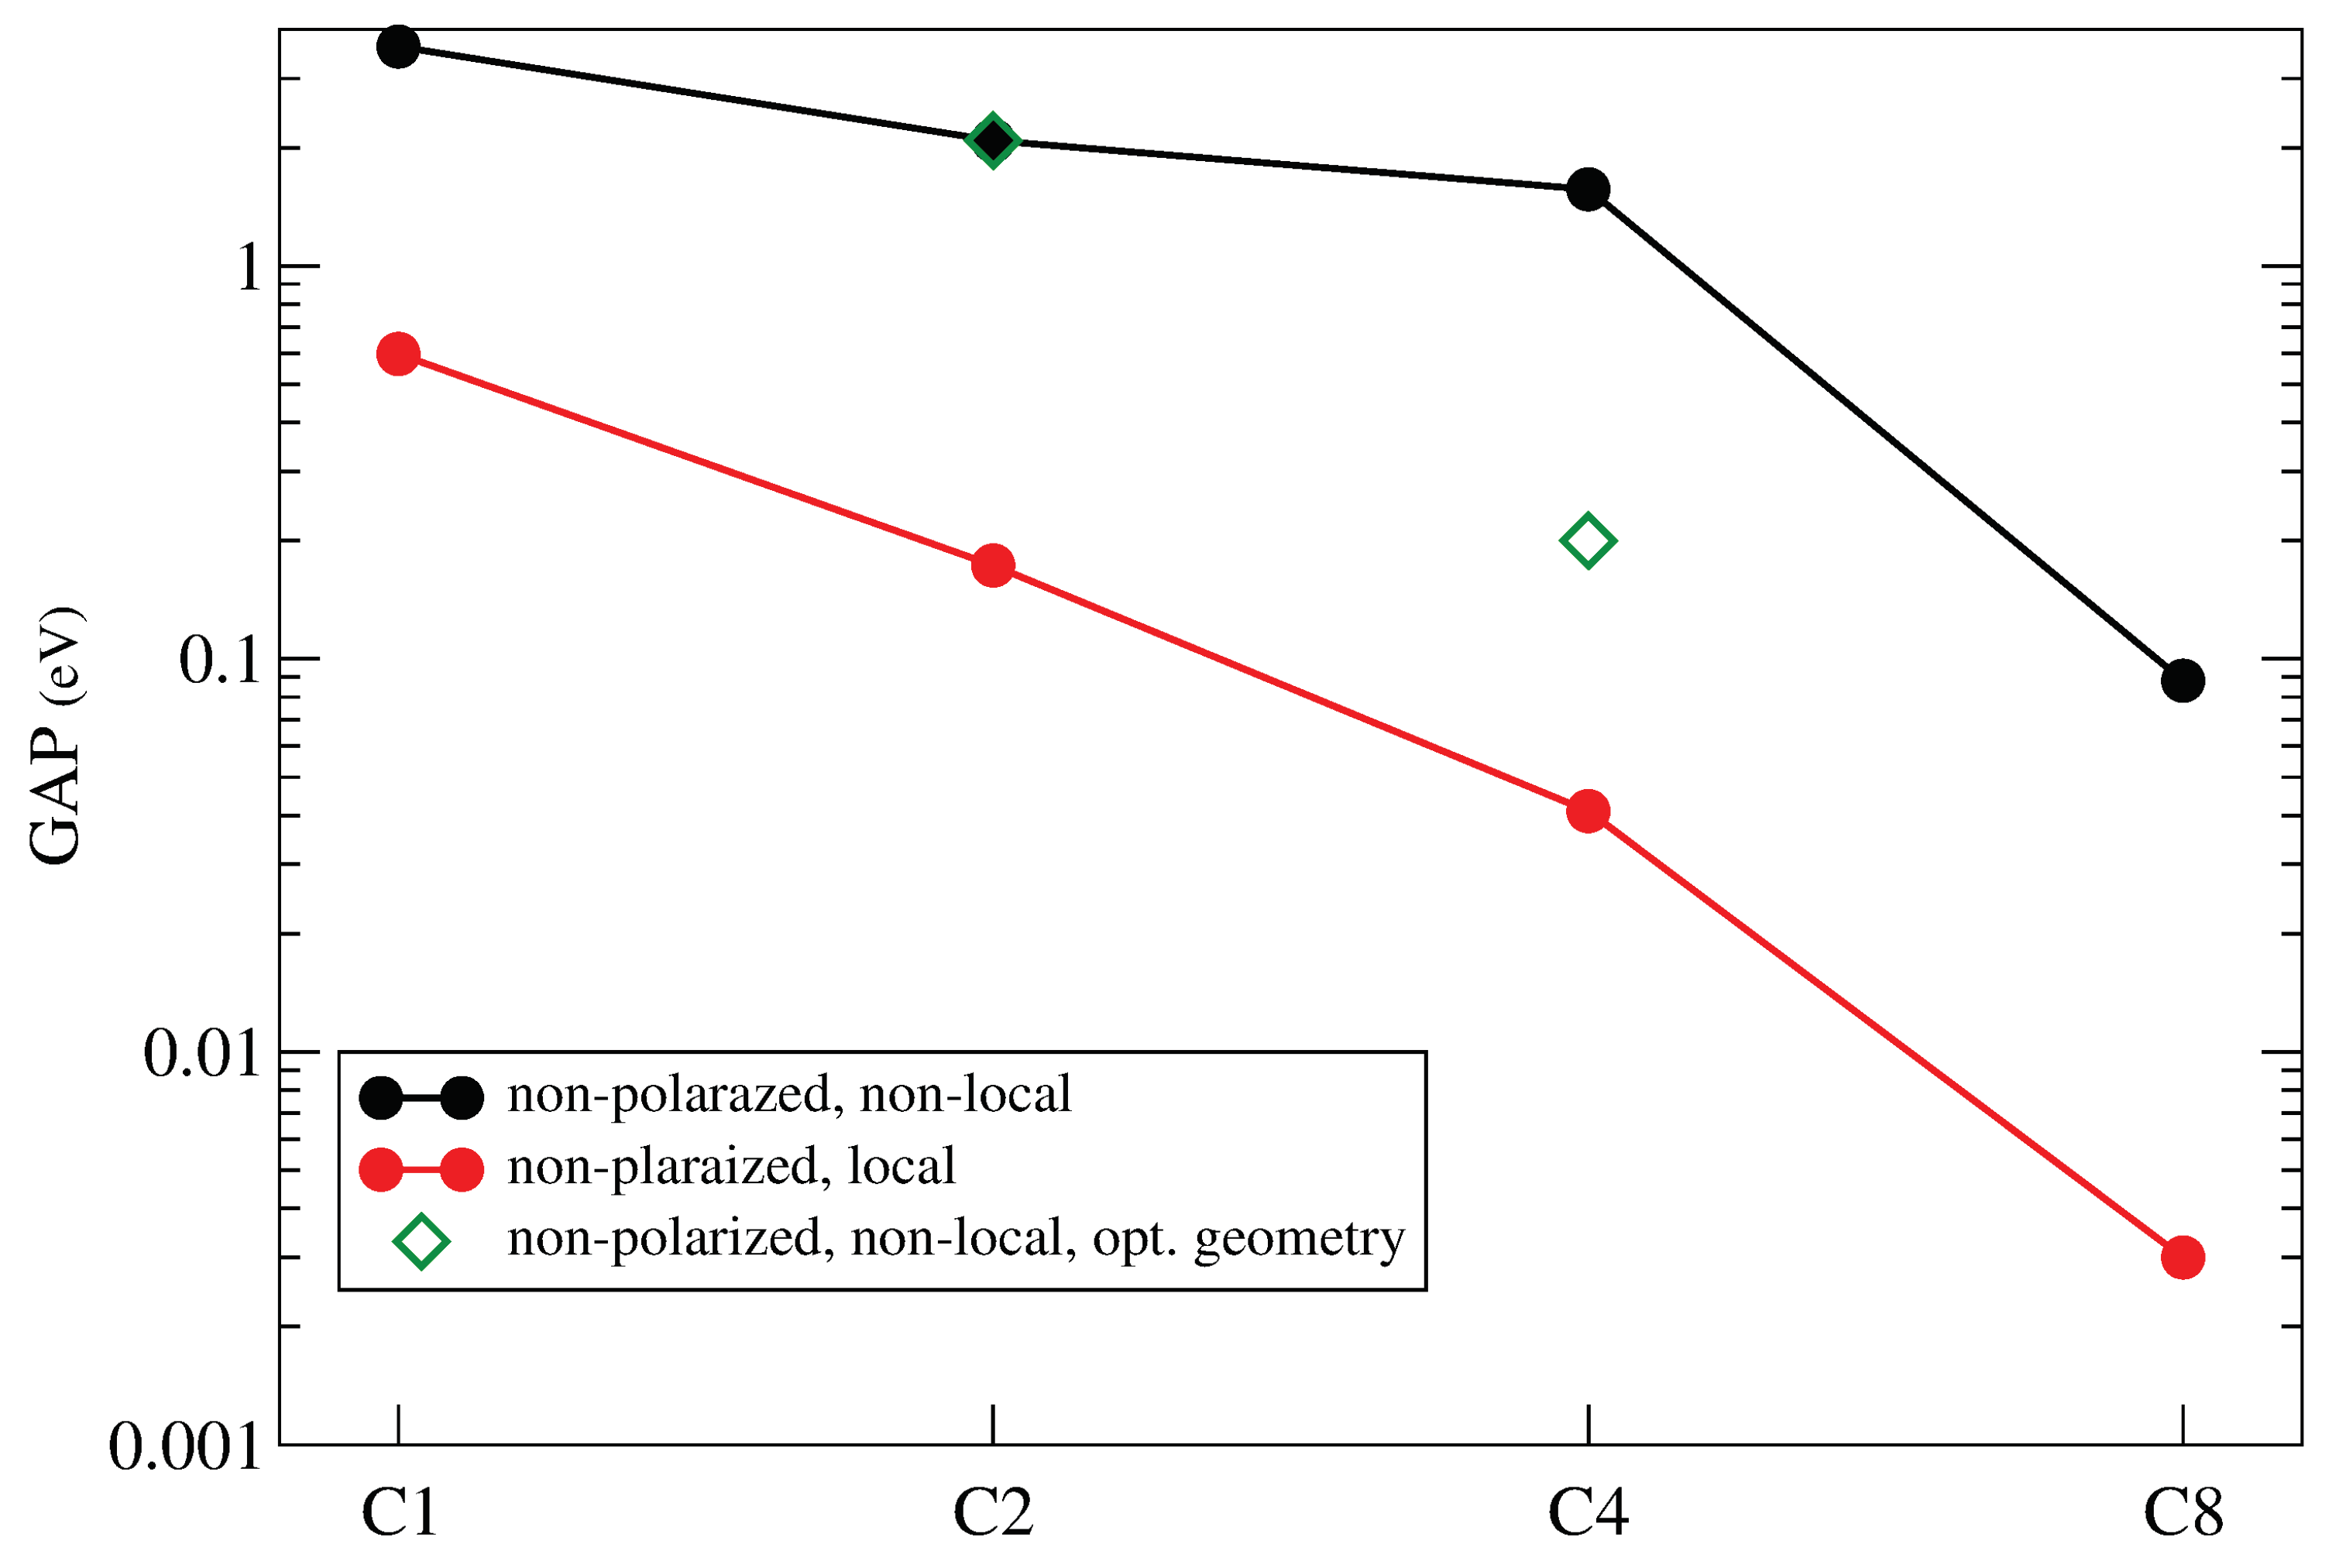
Table 4 and
Figure 9 shows the forbidden gap obtained with PPP. We include, for completeness, results for polarized solutions also, but we will focus finally on non-polarized solutions.
Let us compare Hu and PPP model Hamiltonians. Main features of our results are: i) Hu model and non-polarized solutions lead to small gaps for any size, a result which is in line with DFT results. ii) PPP model produces slightly larger gaps, but they also tend to zero as size of the system increases. iii) Polarized solutions show a large gap in any case.
In principle, both Hu or PPP models lead to zero gap for non-polarized solutions as the size is increased. However, as
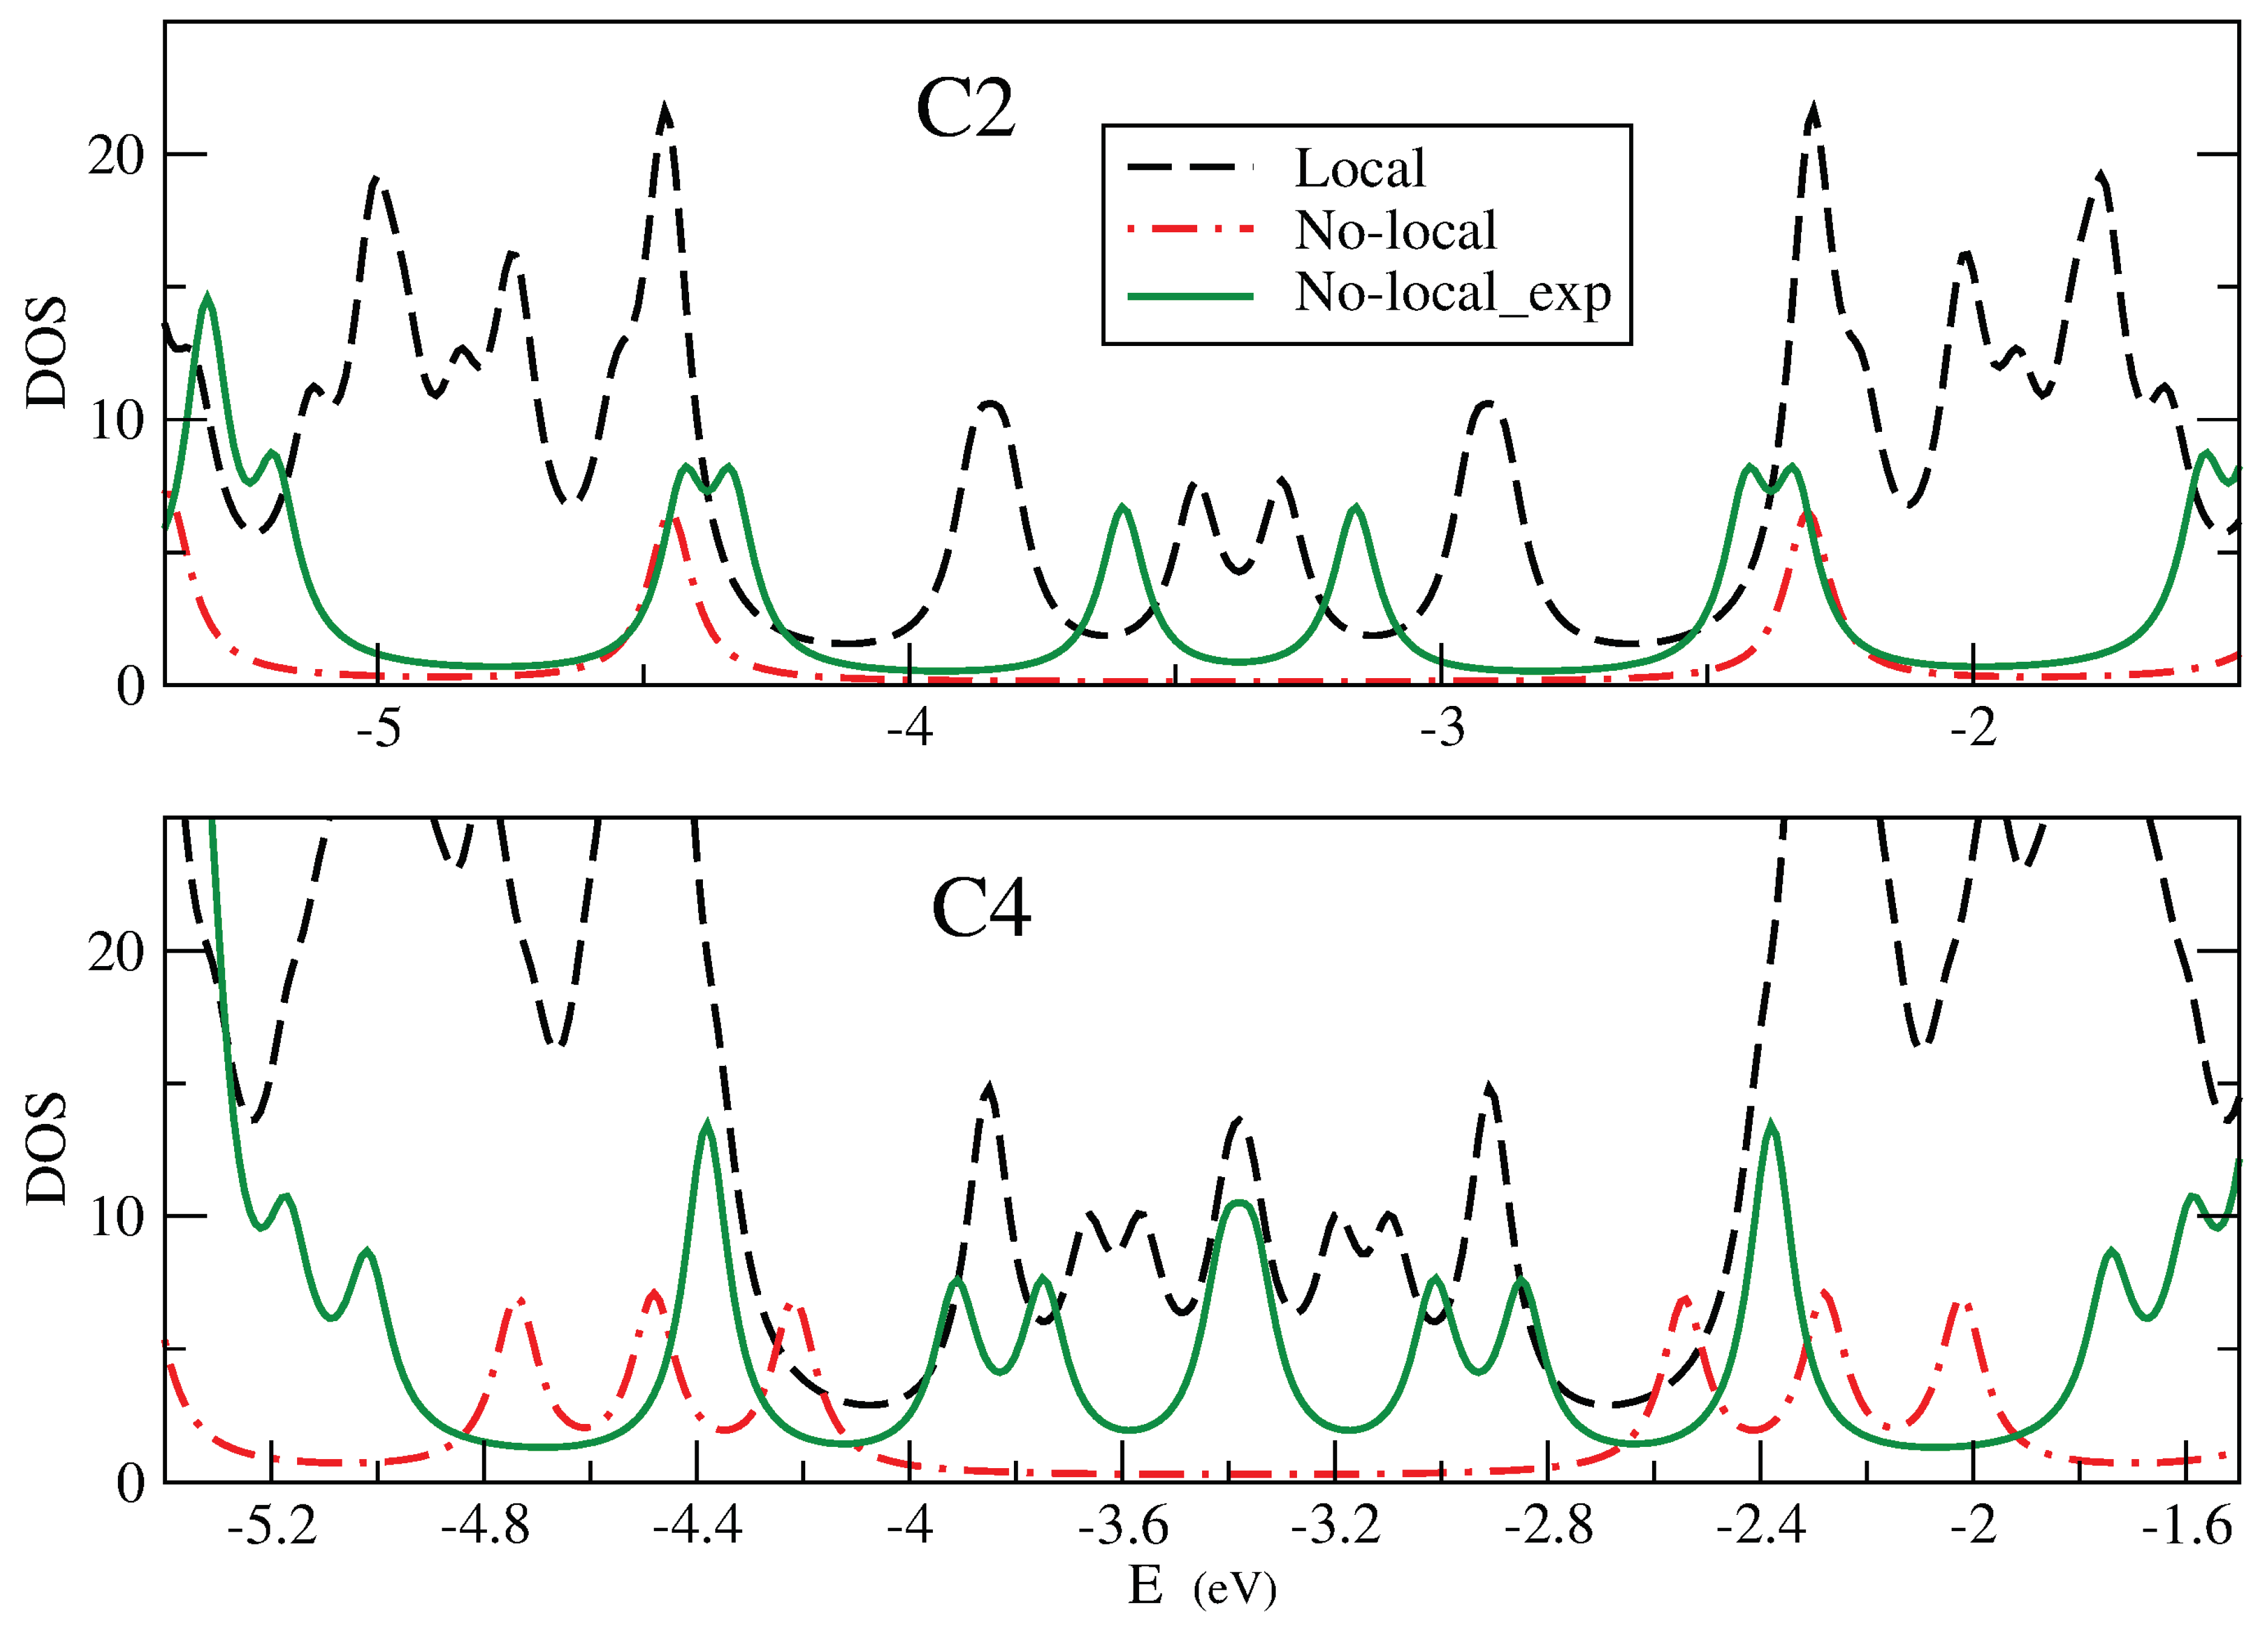
Figure 10 shows, important differences relative to DFT results arise. The Figure shows the variation of TDOS using PPP (red line) and Hu (black line) models for C2 and C4 structures. Although Hu interaction gives correctly the DFT result at the Fermi level ( a small gap for C2 and a peak for C4 ) around the Fermi level the description is not that similar because it has a larger density of states than DFT. For PPP model we obtain a so much larger gap. Both facts are due to the incorrect representation of interaction between topological states coming from both models. Local interaction underestimate it and non-local interaction overestimate it. To improve these results we use the
screened potential, adjusting
factor. We have found that choosing
Å produces results that are qualitatively similar to DFT results (green line in the figure). This screened interaction potential seems to represent more accurately the physics of these strips. It is also consistent with the tight-binding model for topological states.
4. Final Remarks
The data presented in this work support the following conclusions and remarks:
- 1)
The combination of model Hamiltonian (Hu and PPP) calculations and ab initio DFT allows the identification of the effective range of electronic interactions in free standing 7/9-AGNR superlattices. In order to modulate the decay of the electron-electron interaction an exponential cutoff has been used. The inclusion of such parameter is a crucial step for improving the agreement between PPP and DFT results, particularly in what concerns to the description of DOS around the Fermi level. We find that Å, a value that is somewhat larger than the parameter lattice, improves the resemblance between PPP and DFT DOS. Neither Hu not unscreened long-range PPP models seem to be appropriate for the inclusion of interactions in these systems.
- 2)
We have given a plausible route for the evolution of the system density of states in going from the smallest C1 up to the largest superlattice C8. Localized states at 7/9 junctions evolve developing two kind of states: three border states at each system end corresponding to three peaks in DOS at energies around , and (more precisely, they come from a combination of one pure border state and two topological states in the border unit cell) and bulk states that form two bands, one between and and a symmetric second one that lies above (they are linear combinations of topological states originated at 7/9 junctions). All these features can be described by a tight-binding model of two levels per unit cell, except at the border unit cells where there are three states. The tight-binding model allows the precise calculation of the DOS of very large superlattices that are beyond the capability of ab initio methods.
- 3)
Our results for free standing nanoribbons compare qualitatively well with previous results of similar systems deposited on Au (111) surfaces. Finite range interactions imply a renormalization of band widths and separations between peaks.
- 4)
We guess that the screened PPP model can be successfully employed in a large variety of geometric variations of defective free standing nanoribbons allowing a quick exploration of new systems.
Author Contributions
Conceptualization, methodology, calculations and writing, E.L., G.C., J.A.V. and E.S.F.. All authors have read and agreed to the published version of the manuscript.
Funding
This research was funded by the Spanish “Ministerio de Ciencia e Innovación” (grant PID2019-106114GB-I00), AICO/2021/093, PROMETEO/2021/017 (”Generalitat Valenciana”) and the Universidad de Alicante.
Acknowledgments
Financial support by the Spanish “Ministerio de Ciencia e Innovación” (grant PID2019-106114GB-I00), AICO/2021/093, PROMETEO/2021/017 (”Generalitat Valenciana”) and the Universidad de Alicante, is gratefully acknowledged. G.C. acknowledges a financial support from the Spanish Ministry of Education and Science, PID2019-109539GB-C41.
Conflicts of Interest
Declare conflicts of interest or state “The authors declare no conflict of interest.”
References
- Novoselov, K.S.; Geim, A.K.; Morozov, S.V.; Jiang, D.; Zhang, Y.; Dubonos, S.V.; Grigorieva, I.V.; Firsov, A.A. Electric Field Effect in Atomically Thin Carbon Films. Science 2004, 306, 666–669. [Google Scholar] [CrossRef] [PubMed]
- Meyer, J.; Geim, A.K.; Katsnelson, M. I. and Novoselov, K.S.; Booth, T.J.; Roth. The structure of suspended graphene sheets. Nature 2007, 446, 60–63. [Google Scholar] [CrossRef] [PubMed]
- Guinea, F. https://doi.org/10.36471/JCCM_November_2021_01, 2021. Accesed:2023-12-07.
- Cao, Y.; Fatemi, V.; Fang, S.; Watanabe, K.; Taniguchi, T.; Kaxiras, E.; Jarillo-Herrero, P. Unconventional superconductivity in magic-angle graphene superlattices. Nature 2018, 556, 43–50. [Google Scholar] [CrossRef]
- Wong, D.; Nuckolls, K.P.; Oh, M.; Lian, B.; Xie, Y.; Jeon, S.; Watanabe, K.; Taniguchi, T.; Bernevig, B.A.; Yazdani, A. Cascade of electronic transitions in magic-angle twisted bilayer graphene. Nature 2020, 582, 198–202. [Google Scholar] [CrossRef] [PubMed]
- Jaoui, A.; Das, I.; Battista, G.D.; Díez-Mérida, J.; Lu, X.; Watanabe, K.; Taniguchi, T.; Ishizuka, H.; Levitov, L.; Efetov, D.K. Quantum critical behaviour in magic-angle twisted bilayer graphene. Nature Physics 2022, 18, 633–638. [Google Scholar] [CrossRef]
- Rizzo, D.J.; Veber, G.; Cao, T.; Bronner, C.; Chen, T.; Zhao, F.; Rodriguez, H.; Louie, S.G.; Crommie, M.F.; Fischer, F.R. Topological band engineering of graphene nanoribbons. Nature 2018, 560, 204–208. [Google Scholar] [CrossRef] [PubMed]
- Gröning, O.; Wang, S.; Yao, X.; Pignedoli, C.A.; Barin, G.B.; Daniels, C.; Cupo, A.; Meunier, V.; Feng, X.; Narita, A.; et al. Engineering of robust topological quantum phases in graphene nanoribbons. Nature 2018, 560, 209–213. [Google Scholar] [CrossRef] [PubMed]
- Su, W.P.; Schrieffer, J.R.; Heeger, A.J. Soliton excitations in polyacetylene. Phys. Rev. B 1980, 22, 2099–2111. [Google Scholar] [CrossRef]
- Sun, Q.; Yan, Y.; Yao, X.; Müllen, K.; Narita, A.; Fasel, R.; Ruffieux, P. Evolution of the Topological Energy Band in Graphene Nanoribbons. The Journal of Physical Chemistry Letters 2021, 12, 8679–8684. [Google Scholar] [CrossRef]
- Joost, J.P.; Jauho, A.P.; Bonitz, M. Correlated Topological States in Graphene Nanoribbon Heterostructures. Nano Letters 2019, 19, 9045–9050. [Google Scholar] [CrossRef]
- Pariser, R.; Parr, R.G. A Semi-Empirical Theory of the Electronic Spectra and Electronic Structure of Complex Unsaturated Molecules. I. J. Chem. Phys. 1953, 21, 466–471. [Google Scholar] [CrossRef]
- Pople, J.A. Electron interaction in unsaturated hydrocarbons. Trans. Faraday Soc. 1953, 49, 1375–1385. [Google Scholar] [CrossRef]
- Hubbard, J. Electron Correlations in Narrow Energy Bands. Proceedings of the Royal Society of London. Series A, Mathematical and Physical Sciences 1963, 276, 238–257. [Google Scholar] [CrossRef]
- Becke, A.D. Density-functional exchange-energy approximation with correct asymptotic behavior. Phys. Rev. A 1988, 38, 3098–3100. [Google Scholar] [CrossRef] [PubMed]
- Lee, C.; Yang, W.; Parr, R.G. Development of the Colle-Salvetti correlation-energy formula into a functional of the electron density. Phys. Rev. B 1988, 37, 785–789. [Google Scholar] [CrossRef]
- Becke, A.D. Density functional thermochemistry. III. The role of exact exchange. J. Chem. Phys. 1993, 98, 5648–5652. [Google Scholar] [CrossRef]
- Stephens, P.J.; Devlin, F.J.; Chabalowski, C.F.; Frisch, M.J. Ab Initio Calculation of Vibrational Absorption and Circular Dichroism Spectra Using Density Functional Force Fields. J. Phys. Chem. 1994, 98, 11623–11627. [Google Scholar] [CrossRef]
- Chiappe, G.; Louis, E.; San-Fabián, E.; Vergés, J.A. Can model Hamiltonians describe the electron–electron interaction in π-conjugated systems?: PAH and graphene. J. Phys.-Condens. Mat. 2015, 27, 463001. [Google Scholar] [CrossRef]
- Here, W.J.; Ditchfield, R.; Pople, J.A. Self-consistent molecular orbital methods XII. Further extensions of Gaussian-Type Basis sets for use in molecular orbital studies of organic molecules. J. Chem. Phys. 1972, 56, 2257. [Google Scholar] [CrossRef]
- Hariharan, P.C.; Pople, J.A. The influence of polarization functions on molecular orbital hidrogenation energies. Theor. Chim. Acta 1973, 28, 213. [Google Scholar] [CrossRef]
- Frisch, M.J.; Trucks, G.W.; Schlegel, H.B.; Scuseria, G.E.; Robb, M.A.; Cheeseman, J.R.; Scalmani, G.; Barone, V.; Petersson, G.A.; Nakatsuji, H.; et al. Gaussian 16 Revision C.01. https://gaussian.com/gaussian16, 2016. Gaussian Inc. Wallingford CT.
- O’boyle, N.M.; Tenderholt, A.L.; Langner, K.M. cclib: A library for package-independent computational chemistry algorithms. Journal of Computational Chemistry 2008, 29, 839–845. [Google Scholar] [CrossRef] [PubMed]
- Lu, T.; Chen, F. Multiwfn: A multifunctional wavefunction analyzer. J. Comput. Chem. 2012, 33, 580–592. [Google Scholar] [CrossRef] [PubMed]
- Handbook of the Band Structure of Elemental Solids. Papaconstantopoulos, D.A. (Ed.) Springer: New York, MY, 2015. [Google Scholar] [CrossRef]
- Vergés, J.A.; Chiappe, G.; Louis, E. On the forbidden gap of finite graphene nanoribbons. Eur. Phys. J. B 2015, 88, 200. [Google Scholar] [CrossRef]
- Many-Particle Physics (Physics of Solids and Liquids). Mahan, G.D. (Ed.) Springer: Boston, MA, 2000. [Google Scholar] [CrossRef]
- Ohno, K. Some remarks on the Pariser-Parr-Pople method. Theor. Chim. Acta 1964, 2, 219–227. [Google Scholar] [CrossRef]
- Perdew, J.P.; Burke, K.; Ernzerhof, M. Erratum: Generalized Gradient Approximation Made Simple [Phys. Rev. Lett. 77, 3865 (1996)]. Phys. Rev. Lett. 1997, 78, 1396–1396. [Google Scholar] [CrossRef]
- Krishnan, R.; Binkley, J.S.; Seeger, R.; Pople, J.A. Self-consistent molecular orbital methods XX. A basis set for correlated wave functions. J. Chem. Phys. 1980, 72, 650. [Google Scholar] [CrossRef]
- Cao, T.; Zhao, F.; Louie, S.G. Topological Phases in Graphene Nanoribbons: Junction States, Spin Cen ters, and Quantum Spin Chains. Phys. Rev. Lett. 2017, 119, 076401. [Google Scholar] [CrossRef]
- Lin, K.S.; Chou, M.Y. Topological Properties of Gapped Graphene Nanoribbons with Spatial Symmetries. Nano Letters 2018, 18, 7254–7260. [Google Scholar] [CrossRef]
Figure 1.
Schematic representation of the 7/9-AGNR with two unit cells (we call this cluster C2).
Figure 1.
Schematic representation of the 7/9-AGNR with two unit cells (we call this cluster C2).
Figure 2.
Spatially decomposed density of states of 7/9-AGNR superlattices with one to eight unit cells (C1-C8) calculated by means of B3LYP/6-31G* method. Partial densities of states (PDOS) were obtained by adding up local density of states on symmetrical Cs in contiguous layers of 96 atoms (1-96, ..., 289-384). Results are given in the energy region where topological states show up, that is, between -4.8 and -2.4 eV (the Fermi level is approximately at -3.6 eV).
Figure 3.
Schematic representation of topological bulk sates localized at the internal boundaries of a unit cell in the bulk. When further cells are added to the system, an extended chain with two levels per unit cell is obtained.
Figure 3.
Schematic representation of topological bulk sates localized at the internal boundaries of a unit cell in the bulk. When further cells are added to the system, an extended chain with two levels per unit cell is obtained.
Figure 4.
Higher occupied molecular orbitals obtained for a C4 superlattice containing four unit cells. First, fourth and fifth molecular orbitals are border states produced by the coupling of the edge state with the two topological states at cluster ends, while second and third molecular orbitals appear from the coupling of pure topological states at the central units. In brackets, their energy.
Figure 5.
Tight-binding model for topological sates. 1 is the unit cell at the borders of the sample. It contains three levels, one due to the border and two due to the 7/9 frontiers and . 2 is a bulk cell which contains only and states. , t and are the couplings between them.
Figure 5.
Tight-binding model for topological sates. 1 is the unit cell at the borders of the sample. It contains three levels, one due to the border and two due to the 7/9 frontiers and . 2 is a bulk cell which contains only and states. , t and are the couplings between them.
Figure 6.
Total DOS for superlattices C1 to C8, calculated using the topological tight-binding model with eV, eV and eV.
Figure 6.
Total DOS for superlattices C1 to C8, calculated using the topological tight-binding model with eV, eV and eV.
Figure 7.
Molecular states of the tight binding model of topological states for C4. It has ten states. eV, eV and eV.
Figure 7.
Molecular states of the tight binding model of topological states for C4. It has ten states. eV, eV and eV.
Figure 8.
Total DOS for a C54 superlattice, calculated using the topological tight-binding model with eV, eV and eV.
Figure 8.
Total DOS for a C54 superlattice, calculated using the topological tight-binding model with eV, eV and eV.
Figure 9.
Forbidden gap of 7/9-AGNR superlattice vs the number of unit cells C1, C2, C4, C8. The results correspond to unrestricted non-polarized solutions of the PPP Hamiltonian including or not the long-range interaction (black and red circles, respectively) using a standard non optimized geometry for the superlattice. Some results obtained by using the DFT optimized geometry of previous calculations (green rhombus) are also shown.
Figure 10.
TDOS of 7/9-AGNR superlattice with 2 and 4 unit cells (C2 and C4), described by the Hu model (black line), the PPP model (red line) and the exponentially screened PPP model (green line).
Figure 10.
TDOS of 7/9-AGNR superlattice with 2 and 4 unit cells (C2 and C4), described by the Hu model (black line), the PPP model (red line) and the exponentially screened PPP model (green line).
Table 1.
Geometrical structure of 7/9-AGNR superlattices with 2, 3, 4, 6 and 8 Cn)) unit cells calculated by means of DFT. In addition, results for the energies () of HOMO and LUMO (in Hartrees) and the gap (in eV), are reported.
Table 1.
Geometrical structure of 7/9-AGNR superlattices with 2, 3, 4, 6 and 8 Cn)) unit cells calculated by means of DFT. In addition, results for the energies () of HOMO and LUMO (in Hartrees) and the gap (in eV), are reported.
| |
C2: 192 C’s |
C3: 288 C’s |
C4: 384 C’s |
C6: 576 C’s |
C8: 768 C’s |
| d (nm) |
1.285 |
1.284 |
1.284 |
1.284 |
1.284 |
| d (nm) |
1.295 |
1.293 |
1.293 |
1.293 |
1.293 |
|
-0.13783 |
-0.1333 |
-0.13234 |
-0.13198 |
-0.13187 |
|
-0.12441 |
-0.1294 |
-0.13065 |
-0.13112 |
-0.13126 |
| Gap |
0.365 |
0.107 |
0.046 |
0.023 |
0.017 |
Table 2.
Several properties of 7/9-AGNR superlattice C2, calculated by means of DFT, using two different functionals and two Gaussian basis sets. All energies are in Hartrees, except the gap which is given in eV. See
Figure 1 for d
and d
definitions.
Table 2.
Several properties of 7/9-AGNR superlattice C2, calculated by means of DFT, using two different functionals and two Gaussian basis sets. All energies are in Hartrees, except the gap which is given in eV. See
Figure 1 for d
and d
definitions.
| |
B3LYP/6-31G* |
PBE/6-31G* |
B3LYP/6-311G* |
PBE/6-311G* |
| d (nm) |
1.2845 |
1.2803 |
1.2828 |
1.2784 |
| d (nm) |
1.2947 |
1.2903 |
1.2929 |
1.2883 |
|
-0.13783 |
-0.14419 |
-0.14661 |
-0.15097 |
|
-0.12441 |
-0.12801 |
-0.13396 |
-0.13557 |
| Gap |
0.365 |
0.440 |
0.344 |
0.419 |
| E
|
-7350.247114 |
-7342.011956 |
-7351.563136 |
-7343.186493 |
Table 3.
Forbidden gap of ribbon C2 with and without polarization.The calculations were carried out with B3LYP/6-31G* and the geometry of the non-polarized AGNR. For the sake of comparison, results for ribbons without topological defect are also shown. All energies are in Hartrees, except the gap which is given in eV.
| |
7/9-AGRN |
Without defect 7/7 |
Without defect 9/9 |
| |
Non-Polarized |
Polarized |
Non-Polarized |
Polarized |
Non-Polarized |
Polarized |
| E
|
-7350.24711 |
-7350.25368 |
-6435.41973 |
-6435.44606 |
-8266.25259 |
-8266.28214 |
|
-0.13783 |
-0.14645 |
-0.13097 |
-0.15643 |
-0.13254 |
-0.16135 |
|
-0.12441 |
-0.11571 |
-0.12859 |
-0.10275 |
-0.13032 |
-0.10104 |
| Gap |
0.365 |
0.836 |
0.065 |
1.460 |
0.060 |
1.640 |
|
0.0066 |
0.0263 |
0.0295 |
Table 4.
Forbidden gap of 7/9-AGNR superlattice containing 1, 2, 4 and 8 unit cells (see
Figure 1) as calculated by solving the PPP and Hu Hamiltonians within the unrestricted approximation. Calculations for polarized and non-polarized configurations were done. All results in eV.
Table 4.
Forbidden gap of 7/9-AGNR superlattice containing 1, 2, 4 and 8 unit cells (see
Figure 1) as calculated by solving the PPP and Hu Hamiltonians within the unrestricted approximation. Calculations for polarized and non-polarized configurations were done. All results in eV.
| |
Gap (eV) |
E (eV) |
| |
Non-polarized |
Polarised |
Non-polarized |
Polarised |
|
PPP |
Hu |
PPP |
Hu |
PPP |
Hu |
PPP |
Hu |
| C1 |
3.616 |
0.597 |
* |
4.893 |
-1037.562 |
-894.092 |
* |
-906.222 |
| C2 |
2.085 |
0.173 |
3.035 |
4.841 |
-2078.726 |
-1792.47 |
-2079.175 |
-1815.905 |
| C4 |
1.567 |
0.041 |
2.970 |
4.824 |
-4161.08 |
-3589.361 |
-4162.539 |
-3635.361 |
| C8 |
0.088 |
0.003 |
3.069 |
4.819 |
-8092.643 |
-7183.256 |
-8095.469 |
-7273.997 |
| * Non-existent |
|
Disclaimer/Publisher’s Note: The statements, opinions and data contained in all publications are solely those of the individual author(s) and contributor(s) and not of MDPI and/or the editor(s). MDPI and/or the editor(s) disclaim responsibility for any injury to people or property resulting from any ideas, methods, instructions or products referred to in the content. |
© 2024 by the authors. Licensee MDPI, Basel, Switzerland. This article is an open access article distributed under the terms and conditions of the Creative Commons Attribution (CC BY) license (http://creativecommons.org/licenses/by/4.0/).
