Preprint
Article

An Assessment of Urban Wind Potential and the Stakeholders Involved in Energy Decision-Making

Altmetrics

Downloads

143

Views

190

Comments

0

A peer-reviewed article of this preprint also exists.

Submitted:

14 December 2023

Posted:

15 December 2023

You are already at the latest version

Alerts
Abstract
Urban wind energy has emerged as an attractive source of distributed generation in cities to achieve sustainable development goals. The advance in technologies for the use of urban wind energy has turned this source into an attractive alternative for the decarbonization of cities and the energy transition. The objectives of this work are (1) to identify the potential of wind energy through numerical weather prediction (NWP) data tools and (2) to identify the roles and responsibilities of the stakeholders involved in the decision-making process. A methodology was developed in two phases and applied to a case study in the Dominican Republic. The first phase consisted of estimating the wind energy potential for the 32 provinces at a height of 10 m using open-access geographic reference systems tools provided by NASA. In the second phase, 28 stakeholders were identified through snowball sampling. The Responsible, Accountable, Consult, and Informed (RACI) matrix tool was applied to identify the roles of the 28 institutions addressed at the country level as relevant in the decision-making process for the energy sector. The annual average wind speed and energy potential for each province were determined. It was found 24 provinces have poor potential, below <4.5 m/s. In the northwest and east is where there is the greatest potential, between 4.83 - 6.63 m/s. The population density was established and was observed that the provinces with greater potential are less densely populated. Through 59 interviews 28 institutions were identified and evaluated due to their relevance in decision-making for the implementation of energy projects. The MEM has strongly categorized as “A”, electricity distribution companies as “R”, energy associations and universities as “C”, and educational and justice institutions as “I”.
Keywords: 
Subject: Environmental and Earth Sciences  -   Sustainable Science and Technology

1. Introduction

Decarbonization is a route to sustainable development that has been adopted by 196 countries to achieve stability from global warming. The intention is to reduce greenhouse gas emissions and at the same time promote the production of sustainable energy, as well as the rational use of this in the main economic sectors, for several established deadlines, 2030, 2040 and 2050. This objective is to achieve the goal of average global warming of 2 °C in accordance with the agreements adopted by the United Nations at the Paris conference in 2015, which implies a drop of more than 30% of fossil fuels used in 2023, by 2050 [1]. This achievement is based on promoting generation with solar, wind and hydraulic energy, and antagonistically, completing the exit of generation based on mineral coal and gas and the development of carbon capture technology [2].
Other macroeconomic variables that may affect global sustainability are caused by force majeure events. The recent civil conflict between Russia and Ukraine has influenced the volatility of commodities and has included a geopolitical risk, mainly in Europe [3]. Which has caused an increase in fundamental commodities for the production of fossil energy and, at the same time, has driven European countries to accelerate decarbonization [4,5]. Mainly affected are the countries that are self-sufficient in natural, agricultural and energy resources. The sustainable development goals have imposed the paradigm of being able to live with the limits of the resources of planet, and at the same time with the existing asymmetry in countries, such as the economic development of each one, inequality of available resources, the distribution of the wealth and use of natural resources [6]. Energy is a pillar of the sustainable development goals (SDG), such as SDG7 proposes to ensure access to affordable, reliable energy services by 2030.
In the last decade, solar photovoltaic and wind energy have shown a considerable drop in price, which has allowed these technologies to compete with traditional generation sources, where in the last 5 years on average it has fallen by 8% and 4%, for utility-scale solar and on -shore wind, respectively [7]. According to the renewable energy report from the International Renewable Energy Agency (IRENA), power generation cost in 2022, on weighted average fell by 4% between 2021 and 2022, which corresponds to 3% and 5% for solar photovoltaic and wind energy, respectively [8].
It is essential to adopt decision-making tools that help us identify hidden factors that must be overcome for the adequate implementation of distributed technologies in urban environments to support the energy transition [9]. This energy transition is aimed at changing towards a low-carbon energy system, where it seeks to mainly reduce greenhouse gas emissions, mainly CO2. Therefore, the development and implementation of renewable energy technologies, grid flexibility and energy storage, and the promotion of decentralized energy solutions are required [10].
Cities are transforming towards the concept of Smart Cities, to guide energy profiles, energy efficiency and infrastructure towards a low-carbon energy system, in a safe, sustainable and efficient way through digitalization and artificial intelligence [11,12]. Urban wind energy has grown considerably in the last decade. In 2021, 40 MW of small wind turbines (SWT) were installed in urban locations [13]. There is great potential in cities that can be exploited through SWT integrated into buildings [14]. However most be deemed the conditions of the orography and the obstacles to make a good evaluation of the potential of the resource, which substantially influences the profitability of the project [15].
The trend with the search “urban wind energy” in the Lens database returned 5,299 keywords according to a bibliometric analysis of 8,092 research between 2020 - 2023 [16]. Figure 1 shows the keywords with a co-occurrence greater than 10, where 153 keywords were grouped through the software tool for constructing and visualizing bibliometric networks, coloured according to the most recent ones [17], where the most prominent were humans, economic development, environmental monitoring, China, air pollutants, cities, renewable energy, urbanization and wind. This indicates that this is a hot topic recently.
In response to the growing demand in cities, building-integrated turbines can be a sustainable and strategic solution to reduce the carbon footprint of buildings [18]. According to [19], there is great potential to be exploited in cities in the Caribbean region through the installation of SWT integrated into buildings with competitive levelized electricity costs in the order of 0.1419 USD /MWh at 150 m height [20].
Because urban areas are responsible for up to 70% of GHG emissions due to high economic development and population density [21], urban wind energy can be a clean, safe and environmentally sustainable alternative. to take advantage of this resource in cities [22]. The use of urban wind energy can be carried out through SWT integrated into existing buildings, in surrounding areas or considered in the design of future architectural structures [23]. There is a great potential that can be exploited at the urban level and for this the prospecting of the resource, the selection of the SWT, and the estimation of annual energy production, as well as economic and resilience analyses must be carried out [19].
In dense urban environments, you can have an acceleration of wind flow due to the geometries of buildings at certain heights. And in that case, the kinetic energy of the flow can be captured through SWT [24]. The wind flow pattern through buildings will depend on their shape (rectangular, prismatic, conical, etc.), both roofs and heights [25]. In this sense, the fundamental positioning of the wind turbines integrated into buildings, considering their morphology and the surrounding area, becomes relevant [24,26].
The objective of this research is divided into two phases, the first consists of identifying the urban potential of wind energy at the national level through free access numerical weather prediction (NWP) data tools such as geographic information systems (GIS) provided by NASA's Prediction Of Worldwide Energy Resource (POWER) meteorological datasets [27]. In the second phase, carry out a diagnosis through the Responsible, Accountable, Consult, and Informed (RACI) matrix [28] is presented to determine the roles of institutions (public, private, NGOs, Associations) in the development and promotion of the use of this type of technologies.
To gain a deeper understanding of the decision-making in the energy sector, this research paper analyses the stakeholder’s network in the Dominican Republic. This is the first research of this kind carried out specifically for the energy sector in the country. Decision-makers are defined by the International Atomic Energy Agency as those who identify problems that require a solution and select alternate options from those derived from decision-support studies, taking into account their values and priorities as well as the political and social environment in which they operate [29]. Nevertheless, given the interdependencies among sectors, and the complexity of considering social and environmental repercussions, decision-makers must look for comprehensive solutions that reflect the interests of a larger variety of stakeholders [30].
Given the unpredictability inherent in human conduct, decision-makers must exercise caution [31]. The fact that energy service infrastructure is long-lived and usually built to last decades emphasizes the importance of making the right decisions. In the Dominican Republic, the electricity sector is geared towards meeting market demands, however, decisions come from the supply side and are regulated by the government. Currently, the energy supply is below demand and it is the government institutions that are responsible for providing solutions, so their role should be perfectly defined.
Stakeholders in the energy sector work at various levels of the power hierarchy and face competing interests. As a result, multiple stakeholders will view the issue in different ways, and each decision-maker's interpretation of the "best" solution will vary based on how they perceive risks and uncertainties [32]. Accordingly, decision-making models, techniques, and tools for mapping stakeholder decision-making have been examined more closely [33]. Several of these are covered in the section that follows.
This article is structured as follows, Section 2 presents the proposed method approach for each phases, where first the potential of urban wind energy is identified, and then qualitative and quantitative analysis is established through interviews, snowball sampling and surveys. Section 3 presents the results and discussion of these through the application of the methodology to the case study of the Dominican Republic. Finally, Section 4 presents the conclusions.

2. Materials and Methods

This section is divided into two phases, the first presents an evaluation of the wind potential in the Dominican Republic through free access datasets from numerical climate prediction and its comparison with the data obtained with on-site measurement, from the methodologies presented by Vallejo et al. [19,20,34]. In the second phase, previous methodologies are complemented with the RACI matrix tool to identify the responsible actors and their roles in order to take action or strategies for the proliferation of the use of urban wind energy [28].
Several methodologies have been presented for the comprehensive evaluation of urban wind energy potential. Basically, the methodologies include the stages of selection and characterization of the study area, evaluation of the wind resource through various methods, selection of the most appropriate wind turbine, estimation of annual energy, economic estimation, environmental impact evaluation and the evaluation of resilience [19,35,36]. Recently, tools for strategic planning have been included in existing methodologies, such as the SOWT - AHP analysis, to identify internal and external, positive and negative, factors that can be included in the dissemination and use of this type of distributed technology [34].
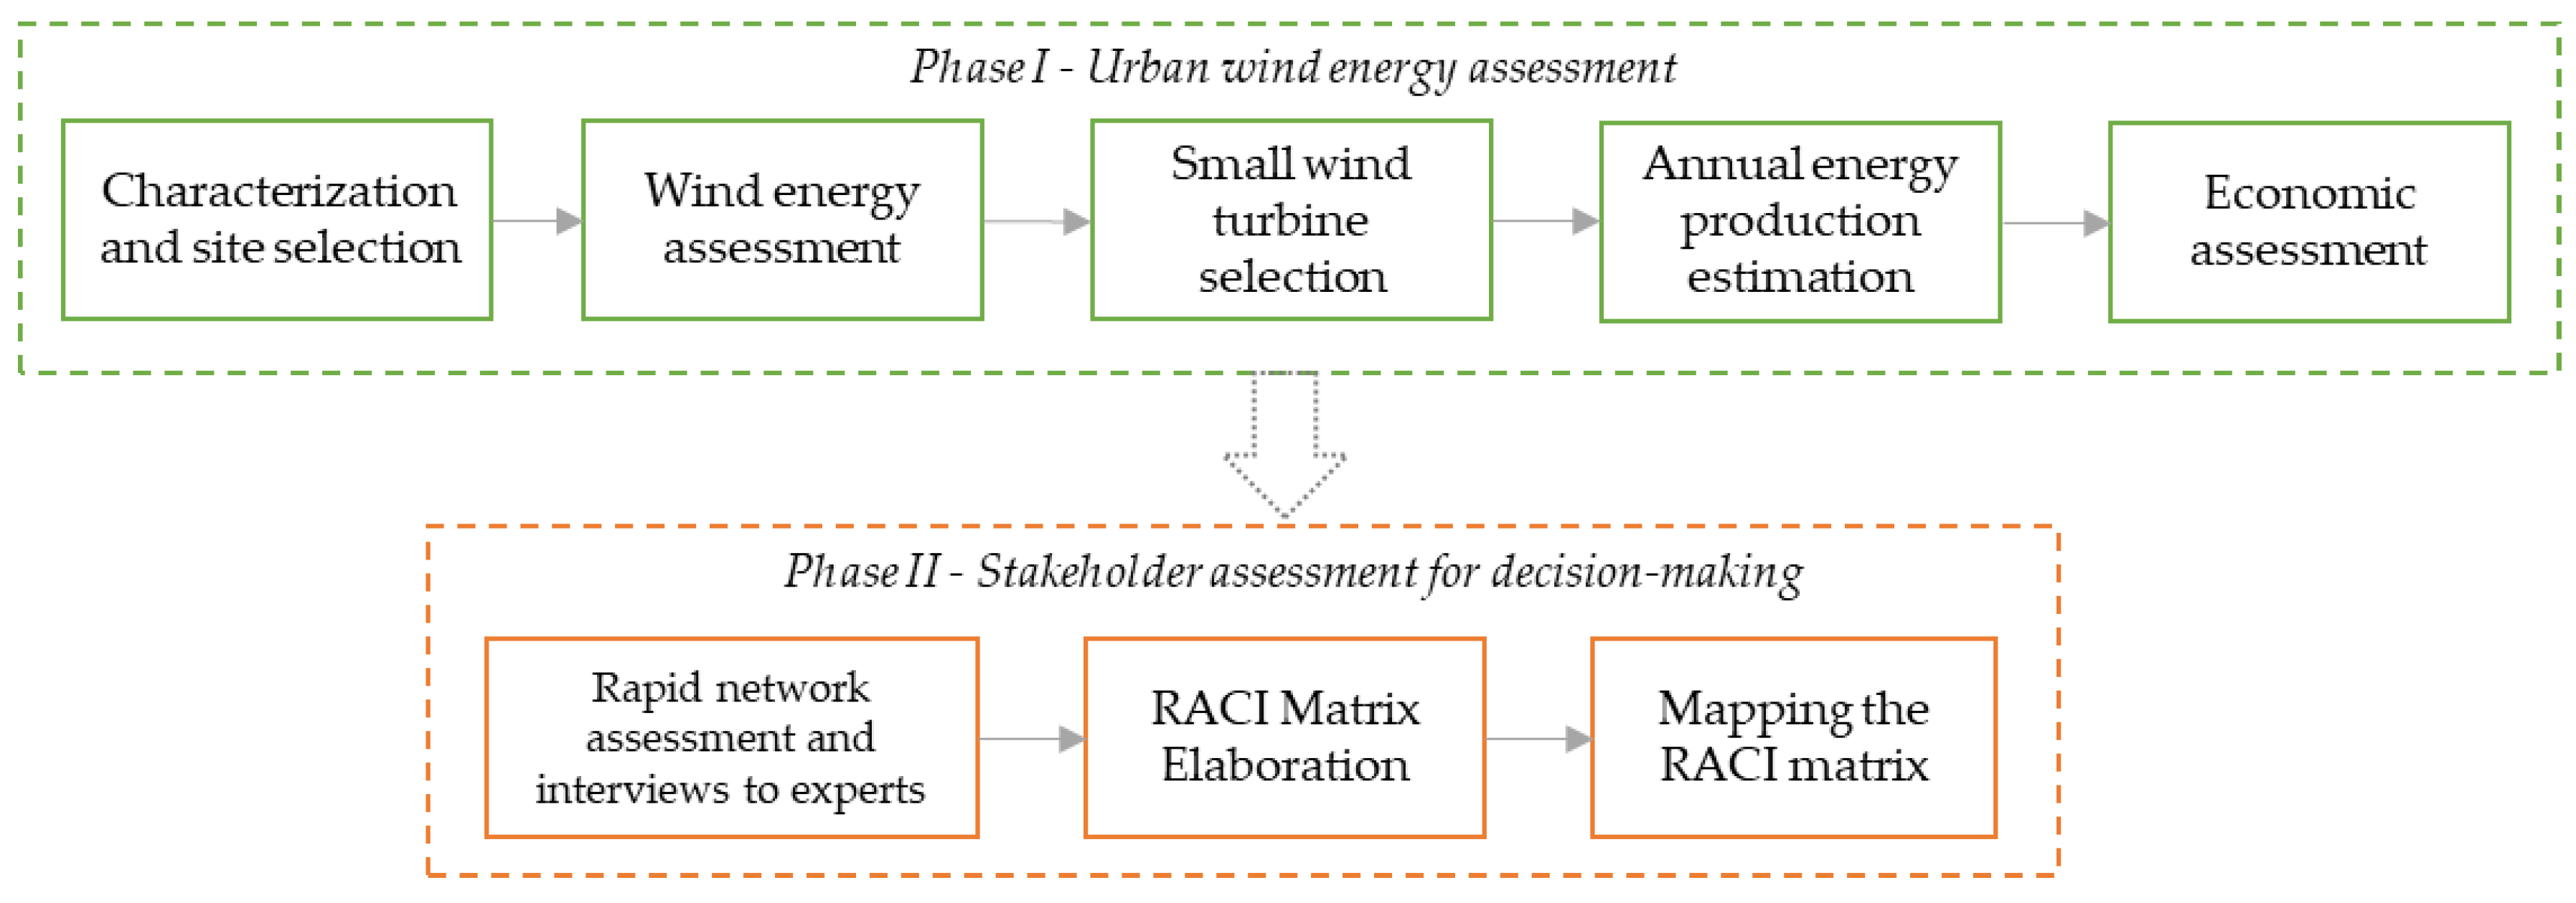
Figure 2 presents the methodology proposed in this research, composed of two main phases, first the evaluation of the potential of urban wind energy and second the identification of the key actors for decision-making in the implementation of the technology and its use in urban environments.
A detailed description of each phase presented in Figure 2, is breakdown below.

Phase 1 – Analysis of urban wind energy

  • Site characterization and selection
The selection and characterization of the study area is an important part of starting the estimation of energy potential. Free access datasets can be used such as geographic reference systems that contain meteorological information, such as NWP and GIS [37]. Usually, these applications provide meteorological parameters, such as wind speed and direction, temperature, barometric pressure, relative humidity, etc., at 10, 50, 100 and 150 m height above the surface and contain a seasonal variation during the year [38]. This approach, with mesoscale resolution, is important to identify potential areas with greater wind kinetic energy rapidly and economically [36]. Recently in Serbia, 16 potential locations for the production of half of the demand with wind energy were determined, through a program of characterization of the potential of wind energy through GIS, that the favourable speed was between 4.9 - 5.8 m/s, where the Eastern plains and the Western mountains, showed better power [39]. On the other hand, as this research is focused on urban locations and not rural ones, the most favourable areas must be identified combined with those with greater urban development. Free access tools such as [40] allow discretizing the number of buildings by their heights in cities and therefore, estimating the space available above the roofs of buildings for the use of wind energy [41].
  • Wind energy analysis
For the analysis of wind energy, several methods are used for prospecting and analysing the resource. The most used to the least frequent [19], where on-site measurement [42,43], with a special and temporary resolution in accordance with the guidelines in the IEC [44]. Followed by numerical climate prediction (NWP), these tools are widely used to relate meteorological variables with geographic maps that are displayed through the geographic information system (GIS), allowing easy and expeditious use in obtaining the potential of the desired renewable resource [45], however, this technique typically overestimates the wind because it does not consider turbulence [46]. Another technique is CFD simulation, which is used to have a more precise spatial resolution and study the behaviour of the wind flow in the area of interest, normally, this studies the phenomenon on the scale of a few meters around the SWTs [47]. From the morphological approach, the NWP, on-site measurement and CFD simulation, study the resource from the regional, neighbourhood and block or street scale, respectively [48]. Other less common methods are the wind tunnel and analytical methods.
The wind tunnel provides interesting information about the wind flow that may not be obtained in a numerical simulation; however, it is more expensive and depends greatly on the homogeneity of the scale model being tested [49,50]. On the other hand, analytical methods have reported results that exceed certain physical limits because they do not adequately take into account some parameters, such as vegetation and terrain orography [51,52]. To make an adequate evaluation of the wind, two or three of the previously mentioned methods must be combined to validate the results of one with another and proceed with the appropriate selection of the small wind turbine, as well as estimate the annual energy production, which influences the profitability indicators of the project.
  • Selection of small wind turbine
Small wind turbines (SWTs) integrated into buildings and peri-urban environments are a generation solution that has been gaining ground in recent years due to their architectural improvements and structural designs, which allow them to be aesthetically integrated into cities [53], [54]. The most suitable SWTs depends on factors such as the cut-in wind speed, the flexibility of its installation and operation, and the aesthetic integration with the environment [55]. According to the IEC standard, the SWT has a capacity ≤ 50 kW and a rotor swept area of ≤ 200 m2 [44]. According to the orientation of the axis, there are horizontal axis turbines (HAWTs) and vertical axis turbines (VAWTs). HAWTs are for environments where the wind flows mostly laminar and has low turbulence, since these turbines must be rotating to be located perpendicular to the wind flow [56]. However, VAWTs are more appropriate for urban environments because they have better aerodynamic performance in high turbulent and low-speed locations due to the unidirectionality of the rotor [57]. In addition, multiple investigations have been presented on the hybridization of VAWTs rotors to improve energy capture over a wide speed spectrum through the combination of drag force and lift [58].
  • Annual energy production estimation
To estimate the annual energy production (AEP), the probability at a given wind speed is determined and this is multiplied by the power that the SWT will produce at that speed. And apart from the frequency probability, it depends on the cube of the average wind speed [59]. In this sense, this is why it is vital to make a good estimate of wind speed as a robust spatial and temporal detail for an adequate feasibility evaluation. Rezaeiha et al. [23,26] present the process for evaluating the AEP, which will be adopted in this work.
  • Economic evaluation
To have a vision of the feasibility of a project, the economic component is crucial. The levelized price of electricity (LCOE) consists of the discount to the present value of the entire cost of generation energy (capital cost, O&M, etc.), divided by the energy production for that same period, with previously determined financial parameters, interest rate and terms [41,60]. Vallejo et al. [20] have analysed the cost of SWTs integrated into high-rise building in the capital of the Dominican Republic, where they have reported LCOE from 0.4794 to 0.1419 USD/kWh, for heights of 40 - 150 m, respectively. These prices being competitive for the conditions of that wholesale electricity market.
As mentioned above, these five steps for the evaluation of urban wind energy have been well presented in the research presented by [19,23,35,36]. The intention of this subsection is to provide a concise context about each steps of the first phase of the proposed methodology, and to be complemented with the analytical part of the previously indicated works.

Phase 2 – Stakeholder analysis through RACI matrix

Stakeholder analysis is a crucial tool in the energy sector for understanding and managing the interests, concerns, and influence of various stakeholders involved in energy projects. Stakeholder analysis tools serve the following purposes: I) to identify decision-makers; II) to comprehend the various stakeholders' roles; and III) to assist in providing information on decision-making processes, power dynamics, and stakeholder interests [61,62].
An approach for quantitative analysis of the relationships between actors is stakeholder analysis, which involves understanding stakeholders with various degrees of expertise and priorities. Stakeholder analysis can be used to improve the transparency and equity of decision-making in development projects by gaining an inventory of those who would be involved in decision-making, assessing their significance based on their level of influence and interest in a specific outcome, mapping the relationships between the actors, and determining their potential for forming alliances [63]. In the energy sector, stakeholders can include government agencies, regulatory bodies, energy companies, local communities, environmental organizations, and consumers. Each stakeholder group may have different priorities, expectations, and potential impacts on energy projects.
In the context of the energy sector, stakeholder analysis has been used for a variety of applications such as an analysis of Dutch stakeholder views on deep geothermal energy [64], analysis of diesel tax reform in Spain [65], an analysis for use of marginal land for biomass production in Denmark [66], analysis of China’s energy conservation campaign [67] and others. It has ranged from societal dialogue, politically viable energy transition, government’s policy-making process to optimal environmental use of the land to achieve multifunctional benefits. Stakeholder analysis falls into one of two categories: either a top-down "analytical categorization" or a bottom-up "reconstructive method" [68]. Stakeholder classifications that are defined by the stakeholders themselves during the stakeholder mapping process are known as the reconstructive method. Analytical categorization, on the other hand, refers to the application of pre-set criteria, such as legitimacy and influence, cooperation and competition, cooperation and threat, and interest and influence [69]. Matrix analysis is frequently used for this [70].
The RACI matrix is one popular method for characterizing stakeholder roles and uses interest and influence to classify stakeholders through a “responsibility assignment matrix” [71]. The RACI model distributes authority, making power dynamics explicit by defining roles in a task, project or management activity [72]. It was selected for this study, as it was seen as more appropriate for broadly categorizing relative levels of importance in decision-making processes. It is also intuitive, can be explained easily and is readily understood by people with no prior familiarity with the RACI model. RACI refers to:
Responsible: Someone who bears the responsibility of seeing a task through to completion.
Accountable: This means that everyone in the team is accountable for whatever work that is assigned to them. Additionally, this person is able to decide on matters pertaining to the assignment. This person is accountable for all of his decisions, which makes this role extremely important.
Consulted: As they will be responsible for providing information on the project under work, those who are selected for this role possess expertise in their respective fields.
Informed: Those who receive regular updates on developments.
The RACI matrix has been used as a Six Sigma tool to identify those involved in the process and their roles in a productivity process corresponding to systems with uncertainty through the define, measure, analyse, improve and control (DMAIC) approach to the implementation of ISO 50001 [73]. This tool is very useful to be implemented in continuous process improvement, both in industrial aspects and in business processes [74].
The use of the RACI matrix is recommended to define the tasks and responsibilities of those involved in a project, as well as follow up on specific tasks and document clear and precise traceability. This prevents role confusion and ensures balance among all members of the project, and allows assigning the corresponding progress in the process of completing each member's tasks [75]. Recently, a RACI matrix was developed to map the different actors involved in the process of using building information modelling for the evaluation of the certification of sustainable buildings in The Netherlands and the potential impact of these [76].
This research presents three stages to develop the implementation of the RACI matrix, which were 1) the determination of the organizations and their role according to interviews and electronic surveys, 2) the parameterization of valuation of the respondents according to their judgments in the people surveyed and interviewed for the identification of the roles of each of those involved, and 3) the mapping of the roles of the organizations [77]. More detailed explanation of the overall research design is provided in the following steps.
  • Rapid network assessment and interviews to experts
To identify the key decision-makers and their motivations of the potential utilisation of urban wind energy. An egocentric network mapping technique was used to accomplish this. Egocentric network mapping is a method used in social network analysis to study the connections and relationships of a single individual, referred to as the "ego," within their immediate social network [78]. To gather information on stakeholder roles through primary interviews, network mapping techniques and the RACI matrix are integrated. More precisely, the following activities were conducted: A) a rapid network assessment (RNA) and B) an online survey. This step-by-step approach was designed to make it possible for pertinent stakeholders to encourage a larger group of actors to participate in the survey, starting with a known that represented both government-and market-led approaches. After the identified stakeholders all of whom are detailed in full below, who were junior, middle, or senior managers, were asked to identify other pertinent figures in the energy sector as part of the RNA, the participants in the online survey were notified. This method allowed for the identification and inclusion of any actor whether a corporate entity or a government agency that was thought to be a pertinent decision-maker. This procedure is explained in more detail below.
The RNA was created with the intention of producing a preliminary roster of key players for the energy sector decision-making processes in the Dominican Republic. From an initial list of stakeholders in the Ministry of Energy, the Electricity Generation and Transmission Company, the Electricity Distribution and Supply Authority, Power Producers, Universities, and Research Canters, NGO’s, people pertinent to electricity supply decisions and policy making were identified to take part in this process. Based on the stakeholders who deal with electrification projects the initial list of respondents for the online survey was completed. This procedure is call "snowball sampling". There were found to be 59 stakeholders in all. After the RNA, an online survey was carried out. This survey was designed to use the RACI matrix to determine the typical role of important stakeholders in decision-making. A total of 59 participants, representing a variety of organisational professional and expertise background, as shown in Table 1. Where 81% are engineers (electrical, mechanical, civil, Etc.), 12% are lawyers who work directly in the energy and/or sustainability sector, and 7% correspond to the business and architecture area. At a general level, the experience is 16 years.
  • RACI Matrix Elaboration
To understand the relative importance of different stakeholders, the physical placement of the different stakeholders in the form of post-it notes on the RACI matrix was converted into X and Y coordinates, whereby overall coordinates for each stakeholder were calculated by averaging the given coordinates for each stakeholder from all the interviewees [28]. Each set of coordinates in the RACI matrix was transformed to a single digit score, S. In the transformation:
Accountable stakeholder (quadrant I) was awarded a score of 4. As show in Eq. 1. Where X and Y are the coordinates of the stakeholder in the RACI matrix.
= 4 0.5 ( 1 X ) 2 + 9 ( 1 Y ) 2
Responsible stakeholder (quadrant II) was awarded a score of 3. As show in Eq. 2.
S = 4 0.5 ( 1 X ) 2 + 4 ( 1 Y ) 2
Consulted stakeholder (quadrant III) was awarded a score of 2. As show in Eq. 3.
S = 1 0.5 ( 1 X ) 2 + 4 ( 1 Y ) 2
Informed stakeholder (quadrant IV) was awarded a score of 1. As show in Eq. 4.
S = 1 0.5 ( 1 X ) 2 + 9 ( 1 Y ) 2
The score for each stakeholder was normalised by the fraction of interviews that identified the stakeholder as relevant to decision-making in the role given by the interviewees, as shown in Eq. 5, where M is the number of interviews and Sabs is the average score.
S a b s = S M 59
  • Mapping the RACI matrix
Finally, a mapping of the results is presented graphically in order to compare the assignment of the roles of each of the institutions according to the judgment of the interviewees. Likewise, the importance of each of these institutions in the role can be visualized assigned. This mapping serves as practical and guideline representations that can be developed around RACI analysis.

3. Results and discussion

This research aims to present the evaluation of urban wind potential with the complement of a decision-making tool for the identification of key actors, such as the RACI Matrix. A methodology has been proposed that contains two phases, first, the determination of urban wind potential through free access data from the NWP, with a spatial resolution of the mesoscale to quickly identify the region with the best potential. And in the second phase, an analysis of the RACI matrix is introduced for the first time to the existing methodologies for the study of urban wind potential. The RACI matrix has been applied in various organisational applications of heterogeneous work groups to identify key actors and their roles for timely decision making.
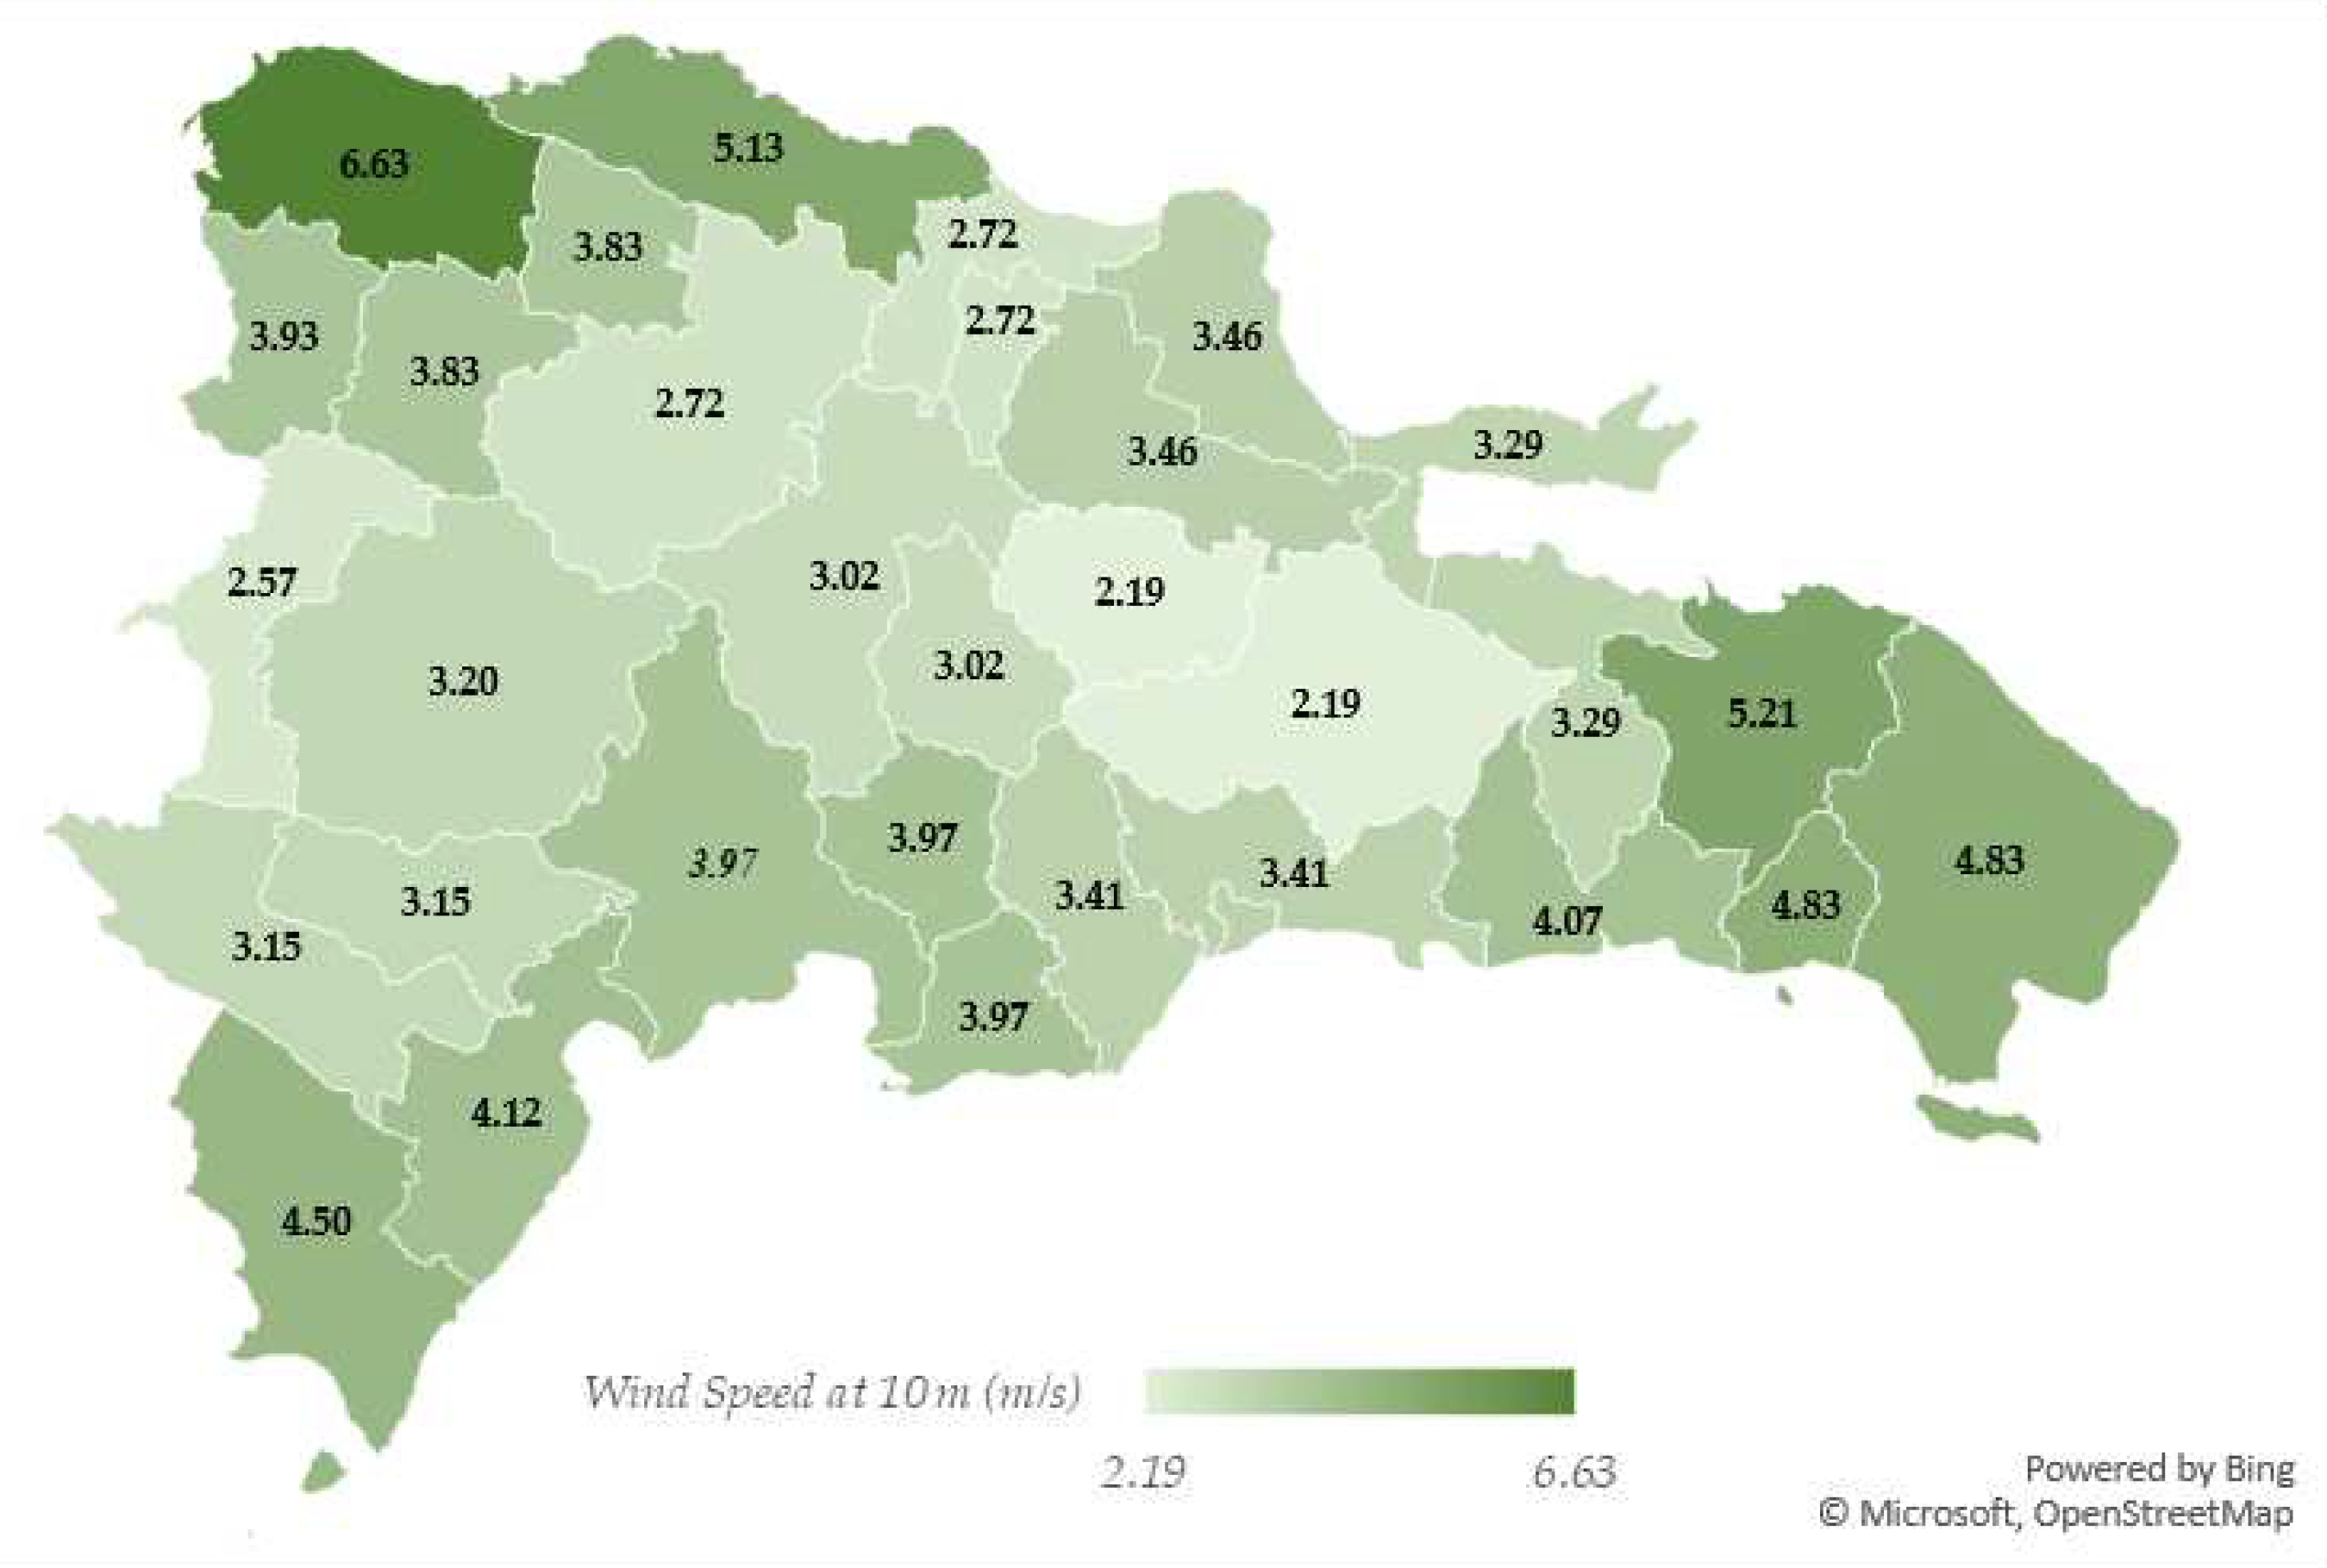
Table 2 presents the urban potential of wind energy in the Dominican Republic. Through the data available from the geographic information systems provided by NASA's Prediction Of Worldwide Energy Resource (POWER) meteorological datasets. The 32 provinces of the country have been selected to determine the urban wind potential at 10 m height above the ground level. The most urbanized location in each province has been selected in order to analyse the urban potential. The datasets analysed is between 2011 and 2021. The provinces with the greatest potential are Montecristi, El Seibo, Puerto Plata, La Altagracia, La Romana and Pedernales, for average wind speeds 6.63, 5.21, 5.13, 4.83, 4.83 and 4.50 m/s. In these provinces there is an estimated potential between 1638 and 3045 kWh/y. The predominant wind direction is 86° with respect to the north. Figure 3 shows graphically the wind speed map at 10 m height for the entire country. In the provinces with greater colour intensity, greater energy will also be produced annually, because the energy produced depends cubed on the average wind speed and the SWTs power curve.
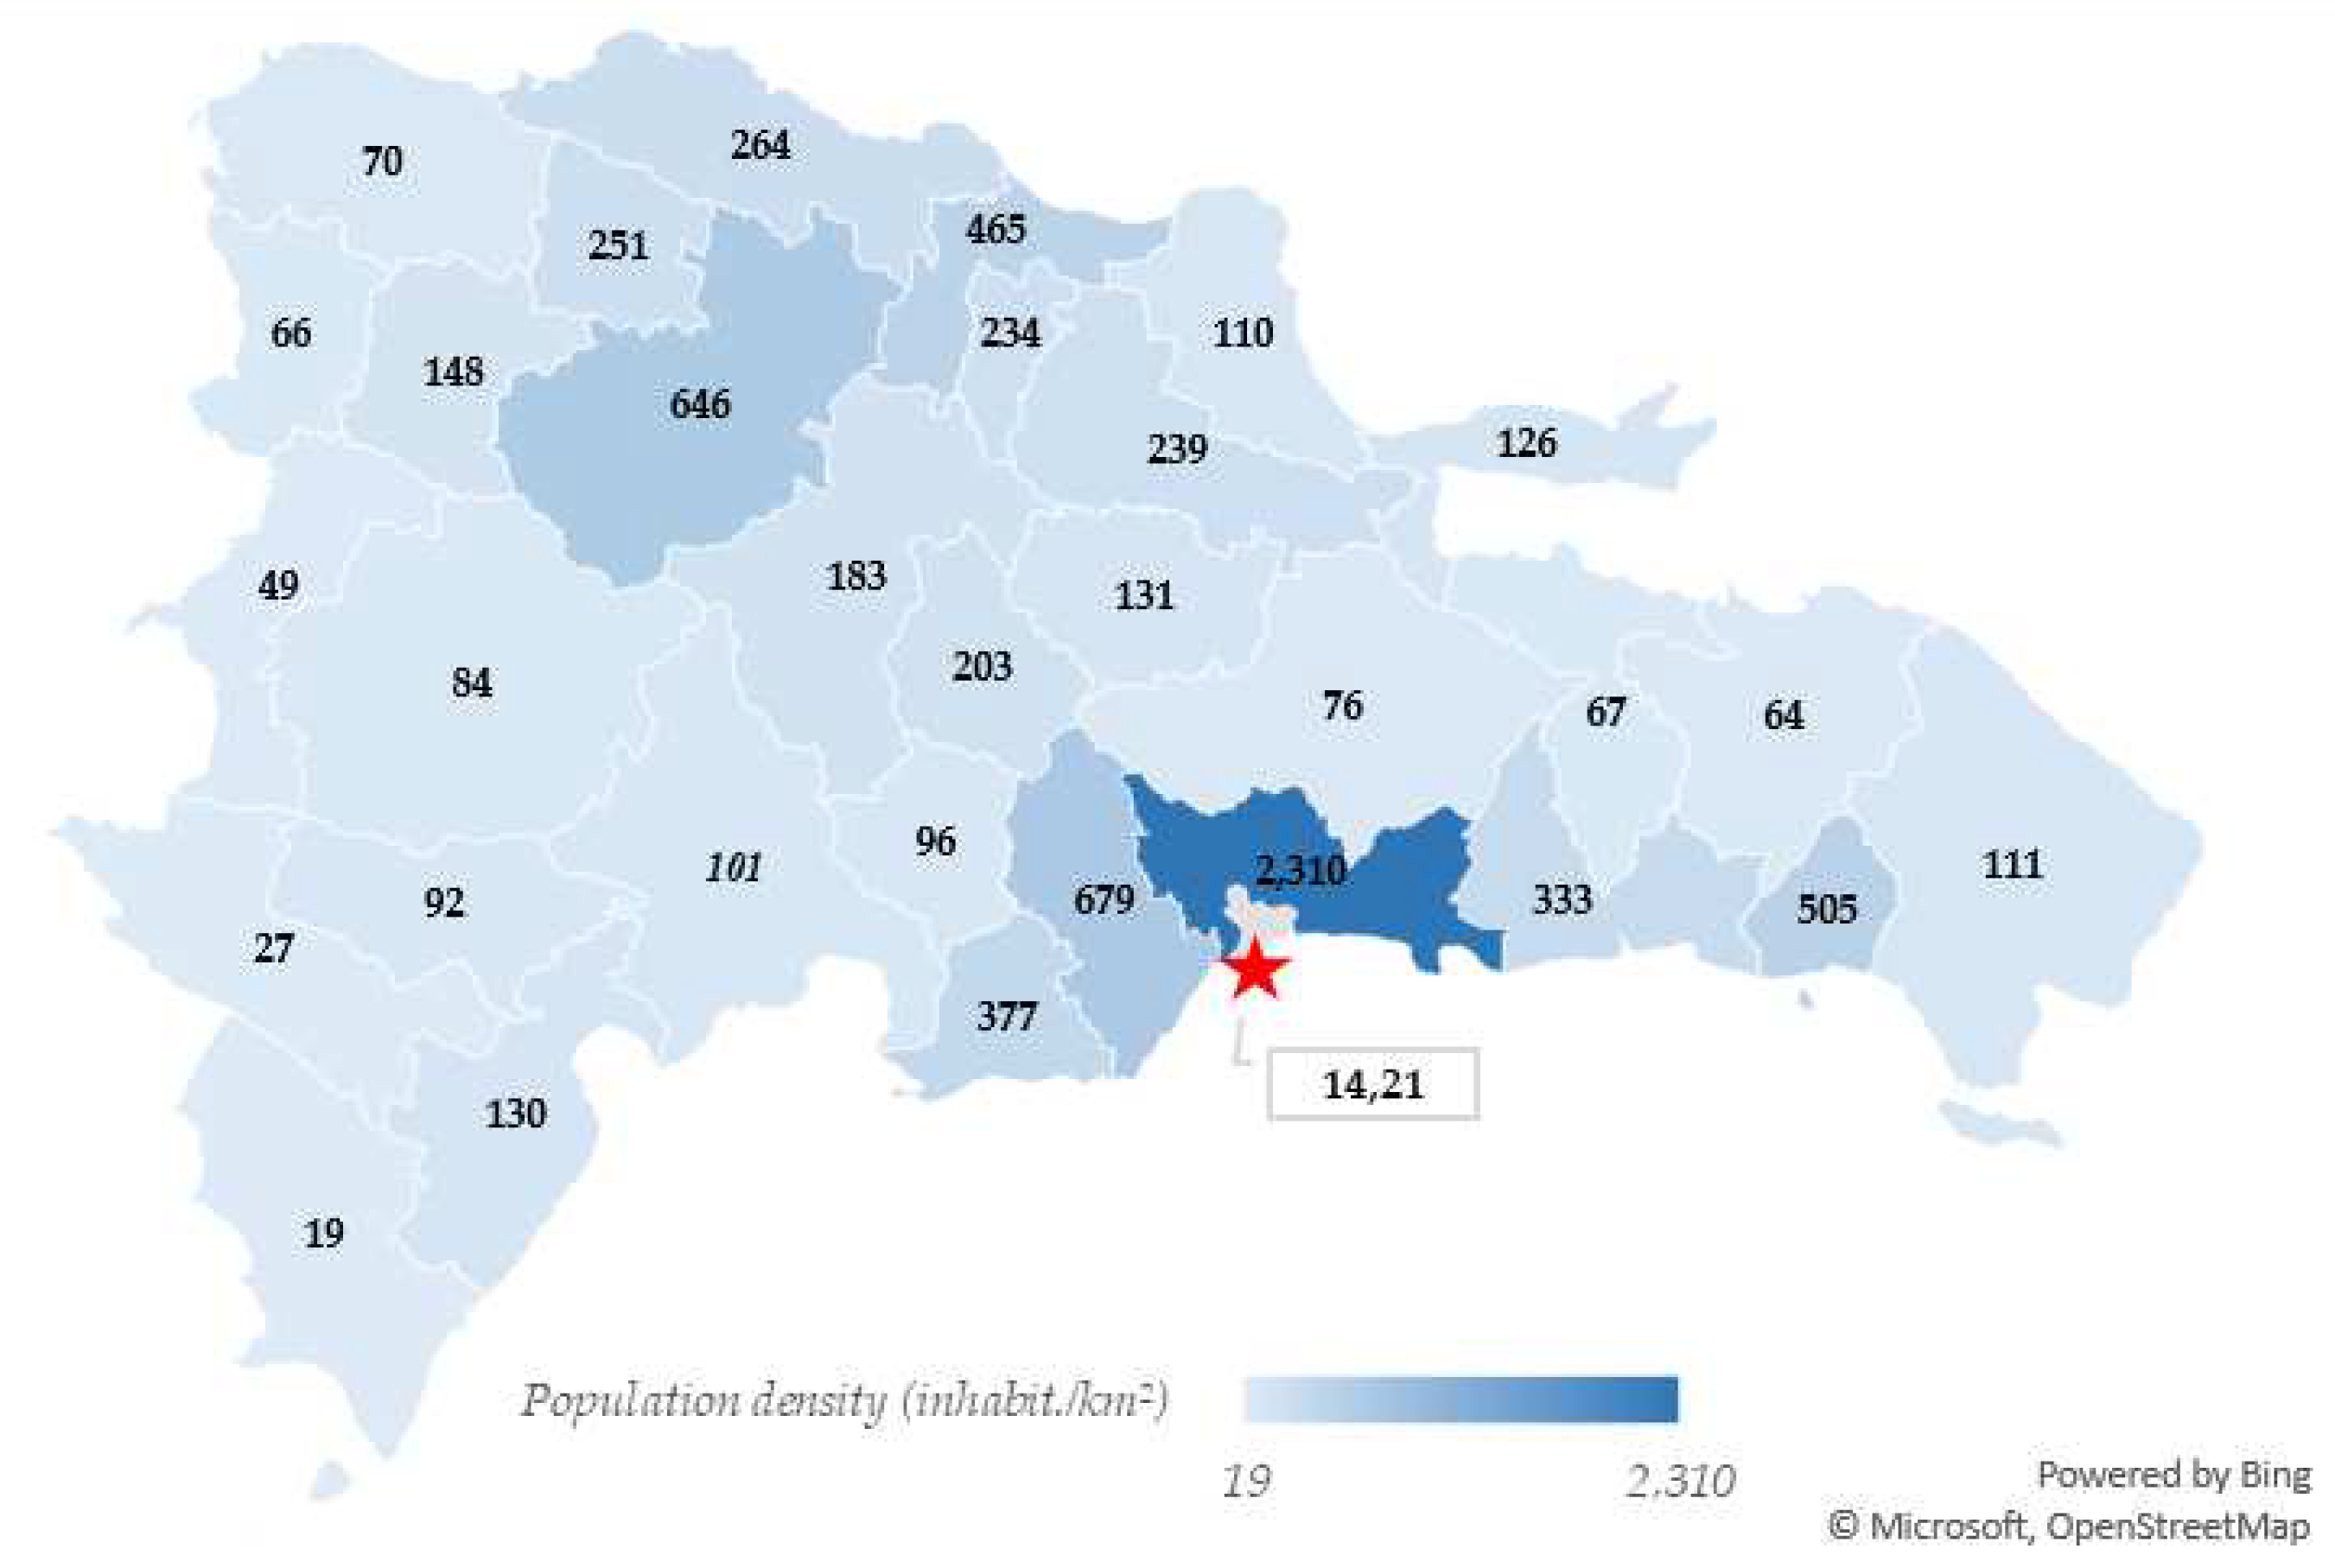
Because it is important to discretize the provinces with the best wind energy power, it is also important to establish a relationship between the most favourable provinces and the most urban ones. Typically, it has been observed that the provinces where there is great wind potential are the least urban, that is, they have greater rurality. In that sense, Table 2 presents the area of each province and the population, to determine a population density index (inhabit. /km²). Figure 4 shows the population density map that can be compared with the urban wind potential map in Figure 3. For example, in the northwest part of both maps, Montecristi has 6.63 m/s at 10 m above the ground, however, population density is 70 inhabitants/km², which is 32nd with the highest wind power and the 7th with the lowest population density. For the National District, a “star” was placed on the map so that the comparison can be seen on the colour scale of the other 31 provinces, because the density of the National District was 14,216 inhabitants/km², while the average of the other 31 provinces is 266 inhabitants/km². Figure 4 shows that the five most densely populated provinces are the National District, Santo Domingo, San Cristóbal, Santiago and La Romana, for a density from 14,216 to 505 inhabitants/km², respectively.
Because GIS does not consider the aspects of orography and roughness of the terrain, this wide spatial resolution technique must be validated through on-site measurement for small-scale evaluation, that is, in the order of micro scale, few meters around the SWTs. [79]. It is recommended to validate the results with on-site measurement campaigns because estimation errors of the order of 33% have been reported, where GIS usually overestimates wind speed [80]. However, as height above ground level can be gained, SWTs can produce more energy because they will be exposed to a greater frequency of high wind speeds, and this makes these types of distributed energy projects more economic. Between buildings 100 - 150 m high, the levelized cost of energy becomes more competitive [20]. No provinces with exceptional potential were identified, only Montecristi is considered very good (5.4-6.7 m/s). El Seibo, La Altagracia, La Romana, Pedernales and Puerto Plata have a moderate potential (4.5-5.4 m/s), and the rest have poor potential (<4.5 m/s) [81].
This research aims to integrate decision-making tools into existing methodologies for the characterization of urban wind potential with the purpose of identifying key actors and their roles in decision-making that encourage the study, analysis and possible use of this technology. Twenty-eight institutions were identified, both public and private, for-profit, and non-profit, and with direct or indirect relationship in energy sector. An electronic survey form was sent to 132 professionals from various disciplines. Table 3 shows a summary of 28 institutions assessed by 59 professionals. The online surveys were analysed using an Excel spreadsheet.
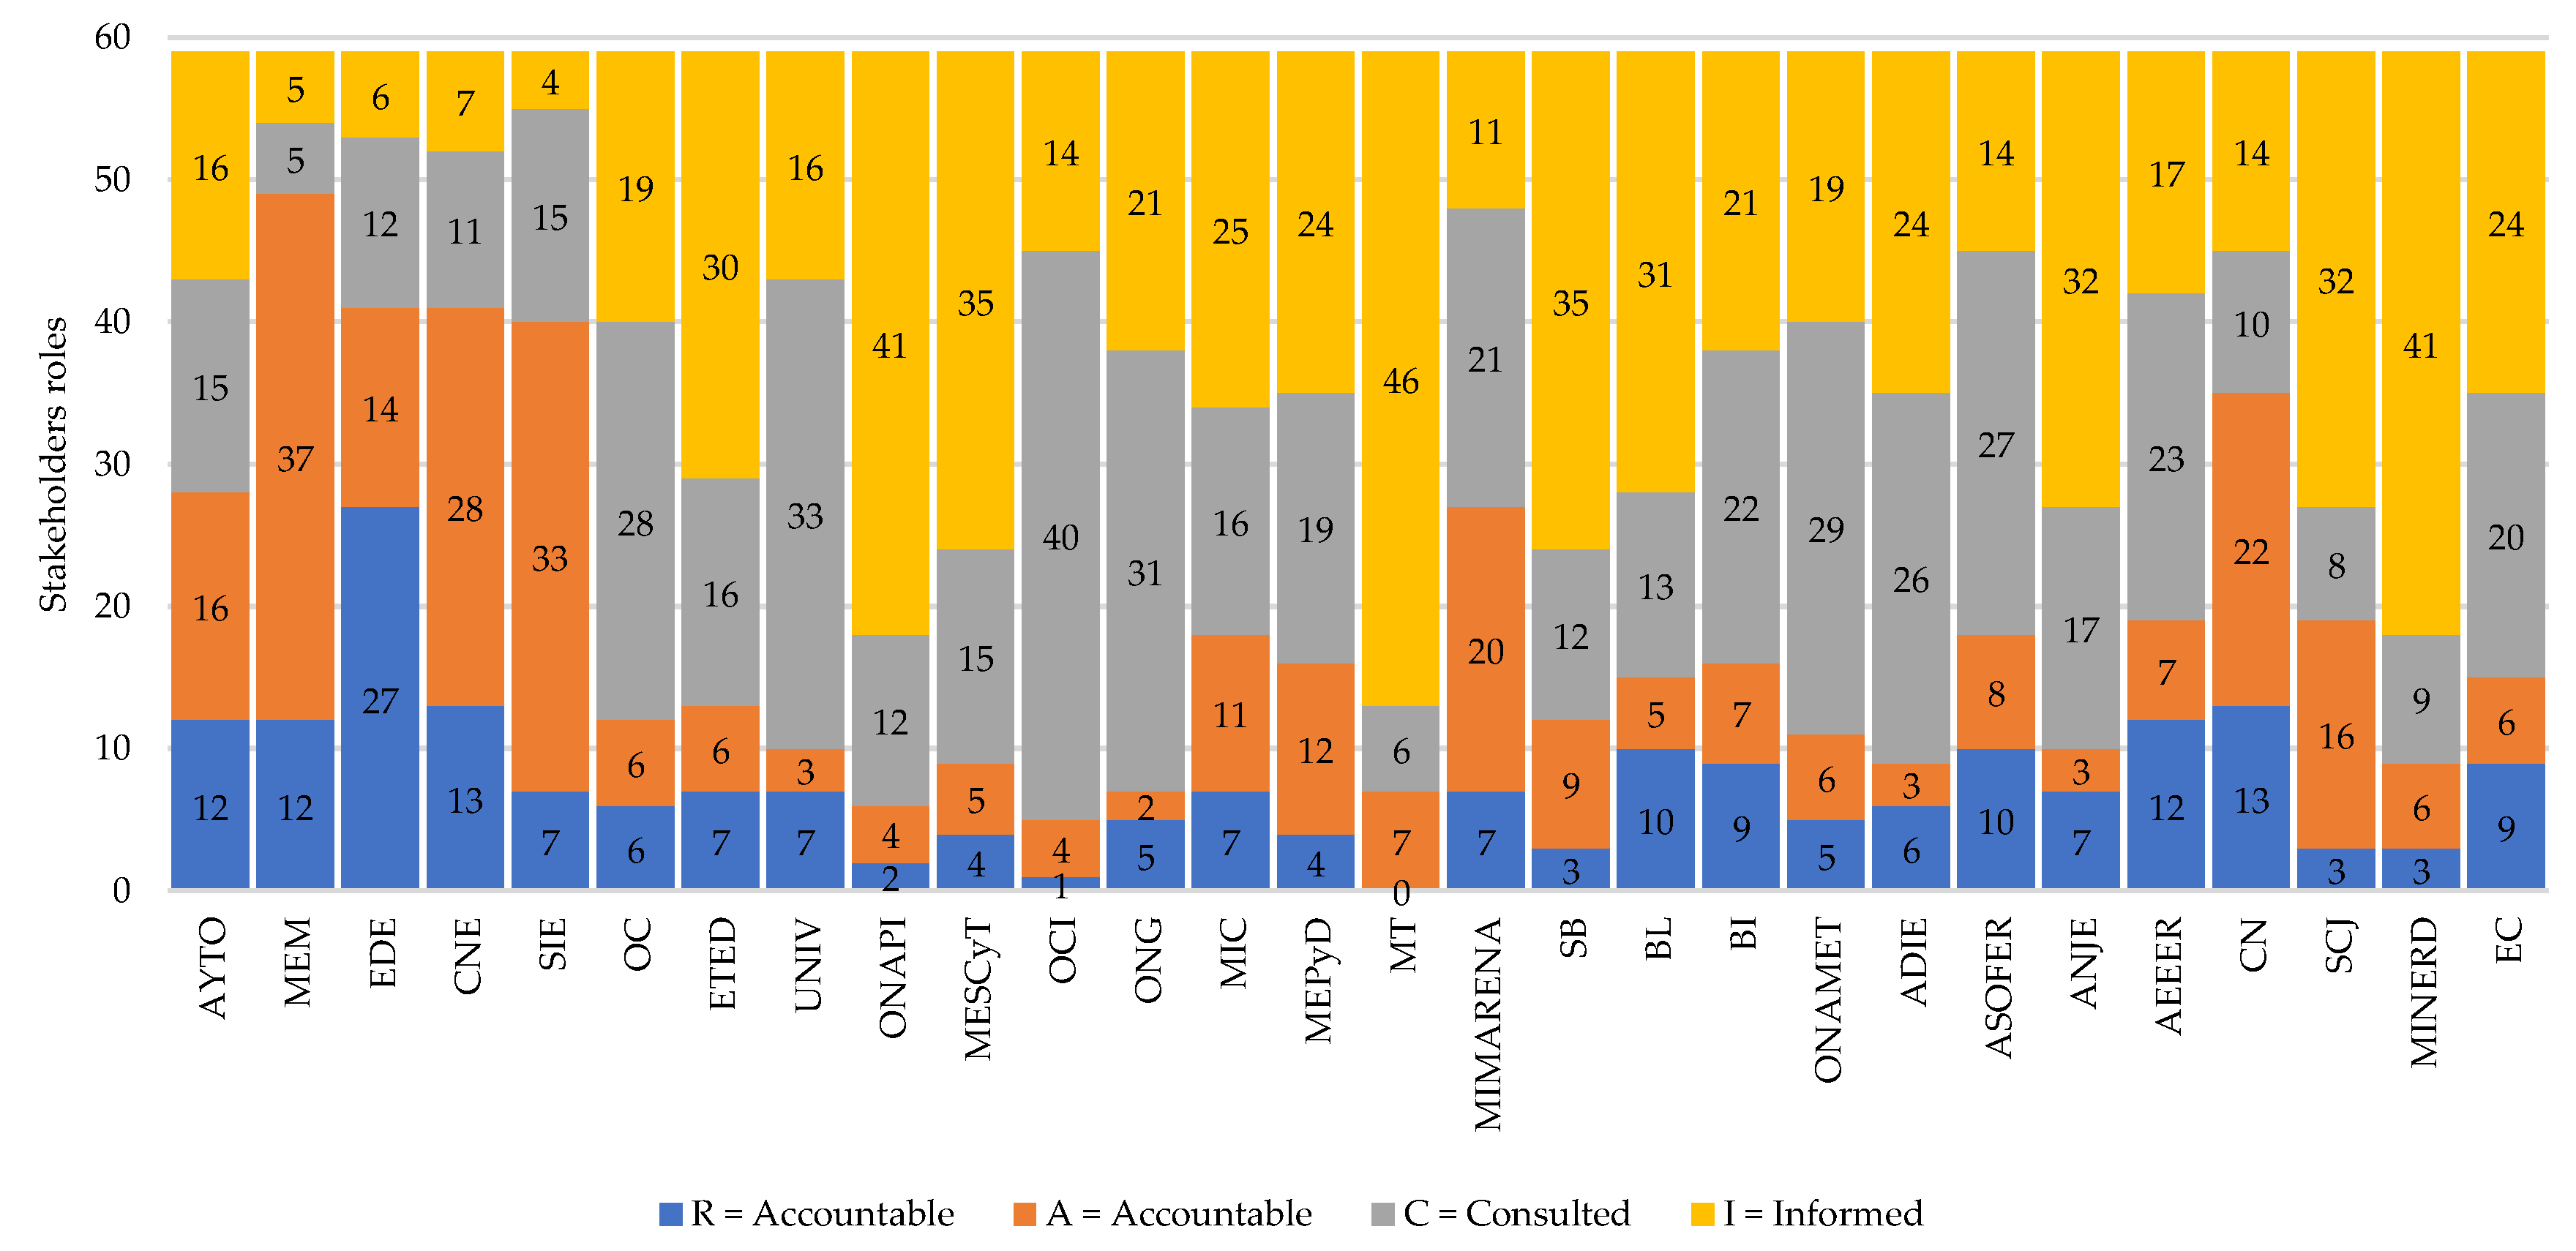
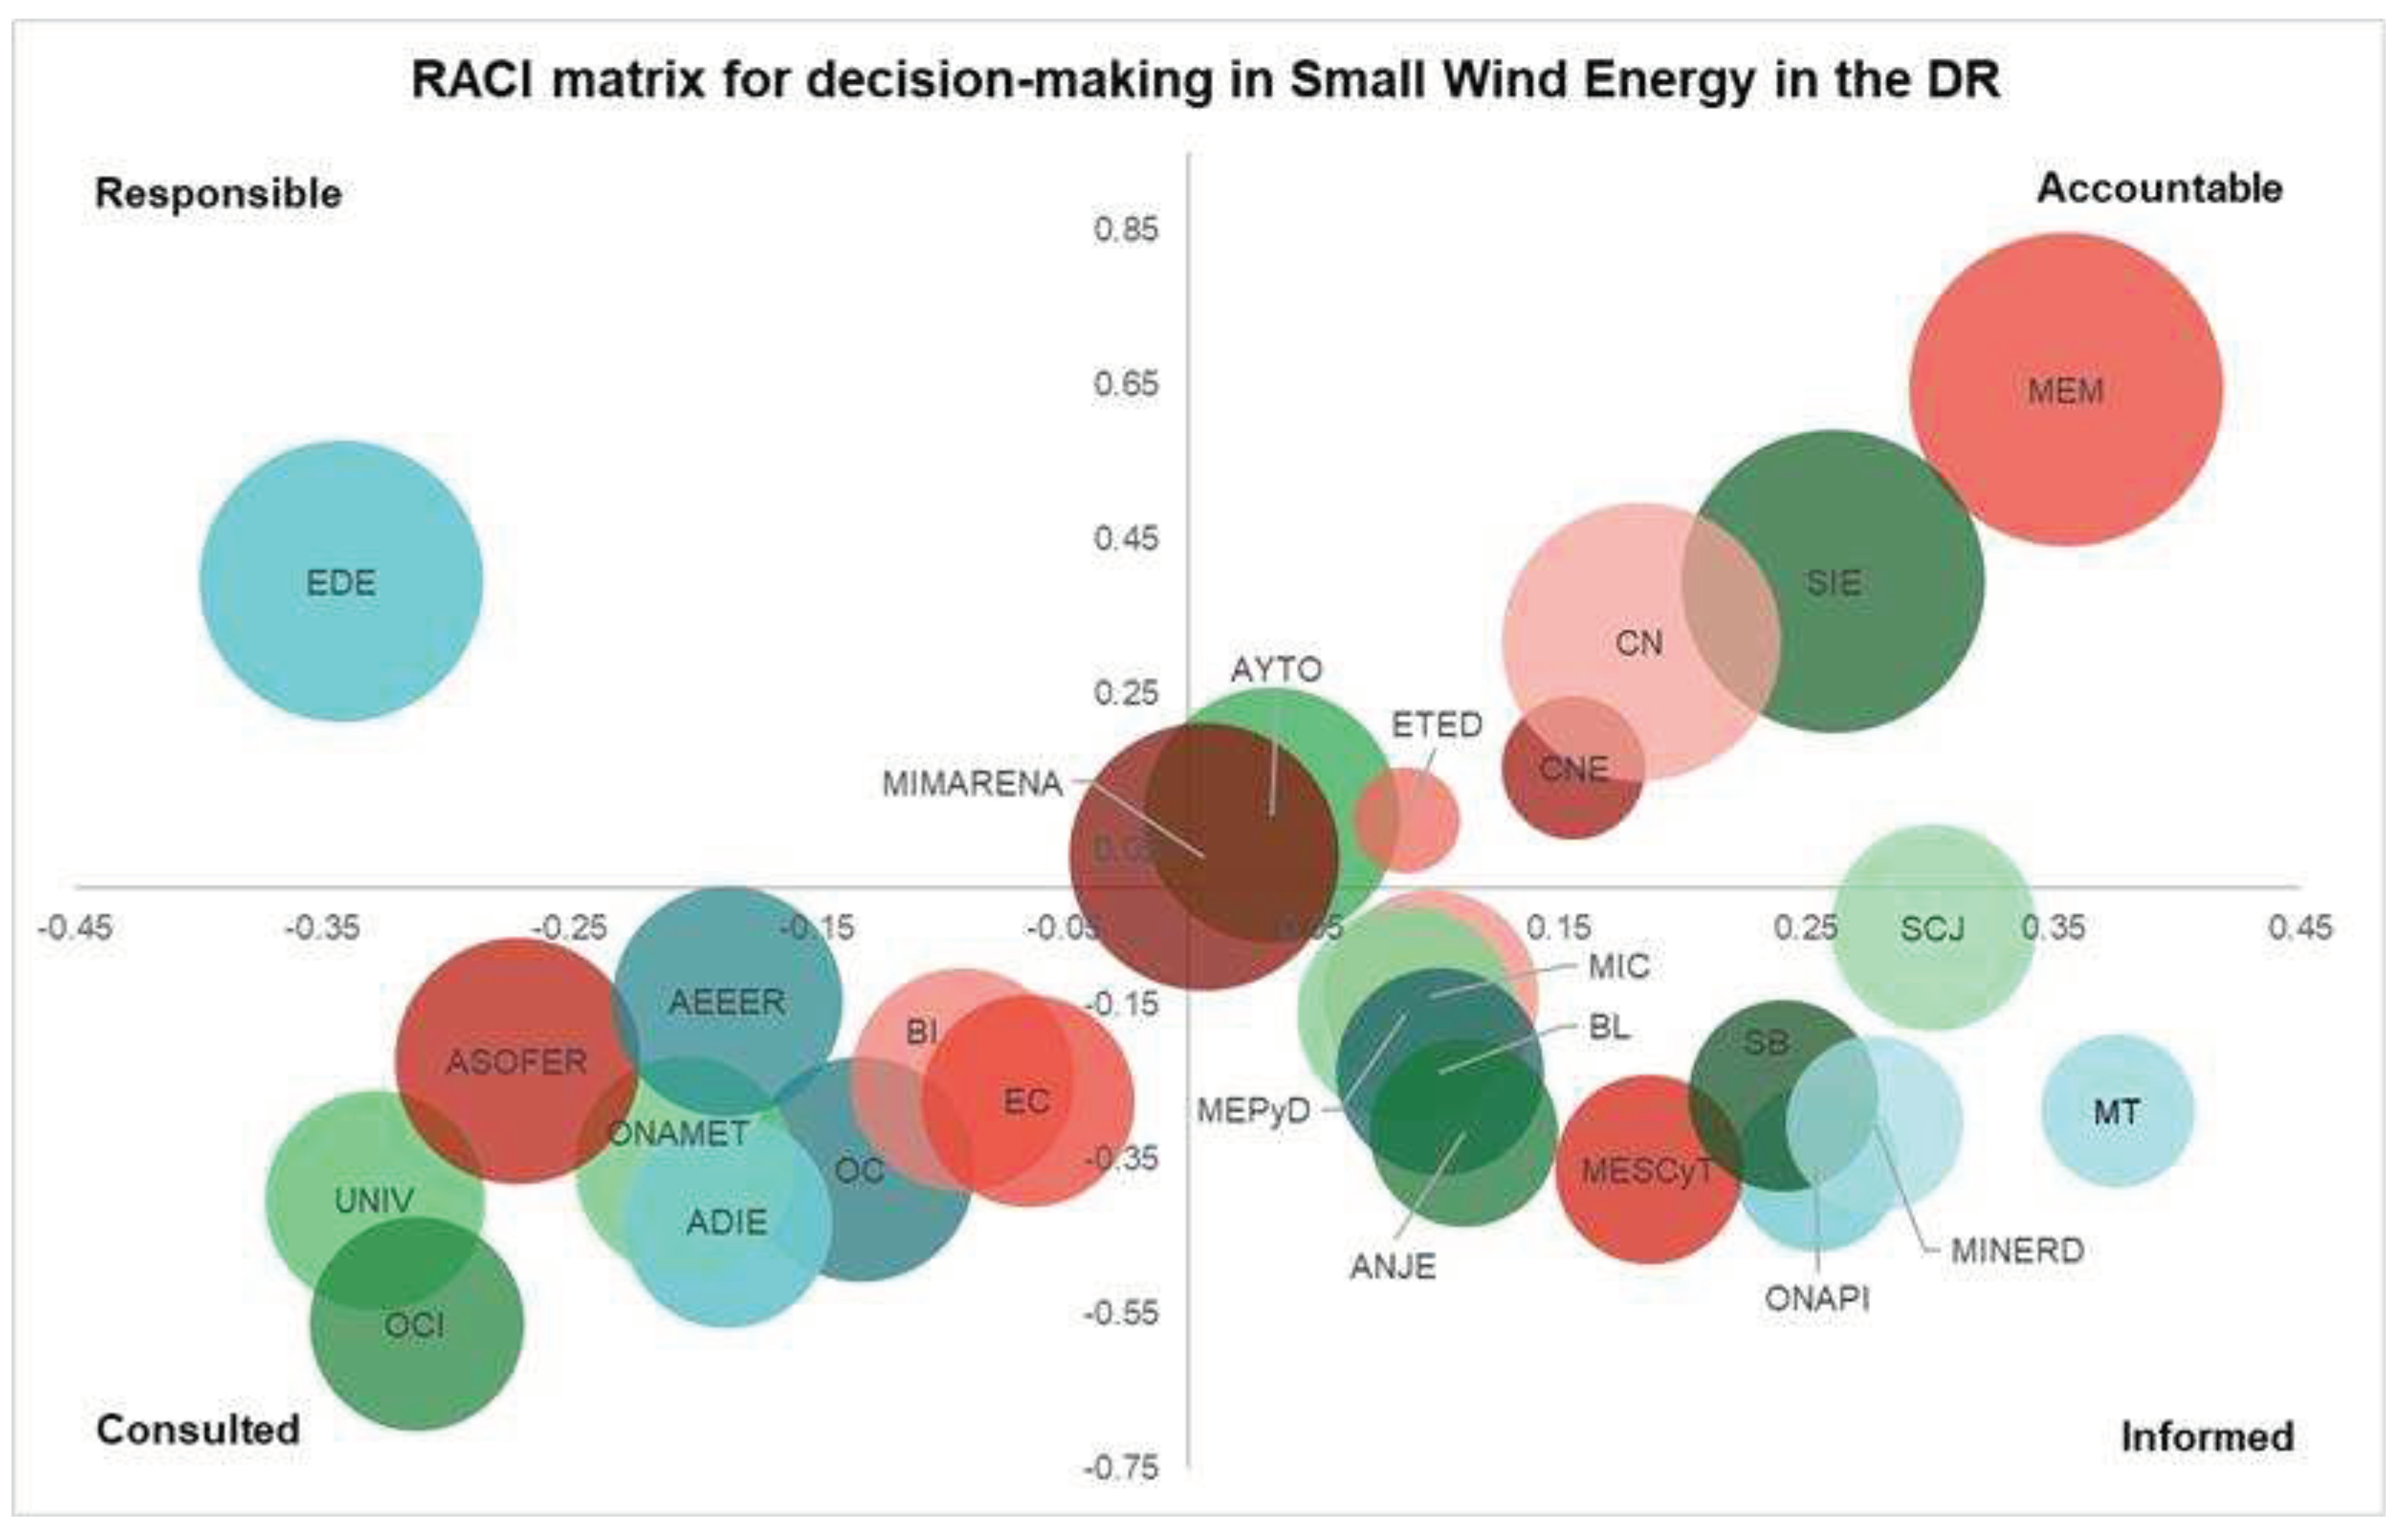
Those participating in the survey selected the role, among R, A, C and I, that they considered for each institution, and then they should assign a value of importance to said role, in a range of 1-5. Figure 5 shows the quantity of roles assignment for each by participants. For example, the electricity distribution company (EDE) obtained a higher share as “R”, 46%, since 27 people consider that the EDE are R.
The scale of importance of a role to a specific institution is variable, since the EDE can be “R”, and the level of importance can vary from 1 to 5 (20%-100%). With this two-step qualification method, the positioning in the quadrant corresponding to the RACI matrix and the intensity with which the respondent considers that he or she should be in said quadrant are obtained. After the respondent assigns a role in the RACI matrix to the institution, it is required to establish Score, calculated as the product between the value of the RACI letters and the degree of relevance of (20%-100%). Table 3 presents the coordinate for each institution according to the judgment of all respondents in the X and Y axis, and Z represents the Score, that is, the weighted importance intensity value.
Figure 6 presents the RACI matrix roles of the 28 institutions evaluated by 59 experts. According to the experts' judgment, in quadrant A, there are companies in the electricity sector as the protagonists in the planning, coordination and supervision of this time of distribution technologies. In the R quadrant, Distributor companies are observed, and a shortage of responsible companies according to the experts' judgment. In the C quadrant, naturally, there are academic institutions, and associations of renewable energy and energy efficiency businesses, as well as banks. And finally, in quadrant I, there are the ministries related to labour, education, commerce, and local banking. MIMARENA (Ministry of Environment and Natural Resources) and the City Councils have a role of A, towards the centre of the cartesian plane, this is what indicates that it had a more varied assessment from the experts' point of view.
Another 10 institutions emerged as recommendations from 16 surveyed experts. The most prominent are the Ministry of Public Works and Communications (31%), General Directorate of Customs (13%), Dominican Institute of Civil Aviation (13%) and other Ministries such as Treasury, internal taxes, and climate change council (18%). The rest of the institutions are of a national security cluster (25%).

4. Conclusions

Urban wind energy has emerged as a promising source of distributed generation in cities to achieve sustainable development goals. The advancements in technology have made urban wind energy a viable option for decarbonizing cities and transitioning to cleaner energy sources. The study focused on assessing the wind energy potential in the Dominican Republic using numerical weather prediction (NWP) data tools. The results showed that some provinces have poor wind potential, while others, particularly in the northwest and east, have significant potential with average wind speeds ranging from 4.83 to 6.63 m/s. The research also identified and analysed the stakeholders involved in the decision-making process related to energy projects. Twenty-eight institutions were identified through interviews, and their roles were evaluated using the Responsible, Accountable, Consult, and Informed (RACI) matrix. The identified stakeholders included electricity distribution companies, energy associations, universities, and educational and justice institutions. The findings revealed the importance of considering various stakeholders' perspectives and involvement in decision-making processes for the effective implementation of urban wind energy projects. This inclusive approach ensures that decisions align with the interests and priorities of different stakeholders and considers the social, environmental, and economic aspects of energy projects.
The study emphasized the need for decision-making tools that can identify hidden factors and overcome challenges in implementing distributed technologies in urban environments. These tools play a crucial role in supporting the energy transition and facilitating the adoption of renewable energy technologies, grid flexibility, and decentralized energy solutions. The research highlighted the potential of building-integrated wind turbines as a sustainable solution for reducing the carbon footprint of buildings in urban areas. By harnessing urban wind energy, cities can contribute to clean and environmentally sustainable energy generation.
Overall, the study provides valuable insights into the wind energy potential in urban areas and the stakeholders involved in energy decision-making. It underscores the importance of considering renewable energy sources like urban wind energy in achieving global sustainability goals and transitioning to low-carbon energy systems.

Author Contributions

For research articles with several authors, a short paragraph specifying their individual contributions must be provided. The following statements should be used “Conceptualization, A.V. and C.C.; methodology, A.V. and I.H.; software, A.V.; validation, E.G., I.H. and C.C.; formal analysis, A.V.; investigation, A.V.; resources, A.V.; data curation, I.H.; writing—original draft preparation, A.V., I.H.; writing—review and editing, E.G.; visualization, A.V.; supervision, I.H.; project administration, A.V.; funding acquisition, A.V. All authors have read and agreed to the published version of the manuscript.” Please turn to the CRediT taxonomy for the term explanation. Authorship must be limited to those who have contributed substantially to the work reported.

Funding

This research was funded by FONDO NACIONAL DE INNOVACIÓN Y DESARROLLO CIENTÍFICO Y TECNOLÓGICO, grant number 2022-3C1-141, through the Ministry of Higher Education, Science and Technology (MESCyT) from the Dominican Republic.

Institutional Review Board Statement

Not applicable.

Informed Consent Statement

Not applicable.

Data Availability Statement

The data presented in this study are available on request from the corresponding author. The data are not publicly available due to privacy.

Acknowledgments

The first author thanks EGE HAINA and ONAMET for their contribution to this research.

Conflicts of Interest

The authors declare no conflict of interest.

References

  1. S&P Global, “Climate Essentials”. ArcGIS StoryMaps. Available online: https://storymaps.arcgis.com/collections/1e05ebf390554cb8b7cefa80e521afda (accessed on 17 September 2023).
  2. Murugesan, M.; Reedman, L.; Brinsmead, T.S.; Rifkin, W.; Gordon, J.; Megharaj, M. Modelling least-cost technology pathways to decarbonise the New South Wales energy system by 2050. Renew. Sustain. Energy Transit. 2023, 3, 100041. [Google Scholar] [CrossRef]
  3. Karkowska, R.; Urjasz, S. How does the Russian-Ukrainian war change connectedness and hedging opportunities? Comparison between dirty and clean energy markets versus global stock indices. J. Int. Financial Mark. Institutions Money 2023, 85, 101768. [Google Scholar] [CrossRef]
  4. Steffen, B.; Patt, A. A historical turning point? Early evidence on how the Russia-Ukraine war changes public support for clean energy policies. Energy Res. Soc. Sci. 2022, 91, 102758. [Google Scholar] [CrossRef]
  5. Zhou, E.; Wang, X. Dynamics of systemic risk in European gas and oil markets under the Russia–Ukraine conflict: A quantile regression neural network approach. Energy Rep. 2023, 9, 3956–3966. [Google Scholar] [CrossRef]
  6. Martins, F.F.; Felgueiras, C.; Caetano, N.S. Macro modeling of electricity price towards SDG7. Energy Rep. 2022, 8, 614–622. [Google Scholar] [CrossRef]
  7. LAZARD. “Levelized Cost Of Energy,” Lazard.com. [Online]. Available online: http://www.lazard.com/perspective/levelized-cost-of-energy-levelized-cost-of-storage-and-levelized-cost-of-hydrogen/ (accessed on 1 October 2022).
  8. IRENA. “Renewable Power Generation Costs in 2022.” [Online]. Available online: https://www.irena.org/Publications/2023/Aug/Renewable-Power-Generation-Costs-in-2022 (accessed on 17 September 2023).
  9. Schlindwein, L.; Montalvo, C. Energy citizenship: Accounting for the heterogeneity of human behaviours within energy transition. Energy Policy 2023, 180, 113662. [Google Scholar] [CrossRef]
  10. Zou, Y.; Wang, M. Does environmental regulation improve energy transition performance in China? Environ. Impact Assess. Rev. 2024, 104, 107335. [Google Scholar] [CrossRef]
  11. ICSC-CITIES. ICSC-CITIES | 2023 VI Ibero-American Congress of Smart Cities. [Online]. Available online: http://icsc-cities.com/ (accessed on 28 October 2023).
  12. van der Meij, M.G.; Fraaije, A.; Broerse, J.; Kupper, F. Guiding visions of corporate smart city innovators: Identifying opportunities for participatory futuring. Futures 2023, 154, 103269. [Google Scholar] [CrossRef]
  13. DOE. “Distributed Wind Market Report: 2022 Edition,” Energy.gov. [Online]. Available online: https://www.energy.gov/eere/wind/articles/distributed-wind-market-report-2022-edition (accessed on 10 March 2023).
  14. Simões, T.; Estanqueiro, A. A new methodology for urban wind resource assessment. Renew. Energy 2016, 89, 598–605. [Google Scholar] [CrossRef]
  15. Fields, J.; Oteri, F.; Preus, R.; Baring-Gould, I. Deployment of Wind Turbines in the Built Environment: Risks, Lessons, and Recommended Practices. NREL/TP--5000-65622 2016, 1260340. [Google Scholar] [CrossRef]
  16. Lens. “Scholar Search Results,” The Lens—Free & Open Patent and Scholarly Search. [Online]. Available online: https://www.lens.org/lens/search/scholar/list?publication_type.must=journal%20article&preview=true&q=urban%20wind%20energy&publishedDate.from=2015-01-01&publishedDate.to=2022-12-31 (accessed on 27 October 2023).
  17. VOSviewer VOSviewer—Visualizing Scientific Landscapes. Available online: https://www.vosviewer.com// (accessed on 11 June 2023).
  18. Fan, X.; Ge, M.; Tan, W.; Li, Q. Impacts of coexisting buildings and trees on the performance of rooftop wind turbines: An idealized numerical study. Renew. Energy 2021, 177, 164–180. [Google Scholar] [CrossRef]
  19. Vallejo-Díaz, A.; Herrera-Moya, I.; Fernández-Bonilla, A.; Pereyra-Mariñez, C. Wind energy potential assessment of selected locations at two major cities in the Dominican Republic, toward energy matrix decarbonization, with resilience approach. Therm. Sci. Eng. Prog. 2022, 32, 101313. [Google Scholar] [CrossRef]
  20. Vallejo, A.; Herrera, I.; Malmquist, A. Building-mounted wind energy potential in Santo Domingo, the Dominican Republic, a contribution for resilient decarbonization. Proceedings of ECOS 2022—The 35th International Conference on Efficiency, Cost, Optimization, Simulation and Environmental Impact of Energy Systems, Eds. Brian Elmegaard, Enrico Sciubba, AnaMBlanco-Marigorta, Jonas Kjær Jensen, Wiebke Brix Markussen, Wiebke Meesenburg, Nasrin Arjomand Kermani, Tingting Zhu, René Kofler, Danmarks Tekniske Universitet (DTU), Lyngby Denmark, 2022; pp. 1925–1936. [Google Scholar]
  21. O'Regan, A.C.; Nyhan, M.M. Towards sustainable and net-zero cities: A review of environmental modelling and monitoring tools for optimizing emissions reduction strategies for improved air quality in urban areas. Environ. Res. 2023, 231, 116242. [Google Scholar] [CrossRef] [PubMed]
  22. Wang, Q.; Wang, J.; Hou, Y.; Yuan, R.; Luo, K.; Fan, J. Micrositing of roof mounting wind turbine in urban environment: CFD simulations and lidar measurements. Renew. Energy 2018, 115, 1118–1133. [Google Scholar] [CrossRef]
  23. Rezaeiha, A.; Montazeri, H.; Blocken, B. A framework for preliminary large-scale urban wind energy potential assessment: Roof-mounted wind turbines. Energy Convers. Manag. 2020, 214, 112770. [Google Scholar] [CrossRef]
  24. Juan, Y.-H.; Wen, C.-Y.; Chen, W.-Y.; Yang, A.-S. Numerical assessments of wind power potential and installation arrangements in realistic highly urbanized areas. Renew. Sustain. Energy Rev. 2020, 135, 110165. [Google Scholar] [CrossRef]
  25. Zagubień, A.; Wolniewicz, K. Energy Efficiency of Small Wind Turbines in an Urbanized Area—Case Studies. Energies 2022, 15, 5287. [Google Scholar] [CrossRef]
  26. Vallejo, A.; Herrera, I.; Castellanos, J.; Pereyra, C.; Garabitos, E. Urban Wind Potential Analysis: Case Study of Wind Turbines Integrated into a Building Using On-Site Measurements and CFD Modelling. 36th International Conference on Efficiency, Cost, Optimization, Simulation and Environmental Impact of Energy Systems (ECOS 2023). Las Palmas De Gran Canaria, Spain: ECOS 2023, 2023, 534–546. [Google Scholar]
  27. NASA. Power Data Access View. 2019. Available online: https://power.larc.nasa.gov/data-access-viewer/ (accessed on 20 September 2022).
  28. Hirmer, S.; George-Williams, H.; Rhys, J.; McNicholl, D.; McCulloch, M. Stakeholder decision-making: Understanding Sierra Leone's energy sector. Renew. Sustain. Energy Rev. 2021, 145, 111093. [Google Scholar] [CrossRef]
  29. IAEA. Enhanced Electricity System Analysis for Decision Making—A Reference Book; 2000. [Google Scholar]
  30. Tajbakhsh, A.; Shamsi, A. Sustainability performance of countries matters: A non-parametric index. J. Clean. Prod. 2019, 224, 506–522. [Google Scholar] [CrossRef]
  31. Craig, P.P.; Gadgil, A.; Koomey, J.G. What Can History Teach Us? A Retrospective Examination of Long-Term Energy Forecasts for the United States. Annu. Rev. Energy Environ. 2002, 27, 83–118. [Google Scholar] [CrossRef]
  32. Read, L.; Madani, K.; Mokhtari, S.; Hanks, C. Stakeholder-driven multi-attribute analysis for energy project selection under uncertainty. Energy 2017, 119, 744–753. [Google Scholar] [CrossRef]
  33. Pollitt, M.G. Search of ’Good’Energy Policy: The Social Limits to Technological Solutions to Energy and Climate Problems. 2015. [Google Scholar]
  34. Díaz, A.V.; Moya, I.H.; Mariñez, C.P.; Lara, E.G.; Victorino, C.C. Key factors influencing urban wind energy: A case study from the Dominican Republic. Energy Sustain. Dev. 2023, 73, 165–173. [Google Scholar] [CrossRef]
  35. Arteaga-López, E.; Ángeles-Camacho, C.; Bañuelos-Ruedas, F. Advanced methodology for feasibility studies on building-mounted wind turbines installation in urban environment: Applying CFD analysis. Energy 2018, 167, 181–188. [Google Scholar] [CrossRef]
  36. Gil-García, I.C.; García-Cascales, M.S.; Molina-García, A. Urban Wind: An Alternative for Sustainable Cities. Energies 2022, 15, 4759. [Google Scholar] [CrossRef]
  37. Gagliano, A.; Nocera, F.; Patania, F.; Capizzi, A. Assessment of micro-wind turbines performance in the urban environments: An aided methodology through geographical information systems. Int. J. Energy Environ. Eng. 2013, 4, 43. [Google Scholar] [CrossRef]
  38. Jervase, J.A.; Al-Lawati, A.M. Wind energy potential assessment for the Sultanate of Oman. Renew. Sustain. Energy Rev. 2012, 16, 1496–1507. [Google Scholar] [CrossRef]
  39. Potić, I.; Joksimović, T.; Milinčić, U.; Kićović, D.; Milinčić, M. Wind energy potential for the electricity production—Knjaževac Municipality case study (Serbia). Energy Strat. Rev. 2020, 33, 100589. [Google Scholar] [CrossRef]
  40. SkyscraperPage. “Database—SkyscraperPage.com,” SkyscraperPage. [Online]. Available online: https://skyscraperpage.com/cities/ (accessed on 2 May 2021).
  41. Wilke, A.; Shen, Z.; Ritter, M. How Much Can Small-Scale Wind Energy Production Contribute to Energy Supply in Cities? A Case Study of Berlin. Energies 2021, 14, 5523. [Google Scholar] [CrossRef]
  42. Gualtieri, G.; Secci, S. Wind shear coefficients, roughness length and energy yield over coastal locations in Southern Italy. Renew. Energy 2011, 36, 1081–1094. [Google Scholar] [CrossRef]
  43. Vita, G.; Shu, Z.; Jesson, M.; Quinn, A.; Hemida, H.; Sterling, M.; Baker, C. On the assessment of pedestrian distress in urban winds. J. Wind. Eng. Ind. Aerodyn. 2020, 203, 104200. [Google Scholar] [CrossRef]
  44. IEC 61400-2:2013. 2013. [Online]. Available online: https://webstore.iec.ch/publication/5433.
  45. Cheng, C.; Gutierrez, N.P.; Blakers, A.; Stocks, M. GIS-based solar and wind resource assessment and least-cost 100 % renewable electricity modelling for Bolivia. Energy Sustain. Dev. 2022, 69, 134–149. [Google Scholar] [CrossRef]
  46. Zhang, Y.; Cao, S.; Zhao, L.; Cao, J. A case application of WRF-UCM models to the simulation of urban wind speed profiles in a typhoon. J. Wind. Eng. Ind. Aerodyn. 2021, 220, 104874. [Google Scholar] [CrossRef]
  47. Toja-Silva, F.; Kono, T.; Peralta, C.; Lopez-Garcia, O.; Chen, J. A review of computational fluid dynamics (CFD) simulations of the wind flow around buildings for urban wind energy exploitation. J. Wind. Eng. Ind. Aerodyn. 2018, 180, 66–87. [Google Scholar] [CrossRef]
  48. Du, S.; Zhang, X.; Jin, X.; Zhou, X.; Shi, X. A review of multi-scale modelling, assessment, and improvement methods of the urban thermal and wind environment. J. Affect. Disord. 2022, 213, 108860. [Google Scholar] [CrossRef]
  49. Al-Quraan, A.; Stathopoulos, T.; Pillay, P. Comparison of wind tunnel and on site measurements for urban wind energy estimation of potential yield. J. Wind. Eng. Ind. Aerodyn. 2016, 158, 1–10. [Google Scholar] [CrossRef]
  50. Mittal, H.; Sharma, A.; Gairola, A. A review on the study of urban wind at the pedestrian level around buildings. J. Build. Eng. 2018, 18, 154–163. [Google Scholar] [CrossRef]
  51. Mikhailuta, S.V.; Lezhenin, A.A.; Pitt, A.; Taseiko, O.V. Urban wind fields: Phenomena in transformation. Urban Clim. 2017, 19, 122–140. [Google Scholar] [CrossRef]
  52. Walker, S.L. Building mounted wind turbines and their suitability for the urban scale—A review of methods of estimating urban wind resource. Energy Build. 2011, 43, 1852–1862. [Google Scholar] [CrossRef]
  53. Byrne, R.; Hewitt, N.J.; Griffiths, P.; MacArtain, P. An assessment of the mesoscale to microscale influences on wind turbine energy performance at a peri-urban coastal location from the Irish wind atlas and onsite LiDAR measurements. Sustain. Energy Technol. Assessments 2019, 36, 100537. [Google Scholar] [CrossRef]
  54. Stathopoulos, T.; Alrawashdeh, H.; Al-Quraan, A.; Blocken, B.; Dilimulati, A.; Paraschivoiu, M.; Pilay, P. Urban wind energy: Some views on potential and challenges. J. Wind. Eng. Ind. Aerodyn. 2018, 179, 146–157. [Google Scholar] [CrossRef]
  55. Anup, K.C.; Whale, J.; Urmee, T. Urban wind conditions and small wind turbines in the built environment: A review. Renew. Energy 2019, 131, 268–283. [Google Scholar] [CrossRef]
  56. Tasneem, Z.; Al Noman, A.; Das, S.K.; Saha, D.K.; Islam, R.; Ali, F.; Badal, F.R.; Ahamed, H.; Moyeen, S.I.; Alam, F. An analytical review on the evaluation of wind resource and wind turbine for urban application: Prospect and challenges. Dev. Built Environ. 2020, 4, 100033. [Google Scholar] [CrossRef]
  57. Micallef, D.; Van Bussel, G. A Review of Urban Wind Energy Research: Aerodynamics and Other Challenges. Energies 2018, 11, 2204. [Google Scholar] [CrossRef]
  58. Eltayesh, A.; Castellani, F.; Natili, F.; Burlando, M.; Khedr, A. Aerodynamic upgrades of a Darrieus vertical axis small wind turbine. Energy Sustain. Dev. 2023, 73, 126–143. [Google Scholar] [CrossRef]
  59. Dai, K.; Bergot, A.; Liang, C.; Xiang, W.-N.; Huang, Z. Environmental issues associated with wind energy—A review. Renew. Energy 2015, 75, 911–921. [Google Scholar] [CrossRef]
  60. Aldersey-Williams, J.; Rubert, T. Levelised cost of energy—A theoretical justification and critical assessment. Energy Policy 2018, 124, 169–179. [Google Scholar] [CrossRef]
  61. Brugha, R.; Varvasovszky, Z. Stakeholder analysis: A review. Health Policy Plan. 2000, 15, 239–246. [Google Scholar] [CrossRef]
  62. Mori, N. Roles Of Stakeholders In Strategic Decision-Making Of Microfinance Organizations. Int. Bus. Econ. Res. J. (IBER) 2010, 9, 51–64. [Google Scholar] [CrossRef]
  63. Chai, J.; Liu, J.N.; Ngai, E.W. Application of decision-making techniques in supplier selection: A systematic review of literature. Expert Syst. Appl. 2013, 40, 3872–3885. [Google Scholar] [CrossRef]
  64. Metze, T.A.; Broek, J.v.D.; van Est, R.; Cuppen, E.H. Participatory repertoires for aligning policy and society: An analysis of Dutch stakeholder views on deep geothermal energy. Energy Res. Soc. Sci. 2023, 98, 103019. [Google Scholar] [CrossRef]
  65. Tomás, M.; García-Muros, X.; Alonso-Epelde, E.; Arto, I.; Rodríguez-Zúñiga, A.; Monge, C.; González-Eguino, M. Ensuring a just energy transition: A distributional analysis of diesel tax reform in Spain with stakeholder engagement. Energy Policy 2023, 177, 113558. [Google Scholar] [CrossRef]
  66. Shortall, O.; Anker, H.T.; Sandøe, P.; Gamborg, C. Room at the margins for energy-crops? A qualitative analysis of stakeholder views on the use of marginal land for biomass production in Denmark. Biomass- Bioenergy 2019, 123, 51–58. [Google Scholar] [CrossRef]
  67. Fu, F.; Feng, W.; Li, Z.; Crawley, E.F.; Ni, W. A network-based modeling framework for stakeholder analysis of China’s energy conservation campaign. Energy 2011, 36, 4996–5003. [Google Scholar] [CrossRef]
  68. Reed, M.S.; Graves, A.; Dandy, N.; Posthumus, H.; Hubacek, K.; Morris, J.; Prell, C.; Quinn, C.H.; Stringer, L.C. Who's in and why? A typology of stakeholder analysis methods for natural resource management. J. Environ. Manag. 2009, 90, 1933–1949. [Google Scholar] [CrossRef]
  69. Hare, M.; Pahl-Wostl, C. Stakeholder Categorisation in Participatory Integrated Assessment Processes. Integr. Assess. 2002, 3, 50–62. [Google Scholar] [CrossRef]
  70. Salam, A.; Noguchi, T. Evaluating capacity development for participatory forest management in Bangladesh's Sal forests based on ‘4Rs’ stakeholder analysis. For. Policy Econ. 2006, 8, 785–796. [Google Scholar] [CrossRef]
  71. Susanto, N.; Putranto, T.T. Stakeholder interactions model of groundwater management in Semarang City/Indonesia. Int. J. GEOMATE 2018, 15, 170–177. [Google Scholar] [CrossRef]
  72. Suhanda, R.D.P.; Pratami, D. RACI Matrix Design for Managing Stakeholders in Project Case Study of PT. XYZ. Int. J. Innov. Enterp. Syst. 2021, 5, 122–133. [Google Scholar] [CrossRef]
  73. Mkhaimer, L.G.; Arafeh, M.; Sakhrieh, A.H. Effective implementation of ISO 50001 energy management system: Applying Lean Six Sigma approach. Int. J. Eng. Bus. Manag. 2017, 9, 1847979017698712. [Google Scholar] [CrossRef]
  74. Cabanillas, C.; Resinas, M.; Ruiz-Cortés, A. A template-based approach for responsibility management in executable business processes. Enterp. Inf. Syst. 2017, 12, 550–586. [Google Scholar] [CrossRef]
  75. Brower, H.H.; Nicklas, B.J.; Nader, M.A.; Trost, L.M.; Miller, D.P. Creating effective academic research teams: Two tools borrowed from business practice. J. Clin. Transl. Sci. 2020, 5, 1–18. [Google Scholar] [CrossRef]
  76. Simhachalam, V.; Wang, T.; Liu, Y.; Wamelink, H.; Montenegro, L.; van Gorp, G. Accelerating Building Energy Retrofitting with BIM-Enabled BREEAM-NL Assessment. Energies 2021, 14, 8225. [Google Scholar] [CrossRef]
  77. Lee, W.-Y.; Lee, S.-H.; Jin, C.; Hyun, C.-T. Development of the RACI Model for Processes of the Closure Phase in Construction Programs. Sustainability 2021, 13, 1806. [Google Scholar] [CrossRef]
  78. Altissimo, A. Combining Egocentric Network Maps and Narratives: An Applied Analysis of Qualitative Network Map Interviews. Sociol. Res. Online 2016, 21, 152–164. [Google Scholar] [CrossRef]
  79. Byrne, R.; Hewitt, N.J.; Griffiths, P.; MacArtain, P. An assessment of the mesoscale to microscale influences on wind turbine energy performance at a peri-urban coastal location from the Irish wind atlas and onsite LiDAR measurements. Sustain. Energy Technol. Assessments 2019, 36, 100537. [Google Scholar] [CrossRef]
  80. Vallejo, A. Urban wind energy potential in the southern region of the Dominican Republic. In Proceedings of the VI Ibero-American Congress of Smart Cities (ICSC-CITIES 2023), Ecuador, 2023; Moreno-Bernal, P., Hernández-Callejo, L., Nesmachnow, S., Rossit, D., Ochoa-Correa, D., Eds.; pp. 642–656. [Google Scholar]
  81. Al-Yahyai, S.; Charabi, Y.; Gastli, A.; Al-Alawi, S. Assessment of wind energy potential locations in Oman using data from existing weather stations. Renew. Sustain. Energy Rev. 2010, 14, 1428–1436. [Google Scholar] [CrossRef]
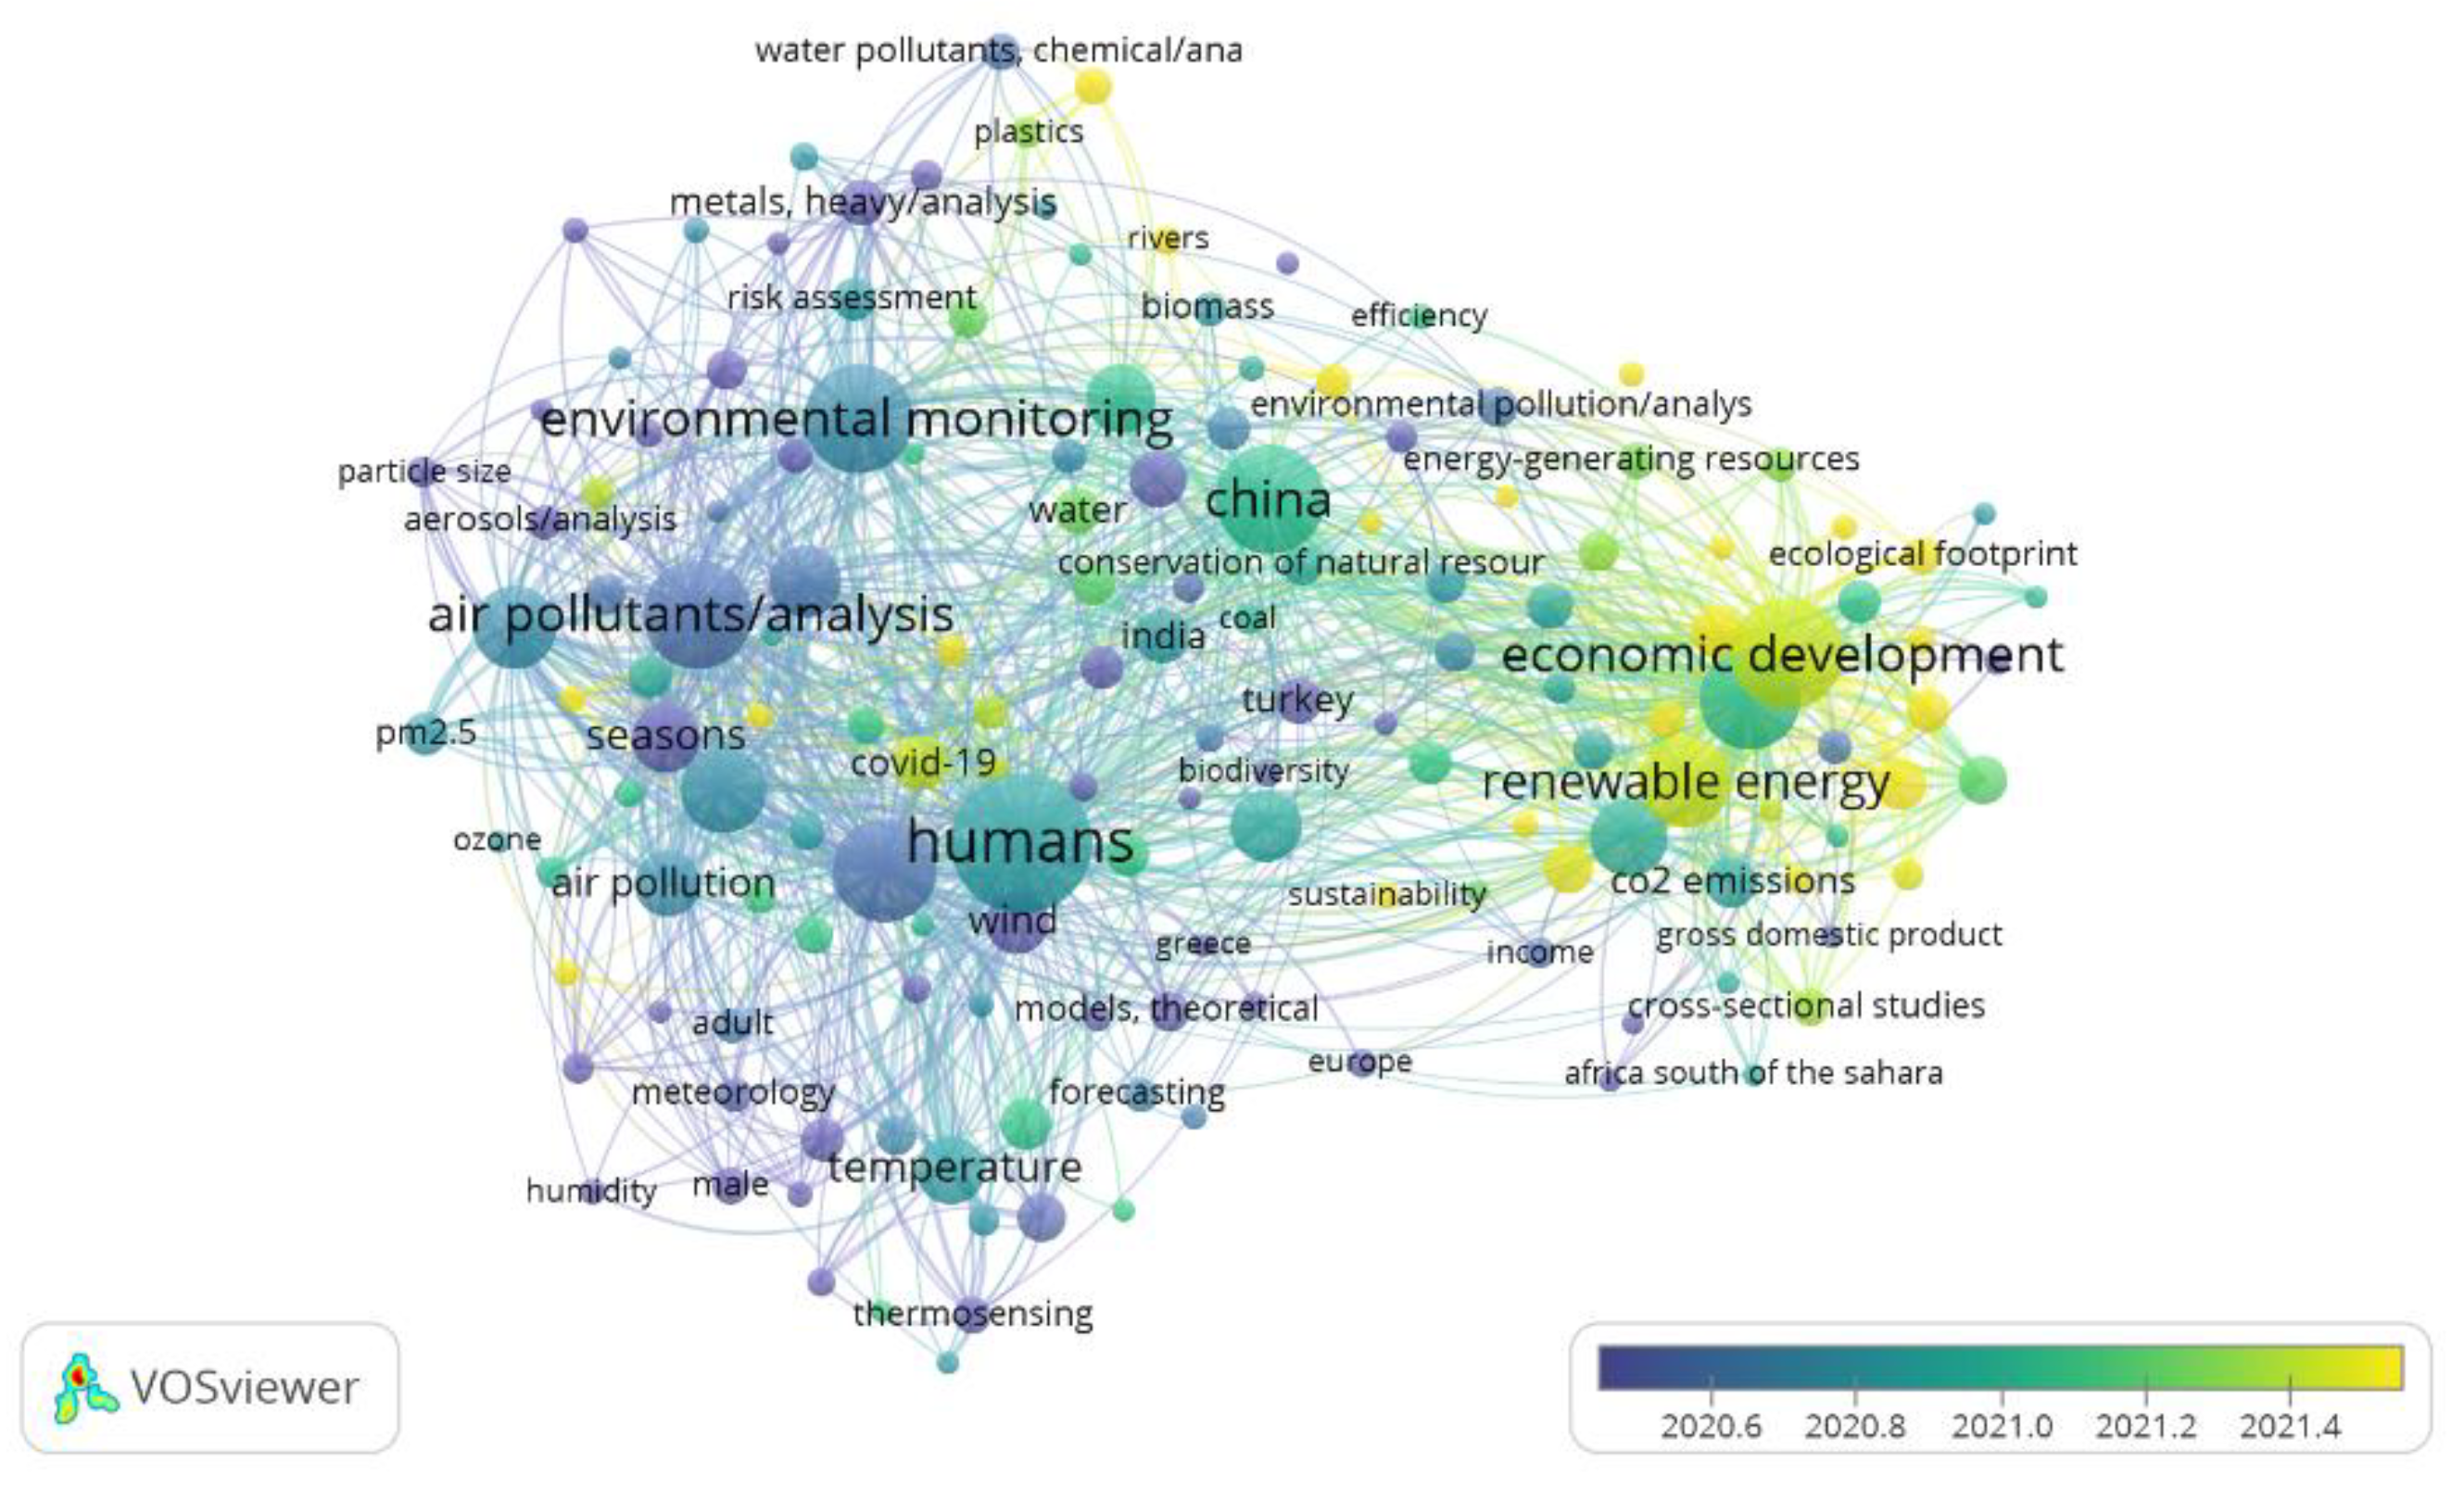
Figure 1. Top-10 Co-occurrence keywords from the bibliometric analysis “urban wind energy”.
Preprints 93362 g001
Figure 2. Framework to urban wind energy assessment and RACI analysis.
Preprints 93362 g002
Figure 3. Year average wind speed per provinces in the Dominican Republic.
Preprints 93362 g003
Figure 4. Population density per provinces in the Dominican Republic.
Preprints 93362 g004
Figure 5. RACI categories and relevance by institution.
Preprints 93362 g005
Figure 6. This is a figure. Schemes follow the same formatting.
Preprints 93362 g006
Table 1. Network structure for stakeholder analysis.
Proffesiononal area Years of experience Counter %
Engineering 17 48 81%
Lawyer 12 7 12%
Bussiness 9 3 5%
Architecture 18 1 2%
Avg. 16 Total 59 Total 100%
Table 2. Urban wind energy and population data by provinces.
Privinces WS at 10 m (m/s) WD at
10 m (°)
Energy (kWh/yr) Area (km²) Population (inhabit.) Population density (inhabit. /km²)
 Azua 3.97 86 1,464 2,532 256,981 101
 Bahoruco 3.15 117 722 1,282 118,987 92
 Barahona 4.12 92 1,638 1,739 226,898 130
 Dajabón 3.93 60 1,416 1,021 67,887 66
 Distrito Nacional 3.41 80 919 104 1,484,789 14216
 Duarte 3.46 87 964 1,605 384,789 239
 Elías Piña 2.57 80 385 1,426 70,589 49
 El Seibo 5.21 82 3,162 1,787 115,889 64
 Espaillat 2.72 88 461 839 390,478 465
 Hato Mayor 3.29 82 828 1,329 89,578 67
 Hermanas Mirabal 2.72 88 461 440 103,974 234
 Independencia 3.15 117 722 2,006 54,785 27
 La Altagracia 4.83 81 2,587 3,010 335,677 111
 La Romana 4.83 81 2,587 654 330,587 505
 La Vega 3.02 90 632 2,287 420,478 183
 María Trinidad Sánchez 3.46 87 964 1,272 140,784 110
 Monseñor Nouel 3.02 90 632 992 201,474 203
 Montecristi 6.63 73 5,197 1,924 135,710 70
 Monte Plata 2.19 84 236 2,632 200,454 76
 Pedernales 4.50 95 2,121 2,075 38,941 19
 Peravia 3.97 86 1,464 792 298,747 377
 Puerto Plata 5.13 90 3,045 1,853 490,733 264
 Samaná 3.29 82 828 854 168,265 126
 Sánchez Ramírez 2.19 84 236 1,196 248,807 131
 San Cristóbal 3.41 80 919 1,266 859,741 679
 San José de Ocoa 3.97 86 1,464 855 82,458 96
 San Juan 3.20 99 761 3,569 300,476 84
 San Pedro de Macorís 4.07 82 1,572 1,255 418,850 333
 Santiago 2.72 88 461 2,837 1,833,451 646
 Santiago Rodríguez 3.83 78 1,313 1,111 164,941 148
 Santo Domingo 3.41 80 919 1,302 2,995,211 2310
 Valverde 3.83 78 1,313 823 207,447 251
Table 3. Institution’s role assignment and relevance.
No. Institution list Accronys X-axes Y-axes Relevance
1 City councils AYTO 0.03 0.09 0.49
2 Ministry of Energy and Mines MEM 0.36 0.64 0.75
3 Electricity Distribution Company EDE -0.34 0.40 0.61
4 National Energy Commission CNE 0.16 0.16 0.16
5 Superintendence of Electricity SIE 0.26 0.40 0.70
6 Coordinating Entity OC -0.13 -0.36 0.39
7 Dominican Electric Transmission Company ETED 0.09 0.09 0.09
8 Universities UNIV -0.33 -0.40 0.37
9 National Industrial Property Office (ONAPI) ONAPI 0.25 -0.36 0.21
10 Ministry of Higher Education, Science and Technology MESCyT 0.19 -0.36 0.27
11 International Cooperation Organizations (USAID, UNDP, GIZ) OCI -0.31 -0.56 0.35
12 NGOs ONG -0.19 -0.44 0.31
13 Ministry of Industry and commerce MIC 0.10 -0.14 0.35
14 Ministry of Economy, Planning and Development MEPyD 0.09 -0.16 0.36
15 Ministry of Labor MT 0.38 -0.29 0.18
16 Ministry of Environment and Natural Resources MIMARENA 0.01 0.04 0.55
17 Superintendence of Banks SB 0.24 -0.27 0.28
18 Local banks BL 0.10 -0.24 0.33
19 International Cooperation Banks BI -0.09 -0.25 0.38
20 National Meteorological Office ONAMET -0.20 -0.36 0.37
21 Dominican Association of the Electrical Industry ADIE -0.19 -0.43 0.34
22 Association for the Promotion of Renewable Energies ASOFER -0.27 -0.22 0.46
23 National Association of Young Entrepreneurs ANJE 0.11 -0.32 0.27
24 Association of Energy Efficiency and Renewable Energy Companies AEEER -0.19 -0.15 0.41
25 National Congress CN 0.18 0.32 0.59
26 Supreme Court of Justice SCJ 0.30 -0.05 0.33
27 Ministry of Education MINERD 0.28 -0.31 0.24
28 Construction entrepreneurs EC -0.06 -0.27 0.35
Disclaimer/Publisher’s Note: The statements, opinions and data contained in all publications are solely those of the individual author(s) and contributor(s) and not of MDPI and/or the editor(s). MDPI and/or the editor(s) disclaim responsibility for any injury to people or property resulting from any ideas, methods, instructions or products referred to in the content..
Copyright: This open access article is published under a Creative Commons CC BY 4.0 license, which permit the free download, distribution, and reuse, provided that the author and preprint are cited in any reuse.
Prerpints.org logo

Preprints.org is a free preprint server supported by MDPI in Basel, Switzerland.

Subscribe

© 2024 MDPI (Basel, Switzerland) unless otherwise stated