1. Introduction
The corrosion of joints between steel and aluminum welded using the Friction Stir Welding (FSW) process is a well-known and significant issue in the field of materials engineering and welding. This phenomenon can lead to severe structural damage and compromise the integrity of the joints. In general, FSW is known for providing high-strength joints, but their durability in a marine environment can be influenced by various factors, in particular the Friction Stir Welding process can affect the ease with which the corrosion process occurs at the joint between these two types of metals. However, even if the problems related to the durability in aggressive environment of different materials are industrially known [
1], in the literature only few works aimed to better relate aspects of corrosion degradation with the mechanical behavior of the joints are reported.
The main effects are as follows:
Formation of composite joints: FSW creates a joint composed of both metals, steel, and aluminum. This joint has a unique microstructure that can influence susceptibility to corrosion. For example, the transition zone between the two metals, known as the "stir zone," may have different characteristics that affect chemical reactivity. Differences in Galvanic potential: The formation of composite joints between steel and aluminum creates an area where differences in electropotential between the two metals can promote galvanic corrosion. The joint itself often serves as a preferential site for the initiation of corrosion, with aluminum acting as the anode and steel as the cathode in a galvanic reaction. The higher corrosion current density is generated in the welded zone due to the occurrence of galvanic corrosion [
2].
Precipitation of intermetallic compounds: In composite joints between steel and aluminum, intermetallic compounds can form due to the interdiffusion of metals during welding. These intermetallic compounds may have a greater susceptibility to corrosion than the base metals, increasing the risk of corrosion damage. Sachindra et al. reported that “the grain structure of each zone depends on the dynamic recrystallization and heat input. However, dynamic recrystallization is more dominating factor compared to the heat input in the stir zone and thus leads to the more refined grains in the stir zone. Like grain structure, distribution of harder material over the aluminum in the weld zone also plays a great role in deciding the joint quality. The formation of intermetallics is also crucial for dissimilar joining. The interface of the Al to non-Al metallic combinations is sensitive to the formation of intermetallics due to the diffusion of the materials to be joined. However, the thickness of the intermetallics is thinner in FSW of dissimilar materials compared to fusion welding. The thickness of the intermetallic compound in the interfacial zone has adverse effects on the tensile strength of the joint. However, the tensile strength of friction stir welded Al to Non-Al metallic combinations is always lower than the aluminum base metals due to the formation of defects and intermetallics.” [
3,
4].
Porosity Effect: The FSW process can create some porosity at the interface between the two materials. These pores can act as preferential sites for the initiation of corrosion, as they facilitate the access of moisture and electrolytes. The results obtained from Zhenglin's research [
5], show that the FSW technique significantly reduces porosity in welding. It is believed that the plastic deformation and dynamic recrystallization process developing in FSW was able to exclude porosity in the weld. Moreover, the absence of melting eliminates porosity and hot cracking, problems that have been shown to occur when fusion welding aluminum and its alloys [
6].
Welding parameters: welding parameters influence the microchemistry and thus the microstructure of friction welded joints. Among the parameters that determine these changes, we can mention: the speed of rotation, the direction of advancement in advancing or retreating side, the tilt angle, the geometry of the pin and the tool, etc. For Zhan et al. [
2], as the rotational speed increases, it increases the average grain size due to severe plastic deformation and high-temperature exposure, dynamically recrystallization takes place in the nugget zone (NZ), forming fine equiaxed grains. Due to uneven shear deformation and heat input at different positions in the NZ, different types of texture components are formed and vary with the rotational speed. Depending on the heat input, FSW limits the formation of intermetallics at the Al-to-steel interface because it involves lower temperatures and avoids melting. A higher rotational speed and larger tool offset can be used to modify the overall temperature distribution in the weld [
7]. Chen et al. [
8] studied the effects of tool positioning on microstructures formed in the Al-to-steel interface region and reported that when the pin was close to the bottom steel piece, Al-to-steel reaction occurred, resulting in intermetallic outbursts formed along the interface, while when the pin approached the steel, a thin and continued interface intermetallic layer was formed [
9]. Sanjay et al. proposed that the weld parameters like the speed of welding and rotation control the material flow and thus reduce weld defects. The above-discussed parameters are already discussed in many papers, so special attention is given to the factors like tool material selection, tool geometry and design, joint configuration, and physical properties of base metals [
10]. The welding of dissimilar alloys is influenced by both the shape and the profile of the shoulder [
11,
12], Jaia et al [
13] find that the pin geometry influences on both the tensile elongation and the value of the breaking load, several authors agree that a spiral pin profile would increase welding effectiveness. Di Bella et al., have studied the effect of the tool tilt and, the tool was inclined of an angle of 2°. This induces an evident effect on the joint [
14].
Di Bella et al. proposed methodology appears to be very effective in predicting FSW emissions in a robust manner with respect to the weld thickness. In general, it is confirmed that this type of welding is among the most sustainable, both for the low energy input required and, above all, for the absence of filler materials, inert gases, and consumables, except for a modest quantity of lubricating oil. The functional unit chosen allows to overcome the limits of comparison between very different geometries and process parameters and has proved to be very suitable for comparing different works [
15].
The evaluation of durability, by accelerated tests, of dissimilar Al/Steel joints has been performed by some authors, but mainly regard other joining techniques but FWS. For example, Wloka et al. [
16] studied the corrosion properties of laser beam joints of aluminium with zinc-coated steel, finding that the corrosion tests show that the joining zone has the most negative corrosion potential and is the first to corrode. The degree of corrosive deterioration depends on the cathodic behaviour of the adjacent metal. Next to effective cathodes, such as steel or Fe-containing intermetallics, the attack is the most. The corrosion performance of laser-brazed joints of AA6082 to galvanized steel was studied with three different methods: immersion test, salt spray test and electrochemical corrosion test by Narsimhachary et al. [
17]. Di Bella et al [
18]. Studied the Durability of orbital riveted steel/aluminium joints in salt spray environment.
Calabrese et al. [
19] performed long-term ageing tests in critical environmental conditions to evaluate the mechanical durability of aluminum alloy/steel SPR joints. The experimental results evidenced that the corrosion degradation phenomena significantly influenced performances and failure mechanisms of the joints; moreover, Calabrese et al [
20] studied the Effect of corrosion degradation on failure mechanisms of aluminum/steel clinched joints.
Le Bozec et al. [
1] investigated the corrosion performance and mechanical properties of various joints composed of different material combinations (e.g., high strength carbon steel, hot-dip galvanized steel, electrogalvanized steel, aluminum alloys 6061 and 5182) using different mechanical joining methods, including, adhesive + clinching, and clinching alone. They found that hybrid (adhesive + clinching) joints had greater strength than clinching along, when both types of joints were subjected to corrosion testing prior to mechanical strength evaluation.
Lim et al. [
21] studied the joint strength of dissimilar combinations of AA 7075-T6 and DP 980 sheets welded by FBJ for spot joints produced with and without adhesive, using an accelerated laboratory scale corrosion cycle test.
Nevertheless, some study on durability of dissimilar Al/steel FSW joints have been performed but focusing the investigation on immersion corrosion and electrochemical corrosion tests. Kulkarni et al. studied the FSW process variables such as backing plate, the rotation speed of the tool, and traverse speed were varied to obtain a suitable combination of parameters to achieve high corrosion resistance of joints along with satisfactory mechanical properties [
22].
Anaman et al [
23] find that, friction stir butt welded joint of dissimilar aluminum and steel alloys, the electrochemical corrosion investigation reveals that the FSW joint exhibits a higher corrosion rate compared to the base materials due to the scattered steel fragments and the increase in martensite content and low-angle grain boundaries (LAGBs).
In a previous study the Authors [
24], evidenced how, for the connection of Steel with aluminum alloy, by varying direction of welding the mechanical properties change, proving that this process parameter affects temperatures, deformations, residual stresses and, consequently, the mechanical properties. The microstructure analyses evidence that of a thin intermetallic compound (IMC) layer at the aluminum and steel interface can be clearly observed due to the rotation effect of the pin, which pulled small pieces of steel from the surface and scattered them on the aluminum surface. By changing the weld side, the quantity and shape of these steel fragments change by affecting the mechanical behavior [
19]. So, it is not possible to exclude that the welding direction can affect the durability of the joint. Preliminary test has been performed [
25] on the same sample before ageing, studying the electrochemical behavior (by microcell polarization tests) of the joint showing that the zones formed during the FSW process (stir and heat affected zone) did not negatively affect the corrosion resistance of the joint.
Corrosion in joints between steel and aluminum welded with FSW is a complex problem that requires a combination of technical approaches, such as coatings, material selection, and design, to successfully prevent or mitigate it. Careful management of this issue is crucial to ensure the reliability and durability of structures and components involving these joints. Despite the criticality of the problem, as before pointed out, very few studies on the durability of FSW joints between aluminum and steel can be found in the literature. In this concern, the aim of the present work is to evaluate the effect of the ageing time in salt spray test on the mechanical performances and failure mechanisms of carbon steel/aluminum alloy joints, obtained by FSW.
2. Materials and Methods
In this study, the joining between aluminum and steel was evaluated, materials that are impossible to weld with traditional techniques, possessing so different chemical characteristics. The use of dissimilar materials, in the industrial sector, is carried out to meet all those construction needs where it is necessary to lighten the structures. The friction welded joints were made by join 6 mm thick AA5083-H111 aluminum alloy sheets, supplied by Media Metalli (
www.mediametalli.com, Italy), and 5 mm thick S355-J0 steel sheets, supplied by the Fincantieri shipyard in Palermo (
www.fincantieri.com, Italy). AA5083 is a very versatile aluminum alloy, its use is aimed at a multitude of sectors such as railways, automobiles and ships but it is not possible to heat treat it. To improve its mechanical characteristics, it is possible to carry out a work hardening treatment through the cold forming technique. The H111 condition was achieved during subsequent operations such as stretching or leveling. The result is an annealed and slightly hardened alloy (less than H11 hardening). S355-J0 is an unalloyed carbon structural steel suitable for cold forming. It is used in many different fields, from carpentry applications (i.e., naval), to the production of metal structures, tanks, to use in architecture, etc... J0 means that, at a temperature of 0°C, the minimum impact energy is equal to 27 J. The preliminary tests, tensile and microhardness tests, were to evaluate the main properties of aluminum and steel.
Table 1 and
Table 2 show, respectively, the chemical composition and the main mechanical properties of both materials used.
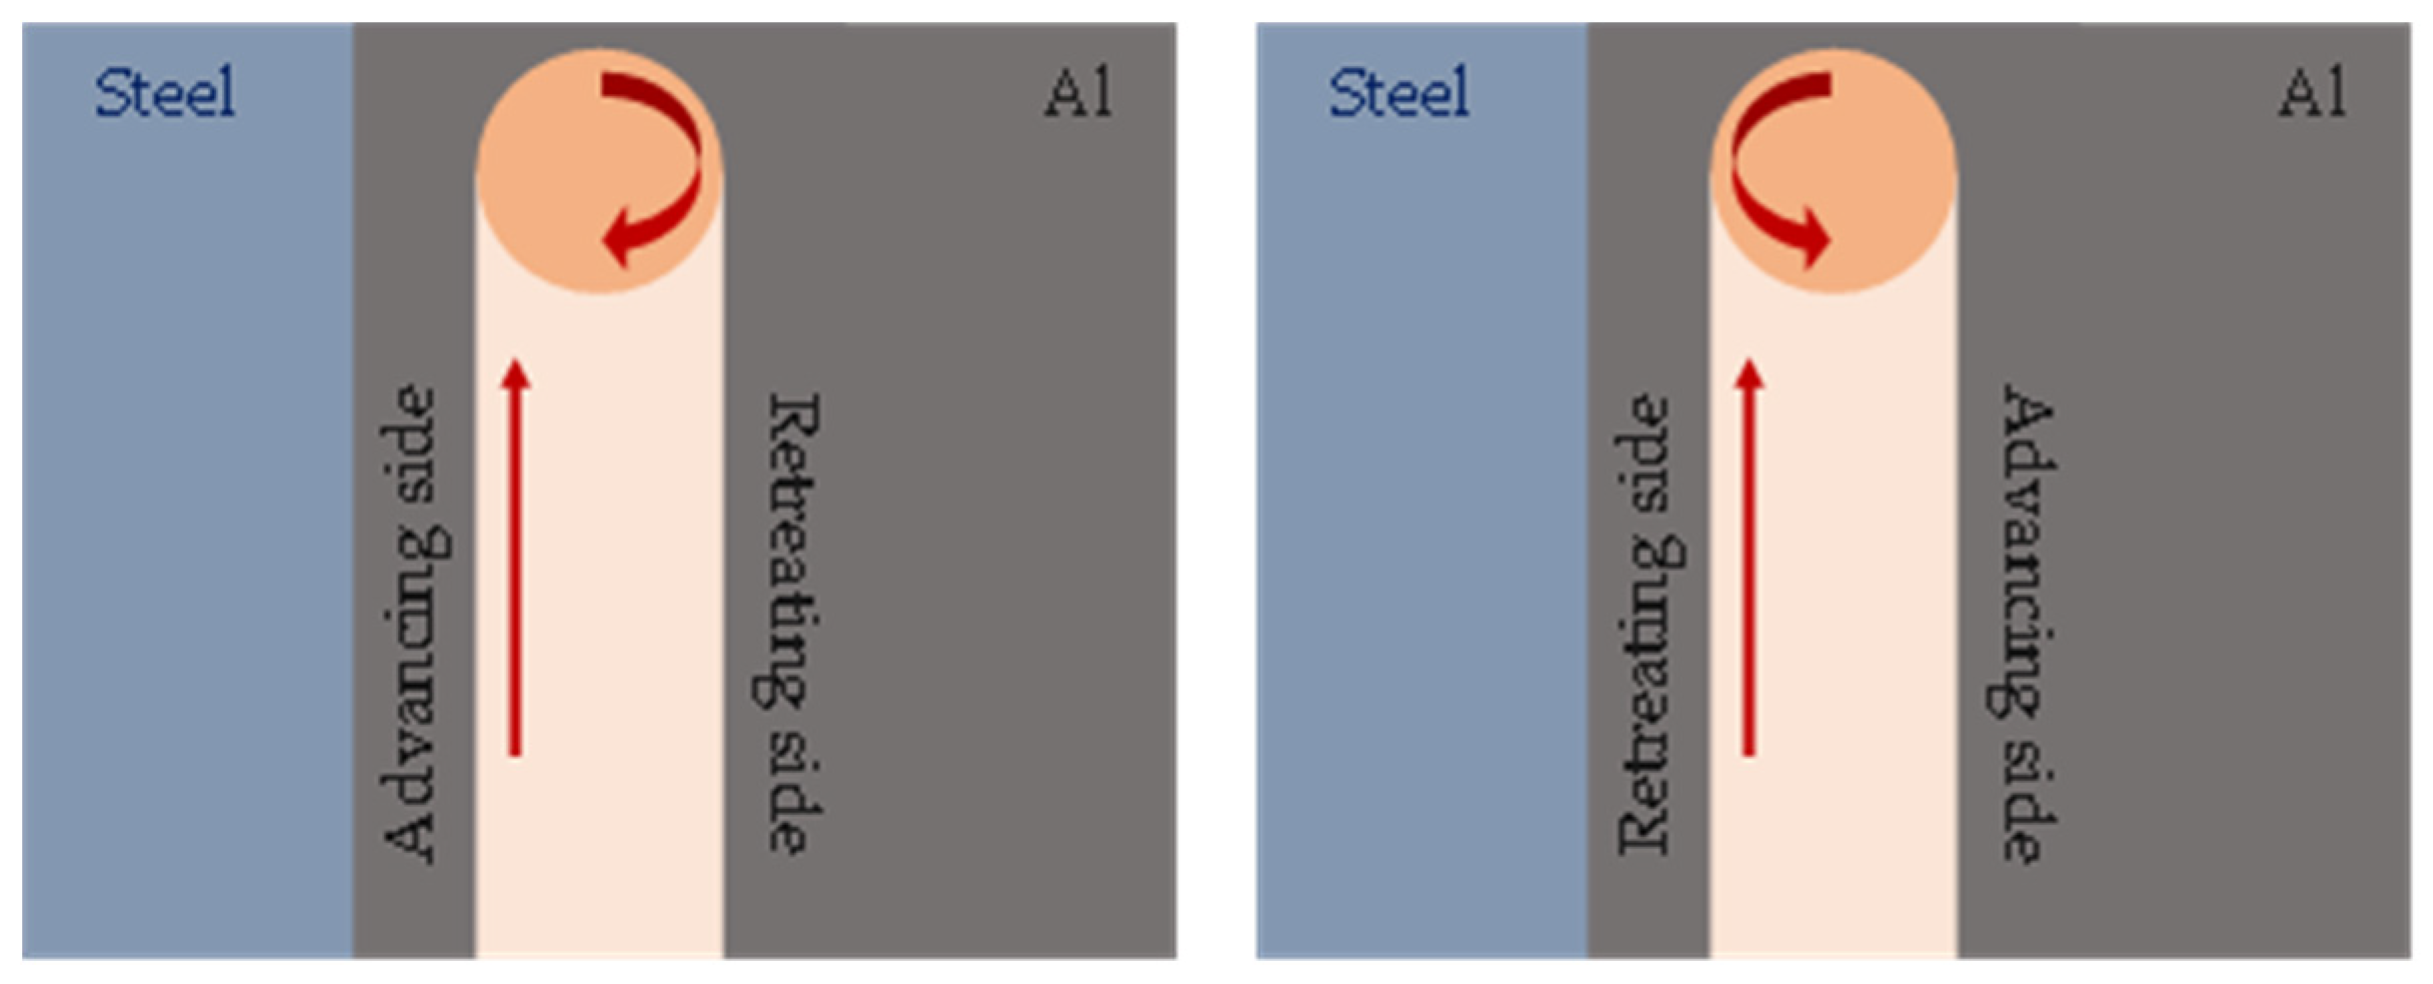
The joint was made using a welding speed of 300 mm/min at 400 rpm and with a force control of 30 kN, changing the feeding direction of the tool along the welding line, maintaining the same rotation’s direction of the tool (clockwise). In
Figure 1, the single lap friction stir welded joint between the aluminum alloy (AA5083-H111) and the steel sheet (S355-J0) is shown. To identify the direction of tool’s rotation: (i) AD, when the advancing side is by the side of the steel (lower plate), and (ii) R, when the retreating side is by the steel side (lower plate)
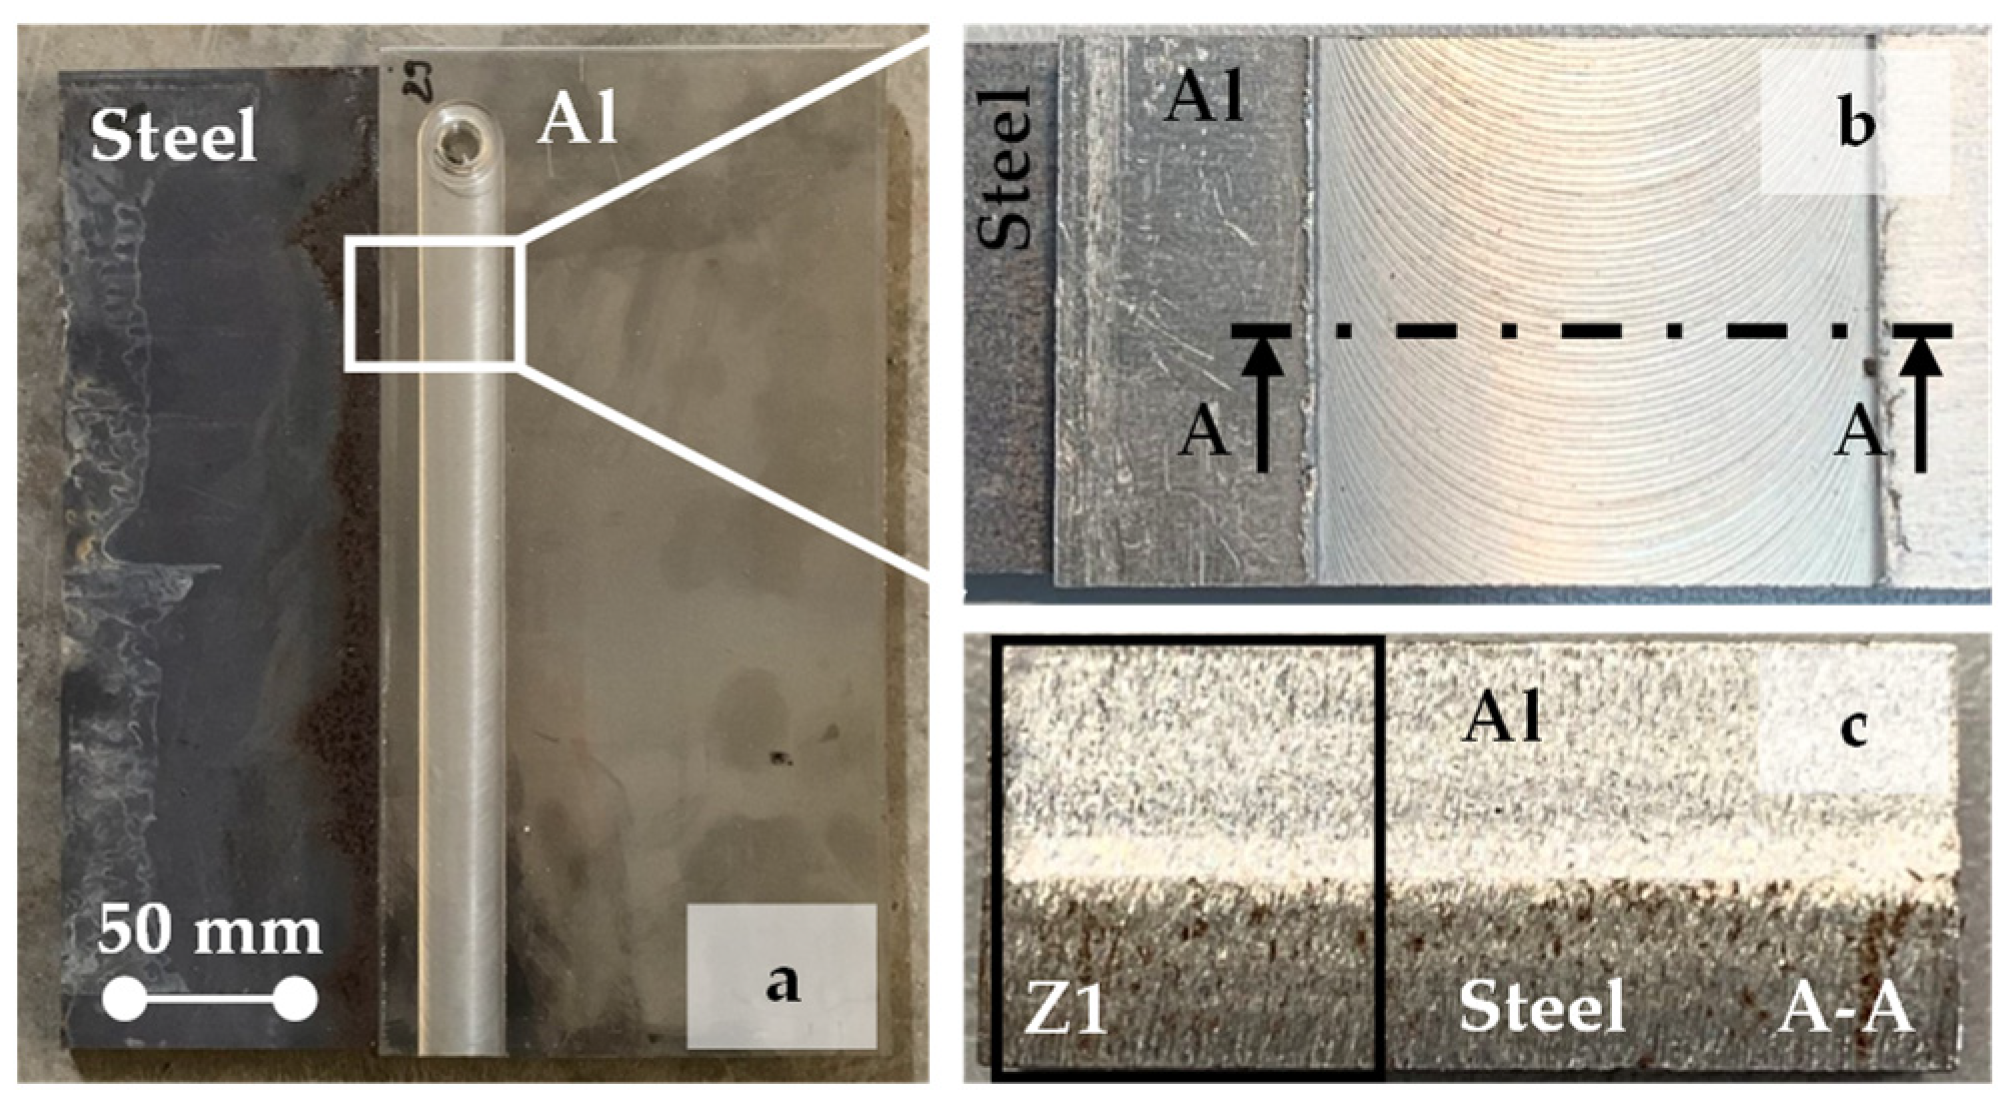
Figure 2 shows the section of the joint where the aluminum and steel subjected to the welding process are highlighted (aluminum/sheet metal interface).
The accelerated aging test was realized through the DCTC 600P salt spray chamber, located at the Department of Engineering of Messina, according to ISO 9227 and ASTM B117 standards.
Five aging points were then identified and reported in the following experimental plan, and then mechanical characterization tests were carried out through tensile tests using the Zwuick Roell Z600 tensile machine in the Structures Laboratory of the Engineering Department.
Table 3.
Experimental Plan Salt spray aging – Materials: AA5083- S355-J0.
Table 3.
Experimental Plan Salt spray aging – Materials: AA5083- S355-J0.
| Parameters: |
T0 |
T1 |
T2 |
T3 |
T4 |
T5 |
Months (5 Ageing points)
Welding Direction
|
2 |
4 |
6 |
8 |
10 |
12 |
| (Advancing/Retreating) |
x |
x |
x |
x |
x |
x |
The nomenclature used for the samples subjected to accelerated aging tests is given below; for the specimens obtained through Friction Stir Welding, the wording FSW_AD_N and FSW_R_T_n has been used, where:
For example, the wording FSW_R_T1 correspond to the sample made with Friction Stear Welding in retreating side and tested at time T1, i.e. at two months of accelerated aging.The joints were mechanically characterized through a Zwick/Roell Z600 testing machine with a 600 kN load cell, equipped with a 10 kN load cell, in accordance with UNI EN ISO 12996. The crosshead rate was set to 1 mm/min. For each configuration (i.e., advancing and retreating), five samples were tested.
3. Results
3.1. Falure Modes
The
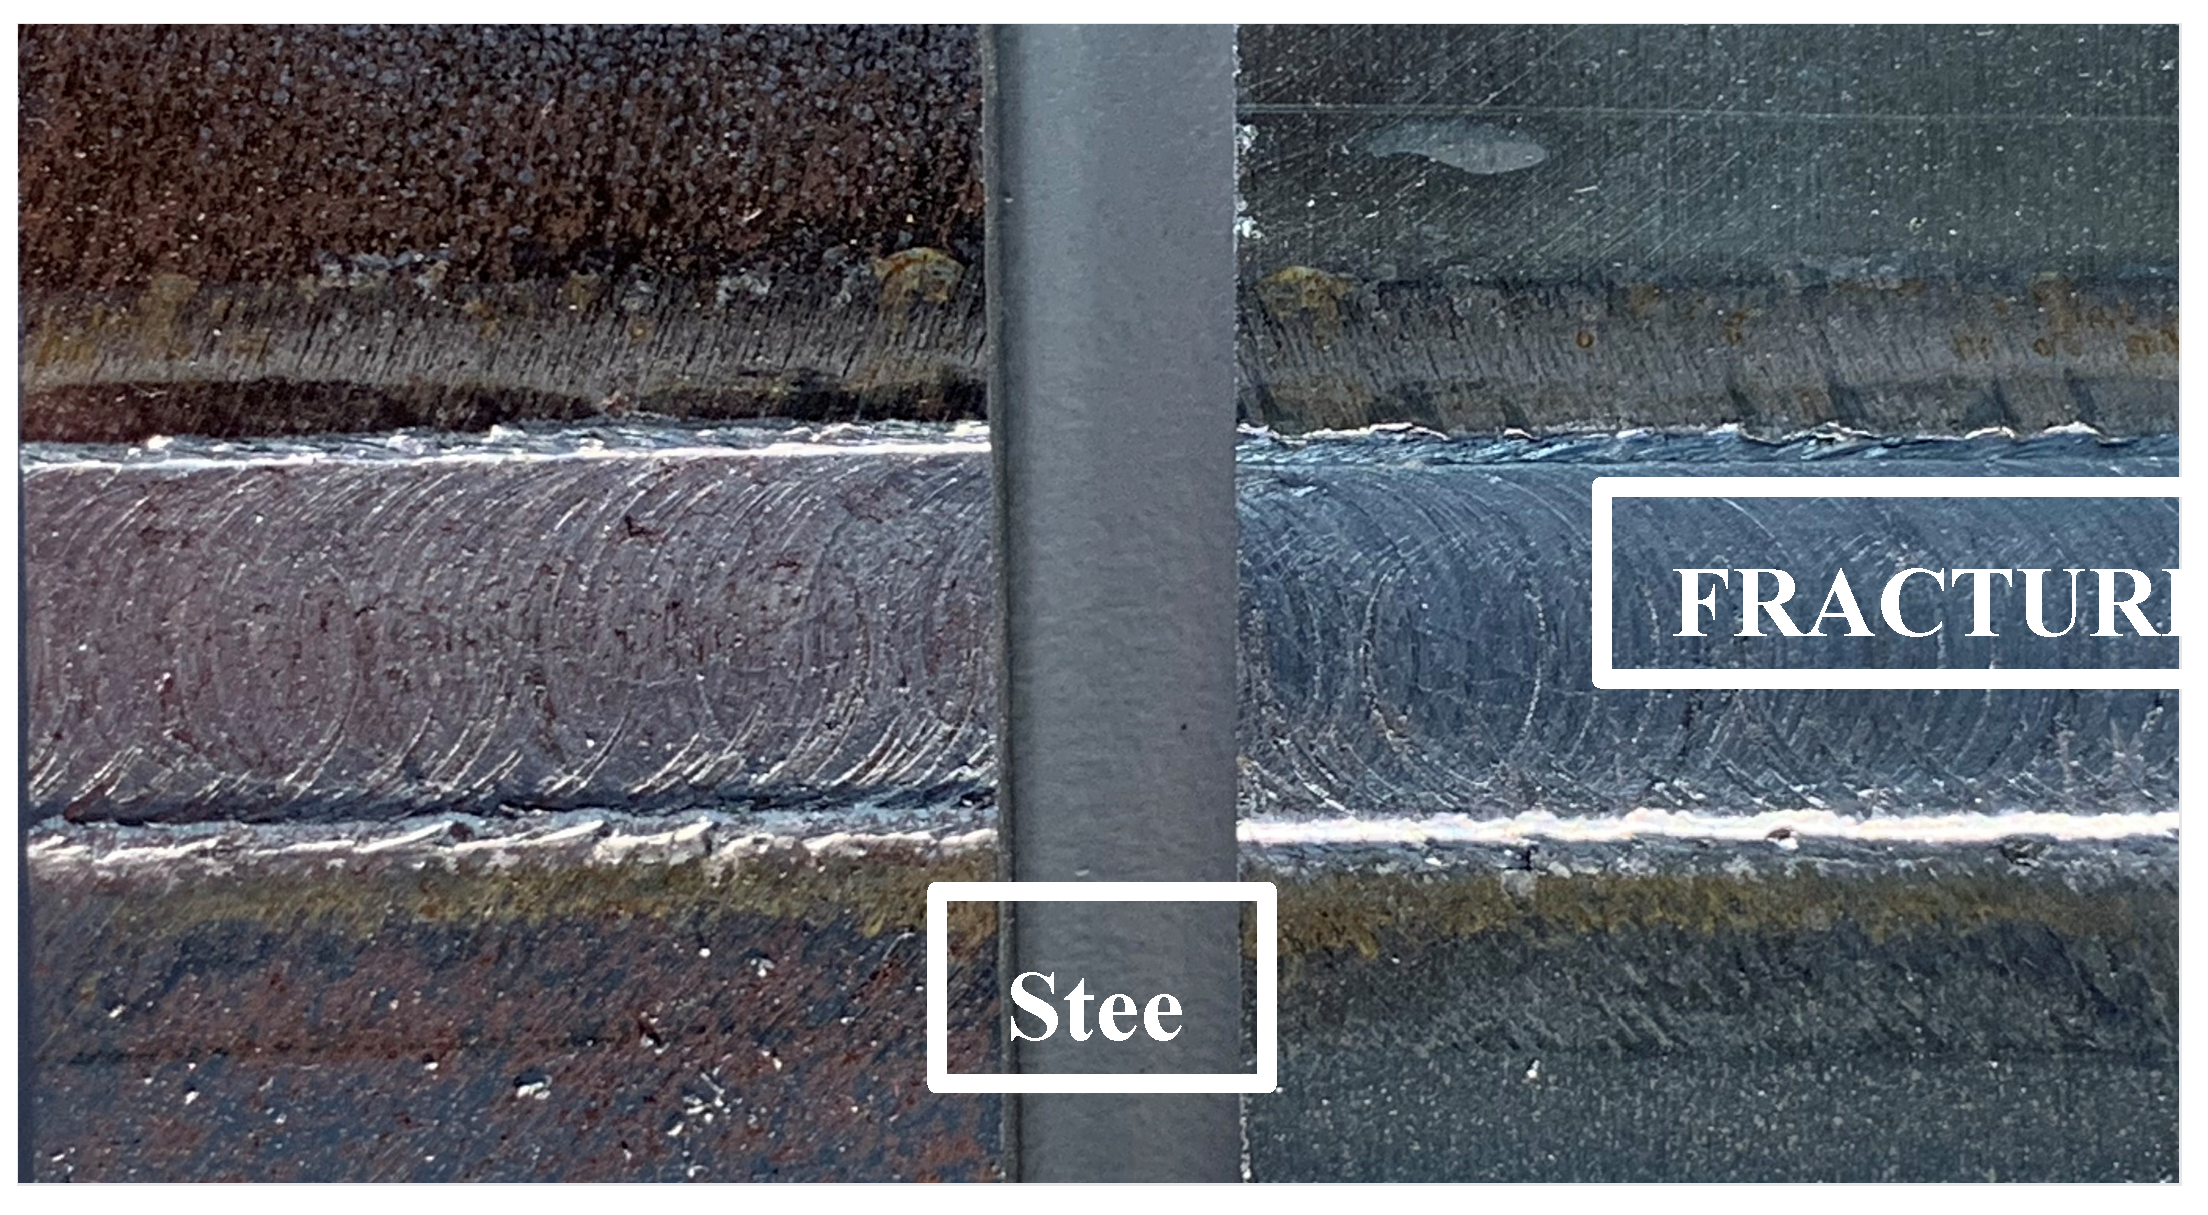
Figure 3 shows the typical failure mode of a joint made for FSW, it is possible to observe the joint area between the steel and the aluminum where the lines produced by the pin during the feed are evident.
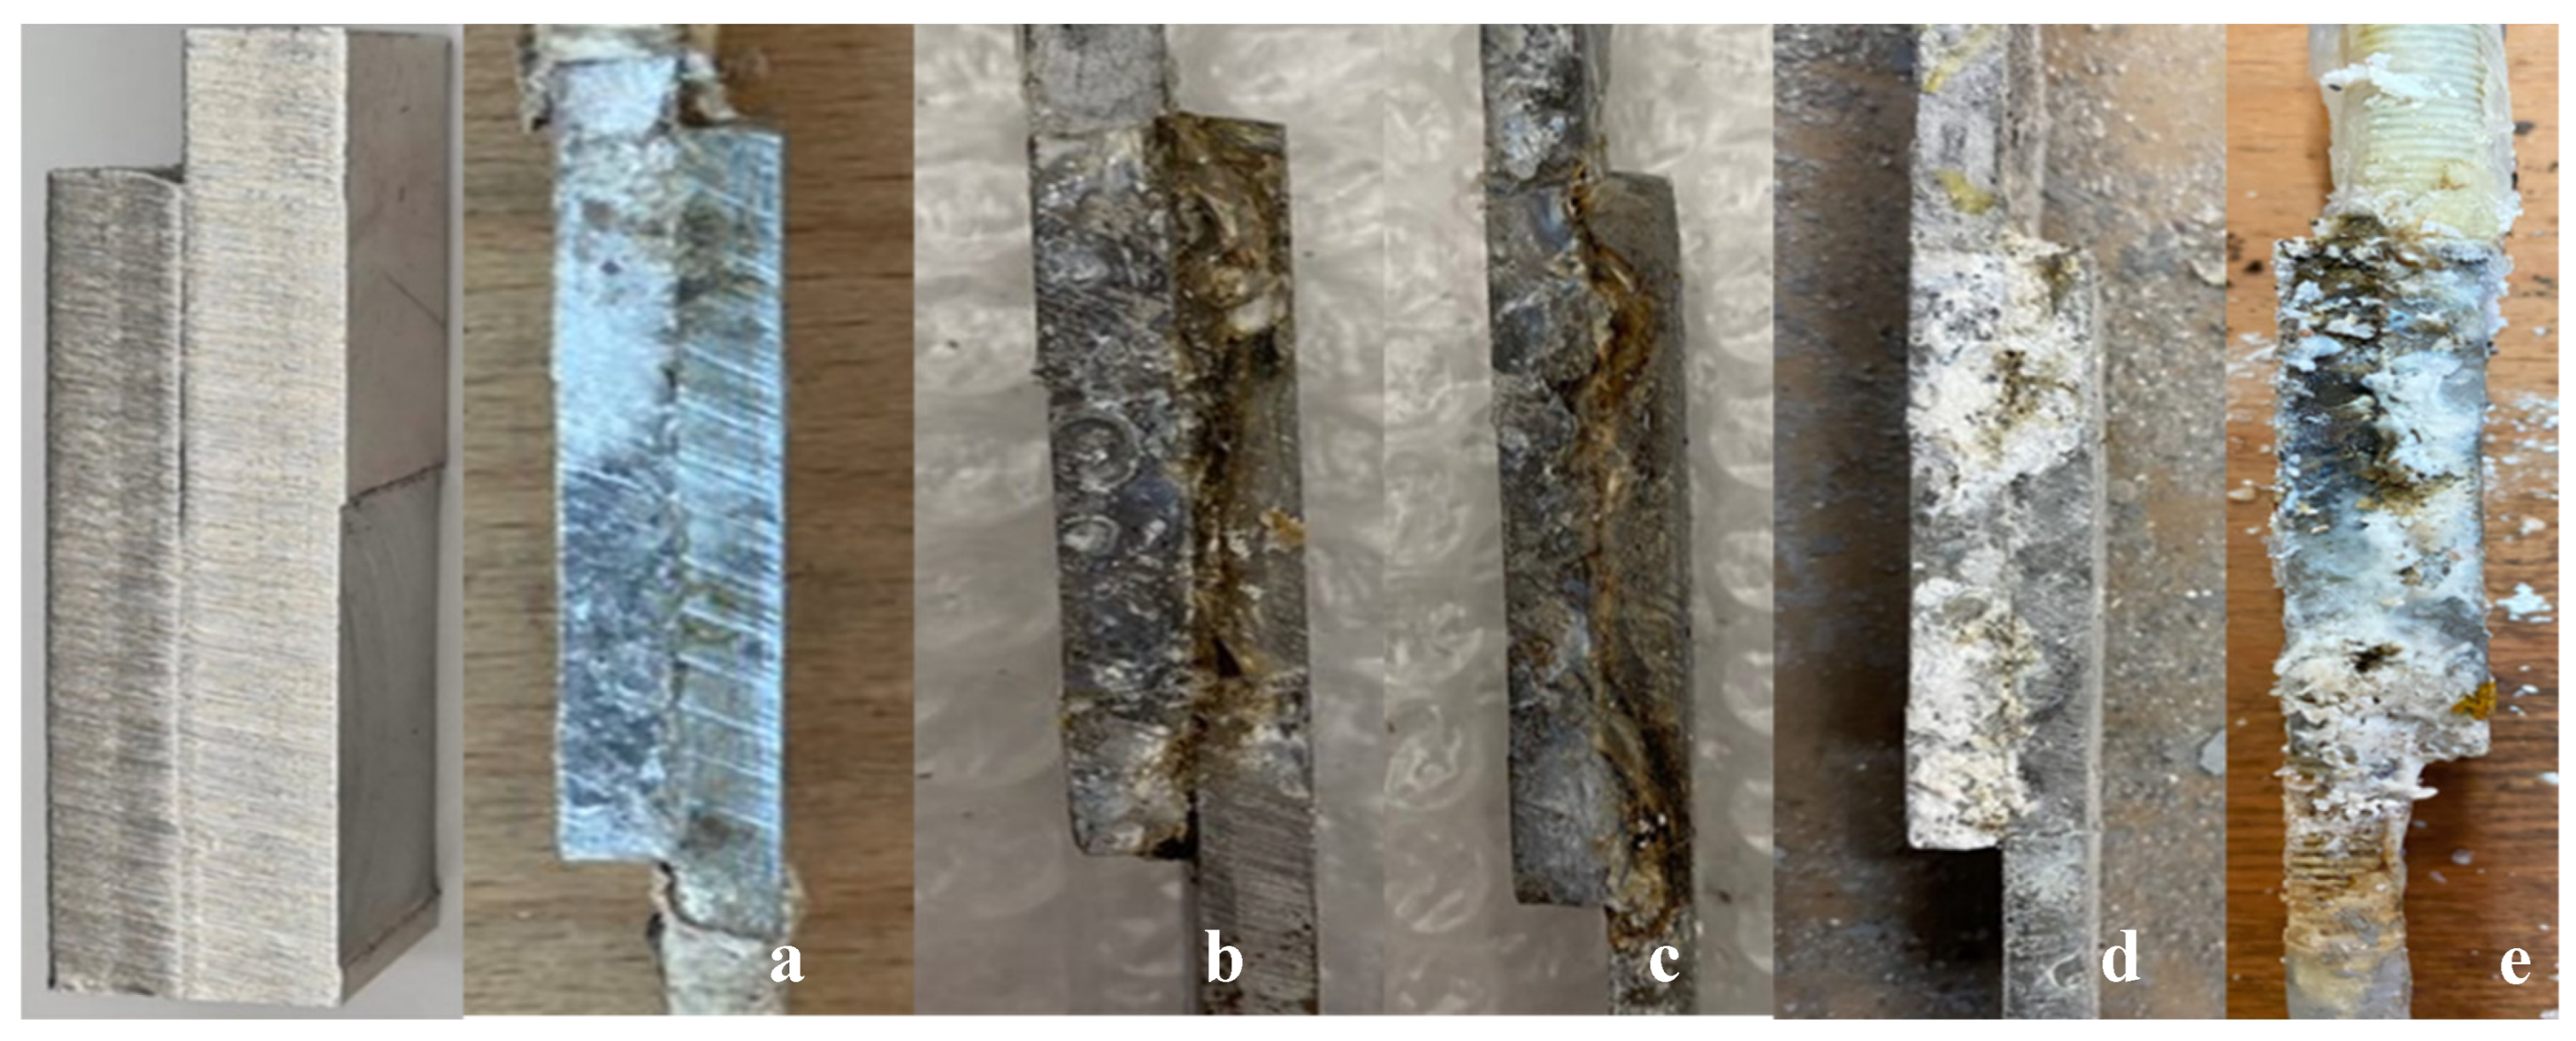
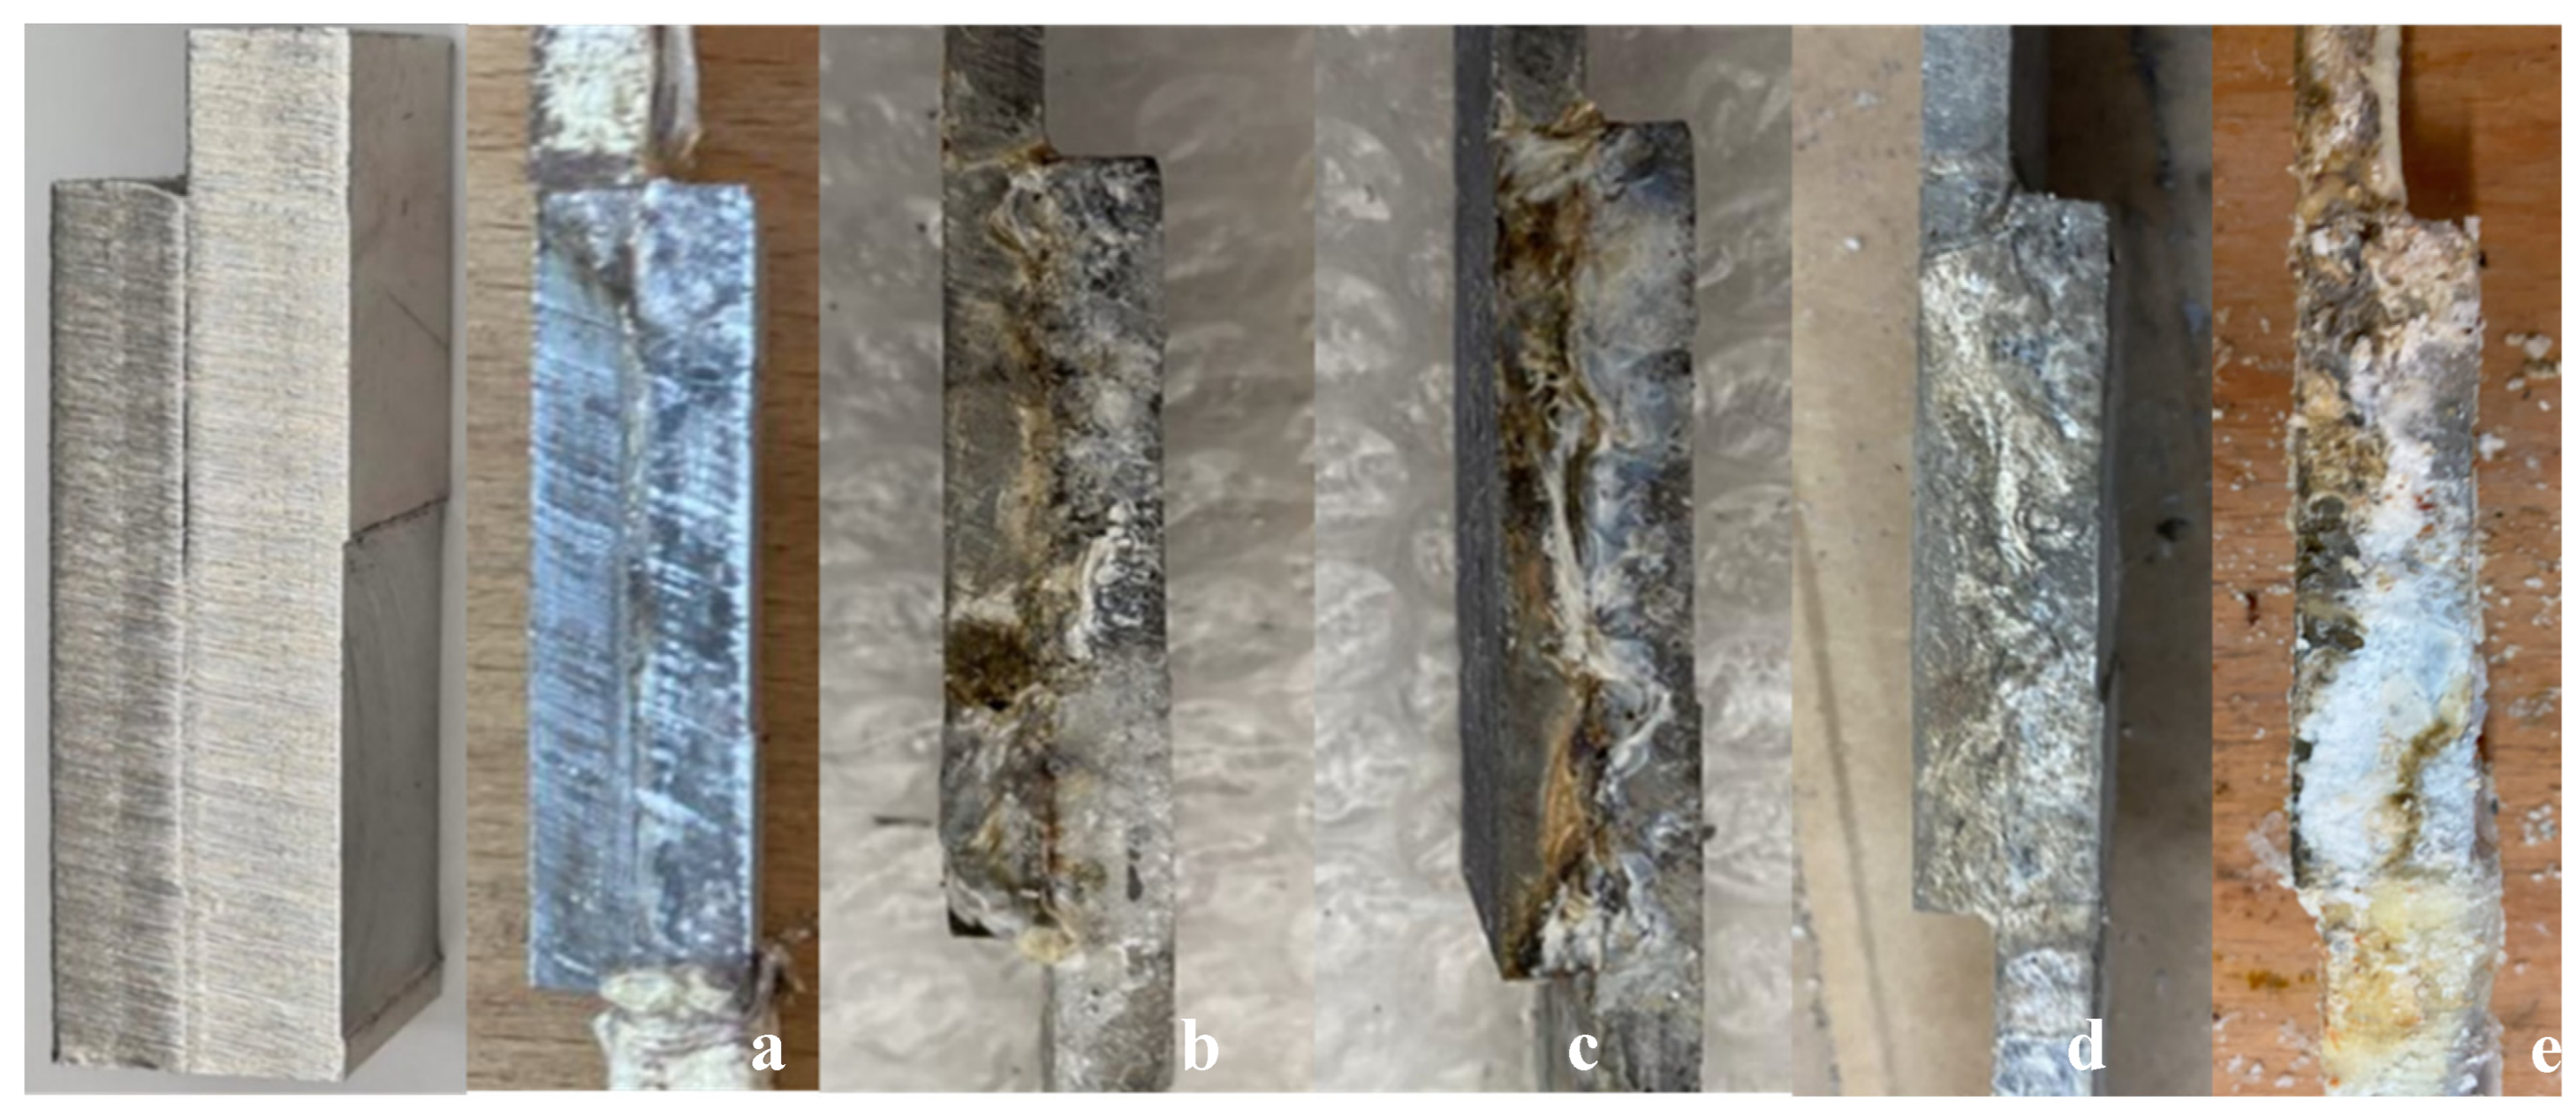
Figure 4 and
Figure 5 show the evolution of the decay of the tested joints due to corrosion, for all established aging points.
The corrosion process is triggered and slowly proceeds over time without causing the joint to collapse. As time increases, It is interesting to note that the joints at the end of the experiment have a limited corrosion at the interface, this means that the response of the joints was not homogeneous, those that did not break during aging, sometimes resisted while maintaining a high resistance value, comparable to the initial one at T0.
3.2. Tensile Test
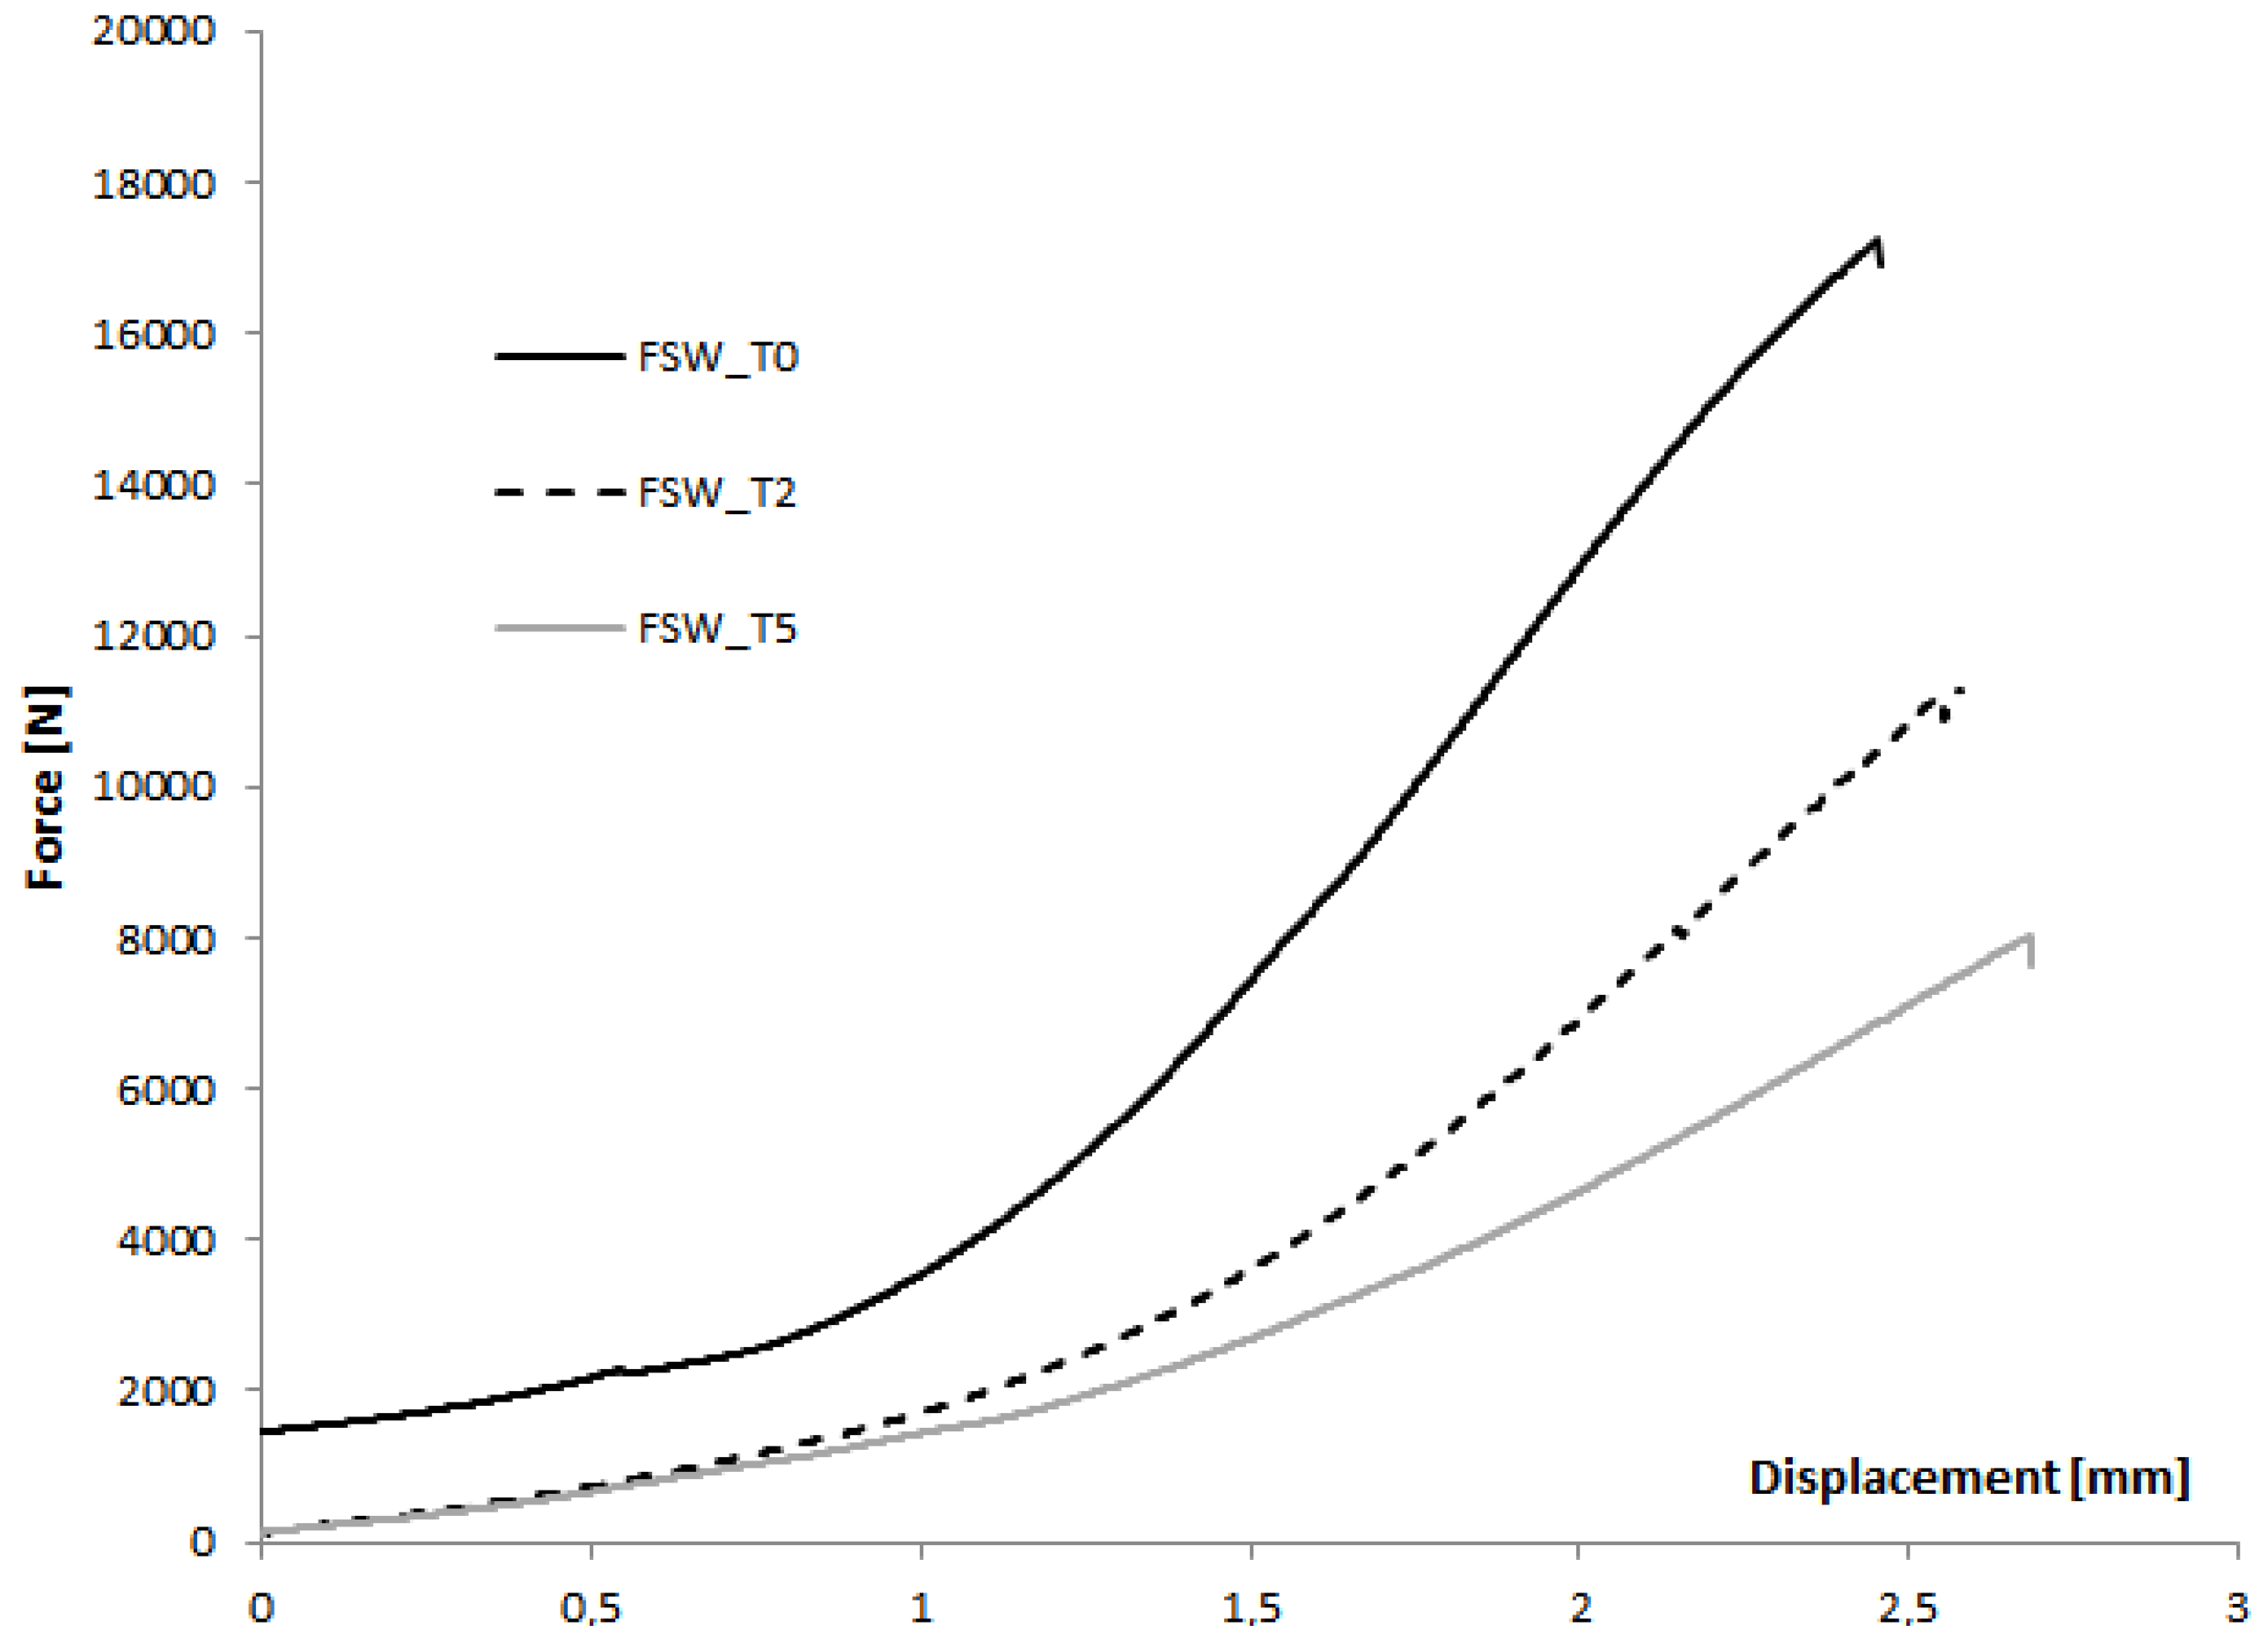
Figure 6 reports typical load-displacement curves for all the investigated parameters. These are characterized by the same trend, and they are almost overlapping. For all the samples, the curve is characterized by two regions with different slopes. Firstly, the load slightly increases due to small settlings in the areas around the weld. Then, the load abruptly increases until it reaches the maximum value corresponding to the failure of the joint. From the analysis of the Force/Displacement curves, a significant decrease in load up to 40% of the initial value is observed already at the second month of aging and the welding technique, in advancing and retreating side, no longer seems to influence the failure mode.
4. Discussion
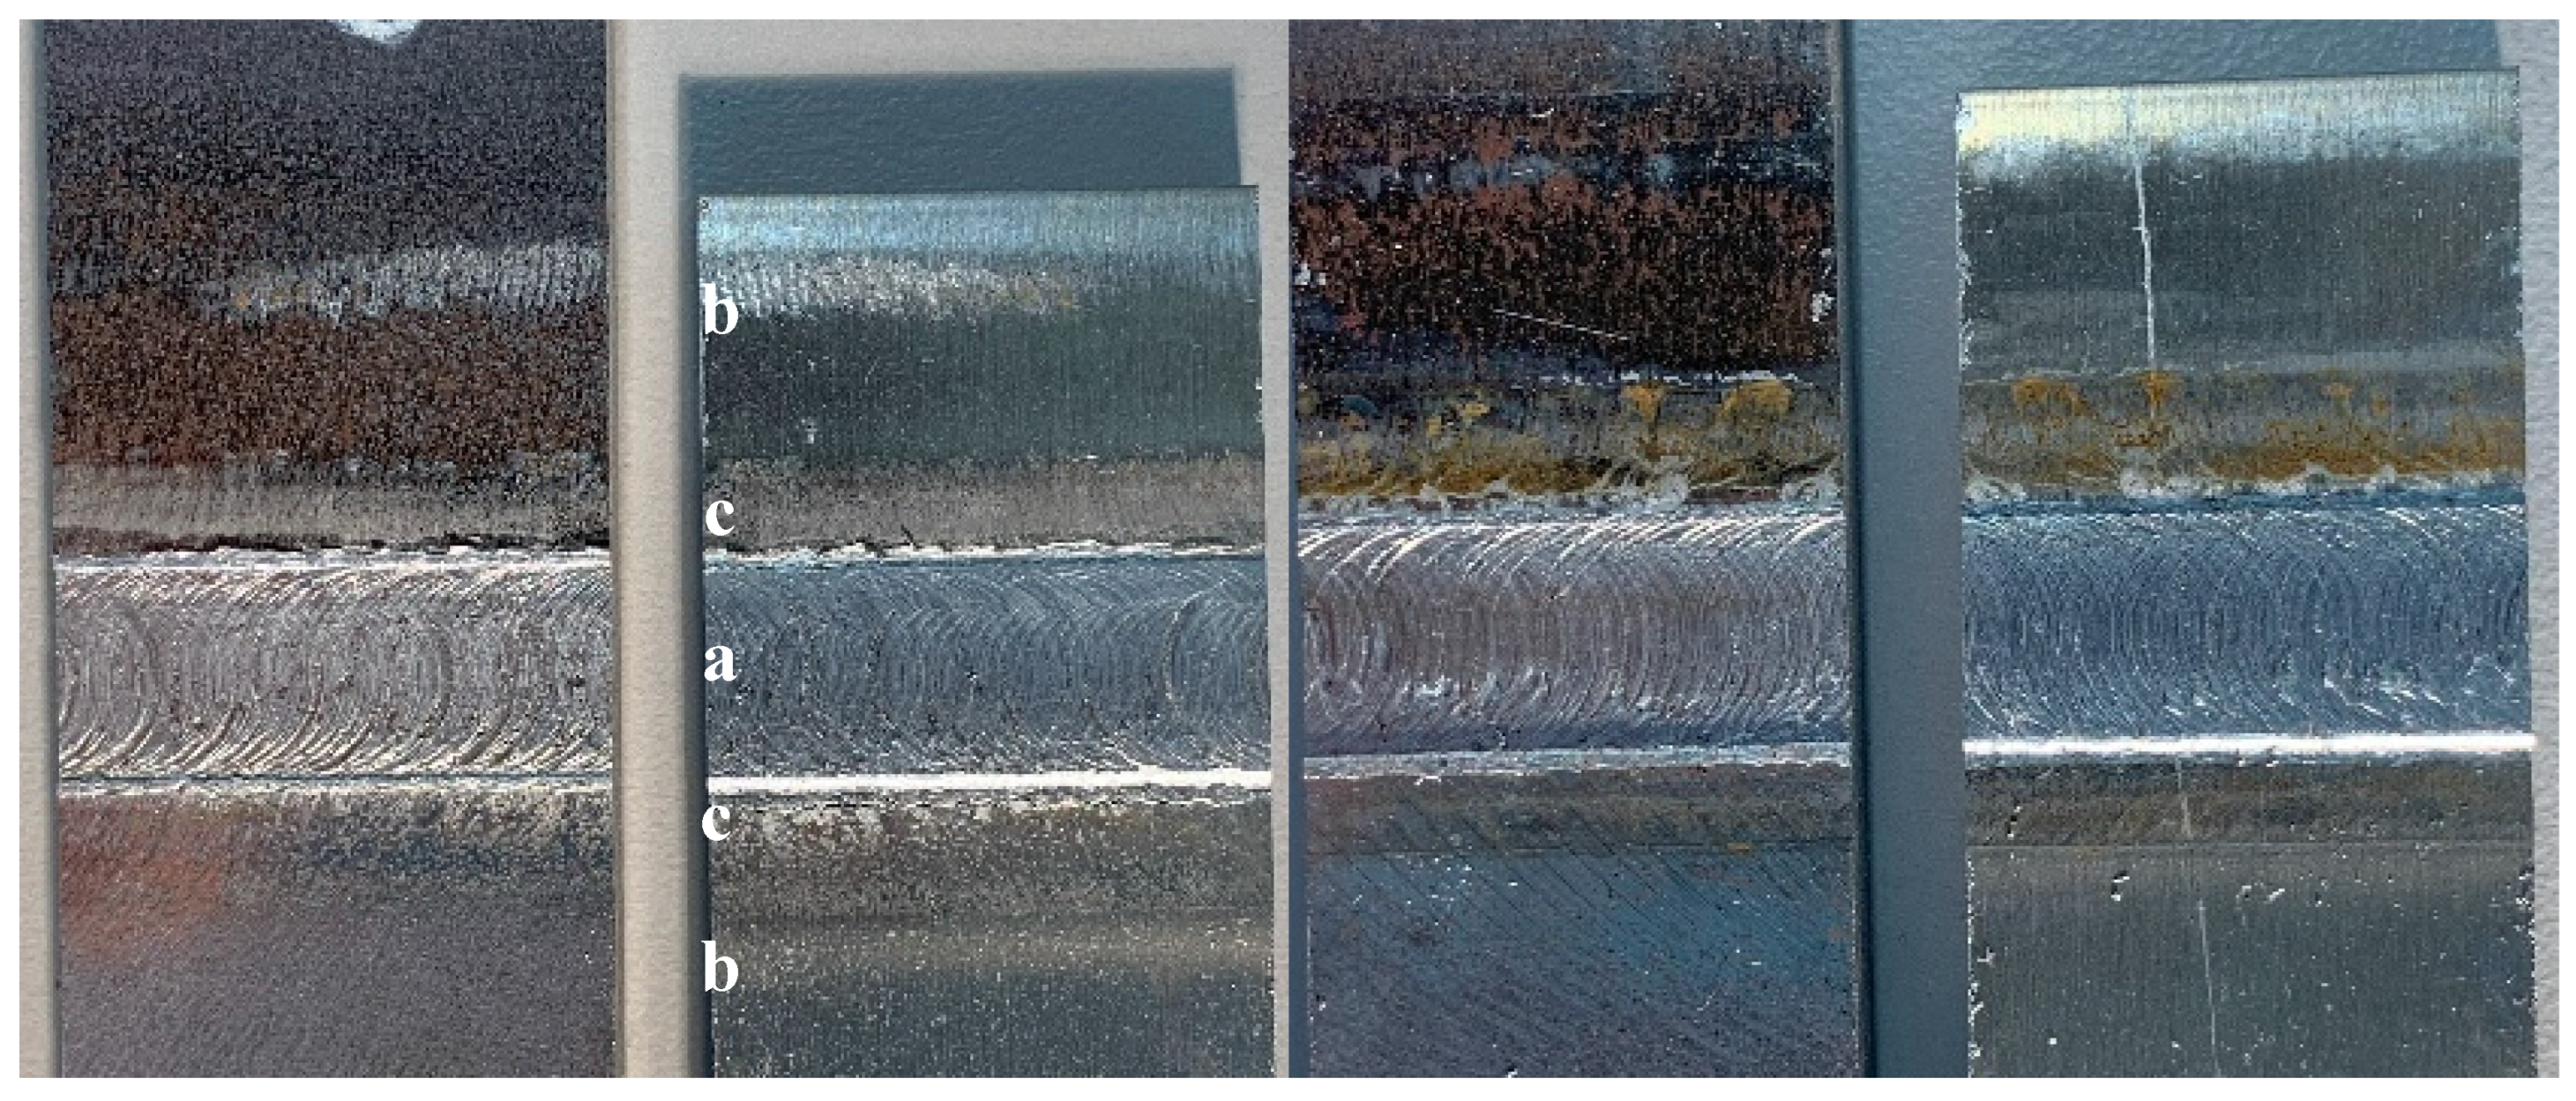
Figure 7,
Figure 8,
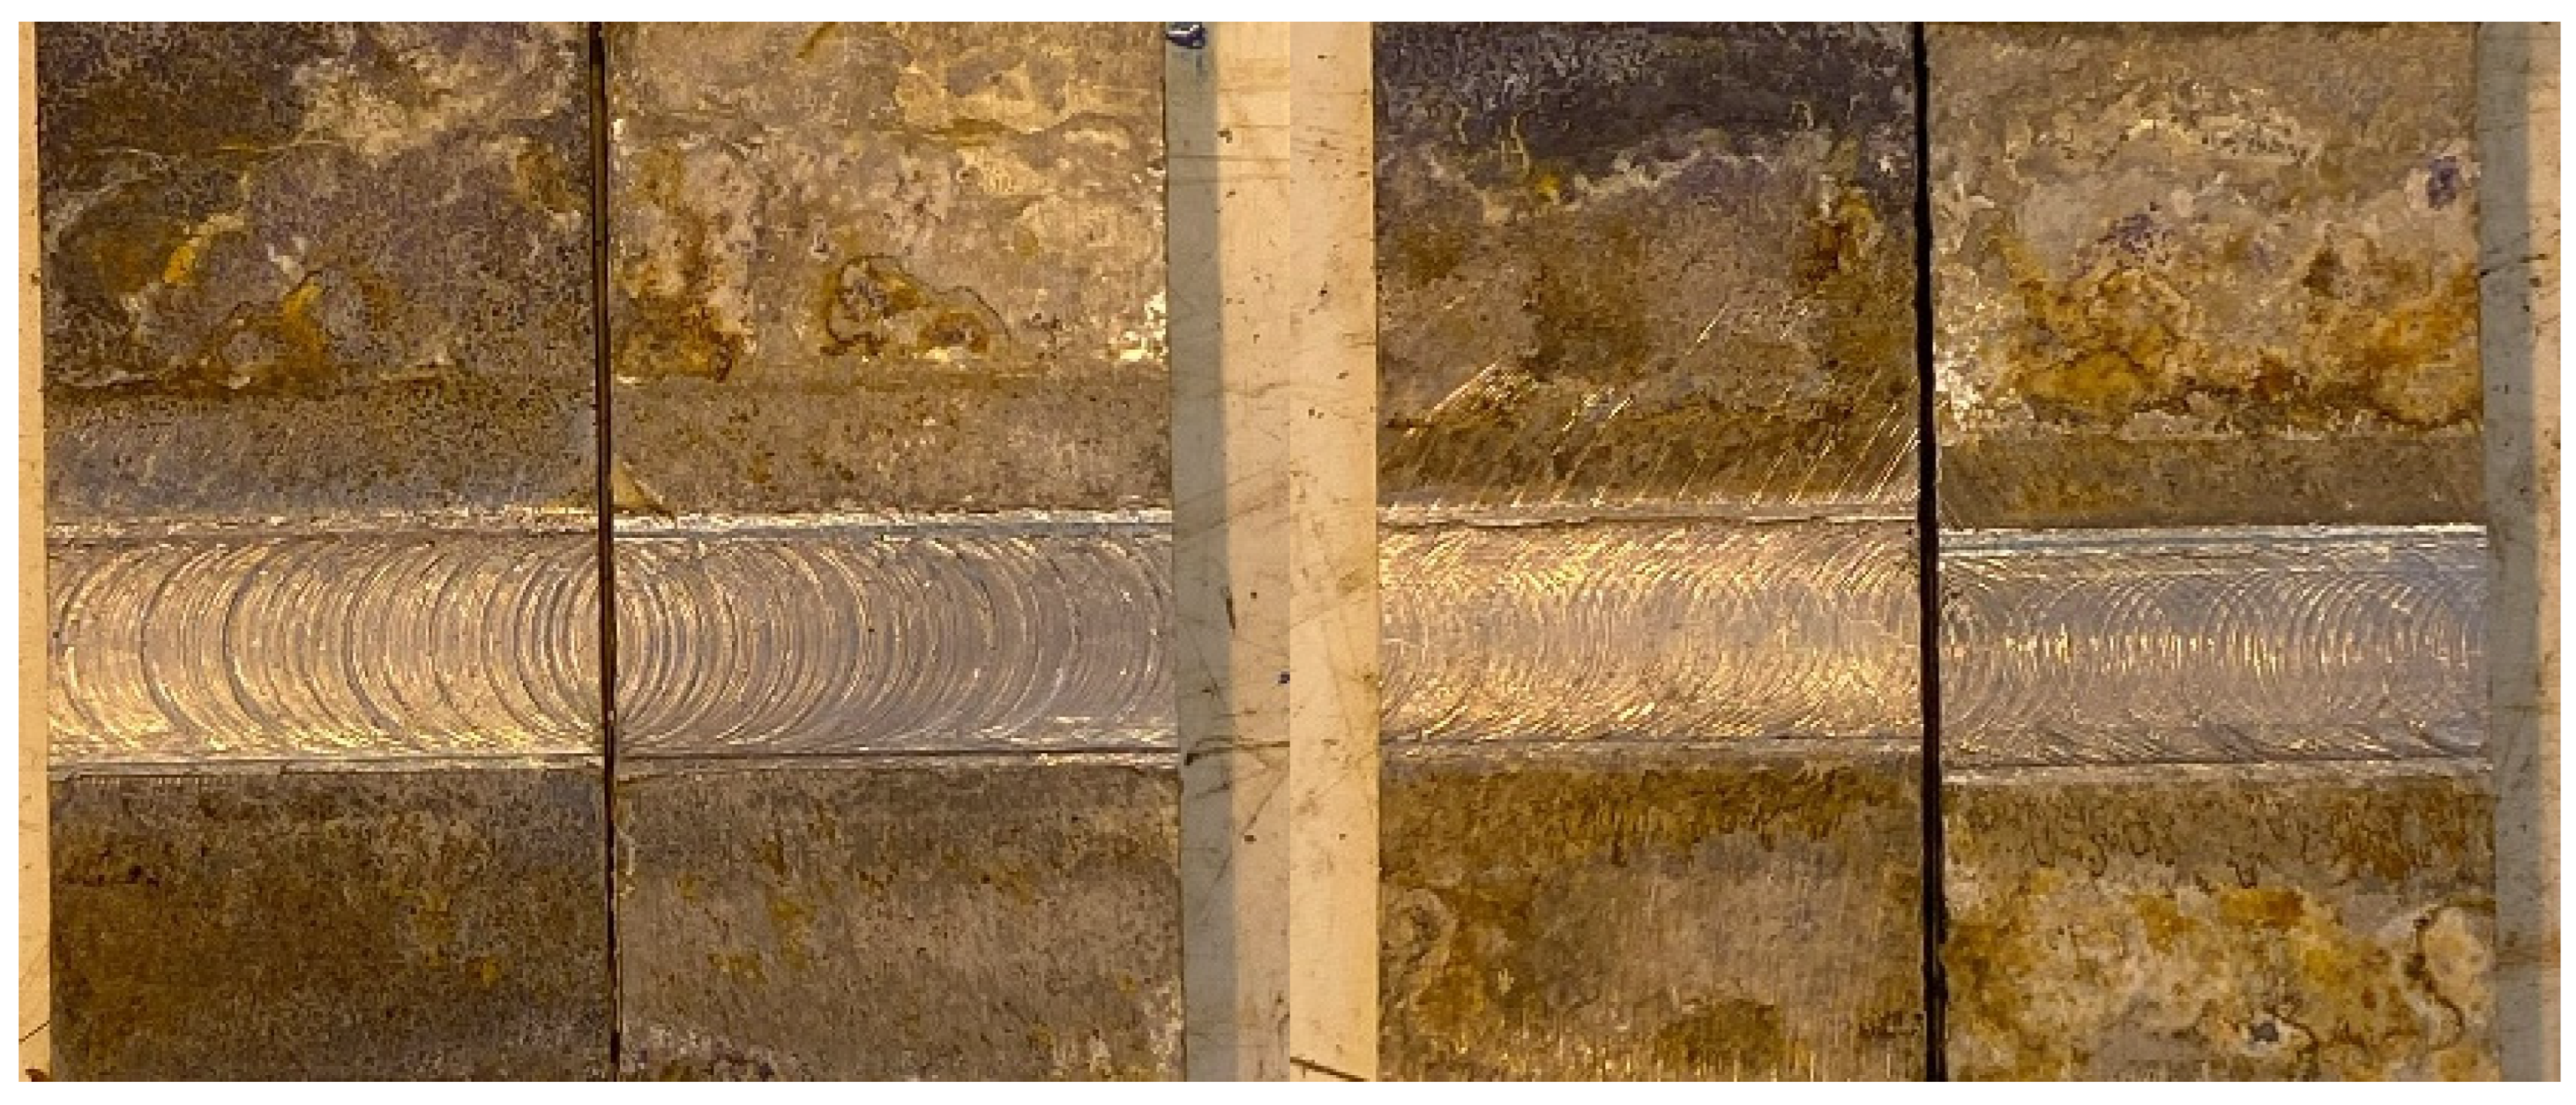
Figure 9,
Figure 10,
Figure 11 and
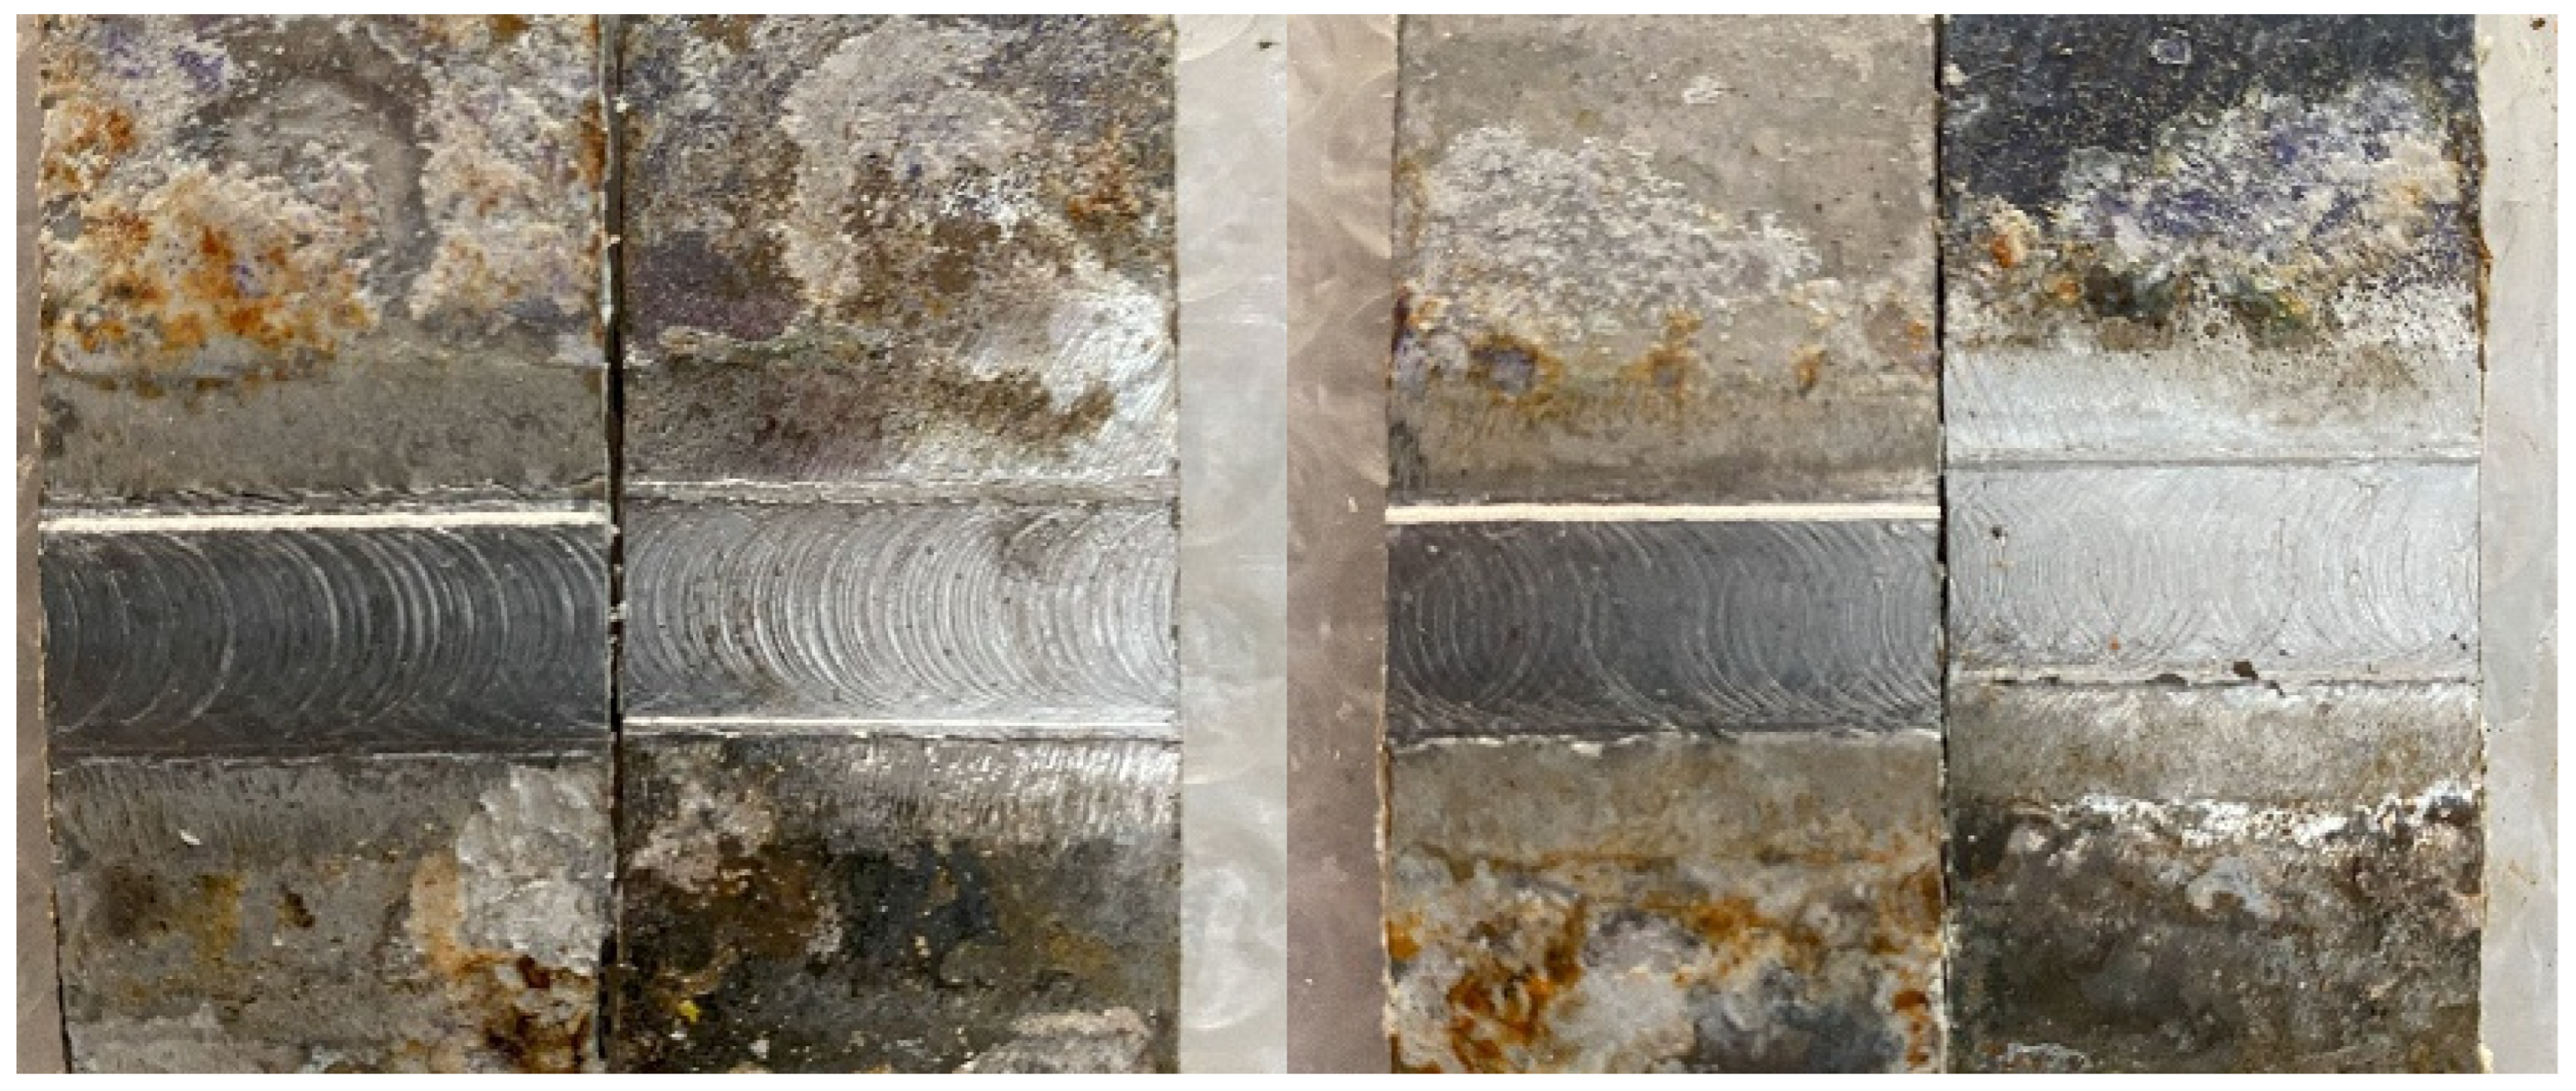
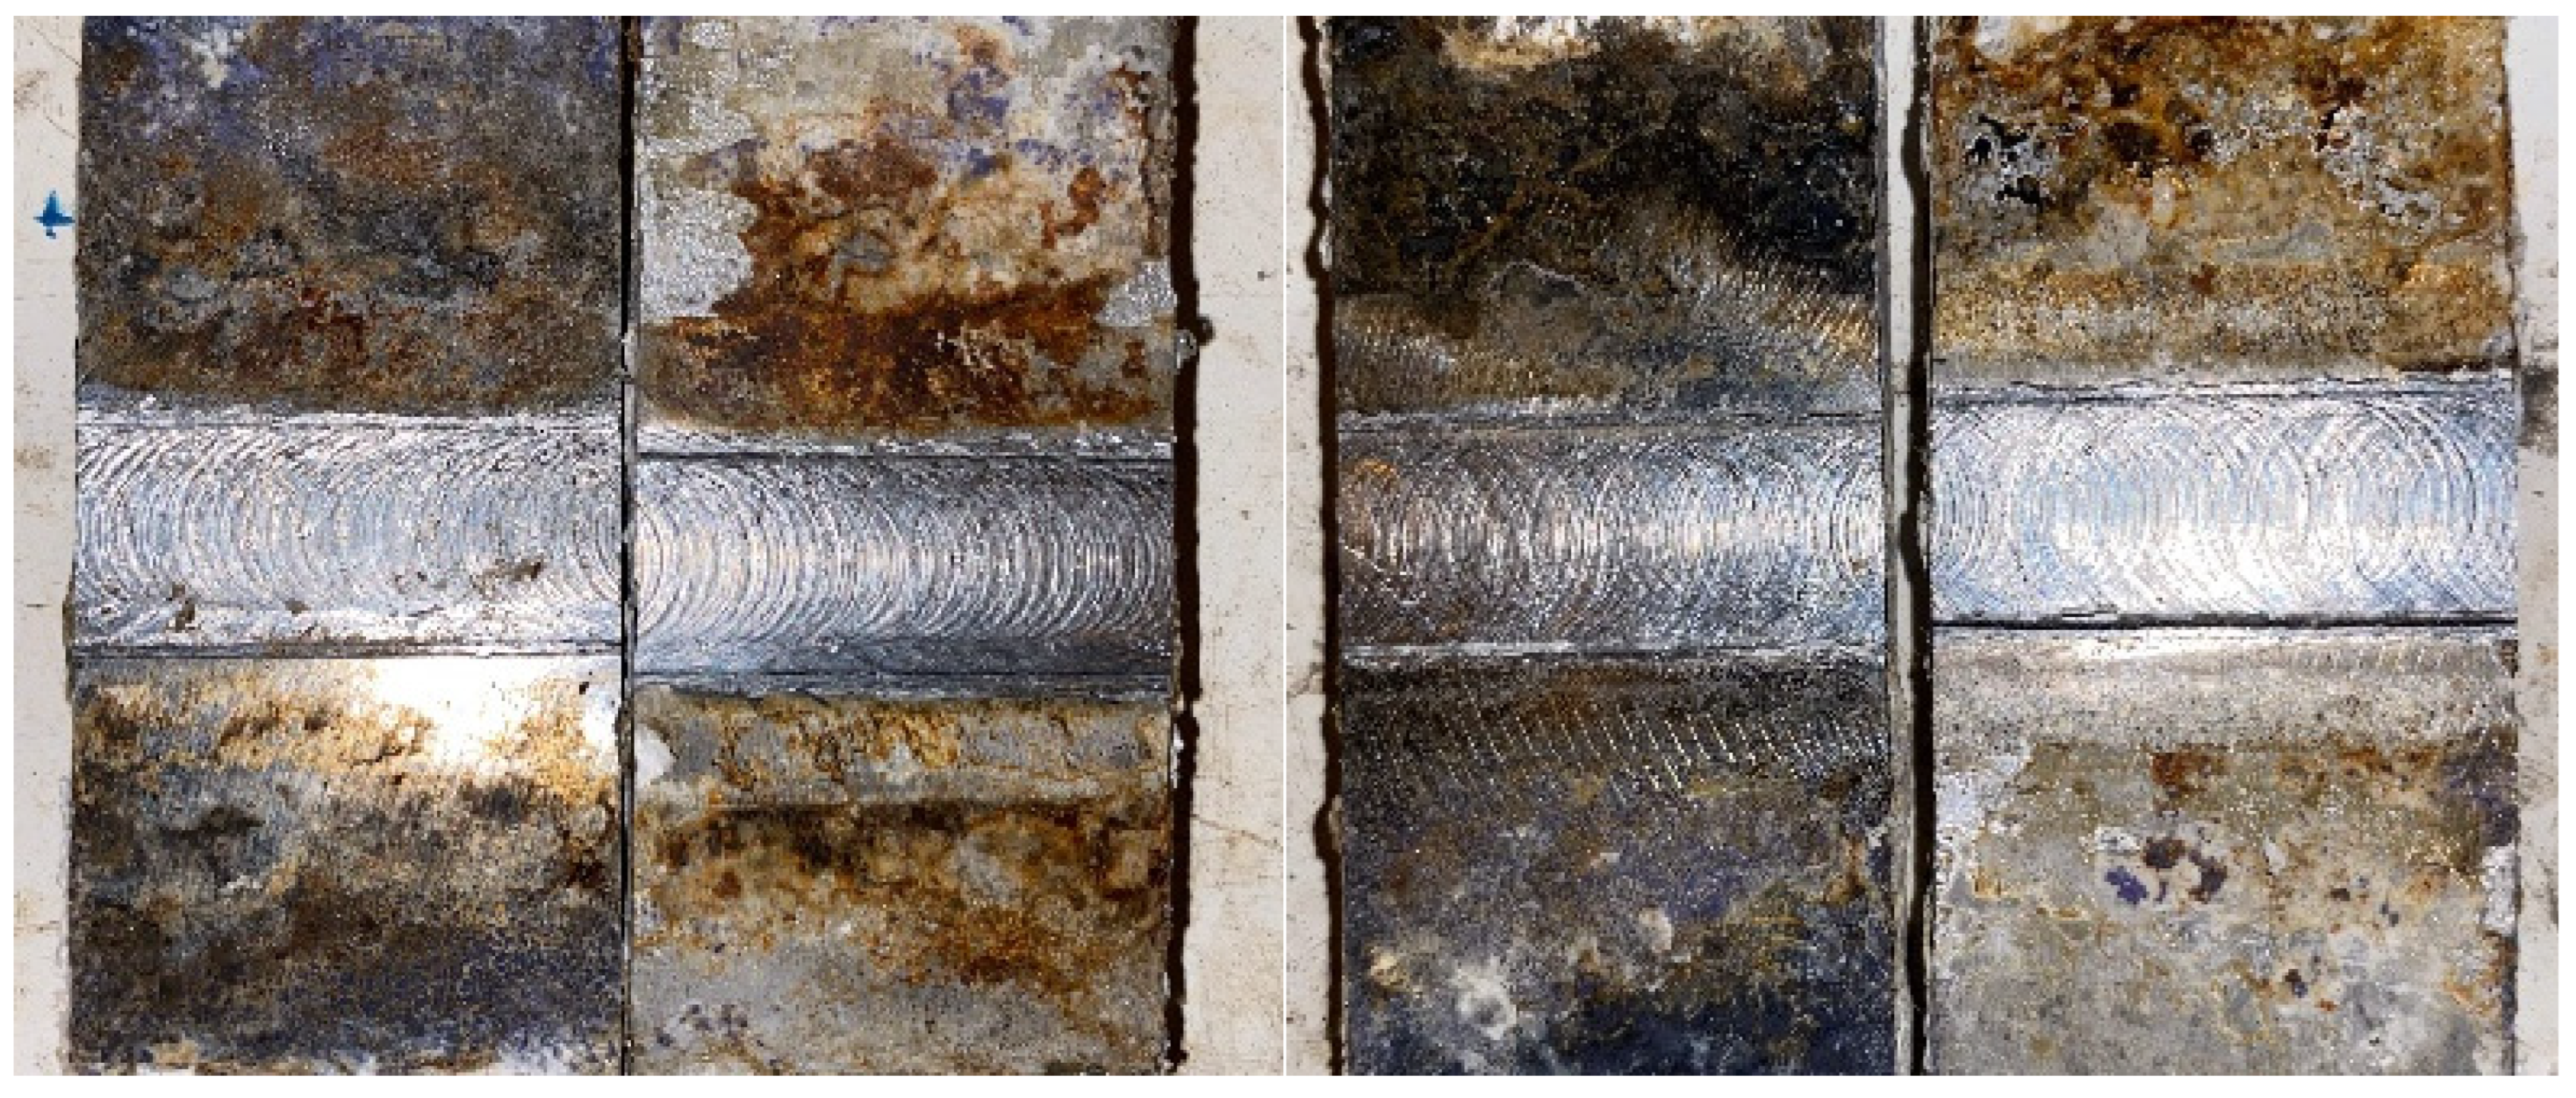
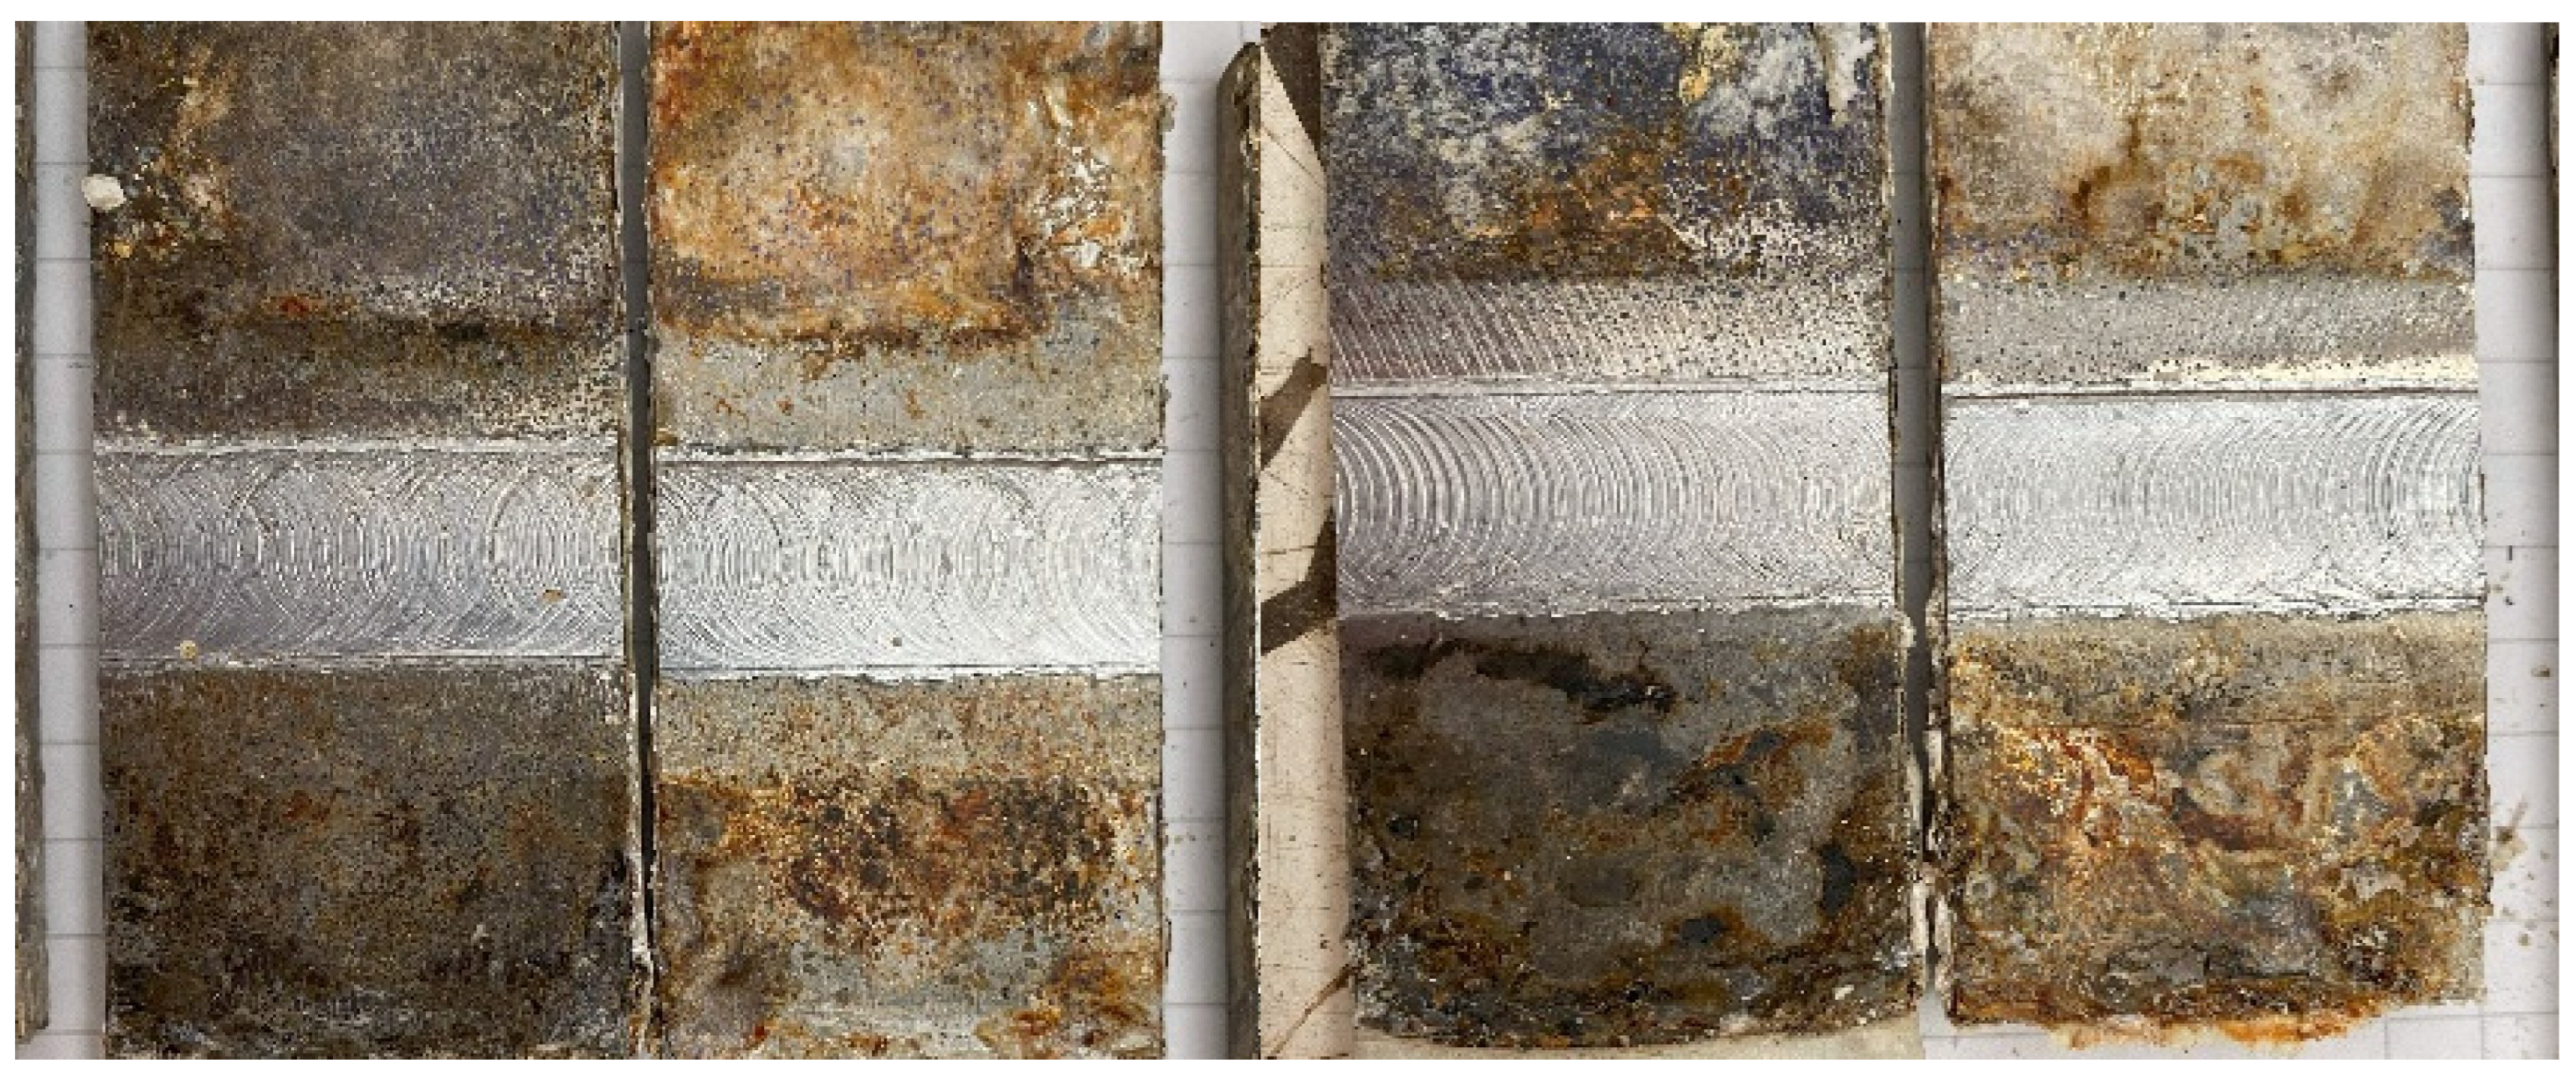
Figure 12 shows the interfaces of the broken samples produced in advancing and retreating side, subjected to accelerated aging, from time T0 to time T5, which corresponds to 12 months. The results show, regardless of the welding direction, that the breakage occurs at the junction interface. A preliminary visual analysis shows that by increasing the time spent in the salt spray chamber, corrosion also increases.
Particularly, it is possible to observe that:
The performed experimental campaign was based on a Design of Experiment with two factors (namely Month and Welding direction), respectively with 6 and 2 levels (namely T0-T5 and AD/R).
With the Minitab® software, a variance analysis was performed aiming to evaluate if the difference in mechanical properties (Maximum Load and displacement at maximum load) between the joint realized in advancing side or in retreating side is significant, at varying the ageing time.
The whole experimental data are reported in the next
Figure 13.
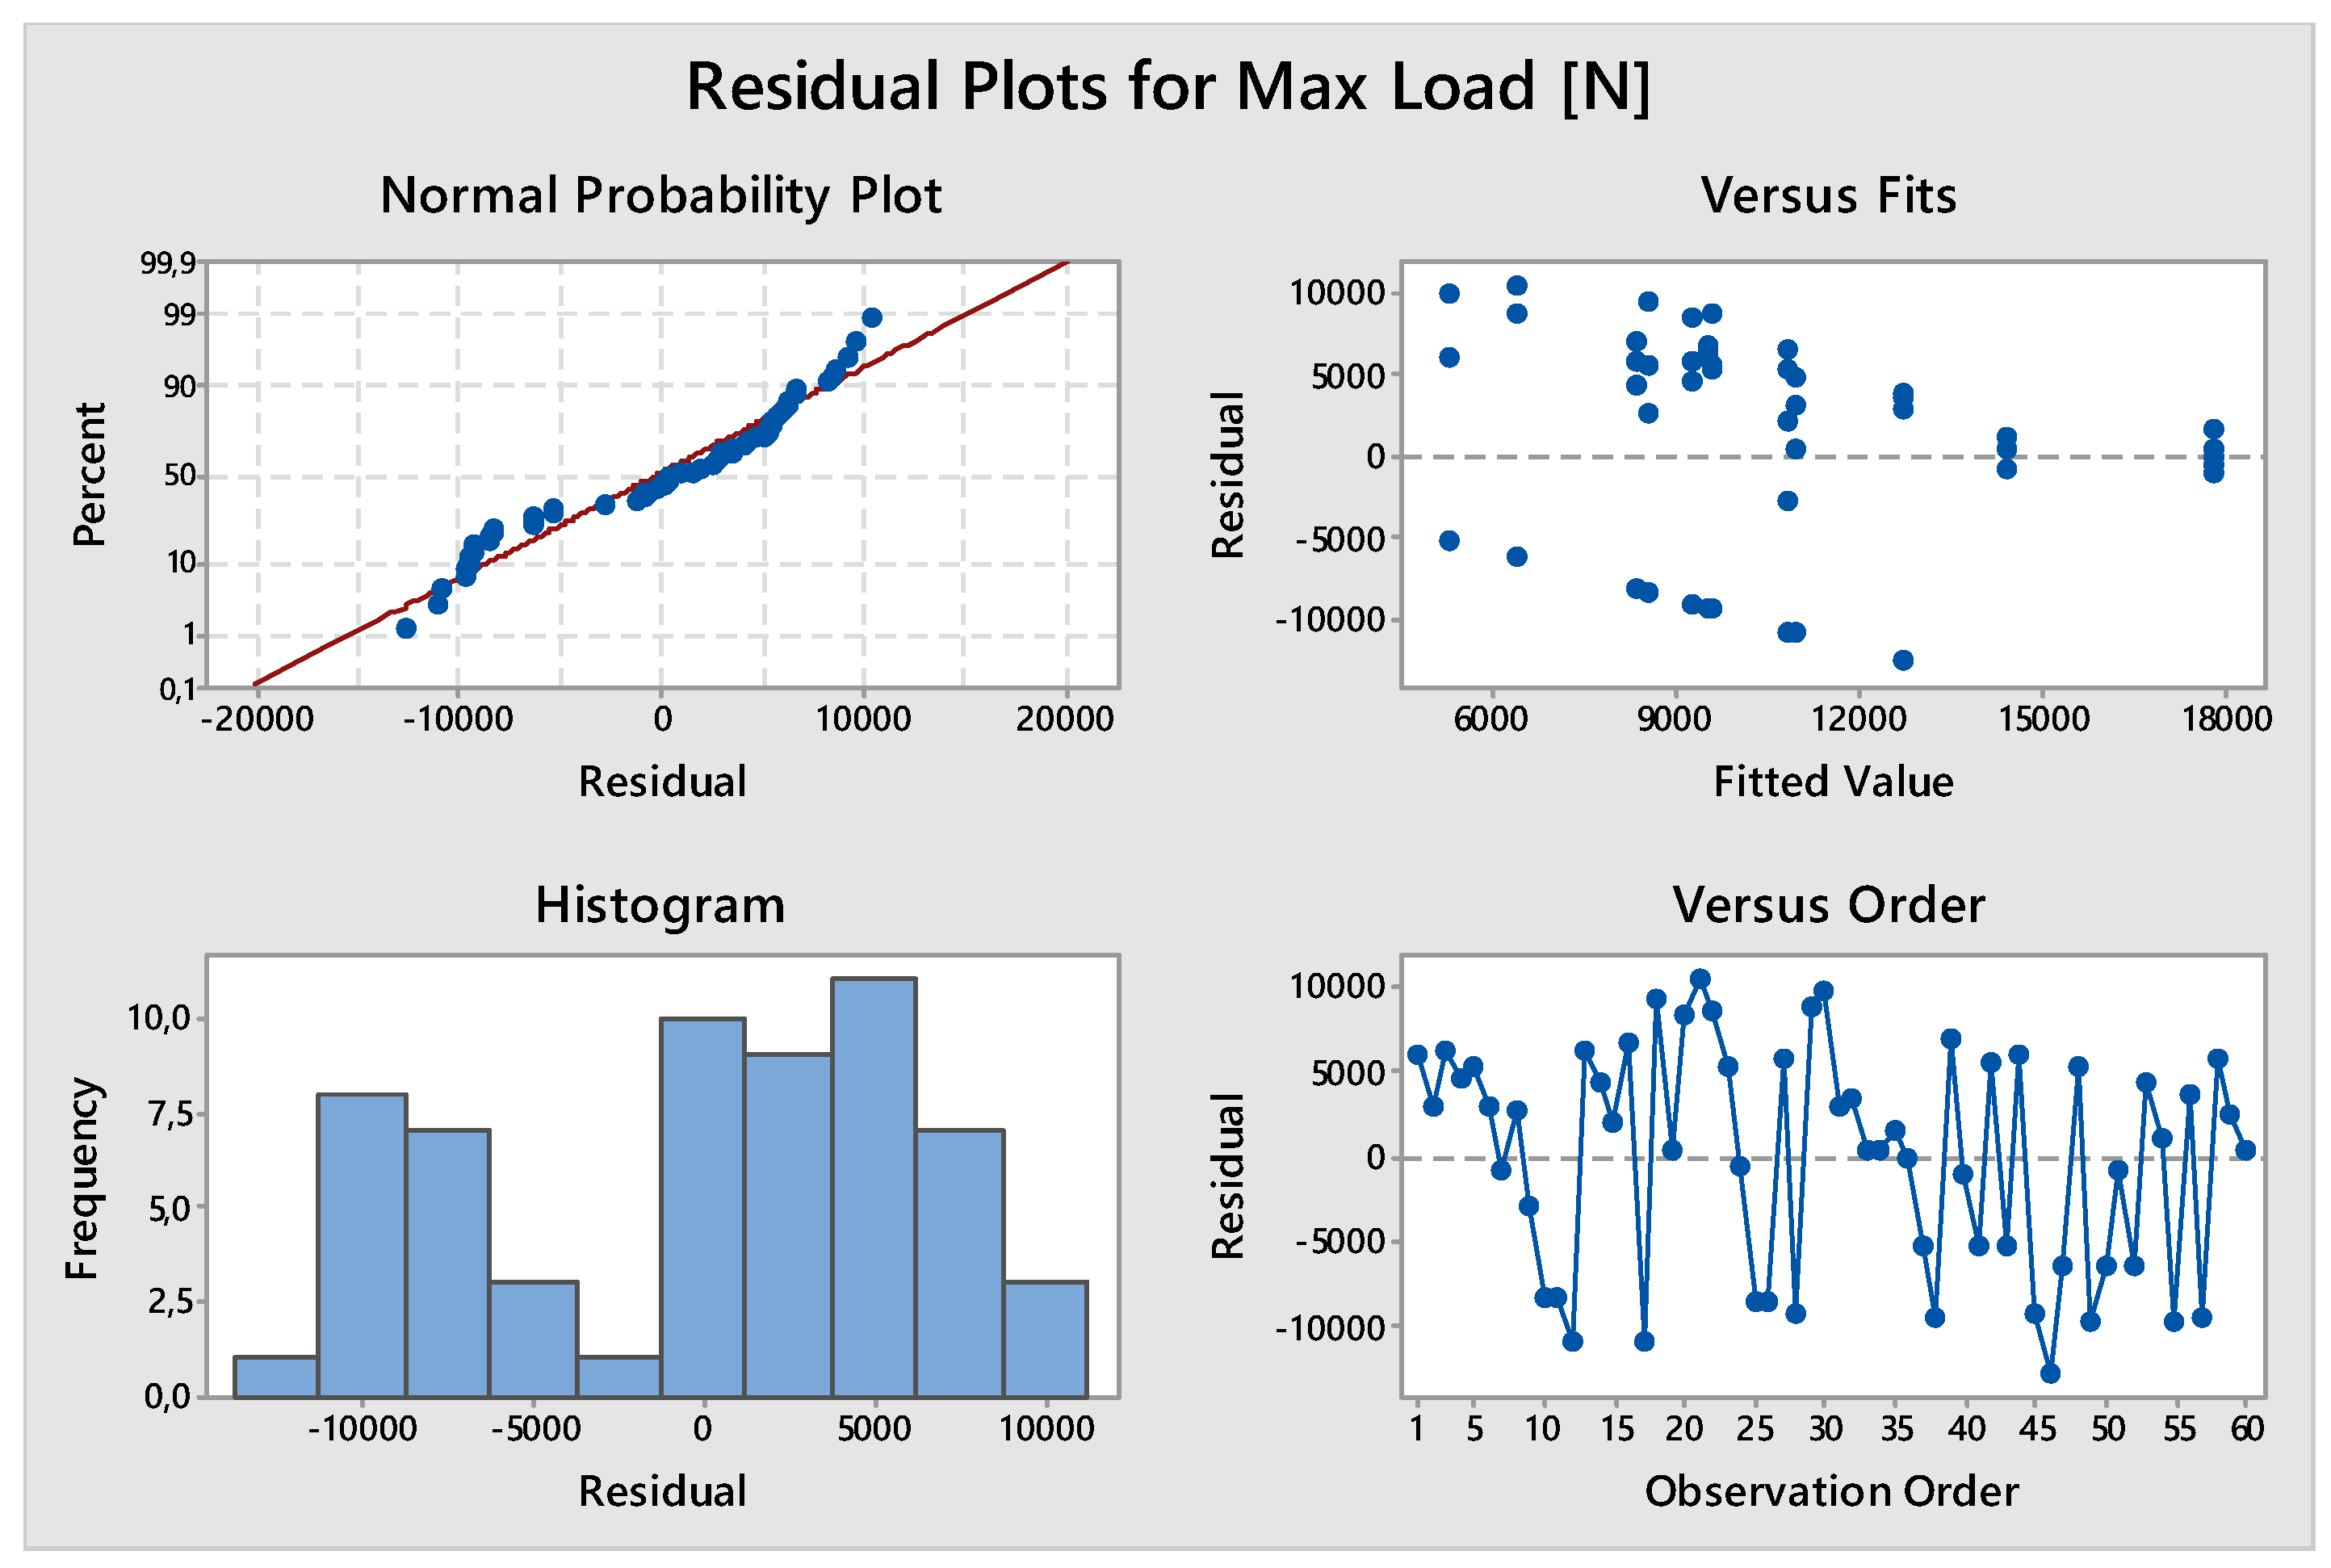
In
Figure 14, the distribution of data and residuals were checked showing a normal distribution and a random distribution of residuals versus fits.
The next
Table 4 summarizes the main results of the variance analysis by considering that one single parameter (i.e., maximum load) was investigated by varying it on two levels (i.e., the advancing and retreating sides).
DF are the degrees of freedom, used to calculate the mean square (MS). In general, they measure how much ‘independent’ information is available to calculate each sum of squares (SS). This last, also called sum of the squared deviations, measures the total variability in the data, which is made up of the following sources: (i) the SS for each of the two factors, which measures how much the level means differ within each factor; (ii) the SS for the interaction, that measures how much the effects of one factor depend on the level of the other factor and (iii) the SS for error, that measures the variability that remains after the factors and interaction are taken into account. MS is simply SS divided by the degrees of freedom. The MSs for error is an estimate of the variance in the data left over after differences in the means were accounted. F is used to deter-mine the p-value (p) that defines if the effect for a term is significant: i.e., if p is less than or equal to a selected level (i.e. 0.05, corresponding to a 95% level of confidence), the effect for the term is significant.
Because the p-values are greater than any reasonable alpha level, evidence exists that the two predictors and their interaction have no significant effect on strength.
It is evident that the presence of broken samples, starting from two months of ageing induces too high variances on data to let us test if the welding direction can affect the maximum load. At the same time, obviously, the presence of such samples is the evidence that the ageing time has relevant effect to the load resistance. It is worth noting that when the data start to decrease in number, became too few to perform statistic assessments.
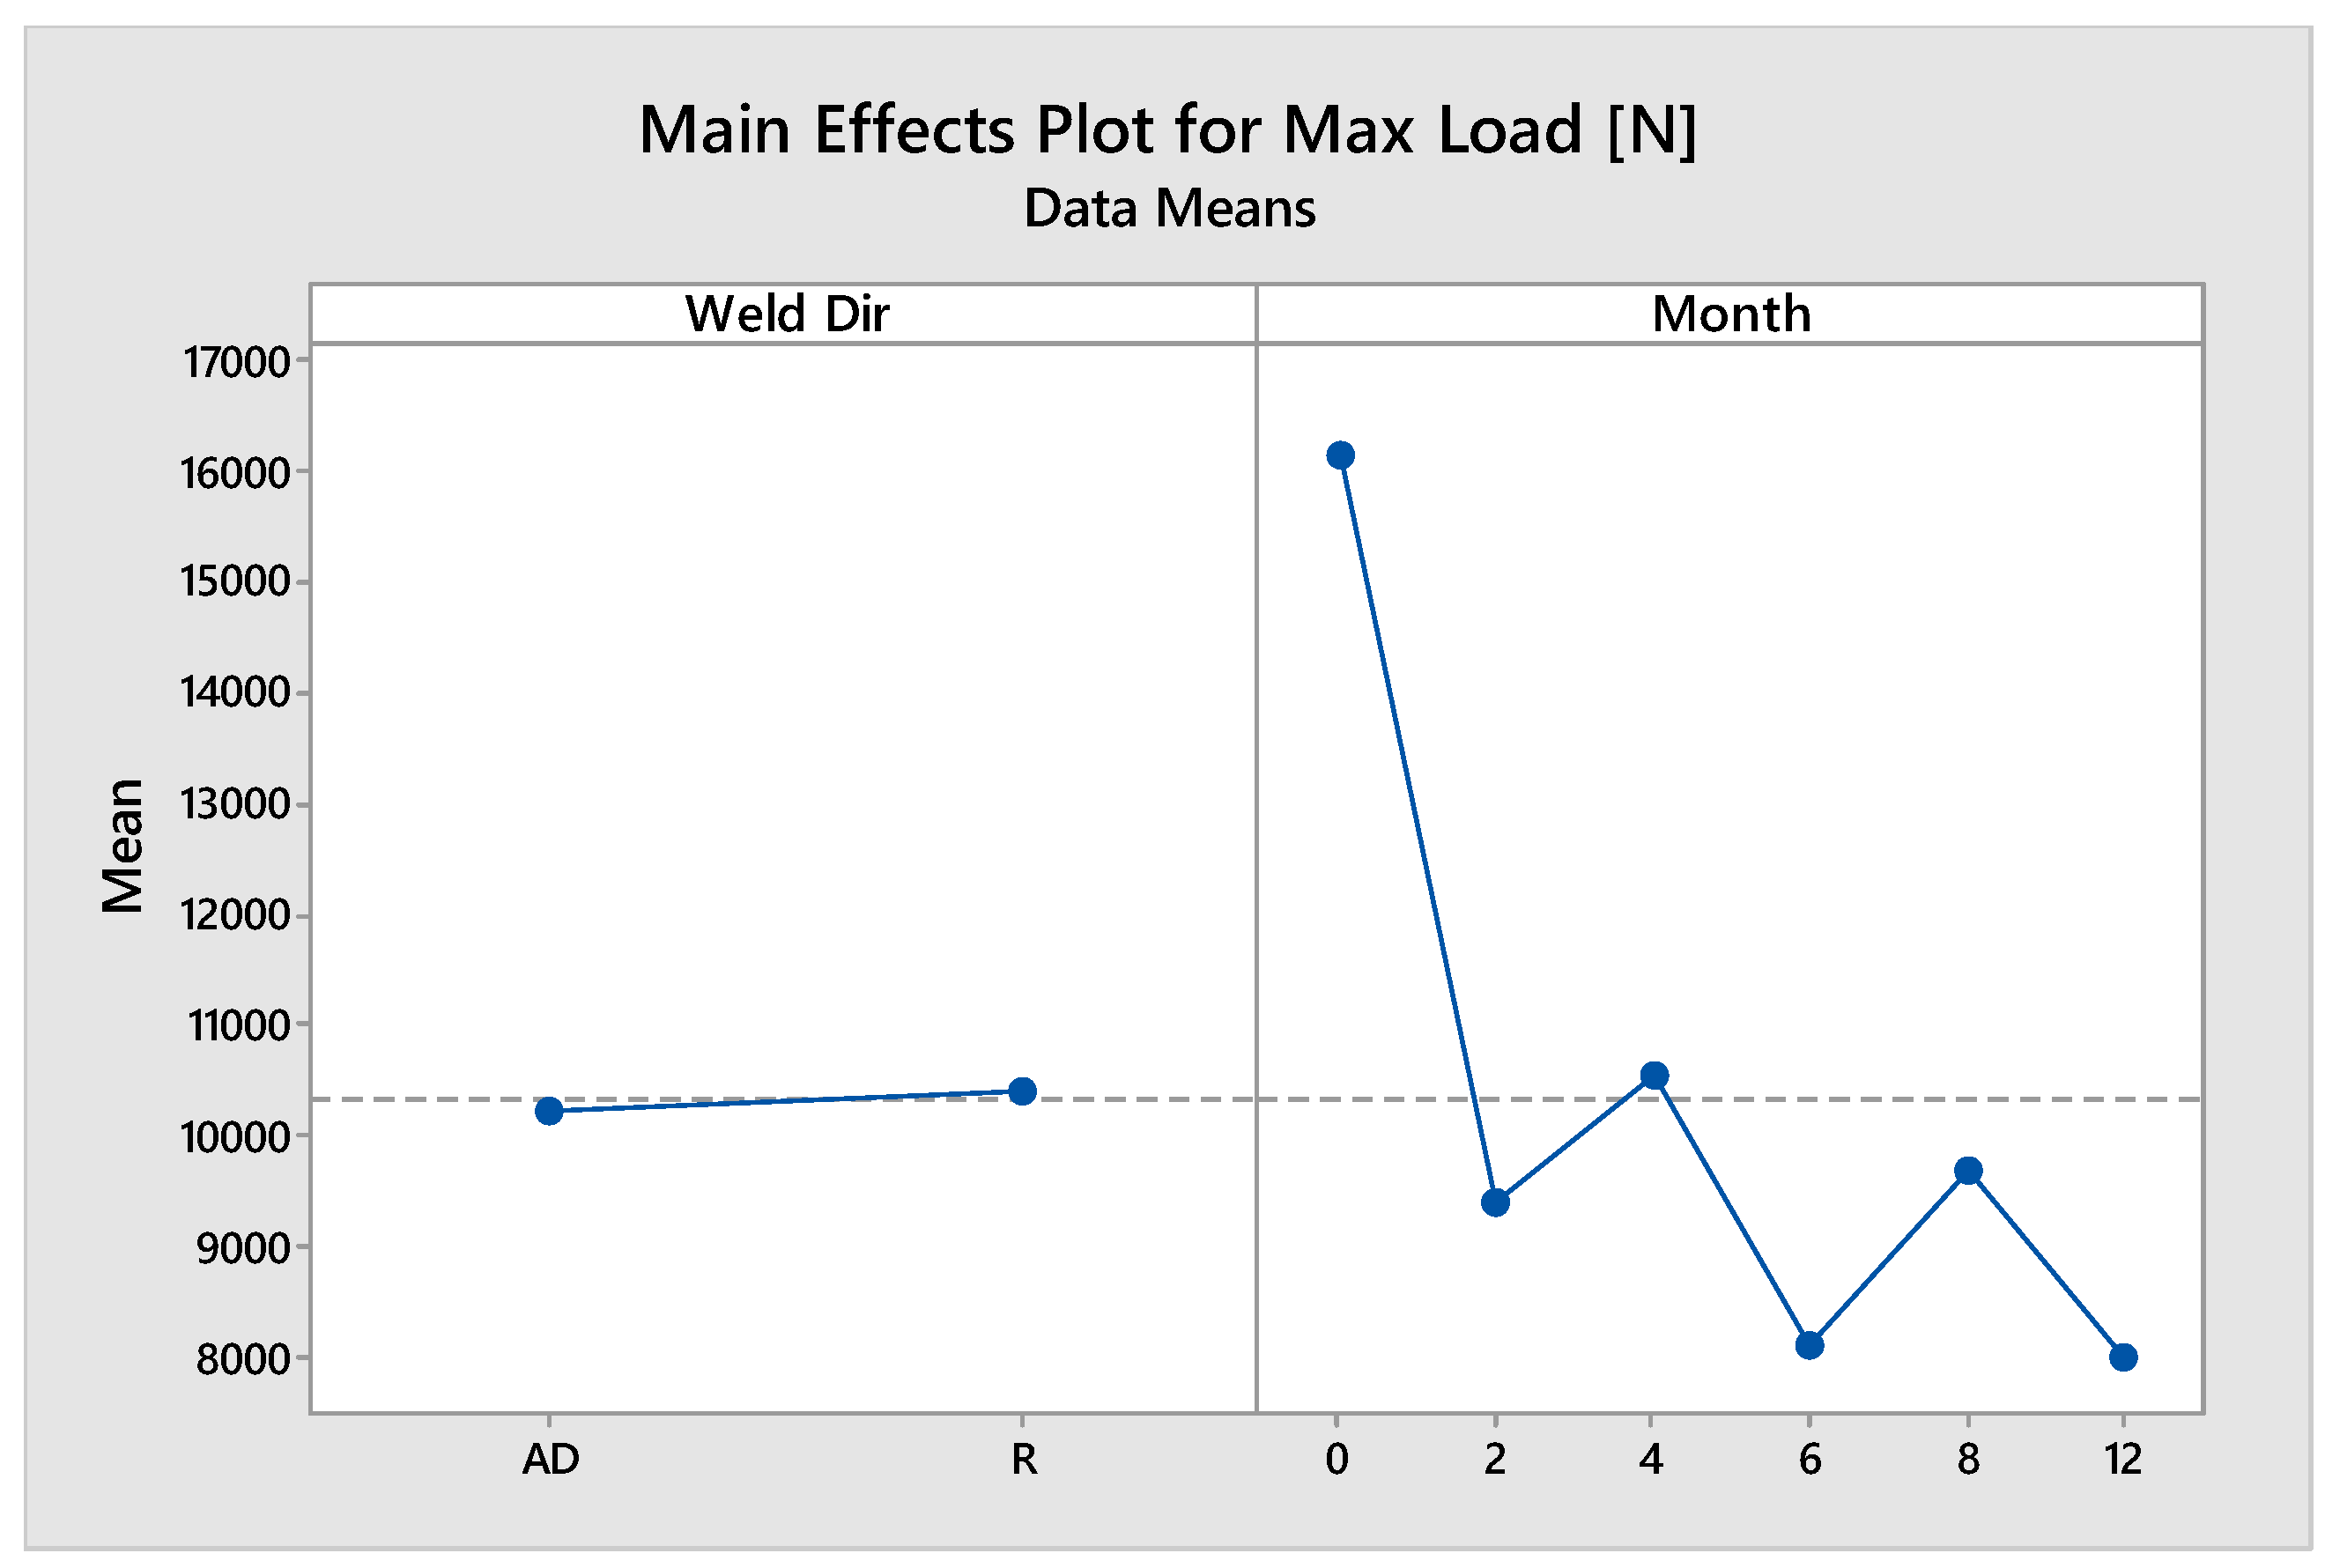
The main effects plot for Max Load is reported in the next figure, in this last the general mean values of Load, for all the AD samples and all the R samples regardless the ageing time shows how negligible is the effect whit respect to the variation of the mean values attained at increasing the ageing time. As for the effect of ageing time (regardless the welding direction), it is interesting that even though the ANOVA does not evidence a significance of this factor, the mean values show a decreasing trend with a mean lower than 10Kn, starting from the second month.
Figure 15.
Main Effects Plot for Max Load.
Figure 15.
Main Effects Plot for Max Load.
Due to the relevant changing in load data, at increasing time, to inquire whether the welding direction has an influence on the maximum load or not on the tested samples, both One way ANOVA and the Tukey pairwise comparison test for means have been performed on the data of each ageing point not considering the broken samples. In the following the results are summarized for the six different ageing times. The data at T0 were already reported in a previous study [
24].
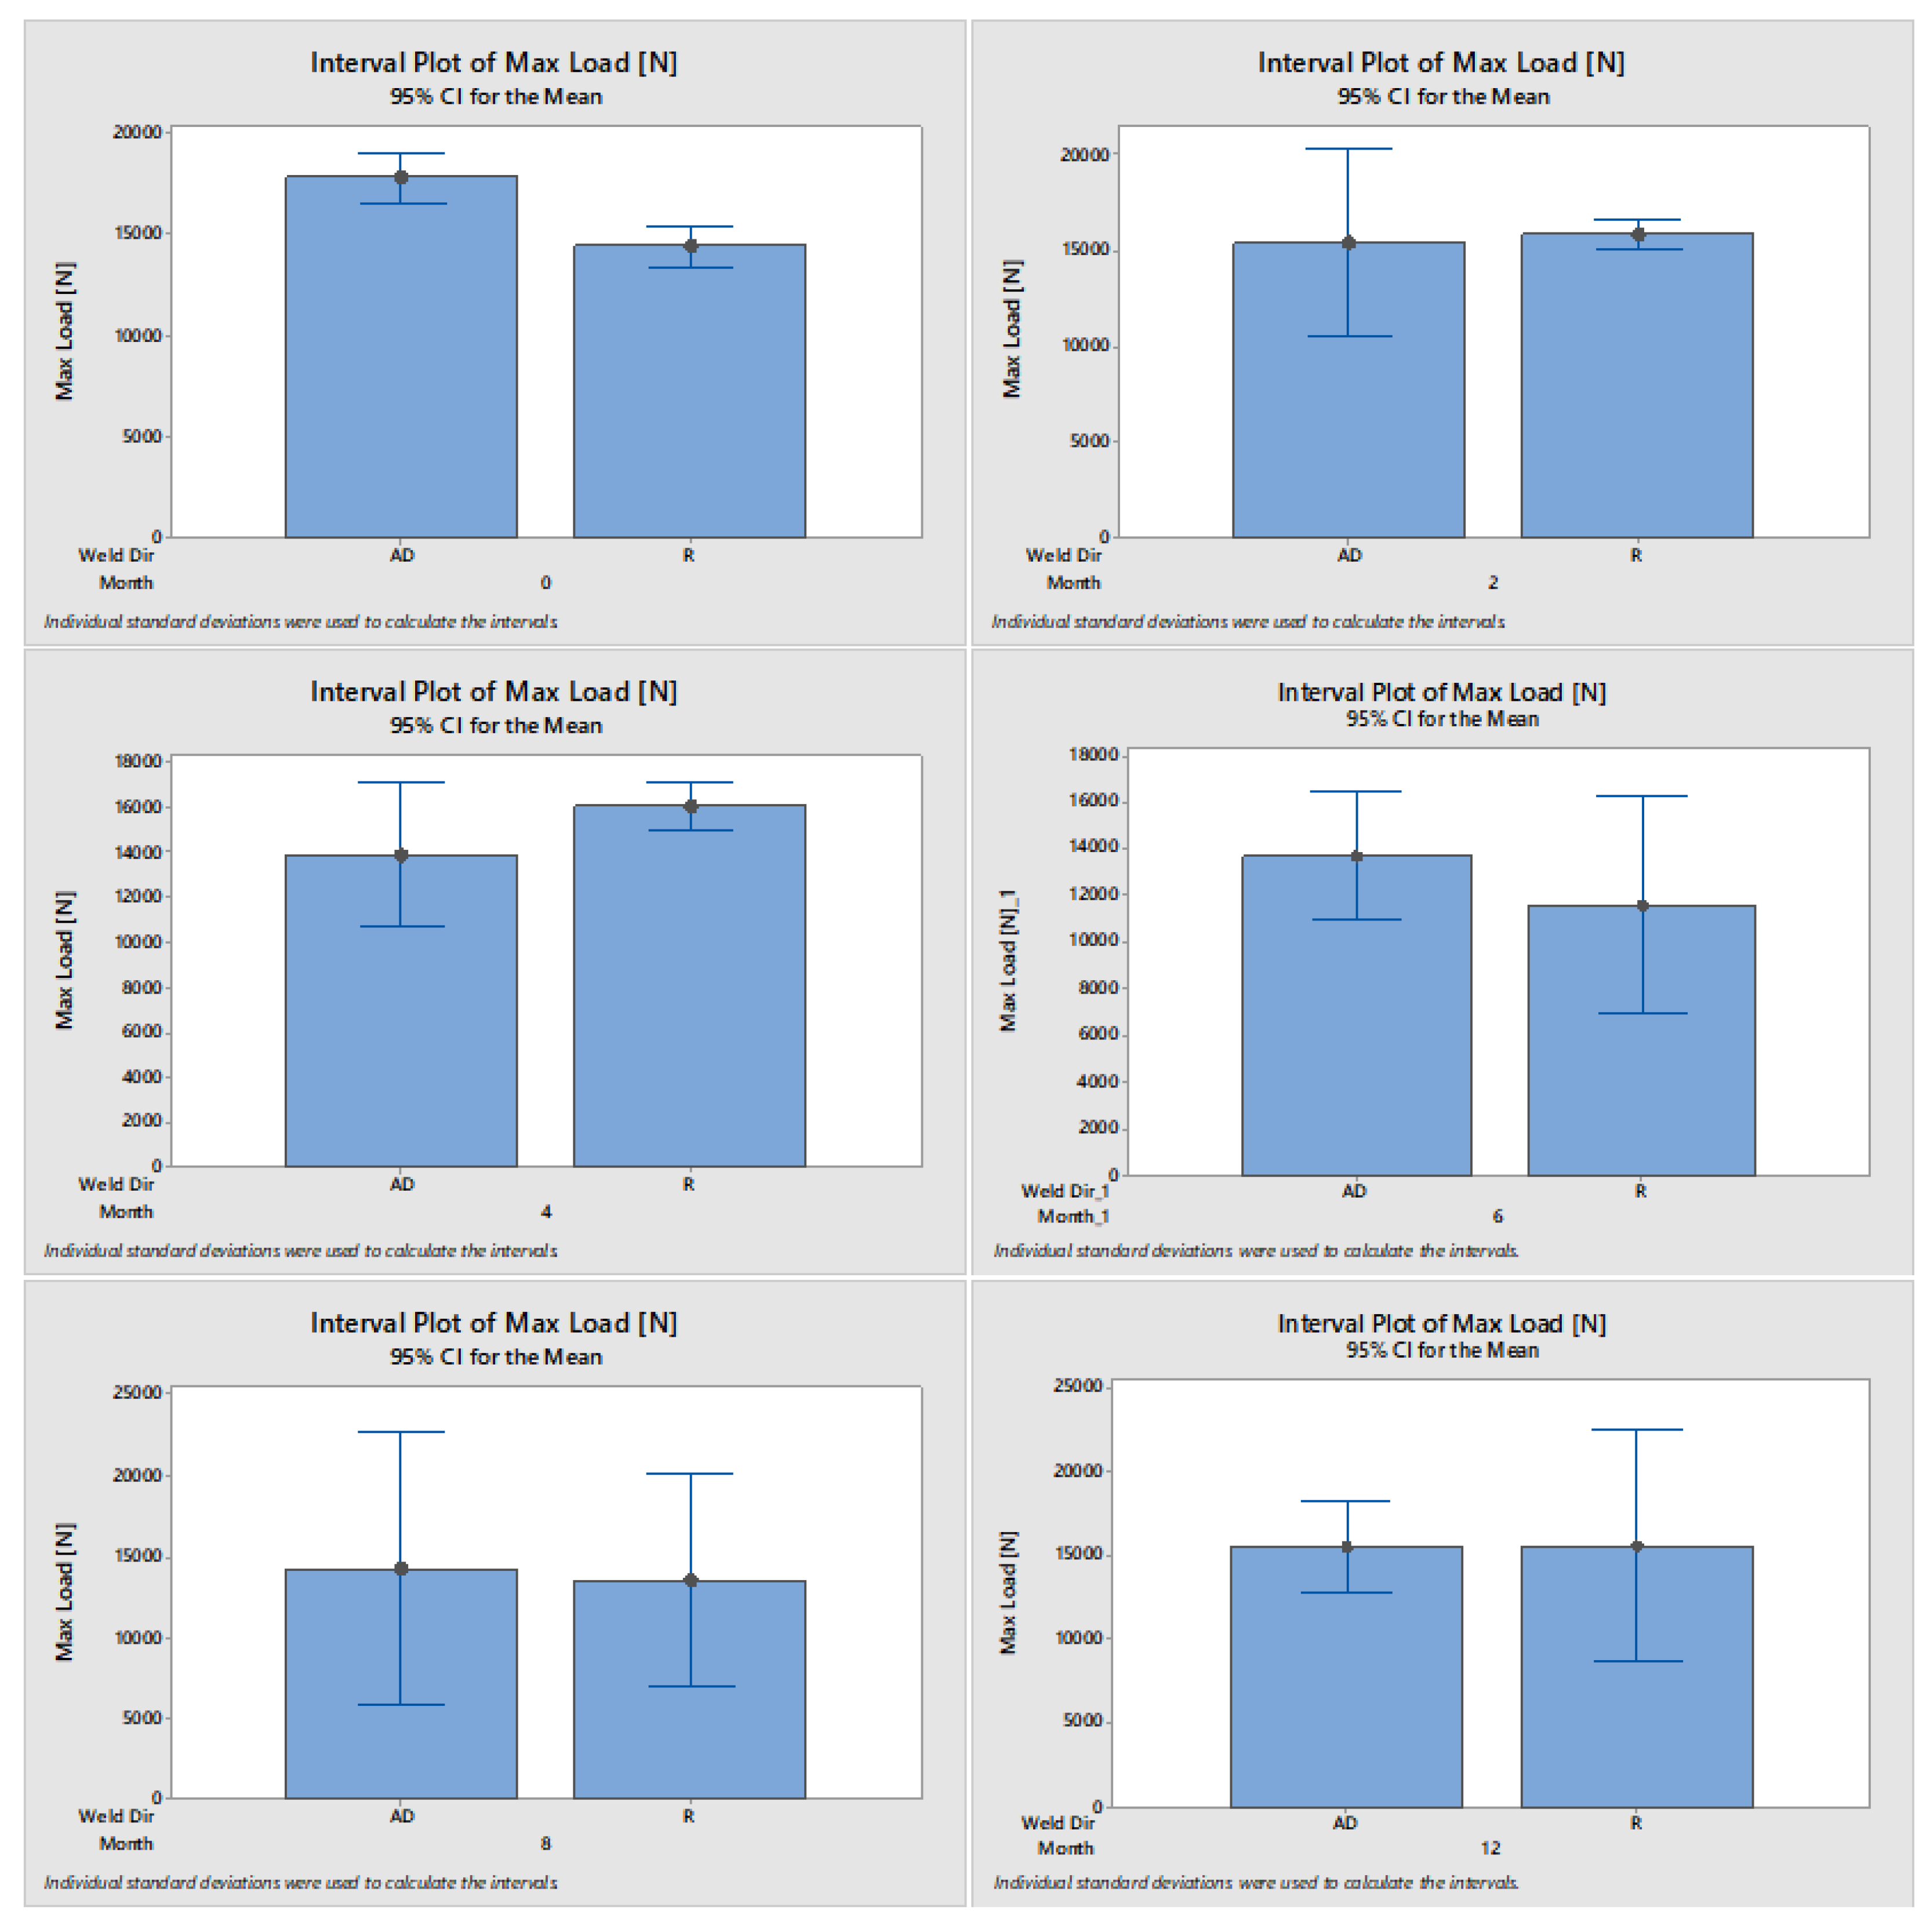
Figure 16.
Interval Plot of Max Load.
Figure 16.
Interval Plot of Max Load.
Naturally the Max load data have lower ranges (the broken samples were not considered) than in the previous analysis, as shown in the next figure.
In these last diagrams is evident how the data ranges overlap each other, except at T0.
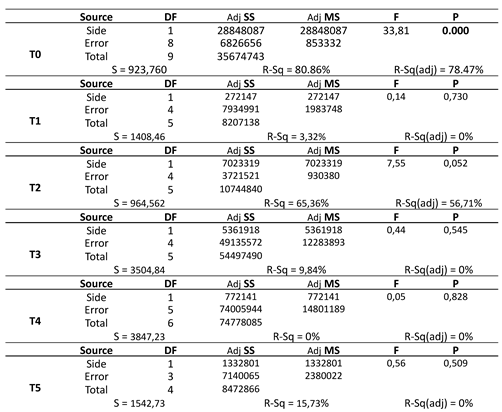
In the next table the One-way ANOVA are summarized. From these results, it is evident that the value of probability is less than the value of 0.05 only at T0. So, we can conclude that during the ageing period the initial differences induced by the welding direction are overcome by the effect of ageing.
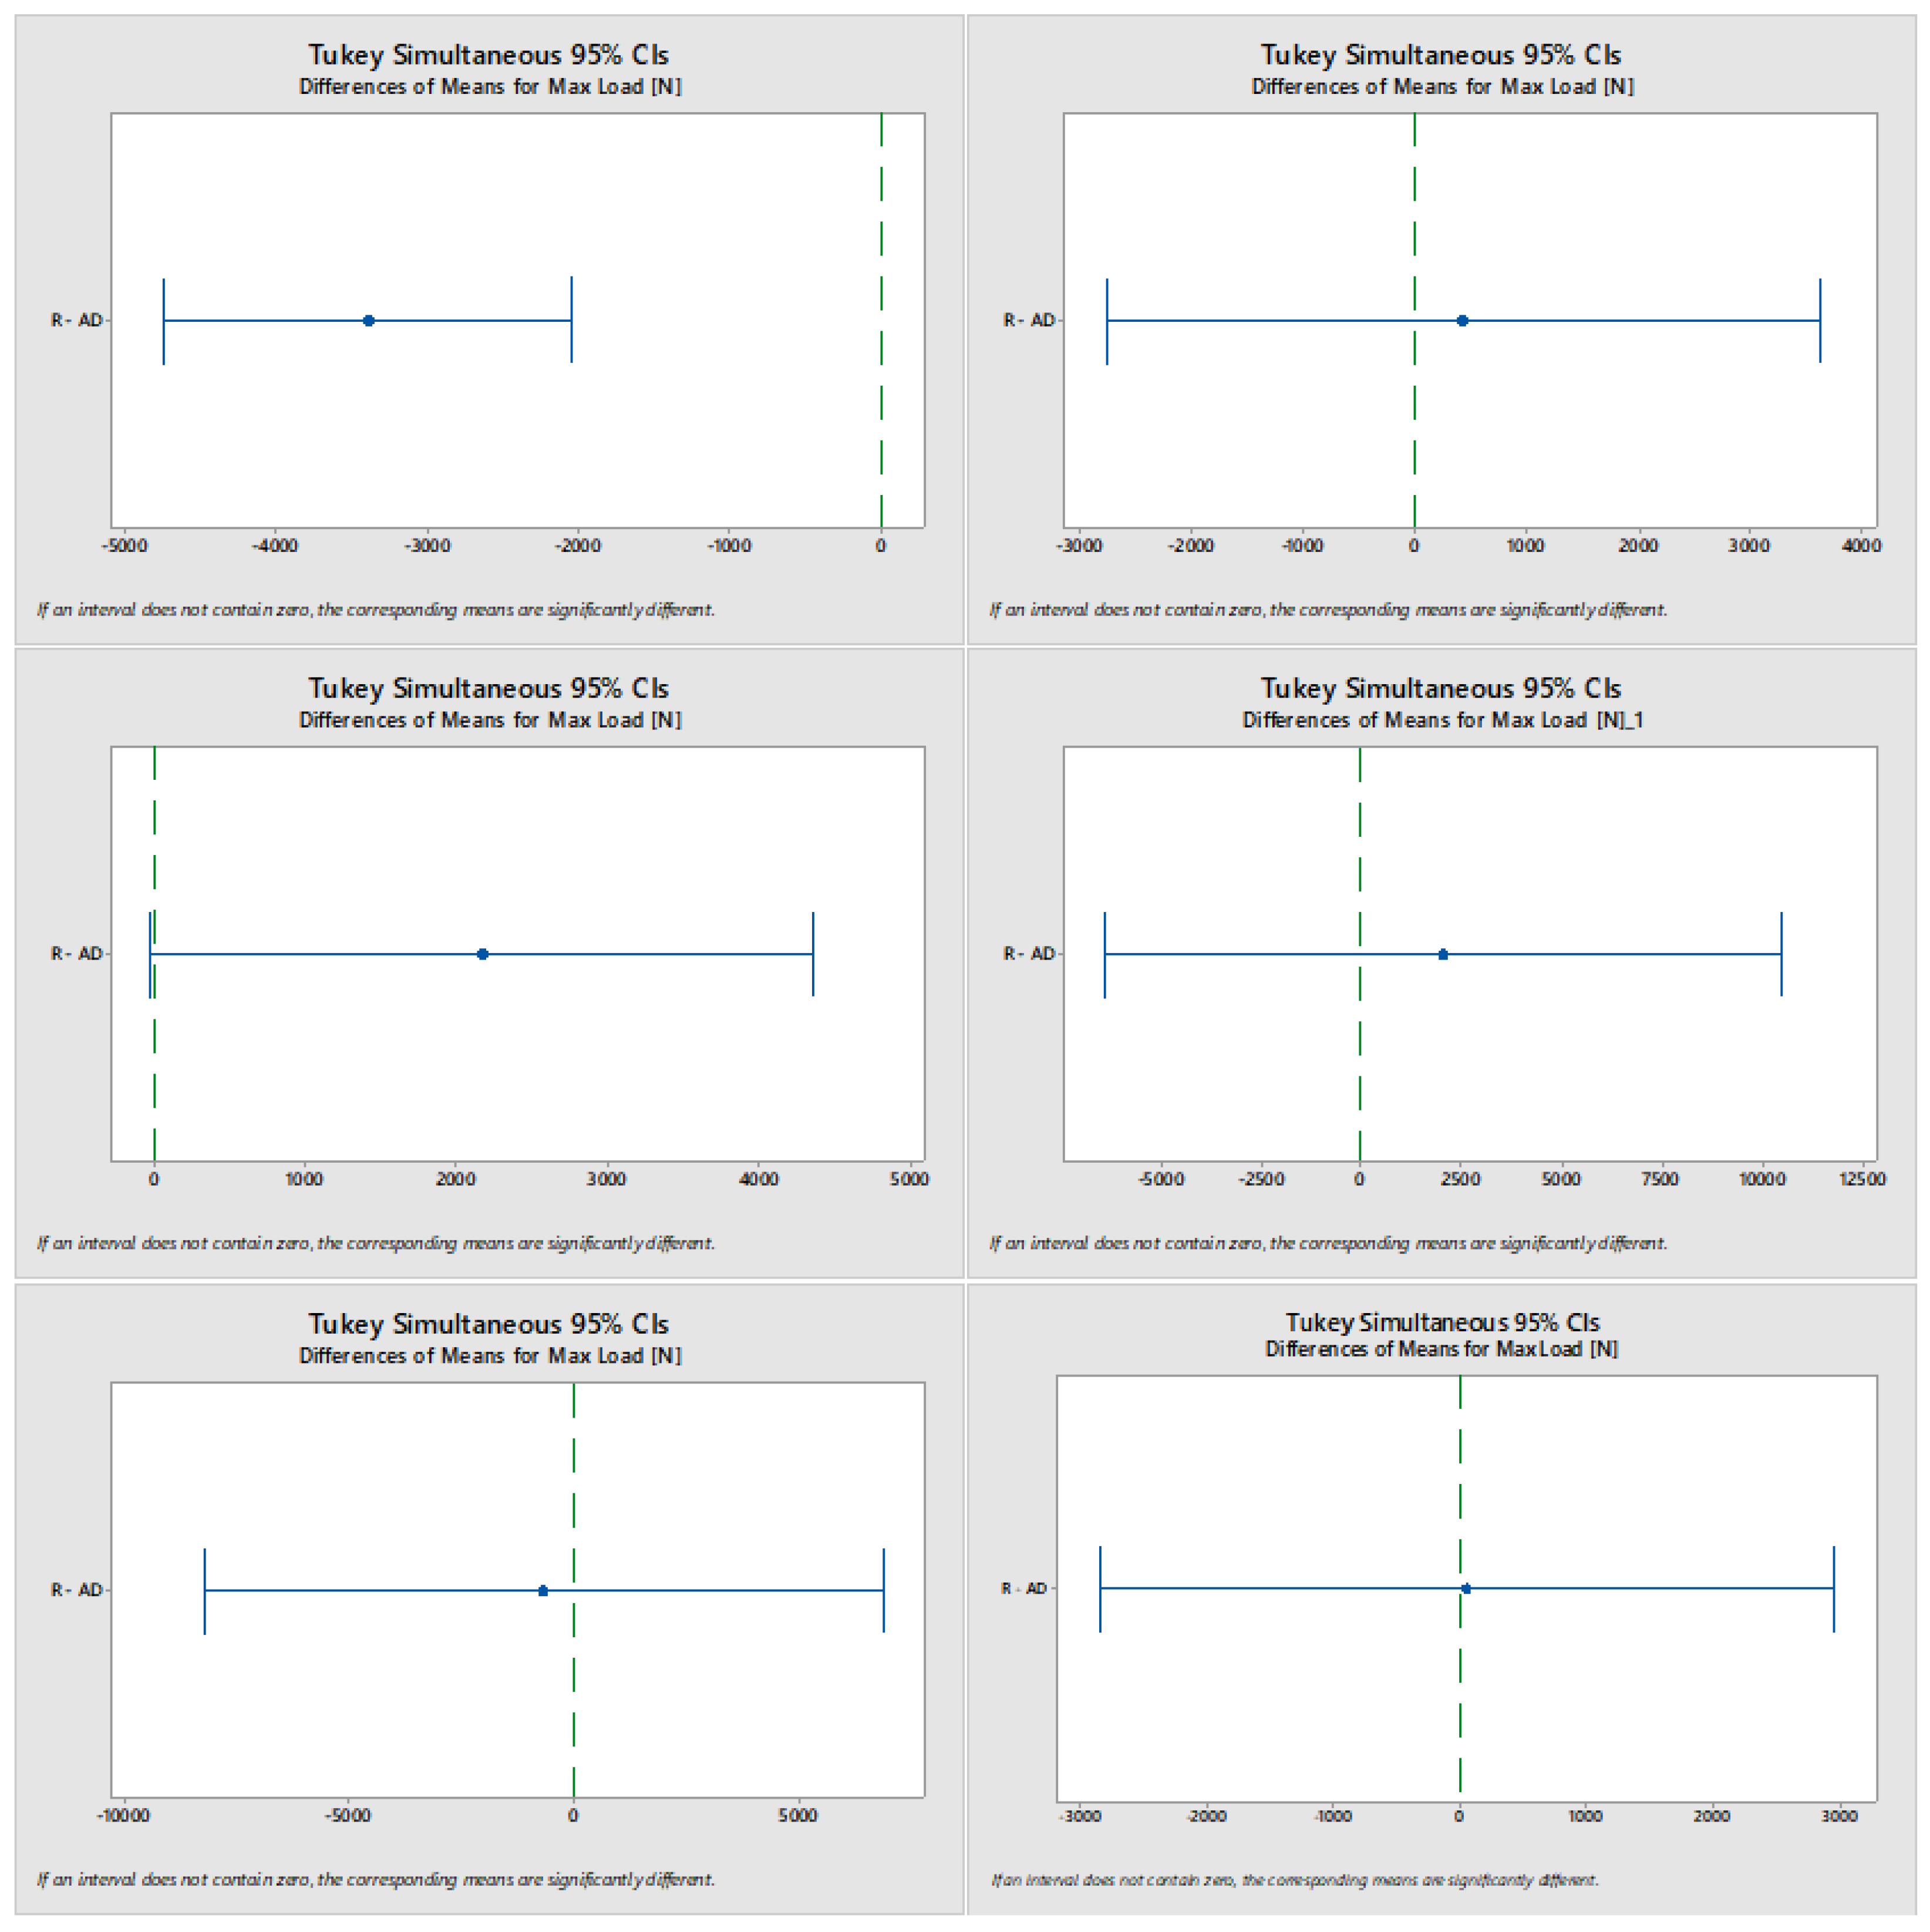
The Tukey Pairwise Comparisons results are reported in
Figure 17, they confirm that only the difference of mean of Max load at T0 between retreating and advancing side is significant.
Table 5.
One-way ANOVA for Maximum Load [N].
Table 5.
One-way ANOVA for Maximum Load [N].
4.2. ANOVA: Analysis of Variance for Displacement at Maximum load [mm].
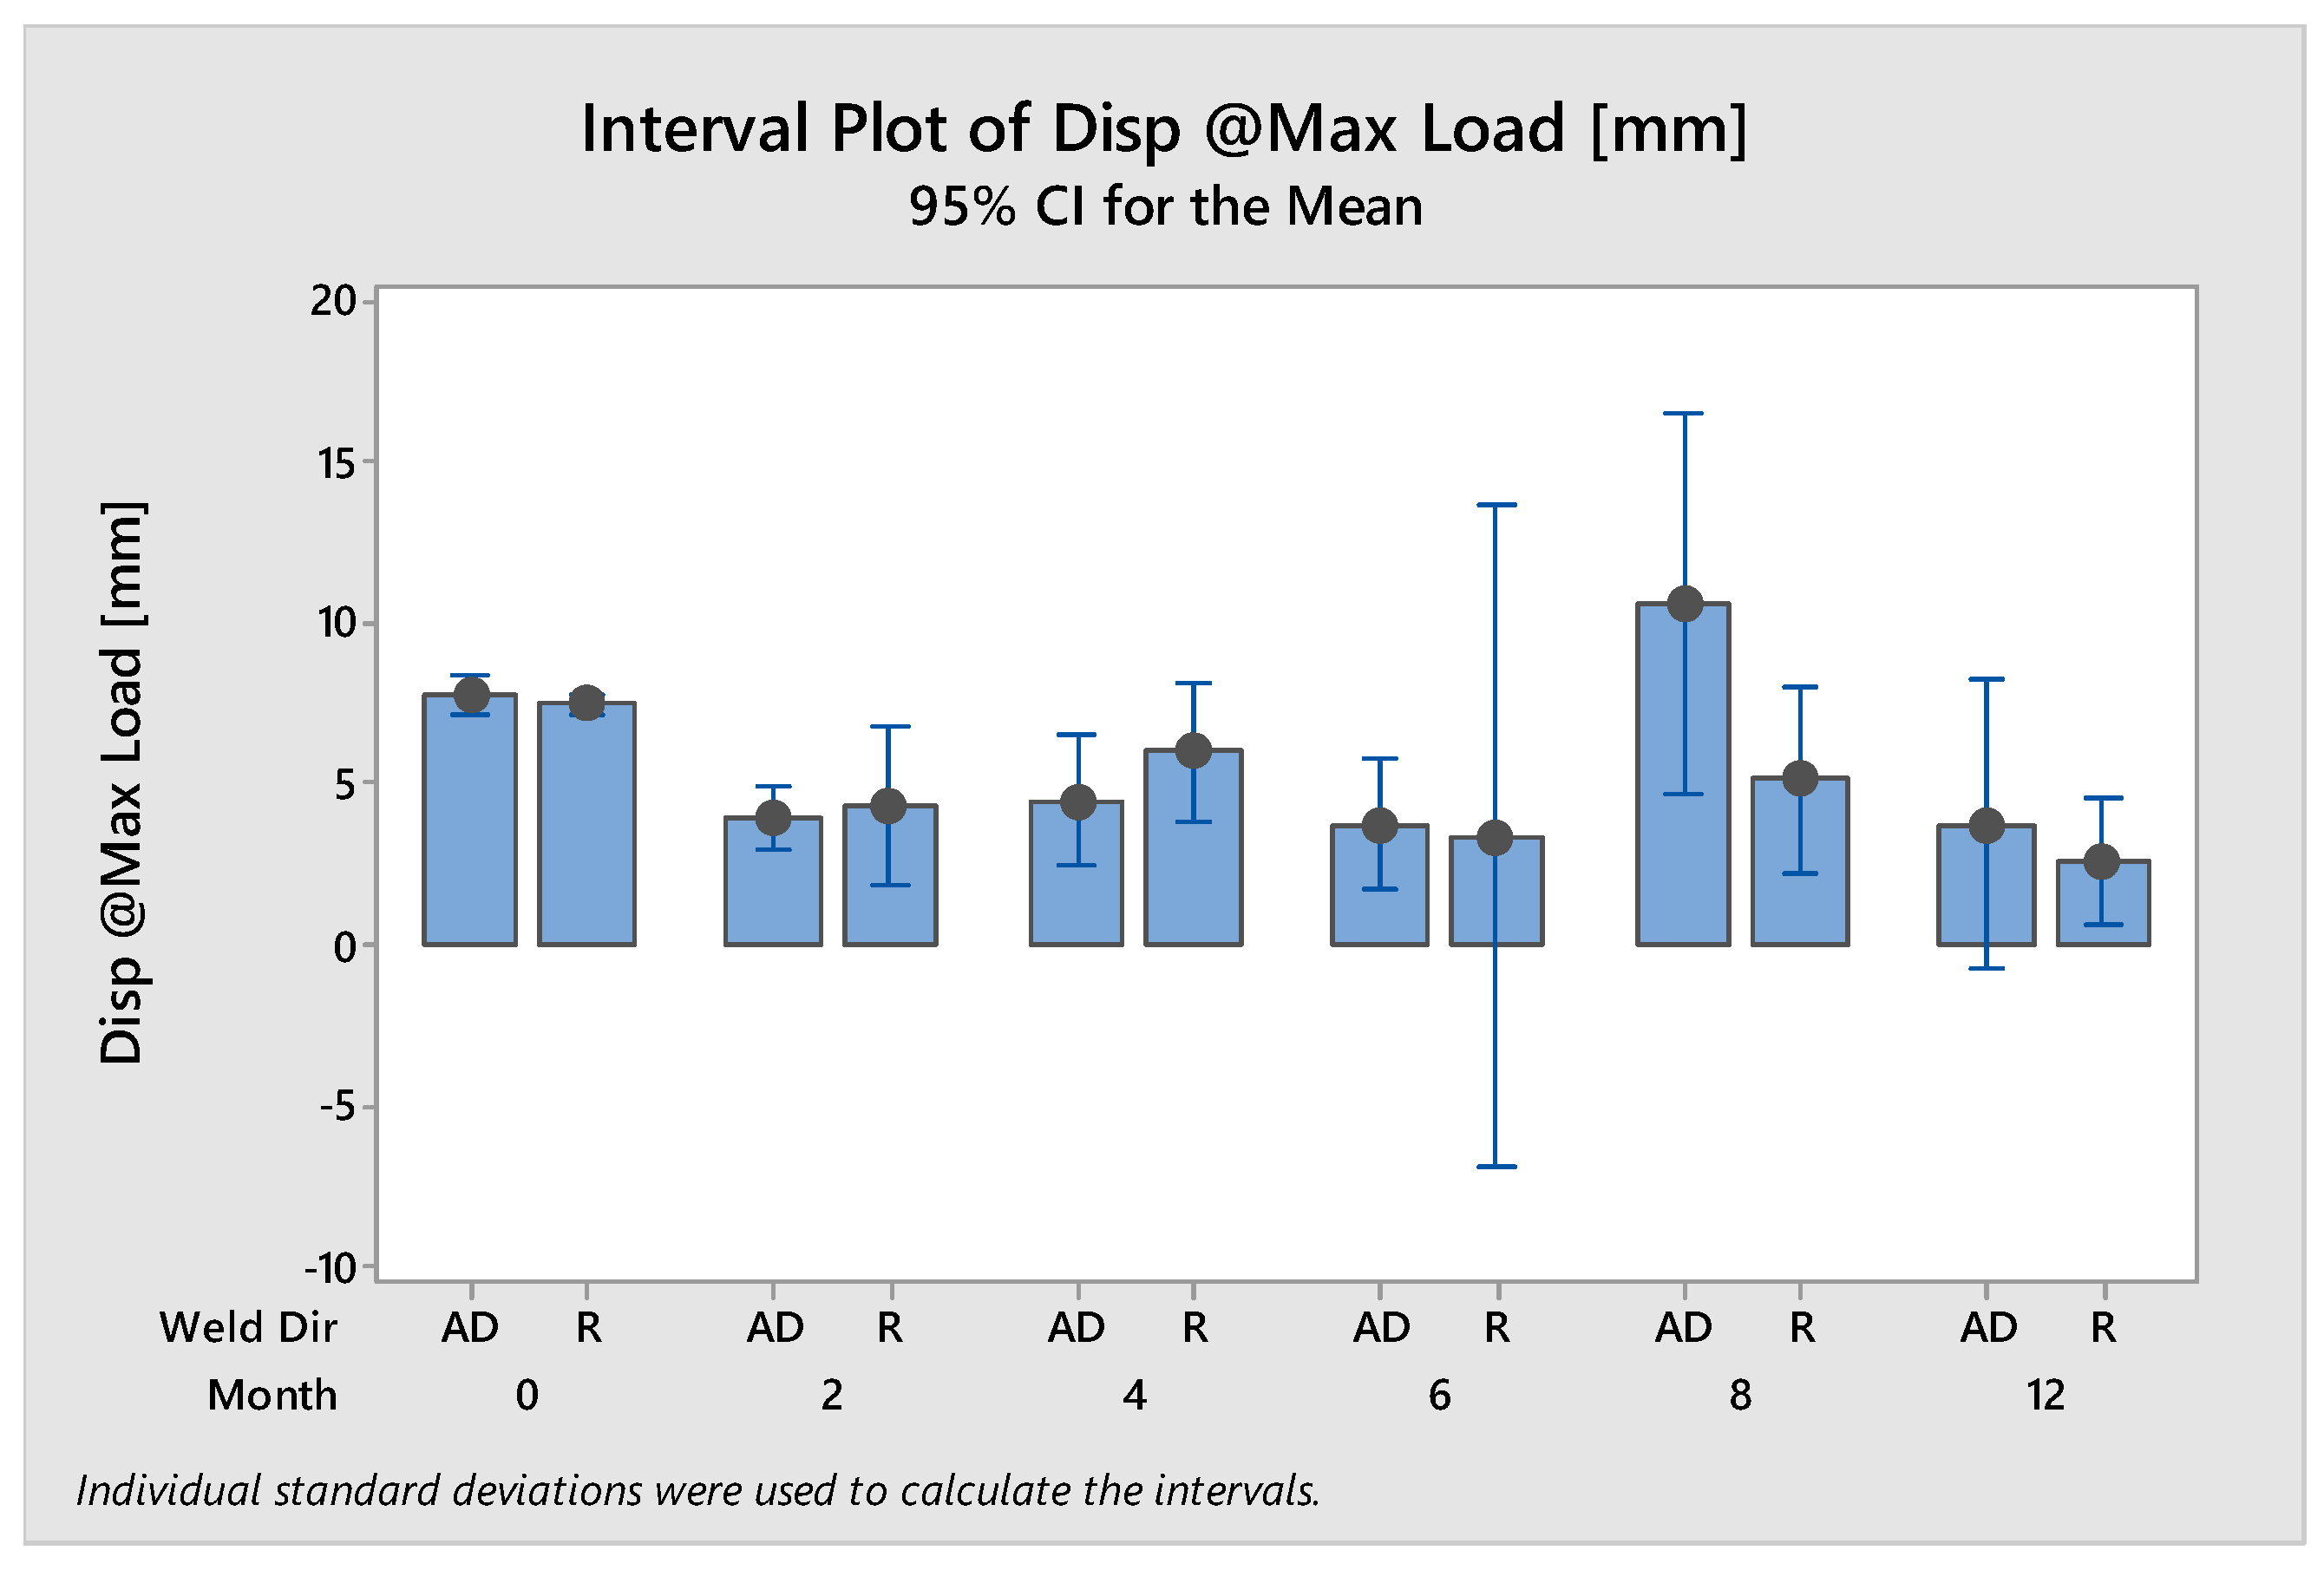
The whole data of Displacement at max load summarized in the next
Figure 18. It is possible to observe how, at increasing ageing time the spreading of data increases.
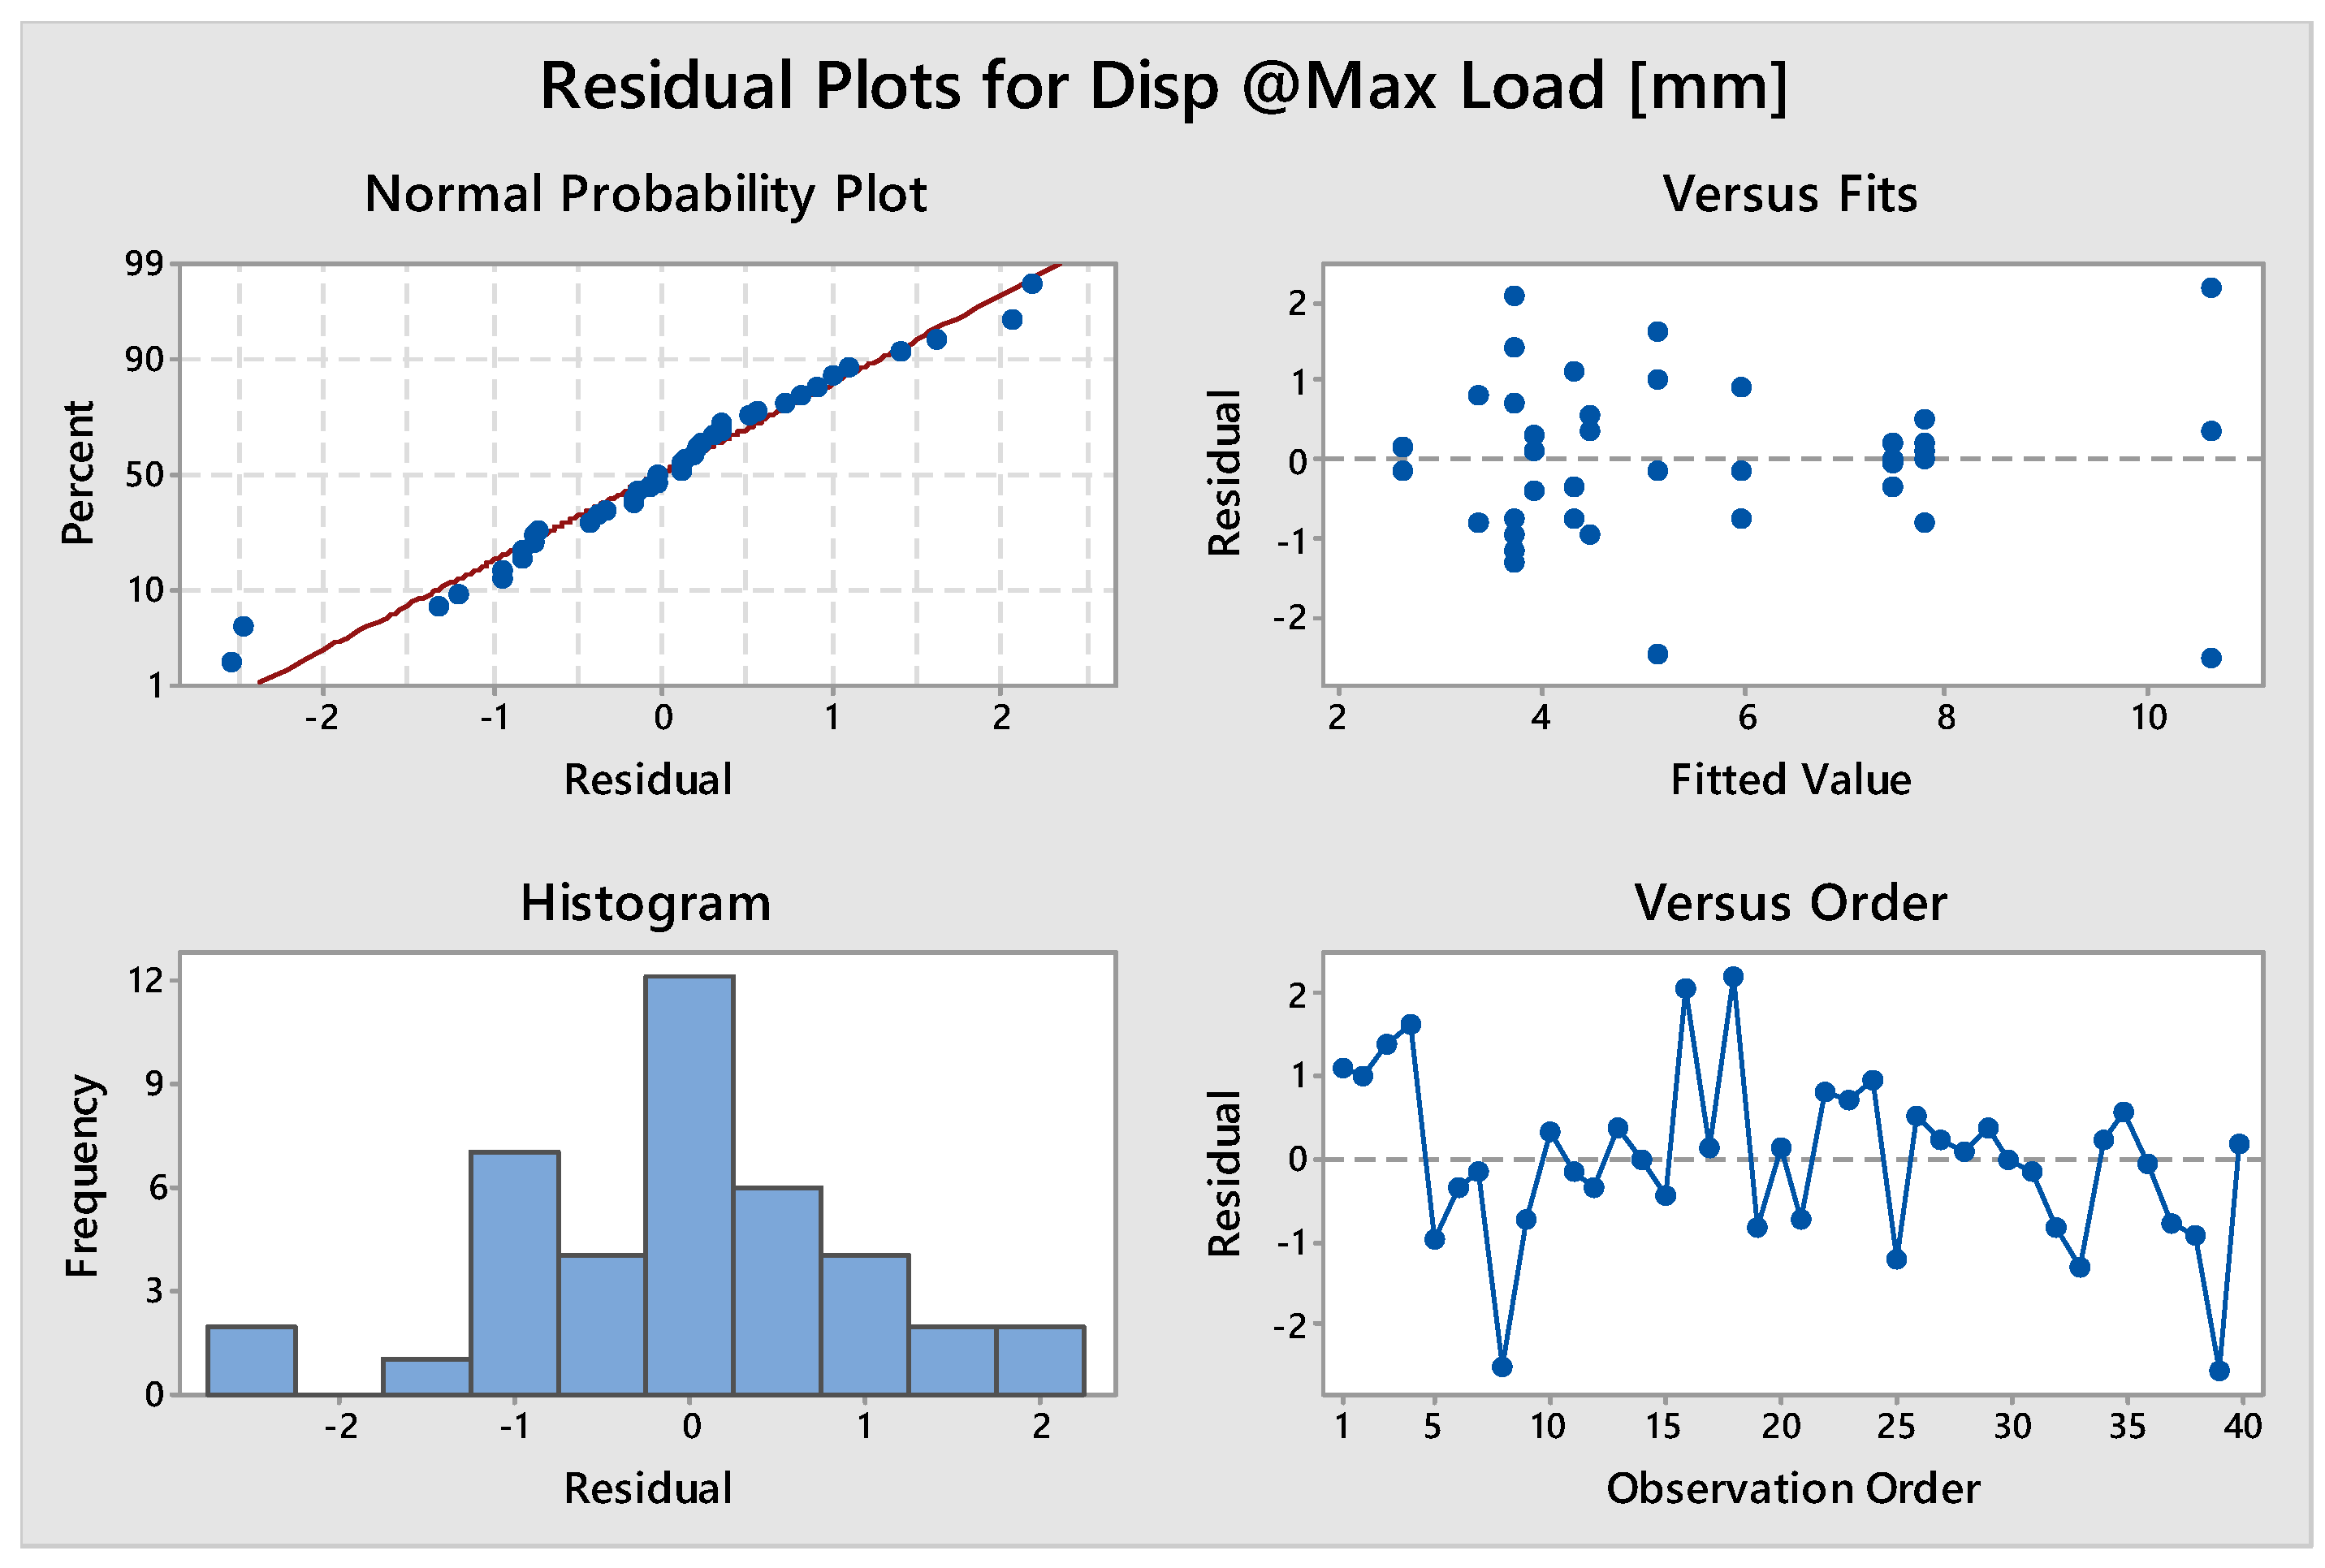
In
Figure 19, the distribution of data and residuals were checked showing a normal distribution and a random distribution of residuals versus fits.
The next
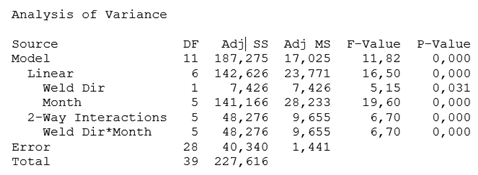
Table 6 summarizes the main results of the variance analysis by considering that one single parameter (i.e., displacement at max load) was investigated by varying it on two levels (i.e., the advancing and retreating sides).
Because the p-values are lower than the fixed alpha level, 0.05, evidence exists that the two predictors and their interaction have significant effect on the displacement at max load.
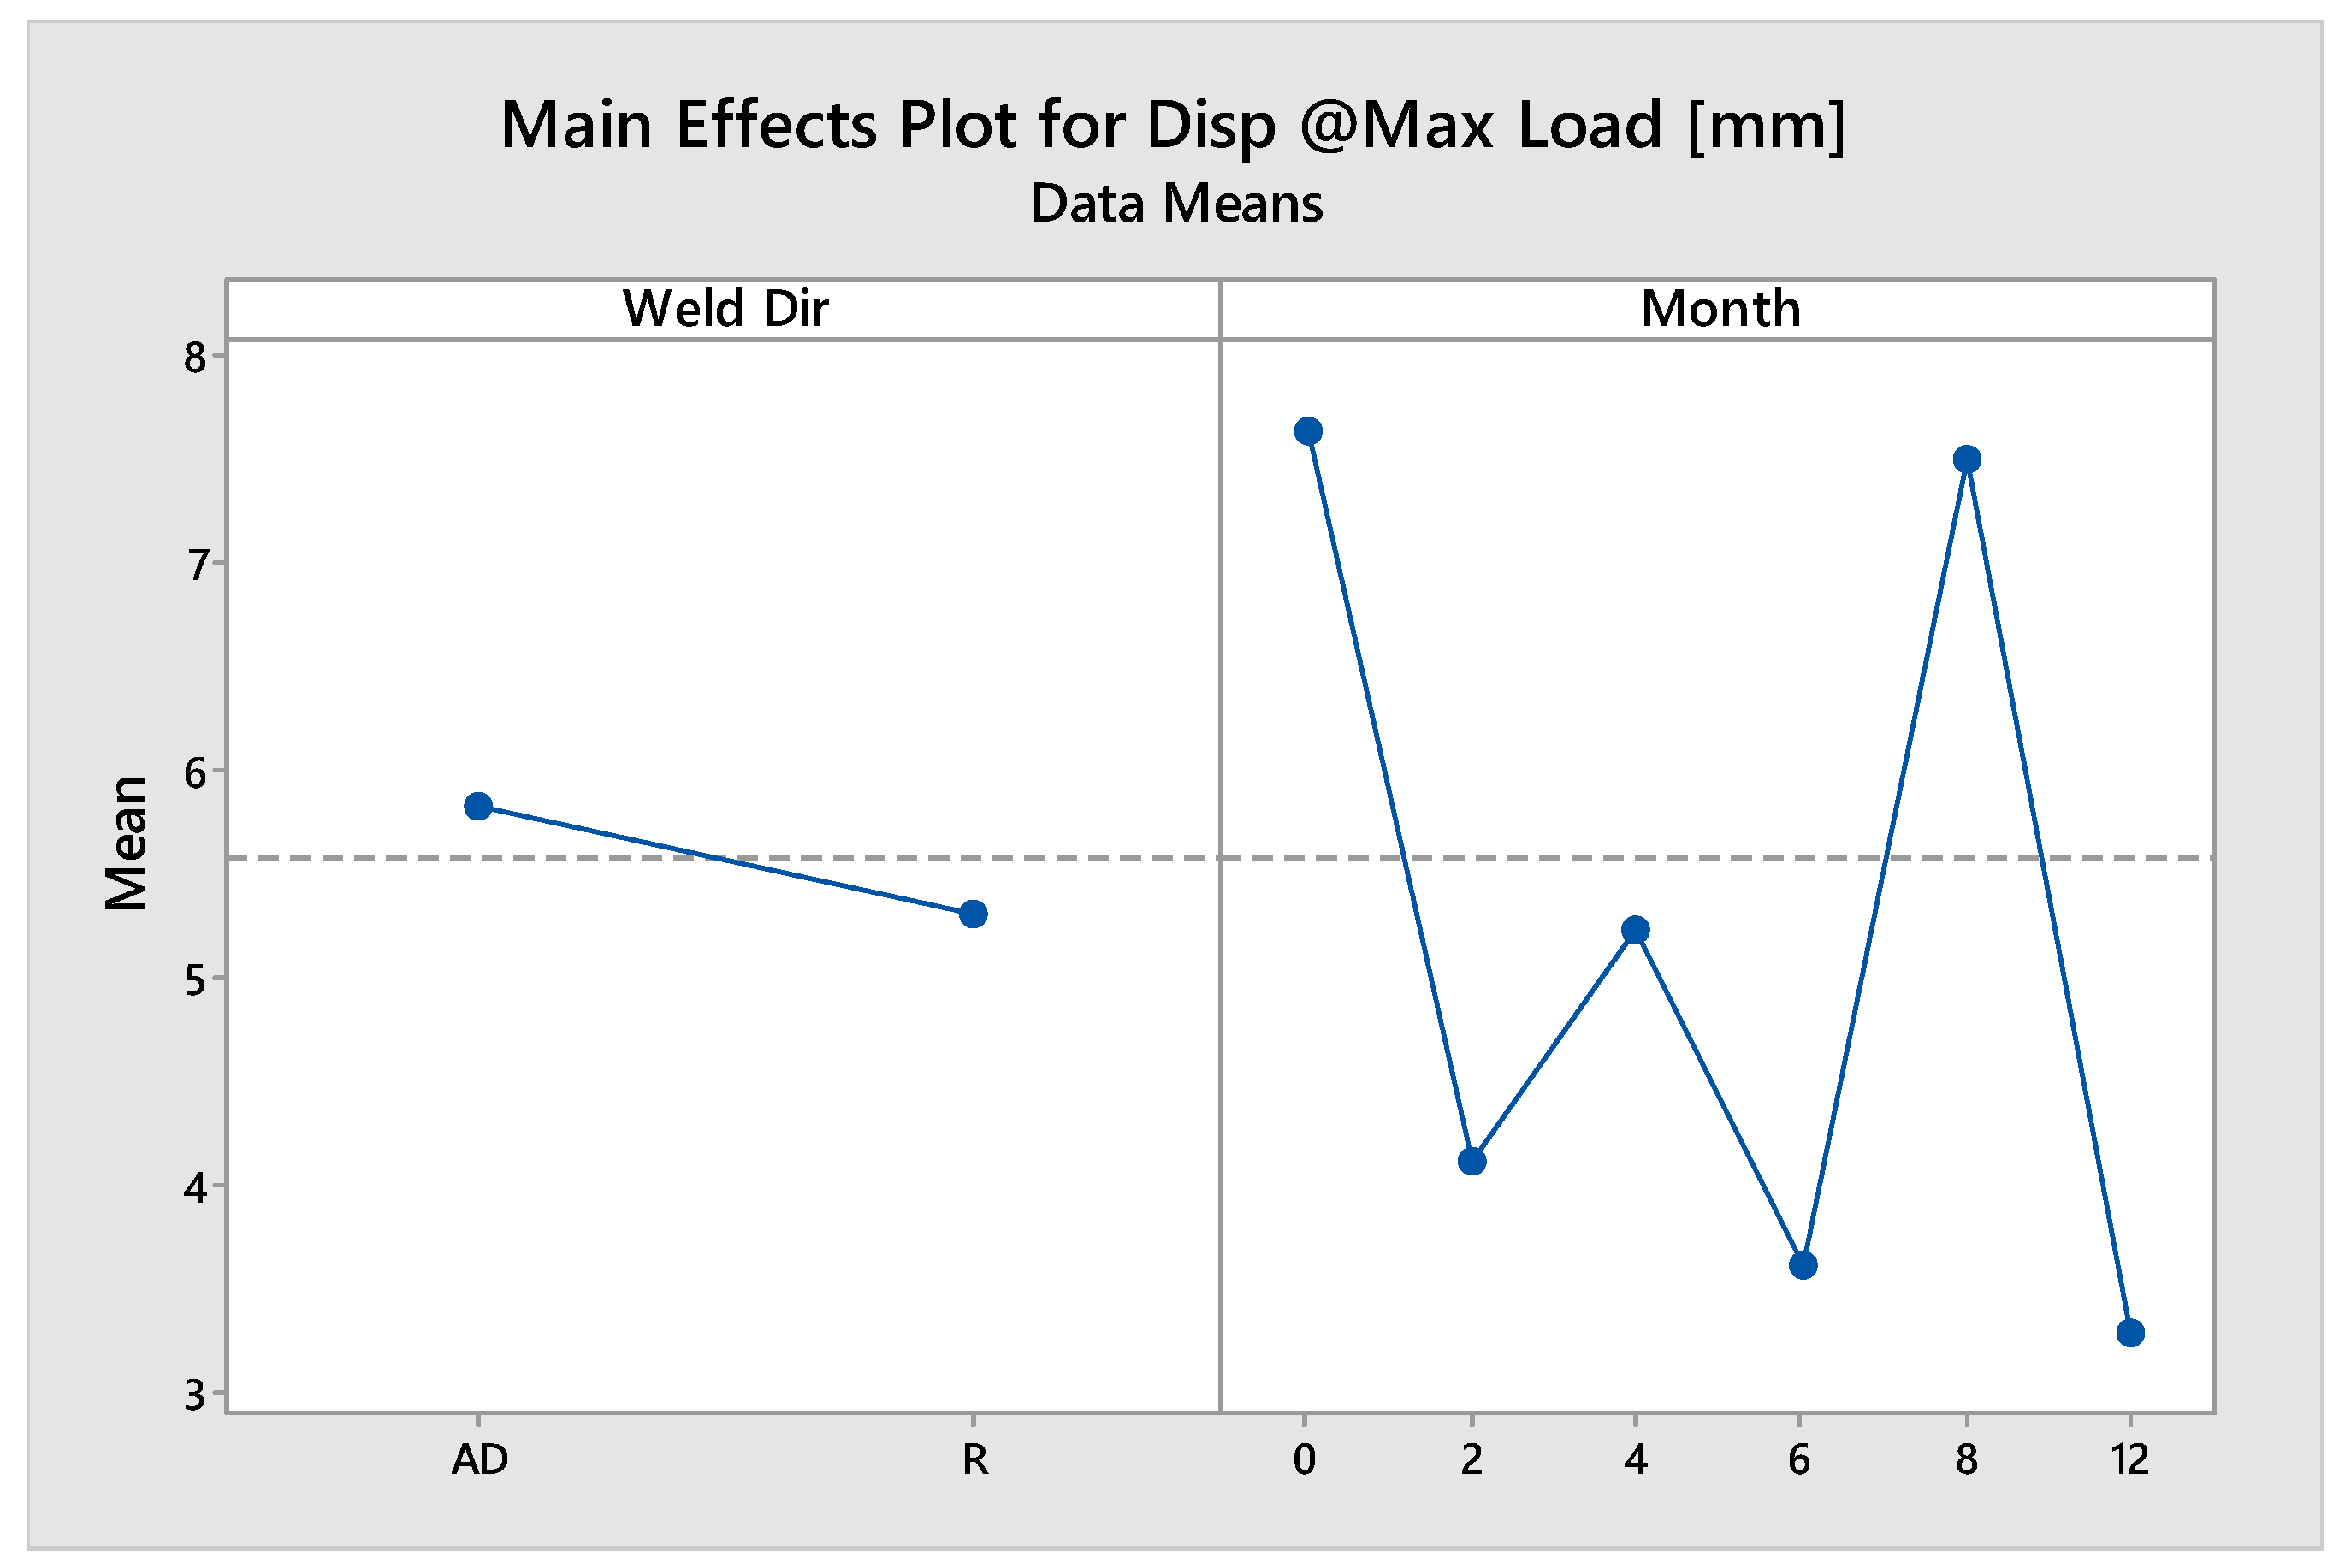
The main effects plot for Displacement at Max Load is reported in the next figure, in this last the general mean values of Load, for all the AD samples and all the R samples regardless the ageing time shows how negligible is the effect whit respect to the variation of the mean values attained at increasing the ageing time.
Figure 20.
Main Effects Plot for Displacement at Max Load.
Figure 20.
Main Effects Plot for Displacement at Max Load.
From this figure it is possible to affirm that the AD samples exhibit slightly higher displacement before reaching the max load. Such difference in the whole data is in the order of less than one millimeter. As for the effect of ageing, the data show a decrease of mean displacement all along the ageing time, except for the data at the month 8, where higher values are shown. This fact could be related to the presence of corrosion products. The very high data spreading, with respect to the displacement at max load together with the low number of specimens doesn’t allow at increasing ageing time to assess relevant results.
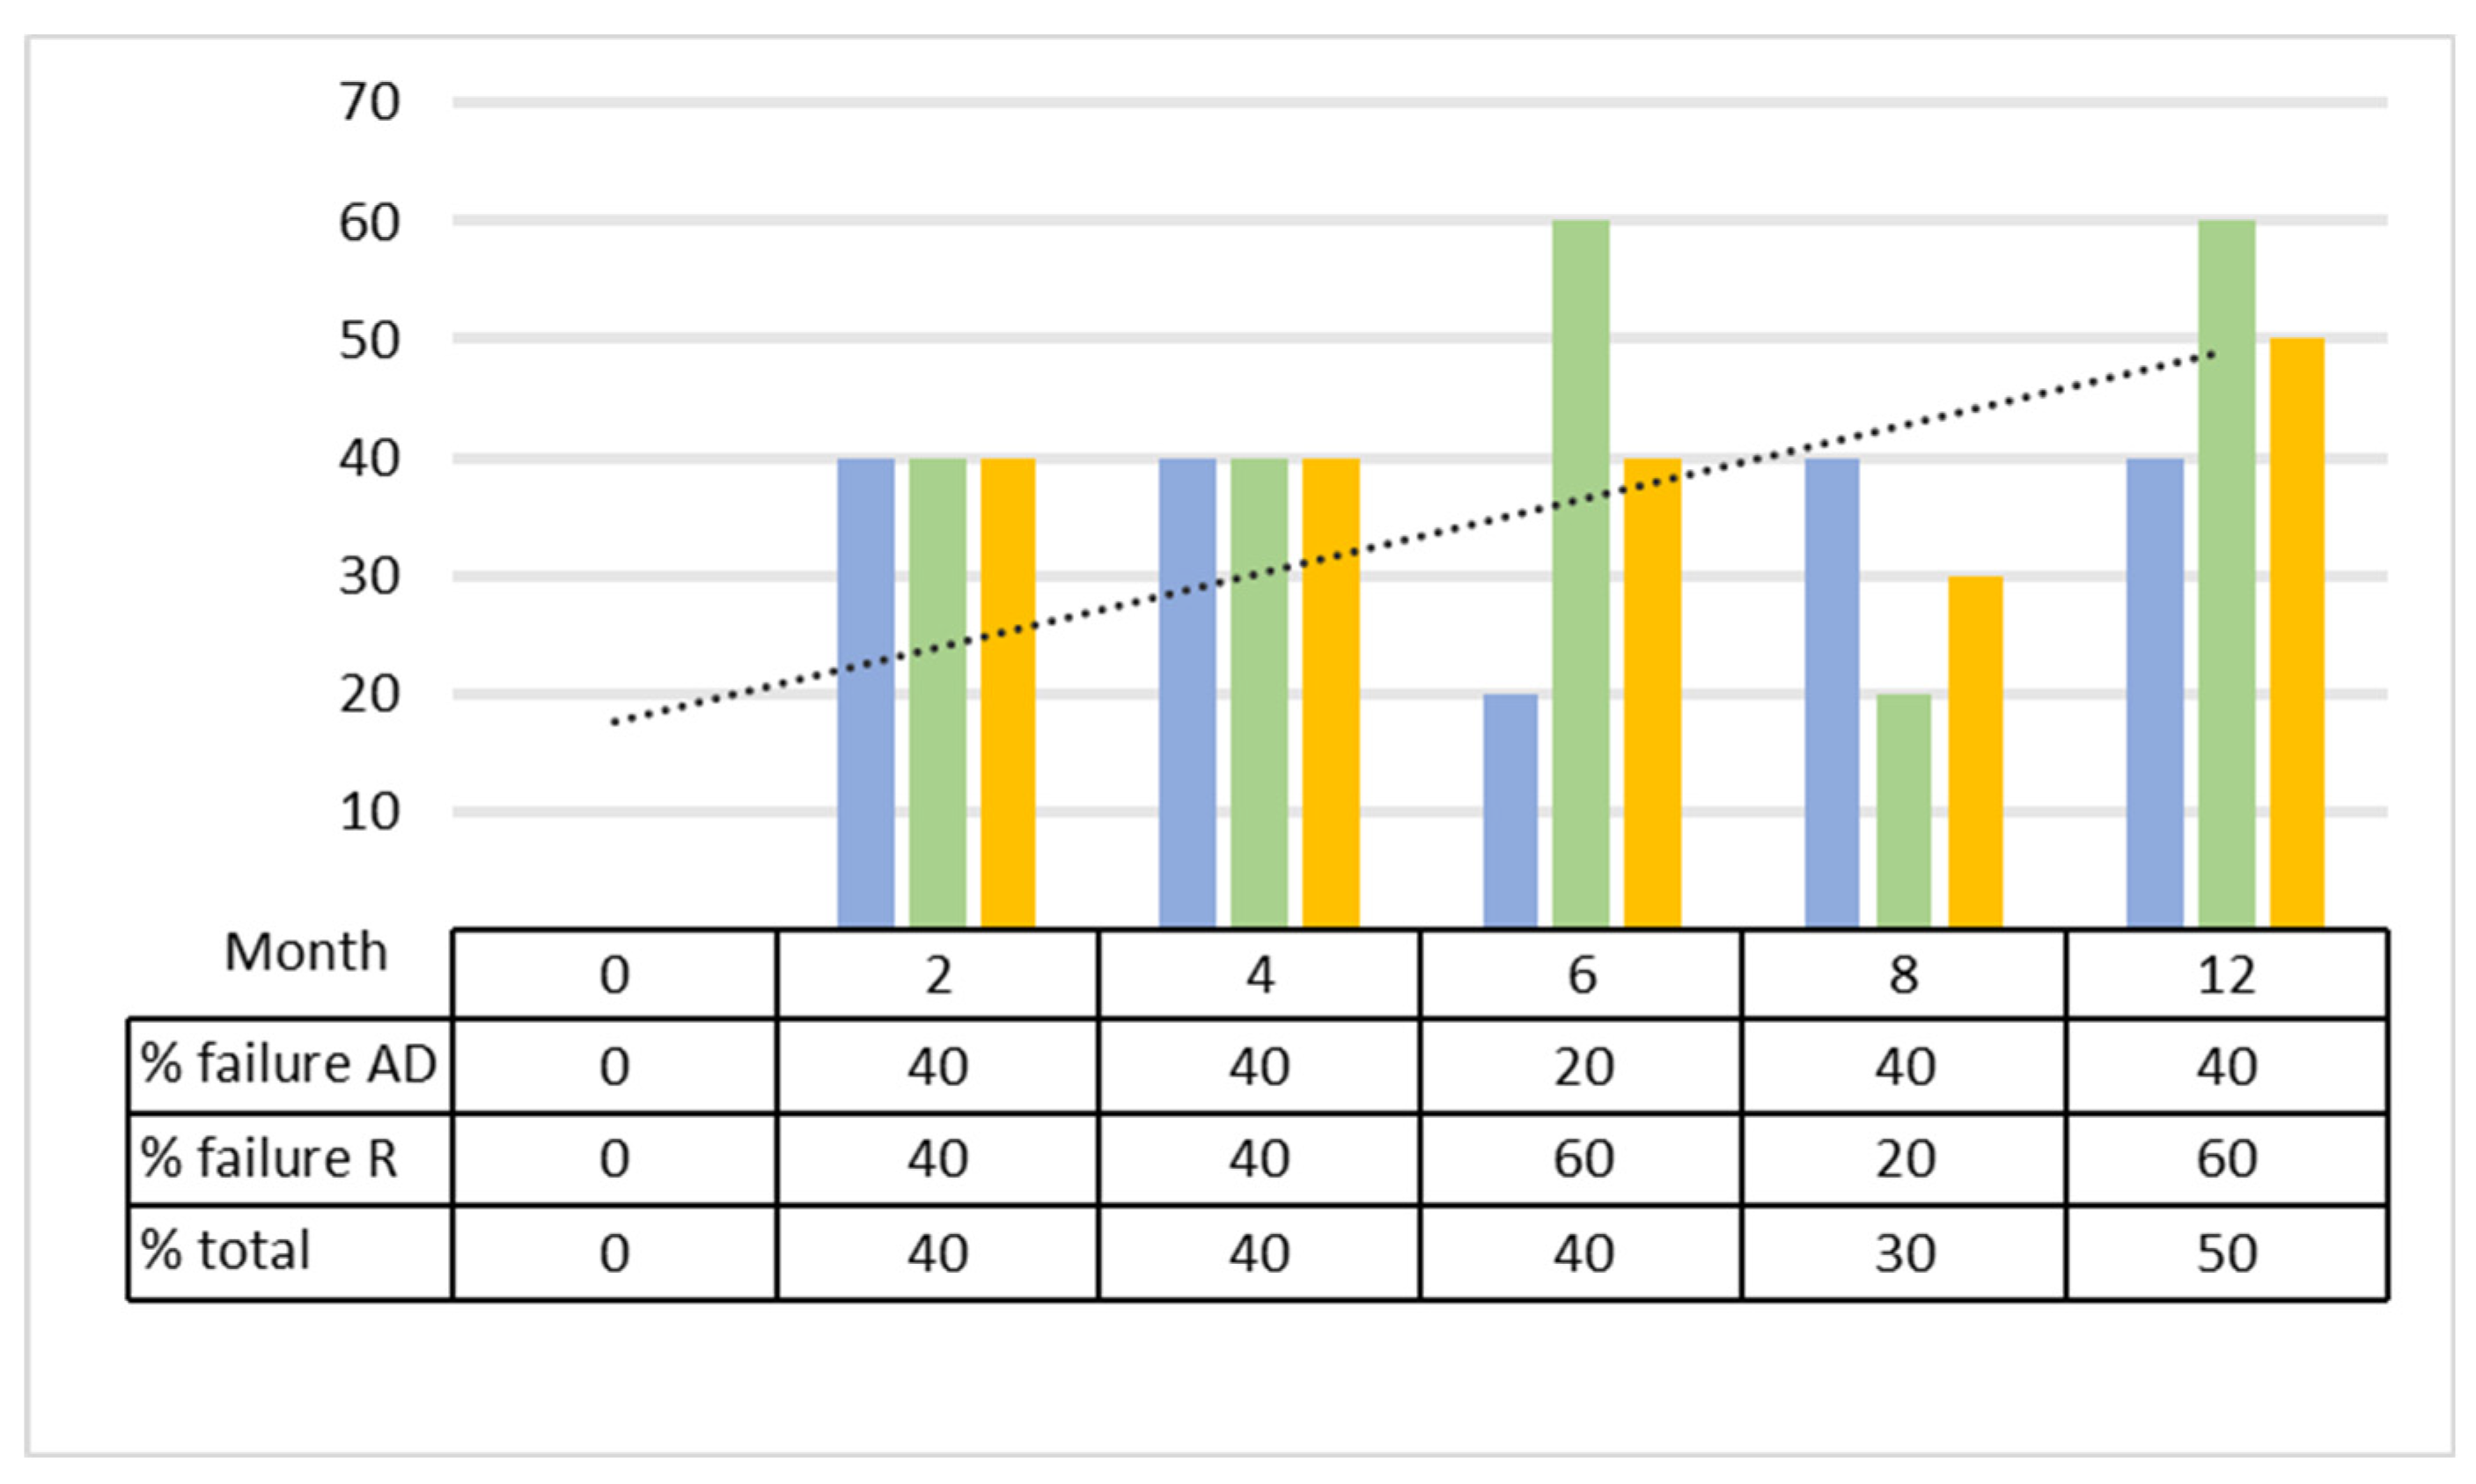
To consider the incidence of the number of broken specimens during aging, this number has been divided by the total number of specimens for each welding direction and for each ageing time. The results are shown in the next
Figure 21.
For the number of studied specimens, no difference between the two welding directions is found, moreover it is worth noticing that starting from the second month the effect of corrosion leads to an excessive damaging of the welding that is almost stationary until the 12th month were half of the population of sample is completely damaged.
5. Conclusions
In this study friction stir welded joints between steel and aluminum alloy have been subjected to accelerated ageing tests (salt fog test - according to ASTM B117). In the first part of the work, data resulting from tensile tests are reported and a preliminary analysis of the ageing process is obtained. The main results can be summarized as follows:
The breakage of the samples during tensile tests occurs always at the junction interface. The surfaces of fracture do not evidence significant differences at changing welding direction.
By increasing the exposition time, the products of corrosion interest the surfaces of fracture in different ways: The area of mixing where welding occurs is clean; the free areas of aluminum and steel are covered by the products of corrosion. The areas between the free sheets and the mixing zone, where aluminum and steel are in intimate contact, but they are not joined, are clean for low time of exposition but the corrosion products penetrate for high exposition time by promoting the failure of the joint.
Moreover,
between the investigated factors (welding direction and ageing time), the welding direction influence the mechanical resistance of the joints only if they are not subjected to salt fog test. The advancing side joints are characterized by a higher joint strength than the retreating side ones at T0, while no significant difference of max load is recorded during the first year of ageing.
The ageing time severely influences the joint resistance starting from the first point of test (i.e. 2 months). Starting from the first point of ageing the maximum load decrease of about 40%, and some specimens are already broken in the salt spray chamber.
The data of Displacement at max load obtained by the tensile are very scattered at increasing the aging time, this fact, together with the low number of samples tested at high aging time does not allow to assess any relevant result.
As for the specimens broken before the tensile test, at increasing aging time, no difference between the two welding directions is found, moreover it is worth noticing that starting from the second month the effect of corrosion leads to an excessive damaging of the welding that is almost stationary until the 12th month were half of the population of sample is damaged.
Further tests (microhardness, metallographic analysis) on theses joints will focus on how corrosion phenomena occur.
Author Contributions
Conceptualization, Guido Di Bella, Chiara Borsellino and Federica Favaloro; methodology, Guido Di Bella, Chiara Borsellino and Federica Favaloro; formal analysis, Chiara Borsellino and Federica Favaloro; investigation, Guido Di Bella, Chiara Borsellino and Federica Favaloro; resources, Chiara Borsellino; data curation, Federica Favaloro; writing—original draft preparation, Federica Favaloro and Chiara Borsellino; writing—review and editing, Chiara Borsellino and Federica Favaloro; visualization, Guido Di Bella; supervision, Chiara Borsellino; project administration, Guido Di Bella and Chiara Borsellino. All authors have read and agreed to the published version of the manuscript.
Funding
This research was funded by Sicilian Region on the European Regional Development Fund 2014-2020, as part of the project “Innovative Solutions for High Energy Saving Naval Vessels (SI-MARE)”, grant number 08ME7219090182.
Data Availability Statement
Not applicable.
Conflicts of Interest
The authors declare no conflict of interest. The funders had no role in the design of the study; in the collection, analyses, or interpretation of data; in the writing of the manuscript; or in the decision to publish the results.
References
- N. Le Bozec, A. Le Gac, D. Thierry, Corrosion performance and mechanical properties of joined automotive materials Mater Corros, 63 (2012), pp. 408-415. [CrossRef]
- Zhang C, Cao Y, Huang G, Zeng Q, Zhu Y, Huang X, et al. Influence of tool rotational speed on local microstructure, mechanical and corrosion behavior of dissimilar AA2024/7075 joints fabricated by friction stir welding. J Manuf Processes 2020; 49:214–26. [CrossRef]
- Sachindra Shankar, Kush P. Mehta, Somnath Chattopadhyaya, Pedro Vilaça, Dissimilar friction stir welding of Al to non-Al metallic materials: An overview, Materials Chemistry and Physics,Volume 288, 2022, 126371, ISSN 0254-0584, (https://www.sciencedirect.com/science/article/pii/S0254058422006770). [CrossRef]
- Sahu M, Ganguly S. Distribution of intermetallic compounds in dissimilar joint interface of AA 5083 and HSLA steel welded by FSW technique. Intermetallics 151, 107734 (2022). [CrossRef]
- Zhenglin Du, Hui-Chi Chen , Ming Jen Tan, Guijun Bi, Chee Kai Chua, Investigation of porosity reduction, microstructure and mechanical properties for joining of selective laser melting fabricated aluminium composite via friction stir welding, Singapore Centre for 3D Printing, School of Mechanical & Aerospace Engineering, Nanyang Technological University, 50 Nanyang Avenue, 639798, Singapore, Singapore Institute of Manufacturing Technology (SIMTech), 73 Nanyang Dr, 637662, Singapore.
- Steenbergen J.E., Thornton H.R.: Quantitative determination of the conditions for hot cracking during welding of aluminium alloys, 1970, Welding Journal 49 (2), pp. 61s to 68s.
- A. Heidarzadeh, S. Mironov, R. Kaibyshev, G. Çam, A. Simar, A. Gerlich, F. Khodabakhshi, A. Mostafaei, D.P. Field, J.D. Robson, A. Deschamps, P.J. Withers, Friction stir welding/processing of metals and alloys: A comprehensive review on microstructural evolution, Progress in Materials Science, Volume 117, 2021, 100752, ISSN 0079-6425. [CrossRef]
- Chen, Z.W.; Yazdanian, S.; Littlefair, G. Effects of tool positioning on joint interface microstructure and fracture strength of friction stir lap Al-to-steel welds. J. Mater. Sci. 2013, 48, 2624–2634. [Google Scholar] [CrossRef]
- Mortello, M.; Pedemonte, M.; Contuzzi, N.; Casalino, G. Experimental Investigation of Material Properties in FSW Dissimilar Aluminum-Steel Lap Joints. Metals 2021, 11, 1474. [CrossRef]
- Sanjay Raj, Pankaj Biswas, Experimental investigation of the effect of induction preheating on the microstructure evolution and corrosion behaviour of dissimilar FSW (IN718 and SS316L) joints, Journal of Manufacturing Processes, Volume 95, 2023, Pages 143-159, ISSN 1526-6125. [CrossRef]
- Palanivel R, Koshy Mathews P, Murugan N. Optimization of process parameters to maximize ultimate tensile strength of friction stir welded dissimilar aluminum alloys using response surface methodology. J Cent South Univ 2013; 20:2929-38. [CrossRef]
- Kasman S, Kahraman F, Emiralioğlu A, Kahraman H. A Case Study for the Welding of Dissimilar EN AW6082 and EN AW 5083 Aluminum Alloys by Friction StirWelding. Metals 2016; 7:6. [CrossRef]
- Jaia S, Sharmab N, Guptac R. Dissimilar alloys (AA6082/AA5083) joining by FSW and parametric optimization using Taguchi, grey relational and weight method. Eng Solid Mech. 2018; 6: 53-66. [CrossRef]
- Di Bella G, Alderucci T, Favaloro F, Borsellino C. Effect of tool tilt angle on mechanical resistance of AA6082/AA5083 friction stir welded joints for marine applications. In: 16th CIRP Conference on Intelligent Computation in Manufacturing Engineering (CIRP ICME 2022), Naples (2022).
- Di Bella G, Alderucci T, Salmeri F, Cucinotta F. Integrating the sustainability aspects into the risk analysis for the manufacturing of dissimilar Aluminium/Steel Friction Stir Welded single lap joints used in marine applications through a Life Cycle Assessment. Sustainable Futures 4, 100101 (2022). [CrossRef]
- J. Wloka, H. Laukant, U. Glatzel, S. Virtanen Corrosion properties of laser beam joints of aluminium with zinc-coated steel Corros Sci, 49 (11) (2007), pp. 4243-4258. [CrossRef]
- D. Narsimhachary, P.K. Rai, S.M. Shariff, G. Padmanabham, K. Mondal, A. Basu, Corrosion behavior of laser-brazed surface made by joining of AA6082 and galvanized steel J Mater Eng Perform, 28 (2019), pp. 2115-2127. [CrossRef]
- G. Di Bella, C. Borsellino, L. Calabrese, E. Proverbio Durability of orbital riveted steel/aluminium joints in salt spray environment – J Manuf Process, 35 (2018), pp. 254-260. [CrossRef]
- L. Calabrese, L. Bonaccorsi, E. Proverbio, G. Di Bella, C. Borsellino, Durability on alternate immersion test of self-piercing riveting aluminium joint, Mater. Des., 46 (2013), pp. 849-856. [CrossRef]
- L. Calabrese, E. Proverbio, G. Galtieri, C. Borsellino, Effect of corrosion degradation on failure mechanisms of aluminium/steel clinched joints, Mater Des, 87 (2015), pp. 473-481. [CrossRef]
- (Y.C. Lim, L. Squires, T.Y. Pan, M. Miles, G.L. Song, Y. Wang, et al. Study of mechanical joint strength of aluminum alloy 7075-T6 and dual phase steel 980 welded by friction bit joining and weld-bonding under corrosion medium , Mater Des, 69 (2015), pp. 37- 43. [CrossRef]
- Kulkarni, B., Pankade, S., Tayde, S. et al. Corrosion and Mechanical Aspects of Friction Stir Welded AA6061 Joints: Effects of Different Backing Plates. J. of Materi Eng and Perform 32, 10817–10833 (2023). [CrossRef]
- Sam Yaw Anaman, Hoon-Hwe Cho, Hrishikesh Das, Jong-Sook Lee, Sung-Tae Hong, Microstructure and mechanical/electrochemical properties of friction stir butt welded joint of dissimilar aluminum and steel alloys, Mater Charact, 154 (2019), pp. 67-79. [CrossRef]
- Di Bella Guido, Borsellino Chiara, Khaskhoussi Amani and Proverbio Edoardo - Effect of tool rotation direction on mechanical strength of single lap Friction Stir Welded joints between AA5083 aluminum alloy and S355J0 steel for maritime applications 2023.
- Khaskhoussi A, Di Bella G, Borsellino C, Calabrese L, Proverbio E. Microstructural and electrochemical characterization of dissimilar joints of aluminum alloy AW5083 and carbon steel S355 obtained by friction welding. Italian Metallurgy 9, 15-21 (2022).
Figure 1.
Advancing and Retreating sides. [
24].
Figure 1.
Advancing and Retreating sides. [
24].
Figure 2.
Friction Stir Welded area: a) whole joined structure; b) zoom on the aluminum area involved by the tool; section after cutting; treated area (mechanical and etching); c) optical microscope image of the steel inclusions [
24].
Figure 2.
Friction Stir Welded area: a) whole joined structure; b) zoom on the aluminum area involved by the tool; section after cutting; treated area (mechanical and etching); c) optical microscope image of the steel inclusions [
24].
Figure 3.
Failure area of an FSW-AD joint.
Figure 3.
Failure area of an FSW-AD joint.
Figure 4.
FSW advancing side at time (a) zero, (b) 2 months, (c) 4 months, (d) 6 months, (e) 8 months, (f) 12 months;.
Figure 4.
FSW advancing side at time (a) zero, (b) 2 months, (c) 4 months, (d) 6 months, (e) 8 months, (f) 12 months;.
Figure 5.
FSW retreating side at time (a) zero, (b) 2 months, (c) 4 months, (d) 6 months, (e) 8 months, (f) 12 months;.
Figure 5.
FSW retreating side at time (a) zero, (b) 2 months, (c) 4 months, (d) 6 months, (e) 8 months, (f) 12 months;.
Figure 6.
Typical displacement curves, for advancing and retreating side joint at increasing aging.
Figure 6.
Typical displacement curves, for advancing and retreating side joint at increasing aging.
Figure 7.
Fracture mode of FSW_AD and FSW_R samples at T0;.
Figure 7.
Fracture mode of FSW_AD and FSW_R samples at T0;.
Figure 8.
Fracture mode of FSW_AD and FSW_R samples at T1;.
Figure 8.
Fracture mode of FSW_AD and FSW_R samples at T1;.
Figure 9.
Fracture mode of FSW_AD and FSW_R samples at T2;.
Figure 9.
Fracture mode of FSW_AD and FSW_R samples at T2;.
Figure 10.
Fracture mode of FSW_AD and FSW_R samples at T3;.
Figure 10.
Fracture mode of FSW_AD and FSW_R samples at T3;.
Figure 11.
Fracture mode of FSW_AD and FSW_R samples at T4;.
Figure 11.
Fracture mode of FSW_AD and FSW_R samples at T4;.
Figure 12.
Fracture mode of FSW_AD and FSW_R samples at T5;.
Figure 12.
Fracture mode of FSW_AD and FSW_R samples at T5;.
Figure 13.
Maximum Loads for AD/R joints at the five points of aging.
Figure 13.
Maximum Loads for AD/R joints at the five points of aging.
Figure 14.
ANOVA – Distribution of data and residual.
Figure 14.
ANOVA – Distribution of data and residual.
Figure 17.
Tukey Pairwise Comparisons for the six ageing times.
Figure 17.
Tukey Pairwise Comparisons for the six ageing times.
Figure 18.
Displacement at maximum Loads for AD/R joints at the five points of aging.
Figure 18.
Displacement at maximum Loads for AD/R joints at the five points of aging.
Figure 19.
ANOVA – Distribution of data and residual.
Figure 19.
ANOVA – Distribution of data and residual.
Figure 21.
Percentage of broken specimen at varying ageing time.
Figure 21.
Percentage of broken specimen at varying ageing time.
Table 1.
Chemical composition of AA5083-H111 aluminum alloy and S355-J0 steel (wt. %).
Table 1.
Chemical composition of AA5083-H111 aluminum alloy and S355-J0 steel (wt. %).
| |
Al |
Mg |
Mn |
Si |
Fe |
Cr |
Zn |
C |
T |
Cu |
S |
P |
N |
Other |
| AA5083-H111 |
Bal. |
4.0-4.9 |
0.4-1.0 |
<0.4 |
<0.4 |
0.05-0.25 |
<0.25 |
- |
<0.15 |
<0.1 |
- |
- |
- |
<0.15 |
| S355-J0 |
- |
- |
<1.60 |
<0.55 |
- |
- |
- |
<0.20 |
- |
<0.55 |
<0.03 |
<0.03 |
<0.012 |
- |
Table 2.
Mechanical properties of AA5083-H111 aluminum alloy [
15] and S355-J0 steel.
Table 2.
Mechanical properties of AA5083-H111 aluminum alloy [
15] and S355-J0 steel.
| |
Rm [MPa] |
Rp02 [Mpa] |
A [%] |
HV0.1 |
| AA5083-H111 |
>275 |
>125 |
16 |
82 |
| S355-J0 |
470-630 |
355 |
22 |
- |
Table 4.
ANOVA: Analysis of Variance for Maximum Load [N].
Table 4.
ANOVA: Analysis of Variance for Maximum Load [N].
Table 6.
ANOVA: Analysis of Variance for Displacement Maximum Load [N].
Table 6.
ANOVA: Analysis of Variance for Displacement Maximum Load [N].
|
Disclaimer/Publisher’s Note: The statements, opinions and data contained in all publications are solely those of the individual author(s) and contributor(s) and not of MDPI and/or the editor(s). MDPI and/or the editor(s) disclaim responsibility for any injury to people or property resulting from any ideas, methods, instructions or products referred to in the content. |
© 2023 by the authors. Licensee MDPI, Basel, Switzerland. This article is an open access article distributed under the terms and conditions of the Creative Commons Attribution (CC BY) license (http://creativecommons.org/licenses/by/4.0/).
