1. Introduction
The analysis of test separators and dynamical fluid metering is an intriguing field that delves into the measurement and monitoring of fluids in various industrial processes. Test separators are essential equipment used to separate and evaluate the composition of different fluids, such as oil, gas, and water, in oil and gas production operations.
These separators play a crucial role in determining the quantity and quality of the fluids being extracted from reservoirs. They help characterize the flow rates, pressure, temperature, and volume of each component, enabling engineers and operators to make informed decisions about the production process.
On the other hand, dynamical fluid metering involves the precise measurement of fluid properties, such as flow rates, viscosity, density, and composition. Accurate fluid metering is vital for ensuring efficiency, safety, and compliance in a wide range of industries, including oil and gas, chemical production, water management, and many more.
By analyzing test separators and utilizing dynamic fluid metering techniques, engineers can optimize production processes, detect anomalies, prevent equipment malfunction, and enhance overall operational performance. This field of study combines scientific principles, engineering expertise, and advanced technologies to provide valuable insights into fluid behavior and facilitate effective decision-making.
2. The Significance of Study
The Sustainable Development Goals (SDGs) set by the United Nations have significant implications for various industries, including the analysis of test separators and dynamical fluid metering. Let’s explore the connection between these two areas and the SDGs.
- ➢
Goal 6: Clean Water and Sanitation: Test separators and dynamical fluid metering techniques contribute to achieving this goal by ensuring efficient and accurate measurement of water usage, quality, and conservation. By monitoring and optimizing fluid flow, these technologies help prevent contamination and promote sustainable water management practices.
- ➢
Goal 7: Affordable and Clean Energy: The analysis of test separators and dynamic fluid metering plays a crucial role in the oil and gas industry’s transition towards cleaner and more efficient energy production. By accurately measuring fluid properties, it enables the optimization of energy extraction processes, reduces waste, and promotes the adoption of renewable energy sources.
- ➢
Goal 9: Industry, Innovation, and Infrastructure: Test separators and dynamical fluid metering techniques support the development and implementation of innovative technologies and infrastructure. By ensuring accurate measurement and analysis of fluid dynamics, they contribute to the efficient and sustainable operation of industrial processes, improving productivity and reducing environmental impact.
- ➢
Goal 12: Responsible Consumption and Production: Sustainable fluid management is an essential aspect of responsible consumption and production. Test separators and dynamic fluid metering help monitor and optimize resource usage, reduce waste, and minimize environmental impact, aligning with the principles of sustainable development.
- ➢
Goal 13: Climate Action: The analysis of test separators and dynamic fluid metering provides valuable insights into fluid behavior, enabling the identification and mitigation of greenhouse gas emissions. By optimizing processes and reducing carbon footprints, these technologies support climate change mitigation efforts.
The analysis of test separators and dynamical fluid metering aligns with several SDGs, including clean water and sanitation, affordable and clean energy, industry innovation and infrastructure, responsible consumption and production, and climate action. By promoting sustainable practices and efficient resource management, these technologies contribute to a more sustainable and environmentally conscious future.
3. The Problem Statement for the Research
"Analysis of Test Separators and Dynamical Fluid Metering., Address the limitations and challenges associated with current test separators and fluid metering techniques. These limitations include inaccuracies in measuring fluid flow rates, inefficiencies in separating different components of a fluid mixture, or difficulties in maintaining stable and reliable operations. By conducting an analysis of these systems, the goal is to identify the problems, propose potential solutions, and ultimately enhance the accuracy and efficiency of test separators and fluid metering processes.
4. Methodology
4.1. Experimentation Separator Design
Separators used in experiments are the gold standard for experimenting with wells. While the three-stage separator (consisting of oil, water, and gas) remains the most widely used experimental separator in the North Sea, the two phase (gas-liquid) separator is the norm in many other parts of the world. For comparison, a two-phase horizontal vessel with the same capacity would weigh around 6500Kg and have dimensions of 4 metres in length, 3 metres in width, and 4 metres in height, while its three-phase counterpart would weigh around 10000kg and have dimensions of 7 metres in length, 3.5 metres in width, and 5 metres in height.
Since the two-phase vessels are smaller, they have fewer moving parts, less equipment, and fewer controls, all of which should make them easier to maintain.
In addition, we won’t be covering compact separator systems that utilize fluid energy and intricate geometries to achieve separation. In
Figure 1, we observe a simplified diagram portraying a three-phase separator.
5. The Traditional Method of Well Testing and Observation
The ‘traditional’ method involves one of the following options:
- ➢
To differentiate between the gas and liquids in a two-phase system and accurately measure the flow rates, conventional single-phase meters are utilized. Additionally, the oil/water split is determined by employing a water cut (WC) meter.
- ➢
To accurately measure the three phases - oil, water, and gas - and distinguish between them, a conventional single-phase meter, as illustrated in
Figure 1, is utilized.
- ➢
The implementation of a water cut meter within a three-phase system presents a viable alternative for effectively monitoring pollution, specifically the presence of water in oil or oil in water. Often hailed as the most optimal approach, the three-phase methodology is renowned for delivering the lowest measurement uncertainty when conducting well experimentation. If the following factors are met, it is highly probable.
- ➢
Ensuring a properly sized separator is crucial for effectively separating gas and liquid fractions. If the separator is undersized, it can lead to incomplete separation, posing a higher risk of gas carry-under and liquid carry-over in the liquid leg(s).
- ➢
We ensure that interface levels are carefully maintained to prevent any contamination by oil, water, or other liquid and gas substances.
- ➢
The meters are perfectly sized to accommodate the range of flow rates encountered during operation.
- ➢
The meters are installed according to the prescribed orientation, ensuring that the necessary upstream and downstream straight lengths are maintained. Additionally, regular inspections are carried out to detect any damage or wear, and the meters are calibrated against traceable references using fluids similar to, or ideally, the actual process fluids.
- ➢
All auxiliary instruments (pressure gauges, thermometers, etc.) are routinely checked and adjusted as needed.
- ➢
Constantly checking for silt and solids buildup in the separator is a standard operating procedure.
- ➢
Liquid (and gas) slugging is prevented by the separator controls (difficult when separators are subject to pressure and level control). Moreover, the control system does not include flow regulation, which is essential for indicators.
This is by no means an all-inclusive list of the many design, operating, and maintenance tasks necessary for reliable flow measurement performance. In actual practice, a single well will undergo testing for a predetermined amount of time once every few weeks or months. In the North Sea, this may entail doing an experiment once every 30 days for 12 to 24 hours. The Reservoir and Production Engineers will decide how long to run the experiments.
Nevertheless, when the brief experimentation period is spread out over a more extended duration (like considering a 12- or 24-hour experiment as representative for 30, 60, or 90 days), the uncertainty in flow measurement tends to rise due to the intermittent usage of the experimentation separator and the absence of flow control. In this context, we operate under the assumption that by conducting a series of short flow experiments, typically lasting as little as 4 hours, every 30 days, we can effectively extrapolate the entirety of the monthly flow.
6. To Solve the Problem of Analyzing Test Separators and Dynamical Fluid Metering, Various Research Methods was Employed
1. Experimental Testing: This method involves conducting controlled experiments in laboratory settings or real-world scenarios to gather data on the performance and limitations of test separators and fluid metering techniques. The experiments involve manipulating variables, measuring flow rates, and analyzing the separation efficiency to identify areas of improvement.
2. Computational Modeling: we develop mathematical models and simulations to simulate the behavior of test separators and fluid metering systems. These models was used to analyze the fluid dynamics, evaluate different design configurations, and predict the performance of various components. Computational modeling allows for a more cost-effective and efficient analysis before implementing changes in real-world applications.
3. Data Analysis: Researchers could analyze existing data collected from operational test separators and fluid metering systems. By examining historical data, patterns and trends can be identified, and potential problems can be pinpointed. Statistical analysis and data visualization techniques can be applied to gain insights into the performance of these systems and highlight areas for improvement.
4. Comparative Studies: This method was used to compare different types of test separators and fluid metering techniques to evaluate their advantages and disadvantages. This could include analyzing case studies, conducting literature reviews, and examining industry best practices. Comparative studies was identify the most effective approaches and provide guidance for improving existing systems.
7. Result and Discussion
7.1. Metering for the Experiment Separator
7.1.1. The Measurement of Gas flow Using an Orifice Plate
Orifice metres are now the most widely used type of petrol metre in the world. The Daniels Senior orifice type fitting is widely recognized and accepted by industry professionals, along with its several clones, is the de facto gas metre for an experimental separator because it allows orifice plates to be readily changed and because it gives this capability. However, the following is a summary of some of the most typical orifice metre issues seen in experimental separator systems:
- ➢
Plate geometry (including worn sharp edges, damaged faces, polluted areas, and so on)
- ➢
Correctly placed plate with the front pointing outward.
- ➢
The installation impacts are often limited to short meter runs, typically around 10D with a 90° bend. Secondary instrument calibration is infrequent, which can lead to errors when operating at low pressures and challenges related to signal-to-noise ratios.
- ➢
Carryover of liquid, with “tide markings” appearing frequently as a result of this phenomenon
- ➢
Taking spot samples for density on an occasional basis, preferably with related liquids
- ➢
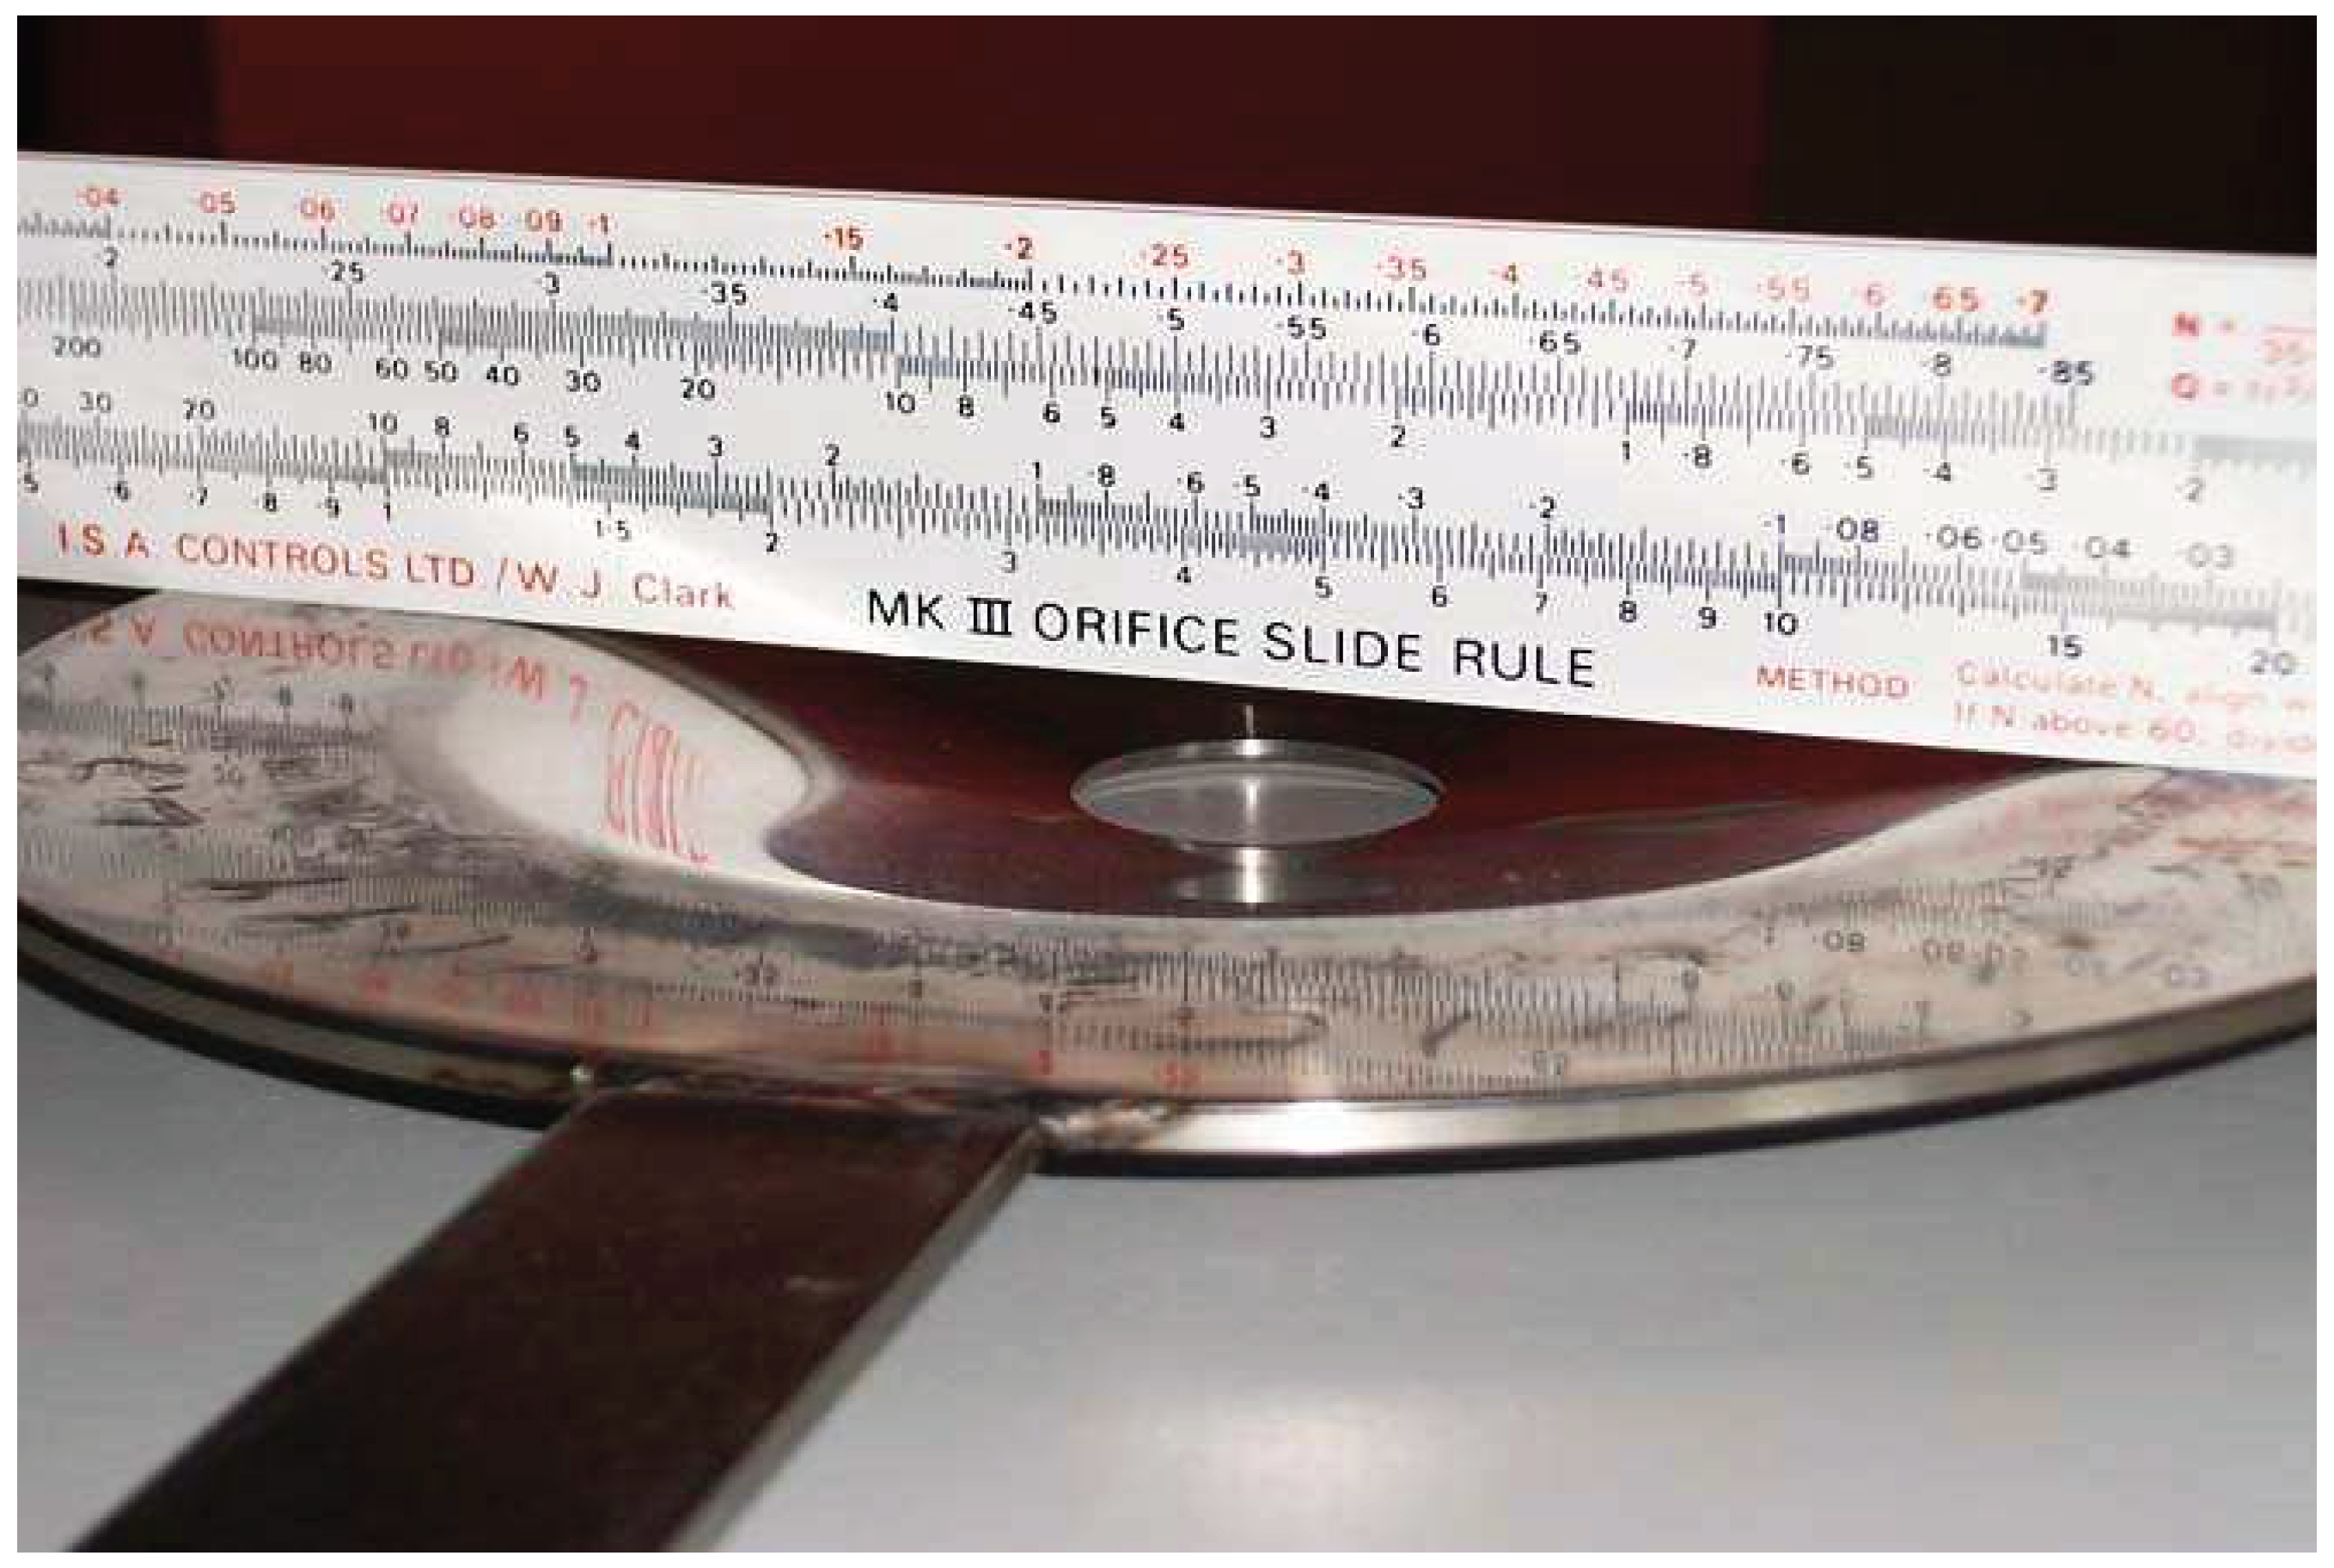
Slug flows, which results in a bent plate. Please refer to
Figure 2 for the presence of liquids and solids in the gearbox tube.
Bent orifice plate serves the function of measuring fluid flow rates. It is a specialized components that introduces a constriction in the flow path measurements purposes. It offers a cost effective and reliable method for estimating flow rates in multiphase flow conditions. By evaluating the performance and limitations of the bent orifice plate in comparison to test separators and dynamical multiphase flows meters.
7.1.2. Gas Meters Equipped with Alternative Differential Pressure (DP) Measurement Methods
Other varieties of DP metres include cone metres and Venturi metres. Although these are very good indicators, they have a number of drawbacks, the most significant of which are their set Beta and the restricted rangeability of the metre at low flows caused by the 1/2-DP function. For example, a 10:1 reduction in DP corresponds to a 3 or 4:1 reduction in flow.
Though it not as vulnerable to liquids and can clean itself, the cone-type metre is more prone to harm by slug flows. Even though it has a self-cleaning feature, this remains the case.
7.1.3. Exploring Alternatives to Traditional DP Gas Meters - Non-DP Gas Meters
While orifice meters are widely used, non-DP meters have also found application in experimental separator metering. Examples of such meters include Ultrasonic (USM) and Coriolis meters. Both these technologies are remarkable; however, it’s important to recognize that they have their own distinct limitations.
Coriolis meters are used to measure mass, but they often lack specificity in providing density output. This density output can be used for converting flows to volume, although there is concern about its reliability. Due to their small meter bores, these meters offer a high turn down ratio, but they also have a relatively significant potential for head loss.
Ultrasonic meters, known as volumetric meters, are highly versatile with excellent turn-down capabilities and minimal head loss, unless flow conditioners are necessary. These meters have found extensive application in experimental separators. Although there have been notable successes, it is important to acknowledge documented instances (and likely numerous unreported cases) where the accuracy of ultrasonic meters has been compromised due to liquid interference with transducers and signals.
Please note that the flow regulators within this service require careful examination due to the genuine issue of hydrates [
2].
7.1.4. The Main Concern Relating to the Experimental Separation Gas Metering
The primary problem with the meters used for gas metering in the early phase separator service is that there is a lack of understanding about the impact of gas ’wetness’ and how these meters work when dealing with wet or saturated flows. It’s one thing to be aware that the meter may over or under measure in wet gas situations, but without knowing the level of gas wetness, it’s difficult to determine the extent to which the meter has over or under measured. Hence, there will consistently be a notable level of uncertainty linked to this particular measurement.
7.2. Fluid Measurement
7.2.1. Wind-Turbine Gauges
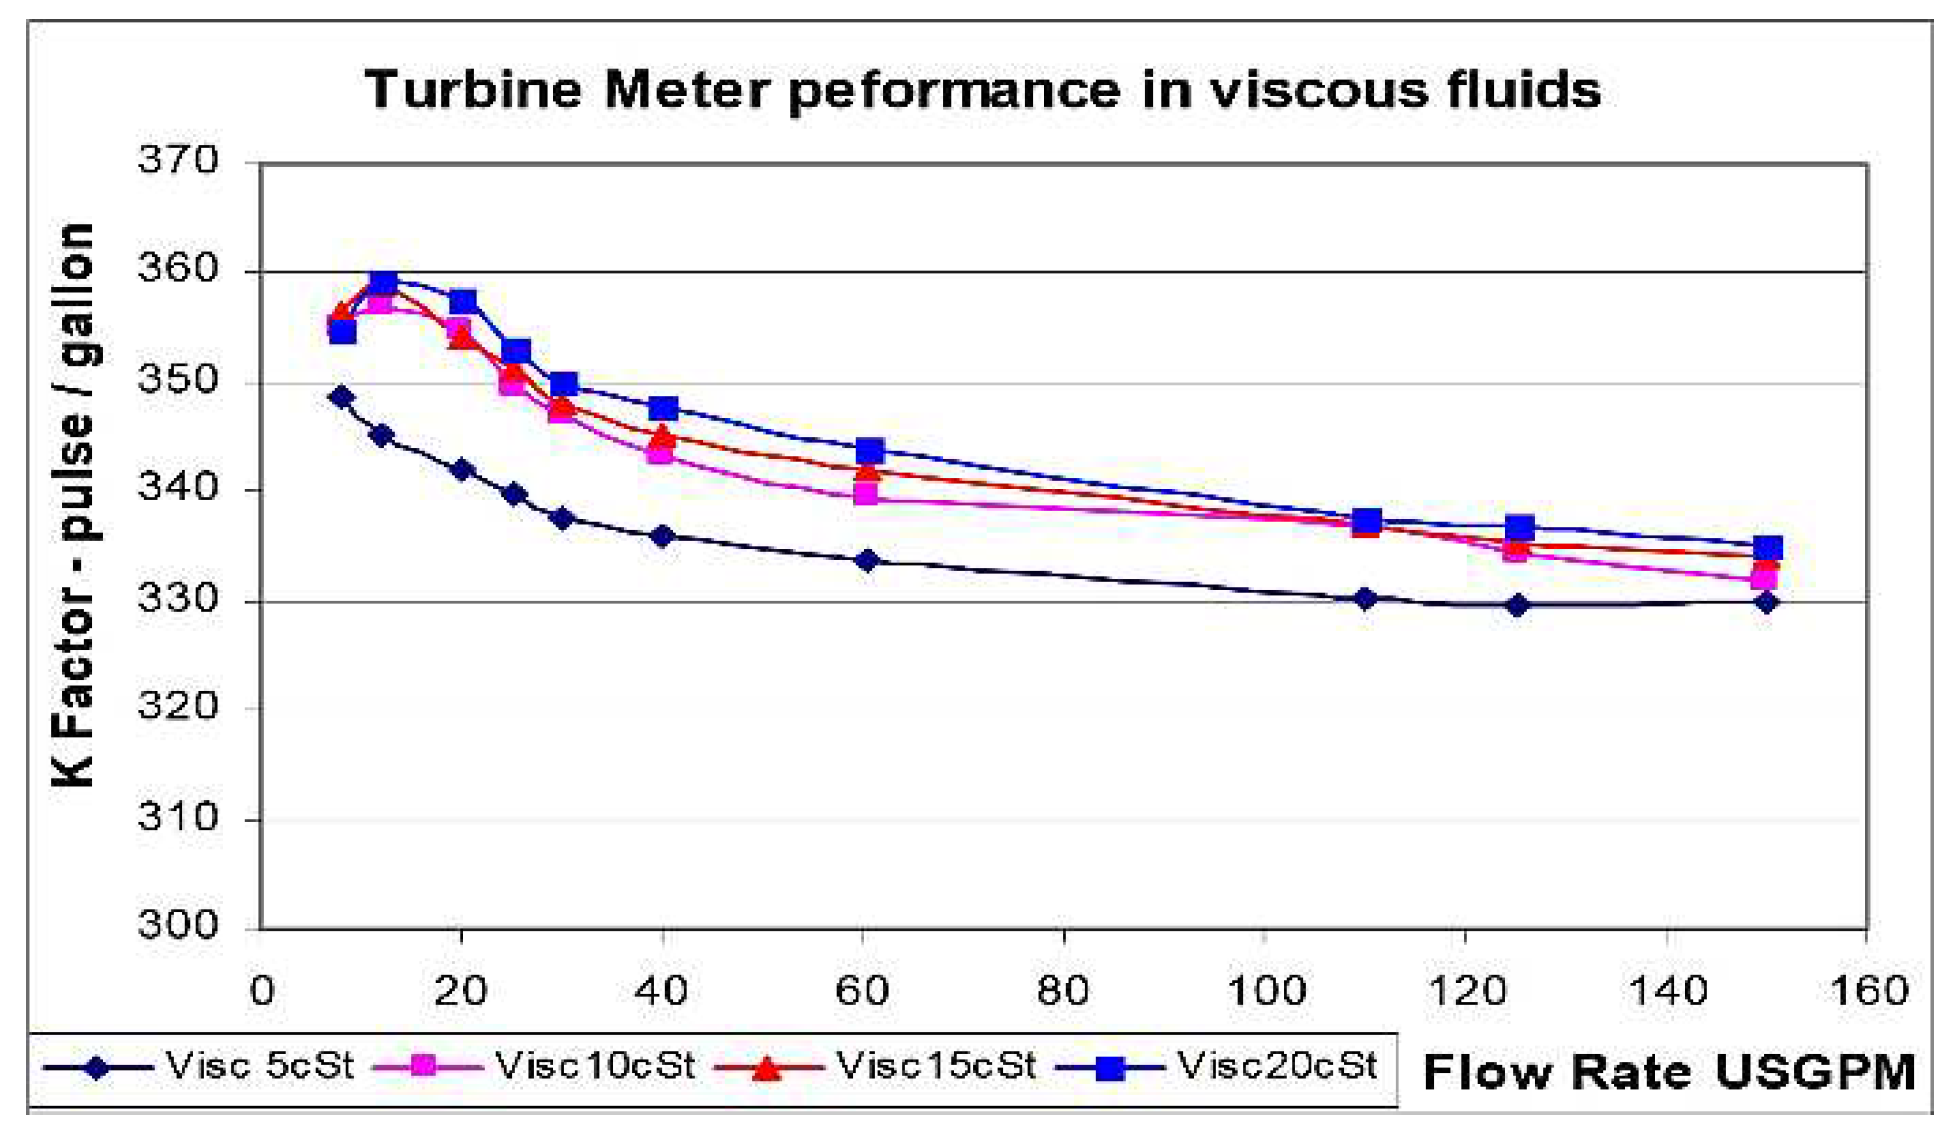
Historically, the turbine metre was the most extensively used liquid metre in experiments separator service. While this metre is a reliable fiscal metre when combined with a proof, its limitations must be acknowledged. When at or near the bubble point, it is particularly vulnerable to variable flows, fluid viscosity, and gas break out, and it is also vulnerable to integrated gases and any particulates in the flow. Typical issues include: -
- ➢
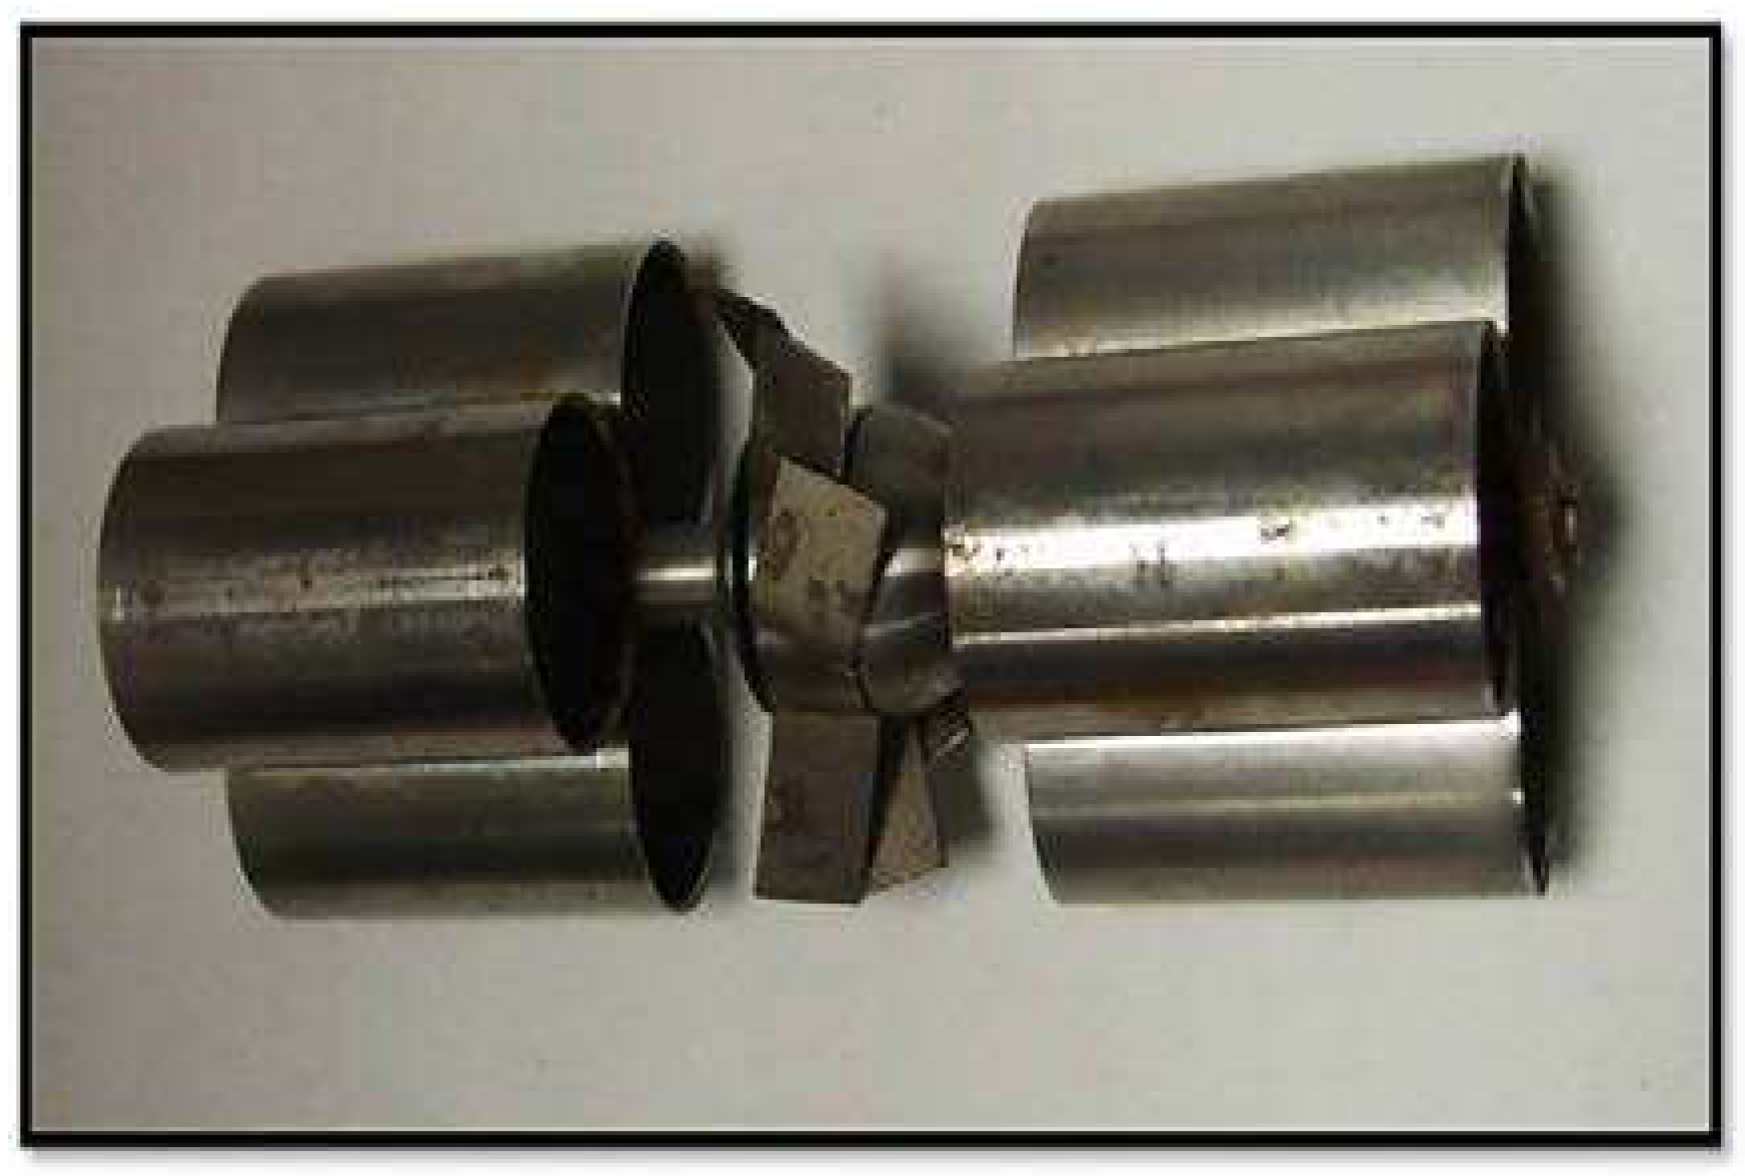
The turbine’s physical condition - Damaged blades. See
Figure 3. - Rusted bearings
- ➢
Liquids can become contaminated with either water in oil or oil in water
- ➢
The roughness of the pipe and potential wall pollution;
- ➢
Regular calibration of main and secondary instruments is recommended to ensure accurate readings.
- ➢
The density or viscosity can vary between different wells or from calibration to operation [
3].
- ➢
The sample size was inadequate to properly evaluate density and viscosity.
- ➢
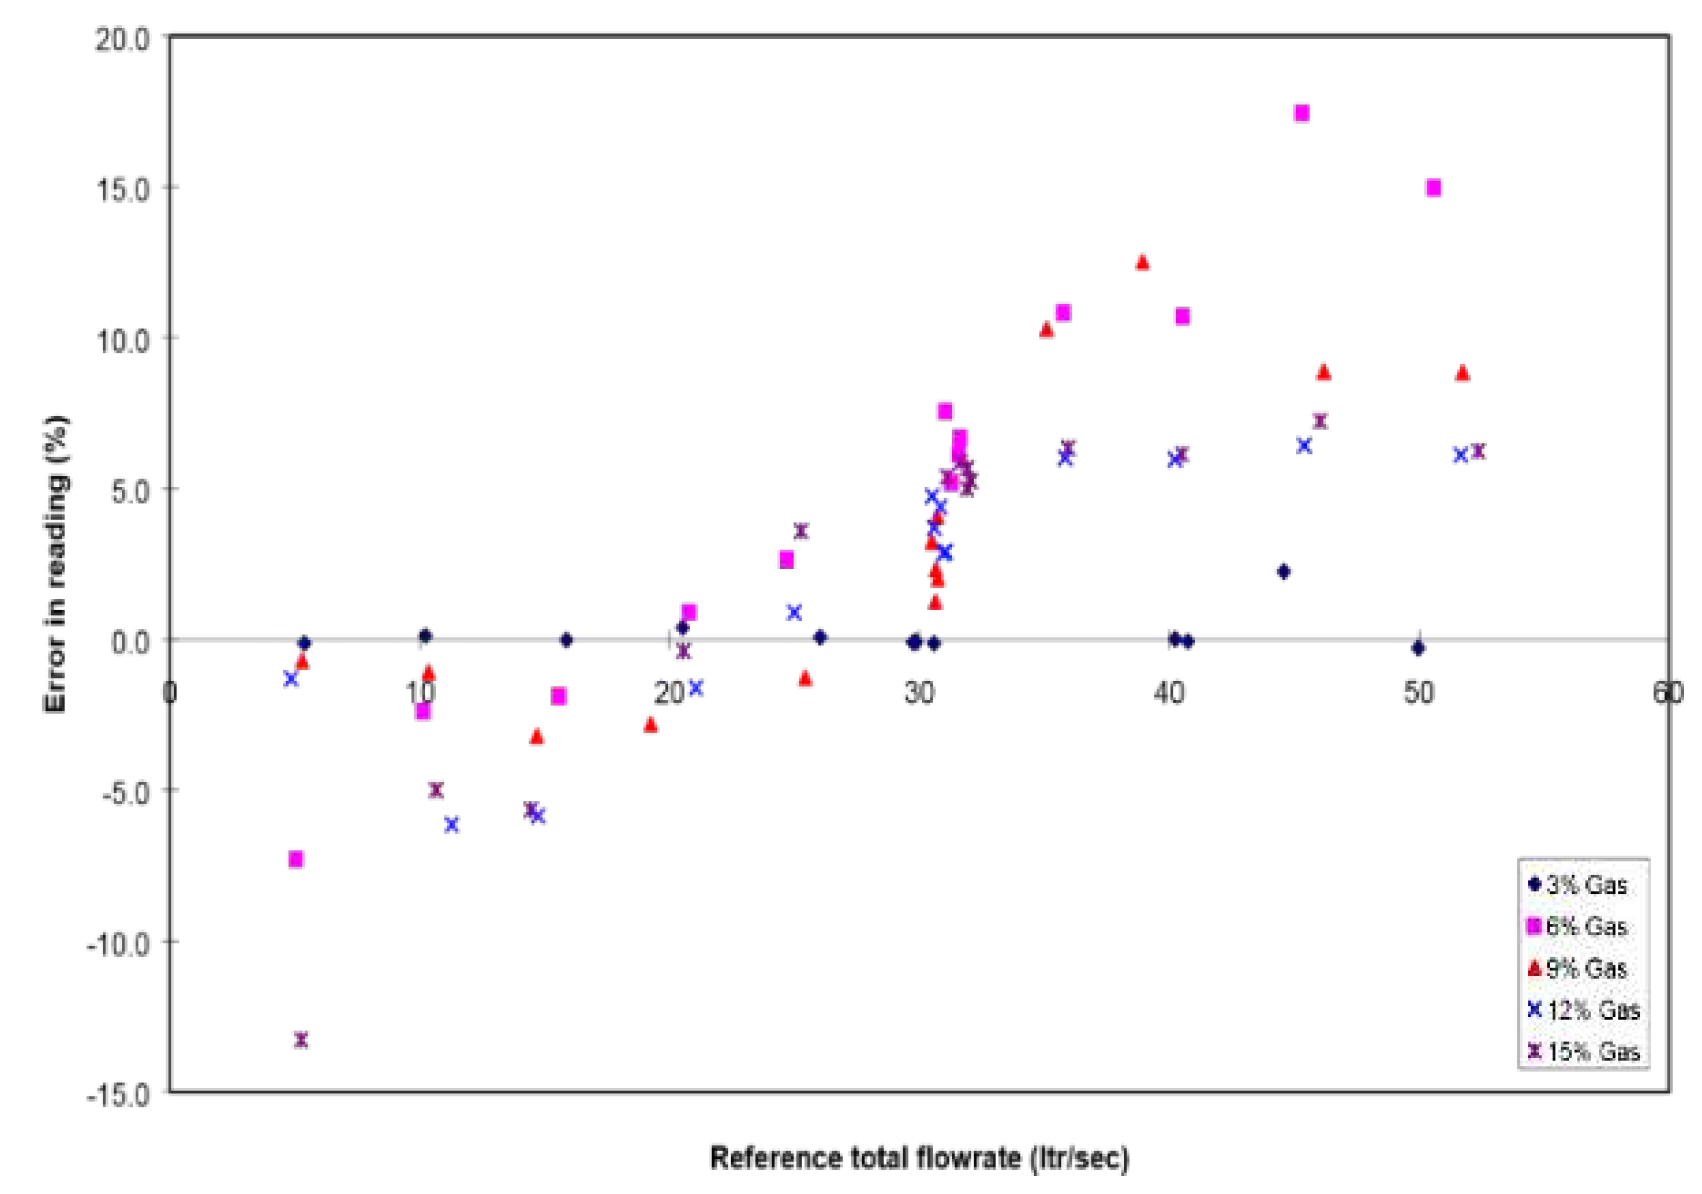
The presence of gas or gas breakout, also known as cavitation, can potentially lead to substantial inaccuracies [
4]. Please direct your attention to
Figure 4.
- ➢
Sensitivity to viscosity - water and oil mixtures are often more viscous than the foundation fluids. Look at
Figure 5.
- ➢
The lack of effective separation between phases (such as emulsions and foaming) leads to contamination between the phases.
A graphical representation illustrating error in liquid rate measurements specifically cavitating flows in a turbine meter. The figure shows potential relationship between the flow rate and the error introduced due to the presence of cavitation. By examining the
Figure 4 and analyzing the error in liquid rate measurements in cavitating flow using a turbine meter, the evaluation aim to assess the limitations and potential inaccuracies associated with this flow measurement techniques in the context of well experimentation represent the performance of a turbine meter in viscous fluids. It illustrates the variation of turbine metering K factors (which represents the meters calibration constant) under different viscosity fluid condition. It shows how the K factors changes as the viscosity of the fluid being measured varies. Evaluating the turbine meters performance in viscous fluid and analyzing k factors under different viscosities allows for a better understanding of the meter’s accuracy and limitations in a well experimentation scenario.
7.2.2. Substitute Liquid Metres
Other indicators are now in use, the most popular of which being Coriolis and ultrasonic metres. Swirl and asymmetry may have an impact on ultrasonic metres (USMs), as they need a completely defined flow profile. Oil/water combinations are tolerable for USMs, but the presence of petrol might cause issues. Free gas in the liquids can affect liquid USMs. At low flows, water globules (the famed "Cousins Glob") and free water in oil can both harm some USM designs [
5]. Unless flow conditioners are required, USMs are non-intrusive metres with very little pressure drop across them. Additionally, USMs provide additional diagnostic data that may be utilized to pinpoint problems such gas carry-under [
6].
Because they don’t require a developed flow profile, Coriolis metres don’t need upstream and downstream straight lengths. However, care should be taken to guarantee that the Coriolis metre is adequately maintained. As Coriolis meters predominantly gauge mass flow as opposed to volumetric flow, additional calculations are required to determine volumetric fluxes. Even though Coriolis meters can measure density, converting mass flow rate to volume flow rate is indeed possible. However, it’s important to note that this conversion may introduce some uncertainty. Oil/water mixes are acceptable for Coriolis metres; however, the inclusion of gas may result in severe inaccuracies. Electronics improvements for the Coriolis metre have made it possible to obtain diagnostic data on the metre and flows during the past ten years.
It is customary to oversize Coriolis metres because of the large pressure drop they will experience. As a result of the need for metre zeroing, Coriolis metres operate less effectively near the bottom of their range, this could potentially heighten the uncertainty surrounding the measurement of liquid flow. Scaling Coriolis meters can sometimes be challenging; therefore, the performance of a six-inch meter may not be as exceptional as that of a four-inch meter.
7.3 Quantifying Water: Accurate Measurement Techniques
A stand-alone meter will be used to measure the water in a three-phase separator. Historically, turbine metres have been utilized, but other metre types, including as Coriolis, USM, and electromagnetic metres, have also been employed recently.
In a two-phase separator, the Water in Oil (WIO) monitor is used to distinguish between the oil and water phases, and the liquids are metered with a single metre. In terms of the oil measurement and the ensuing uncertainty, this is crucial. Gaining a comprehensive understanding of the OIW/WIO monitor’s functionality and its susceptibility to water cut and salinity variations is crucial.
7.3.1. Water Reduction - Analyzing Water Cuts and Monitoring Water Consumption
The quoted uncertainty of several popular water cut monitors is 1%, and these devices use microwave technology. This uncertainty may rise to 2–5%, water typically exhibits a constant flow (typically over 60% of the time) while containing relatively low amounts of gas (ranging from 2% to 5%). It’s important to remember that microwave WC monitors don’t operate as well when water cuts are significant or the salinity shifts.
It is feasible to calculate net oil and water flows using a Coriolis metre by employing the density-based Net Oil Calculation, although this is subject to the following assumptions:
- ➢
An understanding of the densities of water and oil
- ➢
Consistent flow.
- ➢
WC in the middle, as opposed to at the extremes, such as WC >25% or 75%
7.3.2 Water Salinity and Electrical Water Cut Measurement
The salinity must be addressed while measuring WC electrically. Without salinity correction, accuracy is likely to suffer. When the fluid composition is primarily oil, meaning that the oil envelops the water droplets when the water cuts are less than 60%, the salinity does not impact the measurement of water cut (WC). The transition from the ’oil continuous’ condition to the ’water continuous’ condition varies, with effects ranging from 40% to 80%, the outcome may vary based on the current flow regime.
The presence of salinity is expected to pose challenges in the water continuous phase, especially in fields that rely on a water injection system and receive water from multiple sources. The salinity of the generated water has the capacity to undergo a significant variation of up to 25%.
7.3.3 Exploring the Stability of Water Cuts in a Well through Experiments
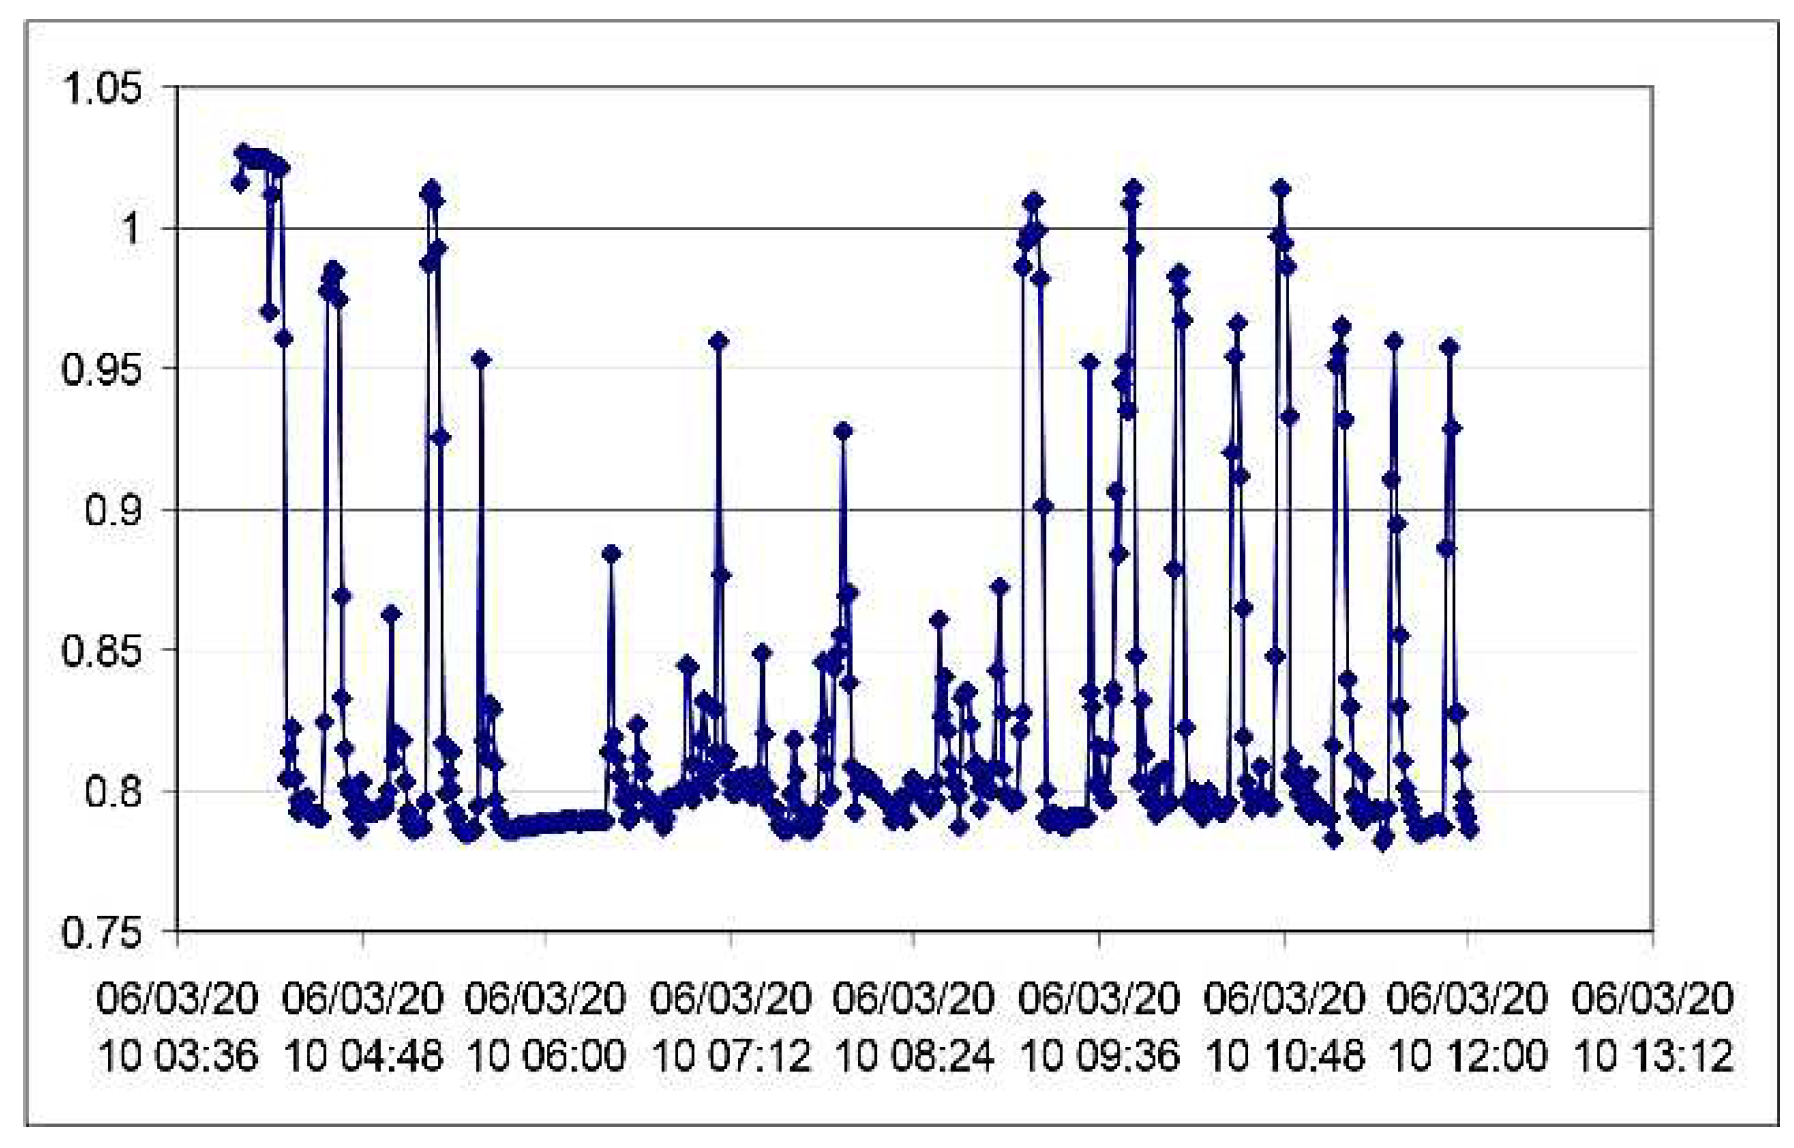
Water cuts are frequently unstable during well exploration and can and do alter regularly. The density of the fluid exhibits a meticulous oscillation, transitioning between 1.025g/cc (resembling water) and 0.78g/cc (resembling oil), as shown in
Figure 6 below, during an experiment utilizing a two-phase separator to measure the changing water cut. A Net Oil Computation from a Coriolis metre was used to calculate the oil water separation. [
7]. Due to these frequent changes, WC determination is a challenging measurement to achieve.
7.3.4 Technologies for Determining Water Cuts
For measuring WC, a variety of technologies are available, including:
- ➢
Microwave - excellent for oil continuous liquids, but unpredictability grows as water content increases. Changes in water salinity, as well as emulsions, can be troublesome for microwave water cut monitors.
- ➢
Electrical capacitance has been found to be advantageous for oil continuous liquids, but it can introduce higher levels of uncertainty when dealing with water continuous fluids. Factors such as changes in salinity and the presence of emulsions may pose challenges in accurately measuring capacitance in these scenarios.
- ➢
The infrared technology operates seamlessly across the entire range of water cut, remaining unaffected by fluctuations in fluid characteristics or the presence of gas. However, it’s important to note that having knowledge of oil quality is essential for accurate results.
- ➢
The Coriolis metering technique, coupled with Net Oil computation, offers versatile applications in both bulk flow measurement and water cut monitoring, provided that the fluid densities are known.
7.4. The Elusive Nature of Measurement
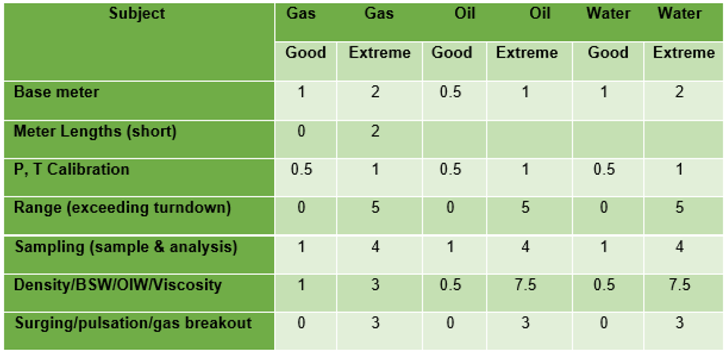
This section lacks a comprehensive examination of measurement uncertainty; rather, it only focuses on the importance of taking measurement uncertainty into account when evaluating the overall performance of the experimental separator. The authors have taken the "easy way out" by copying the uncertainty estimates from API RP 86Table E2 for experimental separator measurements and pasting them into
Table 1 below.
7.4.1 Gas Metre Ambiguity
On the gas leg of an experimental separator, a measurement error of no more than 2% would be considered to be reasonable. With valuable insights from a selection of the esteemed sources mentioned in
Table 1, we have enhanced our understanding significantly, it is more plausible that an average uncertainty would be in the range of 3% to 6%. Extreme circumstances, when some of the sources may significantly increase the uncertainties, might lead to uncertainties exceeding 6%, possibly even as high as 10% to 15%. In cases where the uncertainty is significantly high, it is often attributed to a measurement bias that has been identified. This bias can be quantified to reduce the overall uncertainty or detected through an asymmetric uncertainty distribution. While these observations primarily pertain to orifice meters, many of them also apply to both DP (Differential Pressure) and non-DP meters.
7.4.2 Uncertainties in Liquid Metering
When it comes to measuring liquids like oil or water in a three-phase separator, it is expected that the best achievable measurement uncertainty would fall within the range of 1% to 2%, with an average probability of 2% to 5%. In rare cases, the measurement uncertainty for liquids may exceed 5%, potentially reaching as high as 10%.
Particularly in older fields, the functioning of the water cut monitor in a two-phase separator might be a significant source of error, potentially resulting in inaccuracies of 20% or more on predicted individual oil flow rates.
7.4.3. Problems with Water Metre Accuracy
Although
Table 1 covers the uncertainty of water measurements, in the event of a two-phase separator, it does not include the uncertainty of the resultant oil measurement (1%WC). Measurements of water cuts in two-phase flows have been criticized in the past, but those concerns have been addressed in Section 4.3.
8. Experimentation Separator Value
To separate the fluids, a separator is required. In addition to the use of heat and/or demulsifier chemicals, or any combination thereof, these needs "residence time," which is a function of separator size and flow rates. It needs to:
Get the gas out of the liquid. This depends on the fluid viscosity differential, the time available for separation, and the density difference between the liquid and the gas. Unless the oil- or water-oil emulsion is exceptionally viscous, the density differences and duration are the essential criteria for excellent separator performance in a two-phase separator. However, gas micro-bubbles might be an issue if they become entrained in a highly viscous liquid and stay there for several hours or even days.
In theory, the separator should efficiently release all of its free gas, leaving behind only the gas that is dissolved in the solution. The free gas, although saturated, will have a relatively low moisture content, ensuring that the meter accurately measures it without being affected by any accompanying liquid.
- ➢
In a two-phase separator, a cleverly designed tiny separator is used to ensure there is no liquid-liquid separation and to maintain a homogeneous mixture of fluids. Now, the interesting part is figuring out how to accurately measure the combined liquid and calculate the precise amounts of both oil and water.
- ➢
The purpose of a three-phase separator is to effectively separate oil, water, and gas based on their different densities, fluid viscosities, and the duration they spend inside the separator. It is important to note that the assumption is often made that the oil will be free from water (and vice versa) in the separation process, although this expectation may not always be realistic.
8.1 The Pros and Cons of Using a Separator in Experiments
Many professionals in the field have debated whether or not the Multi-component Indicator should replace (or at least complement) the Experimentation Separator for calculating flow rates.
The usage of Experimentation Separators has both positive and negative aspects to consider.
8.1.1. Pros
The experimental separator serves a range of purposes, and it may not be practical to remove it. Apart from the possibility of extreme slugging causing liquid carry over in the gas leg, experimentation separators remain unaffected by wet gas flow patterns and allow for sampling of single-phase fluids post-separation. In addition to their primary role in separating substances during experiments, separators also offer various other benefits, such as:
- ➢
The restart of poorly performing but otherwise useful wells following a shutdown; • The cleaning of newly drilled or renovated wells (scale compressed, re-completed, etc.)
- ➢
A low-pressure well separator with a tiny group separator.
8.1.2. Cons
The experimental separator may be regarded a disadvantage in an offshore manufacturing plant because of:
- ➢
Size and weight, especially for designs at high pressures; • Relatively costly CAPEX and OPEX.
- ➢
Well measurement is time-consuming (wait for steady process conditions, rinse out prior fluids, etc.). When switching wells for experimental, stabilization time may be delayed (a 12-hour well experimentation may require four hours to stabilize). This is due to the overall separator mass.
- ➢
Only measure "average" well flow rates, and are typically unable to distinguish between different flow patterns.
- ➢
Periodic measurement only reflects a small sample or window (e.g., 24 hours in a month equals 1/30 of a day).
8.2. How Effective Is the Use of Well Experimentation?
How effective an experimental separator is having been the topic of several arguments throughout the years. There isn’t any advice that would answer the query, as far as the writers are aware.
To validate the data obtained from well experiments, it’s essential to balance the total flows from multiple well experiments with the facility disposal systems. This involves carefully comparing the cumulative flows from the wells over time with the disposals, such as fiscal oil and gas, fuel gas, flare, discharged water flows, and more.
Typically
∑Well Flows = ∑Disposals or
∑Well Flows/∑Disposals = 1.
In order for this to work, it is essential that well flows and disposal measurements are consistently recorded in Mass Units, although this is often not the norm in practice.
Striving to achieve a delicate balance in fluid disposal throughout a process facility, where hydrocarbon liquids can be converted into gases and vice versa, is at odds with the volumetric data at standard conditions used by users of well experimentation data (Production and Reservoir). Mass-based equilibrium is the answer, which is quite unusual in the international oil and gas industry.
Although balance factors of 0.5 to 2 are not unheard of, it is more common to see a balance factor in the 0.95 to 1.05 range (exceptionally outstanding) and the 0.9 to 1.1 range (likely), when units are representative.
Figure 7 [
8] depicts a typical balancing chart (or Field Allocation Factor) derived from well experimental data.
Several facilities have claimed to have "excellent" balance factors, but a closer look reveals that in at least some of these cases, the balance factor was artificially inflated by fusing the well experimentation data with the production data. This method is dubious since it prevents quality control checks between the raw data from experiments and export data.
Complexity arises as we start breaking down particular fluids like oil/condensates, gas/gas liquids, and water, rather than just looking at the total volume of fluids generated and disposed of.
5.3. What Are the Elements of a Successful Well Experiment?
How do you define a successful experiment? For Production, Reservoir, and Measurement Engineers, this is the most perplexing query. And that’s probably the one question no one ever asks.
- ➢
One that replicates the earlier successful experiments and demonstrates their repeatability? And in this particular instance, do we have any evidence to suggest that the choke or GL rate has not been altered throughout the time period in question?
- ➢
Have we taken into consideration the output drop that occurs naturally at the wells?
- ➢
One that is inside the allotted time frame of thirty, sixty, or ninety days, etc.
- ➢
An activity that has been carried out for the predetermined amount of time (twelve or twenty-four hours?);
It is possible that the above is acceptable for "ticking the boxes," but it is highly improbable that this will give a solid basis for establishing that the well experimentations are "excellent." Undoubtedly, we ought to be utilizing balancing procedures in order to determine whether the overall well experimentation system balances against the facility outputs; but this would only provide a "warm and fuzzy" sense that the system as a whole is effective. It will not be possible to determine whether or not some wells have inaccurate metering as a result of measuring challenges such as high or low rates, high WC’s or high GVF’s, slugging flows, and other factors.
Based on this, it seems highly likely that we should closely analyze the well experiments and employ statistical significance measures to validate them. This could involve assessing factors such as frequency, repeatability, and duration, among others that need careful consideration.
A consensus among production engineers suggests that certain wells have the potential to perform just as effectively, even with shorter experimentation periods, possibly more frequently. However, it is crucial to select these wells on an individual basis. Typically, these would be wells that consistently generate substantial flows for all the products, or wells that have repetitive, regular brief cycles with significant flows.
Wells with irregularly long cycles, low flows, or low flow of a single phase may actually require longer and more frequent well experiments to achieve a statistically significant flow quantity and a substantial flow rate.
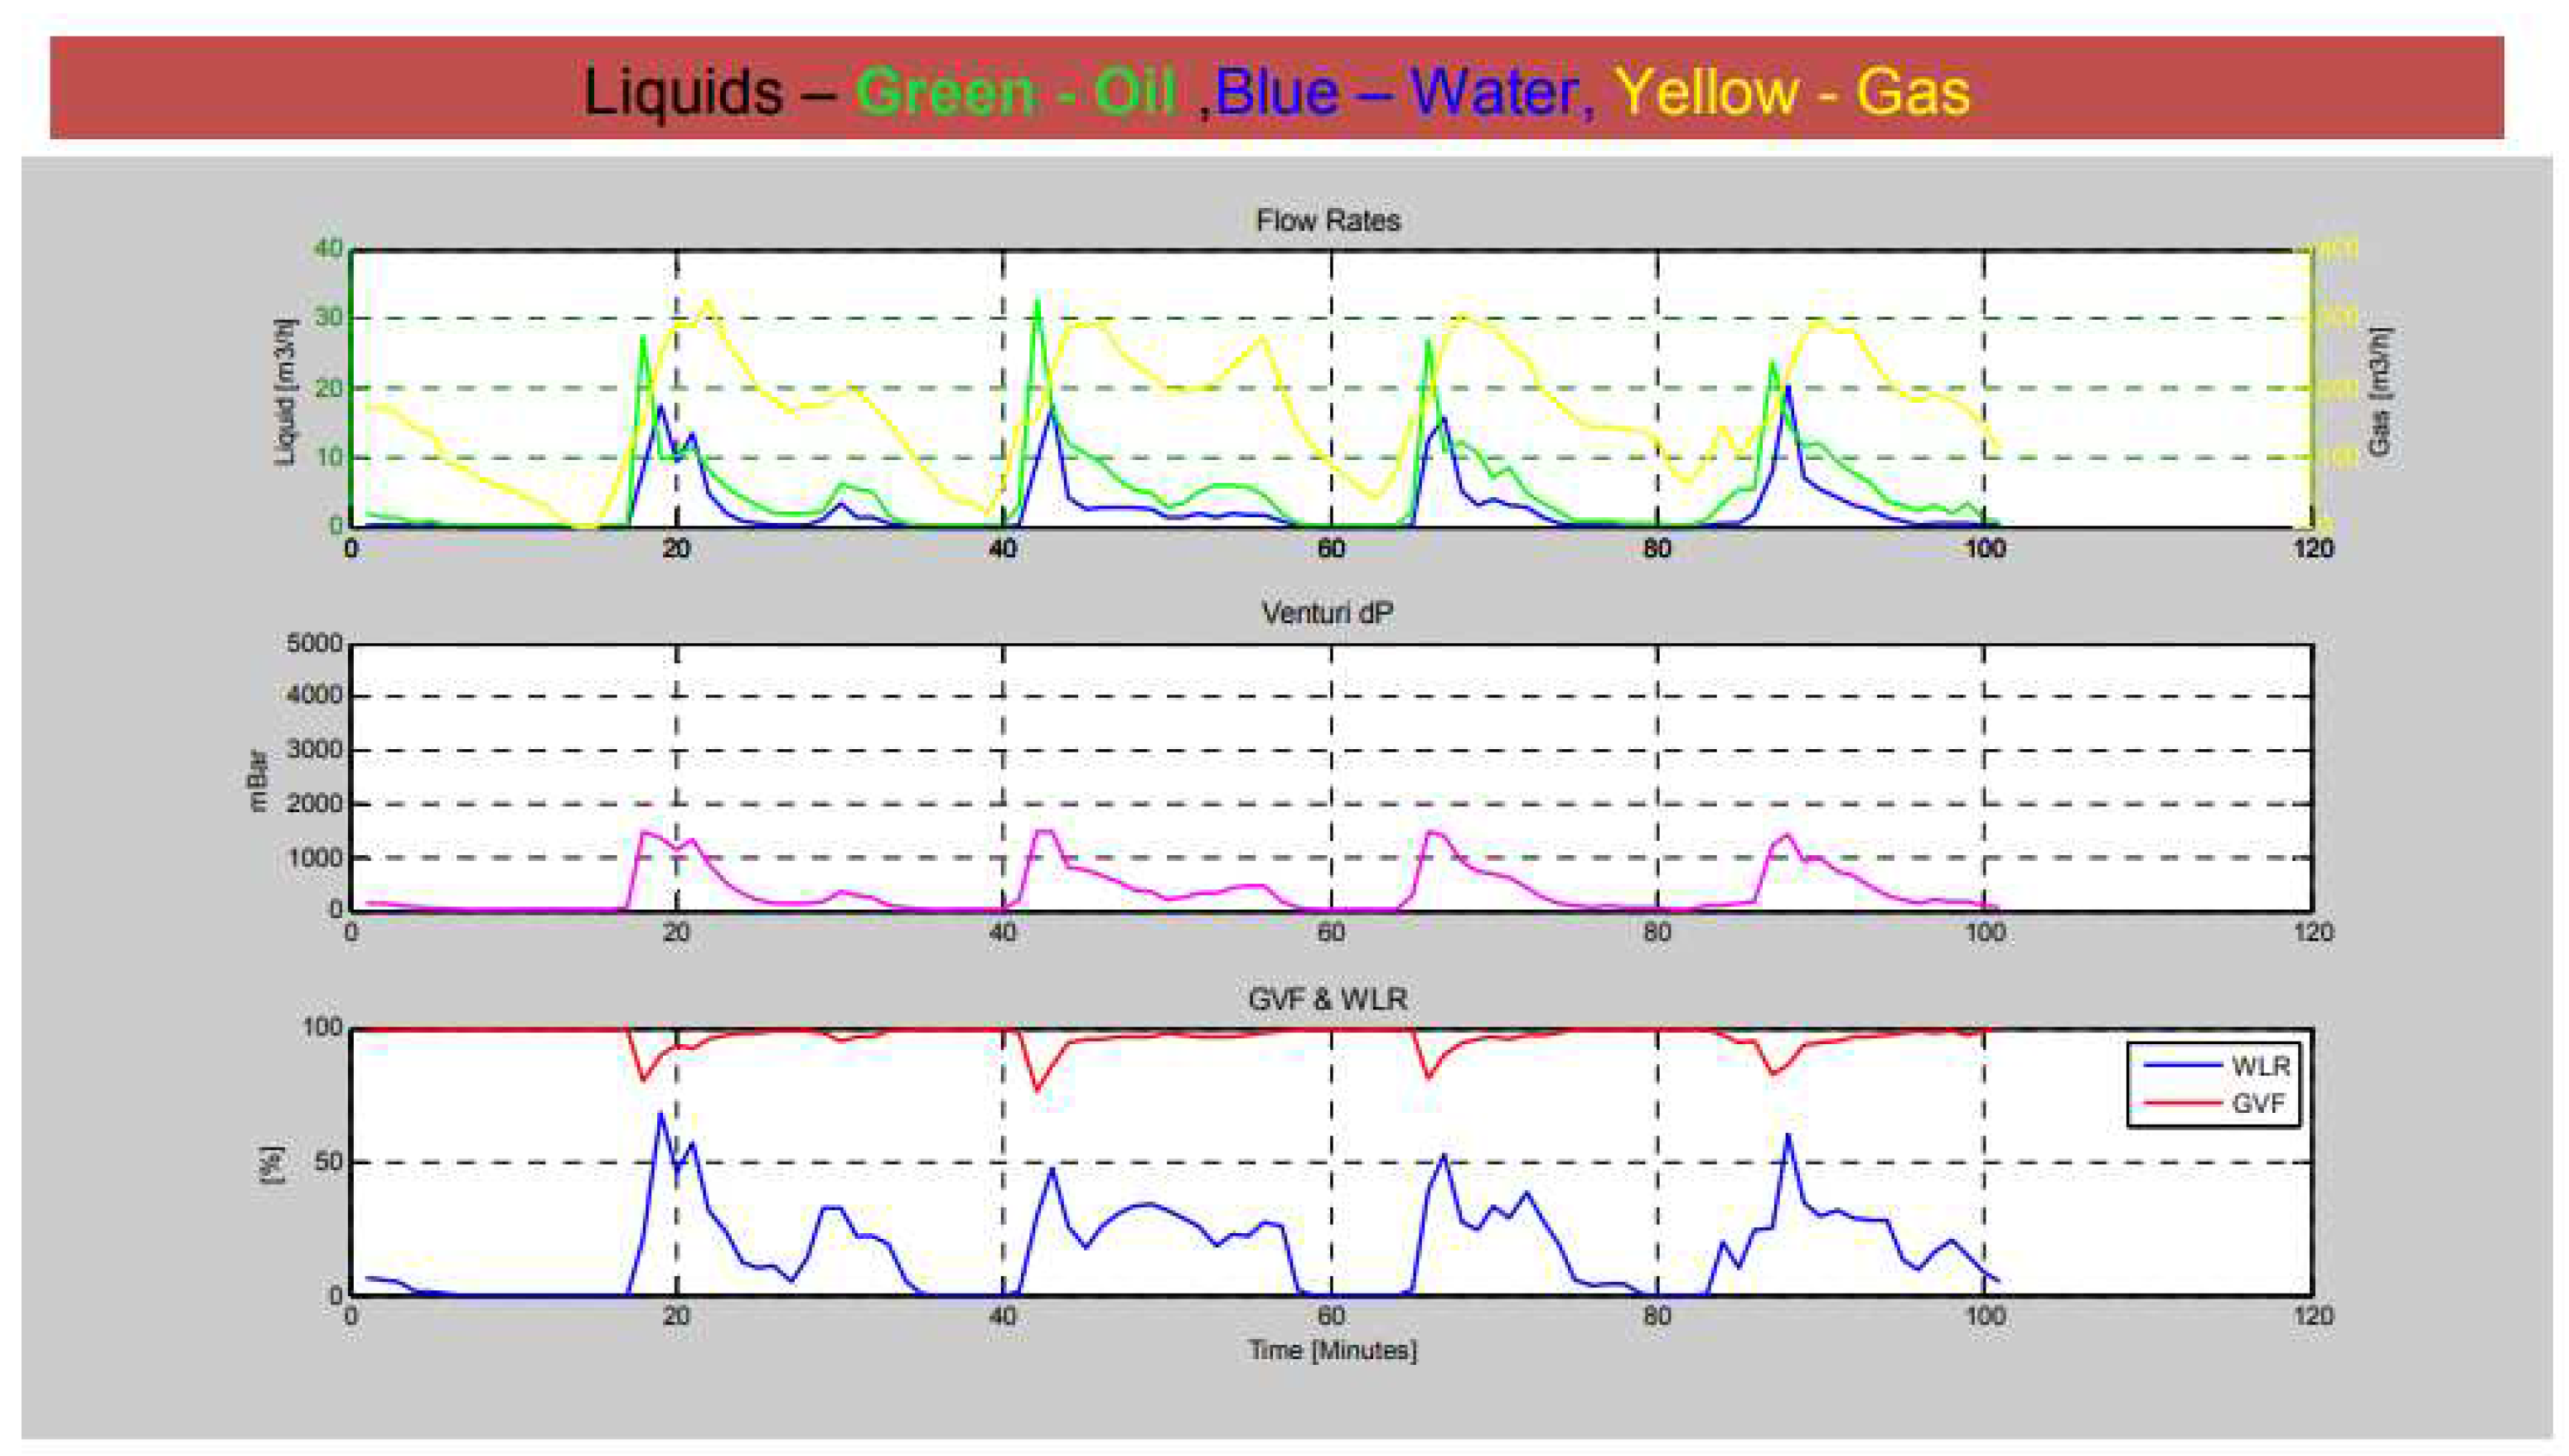
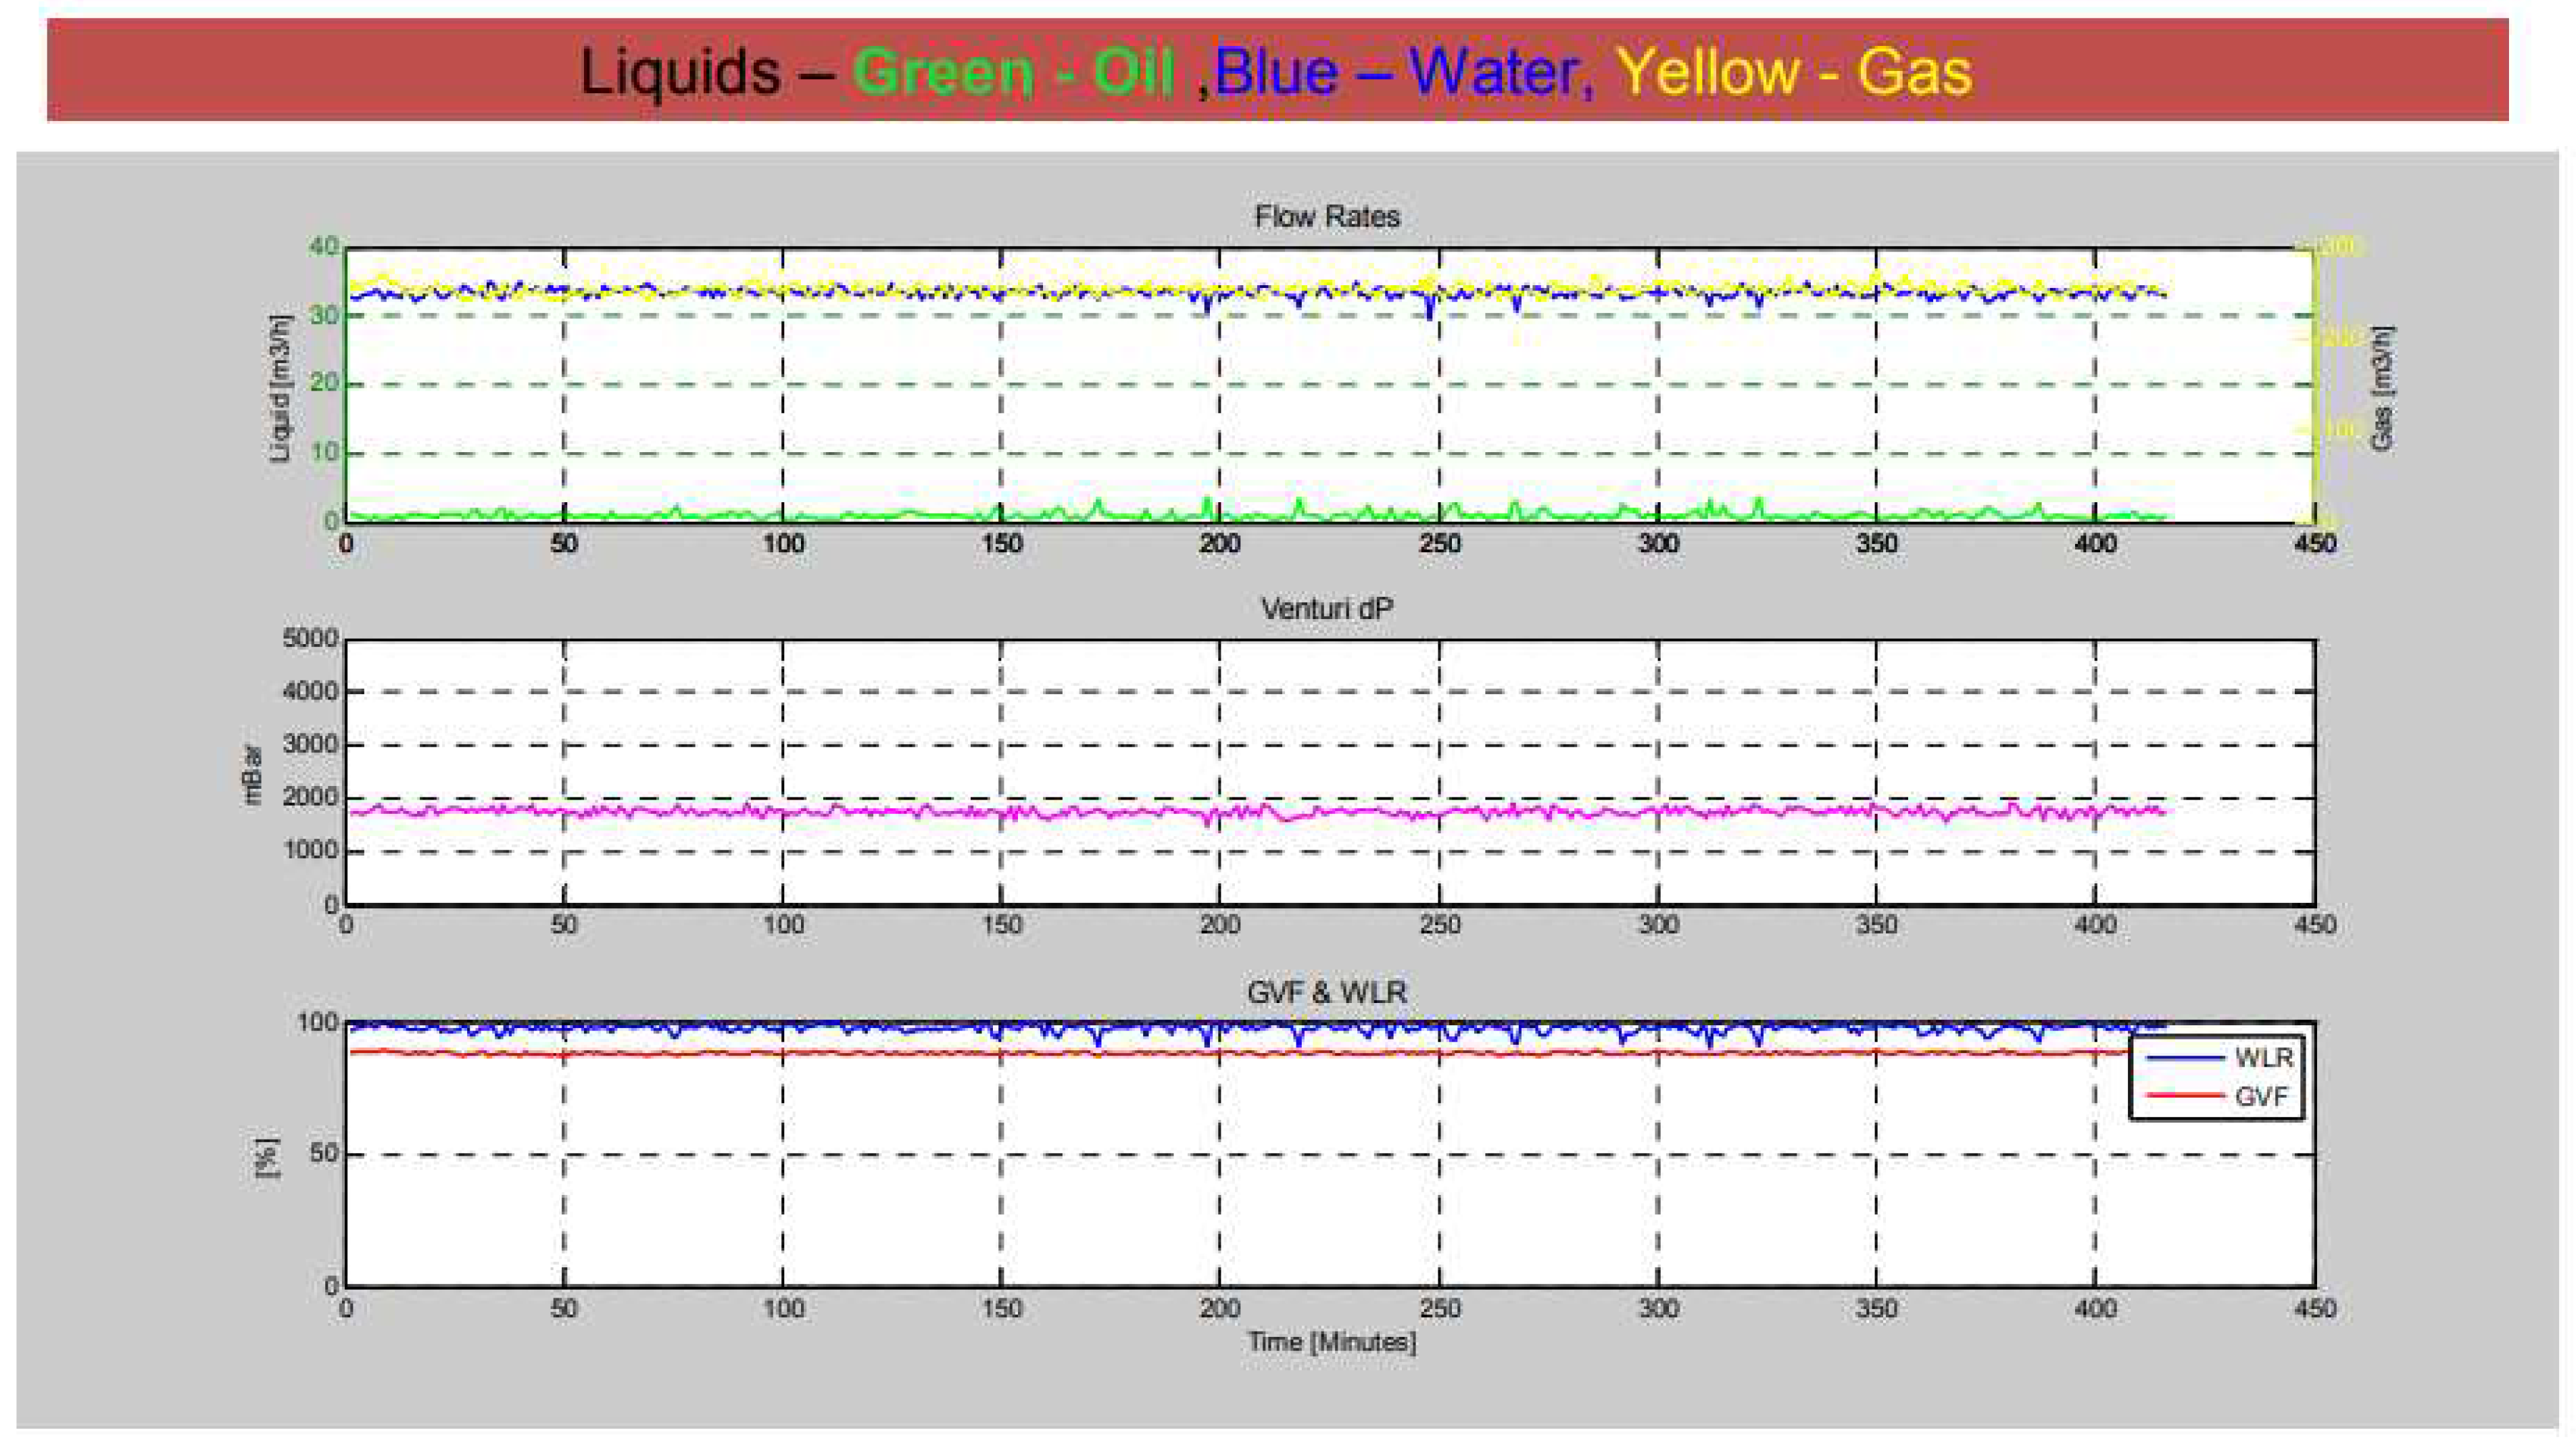
The flow graphs shown below and overleaf are representative of gas lifted wells and serve as examples. It is easy to see why they ought to be approached in various ways with regard to the flow experiments.
The following information may be gleaned from the plots that have been taken from a multi-component metre:
- ➢
Discover the fascinating dynamics of oil, gas, and water as they intertwine in the captivating top plot water
- ➢
The central focus of the plot revolves around the measurement of differential pressure in meters pressure
- ➢
Plotting the Water Cut (%WC) and Gas Void Fraction (%GVF) at the bottom with utmost precision bottom
In
Figure 8, you can observe a depiction of a well with fluid flows that cycle, potentially offering valuable data through regularly spaced experiments conducted within the wells. The GVF is extremely high (>90%) and the WC is steady at around 60%.
In
Figure 9, you’ll find a depiction of an unstable slugging well characterized by high gas flows, low liquid flows, and WC fluctuating between 0% and 70%. Because the slugs are only 20 minutes long, a short well investigation is unlikely to yield statistically significant results. A longer well experimentation period may be required.
Figure 10 depicts a stable well with a high-water content, a high gas volume fraction (GVF), and extremely little oil content. Because oil is the desired end result of the experiment, statistically reliable data may require more time in the well.
Analysis of the aforementioned wells and the selection of an experimental strategy are required to assure the production of commercially viable quantities of the desired commodity (oil) in this situation. This may necessitate multi-day flow experiments; but, with a large number of wells and a busy experimentation separator schedule, this may not be practical. The issue then becomes, how can we optimize well experimentation?
Other than taking a closer look at the wells and collaborating with the Production and Reservoir Engineers to choose a programmed better suited to the demands of the particular wells, what else can we do to enhance the quality of the data gathered from the well experiments? In general, we could and should do experiments more frequently and perhaps with better indications, and here is where MPFMs may prove useful.
5.3. Utilization of an Experiment Separator
The performance monitoring of Well, Reservoir, and Field is the main use for the experimental separator. As a result, it is employed in:
- ➢
Calculating fluid rates
- ➢
Identifying mechanical integrity problems;
- ➢
Determining when changes in fluid flow rates or composition occur (such as water breakthrough, etc.);
Once the flow rates have been established, they may (and frequently are) added up for all the wells that are currently producing, and an estimation of the total output is created for well and system allocation. The productivity of the system is frequently determined using this data as a benchmark.
However, there are other applications where experimental separators play a crucial part. Which are:
- ➢
Determining tubing and casing leaks;
- ➢
Maximizing well production efficiency by employing optimal resource recovery methods such as Gas Lift (GL), Electric Submersible Pump (ESP), or other applicable technique.
- ➢
Assessment of near-well-bore damage;
- ➢
Experimenting with reservoir build-up techniques;
- ➢
Additional monitoring functionalities;
- ➢
Performing a thorough clean-up after completing any necessary rework;
- ➢
Additionally, there were other failures within the system
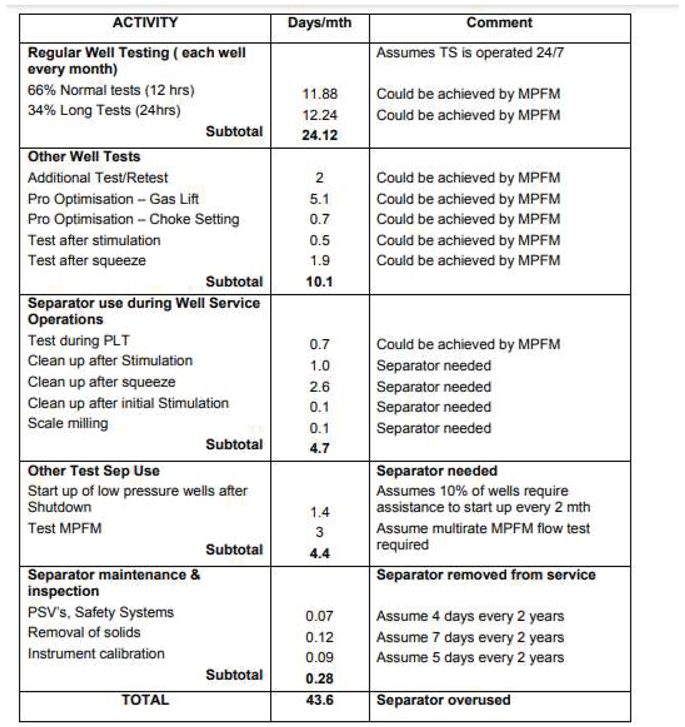
Separator shutdown may be necessary for certain maintenance on the separator, associated instruments, and controls. It is frequently unable to perform its core (well experimentation) purposes as a result of these additional functions and maintenance needs, which can take a significant amount of experimentation separator time. As a result, the "well experimentation utilization" of the experimentation separators can and frequently is poor.
This is problematic since well experimentation data is one of the fundamental instruments for managing oil and gas reserves, and the capacity to conduct frequent well experiments is a crucial critical component. Each well must undergo "periodic" experimentation, the duration of this period may vary, ranging from 30, 60, 90, to 180 days, depending on the specific location and the criteria set by the regulator. Additionally, the size, age, geophysical characteristics, and method of depletion of the reservoirs may influence the Operators Reservoir Engineers’ needs for well testing, build up experimentation, etc.
The purpose of
Table 2 is to tabulate some of the duties assigned to an experimental separator and to provide information about the system’s readiness for good experimentation. The authors have based the separator usage on a facility with, let’s say, 36 operating gas lifted oil wells. These times are hypothetical and will change depending on the kind of production (naturally flowing, gas lifted, pump lifted wells, etc.) and the age of the wells.
Table 2 shows that in this specific situation, it is not reasonable to expect the experimental separator to perform all of the necessary duties by itself.
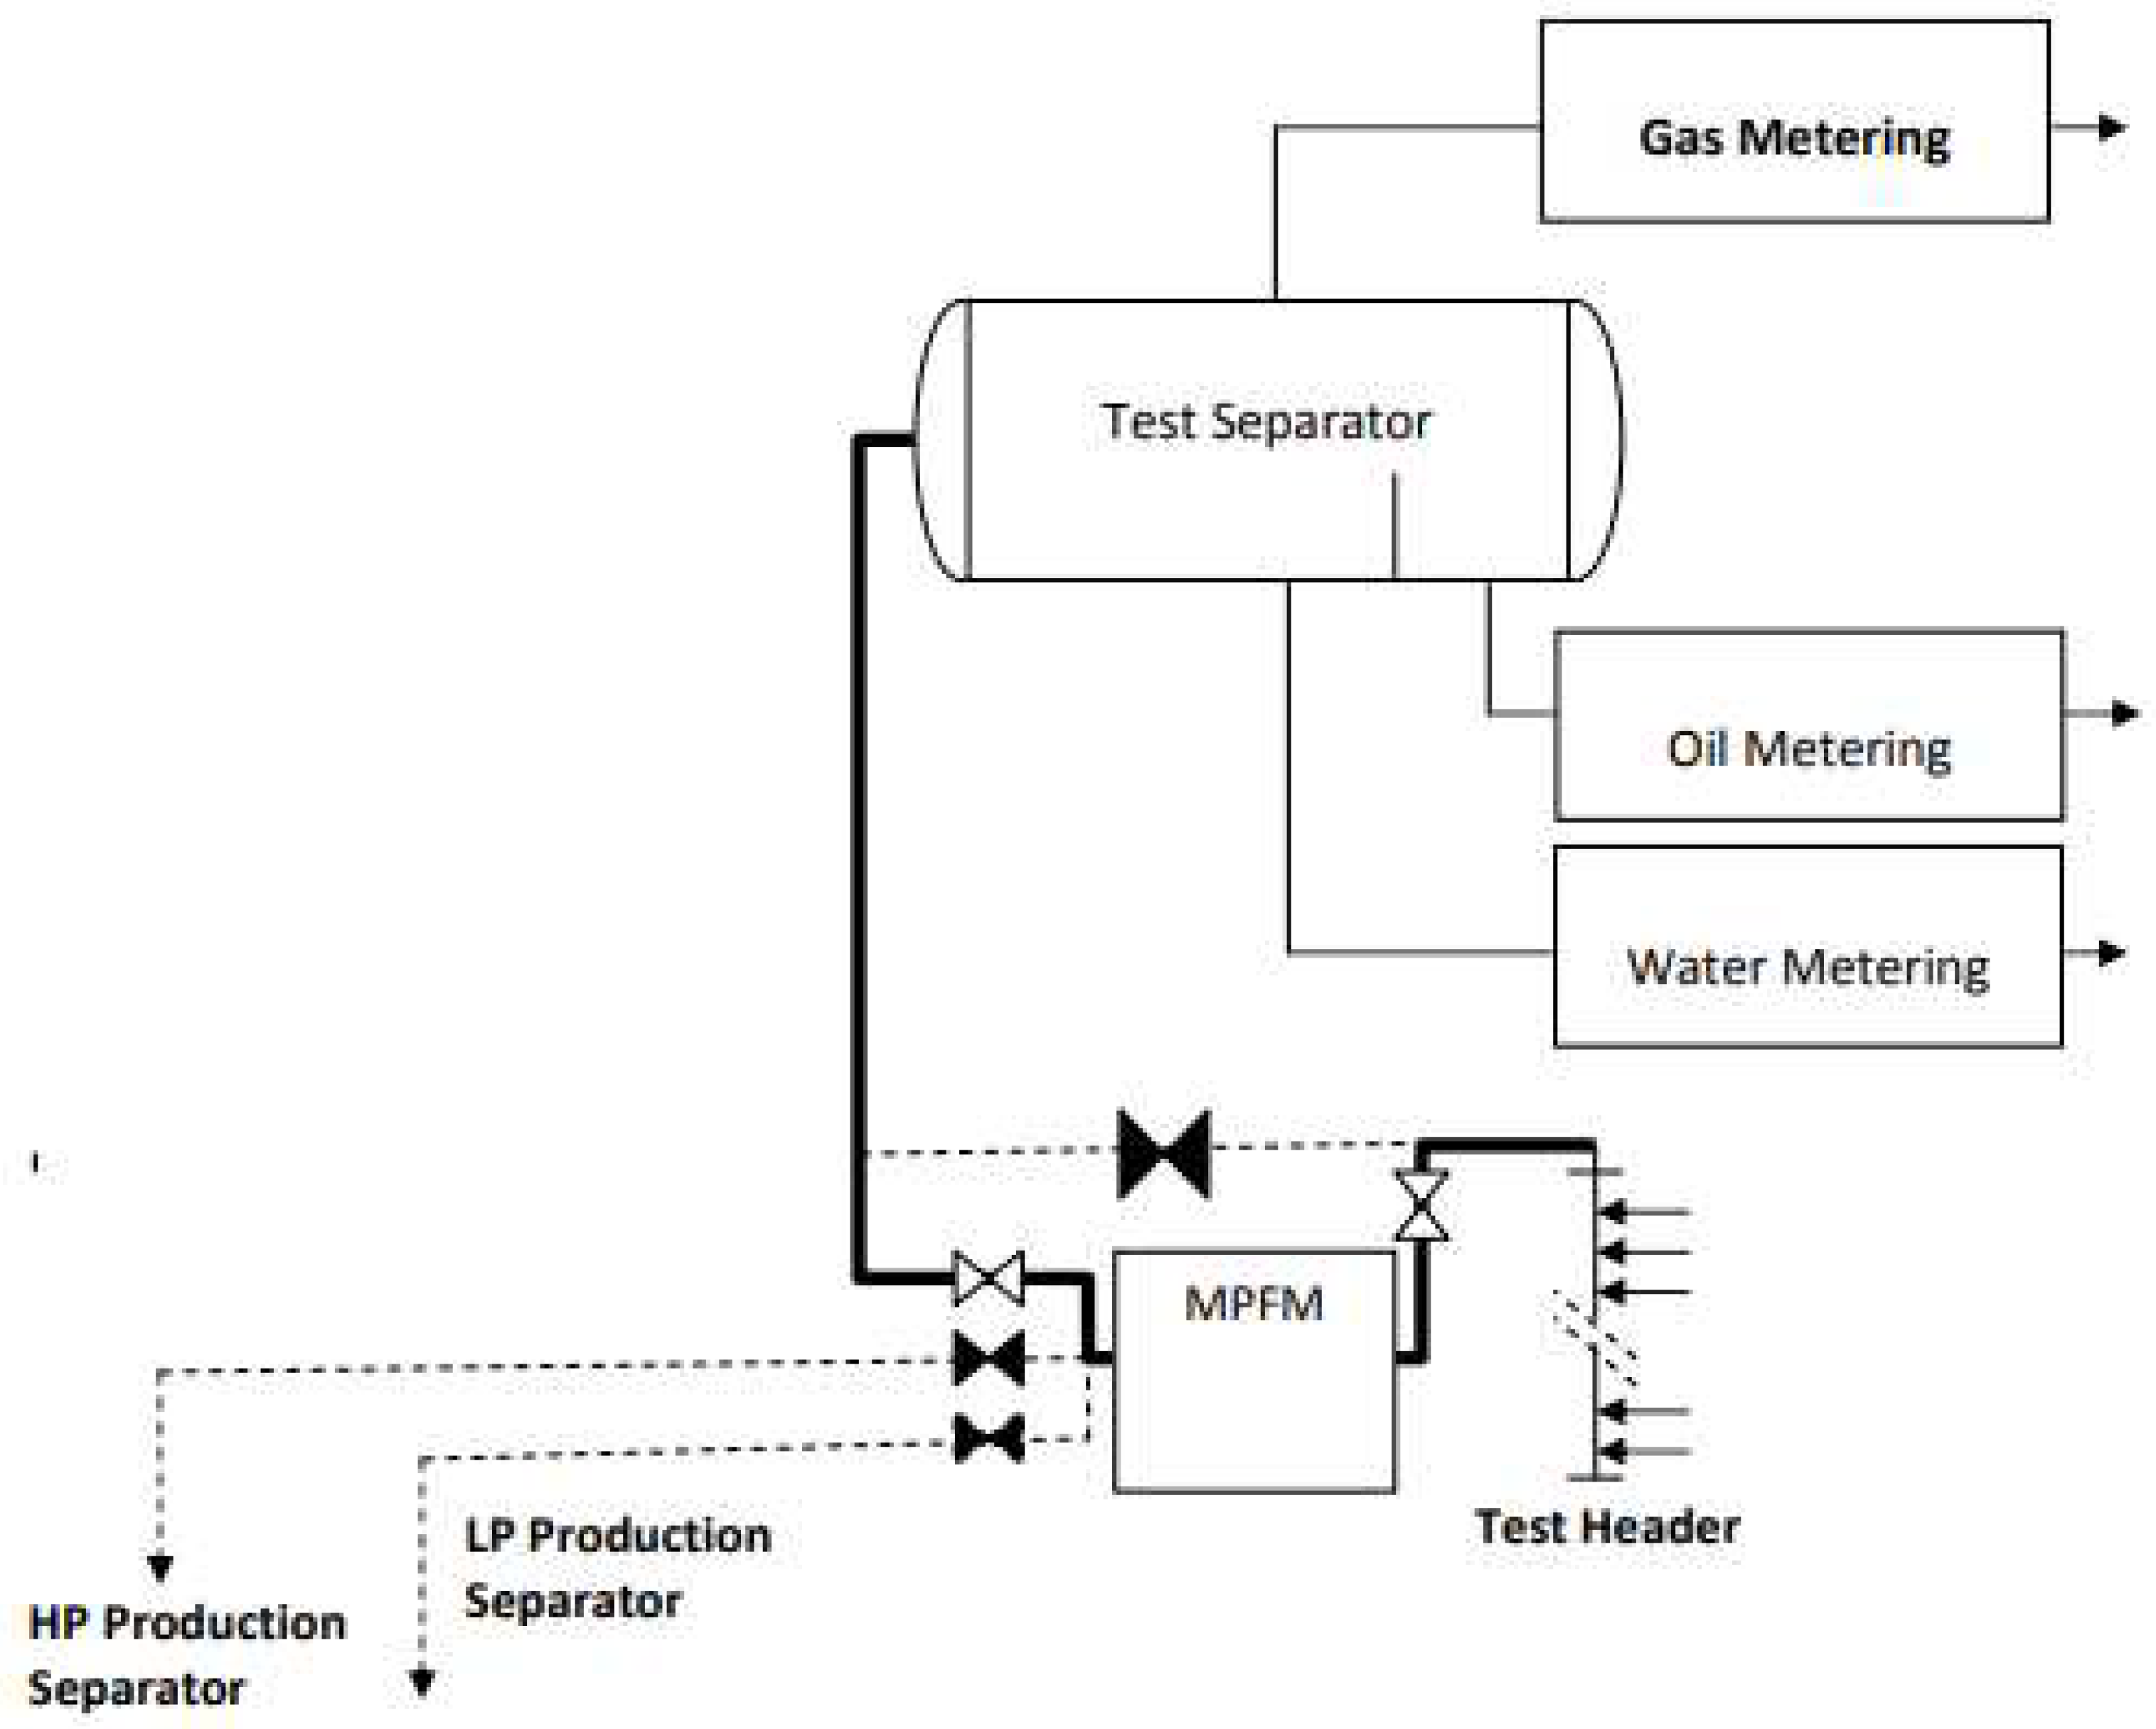
In this instance, a multicomponent metre may be required to supplement the experimental separator’s measuring capabilities (see
Figure 11).
9. Indicators with Multiple Components
A crucial step in ensuring the continued economic growth of smaller and more marginal fields is the creation of multi-component indicators that can continually measure wet gas and multi-component flows [
9,
10]. For bigger new construction projects as well as some of the current and declining reservoirs, where greater field monitoring may deliver higher returns, they may very well offer significant advantages.
About 20 years have passed since the invention of multi-component metres; the first MPFM work to be presented at the NSFMW was in 1988 [
11]. In that time, a few suppliers have come and gone. Numerous performance promises have been made, and while some of them have been fulfilled, a sizable portion have not. There has frequently been a reluctance to emphasize the steps necessary for success and, in other situations, a reluctance to acknowledge that, perhaps, the MPFM is not the best instrument to utilize in some circumstances.
There have also been some "less than complete and candid disclosures" regarding the meter’s hidden costs, and there may be a reluctance to acknowledge that there are flaws, particularly in the way fluid sampling and metre performance vary over time as flows, flow conditions, and fluids do.
While it’s true that not all vendors have frequent User Forums, some do provide platforms for interested parties to discuss both their successes and challenges. However, there seems to be a reluctance among certain vendors to learn from operators or actively educate them. Even in the NFMW forum, both operators and vendors appear hesitant to present papers on meter failures.
Even though a number of in-line MPFMs have been successful, there hasn’t been much discussion on:
- ➢
Reconciling an MPFM with the experimentation separator, and
- ➢
What the MPFM may offer to good experimentation performance.
9.1. What the MPFM Could Improve the Performance of Well Experimentation
When used for well experiments, MPFMs have the distinct benefit over experimental separators in rapidly stabilizing process conditions (usually temperature). The decreased mass allows for a reduction in stabilization time from 4 to 6 hours (depending on local weather conditions) to 30 to 60 minutes.
This greatly contributes in shortening the period of well experiments with an MPFM, which might lead to lower overall experiment durations (experiment duration plus stabilization time).
The MPFM flow reports may be more accurate depictions of the well flows since they are based on direct flow measurements rather than the averaged or conditioned flows seen from the experimental separator. This might be helpful in lowering the time it takes to conduct well experiments when utilizing an MPFM.
9.2. Bringing an MPFM into Harmony with the Experiment Separator
Some Flow Measurement Engineers in the Operators’ team may have reservations when it comes to experimental requests, mainly due to the extensive trials we have already conducted in flow labs and operational fields. It often feels like we are testing a well-functioning MPFM (as observed in flow loops) in a field system that potentially faces challenges related to fluids, system management, and flow measurement." I hope this version better captures your intended message while maintaining clarity [
12].
Users and project managers who are interested in using MPFM systems frequently ask us, "Can I trial a metre against my experimental separator?" Many operators claim they wish to put "their" fluids to the test, implying that North Sea, Alaska, and the GOM undergo radical shifts in engineering technology and scientific understanding in the same way as the Bermuda Triangle did. However, the general flow envelope has not been tested to everyone’s satisfaction, therefore there are certain unique fluids or processes that do need to be trialled.
There is always the chance that there are hydrodynamic, control, or measurement issues at some of the sites used for "real world" field experiments. The MPFM is a novel ’black box’ technology, making it difficult for engineers to master, whereas the experimental separator used by operators is tried-and-true machinery recognized by the local regulator. The credibility loss begins with the MPFM being the starting point for identifying variances between the two sets of equipment. MPFM service and technical staff must use a great deal of discretion when diagnosing issues with clients’ (and potential clients’) machinery. To reassure the customer and his business partners, it is necessary to reconcile an MPFM against an experimental separator, which is not always a simple process.
Earlier, we noted that most experiment separators report in volume units. There may be substantial differences in process conditions between an MPFM and an experimental separator, making it difficult to properly align volumes recorded at the separator with the MPFM due to fluid phase variations. Therefore, when comparing bulk flows, it is easiest to do so in terms of mass.
The best analogy would be to:
∑(Oil+Gas+Water) MPFM compared to ∑(Oil+Gas+Water) TS in Mass terms.
Once the balance is successfully achieved, we can proceed with further efforts to conduct phase comparisons on an individual basis, considering both mass and volume. It is crucial to first establish this initial level of balance, as attempting to balance the phases solely in volumetric terms, particularly when there are variations in the process, can prove challenging.
9.3. MPFM Metering Capability
It is recommended that readers carefully review the specific vendor data sheets for detailed information. 2. In
Table 3, you will find a concise summary of typical performance claims for a selection of in-line MPFM devices.
We are absolutely thrilled to share our incredible progress: the development of cutting-edge auto-switchable multi-component wet gas meters. These meters boast impressive claimed uncertainties, with accuracy levels better than 5% for liquids, 2 to 5% for gas flows, and an outstanding water detection capability of better than 2%. This represents a significant leap forward from our initial goal of achieving uncertainties of about 10 to 25% for metering the different phases. In the past, there was always a sense of unease when dealing with high gas volume fractions (GVF > 85%) and water contents (WC > 85%), but our team has successfully overcome this challenge.
Although many of these performance claims have undergone flow laboratory testing as part of JIPs and Operators’ procedures, there are still a few restrictions.
Similar to single phase metres, it is crucial to size MPFMs properly. Metres that are too big or too little will not function properly, and their uncertainty will probably be considerably higher than advertised. The Operators’ long-term development strategy should consider the replacement of MPFM as a result of diminishing fields. Two (big and tiny) MPFMs are preferable over one enormous metre. It’s also critical to think about the MPFM’s operating environment because different technologies may be better suited to different circumstances.
There is no denying that MPFM performance has considerably improved over time. This is likely the consequence of a multitude of circumstances, including but not limited to:
- ➢
Users are becoming increasingly aware of MPFM (Machine Learning Powered Forecasting Models) and actively resisting the "black box" approach.
- ➢
Enhancements to the flow model: Advances in computing power, high-speed electronics, and secondary instruments have led to significant improvements
- ➢
Exciting advancements have been made in the realm of alliances between vendors and operators through Joint Innovation Partnerships (JIPs)
- ➢
Substantial Standard-type documents that serve as invaluable resources for newcomers.
- ➢
Market competition
- ➢
Open and independent MPFM experimentation Joint Innovation Projects;
In the past five years, we have witnessed incredible improvements in installing MPFM, with several instances where it has successfully detected issues with the experimental separator meters, marking a remarkable role reversal.
These installations, together with the very limited - to date - budgetary allocations in the real world, indicate that MPFMs have gained exceptional levels of acceptability by operators and regulators.
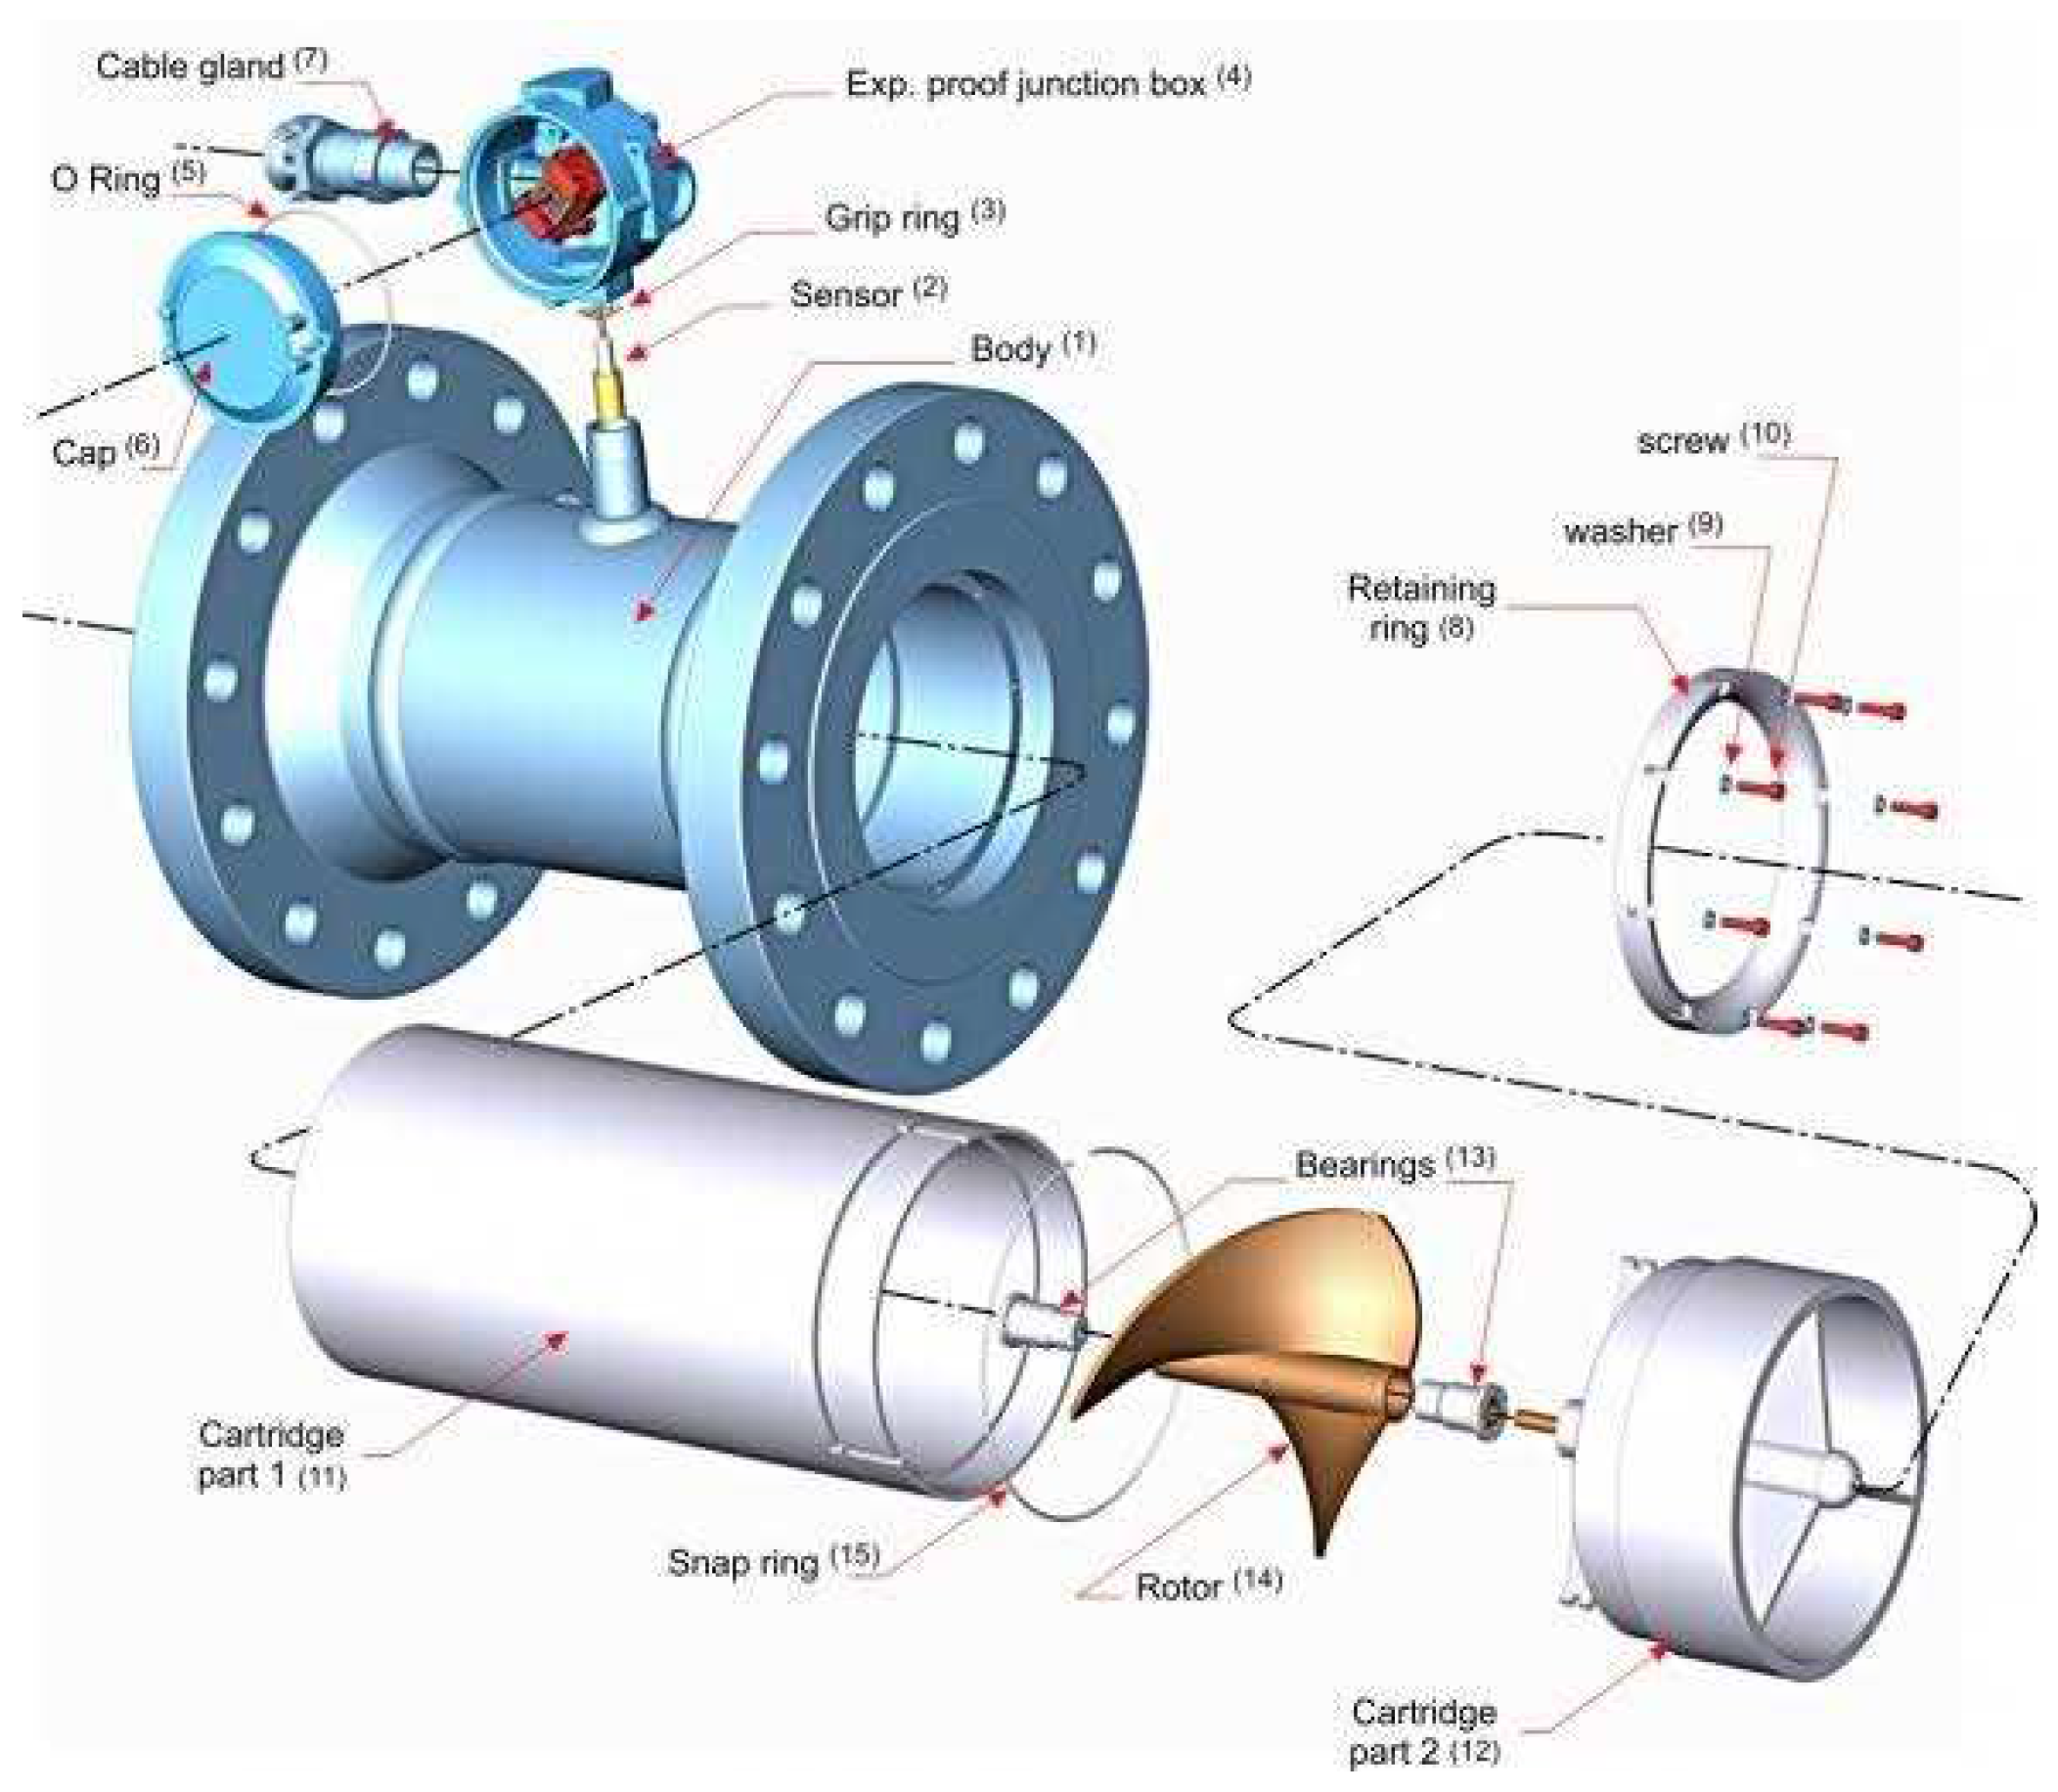
Figure 13.
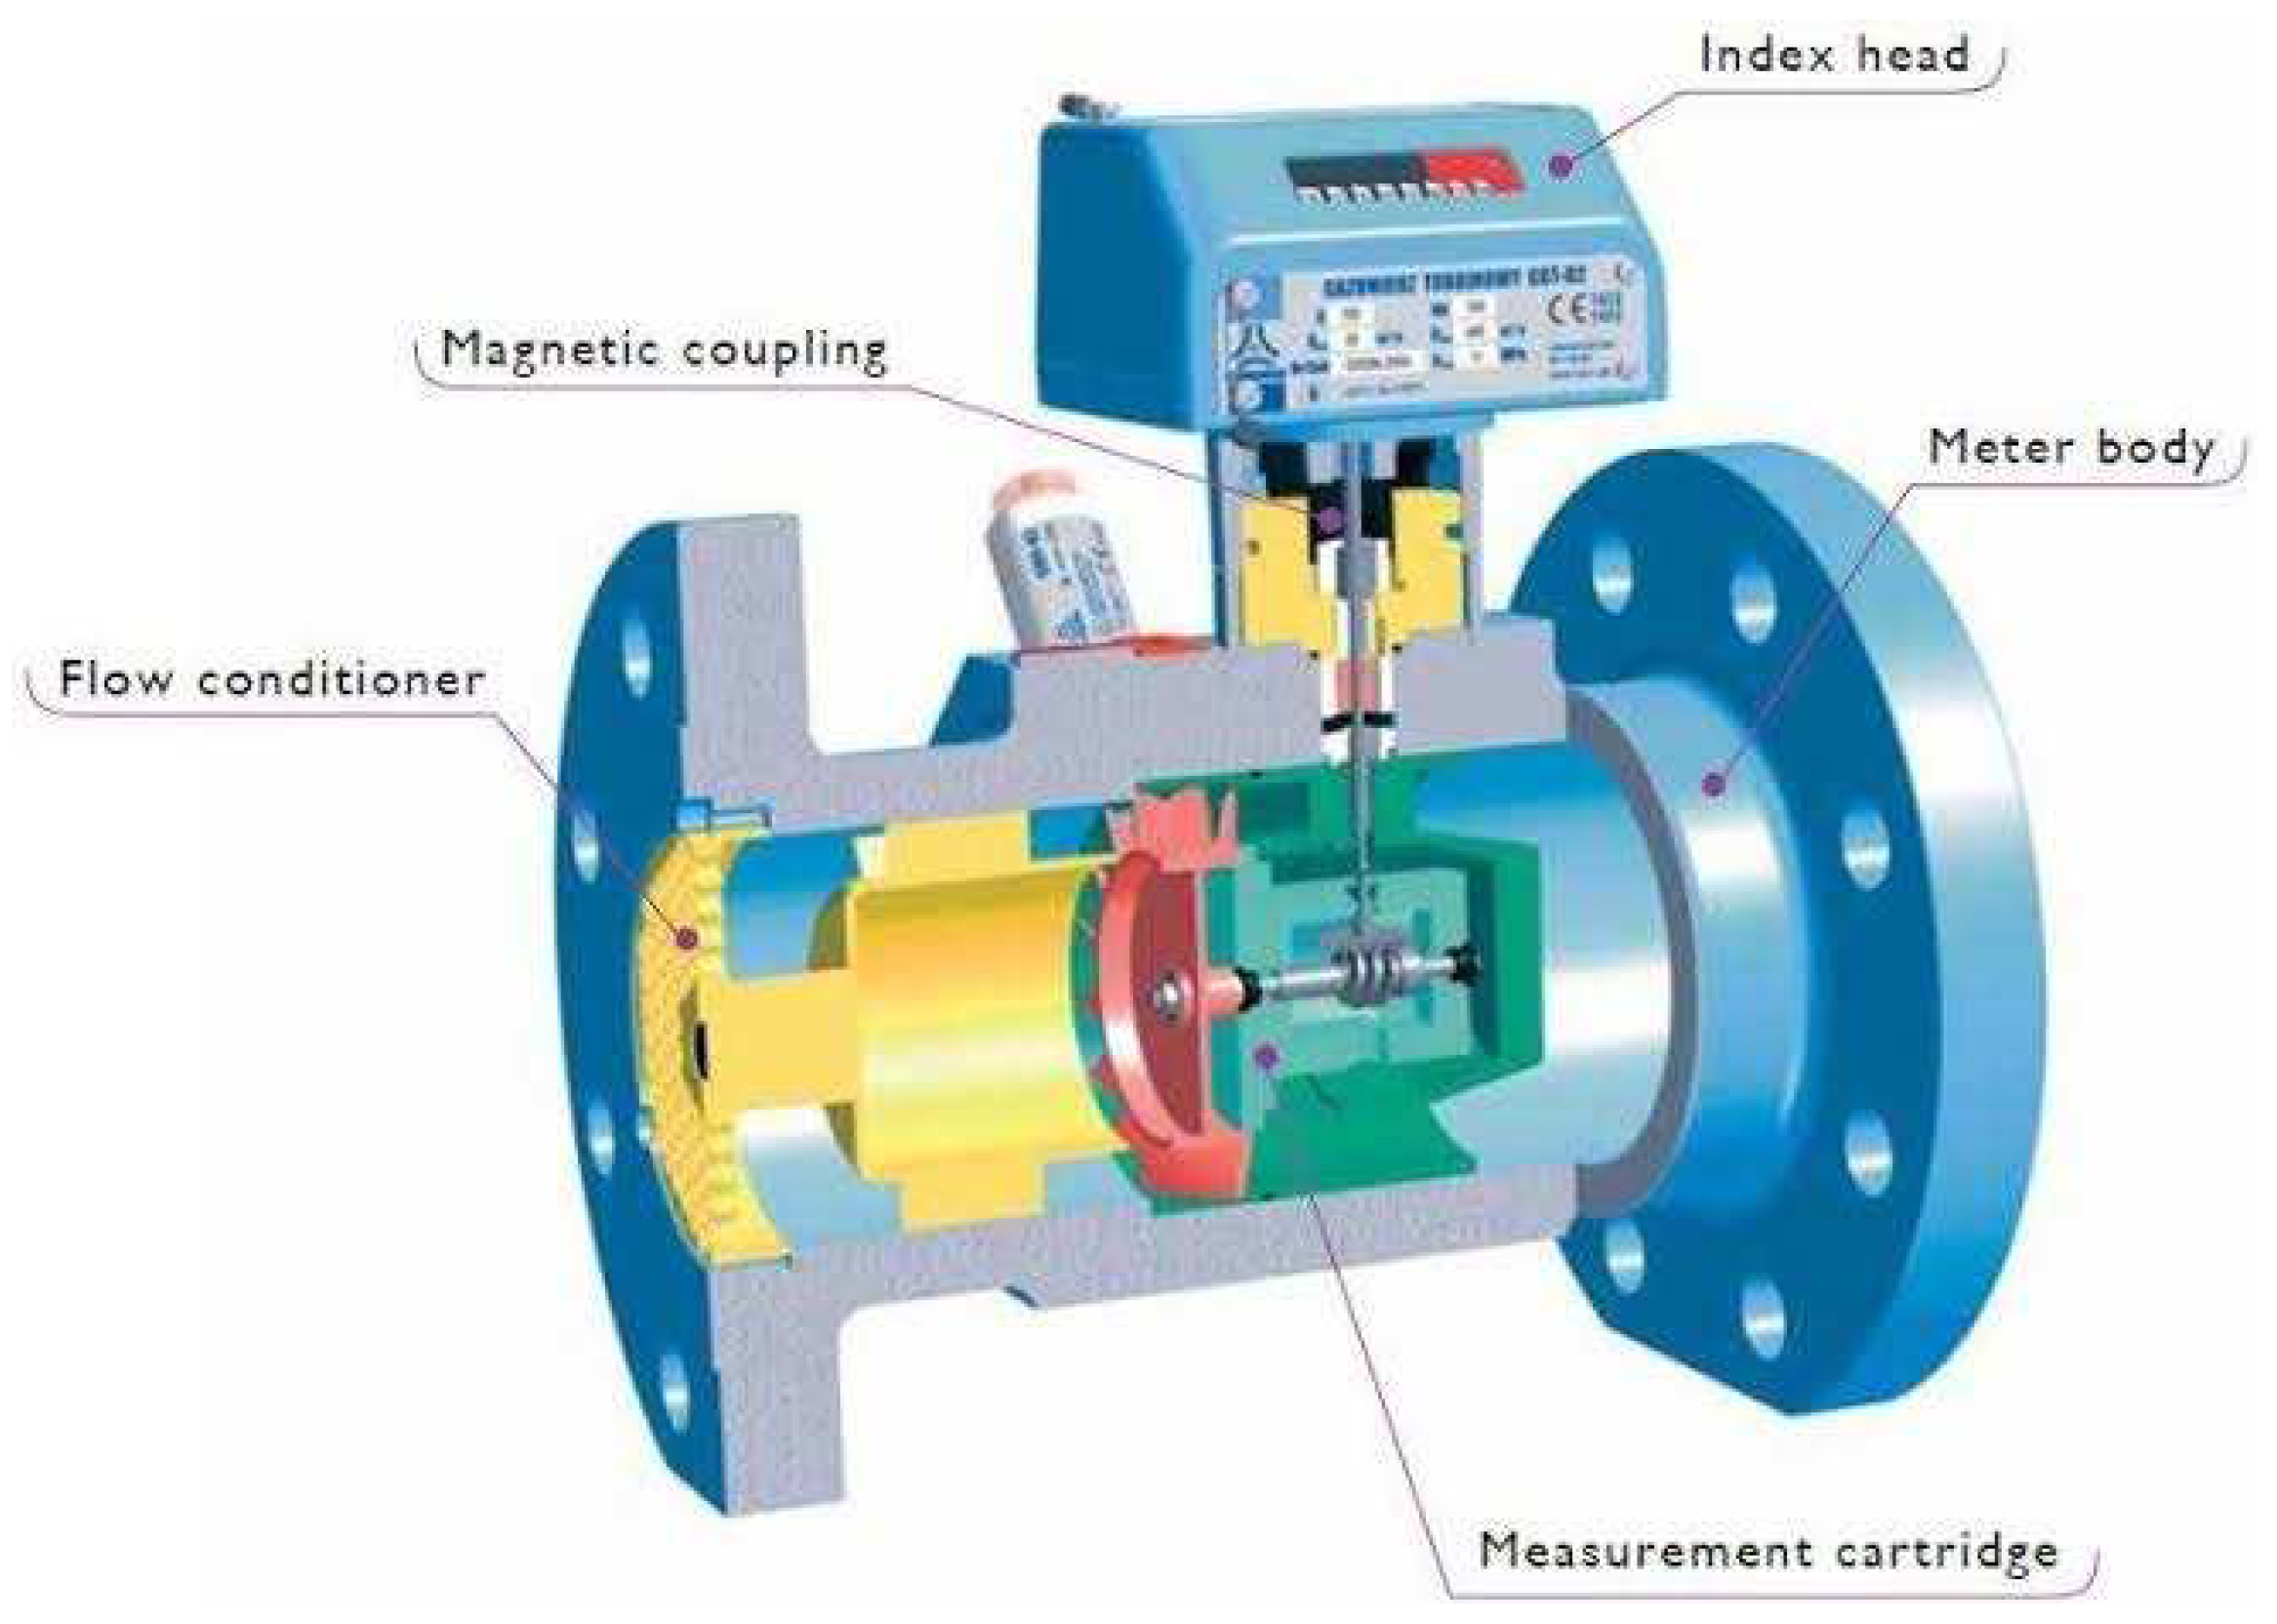
Turbine Metering and Technology: This figure highlights the various technologies and methodologies associated with turbine metering. It encompasses advancements in turbine metering systems, such as improved accuracy, enhanced durability, and compatibility with different fluids. The figure aids in exploring the advancements and potential applications of turbine metering technology.
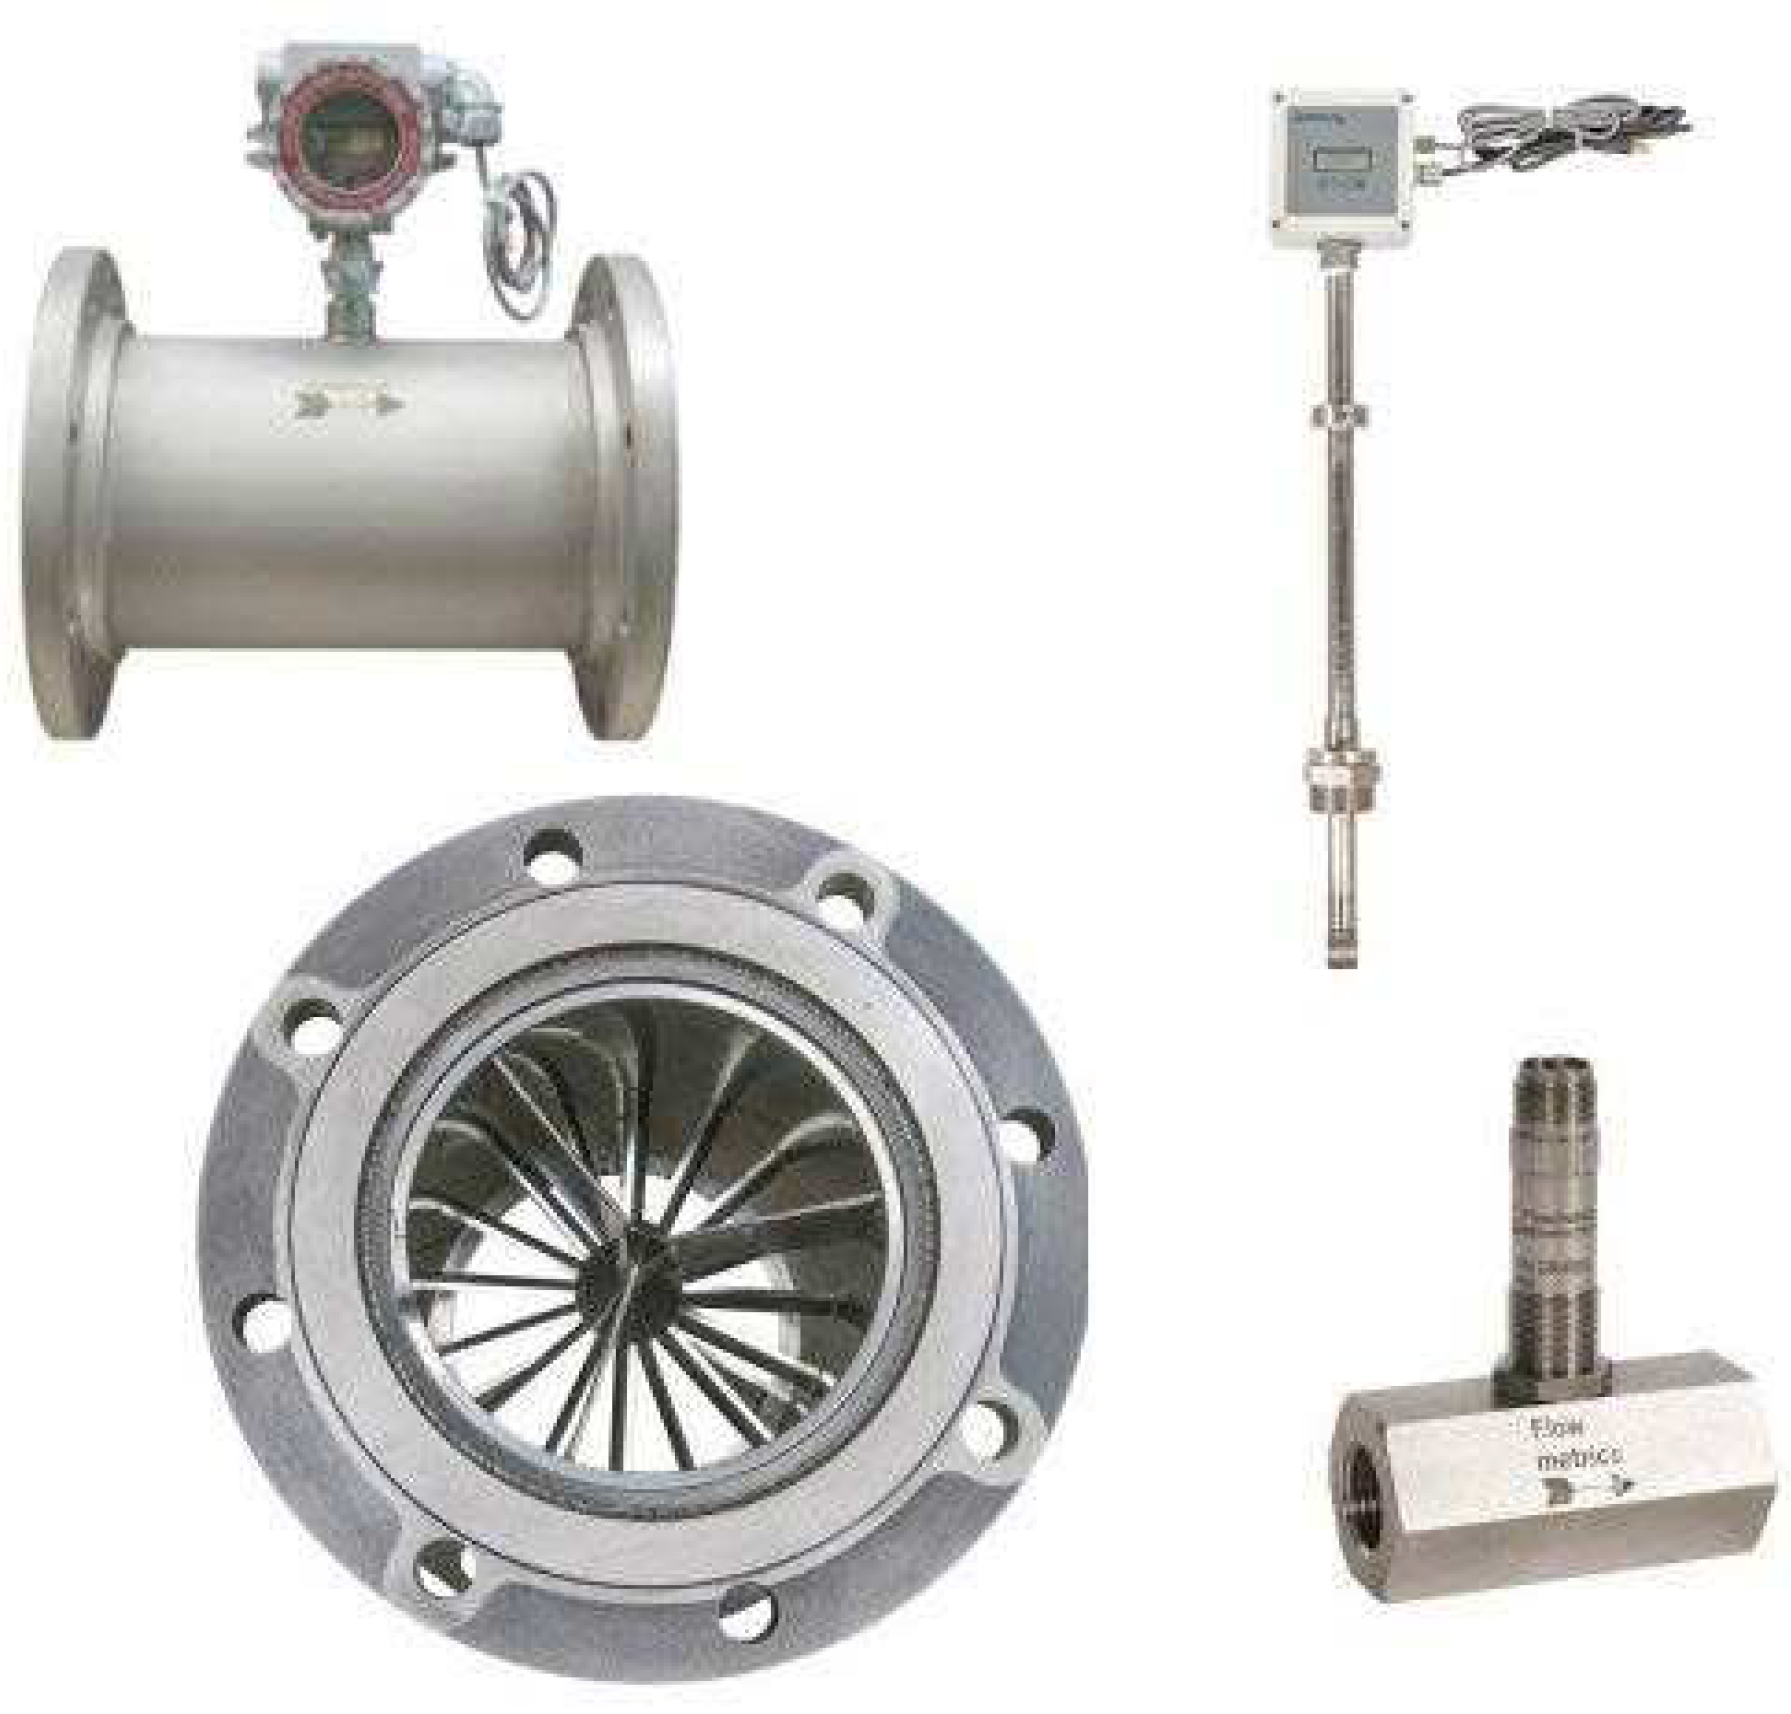
Figure 14.
Turbine Flow Meter: Flow Metering The purpose of this figure is to illustrate how a turbine flow meter is used for flow metering. It showcases the installation and operation of a turbine flow meter in a pipeline or system. It provides insights into the practical application of turbine flow meters for measuring the flow rate of fluids in various industries, including oil and gas.
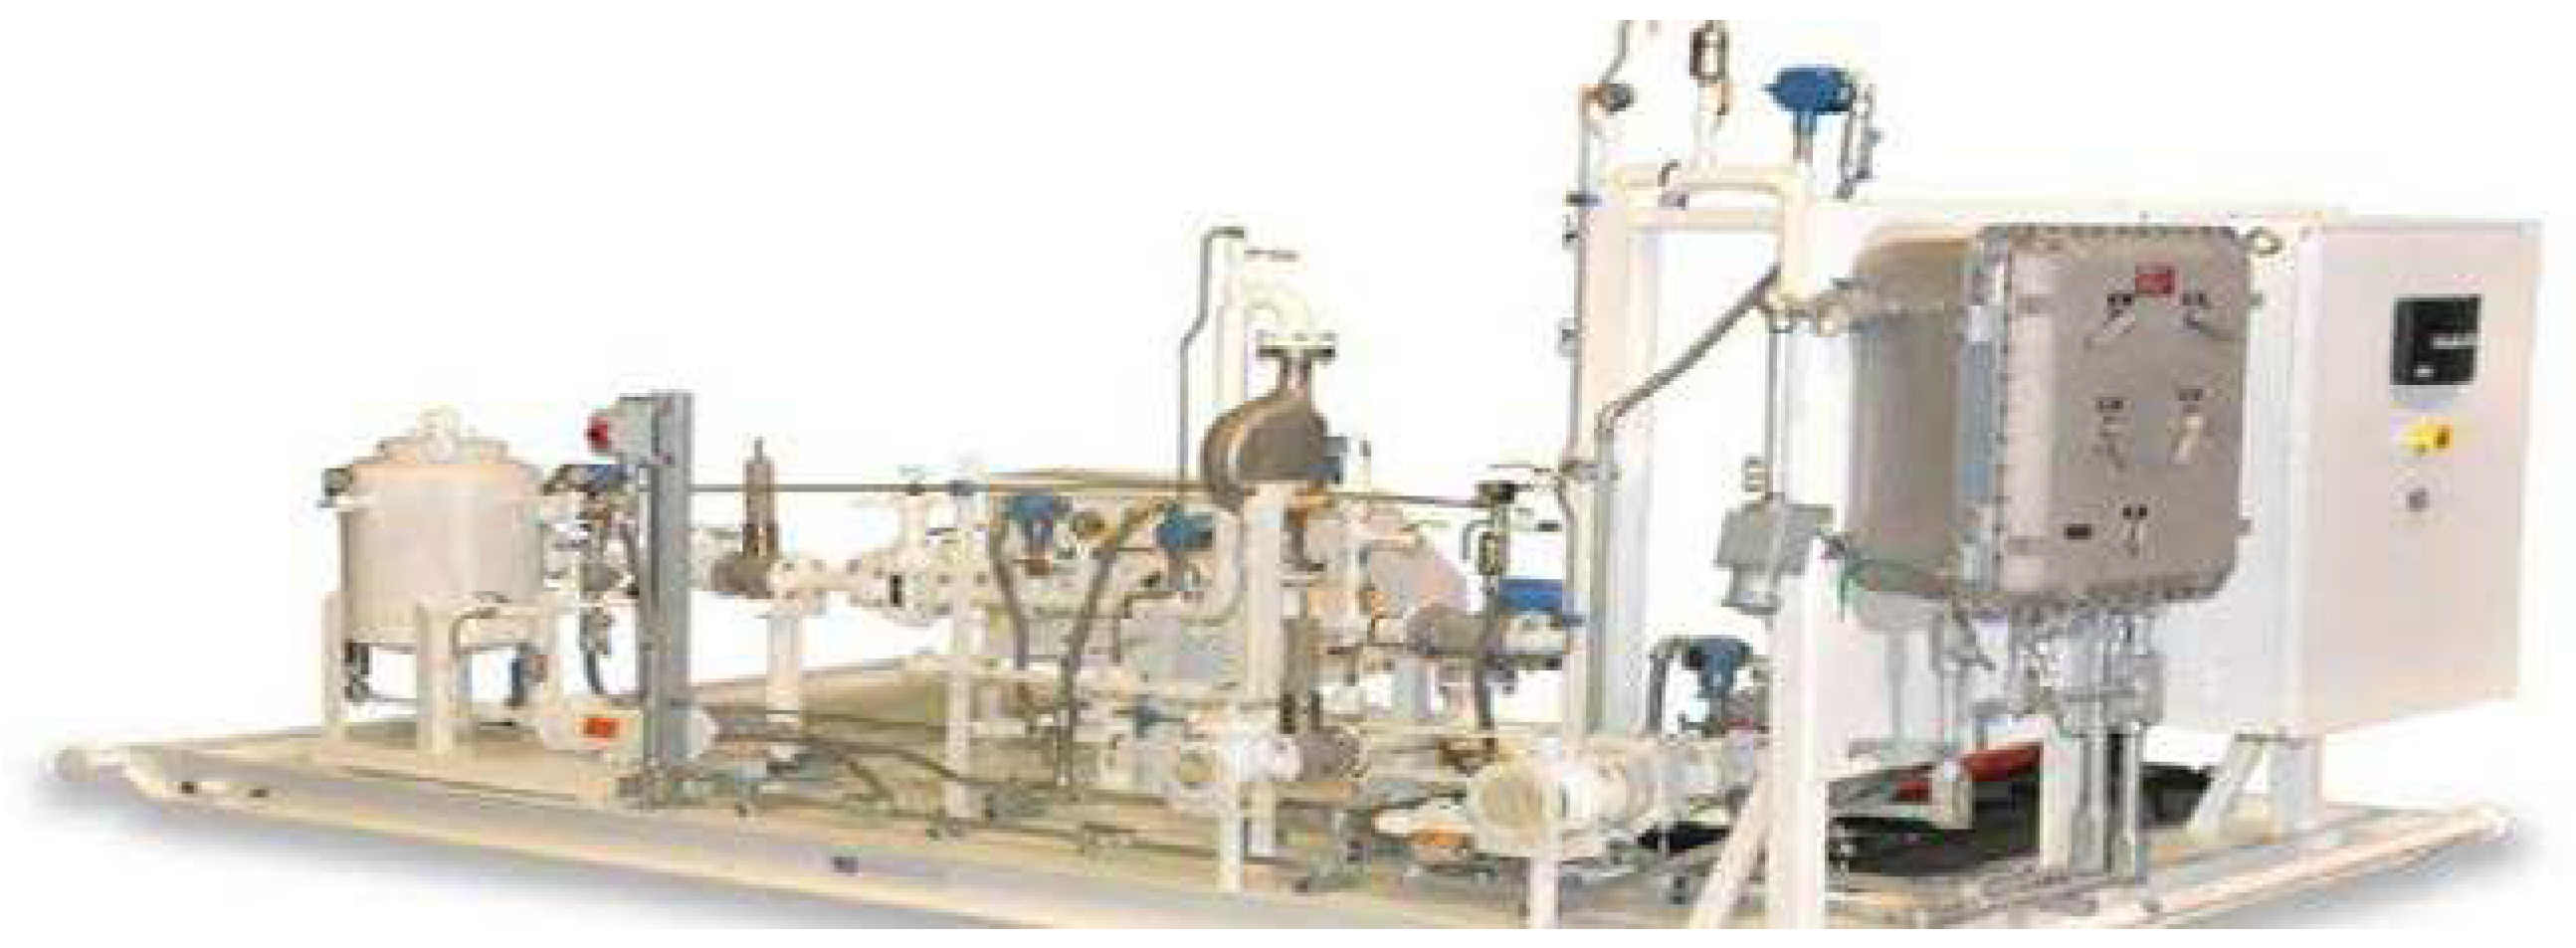
Figure 15.
Metering and Measurements in Oil and Gas: This figure focuses on the metering and measurement techniques specifically used in the oil and gas industry. It highlights the instrumentation and technologies employed for accurate measurement of fluid quantities, such as flow rate, pressure, and temperature. The figure provides a comprehensive overview of the metering and measurement processes specific to the oil and gas sector.
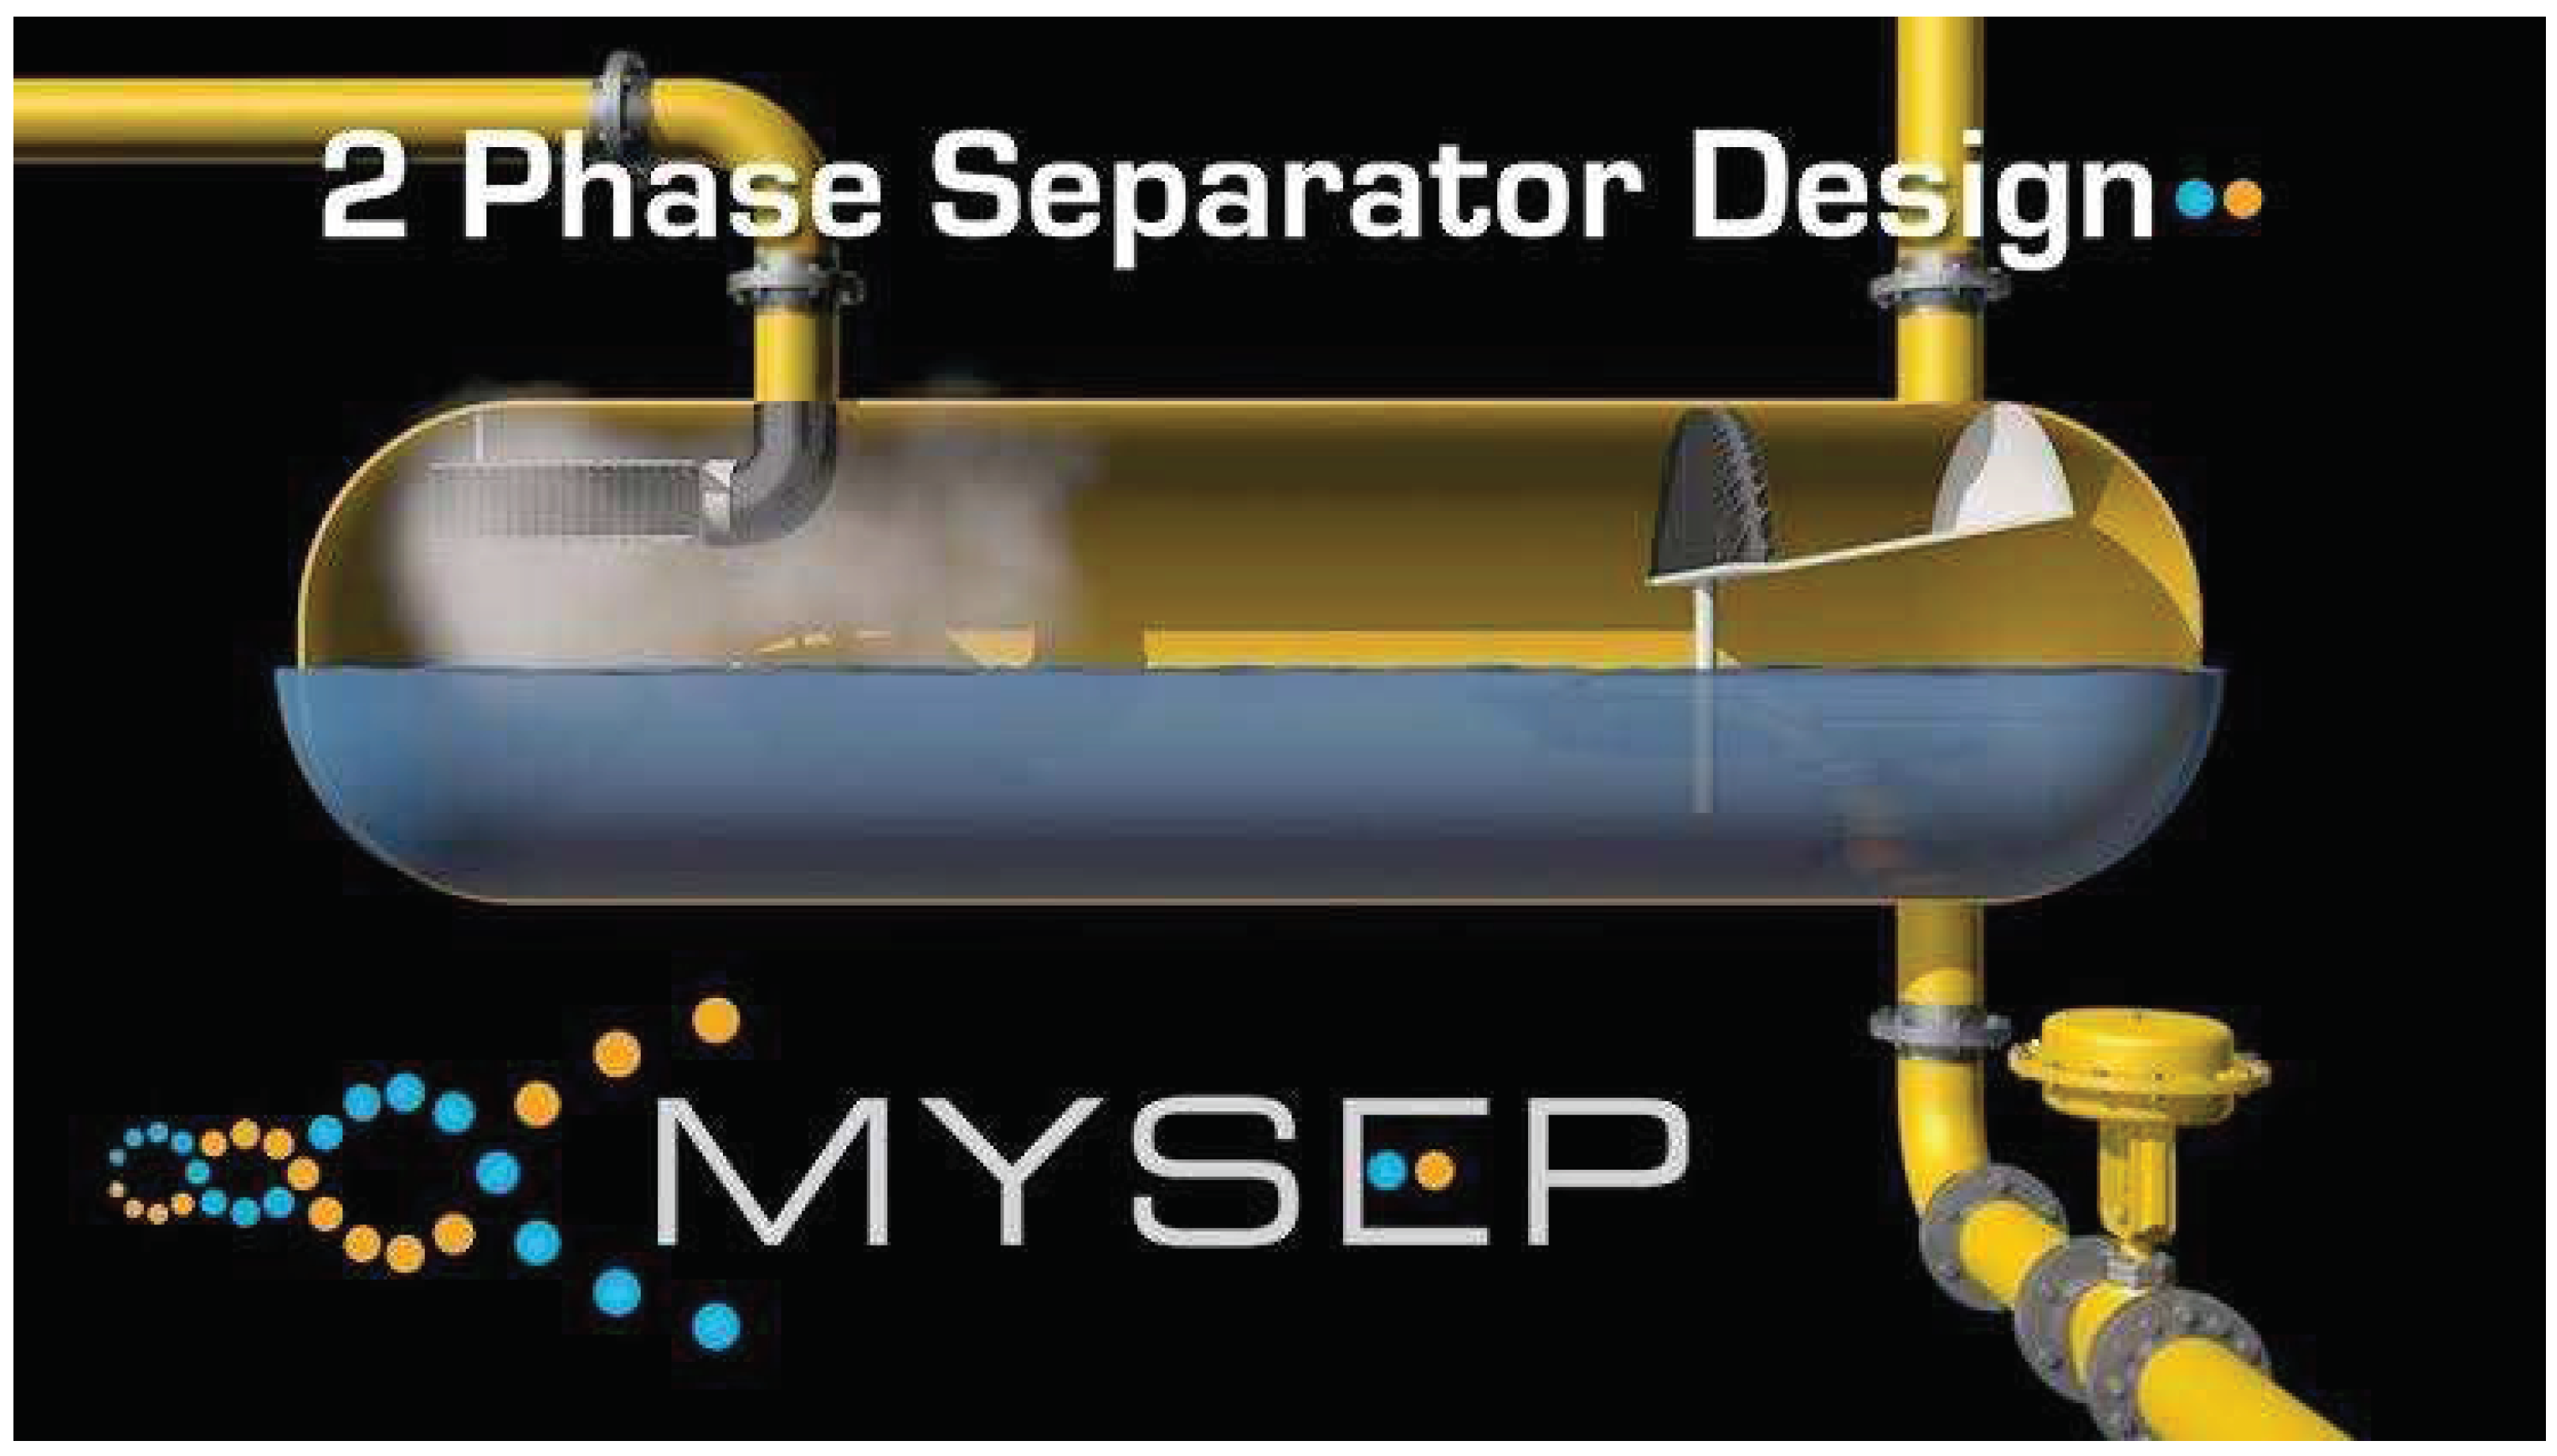
Figure 16.
2 Phase Separator Design: The function of this figure is to showcase the design and components of a two-phase separator, which is commonly used in the oil and gas industry. It depicts the separation process of oil and gas from a mixed fluid stream. The figure aids in understanding the principles and applications of two-phase separators in the oil and gas production process. By analyzing these figures with a deeper understanding of the technologies, designs, and applications related to test separators and dynamical fluid metering.
10. Potential Results That was Obtained from the Analysis of Test Separators and Dynamical Fluid Metering
1. Improved Accuracy: The analysis reveal specific areas where fluid flow measurements are prone to inaccuracies. By implementing suggested changes or improvements, the research lead to enhanced accuracy in fluid metering, providing more reliable data for various applications.
2. Enhanced Separation Efficiency: Through the analysis, researchers identify inefficiencies in separating different components of fluid mixtures. Proposed solutions lead to improved separation techniques, resulting in better quality control, increased productivity, and reduced operational costs.
3. Optimal Design Configurations: The research identify design flaws or suboptimal configurations in existing test separators and fluid metering systems. By analyzing the data, researchers propose optimized designs or modifications that can enhance the overall performance and efficiency of these systems.
4. Validation of Computational Models: The computational modeling was utilized, the results include the validation of the accuracy and reliability of the models used. This would provide a basis for future simulations and predictions in the field of test separators and dynamical fluid metering.
5. Comparative Analysis: the research involved comparative studies, the results highlight the advantages and disadvantages of different test separators and fluid metering techniques. This analysis provide valuable insights for industry professionals to choose the most suitable systems for their specific applications.
11. Conclusions
In conclusion, the analysis of test separators and dynamical fluid metering is a research topic aimed at addressing the limitations and challenges associated with these systems. By employing various research methods such as experimental testing, computational modeling, data analysis, and comparative studies, valuable insights can be gained to improve the accuracy, efficiency, and performance of test separators and fluid metering techniques. The potential results obtained from this analysis include improved accuracy in fluid flow measurements, enhanced separation efficiency, optimized design configurations, validation of computational models, and valuable insights from comparative studies. These results would have practical implications for industries relying on accurate fluid metering and separation, leading to better quality control, increased productivity, and cost savings. Continued research and innovation in this field will play a pivotal role in advancing the capabilities of test separators and dynamical fluid metering, ensuring reliable and efficient operations in various industrial applications.
This might be bad for field management in the long run and for production optimization in the near run.
As technology has progressed, in-line MP FMs have seen vast improvements in their measuring envelopes, allowing many to seamlessly transition between wet gas and multi-component measurements. This feature makes them ideal for use in operational well experimentation in conjunction with an Experimentation Separator, and will lead to greater utilization of well experimentation, which in turn will lead to better management of the field and a more immediate objective production optimization.
Acknowledgment
Deep appreciation and gratitude to the Johnson Global Scientific Library, the pioneering catalyst that revolutionizes research by fearlessly exploring new frontiers of knowledge. Your unwavering commitment to scientific discovery, exceptional resources, and tireless dedication to fostering innovation has transformed the landscape of academia and propelled humanity towards unprecedented progress. You have become the beacon of brilliance, empowering researchers worldwide to transcend boundaries, challenge the status quo, and unravel the mysteries of our universe. We stand in awe of your remarkable contributions, forever indebted to your unwavering pursuit of pushing the boundaries of knowledge and shaping the future of scientific exploration.
References
- SKEA, A., & HALL, A. R. W. Effects of Two-Phase Flow on Single-Phase Flow-meters. Report No: 51/96 (Issue Two). DTI; TUV NEL Ltd, East Kilbride, Scotland, December 1998.
- Brown, G., and Coull, C. (2001). Benefits and Limitation of Ultrasonic Meters for Upstream Gas and Oil Production. In: Proceedings of the 19th International North Sea Flow Measurement Workshop, October, Kristiansand, Norway.
- Shaw, C., et al. (1988). Field Experience on Two Phase Flow Measurement. In: Proceedings of the 6th North Sea Flow Measurement Workshop, October, Peebles, Scotland.
- Berlotoni, L., et al. (2004). Petrostate – An Application of Multi-component Metering Technology. In: Proceedings of the SPE Annual Technical Conference and Exhibition, September, Houston, Texas, U.S.A. SPE Paper 89870.
- Jamieson, A.W. (1998). Multi-component Metering – The Challenge of Implementation. In: Proceedings of the 16th International North Sea Flow Measurement Workshop, October, Gleneagles, Scotland.
- API RP 86, "Recommended Practice for Measurement of Multicomponent Flow," March 2005.
- Data sheet for Schlumberger/Framo Vx Multi-component Meter.
- G. STOBIE and O. FOSSA. MPM Experience on Ekofisk. MPM User Forums, Stavanger 2008 and Houston 2009.
- AS-MPM Multicomponent Meter data sheet.
- Stobie, G. (2010). Multi-component Alaska Meter Experimentation: MPM User Group Forum. Presented in Norway conference in Stavanger, June 2010.
- Roxar 2600 Multicomponent Meter data sheet: Title: Roxar 2600 Multicomponent Meter Data Sheet.
- "Oil/Water Experimentation’s on a 4 path Ultrasonic Meter at Low Flow Velocities" by G. Brown, T. Cousins, D. Augenstein, and M. Almeida, presented at the 24th International North Sea Flow Measurement Workshop in St Andrews, Scotland, in October 2006.
- Challenges at High Accuracy Multi-component and Wet Gas Metering" by L. Scheers, presented at the Galveston Texas MMUR 2007 conference.
|
Disclaimer/Publisher’s Note: The statements, opinions and data contained in all publications are solely those of the individual author(s) and contributor(s) and not of MDPI and/or the editor(s). MDPI and/or the editor(s) disclaim responsibility for any injury to people or property resulting from any ideas, methods, instructions or products referred to in the content. |
© 2023 by the authors. Licensee MDPI, Basel, Switzerland. This article is an open access article distributed under the terms and conditions of the Creative Commons Attribution (CC BY) license (http://creativecommons.org/licenses/by/4.0/).
