Submitted:
16 December 2023
Posted:
18 December 2023
You are already at the latest version
Abstract
Abstract: The establishment of a circular economy in the mining sector, taking advantage of innovations in the exploration and development of hydrocarbon reserves, [ ], their [ ], transportation [ ] and subsequent processing [ ] are significant concerns. The issues surrounding the employment of technology targeted at enhancing environmental safety to increase the productivity of the reproduction process of the natural gas and oil resource base are equally important. The paper discusses the use of green seismic technology of survey to determine the oil and gas potential of the subsoil. A methodological toolkit is proposed for carrying out technical and economic calculations to determine indicators of the environmental and economic efficiency of using innovative resource-saving technology for geological survey in areas densely planted with forests. The purpose of the work is to establish the viability of employing resource-saving technology known as Green Seismic to search for promising hydrocarbon objects in forested areas and determine the expected environmental and economic benefits of geological exploration using the suggested enhanced methodology for their evaluation. The tasks set to achieve the goal were solved using methods of geological and economic assessment of the hydrocarbon raw material potential of territories and water areas, environmental assessment of the negative influence of anthropogenic environmental impact on the natural environment, economic and statistical methods of performing technical and economic calculations to determine performance indicators for the implementation of innovative projects in the field of geological exploration. The novelty of the results obtained lies in the proposed improved algorithm for conducting an environmental and economic assessment of geological exploration for hydrocarbon raw materials, a conceptual description of the Green Seismic technology, systematization of technical, economic, and environmental risks, justification of new regional directions for geological exploration using resource-saving seismic exploration technology.
Keywords:
resource-saving technology
; industrial ecology
; environmental management
; green seismic
; geological exploration for hydrocarbon raw materials
; environmental and economic efficiency
; hard-to-reach (forested) areas
1. Introduction
Raising the effectiveness and efficiency of geological exploration activity is one of the key objectives for the growth of the Russian oil and gas production complex. Currently, most of the territories where prospecting and exploration of hydrocarbon deposits are planned are characterized by poor geological knowledge, inaccessibility, harsh climatic conditions, and environmental vulnerability. Oil and gas companies carry out geological exploration mainly in poorly studied taiga territories and swampy areas using traditional seismic exploration methods. This is often characterized by their low geological and economic efficiency and negative impact on the environment. To advance the geological exploration of oil and gas-bearing regions and expand the base of viable hydrocarbon raw materials, it is imperative to enhance the economic efficiency of geological exploration. Maintaining the quality of the subsoil area studies and, more specifically, the environmental safety of the areas, that are part of the Russian Federation’s Arctic zone (AZRF) are crucial requirements. For such activities to take place, cutting-edge technology, and techniques for performing fieldwork with the least amount of technogenic influence on the environment must be developed. Additionally, [5] methodological approaches for evaluating the expected consequences must be improved.
In this regard, issues related to the introduction of green technologies into the geological exploration process and the improvement of the methodology for assessing geological exploration in terms of taking into account environmental factors are a very relevant and promising industry task. At the same time, it is of no small importance, firstly, to establish the technical feasibility of using innovative Green Seismic technologies, and secondly, to justify the environmental and economic feasibility of their use in forested areas.
The purpose of the study is to establish the viability of employing resource-saving technology known as Green Seismic to search for promising hydrocarbon objects in forested areas and determine the expected environmental and economic benefits of geological exploration using the suggested enhanced methodology for their evaluation.
The following practical and scientific tasks were resolved in the study in order to meet this goal:
1. An enhanced algorithm for performing an environmental and economic assessment of the use of resource-saving technologies for oil and natural gas exploration in forested areas has been proposed. This comes after a critical analysis of the current methodological approaches and criteria for judging the effectiveness of exploration for hydrocarbons.
2. A conceptual description of the Green Seismic technology, used to conduct prospecting work on hydrocarbons in forested areas is presented.
3. The realization of hydrocarbon exploration projects in environmentally sensitive locations was the subject of an issue analysis. The analysis’s findings were used to identify and categorize the technical, financial, and environmental issues that prevent these projects in forested areas from becoming more efficient.
4. Technical and economic calculations have been carried out to justify the feasibility of using Green Seismic technology in comparison with traditional methods of geological exploration for hydrocarbon raw materials in regions with forested areas.
Resolving the conflicts between environmental preservation and economic growth is currently a crucial and promising problem while working on production projects. This is important since the biosphere and human existence are negatively impacted by the growth of the industrial sectors of the economy. In the context of the strategic role of sustainable development, the economy and the environment are becoming increasingly interdependent. The research and implementation of resource-saving technologies in production processes directly affects the profitability of doing business.
A growing body of scientific research is being done in the modern era to support the viability of utilizing green technologies in the oil and gas sector. This is justified through a comprehensive technical, environmental, and financial evaluation of industrial projects, including geological exploration. Therefore, the combined scientific efforts of ecologists and economists during the last ten years have constituted the most important study in this field. In addition to offering suggestions for enhancing techniques for evaluating the anticipated technological, environmental, and economic effects, these works describe novel resource-saving technologies for geological exploration while also considering the mitigation of the adverse effects of production factors on the environment.
In 2017 the Canadian scientific team consisting of A.Dabros, J. Hammond, J. Pinzon, B. Pinno, and D. Langor, David released the findings of a study [6] that examined the detrimental effects on the environment of small-width (between 1.5 and 3 m) and high-density seismic clearings, specifically with regard to damage to forested areas and the delayed restoration of forest plantations following logging. Compared to clearings of traditional width (10 m), small clearings lead to long-term fragmentation of the landscape and negative consequences for biodiversity and ecosystem processes. According to the authors, relatively narrow seismic clearings lead to forest fragmentation. In seismic clearings and in the forest at five meters from the edge of the clearing line, the diversity and cover of plants is reduced compared to the interior forest. Subsequently, this may lead to a slowdown in the natural recovery of seismic clearings since the sources of propagation are reduced in the forests closest to the zones of initial disturbance.
An overview [7] of both national and global green seismic technologies is given by R.R. Khabibullin, I.V. Leontyev and A.L. Krutov in their scientific study. The authors have determined a list of main indicators characterizing the environmental effect of forest conservation during geological exploration, which include: the length of seismic profiles in licensed areas; number of trees saved; volume of wood saved; environmental value of the preserved forest; average cost of preserved forest per 1 linear km of Green Seismic profile. As per the evaluation findings, the average expense of the preserved forest for a 1 linear km seismic survey was 25.8 thousand rubles in monetary terms, equivalent to 300 trees or 57 m3 of wood in physical terms. These findings confirm the resource-saving nature of the implementation of the Green Seismic method studied by the authors. By using lesser volumes of explosives needed to create excitation waves, the method under consideration ensures minimal impact on the environment. However, now, in the practice of assessing environmental and economic efficiency, there is no methodology for precisely quantitative assessment of the expected environmental gain, which is an incentive for further research in this direction.
A Green Seismic technology which uses cable-free equipment to conduct seismic research for oil in difficult-to-reach areas is examined in the work of [8] Zh. Yin, Y. Zhou, and Y. Li. The authors substantiate the technical and geological efficiency of using cableless technologies in the taiga, but there is no assessment of the environmental and economic efficiency of its use, since this problem was not solved in the study. A. Romanov in [9] confirms the high geological efficiency and increased productivity of using cableless equipment during seismic exploration, but also does not determine the environmental and economic effect in the published article.
J. Jorgenson [10] and J. Ver Hoef examine the effects of wintertime geological exploratory activity on the natural environment utilizing lightweight, compact equipment. The soil layer is less negatively impacted by excavation equipment because of the coating of snow and frozen soil; yet, clearing green spaces for clearings is still required. At the same time, the impact on the soils and vegetation at the clearing site remains noticeable two to three years after the geological exploration is finished.
A.A. Ilyinsky and M.A. Ilchenko’s [11] work describes a remote technology for investigating the subsurface for hydrocarbon raw materials. By optimizing the density of the seismic profile network and lowering the amount of prospecting and appraisal drilling, the authors hope to lessen the detrimental effects of technology on the ecosystem. An alternative to ground-based geochemical surveys that covers significantly larger study areas situated in remote, understudied places is laser sensing technology [12],[13]. The geological effectiveness of the technology lies in the increased accuracy of localization of hydrocarbon accumulations in the subsoil. It is worth noting that laser probing does not replace traditional methods of searching for hydrocarbon accumulations and only complements them in combination with seismic exploration. A.E. Cherepovitsyn and D.M. Metkin conducted the aforementioned studies in their scientific work [14]. The authors analyzed the environmental and economic efficiency of using laser sensing of industrial facilities located in remote and hard-to-reach regions of Russia (Arctic zone of the Russian Federation) for the purpose of carrying out their environmental monitoring. It is possible to identify current and future negative sources affecting the natural environment based on the results of sounding the environmental situation within the boundaries of the oil and gas complex’s industrial infrastructure, including during the implementation of exploration projects. This enables the timely implementation of measures to eliminate these sources. The authors of the work present an algorithm for calculating a complex criterion for the economic and environmental effectiveness of implementing projects in the oil and gas sector, including geological exploration. This algorithm considers the effects of ecosystem modifications brought about by environmental protection measures, as well as the total integral effect of direct and indirect environmental effects.
Apart from scientific investigations into the application of green seismic exploration technologies and their viability in forested areas, encompassing geological success as well as environmental and economic implications, several works aim to enhance the methodological framework for evaluating environmental and economic efficacy. Among these is a research paper [15] by S. Esterhuyse. Although the author focuses on projects for the development of areas with unconventional hydrocarbon reserves, geological exploration work can also benefit from the methodological approach suggested for evaluating the environmental and financial viability of implementing such projects. The author presents a methodological tool known as a strategic environmental assessment. It enables one to assess the efficacy of an oil and gas production field’s conceptual design from an environmental perspective and to consider environmental risks and aspects when making critical project management decisions. The work observes that the practical application of a system of strategic environmental evaluation of projects is not codified in legislation in numerous countries that engage in the industrial production of hydrocarbon raw materials. Therefore, oil and gas companies do not conduct such assessments on a regular basis but perform it only for the projects implemented in environmental protection zones.
The study [16] outlines the author’s categorization of the detrimental effects of soil disturbance and deforestation on the ecosystem resulting from the commercial operations of oil and gas companies, including geological exploration. In addition to formulas for calculating the cost of deforestation in relation to the area of deforestation, a method for calculating the cost of lost carbon capture and the cost of harm to fauna is provided. These tools provide a methodological approach to evaluating the economic losses associated with deforestation during the development and operation of oil and gas fields. The calculations were performed using the example of a subsoil site located in tropical forests in Ecuador. Since the detrimental effects on the environment last for a long time, the author suggests calculating the mentioned consequences while considering discounting. Based on the results of the work performed, one of the author’s conclusions is the need to increase investments in new projects to consider the environmental risk factors of production processes. It should be noted that the author’s suggested environmental and economic efficiency indicators do not include a quantitative evaluation of hazards associated with the execution of projects for the geological exploration and industrial development of oil and gas fields located in forested areas. This, in our opinion, is a prerequisite that must be met when choosing which technologies to apply for the prospecting, exploration, and development of the hydrocarbon raw material base.
The findings of a research [17] presented by a group of authors are aimed at a comprehensive environmental assessment of projects for the preparation and development of offshore oil fields. The authors proposed organizational and technical approaches aimed at reducing the negative impact of the industrial implementation of oil and gas projects on the environment. The scientific technique suggested in the work for evaluating the efficacy of environmental measures can be used to projects that are carried out on land, even though the study’s objects are offshore oil and natural gas fields. The authors point out that improving the current methodological tools to span the life cycle of such projects and account for total environmental risk is important to achieve impartial assessments of the detrimental effects of projects on the environment. To this end, scientists recommend conducting a full-scale environmental assessment of oil and gas field development projects, starting from the moment of geological exploration, and ending with activities related to the liquidation of the field. The authors suggest the following organizational and managerial strategies to manage environmental risks: evaluate the current environmental conditions at each stage of the project, create environmental protection strategies that guarantee environmental protection, evaluate the anticipated environmental effects of the proposed strategies both before and after they are put into action, and make necessary adjustments based on the assessment strategies that are put into action. Finally, they suggest implementing environmental monitoring at every stage of the ongoing complex of design work. In addition to having a high degree of methodological uncertainty in the results, the suggested approach to evaluating the environmental effects of oil and gas project implementation does not permit evaluating the indirect technological impact of the ongoing production work on the environment. The system of indicators does not contain an economic component, which is an important aspect when justifying management decisions.
Using over fifteen thousand accessible sources from the Scopus database, comprehensive study [18] performs a critical bibliometric analysis of scientific knowledge gaps in evaluating the sustainability of oil and gas projects undertaken in the Arctic region. The authors categorized the main concerns about evaluating projects’ economic viability, identifying environmental safety metrics, locating utilized technology, and evaluating social impacts. The results of the study showed a relatively small number of works devoted to the sustainable development of oil and gas development projects in the Arctic. Due to the high dangers of disrupting the stability of Arctic ecosystems and the lack of adequate management mechanisms, the authors stress the ineptitude of creating programs for the preparation and production of hydrocarbons in the Arctic zone. One of the key conclusions of the study is the statement that in the conditions of underdeveloped, hard-to-reach areas, high economic results are inversely proportional to the negative environmental impact. The factors determining sustainability, sustainability assessment, justification of sustainability assessment results, and sustainability management are the parts that make up the authors’ map of methodological issues with sustainability of vulnerable Arctic oil and gas projects.
A relatively small number of studies are devoted to resolving methodological issues of assessing the environmental and economic efficiency of work on the preparation of hydrocarbon reserves, despite the growing interest in science and technology in the assessment of geological exploration work in environmentally vulnerable territories, including the northern regions of Russia. This suggests that there are certain gaps in this field of study. An increase in environmentally focused projects for the replication of the hydrocarbon raw material base will be ensured by the development of scientific and methodological tools that offer a comprehensive assessment of the economic and environmental efficiency of utilizing resource-saving technologies in the geological exploration process.
2. Materials and Methods
Geological exploration projects are complex, since their effectiveness is ensured through the simultaneous interaction of technical, technological, organizational, environmental, and economic components.
It is necessary to consider specific conditions and potential issues when developing projects for geological exploration and production organization within forested areas. These include the need for special equipment, the complexity of the terrain, the inability of individuals to physically maneuver large equipment used in field geophysics, and climate factors. The listed conditions significantly increase the volume of investments in the implementation of geological exploration projects, especially when performing the field stages of work.
A subsoil site located on the territory of the Khanty-Mansi Autonomous Okrug was chosen as a calculating example. Integrated initial data for carrying out work at the site, as well as characteristics of the raw hydrocarbon potential are presented in Table 1.
Various methods for making and justifying decisions help to comprehensively analyze all kinds of factors that reduce the efficiency of oil and gas geological exploration. The Ishikawa diagram is a problem analysis model that allows you to delve deeply into the underlying causes and their implications in the context of the object under investigation. It is also referred to as the cause-and-effect diagram, fishbone diagram, or Ishikawa diagram [19]. It is one of the instruments for analyzing the object’s structure and making an evaluation of it. In this study, the Ishikawa diagram is utilized to identify risk concerns completely and methodically for exploration activities within a forested area, as well as to visually depict cause-and-effect links.
The main groups of factors influencing the efficiency of geological exploration and used in constructing the Ishikawa diagram include geographical location of the study area or license area, geological and geophysical equipment, personnel, ecology, and production geology. Each category of components can be broken down to identify the processes and reasons influencing the effectiveness of geological exploration. This information is then used to clarify environmental and economic assessments, which must be conducted in the face of risks and uncertainties [20].
Numerous unique aspects of carrying out geological and economic research are considered in the scientific works of economists, which served as the foundation for the development of an algorithm for evaluating the environmental and economic efficiency of geological exploration for hydrocarbon raw materials. The degree of geological and geophysical knowledge influences the presence of geological uncertainty, which in turn determines the specificity of the geological and economic evaluation of hydrocarbon items projected for finding. Verifying the development of prospective locations for the replication of the mineral resource base of hydrocarbon raw materials is the goal of the geological and economic evaluation [21].
The study uses universal tools to justify the economic feasibility of putting an oil and gas facility into industrial development, discussed earlier in the article by I. Filimonova [22]. The algorithm includes 6 stages: probabilistic assessment of the oil and gas potential of a subsoil site; building an optimization geological and production model that examines all technological factors; building a production and economic model; building a financial and economic model which includes all necessary costs; conducting an analysis of the stability of economic model indicators to changes in oil prices, capital costs, etc.; comparative analysis of assessment results.
In [23] the author proposes a transition from a deterministic assessment of hydrocarbon resources to a probabilistic one, improving methods for distributing predicted volumes of oil and gas among promising objects and clarifying the methodology for forecasting mining and geological factors. The author states that prospecting success rates and a differentiated risk premium should be used in the risk assessment of oil and gas field development.
In [24] deterministic and stochastic factor analysis was carried out to assess the effectiveness of geological exploration. The primary metrics for assessing the economic and geological effectiveness of oil and gas exploration are identified, along with the formulas needed to compute them. The paper presents recommendations for analyzing the effectiveness of geological exploration work carried out in poorly studied and inaccessible territories using deterministic analysis methods; The advisability of using stochastic methods only for established industrial production areas is noted due to the availability of a lot of reliable statistical data on previously carried out geological exploration and production work.
The authors of [25] have developed a methodology for the geological and economic evaluation of the hydrocarbons’ forecast raw material potential. This methodology is based on a well-organized series of studies of understudied oil and gas objects and consists of four stages: resource base analysis, raw material potential assessment, technological parameter determination for field development, and economic evaluation. The authors set out methods for the probabilistic assessment of hydrocarbon resources of forecast objects, considering geological risk, using the software products «EVA-Risk Analysis» and «EVA-Economic Assessment of Oil and Gas Field Development Projects» as calculation tools. Indicators of the geological and economic efficiency of geological exploration work were established because of testing the suggested methodological approach on the example of little-studied objects of the Timan-Pechora oil and gas province, taking into consideration the potential confirmation of raw hydrocarbon potential.
In order to evaluate shale oil and gas projects at any point of project development, study [26] created a methodology that uses a probabilistic approach to reserve assessment in order to account for geological uncertainty. The cost of hydrocarbon raw materials on the market, tax rates and budgetary payments, exchange rates, and other ranges of initial basic economic parameters are used in the calculations to produce probabilistic NPV values, which are then used to recommend the most objective management decisions.
3. Results and Discussion
Figure 1 shows the Ishikawa diagram, which allows us to determine the reasons that negatively affect the environmental and economic efficiency of geological survey carried out in forested areas. The formed factors are not exhaustive, but their total influence on the efficiency of implementation of geological exploration projects exceeds 90 %.
It is advisable to use seismic technology, which uses wireless receivers and narrow-sized seismic signal excitation sources, to reduce the amount of deforestation and increase the environmental and economic efficiency of geological exploration for hydrocarbon raw materials in forested areas. This will also lessen the negative impact of the listed factors on the effectiveness of the geological exploration process.
The expected effects from the introduction of this technology into the production geological exploration process are as follows:
- minimizing the negative effects of technology on the environment by cutting down on the amount of forest destruction on seismic profiles and by not using heavy machinery, which lessens the strain on the soil cover;
- enhancing productivity in the areas of industrial safety and labor protection by executing safe drilling, lowering the number of field crew mobilizations, and reducing injuries during seismic surveys;
- enhancing the quality of primary geophysical data by means of seismic investigation in densely forested areas that were previously unreachable.
The utilization of a wireless radiotelemetry system for seismic data recording is the technological solution’s main component. The machinery avoids the huge trees that are present throughout the profile drilling process, leaving a clearing that is between 1.0 and 1.5 meters wide. There is a decrease in the volume of cut forest by narrowing the profile. Wells are drilled using small-sized drilling rigs, which improves the industrial safety of the drilling process. The resultant wells are filled with explosive charges, which are remotely detonated. Installed in the area, these sensors gather data and send it to a seismic station for further processing.
Clarification of current analytical approaches to the environmental and economic assessment of the implementation’s efficacy is necessary with the introduction of such technology for seismic exploration. After summarizing the body of research on estimating the geological and economic viability of hydrocarbon raw material exploration, it appears feasible to enhance and then implement an algorithm that guarantees the computation of economic and environmental variables that establish project viability.
The extent of expenses and outcomes related to the detrimental effects of geological exploration work on the environment should be considered when performing technical and economic cash flow calculations. These include, on the one hand, environmental safety precautions and, on the other, financial savings from the preservation of natural objects.
The stages of evaluating the geological and economic viability of hydrocarbon raw material exploration for objects situated in environmentally sensitive areas within forested areas are depicted in Figure 2, with consideration given to the anticipated environmental impacts that will positively influence the ensuing economic indicators. At the same time, the set of resulting indicators of economic assessment of the effectiveness of geological exploration depends on their type and scale of impact on the surrounding ecosystem.
The algorithm includes a block for assessing environmental efficiency, which calculates indicators characterizing measures to preserve the natural environment during geological exploration. Based on the results of calculations in this block, the indicators presented in Table 2 are determined.
Following the determination of the indicators, an economic assessment is conducted to determine the efficacy of industrial development of the oil and gas raw material potential, considering the calculated integral effect of implementing measures intended to preserve the environment. Therefore, the potential financial savings from utilizing the resource-saving technology examined in this study are factored in when determining the economic efficiency indicators of implementing a geological exploration project. The primary impact of the resource-saving technology under consideration is to lower the exploration work costs for the corporation on money gathered for forestry usage.
The application of the proposed methodological tools is carried out using the example of a comparative assessment of the use of traditional seismic technology and the resource-saving technology Green Seismic on a subsoil site located in the forested territory of the Khanty-Mansi Autonomous Okrug (KhMAO) - Yugra. The assessment of geological exploration work was carried out in accordance with the «post-facto» and «greenfield» approach set out in [29] and in accordance with the algorithm proposed in this article.
It is intended to conduct 3D seismic research for hydrocarbon raw materials on the region of the subsurface site under consideration utilizing two methods: classic areal seismic exploration and a resource-saving technology known as Green Seismic.
The necessary felling for the preparation of seismic profiles when using traditional technology is the laying of a clearing 4-5 m wide. Considering the average cost of cutting a linear kilometer of a 4-meter profile, which is 40,000 rubles, and the length of the forest in terms of one hectare per linear kilometers (1 ha = 2.5 linear km), the unit cost of excavation will be 100,000 rubles.
The reduction in leased land due to the use of resource-saving technology will be 475 hectares, the reduction in deforestation in physical terms is estimated at 46,597 m3, the reduction in the volume of reforestation will be 276 hectares.
Savings on the costs of seismic exploration using resource-saving technology will be as follows from Table 3, considering the average forest density (2,000 trees/ha), the average distance between trees (2.4 m), the percentage of the territory covered by forest cover (80 %), as well as the cost of renting forest land, the unit cost of cutting a clearing, the cost of reforestation and timber.
A definite possibility for growing savings from its use to boost the financial efficiency of geological research is indicated by scaling up the use of resource-saving technologies for seismic surveys in regions with comparable natural conditions.
To improve the validity of management decisions made at the outset of work in poorly studied forested areas, the derived environmental efficiency indicators should be used in a thorough evaluation of the efficacy of geological exploration activity.
The efficacy of seismic exploration in the licensing region under analysis, utilizing both resource-saving (greenfield assessment) and traditional (post-facto assessment) technologies, is determined by technical and economic calculations, as shown in Table 4.
After completing technical and financial calculations to ascertain the efficiency indicators of geological exploration based on the suggested algorithm, a qualitative and quantitative evaluation of the implementation risks is conducted in relation to the potential application of resource-saving technology in the area.
We can determine the most important elements affecting the security, environmental friendliness, and financial viability of geological exploration projects by evaluating the risks associated with the use of geophysical technology in forested areas. This study uses the method of grouping risks by area of manifestation and the brainstorming method [30] to collect information and analyze the causes of risks [31] when carrying out seismic exploration using traditional and resource-saving technology (Table 5).
In this study, qualitative risk analysis was carried out using the pairwise comparison method [33] for the subsequent development of a thermal risk matrix (probability and impact). Pairwise comparison method has the advantage of comparing each pair of risk occurrences to identify the most significant one, as a qualitative assessment can only be conducted by carefully examining and comparing two objects. The pairwise comparison method allows you to assess risks using an integral indicator of the overall riskiness of the project in relation to the technology used:
where Pi is the probability of the i-th risk occurring; wi – specific weight of the i-th risk; n – number of risks considered.
The probability of the occurrence of the i-th risk is assessed on a 100 % scale, where 0.01 is the minimum probability of risk occurrence, 1.0 is the maximum.
To estimate the weight of the i-th risk, the pairwise comparison method is used, where scores of 0.5 indicate that the risk is less significant in comparison; 1.0 - equivalent risk; 1.5 - the risk is the most significant. The risk weight coefficient is calculated as the ratio of the number of points of the i-th risk to the total value of points for all risks. The potential damage of consequences from a risk event (x) is determined by the ratio of the i-th risk score to the maximum possible score for the risk. At the same time, initially, when identifying risks, the probabilities of their occurrence (y) are determined.
Interpretation of the results of the integral risk level:
1 ≤ R < 35 – low level of risk of the project under consideration;
35 ≤ R < 65 – average level of risk;
65 ≤ R ≤ 100 – high level of risk.
Groups related to production, environmental, and technological hazards were chosen for qualitative analysis since these are the most relevant and of interest when evaluating geophysical methods for oil exploration in challenging environments, such as forested areas.
The matrix of the degree of probability of risks occurring and their impact on the result of geological exploration is presented in Table 6. When determining the degree of risk influence, the following scale was used: «critical», «high», «medium», «low» probability of the occurrence of a risk event and its impact on the effectiveness of the exploration project.
The result of the risk assessment using the pairwise comparison method is presented in Table 7. Figure 3 shows heat maps of the dangers associated with utilizing traditional seismic technology versus resource-saving seismic technology based on the results collected.
Using conventional geophysical technologies to estimate the level of the main groupings of dangers that could result from geological investigation, the results come out at 64.6 %, which is on the boundary between medium and high risk. Utilizing resource-saving technology carries a risk rating of 34.6 %, which is on the edge between lower and medium risk.
Resource-saving technology has greatly decreased the possibility of deforestation hazards and, consequently, the risk of worker injury. It has also lessened the impact of heavy equipment’s excessive load on the soil because it is no longer necessary to utilize it. However, even with the application of new technology, some risk events continue to fall into the high medium zone.
The study conducted a quantitative assessment to support the viability of utilizing resource-saving technologies in the studied location, after a qualitative evaluation of the primary dangers that arise during geological exploration.
This paper uses the fuzzy logic method, an approach in which the variables involved in the analytical description of the model can take on linguistic values, to quantitatively analyze the risks of utilizing resource-saving technologies on the territory of the region under study [34].
Approximately 54 % of Khanty-Mansi Autonomous Okrug - Yugra (KhMAO-Yugra) is covered in forests, making up 4.3 % of the Russian Federation’s total forest area [35]. In addition, the region is characterized by harsh climatic conditions, swampy conditions, a sensitive ecosystem, and a high probability of force majeure events associated with various natural and man-made factors. At the same time, the oil and gas fields of the Khanty-Mansi Autonomous Okrug - Yugra make the largest contribution to the production of hydrocarbons in the country [36].
To assess the risks of using resource-saving technology when carrying out geological exploration for hydrocarbon raw materials, the following statistical indicators were selected (Table 8) [37].
Each of the input factors xi is normalized into a metric in the interval [0; 1] in accordance with the equation:
where x is the normalized value of the variable, xi – is the initial value of the variable (according to Khanty-Mansi Autonomous Okrug-Yugra), – is the minimum/maximum value of the variable (for Russia).
Table 9 presents the values of the normalized variables xi.
At the next stage of calculations, the intervals for the normalized values of the variables and the values of the membership function are determined (Table 10).
Table 11 presents a matrix of risk level values for the region under study, with the level of significance for each factor determined by the equation:
where ri is the level of significance, N is the number of variables, i is the ordinal number of the variable.
For the integral risk assessment (Table 12), nodal points are determined using the equation:
where yj are nodal points, j is the serial number of the level.
The resulting risk assessment is carried out using the equation:
where yj are nodal points, ri is the weight of the i-th factor in the convolution, λij is the value of the membership function of the j-th qualitative level relative to the current value of the i-th factor, 5 is the number of classifier levels.
Table 13 presents a fuzzy value scale for assessing the risk of the study region.
The region under investigation has an integrated risk assessment of 0.583, which falls between medium and high levels and suggests that there may be issues with the implementation of the environmental protection measures in the region. The ratio of the area of reforestation and afforestation to the area of cut down and dead forest plantations for the analyzed period is less than 100 %, which indicates the low efficiency of reforestation work. The value of CO2 emissions corresponds to a level below the average in comparison with the regions of Russia, while the amount of expenditure on environmental protection is above the average level for Russia.
Thus, the implementation of projects using resource-saving seismic survey technology in the region under study will improve the levels of environmental protection activities, environmental safety, as well as indicators of activity in the use of technological innovations in production processes.
4. Conclusions
Even with the advancement of technology, it is currently impossible to conduct a geological investigation of the subsurface without endangering forests. For this reason, the issue of adverse effects on the environment persists. Businesses involved in the oil and gas production complex have contributed to the development of the trend of integrating “green technologies” into geological exploration and production activities. The goal of introducing these technologies is to increase their environmental friendliness and standardize organizational mechanisms for implementation. They do this by using ongoing environmental projects for the extraction of hydrocarbons as an example. By cutting the costs of preparing the area for geological survey by 31.8 %, resource-saving technology will increase the economic efficiency of hydrocarbon geological exploration work by 1.02 %. Moreover, compared to traditional technologies, there will be a significant decrease in incident risks.
Subsoil user companies planning an environmentally safe and cost-effective search for and exploration of hydrocarbon deposits in forested areas of the region using resource-saving technology should implement several measures:
- carry out environmental insurance, which provides coverage for the risks of harm to the environment, life, health, and property of third parties in the process of work;
- carry out corporate examination of geological exploration projects to improve the quality of documentation in terms of making timely environmental decisions aimed at reducing environmental risks.
The use of resource-saving technology is economically feasible for work areas characterized by high forest cover and the level of environmental risk, which ranges from 0.333 to 1.0 on a scale of fuzzy values, which include the Khanty-Mansi Autonomous Okrug, the territories of Eastern Siberia, and the Republic of Sakha (Yakutia).
Due to industry restrictions on the import of high-tech products, which in turn affect the lengthening of time it takes to introduce technological solutions into production, it should be noted that the current geopolitical environment has a negative effect on the development of innovative resource-saving geological exploration technologies in Russia. Resource-saving technology is, however, often connected with implementation risks for projects, requiring large initial investments for the re-equipment of seismic workers and modifications to the current technological chain.
Author Contributions
Conceptualization, D.M. and O.B.; methodology, O.K., D.M. and O.B.; writing—review and editing, O.K., D.M. and O.B.; data collection and analysis, D.M. and O.B.; visualization, D.M. and O.B.; project administration, O.K. and D.M. All authors have read and agreed to the published version of the manuscript.
Funding
This research received no external funding.
Conflicts of Interest
The authors declare no conflict of interest.
References
- Marinina, O.; Kirsanova, N.; Nevskaya, M. Circular Economy Models in Industry: Developing a Conceptual Framework. Energies 2022, 15, 9376. [Google Scholar] [CrossRef]
- Ilyushin, Y.V. Development of a Process Control System for the Production of High-Paraffin Oil. Energies 2022, 15, 6462. [Google Scholar] [CrossRef]
- Ilyushin Yury V., Fetisov V. G., Vasiliev G. G., Leonovich I. A., Müller J. -., Riaz. -., Amir M. H. Development of the automated temperature control system of the main gas pipeline Scientifc Reports. 2023. №13. pp. 1-14. [CrossRef]
- Marinina, O.; Tsvetkova, A.; Vasilev, Y.; Komendantova, N.; Parfenova, A. Evaluating the Downstream Development Strategy of Oil Companies: The Case of Rosneft. Resources 2022, 11, 4. [Google Scholar] [CrossRef]
- Dmitrieva, D.; Romasheva, N. Sustainable Development of Oil and Gas Potential of the Arctic and Its Shelf Zone: The Role of Innovations. J. Mar. Sci. Eng. 2020, 8, 1003. [Google Scholar] [CrossRef]
- Dabros, A.; Hammond, H.; Pinzon, J.; Pinno, B.; Langor, D. Edge influence of low-impact seismic lines for oil exploration on upland forest vegetation in northern Alberta (Canada). Forest Ecology and Management 2017, 400, 278–288. [Google Scholar] [CrossRef]
- Khabibullin, R.R. Increasing the resource-saving technology of ground-based seismic exploration in a wooded area - the Green Seismics project / R. R. Khabibullin, I.V. Leontiev, A.L. Krutov // Scientific Journal of the Russian Gas Society. - 2017. – No. 3. – pp. 29-38. – EDN ZGSJBP.
- Yin, Z.; Zhou, Y.; Li, Y. Seismic Exploration Wireless Sensor System Based on Wi-Fi and LTE. Sensors 2020, 20, 1018. [Google Scholar] [CrossRef] [PubMed]
- Romanov, A.I. High-performance seismic surveys of MOGT 3D with combined recording equipment / A. I. Romanov, A.O. Khukharev // Instruments and systems of exploration geophysics. – 2021. – № 2(69). – Pp. 29-38. – EDN WIZLMM.
- Jorgenson, Janet & Ver Hoef, Jay & Jorgenson, M. (2010). Long-term recovery patterns of arctic tundra after winter seismic exploration. Ecological applications: a publication of the Ecological Society of America. 20. 205-21. [CrossRef]
- Ilyinsky, A.A. Analysis of promising areas for the introduction of remote laser sensing technology for the exploration of oil and gas fields / A. A. Ilyinsky, M.A. Ilchenko // SPbPU Science Week: proceedings of a scientific conference with international participation, the best reports, St. Petersburg, November 18-23, 2019. – St. Petersburg: Federal State Autonomous Educational Institution of Higher Education «Peter the Great St. Petersburg Polytechnic University», 2019. – pp. 339-343. – EDN RBBKUK.
- Elizarov, V.V. & Bespalov, Victor & Grishkanich, Aleksandr & Kascheev, S.V. & Konopel’ko, L.A. & Makarov, Evgenii & Ruzankina, Yu.S. & Zhevlakov, A.. (2018). Raman LIDAR with Increased Aperture for Geoecological Monitoring. 290-290. [CrossRef]
- Ruzankina, Iuliia & Elizarov, V & Konopel’ko, L & Zhevlakov, A. & Grishkanich, Aleksandr. (2018). Raman lidar with for geoecological monitoring. Journal of Physics: Conference Series. 1124. 051036. [CrossRef]
- Cherepovitsyn, A.E. Efficiency of using remote methods of environmental monitoring in the Russian Arctic (on the example of NGK productions) / A. E. Cherepovitsyn, D.M. Metkin // The North and the market: the formation of an economic order. – 2020. – № 4(70). – Pp. 126-139. – EDN NHUWPH. [CrossRef]
- Esterhuyse, Surina. (2018). Identifying the risks and opportunities of unconventional oil and gas extraction using the strategic environmental assessment. Current Opinion in Environmental Science & Health. 3. [CrossRef]
- Azqueta, Diego & Delacamara, Gonzalo. (2008). Oil extraction and deforestation: A simulation exercise. Cepal Review. 2008. 57-70. [CrossRef]
- Salter, Edward & Ford, John. (2001). Holistic Environmental Assessment and Offshore Oil Field Exploration and Production. Marine pollution bulletin. 42. 45-58. [CrossRef]
- Cherepovitsyn, Aleksei & Tcvetkov, Pavel & Evseeva, Olga. (2021). Critical analysis of methodological approaches to assessing sustainability of arctic oil and gas projects. Journal of Mining Institute. 249. 463-479. [CrossRef]
- Al-Hawas, Ahmed & Al-Harbi, Fahad & Amminudin, Kamarul. (2023). Small Scale Projects Planning Best Practices in the Oil and Gas Sector. [CrossRef]
- Shabanova, D.N. Adoption of eco-oriented management decisions in oil and gas companies based on a causal model / D. N. Shabanova // Molodaya Neft: Collection of scientific articles of the All-Russian Youth Scientific and Technical Conference of the Oil and gas industry, Krasnoyarsk, May 15-17, 2015 / Responsible for the release: O.P. Kalyakina. – Krasnoyarsk: Siberian Federal University, 2015. – pp. 176-181. – EDN ULNLAT.
- Popescu, C.; Gheorghiu, S.A. Economic Analysis and Generic Algorithm for Optimizing the Investments Decision-Making Process in Oil Field Development. Energies 2021, 14, 6119. [Google Scholar] [CrossRef]
- Filimonova, I.V. Development of theoretical and methodological foundations of geological and economic assessment of hydrocarbon resources / I. V. Filimonova // Resource and institutional conditions for the formation of an innovative economy: a collection of scientific papers / responsible editors: A.V. Alekseev, L.K. Kazantseva; Institute of Economics and Industrial Production Organization of the Siberian Branch of the Russian Academy of Sciences. – Novosibirsk: Publishing House of the Institute of Economics and Industrial Production Organization of the Siberian Branch of the Russian Academy of Sciences, 2015. – pp. 140-157. – EDN UIOMRD.
- Nazarov, V.I. On improving the methodology of geological and economic assessment of oil and gas resources / V. I. Nazarov // Oil and gas Geology. Theory and practice. – 2013. – Vol. 8, No. 3. – S. 12. – EDN PKCQKS.
- Nazarov V.I., & Medvedeva L.V. (2016). Methods of quantitative assessment of factors affecting the efficiency of exploration. Oil and gas geology. Theory and Practice, 11 (2), 16.
- Cherepovitsyn, A.; Metkin, D.; Gladilin, A. An Algorithm of Management Decision-Making Regarding the Feasibility of Investing in Geological Studies of Forecasted Hydrocarbon Resources. Resources 2018, 7, 47. [Google Scholar] [CrossRef]
- Tugan, Murat & Sinayuc, Caglar. (2018). A new fully probabilistic methodology and a software for assessing uncertainties and managing risks in shale gas projects at any maturity stage. Journal of Petroleum Science and Engineering. 168. [CrossRef]
- Appendix 1 to Order No. 417 of the Ministry of Natural Resources of the Russian Federation dated July 7, 2020 «Order on Approval of the Rules for the Use of Forests for Geological Exploration, Exploration and Extraction of Minerals and a List of Cases of forest use for the Purpose of Geological Exploration, exploration and Extraction of minerals without providing a forest plot, with or without the establishment of an easement» // Ministry of Natural Resources and Environment of the Russian Federation (accessed on 9 November 2023) (In Russian).
- Decree of the Government of the Russian Federation dated 05/22/2007 No. 310 (as amended on 11/29/2021) «On the rates of payment for a unit of forest resources and the rates of payment for a unit of area of a forest plot owned by the Federal Government» (accessed on 9 November 2023) (In Russian).
- Metkin, D.M. Improvement of methods for evaluating the effectiveness of oil and gas exploration projects in the northern territories / D. M. Metkin, O.V. Zhukov, A.A. Temnikov // North and market: formation of an economic order. – 2023. – Vol. 26, No. 1(79). – pp. 120-132. – EDN VPOFRQ. [CrossRef]
- Sui, Yang & Ding, Rui & Wang, Hanqing. (2020). A novel approach for occupational health and safety and environment risk assessment for nuclear power plant construction project. Journal of Cleaner Production. 258. 120945. [CrossRef]
- Abdolkhaninezhad, T.; Monavari, M.; Khorasani, N.; Robati, M.; Farsad, F. Analysis Indicators of Health-Safety in the Risk Assessment of Landfill with the Combined Method of Fuzzy Multi-Criteria Decision Making and Bow Tie Model. Sustainability 2022, 14, 15465. [Google Scholar] [CrossRef]
- Weiland, L.; Green-Harrison, T.; Ketcheson, S. The Influence of Seismic Lines on Wildfire Potential in the Boreal Region of Northern Alberta, Canada. Forests 2023, 14, 1574. [Google Scholar] [CrossRef]
- Makov, V.M. Risk assessment of investment projects of an oil company / V. M. Makov // Bulletin of Economics and Management. - 2016. – No. 3. – pp. 44-49. – EDN YKSIPT.
- Mednikov M.D., & Dombrovsky A.V. (2008). Fuzzy multiple analysis in anti-crisis management. π-Economy, (2 (54)), 315-321.
- Resolution of the Government of the Khanty-Mansiysk Autonomous Okrug – Yugra dated October 9, 2013, No. 425-p about the state program Khanty-Mansiysk Autonomous Okrug – Yugra «Development of forestry and timber industry KhantyMmansiysk Autonomous Okrug – Yugra for 2016-2020» (accessed on 15 May 2023) (In Russian).
- State report (Text) — Rosnedra, 2021, SBR of the Russian Federation, data from FSBI Rosgeolfond (accessed on 15 May 2023) (In Russian).
- National environmental rating of the regions of Russia. Russian public organization «Green Patrol». Available online: https://зеленыйпатруль.рф/ (accessed on 19 May 2023). (In Russian).
- Regional statistics, National set of SDG indicators. Federal State Statistics Service. Available online: https://rosstat.gov.ru/ (accessed on 19 May 2023). (In Russian).
- United Nations. Department of Economic and Social Affairs Sustainable Development. Available online: https://sdgs.un.org/goals (accessed on 19 May 2023). (In English).
Figure 1.
Ishikawa diagram for hydrocarbon exploration projects implemented within a forested area [compiled by the authors].
Figure 1.
Ishikawa diagram for hydrocarbon exploration projects implemented within a forested area [compiled by the authors].
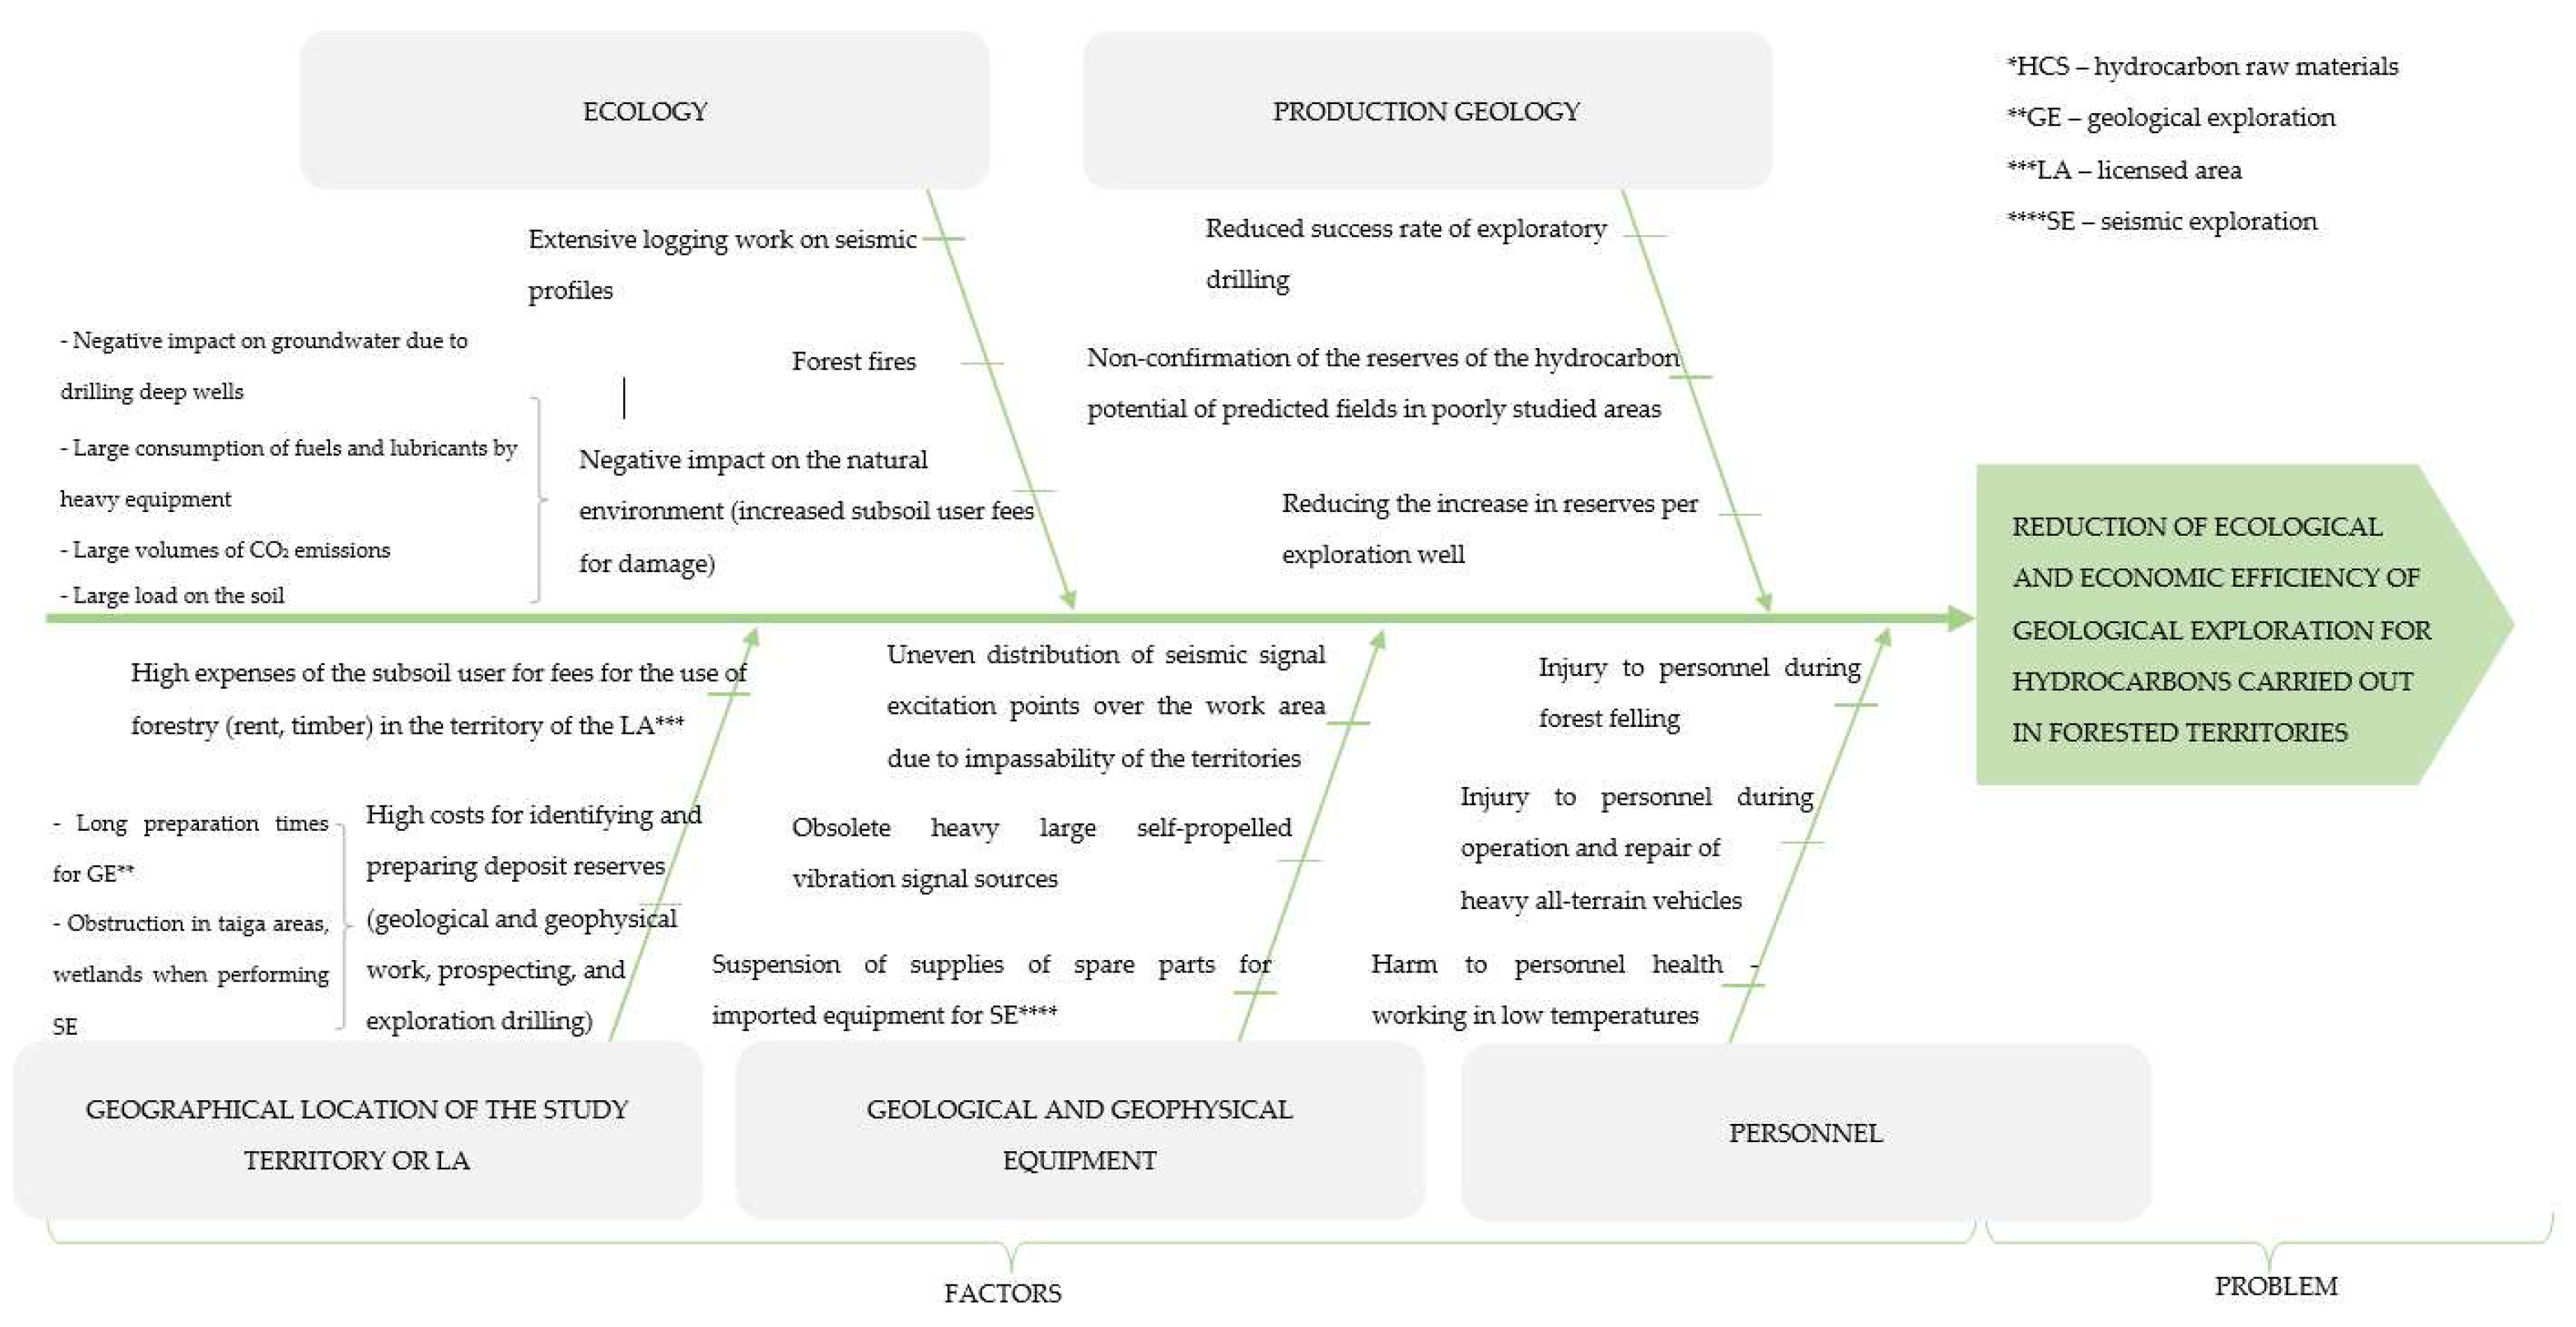
Figure 2.
Algorithm for carrying out calculations to determine indicators of economic efficiency of geological exploration work at sites located in environmentally sensitive areas, considering the expected environmental effects compiled by the authors based on [16,17,19].
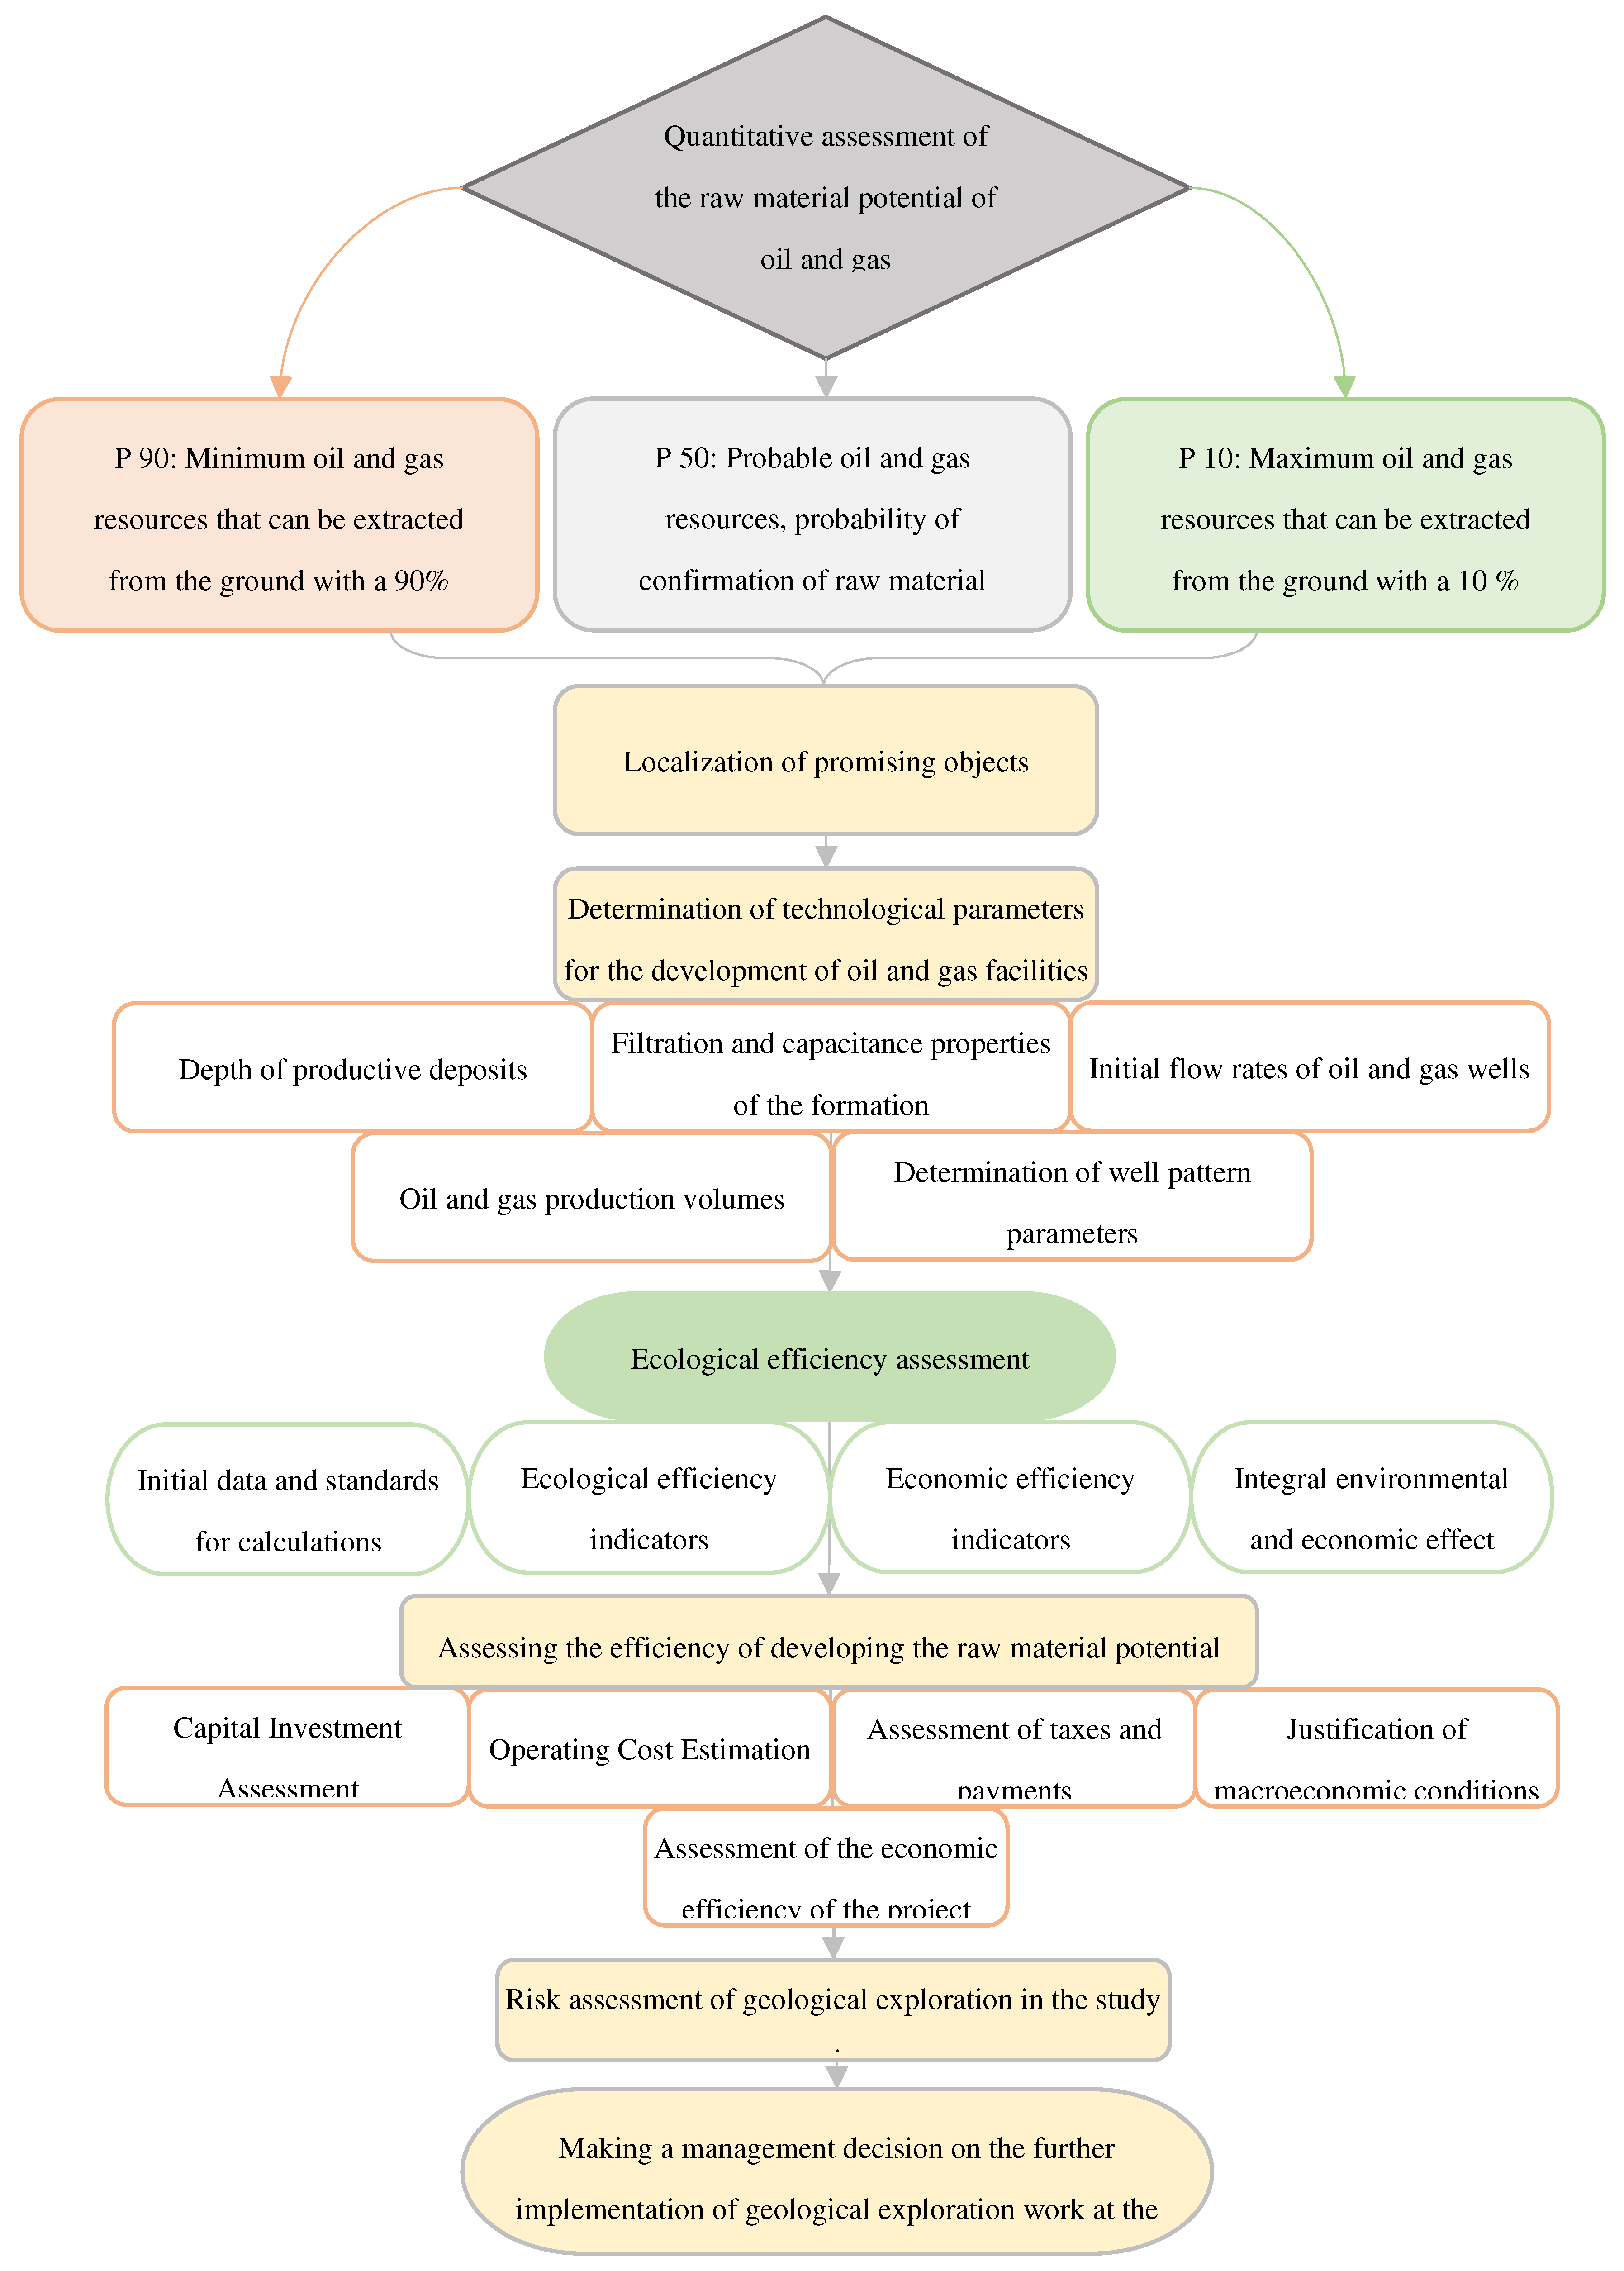
Figure 3.
Heat map of risks when using traditional and resource-saving technologies for geological exploration [compiled by the authors].
Figure 3.
Heat map of risks when using traditional and resource-saving technologies for geological exploration [compiled by the authors].
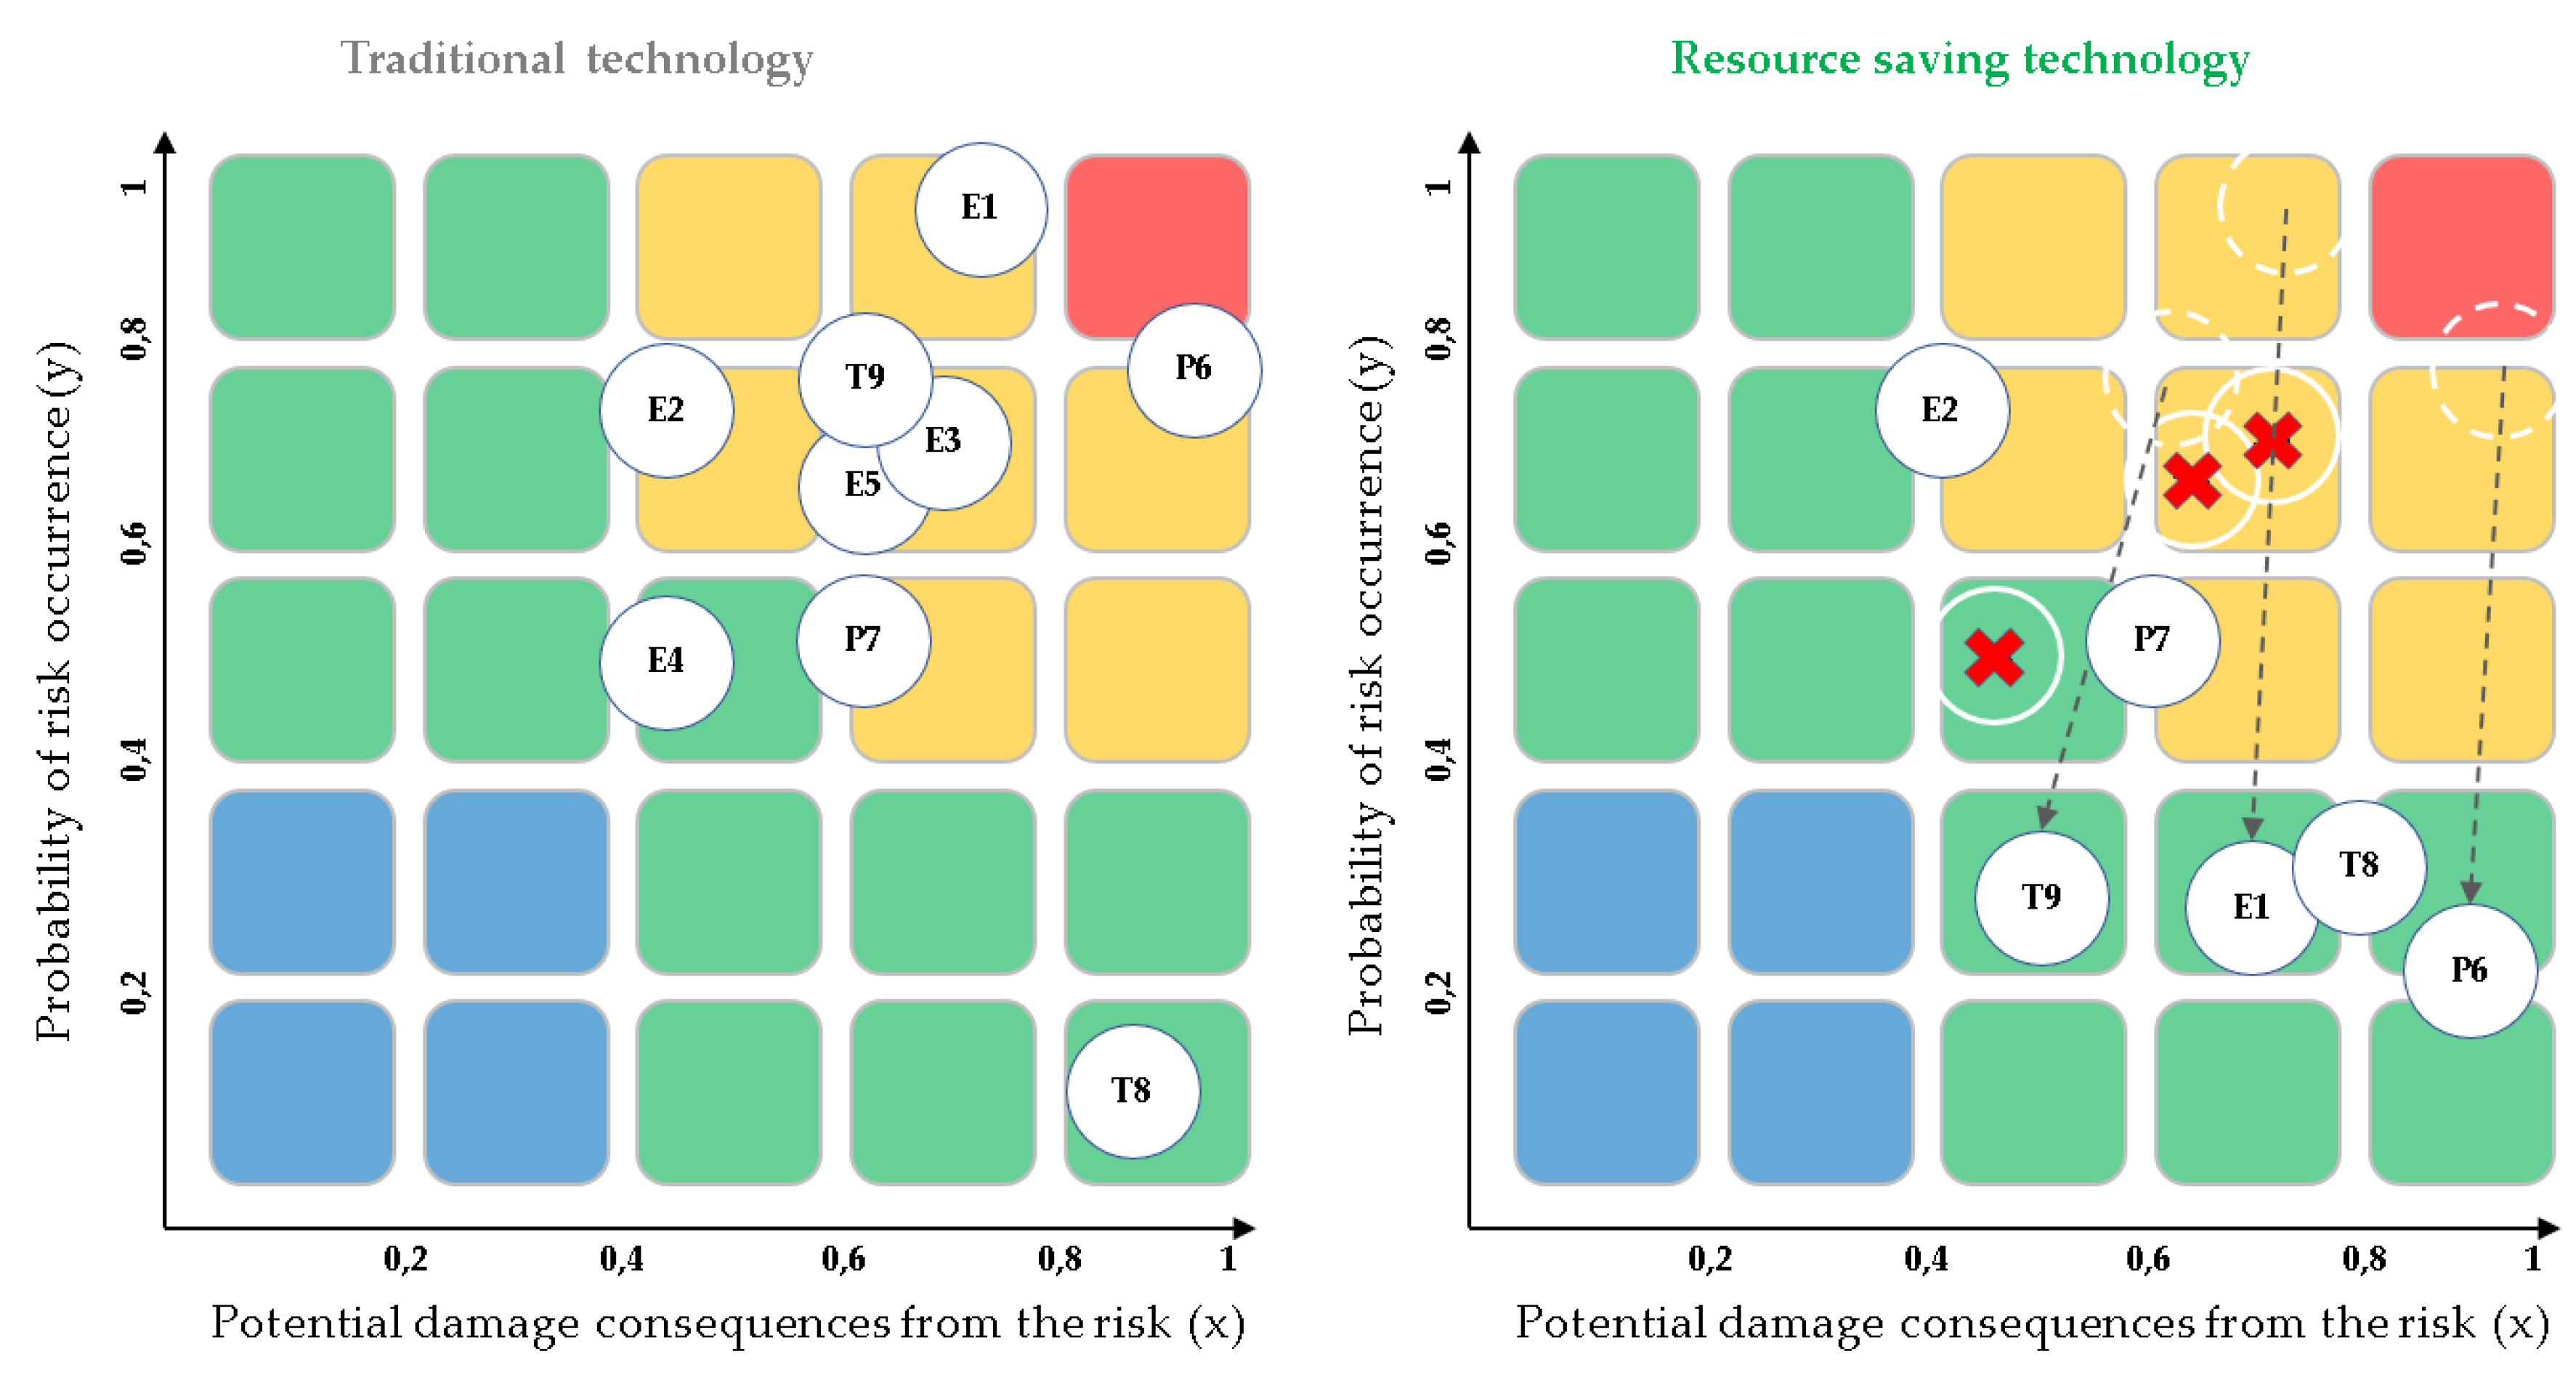

Table 1.
Initial data of the subsoil site where 3D seismic exploration is planned.
| Item No. | Name of the indicator, [units of measure] | Value of the indicator | |
| 1. Ecological and economic indicators for carrying out work on the site | |||
|
Traditional areal seismic survey |
Green seismic survey | ||
| 1.1 | Area of work along the contour of excitation points, [km2] | 304 | |
| 1.2 | Area of work along the contour of reception points, [km2] | 516 | |
| 1.3 | Length of seismic profiles (forest clearings), [km] | 2,180 | |
| 1.4 | Length of crossline profiles, [km] | 350 | 255 |
| 1.5 | Length of inline profiles, [km] | 350 | 255 |
| 1.6 | Profile width, [m] | 4 | 1.5 |
| 1.7 | Rent of forest land, [rub/ha] | 8,813 | |
| 1.8 | Area of forest land, [ha] | 1,761 | 1,286 |
| 1.9 | Volume of cut wood, [m3] | 172,800 | 126,203 |
| 1.10 | Cost of wood, [rub. for 1 m3] | 109 | |
| 1.11 | Average forest density, [pcs/ha] | 2,000 | |
| 1.12 | Degree of forest cover of the territory, [%] | 80 | |
| 1.13 | Area of land subject to reforestation work, [ha] | 1,023 | 747 |
| 1.14 | Cost of reforestation work, [rub/ha] | 470,000 | |
| 2. Characteristics of the raw hydrocarbon potential of the licensed subsoil area | |||
| 2.1 | Volume of predicted resources, [thousand tons] | 720 | |
| 2.2 | Number of prospect wells, [units] | 1 | |
| 2.3 | Prospect well depth, [m] | 2,750 | |
Table 2.
Initial data of the subsoil site where 3D seismic exploration is planned.
| Item No. | Name of the indicator, [units of measure] | Equation | Characteristics of indicators |
|---|---|---|---|
| 1. Ecological efficiency indicators | |||
| 1.1 | Volume of wood [m3] | V1 = V0 – Vrs (1), where V1 is the change in wood volumes; V0 is the volume of wood cut down when using traditional geological exploration technology; Vrs is the volume of wood cut down when using resource-saving technology. |
The indicator characterizes the change in wood volumes that can be achieved because of the use of resource-saving technology for geological exploration in forested areas. |
| 1.2 | Area of forest land within LA [ha] | R1 = R0 – Rrs (2), where R1 is the change in the area of leased forest lands; R0 - area of leased forest land using traditional technology; Rrs is the area of leased forest land using resource-saving technology |
The indicator characterizes the amount of change in leased forests that can be achieved because of the use of resource-saving technology during geological exploration. |
| 1.3 | Scope of reforestation work [ha] | F1 = F0 – Frs (3), where F1 is the change in area for reforestation; F0 - volumes of reforestation work using traditional technology; Frs - volumes of reforestation work using resource-saving technology. |
The indicator characterizes the magnitude of the change in the necessary reforestation work [27] after geological exploration using resource-saving technology. |
| 1.4 | Number of trees [trees] saved | N = D * S * (R0 – Rrs) (4), where N is the number of preserved trees in the study area; D – average forest density (density of forest plantations) (pcs/Ha), determined depending on avg. distances between trees, height and completeness of the forest stand, etc.; S – degree of forest cover of the territory, (%) is determined by the ratio of the forested area of land to the total area of the license area. |
The indicator characterizes the number of trees saved from felling due to a decrease in forest lands during geological exploration using resource-saving technology. |
| 2. Economic efficiency indicators | |||
| 2.1 | Savings from deforestation [RUB] | EV = (R0 – Rrs) * C (5), where C is the cost of cutting down 1 hectare of forest. |
The indicator characterizes the amount of money that a company will save when cutting down forests and carrying out geological exploration work. |
| 2.2 | Savings on forest land rental [RUB] | ER = (R0 – Rrs) * P (6), where P is the price for renting forest land depending on the region of work and is determined in accordance with [28]. |
The indicator characterizes the amount of money that the company will save when renting land for geological exploration. |
| 2.3 | Savings on wood fees monetary units [RUB] | Ew = (V0 – Vrs) * W (7), where W is the cost of wood (rubles per 1 m3) and depends on the type of forest plantation and the distance of its removal, determined in accordance with [22]. |
The indicator characterizes the amount of money that the company will save when determining the payment for felled trees to ensure geological exploration. |
| 2.4 | Savings on reforestation work [RUB] | EF = (F0 – Frs) * R (8), where R is the cost of reforestation work (rubles per 1 hectare) and is determined in accordance with the contract depending on the conditions of the area, its geographical location and type of work. |
The indicator characterizes the amount of money that the company will save when assessing the implementation of reforestation work. |
| 2.5 | Integral economic effect [RUB] | E = EV + ER + Ew + EF (9) |
This indicator shows how much money is saved by using resource-saving technology for geological investigation while still maintaining the natural environment. |
Table 3.
Calculation of savings from the use of resource-saving technology for seismic exploration using the example of a licensed subsoil area located in the Khanty-Mansi Autonomous Okrug.
Table 3.
Calculation of savings from the use of resource-saving technology for seismic exploration using the example of a licensed subsoil area located in the Khanty-Mansi Autonomous Okrug.
| Item | Appraisal | Value | ∆ | Economy [thousand rub] |
|---|---|---|---|---|
| Deforestation [ha] | post-facto | 1,761 | 475 | 47,500 |
| greenfield | 1,286 | |||
| Volume of wood [m3] | post-facto | 172,800 | 46,597 | 5,079 |
| greenfield | 126,203 | |||
| Area of forest land within LA [ha] | post-facto | 1,761 | 475 | 4,174 |
| greenfield | 1,286 | |||
| Scope of reforestation work [ha] | post-facto | 1,023 | 276 | 131,362 |
| greenfield | 747 | |||
| Total savings | 188,115 | |||
Table 4.
Results of technical and economic calculations to determine the effectiveness of seismic exploration work in the licensed area using traditional and resource-saving technologies.
Table 4.
Results of technical and economic calculations to determine the effectiveness of seismic exploration work in the licensed area using traditional and resource-saving technologies.
| Item No. | Name of the indicator | Traditional technology | Resource saving technology | Variation | |
|---|---|---|---|---|---|
| +/- | % | ||||
| 1 | NPV [mio rub] | 320.5 | 327.2 | 6.7 | 1.02 |
| 2 | Internal rate of return [%] | 18.7 | 18.9 | 0.2 | 1.01 |
| 3 | Net Present Value of Returns | 1.46 | 1.50 | 0.04 | 2.74 |
| 4 | Payback period [years] | 4.4 | 4.1 | -0.3 | -6.8 |
| 5 | Expenditure on oil and gas exploration [mio rub] |
592 | 403.9 | -188.1 | -31.8 |
Table 5.
Risks of geological exploration work in forested areas using traditional and resource-saving technologies.
Table 5.
Risks of geological exploration work in forested areas using traditional and resource-saving technologies.
| Sphere of display | Risks | |
|---|---|---|
| Traditional technology | Resource saving technology | |
| 1. Geological risks | 1.1 Reduced success rate of exploratory drilling | |
| 1.2 Unconfirmability of the value of hydrocarbon potential reserves | ||
| 1.3 Geological features of the license area (complex geological structures, obstacles to drilling) | ||
| 1.4 Erroneous interpretation of geological data obtained during research | ||
| 2. Ecological risks | 2.1 Negative impact on the natural environment (deforestation) | |
| 2.2 Forest fires [32] | ||
| 2.3 Increased load on the soil due to the operation of heavy equipment | - | |
| 2.4 Increased CO2 emissions | - | |
| 2.5 Impact on surface and groundwater | - | |
| 3. Production risks | 3.1 Injury to personnel during topographic and geodetic work, incl. felling | |
| 3.2 Personnel health (working in low temperatures) | ||
| 4. Technological risks | 4.1 Unreliability of technology during geological exploration due to equipment failure | |
| 4.2 Technical risks associated with the operation of transport and technical equipment in impassable taiga, under difficult weather conditions | ||
| 5. Economic risks | 5.1 Reducing the volume of seismic exploration while reducing the cost of hydrocarbons on the market | |
| 5 2 Delays in work completion, equipment downtime | ||
| 5.3 High volumes of investment in equipment production | ||
Table 6.
Matrix of the degree of probability of risks occurring and their impact on the result of geological exploration work.
Table 6.
Matrix of the degree of probability of risks occurring and their impact on the result of geological exploration work.
| Probability of a risk event (y) | The degree of influence of the risk event on the project (x) | ||
| Weak (0–0.4) |
Medium (0.4–0.8) | Strong (>0.8) | |
| High (>0.8) | Medium | High | Critical |
| Medium (0.4–0.8) | Medium | High | High |
| Low (0–0.4) | Low | Medium | Medium |
Table 7.
Resulting risk assessment indicators when using traditional and resource-saving technologies for seismic exploration in the licensed area.
Table 7.
Resulting risk assessment indicators when using traditional and resource-saving technologies for seismic exploration in the licensed area.
| Name of risks | Traditional technology | Resource saving technology | ||||
| Potential damage consequences from the risk (x) | Probability of risk occurrence (y) | Potential damage consequences from the risk (x) | Probability of risk occurrence (y) | |||
| Ecology | E1 | Negative impact on the natural environment (deforestation) | 0.75 | 0.97 | 0.73 | 0.25 |
| E2 | Forest fires | 0.42 | 0.75 | 0.40 | 0.75 | |
| E3 | Increased load on the soil due to the operation of heavy equipment | 0.71 | 0.73 | - | - | |
| E4 | Increased CO2 emissions | 0.42 | 0.51 | - | - | |
| E5 | Impact on surface and groundwater | 0.63 | 0.67 | - | - | |
| Production | P6 | Injury to personnel during topographic and geodetic work, incl. felling | 0.96 | 0.79 | 0.93 | 0.20 |
| P7 | Personnel health (working in low temperatures) | 0.63 | 0.57 | 0.60 | 0.57 | |
| Technology | T8 | Unreliability of technology during geological exploration due to equipment failure | 0.88 | 0.10 | 0.80 | 0.31 |
| T9 | Technical risks associated with the operation of transport and technical equipment in impassable taiga, under difficult weather conditions | 0.63 | 0.78 | 0.53 | 0.24 | |
Table 8.
Indicators for assessing the environmental risk of the region for geological exploration for hydrocarbon raw materials [38,39].
| Ecology | ||||
| x1 | x2 | x3 | x4 | |
| Region/Indicator | Environmental rating (qualitative indicator) | Ratio of the area of reforestation and afforestation to the area of cut down and dead forest plantations [%] | Emissions of pollutants into the atmospheric air from stationary sources [thousands. tons] | Expenses on environmental protection [mio rub] |
| KHMAO-Yugra | 50.00 | 73.00 | 1,142.00 | 29,896.00 |
| Maximum value for Russia | 76.00 | 1,657.80 | 2,540.00 | 55,661.00 |
| Minimum value for Russia | 43.00 | 23.60 | 2.00 | 63.00 |
Table 9.
Normalized values of variables xi.
| Factor | Value of xii | Normalized value of xii |
|---|---|---|
| x1 | 50.00 | 0.212 |
| x2 | 73.00 | 0.970 |
| x3 | 1,142.00 | 0.449 |
| x4 | 29,896.00 | 0.463 |
Table 10.
Classification of the level of factors xi and general risk.
| Range of values, x (y) | Membership function | |
|---|---|---|
| 0<= x (y) <=0.167 | X1, Y1 (Very low) | 1 |
| 0.167<x (y) <0.333 | X1, Y1 | µ1 |
| X2, Y2 (Low) | 1-µ1 = µ2 | |
| 0.333<= x (y) <0.5 | X2, Y2 | µ2 |
| X3, Y3 (Average) | 1-µ2 = µ3 | |
| 0.5<= x (y) <0.667 | X3, Y3 | µ3 |
| X4, Y4 (High) | 1-µ3 = µ4 | |
| 0.667< x (y) <0.833 | X4, Y4 | µ4 |
| X5, Y5 (Very high) | 1-µ4 = µ5 | |
| 0.833< x (y) <=1 | X5, Y5 | 1 |
Table 11.
Matrix of risk level values for the region under study.
| Factor | Subset scale | Significance level | ||||
| very low | low | average | high | very high | ||
| x1 | 0.72 | 0.28 | 0.1 | |||
| x2 | 1 | 0.4 | ||||
| x3 | 0.30 | 0.70 | 0.2 | |||
| x4 | 0.22 | 0.78 | 0.3 | |||
| classificator level | 5 | 4 | 3 | 2 | 1 | |
Table 12.
Matrix of weighted values of factors and integral risk.
| Factor | Subset scale (weighted) | ||||
| very low | low | average | high | very high | |
| x1 | 0.07 | 0.03 | - | - | - |
| x2 | - | - | - | - | 0.40 |
| x3 | - | 0.06 | 0.14 | - | - |
| x4 | - | 0.07 | 0.23 | - | - |
| Sum | 0.07 | 0.15 | 0.37 | - | 0.40 |
| nodal points | 0.165 | 0.332 | 0.499 | 0.666 | 0.833 |
| y | 0.012 | 0.051 | 0.186 | - | 0.333 |
| y integral | 0.583 | ||||
Table 13.
Fuzzy value scale for assessing the risk of the study region during geological exploration [compiled by the authors].
Table 13.
Fuzzy value scale for assessing the risk of the study region during geological exploration [compiled by the authors].
| Set of y values | Level of risk | Description |
| 0.000-0.333 | Very low level | - the highest level of environmental friendliness of the region: high level of novelty of environmental projects, activity of public organizations, absence of environmental incidents; - large volumes of reforestation work in the region, exceeding the figures for cut down plantings; - carrying out special programs for afforestation in the region; - virtually no CO2 emissions; - serious volumes of investments aimed at environmental protection and rational use of natural resources from local and federal budgets. |
| 0.167-0.500 | Low level | - the intensity of the processes of creation, implementation and practical use of environmental innovations in the region is above the national average; - afforestation and reforestation cover more than the area of the dead forest; - low level of CO2 emissions; - environmental protection costs in the region are significantly higher than the Russian average. |
| 0.333-0.667 | Medium level | - average social and environmental indicators for Russia; - the reforestation area is equal to the clearing area; - greenhouse gas emissions are normal and do not exceed the average for Russia; - funds are spent annually on environmental protection, but do not adequately cover damage from negative impacts. |
| 0.500-0.833 | High level | - reforestation work does not cover the full volume of cut down and dead forest plantations; - CO2 emissions meet the standards, but are higher than the national average; - innovative environmental projects are rarely implemented in the region, and there is little activity in environmental protection measures; - insignificant investments of companies and budgets of various levels in the restoration and protection of the natural environment. |
| 0.667-1.000 | Very high level | - low state of ecology in the subject: environmentally significant events, incidents and problems; - there are no reforestation works; - high greenhouse gas emissions; - there are practically no investments in environmental protection from the budgets of the region and the Russian Federation. |
Disclaimer/Publisher’s Note: The statements, opinions and data contained in all publications are solely those of the individual author(s) and contributor(s) and not of MDPI and/or the editor(s). MDPI and/or the editor(s) disclaim responsibility for any injury to people or property resulting from any ideas, methods, instructions or products referred to in the content. |
© 2023 by the authors. Licensee MDPI, Basel, Switzerland. This article is an open access article distributed under the terms and conditions of the Creative Commons Attribution (CC BY) license (http://creativecommons.org/licenses/by/4.0/).
Copyright: This open access article is published under a Creative Commons CC BY 4.0 license, which permit the free download, distribution, and reuse, provided that the author and preprint are cited in any reuse.


