Submitted:
17 December 2023
Posted:
18 December 2023
You are already at the latest version
Abstract
Breast cancer is a global health concern, necessitating continuous advancements in diagnostic medical imaging technologies for early detection and improvement of treatment. This paper presents an overview of the past, present and future of breast cancer imaging using light and some results from the current studies. The paper specifically presents the role of Diffuse Optical Tomography (DOT) in breast cancer imaging. Conventional methods, such as X-ray mammography, face limitations. Diffuse Optical Tomography, a non-invasive light-based imaging modality can provide quantitative descriptive and architectural information about breast tissue. The paper discusses the key challenges and recent developments in breast cancer imaging using DOT to overcome some key challenges. This paper aims to contribute to the understanding of the evolving technological landscape in breast cancer imaging using light for improving early detection and patient outcomes.
Keywords:
breast cancer
; medical imaging
; light
; diffuse optical tomography
; spectroscopy
; fNIRS
1. Introduction to Breast Cancer
There were more than 42,000 women who died from breast cancer in the year 2019 in the United States alone. This makes breast cancer one of the most common cancers among women. In most urban populations, breast cancer is the leading cause of cancer [1]. Women’s cancer registries show that 19.4% of all cancers were breast cancers. The majority of breast cancer cases occur among women older than 50, but 32% of those diagnosed were under 50. Most invasive cases (approximately 80%) occur after 50 years of age, but the chances are increasing in women who are less than 50 years old. About 9% of all newly diagnosed breast cancer cases were found in women younger than 45 years of age in the United States. In addition to an early onset of menarche at a young age, a late onset of menopause, the first full-term pregnancy following the age of 30, a mother or sister who has been diagnosed with premenopausal breast cancer or someone who has experienced breast cancer or benign proliferative breast disease as a personal history can contribute to an increased risk of breast cancer.
Higher breast cancer risk has also been associated with obesity, nulliparity, and urban residence. The overall breast cancer mortality rate has been declining steadily since the early 1990s despite an increase in breast cancer diagnoses. The survival rate can vary between 45% and 95% based on the size of the tumor and lymph node involvement. Among the main problems with breasts are their size, texture, composition, and age variation. Patients feel a breast lump when signs and symptoms of breast cancer have appeared (usually without pain) [2]. Breast discharge, scaliness, ulceration, and retraction are other symptoms that may occur. Pain in the breast is often caused by benign conditions and does not always indicate breast cancer [2].
1.1. Ancient
The etiology of breast masses varies from benign to malignant. Invasive ductal carcinoma is the most common malignancy in the breast, while fibroadenoma is the most common benign cancer. Even though modern diagnostic tools are relatively effective and are capable of assessing breast cancer in a timely manner, the disease is by no means a newly discovered one. The first known written description of a breast tumor was found in an ancient Egyptian manuscript originated sometime between 3,000 BCE and 1,500 BCE. Radical mastectomy was introduced as the treatment of choice for breast cancer [3]. It was in 1757, when Henri François Le Dran’s discovered that cancer could spread from the breast to the axillary lymph nodes under the arm. There was a significant improvement in the understanding of cancer biology among physicians at this time. It was realized that proper treatment for breast cancer required the removal of both the diseased tissue and the healthy tissue surrounding it. Later in the twentieth century, X-rays and radiation led to better detection and treatment of breast cancer using light.
2. Breast Cancer Imaging using Light
2.1. Brief History
In 1929, shadowgraphs of breast tissue were referred to as diaphanography, which allowed optical characterization of the breast [4]. Cutler proposed using light to detect breast tumors. Diaphanography is used to differentiate between solid tumors and cysts in the breast. However, Cutler found it difficult to achieve the required light intensity without causing the patient’s skin to become too hot. As a result, the technique was temporarily abandoned by researchers in the 1930s and 1940s. Gros et al. [5] reported in 1972 that they had been able to distinguish benign lesions from malignant lesions through the use of light. In order to describe the transillumination process, they coined the term diaphanography. According to a study conducted by Ohlsson et al. [6], adding infrared wavelengths and taking pictures of the transilluminated breast with an infrared-sensitive film greatly improved their ability to spot cancer. In the early 1980s, the transillumination measurements were renewed using light at wavelengths that have low tissue absorption (600 to 1300 nm) [7,8,9]. As a result of the large distribution of photon pathways through breast tissue, spectroscopic information was distorted and optical images were blurred due to the high degree of scattering. As the result of a study conducted in 1990 [10], it was concluded that the method showed a lower level of accuracy than conventional methods. Due to the difficulty in separating absorption from scattering within the tissue and the inability to reconstruct the image from the two-dimensional photographic data. Diaphanography has not been highly regarded as a method for diagnosing breast cancer.
2.2. Current State
As of now, X-ray mammography serves as the most reliable clinical tool for screening and diagnosing breast cancer. Studies have confirmed that mammography can increase the breast cancer survival rate through population-wide screening efforts, making it an established modality for breast imaging for the early detection of breast cancer. Beginning in the 1960s, these studies paved the way for mammography in the 1980s. Among the most significant advancements in breast imaging over the last few decades have been improvements in the quality of the examination, reporting, and interpretation of mammography studies [11,12]. In older women, X-ray mammography can be very effective for detecting abnormalities in the breast because it offers high resolution. This population is estimated to have between 85%-90% of breast cancer tumors [13]. However, X-ray mammography has a low positive predictive rate. A biopsy is typically performed on benign tumors 60% to 85% of the time [14]. 80% of women who undergo a biopsy after an abnormal X-ray mammogram is detected by a screening practice, are cancer-free [15].
When it comes to dense breast tissue, X-ray methods produce a lower sensitivity compared to other methods and also have the risk of inducing cancer as they expose the patient to ionizing radiation [9]. In addition, the method cannot accurately distinguish between benign and malignant tumors. Post-menopausal women may experience increased mammographic density due to hormone replacement therapy [16] or cyclically during their menstrual cycles [17]; this can reduce the effectiveness of mammographic screening. Other diagnostic techniques such as positron emission tomography, magnetic resonance imaging, ultrasound, and thermography have been developed. These techniques are available today, but there are a number of limitations such as cost, throughput limit, specificity limit (MRI), and sensitivity limit (ultrasound). The positron emission tomography technique is a promising tool for assessing the metabolic demands of tissue. However, it does require the use of radionuclides that are exogenous to the tissue and it cannot take into account thermal changes among tissues.
A non-invasive imaging method that can provide both structural and functional information is therefore needed, preferably in real-time. It is necessary to develop a technique that will be able to detect, localize, and characterize hidden objects within biological media. This will be done without altering the surrounding medium in any way. The near-infrared (NIR) light-based optical imaging modality could provide an answer to all of these questions and may be able to satisfy all these requirements [18,19,19]. Compared to positron emission tomography and magnetic resonance imaging, optical imaging holds significant appeal as an alternative tool for mammography since it uses non-ionizing radiation (allowing continuous or repeated exposure), is non-invasive, does not require contrast agents to be injected, is relatively portable, and is economically feasible in comparison to other imaging methods. The optical methods disclose unique spectroscopic characteristics of tissues that are not detectable with the other methods listed above. Also, these techniques are capable of providing quantitative measurements, as well as functional data about tissues, which can be used for further analysis. While projection light imaging was investigated as early as 1929 [4], non-ionizing light tomography is a relatively new and active field of research. There is usually a difference between the optical properties of normal tissues and those of diseased tissues. Measurements of optical properties can therefore be used to detect breast cancer. As a result of the significant architectural changes that occur in cancerous tissues both at the cellular and subcellular levels, it is not surprising that optical property differences can be found. Furthermore, the cellular components responsible for elastic scattering typically have dimensions between the visible and near-infrared wavelengths. Vascularization of some tumors causes increased light absorption caused by increased blood flow. To enhance the optical contrast between normal and abnormal tissues, optical contrast agents may also be used. Optical imaging provides sensitive signatures for early cancer detection and monitoring due to the fact that optical information depends on the molecular conformation of biological tissues. It is natural to use optical imaging as an adjunct to mammography or ultrasound imaging. This is because the information that is gained from the optical signal is distinct from that of other imaging systems.
3. Optical Medical Imaging
The development of optical medical imaging over the last century has made it easier for modern medicine to acquire high-density data, with a much higher degree of precision, less prone to errors, and with a broader range of source-detector combinations and wavelengths than it used to be. Light is a term used to refer to wavelengths in the infrared, visible, and ultraviolet ranges. A wide variety of physical processes and physical properties within the human body have been investigated, measured, and recorded since the description of light by Maxwell in the 1800s as electromagnetic wave propagation by the scientific community.
Three-dimensional reconstruction uses more sophisticated techniques and incorporates prior information with a much higher degree of precision while compensating for specific sources of measurement error that cannot be avoided. The X-ray was discovered by Wilhelm Conrad Roentgen in November 1895. There is no doubt that clinical motivation played a significant role in this development. In the development of a number of valuable medical diagnostic imaging tools, parameter recovery based on radiation information has played a key role. As a result of the discovery of X-ray, the scope of medical technology has continuously been widened due to the fact that it allows the patient to see inside the body without penetrating it. However, it does so using electromagnetic or particle radiation, rather than a scalpel. Ultrasounds, magnetic resonance imaging (MRI), and positron emission tomography (PET) are examples of computer-assisted tomography.
3.1. Advantages of Optical Imaging
- Since the opticl radiation is noninvasive and non-ionizing, small, repeatable doses can be used repeatedly without harming the patient. As a result, routine screenings and continuous bedside monitoring can be accomplished using radiation.
- Due to their different absorption and scatter characteristics at NIR wavelengths, optical methods have the potential to differentiate soft tissues that are indistinguishable by other techniques.
- With optical imaging, information can be gained about the function of the tissue at the molecular level as well as at the submicroscopic structural level.
- It is possible to determine functional information about oxygen partial pressure, as well as the concentration of deoxyhemoglobin and oxyhemoglobin as a result of specific absorption by chromophores, such as oxy- and deoxyhemoglobin.
- Aside from being inexpensive and portable, optical tomography in intensive care units is much more convenient than computed tomography (CT) or magnetic resonance imaging (MRI).
4. Diffuse Optical Tomography
Diffuse optical tomography (DOT) is an example of an optical medical imaging modality that can be applied to image breasts [20,21]. DOT uses near-infrared (NIR) light to image the inner anatomical maps and functional information of tissue. DOT works by measuring the NIR light transmitted or reflected from tissues to determine their optical properties inside tissue. The system employs a model-based image reconstruction technique and can also calculate hemoglobin concentrations, water concentrations, and lipid concentrations within tissues. As the DOT instrumentation uses multiple light sources and detectors, hence, multiplexing techniques [22] are required for high-speed light and detector switching and system calibration to correct measurement errors in the system [23]. In optical tomographic images, the optical properties profile of the tissue can be reconstructed from the optical measurement data. In DOT tissue is irradiated with safe NIR illumination at various locations. The scattered light at the boundary is measured at a few locations, and then an image reconstruction model is used to form images localizing the optical properties of the tissue. The mathematical model of the derivation of the spatial distribution of tissue from the measured data at the tissue boundary is known as the inverse problem. A major advantage of DOT is that it can provide functional images of tissue since the wavelength-dependent light absorption by tissue constituents can be measured using more than one wavelength of light in the nonionizing NIR range (600-1000 nm) [19]. Brain imaging and breast imaging are DOT’s main applications.
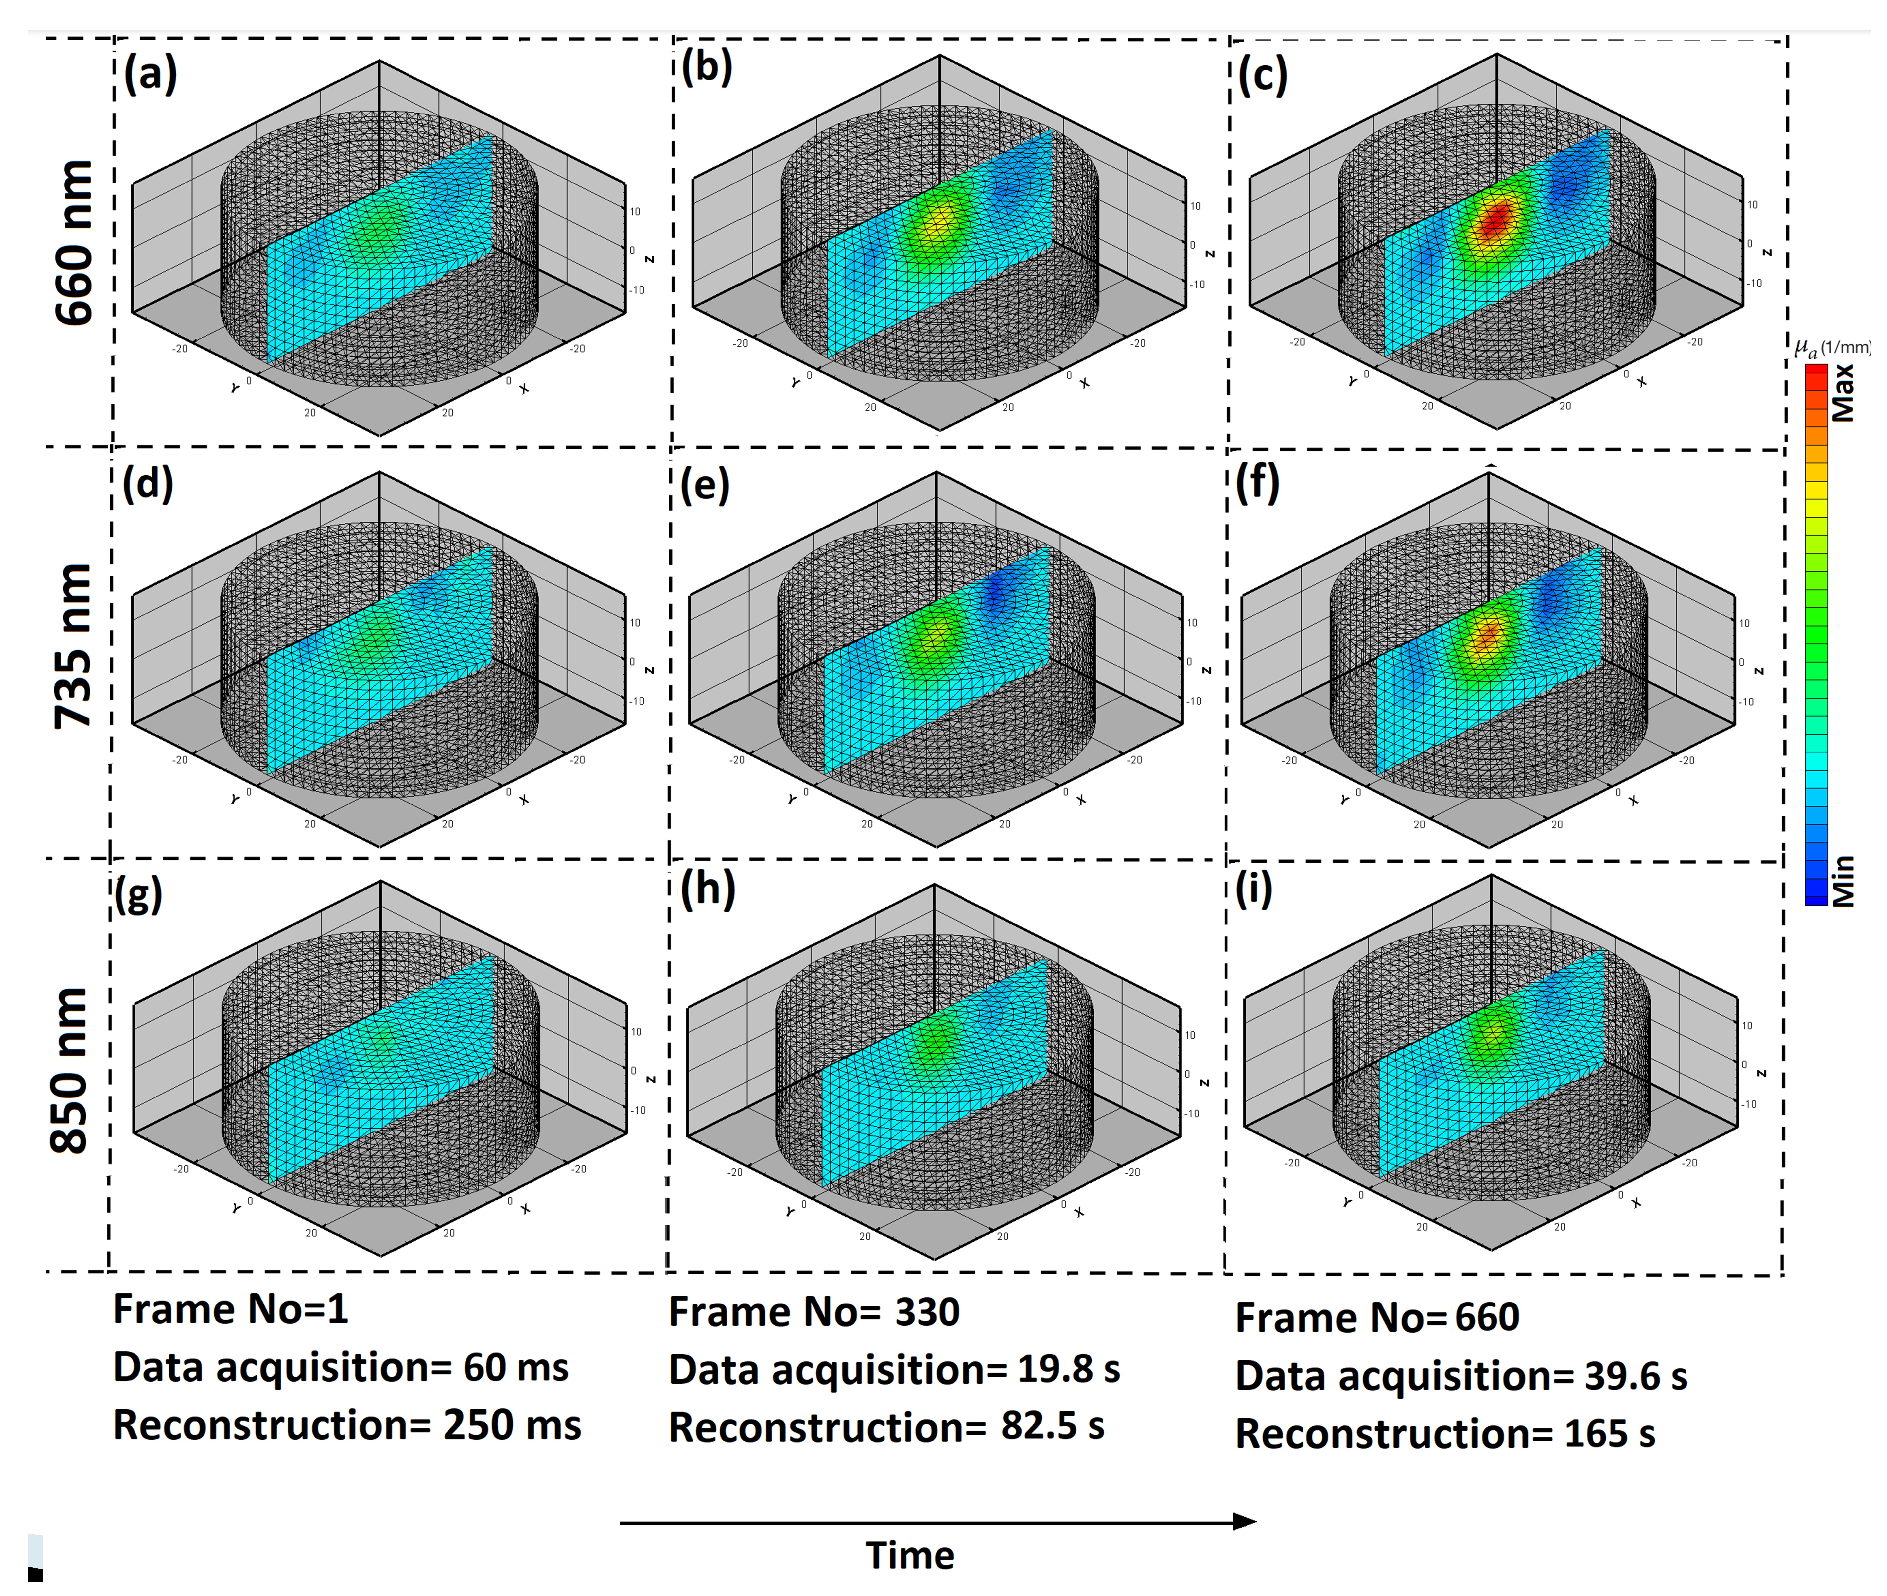
In advanced DOT instrument, raw 3D measurement data is continuously collected, for example after every 60 ms and the 3D spectroscopic image reconstruction is also simultaneously performed. There could be a lagging in image reconstruction or rate of image reconstruction could be different than the data acquisition rate, for example 250 ms to reconstruct per measurement cycle. Some instrument allow circular probe [Figure 2] for continuous spectroscopic imaging [24]. These advanced systems combine the spectroscopic images with extinction coefficients, in order to produce 3D functional images of tissue as shown in the Figure 3.
Simple imaging methods based on DOT include functional near-infrared spectroscopy (fNIRS). In fNIRS channel-wise measurements instead of fully tomographic image reconstruction occur [25]. There’s a lot of use of fNIRS for brain imaging, for example, to measure mental workload [26,27,28,29], measure mental stress [30], and neurofeedback [31]. It’s relatively easier to build an fNIRS system [32,33,34] than DOT. A patch for brain imaging was also shown [32,34]. However, the signal quality depends on the design of the light sources and detectors, known as optodes [35]. There is also a great deal of research on portable fNIRS systems [36,37]. An fNIRS system was also developed using Internet-of-Things technology [38,39,38]. Furthermore, machine learning can be applied to fNIRS in real-time to enable the automatic classification of brain function [28,40,41].
4.1. Challenges
In the case of DOT, there is a challenge in the estimation of internal optical properties of tissue using measurements on the tissue boundary [20,42]. Due to highly scattering of NIR light throughout the tissue, the estimation problem (known as inverse problem) is nonlinear, ill-posed, and sometimes underdetermined [20]. There are, however, algorithms [Figure 1] for reconstructing 3D DOT images at high speeds [43]. Recently, a semi-analytical method for DOT image reconstruction was also proposed [44]. For faster image reconstruction, GPUs were used [45]. Real-time imaging of DOT is also possible using GPUs [46]. New instrument for scanning a specific region of the tissue for high-speed tissue imaging was proposed [47,48]. The DOT instruments are big and data collection is slow. Researchers are working to reduce instrument costs by implementing LEDs and photodetectors [49,50,51]. DOT can also be used as an imaging system at point-of-care [37,52,53]. Some of the systems are developed to teach students how optical medical imaging system works [54]. While collecting data, noise from the top of the tissue is introduced to the signal of interest (signal from deep tissue). A practical method based on the measurements of superficial noise and subtracting the noise from the measurements shown to be effective [55]. As of right now, research in this field is expanding rapidly. It has been shown that NIR light is capable of being used in medical imaging in order to detect breast cancer at an early stage and to image the brain function.
4.2. Discussion and Conclusion
While technological advances have been made in various aspects of DOT, the issue of photon scattering within breast tissue remains a significant obstacle, affecting the accuracy of image reconstruction and limiting the effectiveness of DOT. Some of the issues are related to the signal-to-noise ratio, depth penetration, and the trade-off between spatial and temporal resolution. Furthermore, the breast tissue composition limits the spatial resolution and accuracy. The practical challenges involved with implementing DOT in clinical settings, including simplification of protocols, integration with other imaging modalities, and the need for reliable validation through large-scale clinical trials. This paper aims to contribute to the ongoing light-based breast cancer imaging technologies, supporting the identification of key areas for improvement and innovation in the application of Diffuse Optical Tomography for breast cancer diagnosis and monitoring.
References
- Basic Information About Breast Cancer | CDC.
- Boyd, N.F.; Jensen, H.M.; Cooke, G.; Han, H.L.; Lockwood, G.A. Mammographic densities and the prevalence and incidence of histological types of benign breast disease. European Journal of Cancer Prevention 2000, 9, 15–24. [Google Scholar] [CrossRef]
- Freeman, M.D.; Gopman, J.M.; Salzberg, C.A. The evolution of mastectomy surgical technique: from mutilation to medicine. Gland Surgery 2018, 7, 308. [Google Scholar] [CrossRef]
- Cutler, M. Transillumination as an aid in the diagnosis of breast lesions. Surgery, gynecology and obstetrics 1929, 48, 721–729. [Google Scholar]
- Gros, C.M.; Quenneville, Y.; Hummel, Y. Diaphanologie mammaire. J. Radiol. Electrol. Med. Nucl 1972, 53, 297–302. [Google Scholar]
- Ohlsson, B.; Gundersen, J.; Nilsson, D.M. Diaphanography: a method for evaluation of the female breast. World journal of surgery 1980, 4, 701–706. [Google Scholar] [CrossRef]
- Bartrum, R.J.; Crow, H.C. Transillumination lightscanning to diagnose breast cancer: a feasibility study. American Journal of Roentgenology 1984, 142, 409–414. [Google Scholar] [CrossRef] [PubMed]
- Gisvold, J.J.; Brown, L.R.; Swee, R.G.; Raygor, D.J.; Dickerson, N.; Ranfranz, M.K. Comparison of mammography and transillumination light scanning in the detection of breast lesions. AJR. American journal of roentgenology 1986, 147, 191–194. [Google Scholar] [CrossRef]
- Homer, M.J. Breast imaging: pitfalls, controversies, and some practical thoughts. Radiologic clinics of North America 1985, 23, 459–472. [Google Scholar] [CrossRef]
- Alveryd, A.; Andersson, I.; Aspegren, K.; Balldin, G.; Bjurstam, N.; Edström, G.; Fagerberg, G.; Glas, U.; Jarlman, O.; Larsson, S.A. Lightscanning versus mammography for the detection of breast cancer in screening and clinical practice. A Swedish multicenter study. Cancer 1990, 65, 1671–1677. [Google Scholar] [CrossRef]
- Heck, L.; Herzen, J. Recent advances in X-ray imaging of breast tissue: From two- to three-dimensional imaging. Physica Medica 2020, 79, 69–79. [Google Scholar] [CrossRef]
- Leichter, I.; Buchbinder, S.; Bamberger, P.; Novak, B.; Fields, S.; Lederman, R. Quantitative characterization of mass lesions on digitized mammograms for computer-assisted diagnosis. Investigative radiology 2000, 35, 366–372. [Google Scholar] [CrossRef]
- Baker, L.H. Breast Cancer Detection Demonstration Project: five-year summary report. CA: a cancer journal for clinicians 1982, 32, 194–225. [Google Scholar] [CrossRef]
- Hall, F.M.; Storella, J.M.; Silverstone, D.Z.; Wyshak, G. Nonpalpable breast lesions: recommendations for biopsy based on suspicion of carcinoma at mammography. Radiology 1988, 167, 353–358. [Google Scholar] [CrossRef]
- Poplack, S.P.; Tosteson, A.N.; Grove, M.R.; Wells, W.A.; Carney, P.A. Mammography in 53,803 women from the New Hampshire mammography network. Radiology 2000, 217, 832–840. [Google Scholar] [CrossRef]
- Baines, C.J.; Dayan, R. A tangled web: factors likely to affect the efficacy of screening mammography. Journal of the National Cancer Institute 1999, 91, 833–838. [Google Scholar] [CrossRef]
- White, E.; Velentgas, P.; Mandelson, M.T.; Lehman, C.D.; Elmore, J.G.; Porter, P.; Yasui, Y.; Taplin, S.H. Variation in mammographic breast density by time in menstrual cycle among women aged 40-49 years. Journal of the National Cancer Institute 1998, 90, 906–910. [Google Scholar] [CrossRef]
- Hebden, J.C.; Arridge, S.R.; Delpy, D.T. Optical imaging in medicine: I. Experimental techniques. Physics in medicine and biology 1997, 42, 825–840. [Google Scholar] [CrossRef]
- Gibson, A.P.; Hebden, J.C.; Arridge, S.R. Recent advances in diffuse optical imaging. Physics in Medicine and Biology 2005, 50, R1. [Google Scholar] [CrossRef]
- Arridge, S.R. Optical tomography in medical imaging. Inverse Problems 1999, 15, R41. [Google Scholar] [CrossRef]
- Saikia, M.J. Design and development of a functional diffuse optical tomography probe for real-time 3D imaging of tissue. SPIE, 2021, Vol. 11639, pp. 213–218. [CrossRef]
- Poorna, R.; Kanhirodan, R.; Saikia, M.J. Square-waves for frequency multiplexing for fully parallel 3D diffuse optical tomography measurement. SPIE, 2021, Vol. 11639, pp. 219–226. [CrossRef]
- Saikia, M.J. An embedded system based digital onboard hardware calibration for low-cost functional diffuse optical tomography system. SPIE, 2021, Vol. 11632, pp. 1–8. [CrossRef]
- Saikia, M.J. A Spectroscopic Diffuse Optical Tomography System for the Continuous 3-D Functional Imaging of Tissue - A Phantom Study. IEEE Transactions on Instrumentation and Measurement 2021, 70. [Google Scholar] [CrossRef]
- Cai, Z.; Machado, A.; Chowdhury, R.A.; Spilkin, A.; Vincent, T.; Ümit Aydin.; Pellegrino, G.; Lina, J.M.; Grova, C. Diffuse optical reconstructions of functional near infrared spectroscopy data using maximum entropy on the mean. Scientific Reports 2022 12:1 2022, 12, 1–18. [CrossRef]
- Saikia, M.J.; Besio, W.G.; Mankodiya, K. The Validation of a Portable Functional NIRS System for Assessing Mental Workload. Sensors 2021, 21, 3810. [Google Scholar] [CrossRef] [PubMed]
- Ali, J.; Cody, J.; Maldonado, Y.; Ramakrishna, H. Near-Infrared Spectroscopy (NIRS) for Cerebral and Tissue Oximetry: Analysis of Evolving Applications. Journal of Cardiothoracic and Vascular Anesthesia 2022, 36, 2758–2766. [Google Scholar] [CrossRef] [PubMed]
- Saikia, M.J.; Kuanar, S.; Borthakur, D.; Vinti, M.; Tendhar, T. A machine learning approach to classify working memory load from optical neuroimaging data. 2021, p. 69. [CrossRef]
- Saikia, M.J. K-means Clustering Machine Learning Approach Reveals Groups of Homogeneous Individuals with Unique Brain Activation, Task, and Performance Dynamics using fNIRS. IEEE Transactions on Neural Systems and Rehabilitation Engineering 2023. [Google Scholar] [CrossRef] [PubMed]
- Ghouse, A.; Candia-Rivera, D.; Valenza, G. Multivariate Pattern Analysis of Entropy estimates in Fast- and Slow-Wave Functional Near Infrared Spectroscopy: A Preliminary Cognitive Stress study. Proceedings of the Annual International Conference of the IEEE Engineering in Medicine and Biology Society, EMBS 2022, 2022-July, 373–376. [CrossRef]
- Flanagan, K..; Saikia, M.J.; Saggio, G.; Flanagan, K.; Saikia, M.J. Consumer-Grade Electroencephalogram and Functional Near-Infrared Spectroscopy Neurofeedback Technologies for Mental Health and Wellbeing. Sensors 2023, Vol. 23, Page 8482 2023, 23, 8482. [CrossRef]
- Abtahi, M.; Cay, G.; Saikia, M.J.; Mankodiya, K. Designing and testing a wearable, wireless fNIRS patch. Institute of Electrical and Electronics Engineers Inc., 2016, Vol. 2016-Octob, pp. 6298–6301. [CrossRef]
- Tsow, F.; Kumar, A.; Hosseini, S.H.; Bowden, A. A low-cost, wearable, do-it-yourself functional near-infrared spectroscopy (DIY-fNIRS) headband. HardwareX 2021, 10, e00204. [Google Scholar] [CrossRef] [PubMed]
- Saikia, M.J.; Mankodiya, K. A Wireless fNIRS Patch with Short-Channel Regression to Improve Detection of Hemodynamic Response of Brain. Institute of Electrical and Electronics Engineers Inc., 2018, pp. 90–96. [CrossRef]
- Saikia, M.; Mankodiya, K. 3D-printed human-centered design of fNIRS optode for the portable neuroimaging. 2019, Vol. 10870. [CrossRef]
- Momtahen, S.; Shokoufi, M.; Ramaseshan, R.; Golnaraghi, F. Near-Infrared Handheld Probe and Imaging System for Breast Tumor Localization. IEEE Canadian Journal of Electrical and Computer Engineering 2023, 46, 246–255. [Google Scholar] [CrossRef]
- Saikia, M.; Besio, W.; Mankodiya, K. WearLight: Toward a Wearable, Configurable Functional NIR Spectroscopy System for Noninvasive Neuroimaging. IEEE Transactions on Biomedical Circuits and Systems 2019, 13. [Google Scholar] [CrossRef] [PubMed]
- Saikia, M.J.; Cay, G.; Gyllinsky, J.V.; Mankodiya, K. A Configurable Wireless Optical Brain Monitor Based on Internet-of-Things Services. Institute of Electrical and Electronics Engineers Inc., 2018, pp. 42–48. [CrossRef]
- Saikia, M.J. Internet of things-based functional near-infrared spectroscopy headband for mental workload assessment. SPIE, 2021, Vol. 11629, pp. 143–150. [CrossRef]
- Khan, M.A.; Asadi, H.; Hoang, T.; Lim, C.P.; Nahavandi, S. Measuring Cognitive Load: Leveraging fNIRS and Machine Learning for Classification of Workload Levels. Communications in Computer and Information Science 2024, 1963 CCIS, 313–325. [Google Scholar]
- Saikia, M.J.; Brunyé, T.T. K-means clustering for unsupervised participant grouping from fNIRS brain signal in working memory task. SPIE, 2021, Vol. 11629, pp. 159–164. [CrossRef]
- Arridge, S.R.; Hebden, J.C. Optical imaging in medicine: II. Modelling and reconstruction. Physics in Medicine and Biology 1997, 42, 841. [Google Scholar] [CrossRef]
- Saikia, M.J.; Kanhirodan, R.; Vasu, R.M. High-speed GPU-based fully three-dimensional diffuse optical tomographic system. International Journal of Biomedical Imaging 2014, 2014. [Google Scholar] [CrossRef]
- Das, T.; Dutta, P.K.; Saikia, M.J. Gaussian Distributed Semi-Analytic Reconstruction Method for Diffuse Optical Tomographic Measurement. IEEE Sensors Journal 2023, 23, 29536–29544. [Google Scholar] [CrossRef]
- Saikia, M.J.; Kanhirodan, R. High performance single and multi-GPU acceleration for Diffuse Optical Tomography. Institute of Electrical and Electronics Engineers Inc., 2014, pp. 1320–1323. [CrossRef]
- Saikia, M.J.; Rajan, K.; Vasu, R.M. 3-D GPU based real time Diffuse Optical Tomographic system. IEEE Computer Society, 2014, pp. 1099–1103. [CrossRef]
- Saikia, M.J.; Kanhirodan, R. Development of DOT system for ROI scanning. Optical Society of America (OSA), 2014, p. T3A.4. [CrossRef]
- Saikia, M.J.; Kanhirodan, R. Region-of-interest diffuse optical tomography system. Review of Scientific Instruments 2016, 87, 013701. [Google Scholar] [CrossRef] [PubMed]
- Yuan, G.; Alqasemi, U.; Chen, A.; Yang, Y.; Zhu, Q. Light-emitting diode-based multiwavelength diffuse optical tomography system guided by ultrasound. https://doi.org/10.1117/1.JBO.19.12.126003 2014, 19, 126003. [CrossRef]
- Zhang, X. Instrumentation in Diffuse Optical Imaging. Photonics 2014, 1, 9–32. [Google Scholar] [CrossRef] [PubMed]
- Saikia, M.; Manjappa, R.; Kanhirodan, R. A cost-effective LED and photodetector based fast direct 3D diffuse optical imaging system. 2017, Vol. 10412. [CrossRef]
- Saikia, M.J.; Kanhirodan, R. Development of handheld near-infrared spectroscopic medical imaging system. Optical Society of America, 2019, p. DS1A.6.
- Saikia, M.J.; Mankodiya, K.; Kanhirodan, R. A point-of-care handheld region-of-interest (ROI) 3D functional diffuse optical tomography (fDOT) system. SPIE, 2019, Vol. 10874, p. 90. [CrossRef]
- Saikia, M.J.; Kanhirodan, R. A tabletop Diffuse Optical Tomographic (DOT) experimental demonstration system. SPIE, 2019, Vol. 10869, p. 11. [CrossRef]
- Saikia, M.J.; Manjappa, R.; Mankodiya, K.; Kanhirodan, R. Depth sensitivity improvement of region-of-interest diffuse optical tomography from superficial signal regression. OSA - The Optical Society, 2018, Vol. Part F99-C, p. CM3E.5. [CrossRef]
Figure 1.
Broyden based MoBIIR algorithm for image reconstruction.
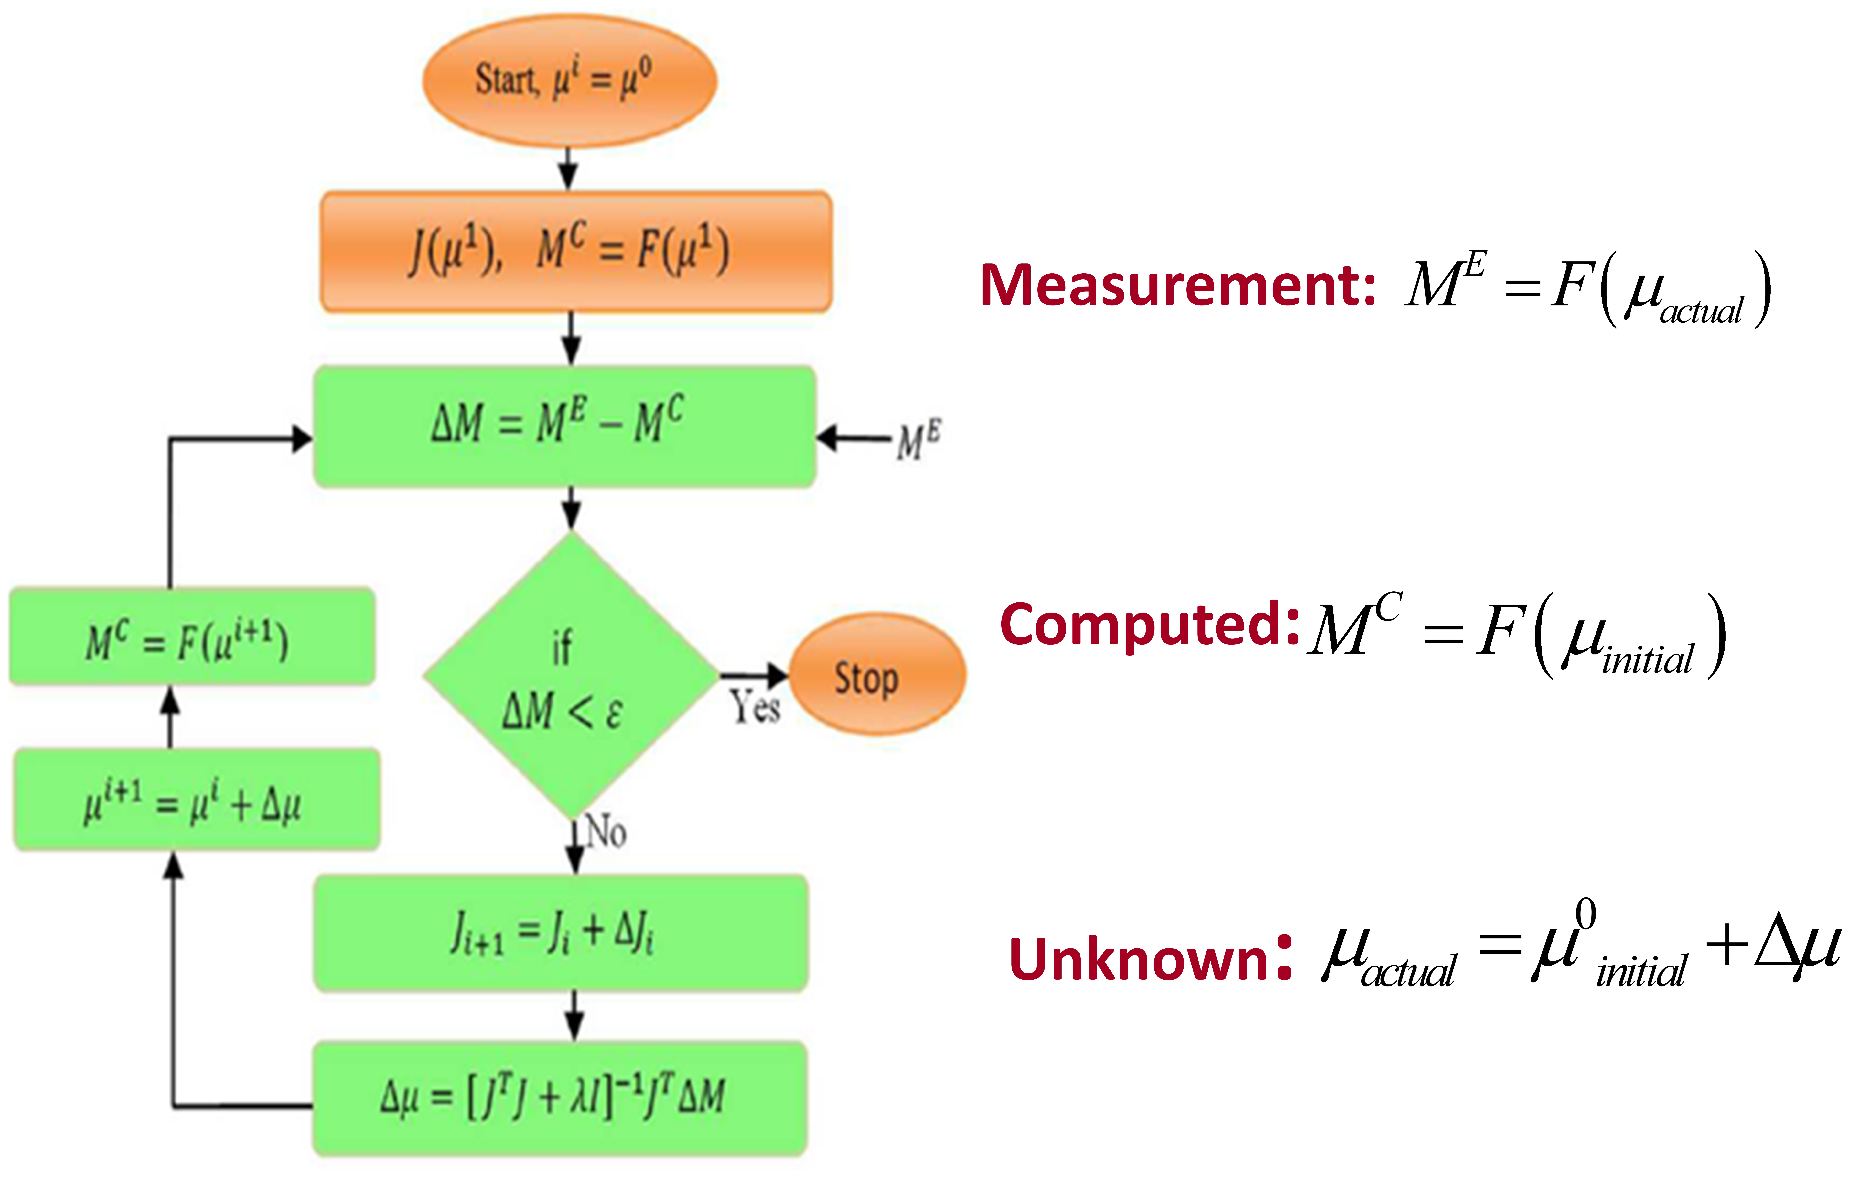
Figure 2.
Functional DOT probe. The probe allowed continuous spectroscopic imaging.
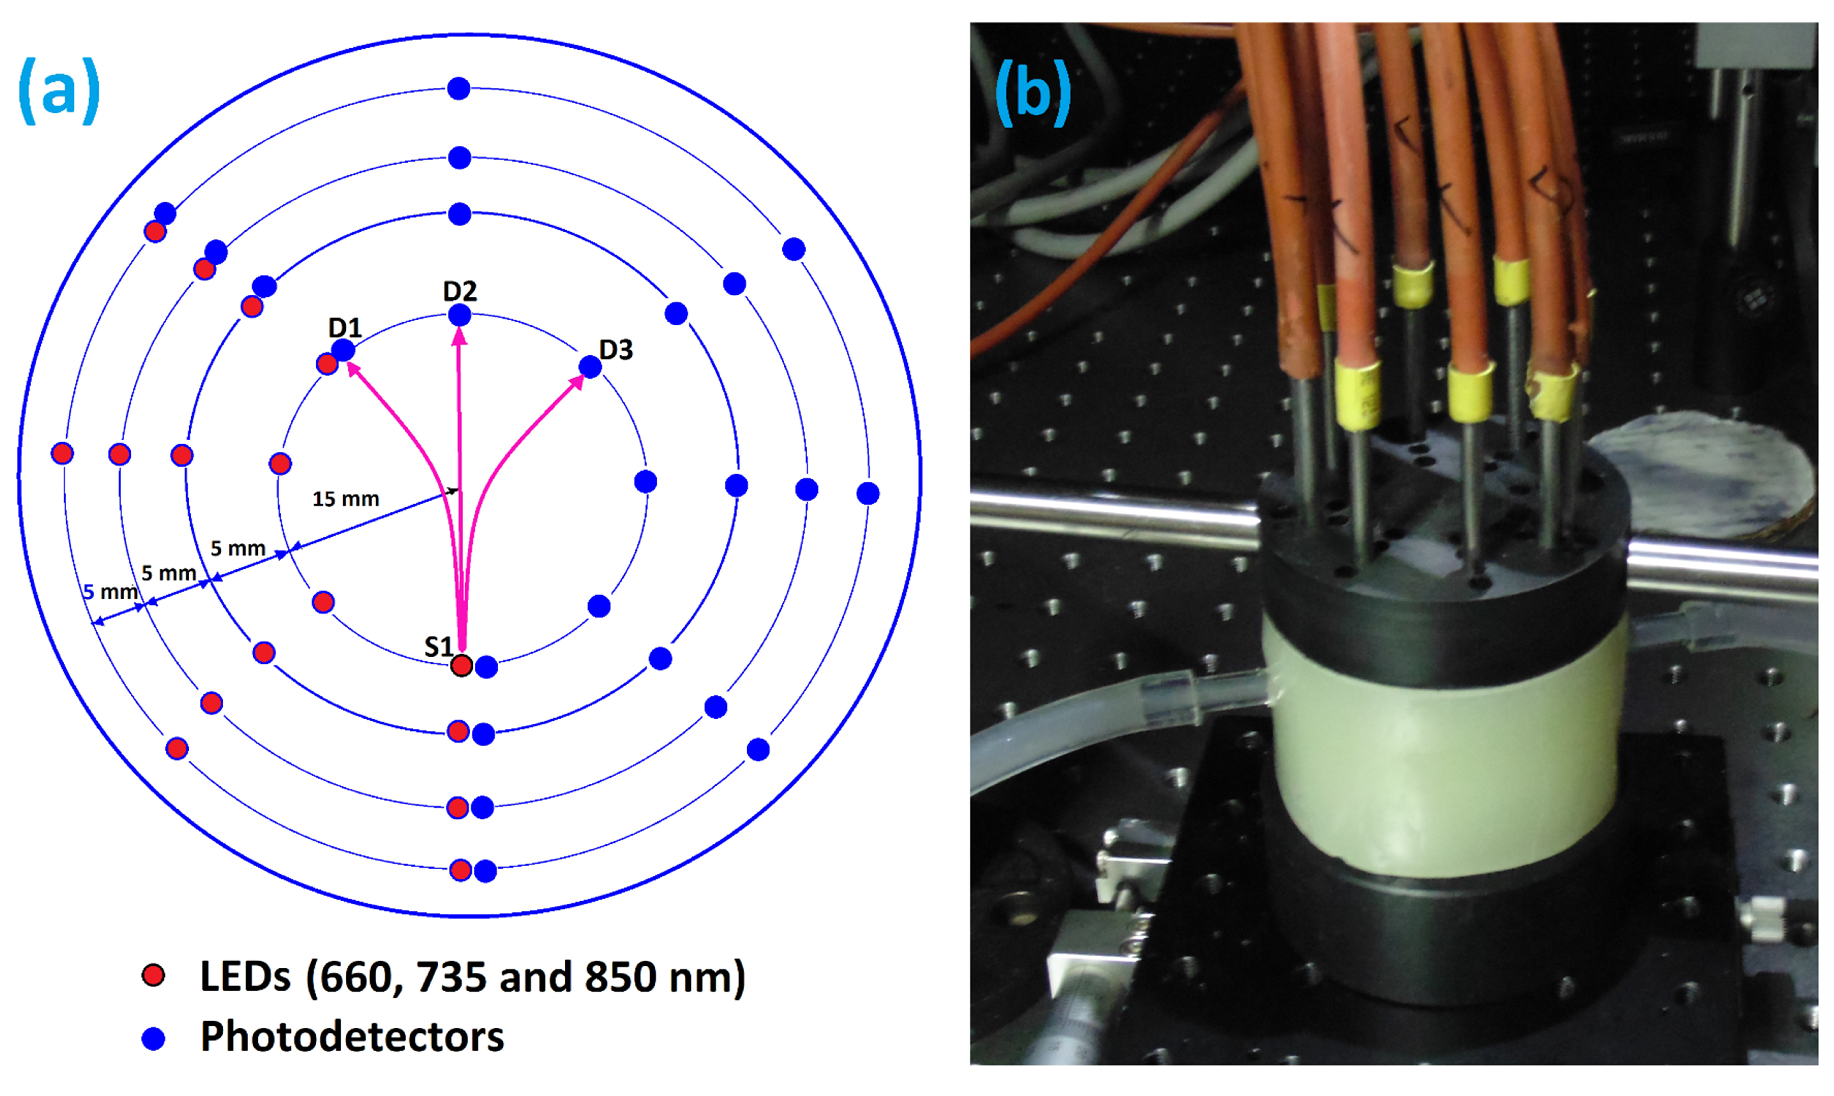
Figure 3.
3D spectroscopic image reconstruction was performed at a rate of 250 ms per measurement cycle.
Figure 3.
3D spectroscopic image reconstruction was performed at a rate of 250 ms per measurement cycle.
Disclaimer/Publisher’s Note: The statements, opinions and data contained in all publications are solely those of the individual author(s) and contributor(s) and not of MDPI and/or the editor(s). MDPI and/or the editor(s) disclaim responsibility for any injury to people or property resulting from any ideas, methods, instructions or products referred to in the content. |
© 2023 by the authors. Licensee MDPI, Basel, Switzerland. This article is an open access article distributed under the terms and conditions of the Creative Commons Attribution (CC BY) license (http://creativecommons.org/licenses/by/4.0/).
Copyright: This open access article is published under a Creative Commons CC BY 4.0 license, which permit the free download, distribution, and reuse, provided that the author and preprint are cited in any reuse.


