Preprint
Article

Analysis of Pentose Phosphate Pathway Inhibition on Generation of Reactive Oxygen Species and Epileptiform Activity in Hippocampal Slices

Altmetrics

Downloads

97

Views

39

Comments

0

A peer-reviewed article of this preprint also exists.

Submitted:

18 December 2023

Posted:

19 December 2023

You are already at the latest version

Alerts
Abstract
The pentose phosphate pathway (PPP) is one of three major pathways involved in glucose metabolism, regulated by glucose-6-phosphate dehydrogenase (G6PD), controlling NADPH formation. NADPH, in turn, regulates the balance of oxidative stress and reactive oxygen species (ROS) levels. G6PD dysfunction, affecting PPP, is implicated in neurological disorders, including epilepsy. However, PPP's role in epileptogenesis and ROS production during epileptic activity remains unclear. To clarify these points, we conducted electrophysiological and imaging analyses on mouse hippocampal brain slices. Using the specific G6PD inhibitor G6PDi-1, we assessed its effects on mouse hippocampal slices, examining intracellular ROS, glucose/oxygen consumption, and ROS production during synaptic stimulation and in the 4AP epilepsy model. G6PDi-1 increased basal intracellular ROS levels and reduced synaptically induced glucose consumption but had no impact on ROS production from synaptic stimulation. In the 4AP model, G6PDi-1 didn't significantly alter spontaneous seizure frequency or H2O2 release amplitude but increased the frequency and peak amplitude of interictal events. These findings suggest that short-term PPP inhibition has a minimal impact on synaptic circuit activity.
Keywords: 
Subject: Medicine and Pharmacology  -   Neuroscience and Neurology

1. Introduction

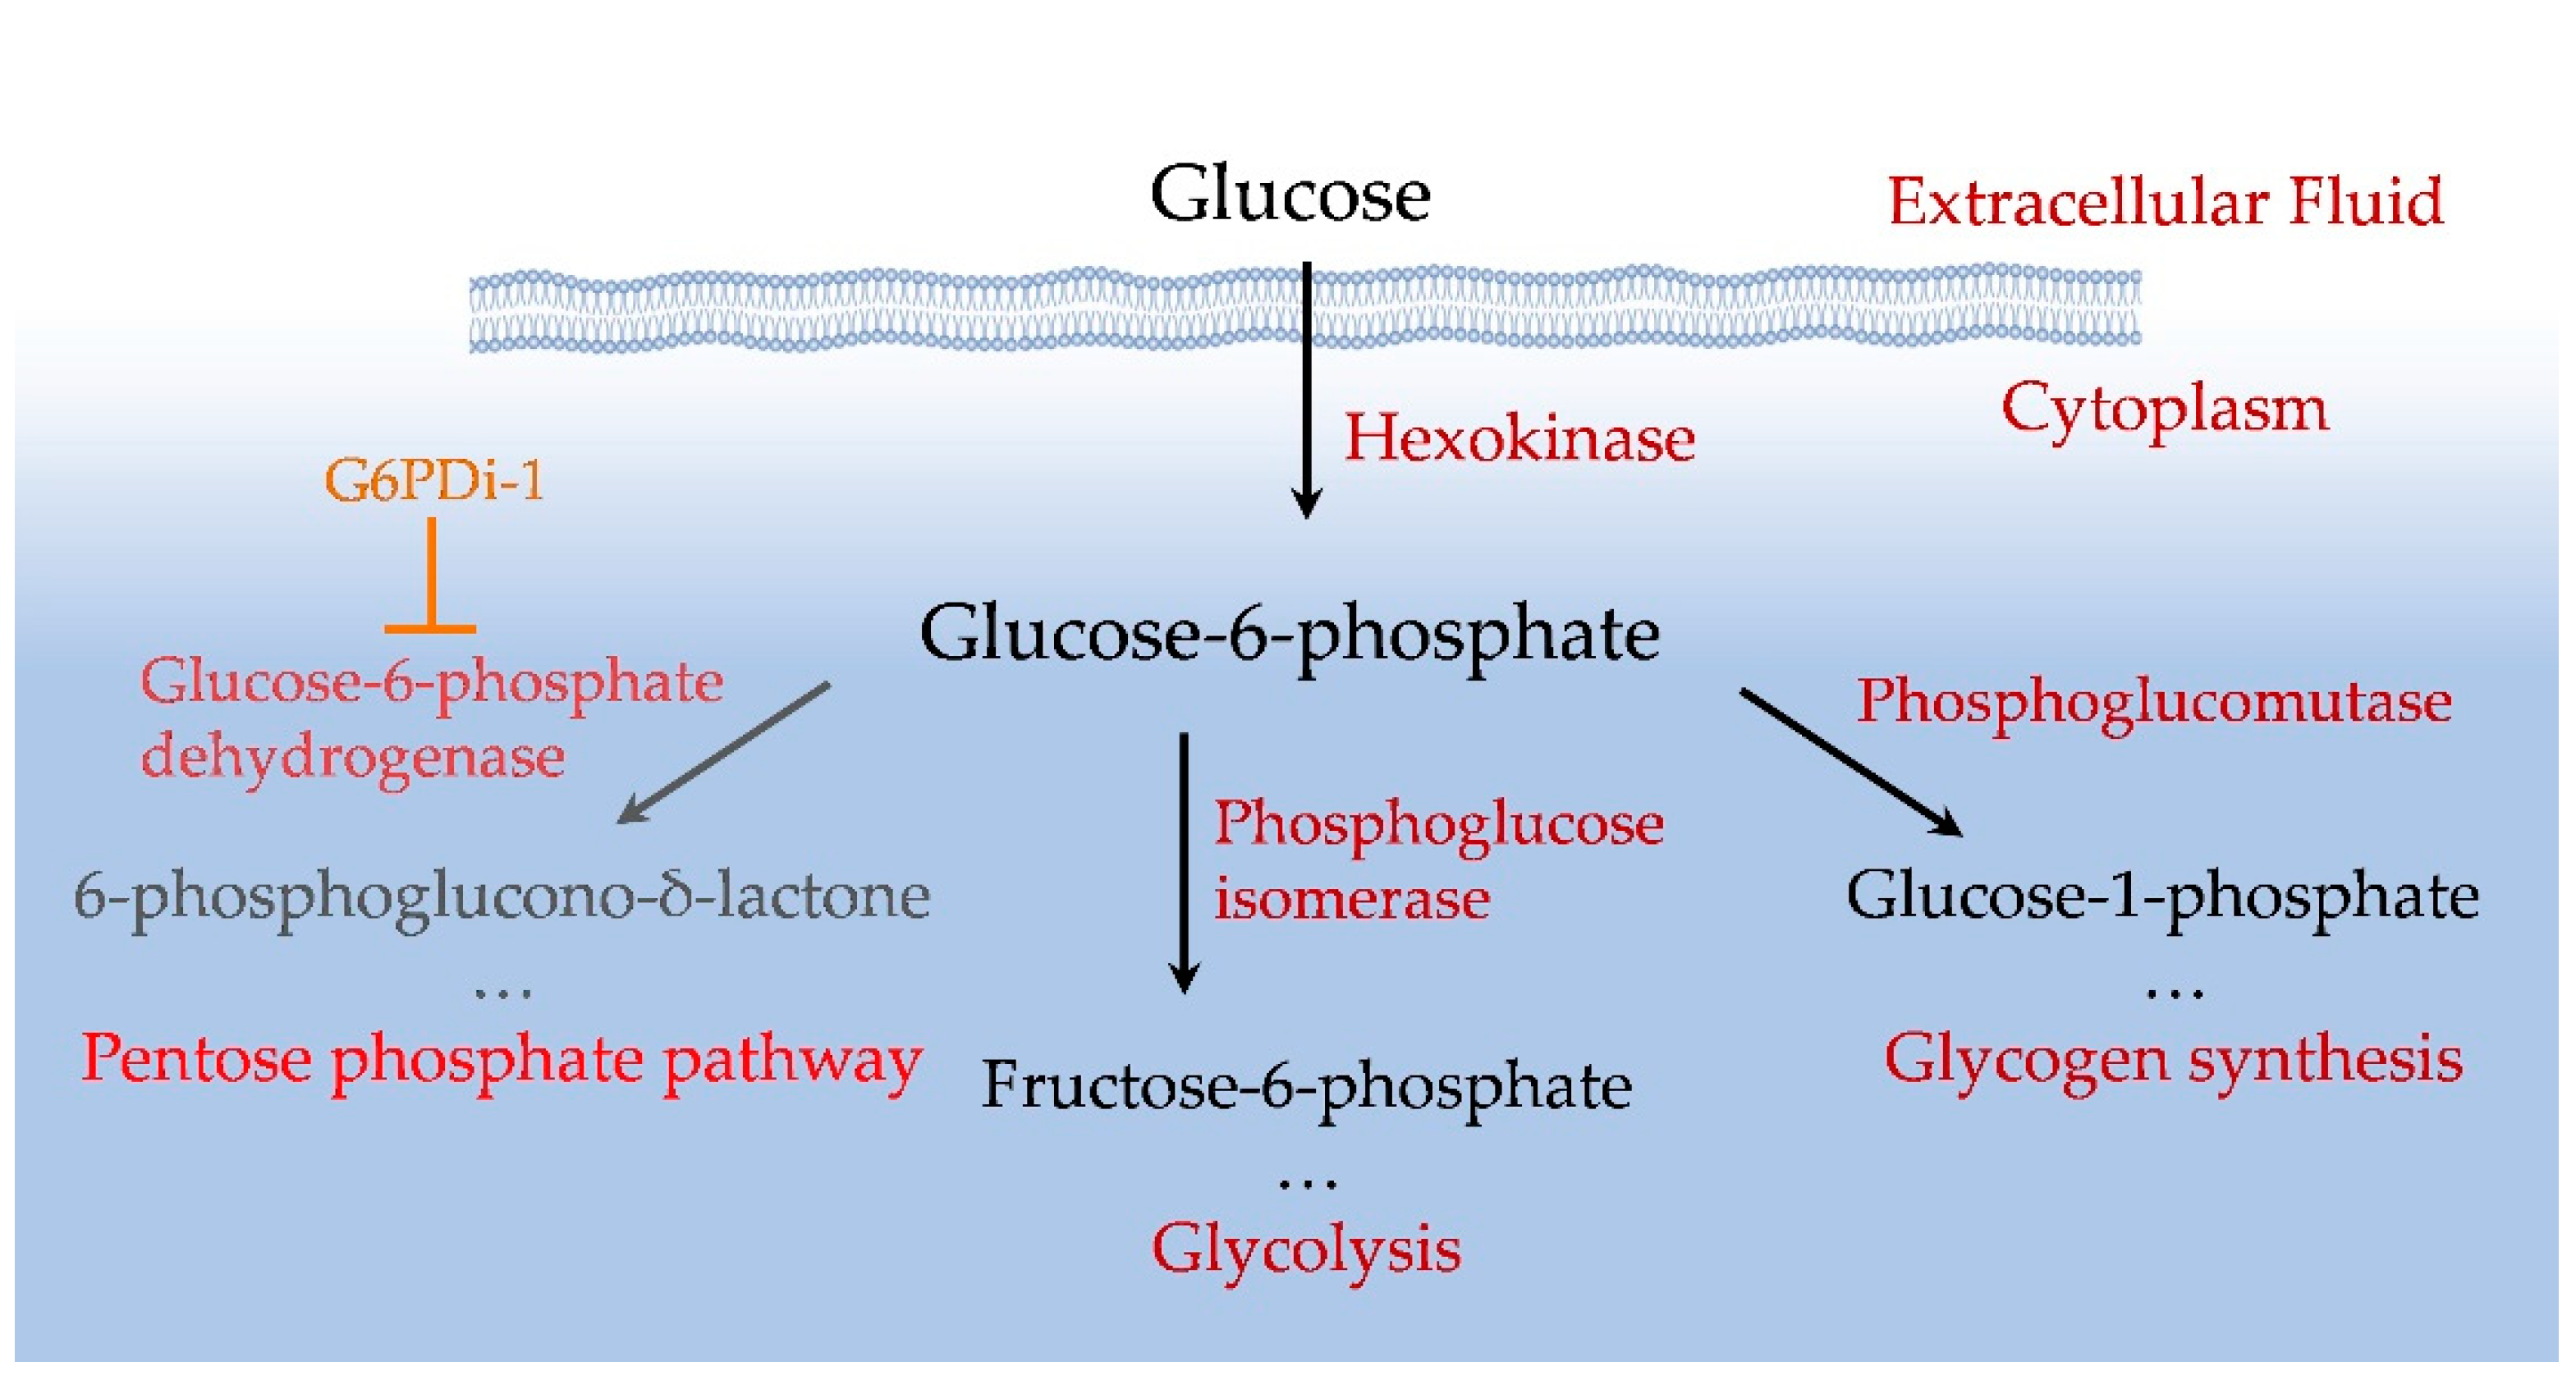
The mammalian brain is an organ that consumes a large amount of energy. Its activity largely depends on glucose delivered by blood into the brain and a tight regulation of glucose metabolism is critical for reliable brain functioning [1,2]. Glucose is converted to glucose-6-phosphate (Glu6P) under the action of hexokinase, which primarily controls the metabolism of this monosaccharide [3,4]. Glu6P is directed by various enzymes along three main pathways: glycolysis, glycogen synthesis and the pentose phosphate pathway (PPP) (Figure 1). Glycolysis is used for energy production, while PPP provides the production of NADPH, a reduced form of nicotinamide adenine dinucleotide phosphate (NADP). NADPH allows to preserve the reduced form of glutathione, the main cellular antioxidant that suppresses reactive oxygen species (ROS) and thus balances oxidative stress [5].
Glucose catabolism into PPP is channelled by the enzyme Glucose-6-phosphate dehydrogenase (G6PD), which converts Glu6P to 6-phosphoglucono-δ-lactone with parallel reduction of NADP. G6PD has been intensively studied in mammalian cells, since partial deficiency of this enzyme underlies the most common form of nonimmune hemolytic anemia [6] and a full depletion of G6PD in mammals leads to embryonic lethality [7]. It has been suggested that G6PD is involved in the pathology of various human diseases such as heart failure [8], hypertension and cancer [9]. In addition, it has been indicated that G6PD deficiency may be a predisposing factor for rhabdomyolysis following a tonic-clonic seizure [10] and progressive myoclonic epilepsy can be associated with mutation in G6PD [11]. G6PD dysfunction leads to a decrease in the concentration of NADPH and the reduced form of glutathione, which, in turn, causes increased oxidative stress [12,13]. It has been also reported that patients with Alzheimer's disease had an increased expression of G6PD in human hippocampus, indicating that the activity of the enzyme may be particularly important in this part of the brain [14,15].
Figure 1. Scheme of intracellular glucose utilization.
Preprints 93660 g001
The hippocampus serves as both a cognitive structure and an emotions regulator. The dorsal hippocampus is primarily involved in cognitive functions, such as learning and memory related to navigation, exploration, and locomotion. In contrast, the ventral hippocampus is linked to motivational and emotional behaviour [16,17]. These functions are supported by unique anatomical, morphological, molecular, and electrophysiological features of hippocampal cells [18].
Previous work in hippocampal slices also showed that the rapid release of hydrogen peroxide is mainly supplied by NADPH oxidase (NOX), which is a trigger of epileptic seizures [19]. In this pathological condition, NADPH can be used by NOX for ROS production [5]. Active NOX generates superoxide by transferring an electron from NADPH in the cytosol to oxygen in the extracellular space [20]. Thus, NADPH, which is also produced in PPP, could potentially be involved in two competing reactions: NOX, which produces ROS, and PPP, which neutralizes them.
Although several pathological disorders associated with G6PD deficiency are well documented, the consequences of PPP modulation due to G6PD inhibition require in-depth analysis. In particular, it is important to elucidate how the suppression of G6PD function modulates the baseline level of ROS and changes in ROS caused by synaptic activation, as well as the effect of G6PD inhibition on seizure generation in models of epilepsy.
To clarify some of these issues, we have selected recently proposed effective inhibitor of G6PD, a nonsteroidal small molecule (G6PDi-1) [21]. The G6PDi-1 acts by blocking or reducing the activity of the G6PD enzyme, which leads to the inhibition of the pentose phosphate pathway. In our study, G6PDi-1 was used as a tool to analyze the following questions: (i) how inhibition of the G6PD enzyme affects glucose and oxygen consumption during synaptic stimulation of neurons in brain slices; (ii) how inhibition of G6PD by G6PDi-1 affects the base level of ROS and its elevation during synaptic stimulation; (iii) how G6PDi-1 acts on ROS production during seizure-like activity in the 4AP model of epilepsy in hippocampal slices. For this purpose, we simultaneously measured electrical (local field potentials, LFPs) and metabolic network parameters (extracellular oxygen, glucose, H2O2) in hippocampal slices.

2. Results

2.1. Effect of G6PDi-1 on consumption of glucose and oxygen in hippocampal slices
PPP is an alternative glycolytic pathway for glucose metabolism (Dienel, 2019). To assess the extent of glucose metabolism modulation by PPP inhibition, we measured glucose and oxygen consumption in hippocampal slices when the PPP was suppressed ed by G6PDi-1, an inhibitor of the G6PD enzyme (Figure 1).
The glucose and oxygen changes were measured simultaneously by glucose enzymatic microelectrodes and Clark oxygen microelectrode with in conjunction LFP registration. The scheme of electrode's allocation in the slice is shown in Figure 2a. The analysis carried out on 7 acute hippocampal slices showed that immediately after the installation of the glucose sensor, the baseline glucose level in different slices varied from 1.76 to 2.74 mM. The 30-second stimulation (200 ms pulses at 10 Hz) of Shaffer collaterals caused remarkable consumption of glucose ranging from 0.1 to 0.94 mM in different slices.
The following concentrations of G6PDi-1 were tested to determine glucose consumption: 50 nM, 500 nM, 2.5 μM, 5 μM. As the concentration increased, glucose uptake due to synaptic stimulation progressively decreased. The 2.5 μM concentration was found to be saturating (results not shown) and was used in the following experiments on hippocampal slices.
The traces shown in Figure 2b illustrate the glucose changes in control condition, during the application of 2.5 μM G6PDi-1 and after washing. The stimulation in control condition (black) leads to 0.62 mM consumption of glucose, during the application of G6PDi-1 (orange) the consumption of glucose decreased to 0.5 mM and after washing (gray) the amplitude of consumption elevated to 0.58 mM (Figure 2b,c).
The application of G6PDi-1, 2.5 μM did not significantly change the rate of glucose consumption and its recovery kinetics. To evaluate more accurately the glucose consumption, we analyzed the integral area of changes in the glucose level in the slice from the moment of the onset of synaptic stimulation (30 sec) to the moment, when the glucose level was completely recovered (250 sec). The relative glucose consumption at each stimulation was calculated relative to the last stimulation in control.
G6PDi-1 caused a slow developing decrease in synaptically induced glucose consumption. After 8-10 mins of the inhibitor addition, glucose consumption decreased by 9.4±4.5%, while its presence during 15-20 mins resulted in decrease by about 20%. As illustrate Figure 2d, average decreasing was to 79.8±4.0% compared to control. Washing was accompanied by an increase in glucose consumption to 92.9±7.3% (Figure 2d, p < 0.05, n=6), which indicates the reversibility of the inhibitory effect of the compound.
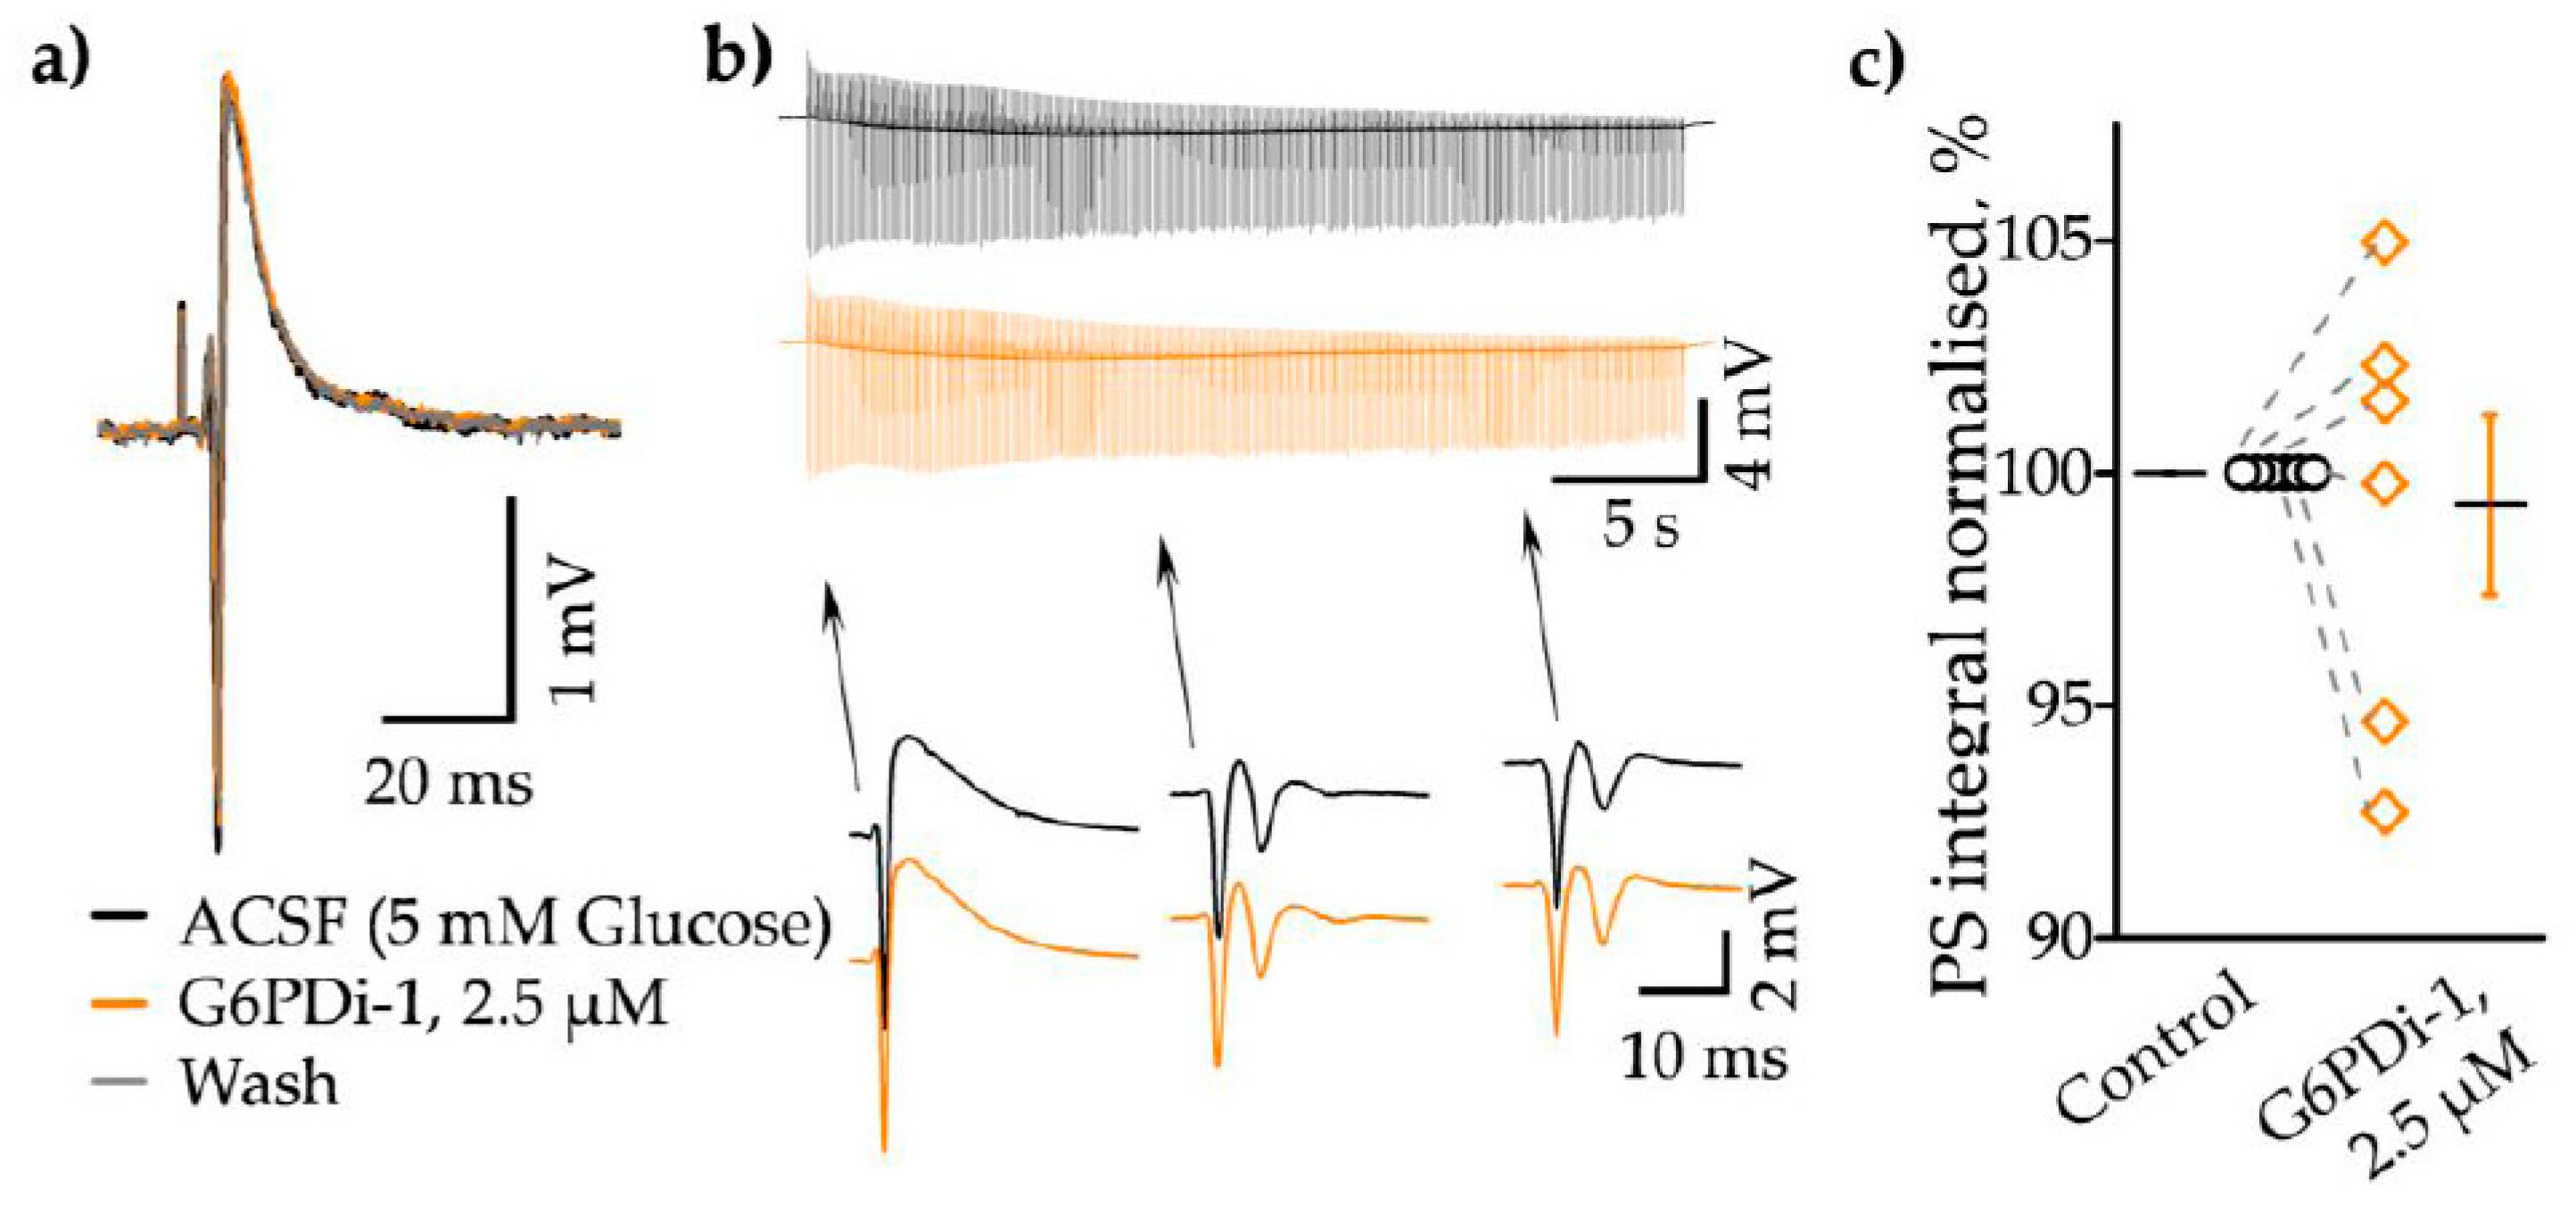
To clarify whether G6PDi-1 affects the properties of synaptic transmission, we analysed the electrophysiological characteristics of neuronal population activity following the G6PDi-1 application. Electrical signals (the presynaptic volley, postsynaptic response and spikes) were recorded using glass electrodes placed in stratum oriens CA1 zone of hippocampus (Figure 2a). During the G6PDi-1 application and after washing the presynaptic volley of LFP component did not change compared to control indicating that a similar number of nerve fibers were activated (Figure 3a).
An example of a train of electrical signals during stimulation (30 s, 10 Hz) in the control and after the addition of G6PDi-1 with insetions of single responses, illustrates absence of any modulation (Figure 3b). To further validate these results, we performed an analysis of the LFP integrals, using the procedure described in detail previously [22]. The computer program separated each LFP, shifted the baseline to 0, and selected the region of integration. Population spikes were inverted and then the integral of the whole trace was calculated. On average, the mean population spikes (PS) integral of trains didn’t change, upon application of G6PDi-1 become 99.3±1.9% if compare with control. The summarized data from 6 slices demonstrate that G6PDi-1 has not effect on the electrical activity on hippocampal slices (n=6, Figure 3c). Furthermore, G6PDi-1 did not change the amplitude or kinetics of synaptically induced responses, indicating an absence of effect on electrical activity.
These results strongly demonstrate that the decrease in glucose uptake induced by G6PDi-1 is not associated with a reduction in the efficiency of synaptic stimulation of Shaffer collaterals.
Figure 3. G6PDi-1 does not affect on electrophysiological characteristics of neuronal population activity. (a) Sample local field potential (LFP) traces from a single experiment in control (black line), during the application of 2.5 µM G6PDi-1 (orange line) and after wash (gray). (b) The superimposed LFPs during the stimulation train (30 s, 10 Hz), individual events are shown in the insets below. (c) Average population spike (PS) integral values from 6 slices (n=6, age 2-3 Mo). The black line illustrates the mean, whiskers – SE.
Preprints 93660 g003
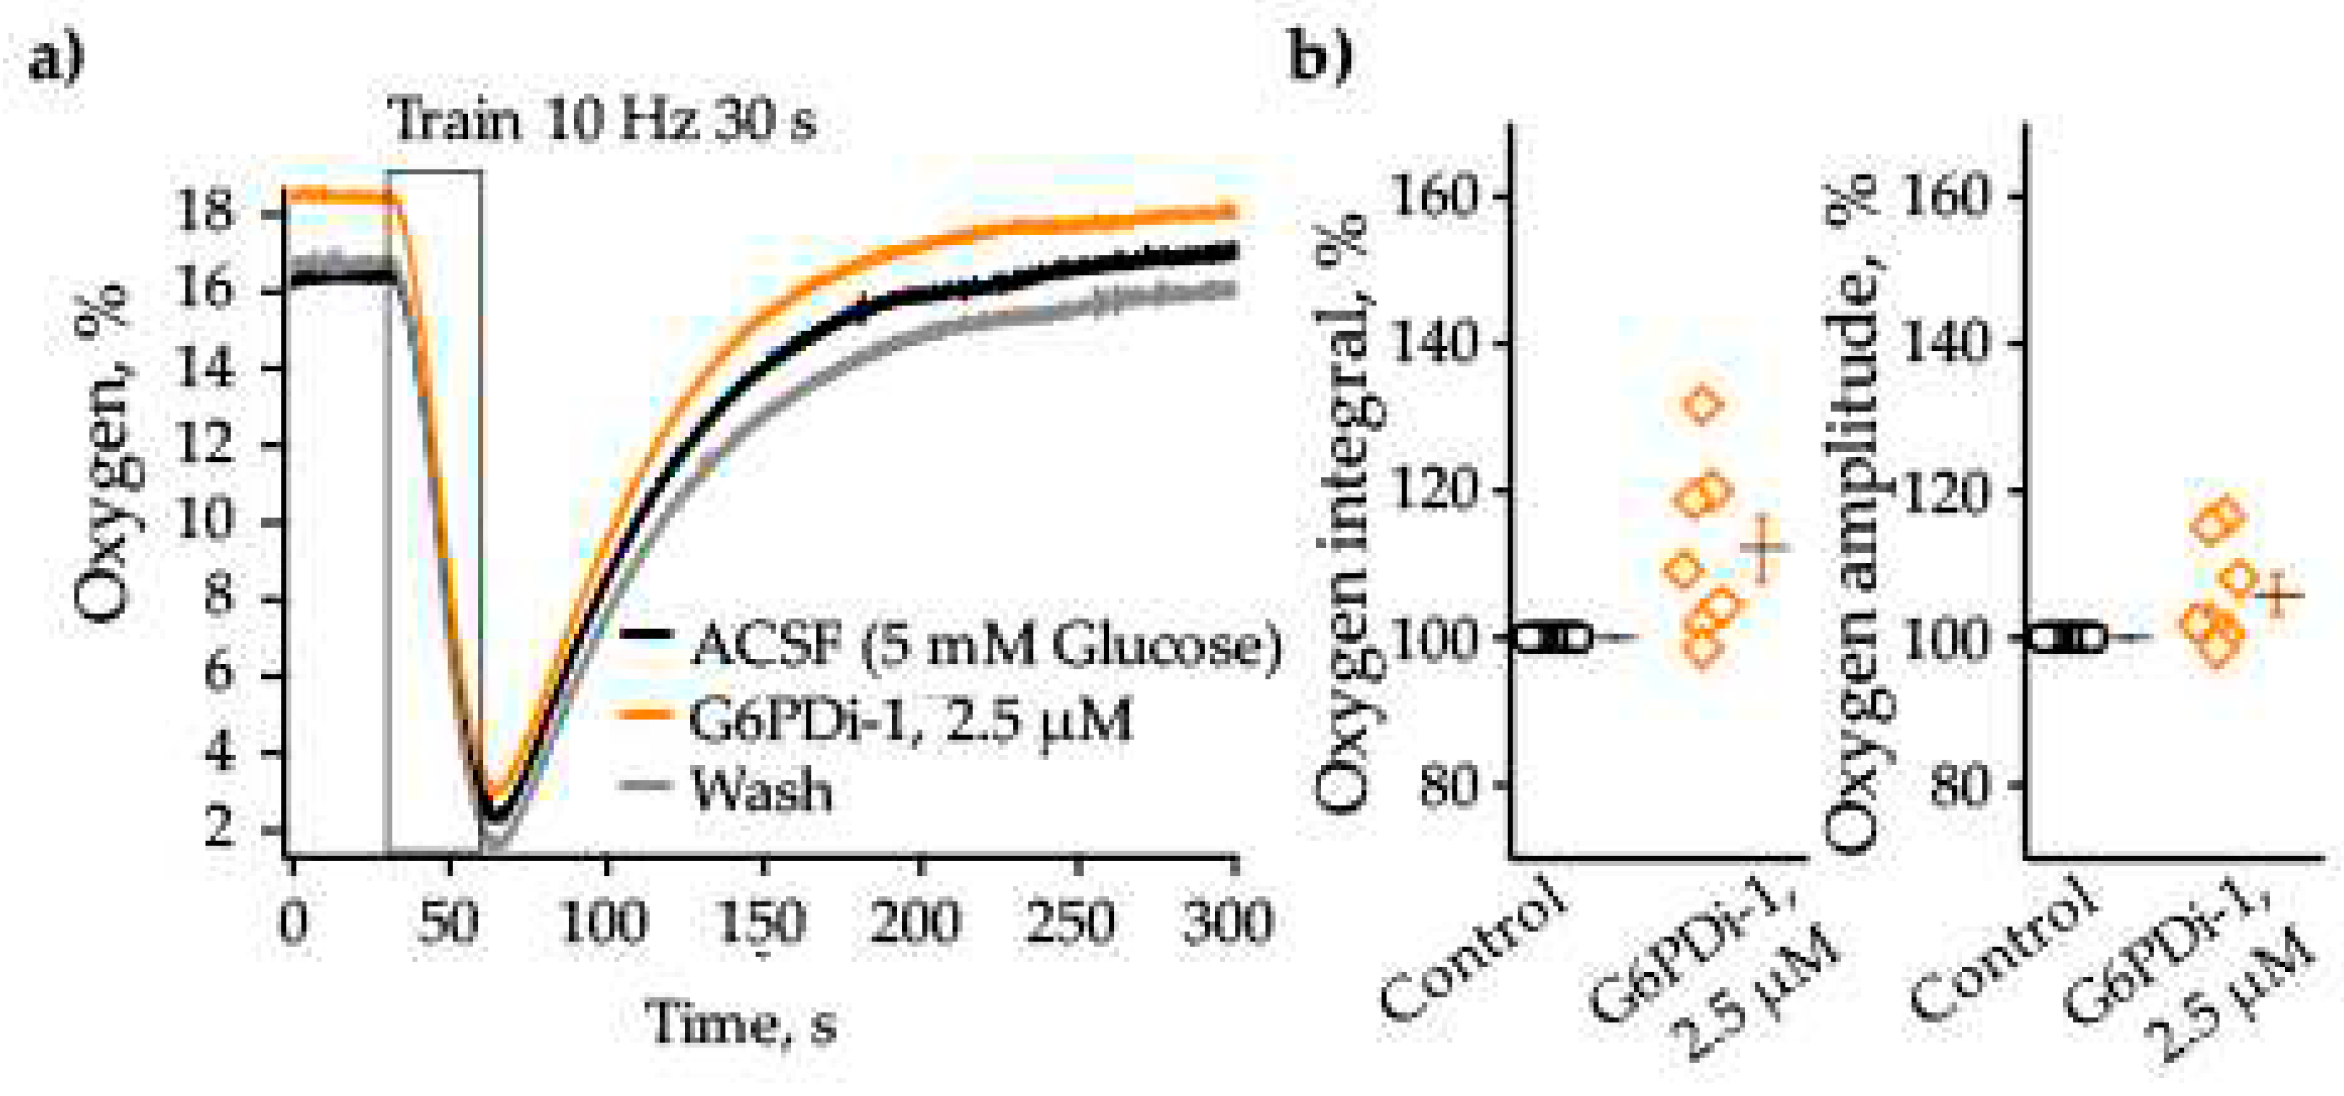
We then analyzed the oxygen consumption induced by synaptic stimulation upon application of G6PD inhibitor. The baseline oxygen level in the control was 16.3% and synaptic stimulation (10 Hz, 30 s) caused remarkable decrease of its level to 2.2% (Figure 4a). The decrease was reversible, after 200 second oxygen returned to its original level. Application of G6PDi-1 did not have a pronounced effect on the amplitude and kinetics of oxygen consumption. Figure 4b summaries relative changes of oxygen transients induced by synaptic stimulation in control and during the G6PDi-1 application. In the presence of G6PDi-1 (2.5 µM), the average oxygen consumption integrals and oxygen transient amplitude were, respectively, 112.0±4.5% (not significant, n=7) and 106±2.7% (not significant, n=7) compared to the control.
Thus, inhibitor G6PDi-1 caused small and reversible decrease in glucose consumption, whereas oxygen consumption tended to increase.

2.2. Effect G6PDi-1 on basic and synaptically induced changes of intracellular ROS levels
The pentose phosphate pathway is a metabolic pathway in which glucose-6-phosphate is oxidized to generate pentose sugars, as well as reducing equivalents in the form of NADPH [23]. The PPP produces the reduced form of NADPH, which serves as an energy source for intracellular antioxidant systems, in particular the glutathione and thioredoxin systems. We therefore analyzed intracellular ROS production upon inhibition of the pentose phosphate pathway using the cell-permeable dye CellROX (see Methods).
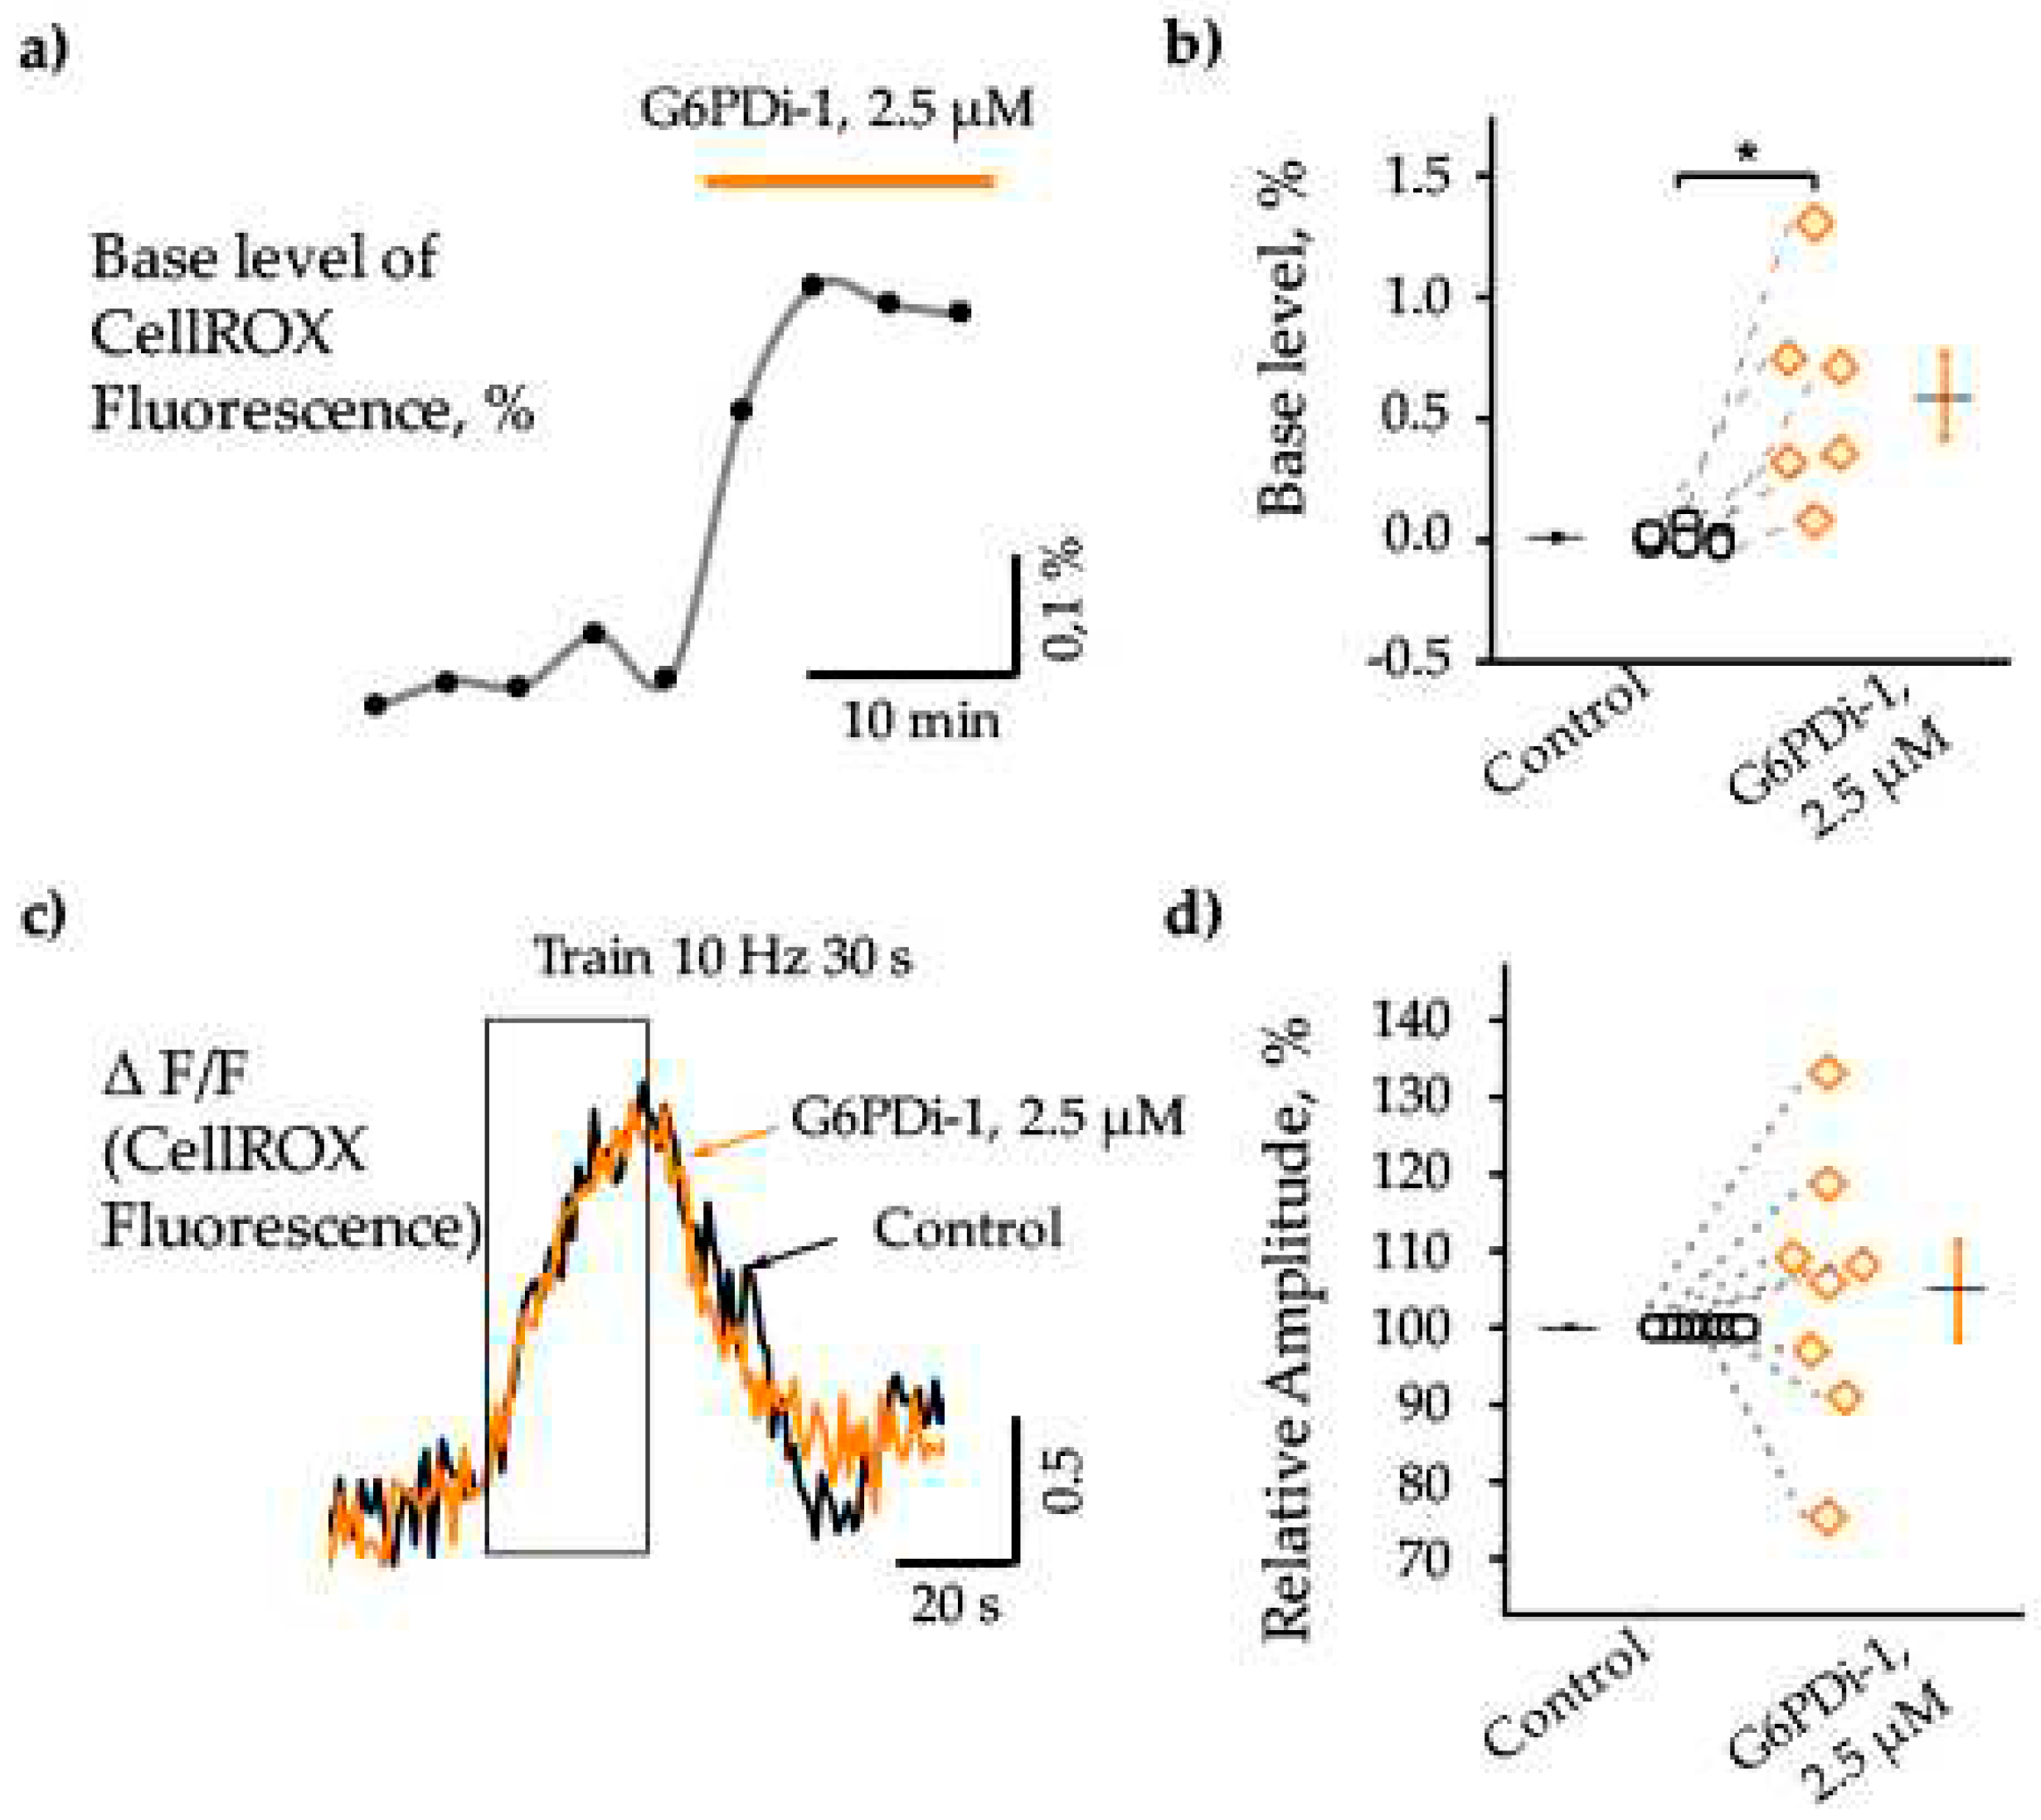
Fluorescence changes from a single slice under the G6PDi-1 application compared with control are shown in Figure 5a and changes in 6 slices are taken into account in Figure 5b (n=6, p < 0.05). The analysis showed that inhibition of PPP by G6PDi-1 causes an increase in the basal level of ROS in the cytoplasm: after addition of G6PDi-1 (2.5 μM), fluorescence increased slowly and reached a maximum quasi-steady-state level after approximately 10 min. In the slice shown in Figure 5a, fluorescence increased by ≈0.3%. Across slices, the G6PDi-1-induced increase in basal levels in hippocampal CA1 cells averaged 0.6 ± 0.17% (n = 6, Figure 5b).
To elucidate the effect of PPP inhibition on synaptically induced changes in ROS, we used stimulation of Schaffer collaterals under control conditions and then in the presence of G6PDi-1. The increase in fluorescence was calculated as ΔF/F0, where ΔF is the change in fluorescence in the hippocampus, F0 is the fluorescence in the cortical area, since synaptic stimulation did not cause changes in fluorescence in this region.
Synaptic stimulation of Shaffer collaterals (10 Hz, 30 sec) caused an increase of fluorescence (ΔF/F) under control conditions as well as in the presence G6PDi-1, reflecting an increase of intracellular ROS. The effect was reversible and fluorescence returned to the initial level approximately 30-40 seconds after the end of stimulation. (Figure 5c).
Importantly, addition of 2.5 µM G6PDi-1 had no apparent effect on either the amplitude or kinetics of synaptically induced fluorescence changes (Figure 5c orange line). The change in fluorescence to stimulation was completely blocked in the presence of 1 µM TTX, indicating a synaptic nature of the change in fluorescence to stimulation (data not shown).
On 8 slices, the relative amplitude of fluorescence changes under the action of the G6PD inhibitor varied compared to the control from 75.3% to 133.2% with mean value of 104.8±6.2% (n=8, Figure 5d), indicating a minor effect of G6PD-1, on the synaptically induced increase in intracellular ROS.
Figure 5. Action of G6PDi-1 on the intracellular ROS. (a) Base fluorescence changes from separate slices following the G6PDi-1 (2.5 μM) application, that is highlighted by orange line. (b) Summary of G6PDi-1 action on the base level of intracellular ROS (n=6, age mice 20-25 days of postnatal development – P20-25). (c) Accumulated signals of 2 traces of fluorescence changes during synaptic stimulation (10 Hz, 30 s) in control (black), during the 2.5 μM G6PDi-1 application (orange). The duration of stimulation is indicated by frame. (d) Summary of intracellular ROS changes under the synaptic stimulation in control (black), and during the G6PDi-1 application (orange) (n=8, P20-25).
Preprints 93660 g005

2.3. Analysis of the G6PDi-1 action on the production of hydrogen peroxide and seizure-like phenomena in the 4AP model of epilepsy

Previous studies demonstrated that spontaneous seizures were preceded by a rapid, high-amplitude release of hydrogen peroxide (H2O2) [19,24]. Notably, inhibiting NADPH oxidase, an enzyme responsible for reactive oxygen species (ROS) production, has been shown to eliminate the rapid release of H2O2 and prevent the induction of seizures [19].
In this study, we sought to assess the effect of PPP inhibition, specifically the enzyme G6PD, to H2O2 production during epileptiform activity, as well as to the frequency of spontaneous seizures. For this propose we applied the specific inhibitor of G6PD (G6PDi-1, 2.5µM) on acute brain slices generating SLEs induced by 4AP administration [25,26].
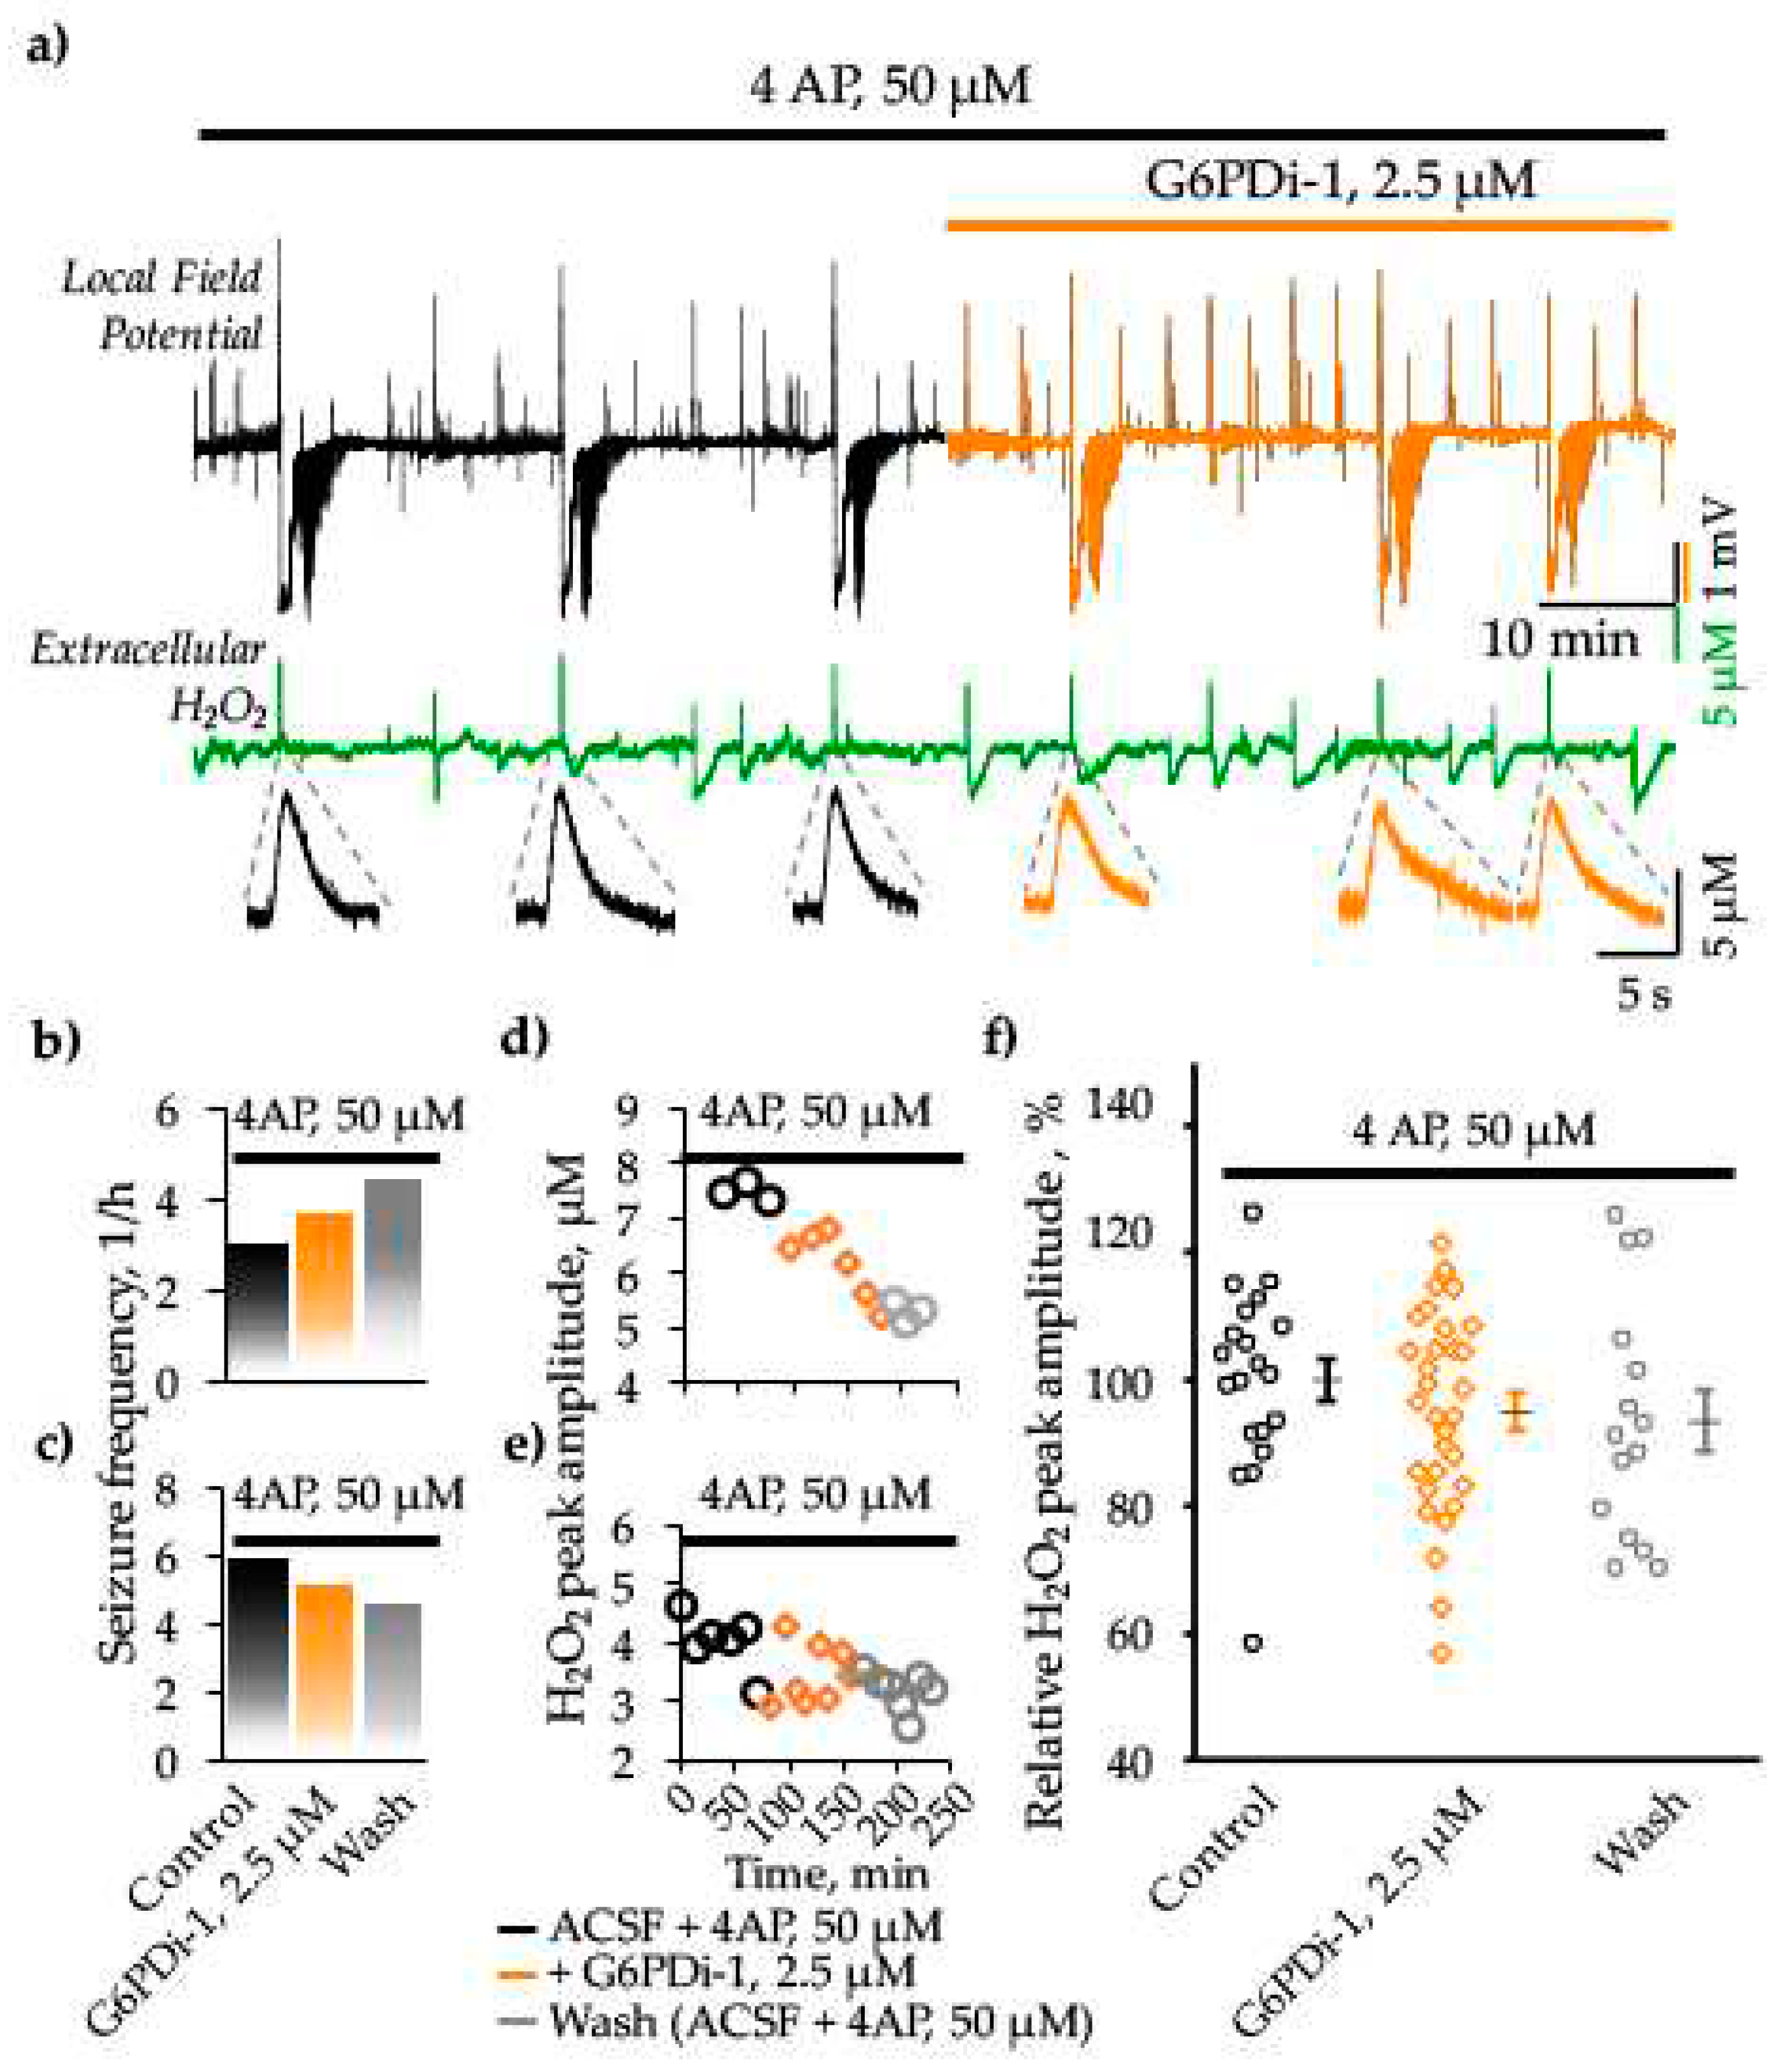
Application of 4AP (50 μM) resulted in hippocampal network hyperexcitability manifested as interictal activity and seizure like-events (SLEs) (Figure 6a). The first SLEs became apparent 15-23 min (19.1±1.5 min, n=4) after onset of perfusion of the 4AP containing ACSF. The SLEs recorded in the stratum oriens of CA1 hippocampal zone lasted between 40 and 78 s (60.7±3.8 s, n=15) and were characterized by negative DC-shift of the local field potential (mean amplitude 2.8±0.2 mV, n=15). Simultaneous monitoring of local field potentials and extracellular H2O2 revealed that all spontaneous seizures were associated with an especially high and fast release of H2O2 both in control (4AP alone) and following the G6PDi-1 application (Figure 6a).
Special attention is given to the analysis of spontaneous SLEs frequency. We observed an increase in seizure occurrence on two slices during both the application of G6PDi-1 (from 3 to 4 and from 4 to 6 SLEs per hours) and the washing phase (Figure 6b). In contrast, other two slices exhibited a tendency toward a decrease (from 6 to 5 and from 5 to 4 SLEs per hour) in seizure frequency (Figure 6c). The difference in the effect direction may due to the difference in hippocampal region where brain slice came from. Indeed, when cutting the sagittal slices, we don’t control are they from dorsal or ventral hippocampus (see Discussion).
We also monitored the H2O2 production during spontaneous seizure-like events (SLEs), observing variations in peak amplitude ranging from 2 to 8 μM across different slices. The changes in peak amplitude of H2O2 production during the application of G6PDi-1 and after washing, corresponding to the slices depicted in Figure 6b,c, are visually represented in Figure 6d,e, respectively. Importantly, there was a tendency towards a gradual reduction in the peak amplitude of hydrogen peroxide production upon the addition of G6PDi-1 and after the washing phase, as depicted in Figure 6d,e. This pattern was consistently observed in other slices as well. On average, the relative peak amplitude of H2O2 release during spontaneous seizure-like events (SLEs) was 94.9±2.8% upon the application of G6PDi-1 (Median difference -5.05% [CI -15.3%, 7.69%]), and during washing, it was 93.4±4.9% (Median difference -10.5% [CI -25.1%, 4.9%]), compared to the control in the 4AP model of epilepsy (Figure 6f). Thus, the PPP inhibition reduced the release of H2O2 however the size of effect is too small to conclude its statistical significance.
We also analyzed the release of H2O2 associated with interictal-like events (IIEs). Interestingly, in the control condition (4AP alone), the amplitudes of H2O2 transients generated during IIEs were significantly lower than in the case of SLEs (Median difference -2.98μM [CI -3.58μM, -1.49 μM]), while during GP6H inhibition, these differences almost disappeared (Median difference -0.891 μM [CI -1.92 μM, -0.22 μM]). Additionally, the frequency of IIEs accompanied by H2O2 release increased in the presence of the inhibitor (11 vs 9 IIEs per hour), however, the amplitude of release decreased (Median difference -0.205 μM [CI -1.85 μM, 0.589 μM]). These observations may suggest two opposing processes: facilitation of H2O2 release due to the weakening glutathione-dependent antioxidant defense and a decrease in NOX-mediated H2O2 production. Indeed, both processes require NADPH, which production is ensured by the PPP.

3. Discussion

Glucose, the main energy source of biological tissues, is utilised via three main pathways: glycolysis, glycogen synthesis and the pentose phosphate pathway (PPP) (Figure 1). The PPP comprises two separate branches, oxidative and non-oxidative [4]. The oxidative branch primarily depends on glucose 6-phosphate dehydrogenase (G6PD). This branch ensures the production of NADPH, which is required to maintain high the level of the reduced glutathione - main cellular antioxidant. Therefore, the dysfunction of G6PD may results in the oxidative stress.
A number of studies indicate that oxidative stress and the production of ROS contribute to the pathogenesis of neurological diseases such as Alzheimer's disease, Parkinson's disease, Huntington's disease, stroke, amyotrophic lateral sclerosis and the pathogenesis of epilepsy [4,27,28,29]. Although animal studies have demonstrated the involvement of the oxidative stress in the occurrence of spontaneous seizures in chronic epilepsy [30,31,32], it is not yet clear whether excessive ROS production is a cause or a consequence (or possibly both) of seizure activity. Some studies indicate that oxidative stress is a consequence of seizures [24,33] while others consider it as the cause of epileptogenesis [19,34]. Although the glucose metabolism via PPP is crucial for antioxidant defence it is still not clear if its impairment may contribute to the epileptogenesis and/or seizures generation.
Our study is aimed to clarify some of these questions. We present here an analysis of the effects of PPP inhibition on: (i) glucose and oxygen consumption and ROS production during synaptic stimulation; (ii) seizure-like activity and ROS production in a 4AP model of epilepsy on hippocampal slices.
To inhibit the oxidative branch of PPP, we used recently proposed the nonsteroidal molecule G6PDi-1, described as efficient and specific inhibitor of G6PD [21]. Previously, the steroid derivative dehydroepiandosterone (DHEA) has been used in many studies to suppress G6PD in in vitro and in vivo experimental models [35,36,37]. However, more recent observations demonstrated that DHEA is not a specific inhibitor of G6PD as it acts directly as ligands for steroid hormone and nuclear receptors, activating G-protein-coupled receptors and inhibiting voltage-gated T-type Ca2+ channels [38]. We therefore suggest that our approach using G6PDi-1 offers a more specific analysis of the consequences of PPP inhibition on synaptic function, network excitability, reactive oxygen species generation, and epileptogenesis.

3.1. Effect of G6PDi-1 on glucose consumption in hippocampal slices

Glucose and oxygen consumption associated with neuronal network activity induced by the electrical stimulation of Schaffer collaterals in hippocampal slices. The addition of G6PDi-1 led to a gradual decrease in glucose consumption by about 20% compared to the control. The decrease in glucose uptake induced by G6PDi-1 is not associated with a reduction in the efficiency of synaptic stimulation of Schaffer collaterals or synaptic function, since the inhibitor did not affect the strength of the evoked local field potentials (LFPs). This contrasts with an earlier study that demonstrated that a widely used G6PD inhibitor, the steroid DHEA, caused a significant increase in LFP [39]. As mentioned above, DHEA is a nonspecific G6PD inhibitor. It may also cause inhibition of GABAA receptors [40] or an increase in spontaneous glutamate release [41]. In contrast, G6PDi-1 exerts more specific inhibition of G6PD [21]. Thus, our result suggests that in the activated hippocampal slices the PPP consumes 20% of overall glucose and this glucose is not utilized for the neuronal network activity.
Previous studies on isolated brain of monkeys [42] and rat [43], and cultured cerebellar neurons [44] assessed the contribution of glucose oxidation via PPP in the range 3-39%. This wide range, presumably, arise from using different species and experimental approaches. In general, our results are consistent with these observations.

3.2. Effect G6PDi-1 on basic and synaptically induced changes of intracellular ROS levels

To elucidate the effect of G6PDi-1 on basal levels and synaptically induced changes in intracellular ROS, we used the membrane-permeable fluorescent dye CellROX. Application of G6PDi-1 caused elevation of the basal level of intracellular ROS. Low-frequency stimulation of Schaffer collaterals (10 Hz, 30 s) also caused an increase in intracellular ROS. However, this activity-induced increase in ROS was not modulated by G6PDi-1.
These observations suggest that the oxidative branch of the PPP is involved in altering the basal level of intracellular ROS, while the synaptically induced rapid increase in ROS is unaffected by this metabolic pathway.

3.3 Effect G6PDi-1 on hydrogen peroxide (H2O2) production and epileptiform activity

A previous study using in vitro and in vivo models of epilepsy showed that seizure-like events are associated with rapid release of hydrogen peroxide (H2O2) mediated by NADPH oxidase (NOX) [19]. To clarify whether the glucose utilization by the oxidative branch of PPP is involved in the regulation of H2O2 release and epileptiform activity, we analyzed the effects of G6PD inhibition in the 4AP model of epileptic seizures in hippocampal slices.
In our experiments, spontaneous seizures caused a significant transient increase in H2O2 with peak amplitudes varying across slices from 2 to 8 μM. The addition of G6PDi-1 practically did not change these values, however it diminished the amplitude of H2O2 transients associated with interictal-like discharges and increased their frequency.
These observations may suggest the coincidence of two opposing processes: facilitation of H2O2 release (increased frequency) due to the weakening of glutathione-dependent antioxidant defense and a decrease in NOX-mediated H2O2 production (decreased amplitude). Indeed, both processes require NADPH, which production is ensured by the PPP. Therefore, by its inhibition we reduce the amount of substrate required for the both antioxidant defense and oxidative stress.
The G6PD inhibitor did not affect the frequency of spontaneous seizure-like events if all data are pooled together. However, we noted that in two out of four slices the drug decreased the frequency, while in the two others, it increased the SLE incidence. Such an opposite effect could be explained by different origins of the slices used for these experiments. When cutting sagittal slices, we cannot accurately determine whether they originate from the dorsal, intermediate, or ventral hippocampus. It is established that the dorsal hippocampus (DH) is involved in learning and memory associated with navigation, exploration, and locomotion, whereas the ventral hippocampus (VH) is involved in motivational and emotional behaviour [16]. These functions are supported by very distinct anatomical, morphological, molecular, electrophysiological properties of hippocampal cells (see for ref. Brancati 2021). The hippocampus structure is also highly heterogeneous at the gene level, from its dorsal to its ventral tip [45,46]. Also, to fuel the identical neuronal network activity DH and VH recruit differentially the energy metabolism pathways [18]. Therefore, the activity of PPP during SLEs could be different in slices cut from ventral or dorsal hippocampi. We tried to make transverse sections of the dorsal and ventral hippocampus using the method described in [47], but we were unable to induce spontaneous SLEs. Probably, with these cutting methods, long-distance connections, which are necessary for the occurrence of seizures are cut off [48].
In conclusion, this work is a first attempt to evaluate the effect of the specific G6PD inhibitor on the hippocampal neuronal network. Altogether our results suggest that G6PD inhibition suppresses the glucose consumption by the PPP. This pathway is not crucial for the generation of the normal activity of the hippocampal neuronal network; in case of the epileptiform activity there is no clear effect in the case of the explored model of SLE. The further studies should be carried out using another model ex vivo and in vivo.

4. Materials and Methods

4.1. Animals

Experiments were carried out on laboratory ICR (CD-1) outbred mice of both genders, aged in different series of experiments P20-34 and 2–3 months. Use of animals was carried out in accordance with the Guide for the Care and Use of Laboratory Animals (NIH Publication No. 85–23, revised 1996) and European Convention for the Protection of Vertebrate Animals used for Experimental and other Scientific Purposes (Council of Europe No. 123; 1985). All animal protocols and experimental procedures were approved by the Local Ethics Committee of Kazan State Medical University (No. 10; 20.12.2016) and the AMU Ethics Committee for Animal Experimentation (#30-03102012).

4.2. Brain Slices Preparation

In experiments devoted to monitoring electrical activity, oxygen and glucose consummation, brain slices were prepared from 2-3-month-old male mice. The mouse anesthetized with a mixture of sevoflurane (8%) and oxygen (1 L/min) was decapitated, the brain was rapidly removed from the skull and placed in the ice-cold artificial cerebrospinal fluid (ACSF). The ACSF solution consisted of (in mM): NaCl 126, KCl 3.5, NaH2PO4*H2O 1.2, NaHCO3 25, CaCl2*2H2O and MgCl2*6H2O 1.3, pH 7.3-7.4. ACSF was aerated by 95% O2 / 5% CO2 gas mixture. Sagittal slices (350 µm) were cut using a tissue slicer Leica VT 1200s (Leica Microsystem, Wetzlar, Germany). During cutting, slices were submerged in an ice-cold high K+ solution consisting of (in mM): K-gluconate 140, HEPES 10, Na-gluconate 15, EGTA 0.2, NaCl 4, pH adjusted to 7.2 by KOH. Slices were immediately transferred to a multisection, dual side perfusion chamber with constantly circulating ACSF and allowed to recover for 2 hours at room temperature (25°C). Slices were then transferred to a recording chamber continuously perfused (9 mL/min) with ACSF (33°C to 34°C) containing 5 mM glucose with access to both slice sides.
For registration of ROS intracellular changes, mice (P20-34) were anesthetized with isoflurane before decapitation. The brain was rapidly removed. Sagittal 350 μm thick slice of the cerebral hemispheres containing the hippocampus were cut using a vibratome (Model NVSLM1, World Precision Instruments) in ice-cold high K+ solution. Slices were immediately transferred in a chamber filled with oxygenated ACSF and allowed to recover for 2 hours at room temperature. Slices were then transferred to a recording chamber continuously perfused (15 mL/min) with ACSF (33°C).

4.3. LFP recording and synaptic stimulation

Shaffer collaterals were stimulated using the DS2A isolated stimulator (Digitimer Ltd, Hertfordshire, UK) with a bipolar electrode situated in the stratum radiatum of CA1 hippocampal region. Single pulses (60 to 150 µA, 200 ms) were delivered to induce a local field potential (LFP) of nearly 50-70% of maximal amplitude. LFPs were recorded using glass microelectrodes filled with ASCF, placed in CA1 stratum oriens and connected to the ISO DAM-8A amplifier (World Precision Instruments).

4.4. Glucose and H2O2 measurement

Tissue glucose concentrations were measured using enzymatic microelectrodes (tip diameter 25 μm, length 0.5 mm, polarization 0.5V, Sarissa Biomedical, UK) connected to a free radical analyzer TBR4100 (World Precision Instruments, Hitchin, UK). Calibration was performed after the first polarization and repeated after each experiment to ensure the sensor's unchanged sensitivity to the substrate.

4.5. Oxygen measurement

A Clark oxygen microelectrode (tip diameter 10 μm; Unisense Ltd, Denmark) was used to measure slice tissue pO2. The electrode was connected to a picoammeter (PA2000, Unisense Ltd). A two-point calibration was performed by inserting the electrode in normal ACSF (at 33°C) equilibrated with either 95% O2 or ambient air.

4.6. Pharmacology

The following drugs were used: G6PDi-1 (2.5 μM, Sigma-Aldrich, CAS No.: 2457232-14-1), CellROX™ Orange Reagent (5 μM, ThermoFisher, C10443), 4-aminopyridine (4AP) (50 μM, Sigma-Aldrich, CAS No.: 504-24-5).

4.7. Fluorescence monitoring of intracellular Reactive Oxygen Species (ROS)

CellROX Orange is cell-permeant dye, that exhibits fluorescence upon oxidation by ROS. To load cells with the dye, the sagittal hippocampal slices of 20-34-days-old mice were transferred into a microchamber with 2 mL ACSF containing 5 µM of ROS-sensitive fluorescent dye CellROX Orange. Slices were incubated at room temperature with oxygenation for 40 minutes and then washed during 40 min by ACSF. For fluorescence monitoring, slices were placed in the recording chamber with superfused oxygenated ACSF at 33°C. The fluorescence of CellROX Orange was excited by wavelength 505 nm, duration 700 ms with frequency 1 Hz, and emission fluorescence was recorded at wavelengths above 600 nm. To monitor changes in intracellular ROS (increase in fluorescence intensity) caused by stimulation of Shaffer collaterals, regions of interest (ROI) were selected in stratum radiatum of the hippocampal CA1area and in the cortex. The cortex area was used as the reference zone, where synaptic stimulation did not cause changes in fluorescence.
The bleaching of fluorescent dye and production and utilization of ROS occurred with time during the experiment. Therefore, the basic level of fluorescence intensity tended to constantly increase or decrease when one of the processes predominated. In order to eliminate these effects, the trend line was determined under control conditions, and taking into account the trend, the change in fluorescence under the action of the PPP inhibitor (G6PDi-1, 2.5 µM) was calculated.

4.8. Data analysis

Group measures were expressed as means ± SEM. Statistical significance was assessed using the Wilcoxon's signed paired test. The level of significance was set at p < 0.05. Nonparametric significance tests were used to evaluate the difference between H2O2 release in control (4AP only) and after G6PDi-1 addition. We calculated the 95% confidence interval (95% CI) of the median difference. In the text, the size of the difference is presented as median difference: [lower limit, upper limit of 95% CI]. This type of analysis was performed using the estimation statistics (website www.estimationstats.com). Signal analysis was performed using the IgorPro software (WaveMetrics, Inc., USA) with custom developed macros.

Author Contributions

Conceptualization: D.P., A.I., P.B.; methodology: D.P., A.I., P.B.; investigation: D.P, A.I.; writing: D.P., P.B; review and editing: D.P., A.I., P.B; supervision: P.B.; funding acquisition: P.B. All authors have read and agreed to the published version of the manuscript.

Funding

This research was funded by the Russian Scientific Foundation (project No. 18-15-00313.

Institutional Review Board Statement

The animal study protocol was approved by the Local Ethics Committee of Kazan State Medical University (No. 10; 20.12.2016) and the AMU Ethics Committee for Animal Experimentation (#30-03102012).

Acknowledgements

We are grateful to Dr. Yu. Zilberter for his original stimulation of this project and for discussions at the early stages of the study. We thank the Embassy of France in the Russia for providing a scholarship for Daria Ponomareva.

Conflicts of Interest

The authors declare no conflict of interest.

References

  1. Fioramonti, X.; Pénicaud, L.; Fioramonti, X.; Pénicaud, L. Carbohydrates and the Brain: Roles and Impact. Feed Your Mind - How Does Nutr. Modul. Brain Funct. throughout Life? 2019. [Google Scholar] [CrossRef]
  2. Nimgampalle, M.; Chakravarthy, H.; Devanathan, V. Glucose metabolism in the brain: An update. Recent Dev. Appl. Microbiol. Biochem. Vol. 2 2021, 77–88. [Google Scholar] [CrossRef]
  3. Rolland, F.; Winderickx, J.; Thevelein, J.M. Glucose-sensing mechanisms in eukaryotic cells. Trends Biochem. Sci. 2001, 26, 310–317. [Google Scholar] [CrossRef] [PubMed]
  4. Perl, A.; Hanczko, R.; Telarico, T.; Oaks, Z.; Landas, S. Oxidative stress, inflammation and carcinogenesis are controlled through the pentose phosphate pathway by transaldolase. Trends Mol. Med. 2011, 17, 395–403. [Google Scholar] [CrossRef] [PubMed]
  5. Tang, B.L. Neuroprotection by glucose-6-phosphate dehydrogenase and the pentose phosphate pathway. J. Cell. Biochem. 2019, 120, 14285–14295. [Google Scholar] [CrossRef] [PubMed]
  6. Manganelli, G.; Masullo, U.; Passarelli, S.; Filosa, S. Glucose-6-phosphate dehydrogenase deficiency: disadvantages and possible benefits. Cardiovasc. Hematol. Disord. Drug Targets 2013, 13, 73–82. [Google Scholar] [CrossRef] [PubMed]
  7. Longo, L.; Vanegas, O.C.; Patel, M.; Rosti, V.; Li, H.; Waka, J.; Merghoub, T.; Pandolfi, P.P.; Notaro, R.; Manova, K.; et al. Maternally transmitted severe glucose 6-phosphate dehydrogenase deficiency is an embryonic lethal. EMBO J. 2002, 21, 4229–4239. [Google Scholar] [CrossRef]
  8. Gupte, S.A. Glucose-6-phosphate dehydrogenase: a novel therapeutic target in cardiovascular diseases. Curr. Opin. Investig. Drugs 2008, 9, 993–1000. [Google Scholar]
  9. Boros, L.; Puigjaner, J.; Cascante, M.; research, W.L.-C. undefined Oxythiamine and dehydroepiandrosterone inhibit the nonoxidative synthesis of ribose and tumor cell proliferation. AACRLG Boros, J Puigjaner, M Cascante, WNP Lee, JL Brand. S Bassilian, FI YusufCancer Res. 1997. AACR.
  10. Liguori, R.; Giannoccaro, M.P.; Pasini, E.; Riguzzi, P.; Valentino, M.L.; Comi, G. Pietro; Carelli, V.; Bresolin, N.; Michelucci, R. Acute rhabdomyolysis induced by tonic-clonic epileptic seizures in a patient with glucose-6-phosphate dehydrogenase deficiency. J. Neurol. 2013, 260, 2669–2671. [Google Scholar] [CrossRef]
  11. Abul, M.; Azad, K.; Nazmul, M.; Chowdhury, H.; Abdullah, M.; Hasan, A.; Masum Emran, M.; Das, P.; Akther, M.; Emran, M.M. Progressive Myoclonic Epilepsy: Lafora Disease - Clinical and Genetic Findings. http://www.sciencepublishinggroup.com 2022, 11, 126. [Google Scholar]
  12. Ulusu, N.N.; Sahilli, M.; Avci, A.; Canbolat, O.; Ozansoy, G.; Ari, N.; Bali, M.; Stefek, M.; Stolc, S.; Gajdosik, A.; et al. Pentose phosphate pathway, glutathione -dependent enzymes and antioxidant defense during oxidative stress in diabetic rodent brain and peripheral organs: Effects of stobadine and vitamin E. Neurochem. Res. 2003, 28, 815–823. [Google Scholar] [CrossRef] [PubMed]
  13. Patel, M. Targeting Oxidative Stress in Central Nervous System Disorders. Trends Pharmacol. Sci. 2016, 37, 768–778. [Google Scholar] [CrossRef] [PubMed]
  14. Russell, R.L.; Siedlak, S.L.; Raina, A.K.; Bautista, J.M.; Smith, M.A.; Perry, G. Increased neuronal glucose-6-phosphate dehydrogenase and sulfhydryl levels indicate reductive compensation to oxidative stress in Alzheimer disease. Arch. Biochem. Biophys. 1999, 370, 236–239. [Google Scholar] [CrossRef] [PubMed]
  15. Ulusu, N.N. Glucose-6-phosphate dehydrogenase deficiency and Alzheimer’s disease: Partners in crime? The hypothesis. Med. Hypotheses 2015, 85, 219–223. [Google Scholar] [CrossRef] [PubMed]
  16. Moser, M.; Hippocampus, E.M. undefined Functional differentiation in the hippocampus. Wiley Online Libr. Moser, EI MoserHippocampus, 1998. Wiley Online Libr. 1998. [Google Scholar] [CrossRef]
  17. Fanselow, M.S.; Dong, H.W. Are the dorsal and ventral hippocampus functionally distinct structures? Neuron 2010, 65, 7–19. [Google Scholar] [CrossRef] [PubMed]
  18. Brancati, G.E.; Rawas, C.; Ghestem, A.; Bernard, C.; Ivanov, A.I. Spatio-temporal heterogeneity in hippocampal metabolism in control and epilepsy conditions. Proc. Natl. Acad. Sci. U. S. A. 2021, 118. [Google Scholar] [CrossRef]
  19. Malkov, A.; Ivanov, A.I.; Latyshkova, A.; Bregestovski, P.; Zilberter, M.; Zilberter, Y. Activation of nicotinamide adenine dinucleotide phosphate oxidase is the primary trigger of epileptic seizures in rodent models. Ann. Neurol. 2019, 85, 907–920. [Google Scholar] [CrossRef]
  20. Bedard, K.; Krause, K.H. The NOX family of ROS-generating NADPH oxidases: physiology and pathophysiology. Physiol. Rev. 2007, 87, 245–313. [Google Scholar] [CrossRef]
  21. Ghergurovich, J.M.; García-Cañaveras, J.C.; Wang, J.; Schmidt, E.; Zhang, Z.; TeSlaa, T.; Patel, H.; Chen, L.; Britt, E.C.; Piqueras-Nebot, M.; et al. A small molecule G6PD inhibitor reveals immune dependence on pentose phosphate pathway. Nat. Chem. Biol. 2020, 16, 731. [Google Scholar] [CrossRef] [PubMed]
  22. Ivanov, A.; Mukhtarov, M.; Bregestovski, P.; Zilberter, Y. Lactate Effectively Covers Energy Demands during Neuronal Network Activity in Neonatal Hippocampal Slices. Front. Neuroenergetics 2011, 3. [Google Scholar] [CrossRef] [PubMed]
  23. Dienel, G.A. Brain Glucose Metabolism: Integration of Energetics with Function. Physiol. Rev. 2019, 99, 949–1045. [Google Scholar] [CrossRef] [PubMed]
  24. Malkov, A.; Ivanov, A.I.; Buldakova, S.; Waseem, T.; Popova, I.; Zilberter, M.; Zilberter, Y. Seizure-induced reduction in glucose utilization promotes brain hypometabolism during epileptogenesis. Neurobiol. Dis. 2018, 116, 28–38. [Google Scholar] [CrossRef] [PubMed]
  25. Perreault, P.; Avoli, M. Physiology and pharmacology of epileptiform activity induced by 4-aminopyridine in rat hippocampal slices. 1991, 65, 771–785. [Google Scholar] [CrossRef]
  26. Smirnova, E.Y.; Chizhov, A. V.; Zaitsev, A. V. Presynaptic GABAB receptors underlie the antiepileptic effect of low-frequency electrical stimulation in the 4-aminopyridine model of epilepsy in brain slices of young rats. Brain Stimul. 2020, 13, 1387–1395. [Google Scholar] [CrossRef] [PubMed]
  27. Uttara, B.; Singh, A.; Zamboni, P.; Mahajan, R. Oxidative stress and neurodegenerative diseases: a review of upstream and downstream antioxidant therapeutic options. Curr. Neuropharmacol. 2009, 7, 65–74. [Google Scholar] [CrossRef]
  28. Angamo, E.A.; Haq, R.U.; Rösner, J.; Gabriel, S.; Gerevich, Z.; Heinemann, U.; Kovács, R. Contribution of Intrinsic Lactate to Maintenance of Seizure Activity in Neocortical Slices from Patients with Temporal Lobe Epilepsy and in Rat Entorhinal Cortex. Int. J. Mol. Sci. 2017, 18. [Google Scholar] [CrossRef]
  29. Pearson-Smith, J.N.; Patel, M. Metabolic Dysfunction and Oxidative Stress in Epilepsy. Int. J. Mol. Sci. 2017, 18. [Google Scholar] [CrossRef]
  30. Pestana, R.R.F.; Kinjo, E.R.; Hernandes, M.S.; Britto, L.R.G. Reactive oxygen species generated by NADPH oxidase are involved in neurodegeneration in the pilocarpine model of temporal lobe epilepsy. Neurosci. Lett. 2010, 484, 187–191. [Google Scholar] [CrossRef]
  31. Shin, E.J.; Jeong, J.H.; Chung, Y.H.; Kim, W.K.; Ko, K.H.; Bach, J.H.; Hong, J.S.; Yoneda, Y.; Kim, H.C. Role of oxidative stress in epileptic seizures. Neurochem. Int. 2011, 59, 122–137. [Google Scholar] [CrossRef] [PubMed]
  32. McElroy, P.B.; Liang, L.P.; Day, B.J.; Patel, M. Scavenging reactive oxygen species inhibits status epilepticus-induced neuroinflammation. Exp. Neurol. 2017, 298, 13–22. [Google Scholar] [CrossRef] [PubMed]
  33. Puttachary, S.; Sharma, S.; Stark, S.; Thippeswamy, T. Seizure-induced oxidative stress in temporal lobe epilepsy. Biomed Res. Int. 2015, 2015. [Google Scholar] [CrossRef] [PubMed]
  34. Shekh-Ahmad, T.; Kovac, S.; Abramov, A.Y.; Walker, M.C. Reactive oxygen species in status epilepticus. Epilepsy Behav. 2019, 101. [Google Scholar] [CrossRef] [PubMed]
  35. Marks, P.A.; Banks, J. Inhibition of mammalian glucose-6-phosphate dehydrogenase by steroids. Proc. Natl. Acad. Sci. U. S. A. 1960, 46, 447–452. [Google Scholar] [CrossRef]
  36. Monaco, M. Di; Pizzini, A.; Gatto, V.; … L.L.-B. journal of; 1997, undefined Role of glucose-6-phosphate dehydrogenase inhibition in the antiproliferative effects of dehydroepiandrosterone on human breast cancer cells. nature.comM Di Monaco, A Pizzini, V Gatto, L Leonardi, M Gall. E Brignardello, G BoccuzziBritish J. cancer, 1997. nature.com. [CrossRef]
  37. Girón, R.A.; Montaño, L.F.; Escobar, M.L.; López-Marure, R. Dehydroepiandrosterone inhibits the proliferation and induces the death of HPV-positive and HPV-negative cervical cancer cells through an androgen- and estrogen-receptor independent mechanism. FEBS J. 2009, 276, 5598–5609. [Google Scholar] [CrossRef] [PubMed]
  38. Prough, R.A.; Clark, B.J.; Klinge, C.M. Novel mechanisms for DHEA action. J. Mol. Endocrinol. 2016, 56, R139–R155. [Google Scholar] [CrossRef]
  39. Malkov, A.; Ivanov, A.I.; Popova, I.; Mukhtarov, M.; Gubkina, O.; Waseem, T.; Bregestovski, P.; Zilberter, Y. Reactive oxygen species initiate a metabolic collapse in hippocampal slices: Potential trigger of cortical spreading depression. J. Cereb. Blood Flow Metab. 2014, 34, 1540–1549. [Google Scholar] [CrossRef]
  40. Demirgören, S.; Majewska, M.D.; Spivak, C.E.; London, E.D. Receptor binding and electrophysiological effects of Dehydroepiandrosterone sulfate, an antagonist of the GABAA receptor. Neuroscience 1991, 45, 127–135. [Google Scholar] [CrossRef]
  41. Dong, L.Y.; Cheng, Z.X.; Fu, Y.M.; Wang, Z.M.; Zhu, Y.H.; Sun, J.L.; Dong, Y.; Zheng, P. Neurosteroid dehydroepiandrosterone sulfate enhances spontaneous glutamate release in rat prelimbic cortex through activation of dopamine D1 and sigma-1 receptor. Neuropharmacology 2007, 52, 966–974. [Google Scholar] [CrossRef]
  42. Hostetler, K.Y.; Landau, B.R.; White, R.J.; Albin, M.S.; Yashon, D. Contribution of the pentose cycle to the metabolism of glucose in the isolated, perfused brain of the monkey. J. Neurochem. 1970, 17, 33–39. [Google Scholar] [CrossRef] [PubMed]
  43. Rodriguez-Rodriguez, P.; Fernandez, E.; Bolaños, J.P. Underestimation of the pentose–phosphate pathway in intact primary neurons as revealed by metabolic flux analysis. J. Cereb. Blood Flow Metab. 2013, 33, 1843. [Google Scholar] [CrossRef] [PubMed]
  44. Jekabsons, M.B.; Gebril, H.M.; Wang, Y.H.; Avula, B.; Khan, I.A. Updates to a 13C metabolic flux analysis model for evaluating energy metabolism in cultured cerebellar granule neurons from neonatal rats. Neurochem. Int. 2017, 109, 54. [Google Scholar] [CrossRef] [PubMed]
  45. Thompson, C.L.; Pathak, S.D.; Jeromin, A.; Ng, L.L.; MacPherson, C.R.; Mortrud, M.T.; Cusick, A.; Riley, Z.L.; Sunkin, S.M.; Bernard, A.; et al. Genomic anatomy of the hippocampus. Neuron 2008, 60, 1010–1021. [Google Scholar] [CrossRef]
  46. Dong, H.W.; Swanson, L.W.; Chen, L.; Fanselow, M.S.; Toga, A.W. Genomic-anatomic evidence for distinct functional domains in hippocampal field CA1. Proc. Natl. Acad. Sci. U. S. A. 2009, 106, 11794–11799. [Google Scholar] [CrossRef] [PubMed]
  47. Malik, R.; Dougherty, K.A.; Parikh, K.; Byrne, C.; Johnston, D. Mapping the electrophysiological and morphological properties of ca 1 pyramidal neurons along the longitudinal hippocampal axis. Wiley Online Libr. Malik, KA Dougherty, K Parikh, C Byrne, D JohnstonHippocampus, 2016. Wiley Online Libr. 2016, 26, 341–361. [Google Scholar] [CrossRef]
  48. Isaeva, E.; Romanov, A.; Holmes, G.L.; Isaev, D. Status epilepticus results in region-specific alterations in seizure susceptibility along the hippocampal longitudinal axis. Epilepsy Res. 2015, 110, 166–170. [Google Scholar] [CrossRef]
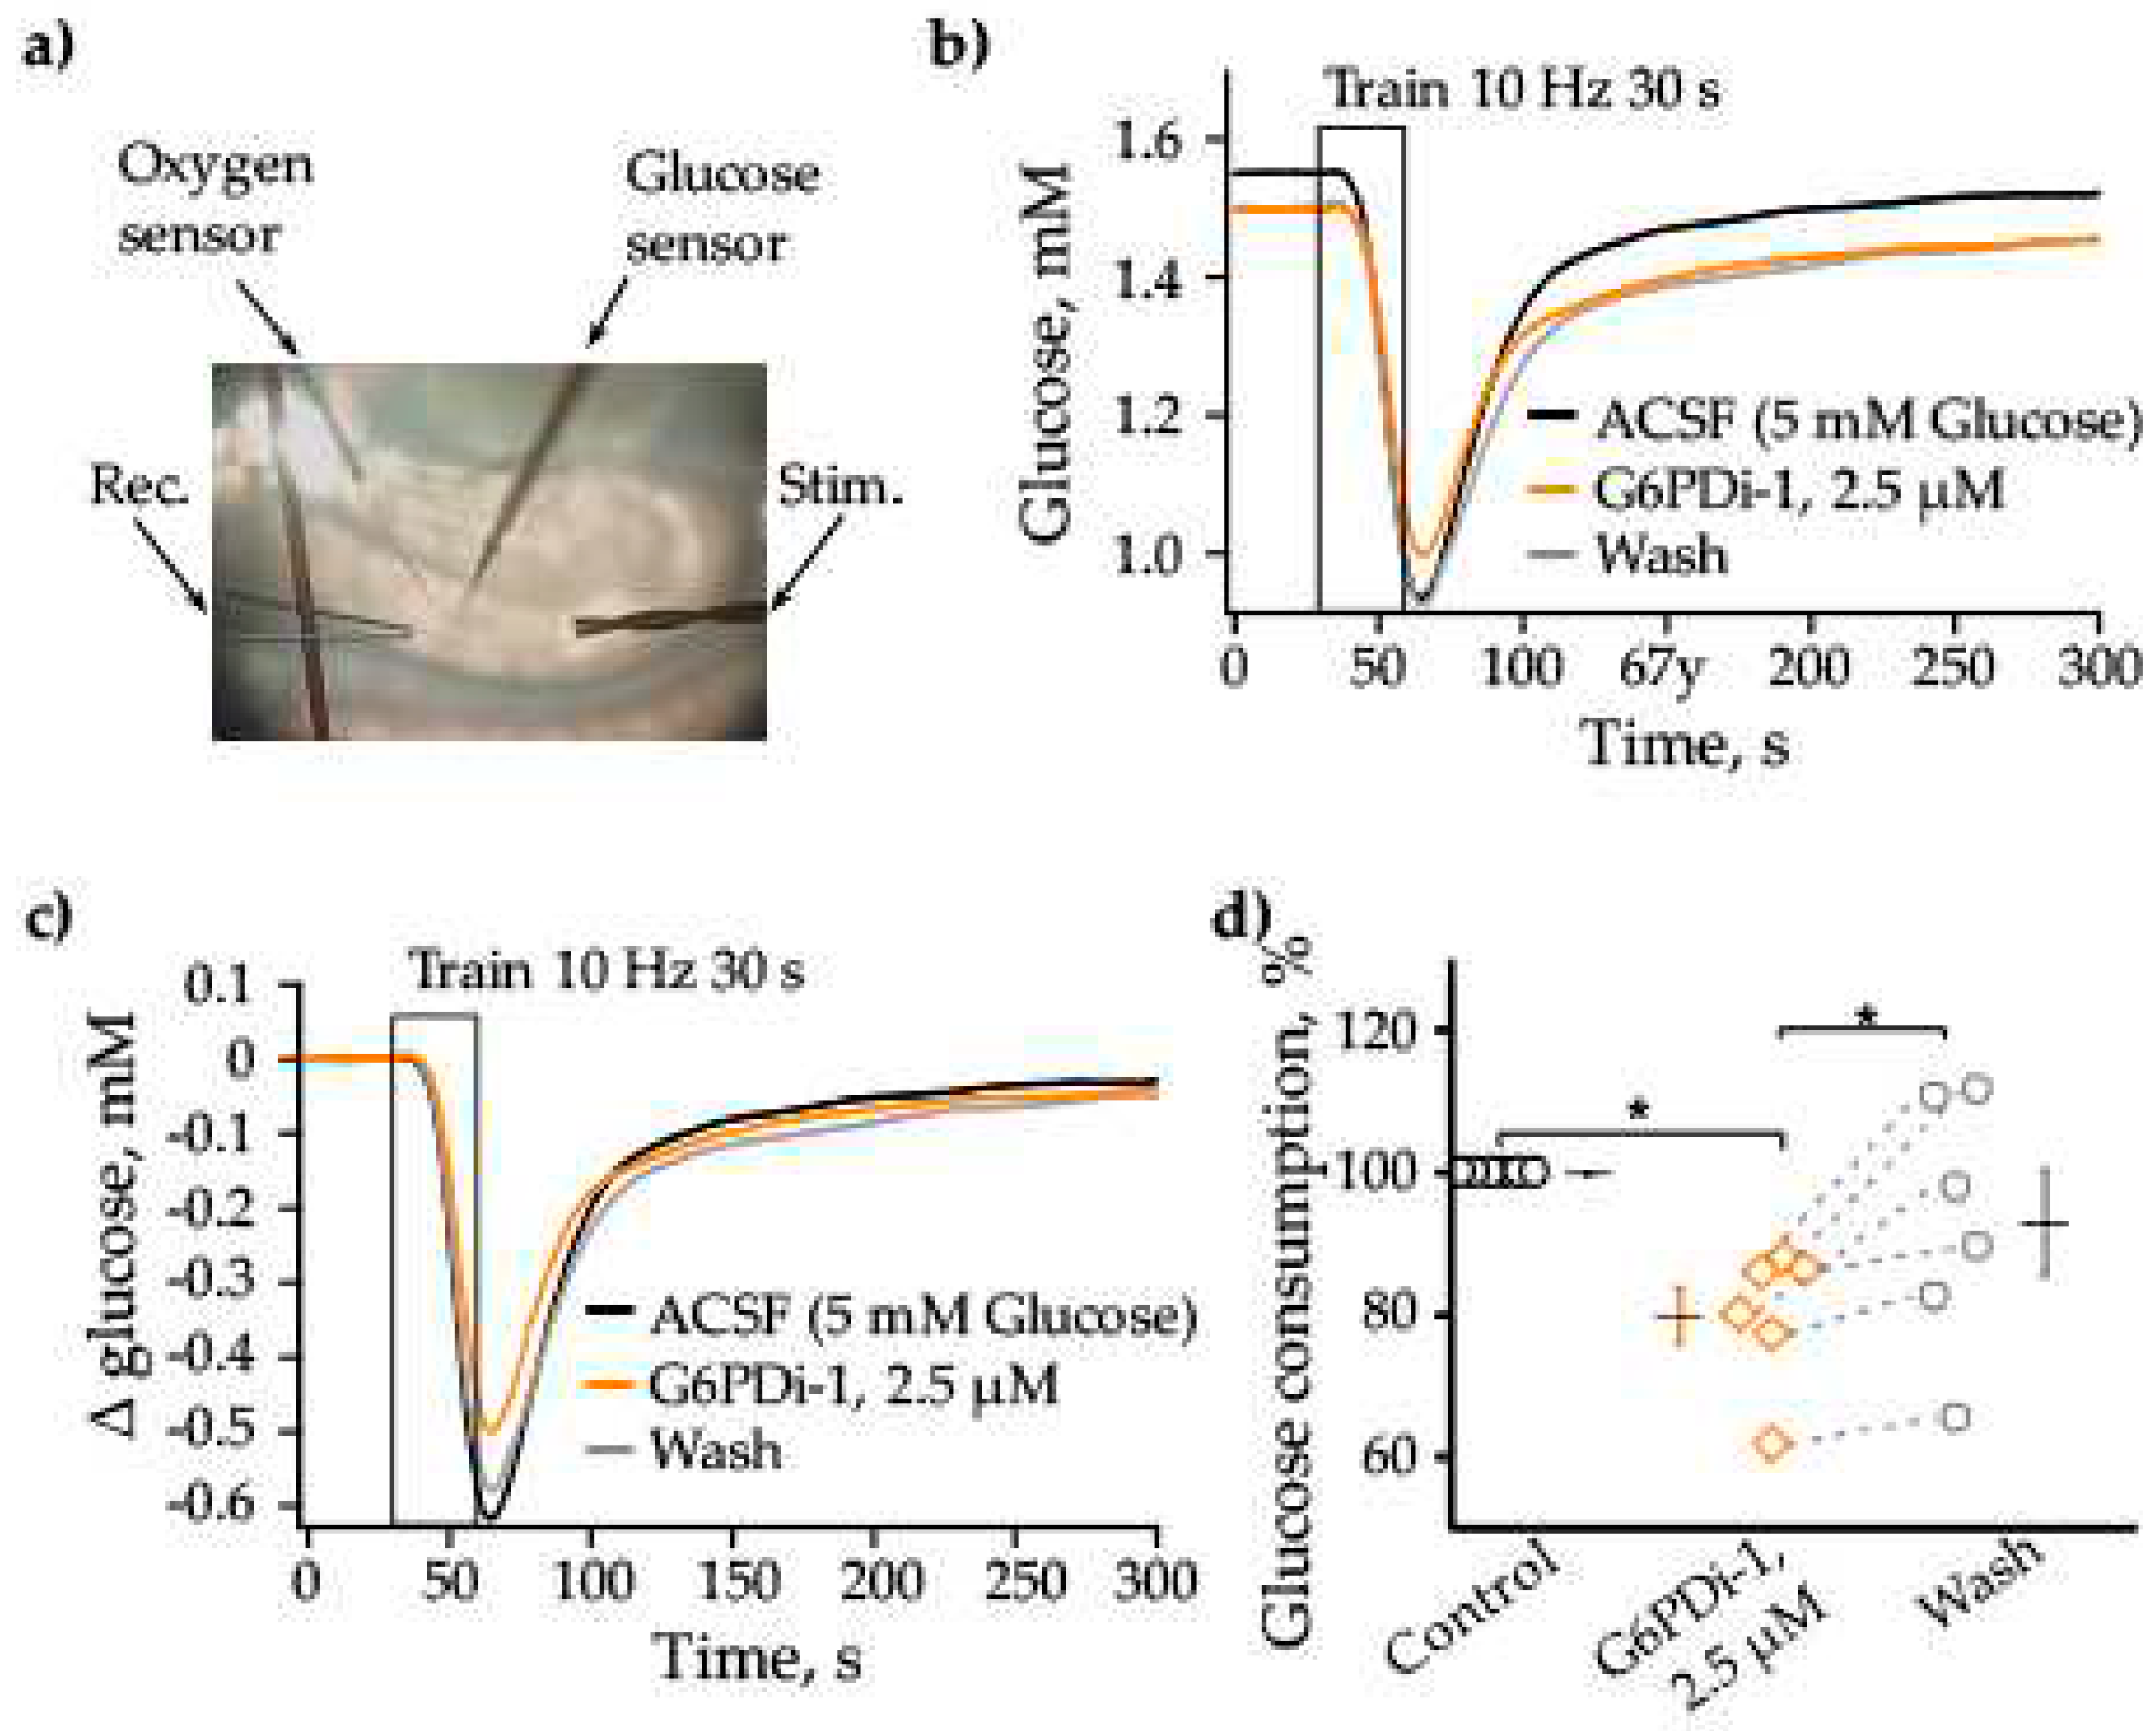
Figure 2. The G6PDi-1 action on glucose during synaptic stimulation. (a) Placement of the Oxygen and Glucose sensors, recording and stimulation electrodes on the slices. Changes of Glucose (b) induced by 10 Hz 30 s stimulation on one slice: in control – black line, G6PDi-1 action (2.5 μM) – orange line and washing – gray (Age mouse: 3 Month). The superimposed glucose changes are shown on figure (c). Summarized data showed changes Glucose, n=6 (d). Each point in the group is represents a separate slice, and the line shows the change of parameter when conditions change. Black line illustrates the mean, whiskers – standard error (SE). * - p < 0.05 (Wilcoxson pair test).
Preprints 93660 g002
Figure 4. The G6PDi-1 action on oxygen during synaptic stimulation. (a) Changes of Oxygen induced by Shaffer collaterals stimulation (10 Hz 30 s) on one slice: in control– black line, G6PDi-1 action (2.5 μM) – orange line and washing – gray (Age mouse: 3 Month). (b) Summarized data of changes of oxygen consumption integrals and oxygen transient amplitude (n=7, age 2-3 Mo). The black line illustrates the mean, whiskers – SE.
Preprints 93660 g004
Figure 6. Effect G6PDi-1 on electrical activity and peak amplitude of extracellular H2O2 production during spontaneous SLEs induced by 4AP. a) Representative traces of local field potential (black) and extracellular H2O2 (green) that are recorded before and after addition of G6PDi-1 (orange). Below, at expanded time scale, examples of associated extracellular H2O2 changes during spontaneous epileptiform events are shown. Frequency of spontaneous seizures (b, c) and peak amplitude of hydrogen peroxide release during spontaneous epileptiform events (d, e), that occurred in the presence of 4AP (black), after the addition of G6PDi-1(orange) and after washing (gray), illustrated with examples from two slices. f) Summary of normalized H2O2 release amplitudes during spontaneous SLEs in the presence of 4AP, after addition of G6PDi-1 and after washing (n=4).
Preprints 93660 g006
Disclaimer/Publisher’s Note: The statements, opinions and data contained in all publications are solely those of the individual author(s) and contributor(s) and not of MDPI and/or the editor(s). MDPI and/or the editor(s) disclaim responsibility for any injury to people or property resulting from any ideas, methods, instructions or products referred to in the content.
Copyright: This open access article is published under a Creative Commons CC BY 4.0 license, which permit the free download, distribution, and reuse, provided that the author and preprint are cited in any reuse.
Prerpints.org logo

Preprints.org is a free preprint server supported by MDPI in Basel, Switzerland.

Subscribe

© 2024 MDPI (Basel, Switzerland) unless otherwise stated