1. Introduction
The COVID19 vaccines were authorised for sale in 2020 under an Emergency Use Authorisation (EUA). This authorisation was based on clinical trials of inappropriate design and of incomplete execution. In particular the clinical trials used disease specific endpoints instead of all–case mortality or morbidity, thus overestimating the benefit and concealing the harm [
1]. Consequently, the clinical trials could not (nor had been designed to) conclude on prevention of infection or transmission, or on prevention of hospitalisation, severe disease or death [
2]. Moreover, clinical trials were still on–going, hence limited data were available and absolute risk reduction metrics were not reported, which led to reporting bias [
3]. Hence, at the time of the EUA, vaccine safety – and still less vaccine efficiency – had not been proven.
The roll–out of the COVID19 vaccination was followed by an unprecedented increase in the number of reports on adverse effects submitted to the Vaccine Adverse Event Reporting System (VAERS) database in the United States of America (USA).
Several studies have analysed the VAERS data focusing on different aspects, namely occurrence of myocarditis and pericarditis [
4], and occurrence of deaths with age and comorbidity [
5,
6]. Other studies have analysed similar vaccine reporting systems, namely the Suspected Adverse Effects (SAE) in the European Union/European Economic Area (EU/EEA), focusing on the inhomogeneous toxicity across vaccine batches [
7]. Vaccine toxicity should pose a scientific concern for vaccine formulation and a quality concern for vaccine manufacturing, given the implications to public health [
8].
The quantitative relations inferred from these studies establish a strong correlation between COVID19 vaccines and adverse effects. However, to our knowledge no study was focused on establishing a causal relation. In this study we present a formalism to infer a causal relation between COVID19 vaccine and adverse effects, and hence assess the safety of COVID19 vaccines. To minimise the impact of confounding factors [
9], among the adverse effects we focused on deaths as the indisputable measure of vaccine safety.
Since the VAERS database relies on a spontaneous (or passive) reporting of adverse events that occur following vaccination, it is inherently limited and hence it should be analysed with caution [
10]. Having these limitations in mind, we specify the working assumptions on the data, the theoretical properties of the selected methods, and the limitations of the current formalism.
The study is organised as follows. In
Section 2, we present the VAERS data set and describe the data processing and data selection for the subsequent analysis. In
Section 3, we organise the data per vaccine manufacturer and per symptom, producing a demographic analysis of the patient population. In
Section 4, we organise the data per vaccine manufacturer and per vaccine lot, producing a homogeneity analysis of each COVID19 vaccine. In
Section 5, we organise the data per vaccine manufacturer in time and measure the lag–correlation between pairs of dates. Finally, in
Section 6, we conclude with insights from the current analysis and plans for the future analysis.
2. The VAERS data
2.1. VAERS data files
Data on the adverse effects of the COVID19 vaccine were downloaded on 1 Feb 2022 from VAERS
1 in the form of comma–separated value files. We selected this data download to minimise contamination from subsequent vaccine doses. For each year
, we obtain the following three files:
the [YEAR]VAERSDATA.csv file contains information related to the vaccine’s recipient (e.g. age, sex, state, patient outcomes, dates) and consists of: an array of size 50036 rows and 35 columns for year = 2020, and an array of size 748690 rows and 35 columns for year = 2021;
the [YEAR]VAERSVAX.csv file contains information related to the vaccine (e.g. vaccine name, manufacturer, lot number, number of previous doses administered) and consists of: an array of size 60054 rows and 8 columns for year = 2020, and an array of size 792969 rows and 8 columns for year = 2021;
the [YEAR]VAERSSYMPTOMS.csv file contains information on the adverse events, grouped into five columns, with entries in text (e.g. ) and in coded terms using the MedDRA dictionary (e.g. ) and consists of: an array of size 61335 rows and 11 columns for year = 2020, and an array of size 1001256 rows and 11 columns for year = 2021.
The files have a column named containing the VAERS identification number, which we use to match the entries across the three files.
2.2. Processing of VAERS data
For each year we combined the data from the three files on the column obtaining: an array of size 50036 rows and 52 columns for year = 2020, and an array of size 748687 rows and 52 columns for year = 2021. We then concatenated the combined data from all years, resulting an array of size 798723 rows and 52 columns. We removed rows with null entries in the column named containing the vaccine manufacturer (which corresponds to a fraction of 0.02) or with null entries in the column named containing the vaccine lot (which corresponds to a fraction of 0.32). Hence, the resulting array has size 535526 rows and 52 columns.
We checked the consistency between deaths (as read off of column ) and death dates (as read off of column ). Of all 7047 deaths (i.e. ), 6604 had valid death date (which corresponds to a fraction of 0.94) and 6762 had valid onset date (which corresponds to a fraction of 0.96). While all valid death dates correspond to deaths, there are deaths with an invalid death date. Of the 443 deaths with invalid death dates, 213 had valid onset dates (as read off of column ); conversely, of the 285 deaths with invalid onset dates, 55 had valid death dates. An idea was to assign the corresponding onset date (if valid) to the invalid death date, and conversely to assign the corresponding death date (if valid) to the invalid onset date.
Before making the assignment, we proceeded to check if the death cases (i.e. ) contained death in any of the five symptom columns. Of the 213 deaths with valid onset dates and invalid death dates, 156 contained death among the symptoms, so we assigned the onset date to the death date. Of the 55 deaths with valid death date and invalid onset dates, 34 contained death among the symptoms, so we assigned the death date to the onset date. Of the 230 death cases with invalid death date and invalid onset date, 152 contained death among the symptoms, so we removed them. We also checked if non–death cases (i.e. ) indeed did not contain death among the symptoms. Of the 26 non–death cases with death listed as a symptom, all had invalid death date but valid onset date, so we assigned the onset date to the death date and moreover changed to
Finally, we removed the rows with null onset date or null vaccination date (as read off of column ). Hence, the resulting array has size 499824 rows and 52 columns.
We also checked the consistency between pairs of date columns. Noting that the onset date must come after the vaccination date, and that the received date (as read off of column ) must come after the onset date, then the differences and s must always be positive. In the case of death, nothing that the death date must come after the vaccination date, then the difference must always be positive. We removed all rows that violated these conditions, and set the lower time bound as the minimum value of and the upper time bound as the maximum value of The resulting array has size 491402 rows and 52 columns, and covers the interval [12–02–1900, 31–12–2021].
2.3. Selection of VAERS data
Since we are interested in analysing the adverse effects of the COVID19 vaccines only, we selected the entries with COVID19 in the column and set a lower bound to the vaccination date of 01–10–2020. The resulting array has size 454573, rows and 52 columns, and covers the interval [01–10–2020, 21–12–2021].
Moreover, since we are interested in identifying vaccine lots, we removed the entries with invalid values in the columns The resulting array has size 452091 rows and 52 columns.
3. Demographic analysis of the VAERS data
3.1. Organisation of VAERS data per vaccine manufacturer
We selected the VAERS data on the COVID19 vaccine manufacturers (as read off of column
). In particular, we filtered the data by the three vaccine manufacturers, namely: JANSSEN, MODERNA and PFIZER\BIONTECH.
2 We produced the distribution of the VAERS data by
(
Figure 1, left panel). The fraction of entries per
is [0.08, 0.47, 0.45].
For each
we produced distributions of the demographical characteristics of the corresponding sample, in particular by sex, read off of column
(
Figure 1, centre panel) and by age bin of length 10, obtained from column
(
Figure 1, right panel), so that the age bin labelled
corresponds to the interval
Regarding sex per
we observe that the fraction of each sex is [0.60, 0.71, 0.68] for females, [0.40, 0.28, 0.31] for males, with the remaining fraction referring to unknown value. Regarding age per per
we observe that the median age is [45, 54, 47] and that the 90 percentile corresponds to the age bins labelled [60, 70, 70], with the top age bins being [60, 70, 60].
We also produced the distribution of the VAERS data by vaccine manufacturer, grouped by adverse effects, in particular grouped by hospitalisation (read off of column i.e. whether the patient required hospitalisation) and by deaths (read off of column i.e. whether the patient died). We observe that fractions [0.089, 0.054, 0.076] of entries required hospitalisation, whereas fractions [0.017, 0.013, 0.015] of entries led to death.
To contextualise the occurrence of deaths, from the subsample defined by
we produced the same distributions as above for the VAERS entries corresponding to deaths (
Figure 2).We show the distribution of deaths per
in
Figure 2, left panel. The fraction of entries per
is [0.09, 0.44, 0.47].
Regarding sex per
we observe that the fraction of each sex is [0.42, 0.40, 0.44] for females, [0.58, 0.60, 0.55] for males, with the remaining fraction referring to unknown value (
Figure 2, centre panel). Regarding age per
VAX_MANU, we observe that the median death age is [67, 76, 76] and that the 90 percentile corresponds to the age bins labelled [80, 90, 90], with the top age bins being [70, 80, 90] (
Figure 2, right panel). Regarding hospitalisation per
we observe that fractions [0.46, 0.33, 043] of entries corresponding to deaths required hospitalisation which correspond to fractions [0.008, 0.004, 0.006] of all entries.
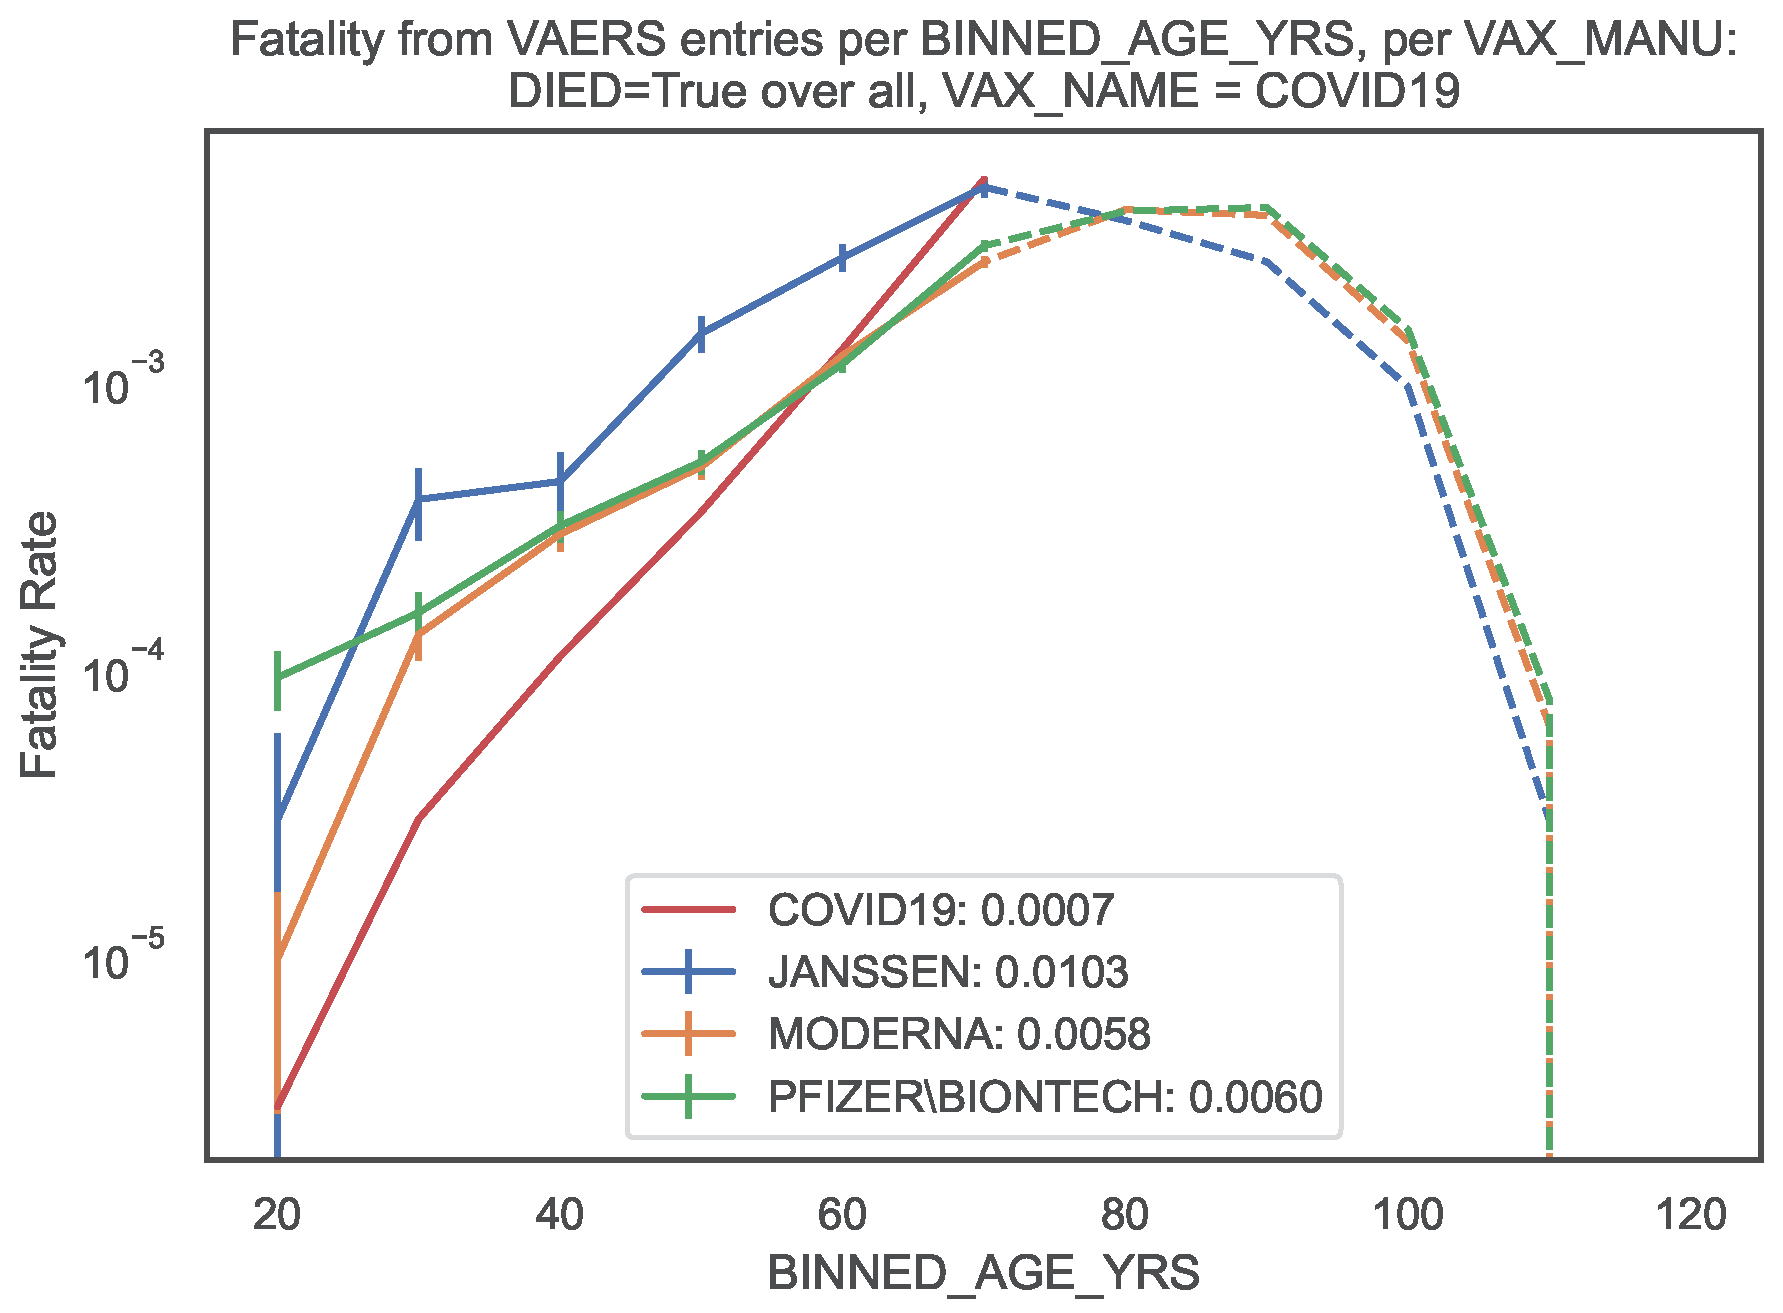
We then compared the COVID19 vaccine fatality rate per
with the COVID19 infection fatality rate (IFR) obtained in the latest meta–regression analysis [
11]. According to Ref. [
11], the median IFR of COVID19 per age bin ranges between
and
whereas the global IFR of COVID19 is
for 0–69 years old (
Table 1, last column). Note that the focus of Ref. [
11] was on an accurate estimate of the IFR of COVID19 among non–elderly people, motivated by the fact that non–elderly people (i.e. younger than 70 years old) represent 94% of the global population.
Conversely, in the sample of vaccinated patients covered by the VAERS records, our results show vaccine fatality rates per
between 10 and
times (i.e. between one and two orders of magnitude) larger than the IFR of COVID19 in almost all age bins, the sole exception being the [60, 70[ bin where the fatality rates are of the same order of magnitude (
Table 1). This amounts to a global vaccine fatality over all age bins of order 0.02. We also computed the global vaccine fatality over all age bins up to 70, finding [0.010, 0.006, 0.006] per
hence of order 0.01.
3 For an easier visualisation, we plotted the fatality rates per age bin in
Figure 3. The global vaccine fatality rate for non–elderly people is non–negligible and moreover up to two orders of magnitude larger than the IFR of COVID19 in the sample of infected patients in Ref. [
11].
3.2. Organisation of VAERS data per vaccine manufacturer, per symptom
We produced the distribution of the VAERS data by COVID19 vaccine manufacturer, grouped by symptom (read off of columns SYMPTOM#). We observe that SYMPTOM1 is the only symptom column that does not have missing values, with the columns from SYMPTOM2 to SYMPTOM5 having progressively more missing values.
We also produced the distribution of the top–10 most frequent symptoms per symptom column separately for each COVID19 vaccine manufacturer. We observe that the top–10 most frequent entries in column SYMPTOM_1 over all VAX_MANU are {Chills, Arthralgia, Dizziness, COVID–19, Asthenia, Fatigue, Injection site erythema, Headache, Expired product administered, Erythema}.
To contextualise the severity of the reported symptoms, using the subsample defined by DIED=True, we produced the distribution of the top–10 most frequent symptoms corresponding to deaths. We observe that the top–10 most frequent entries in column SYMPTOM_1 over all VAX_MANU are {Death, COVID–19, Acute respiratory failure, Asthenia, Acute kidney injury, Cardiac arrest, Autopsy, Abdominal pain, COVID–19 pneumonia, Cerebrovascular accident}.
For an easier reading, in
Table 2, we list the top–10 most frequent symptoms in column
SYMPTOM_1 per
VAX_MANU, both for the entire sample and for the subsample
DIED=
True.
3.3. Comparison of VAERS data per vaccine name
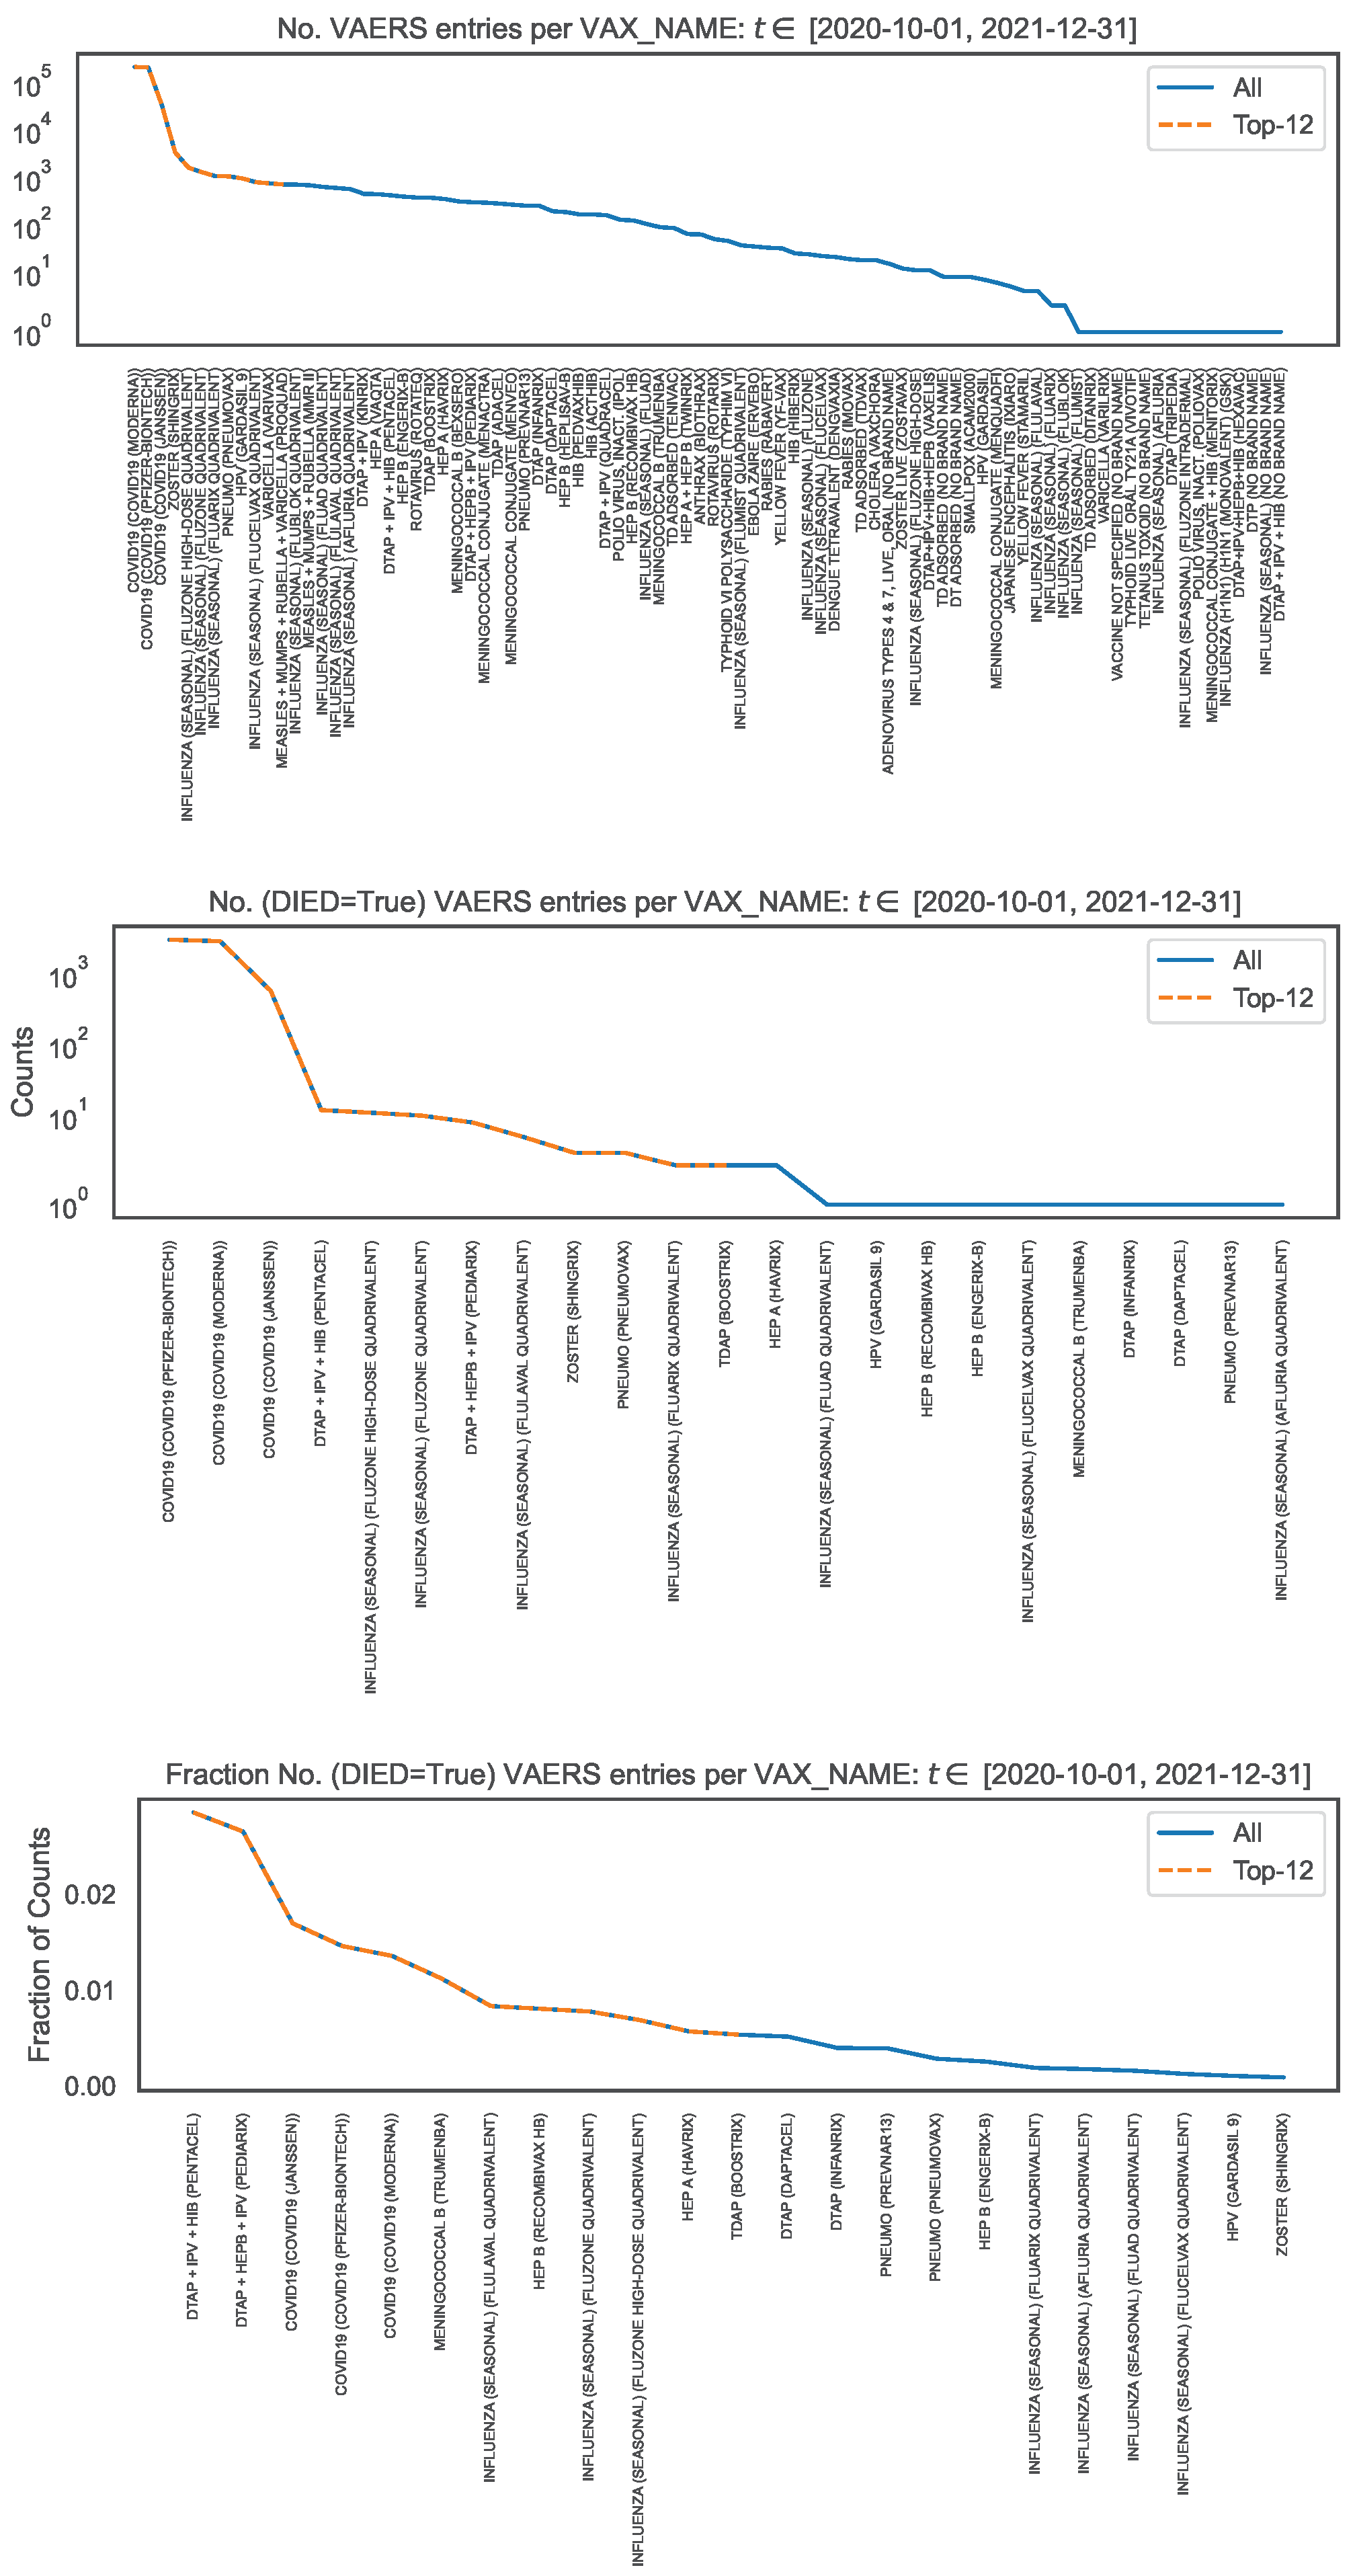
To contextualise the counts of symptoms, we looked at the VAERS data over all vaccine names (read off of column
VAX_NAME) for the same time interval and produced the distribution of the number of VAERS entries per
VAX_NAME (
Figure 4, top panel). Note that
Figure 1, left panel, covers a subset of
Figure 4 corresponding to
We observe that the number of VAERS entries for each COVID19 vaccine is
times (i.e. two orders of magnitude) larger than for the vaccines with the next largest number of entries (i.e. ZOSTER, INFLUENZA and HPV).
4
To contextualise the counts of symptoms within the occurrence of deaths, using the subsample defined by
DIED=
True, we produced the distribution per
VAX_NAME of the number of VAERS entries corresponding to deaths (
Figure 4, middle panel), and the corresponding distribution normalised to the number of VAERS entries in each
VAX_NAME (
Figure 4, bottom panel). We observe that the number of VAERS deaths for each COVID19 vaccine is
times (i.e. two orders of magnitude) larger than for the vaccines with the next largest number of deaths (i.e. DTAP+IPV+HIB, INFLUENZA and DTAP+HEPB+IPV). We also observe that, within the VAERS data, the fatality rate of the COVID19 vaccines is only surpassed by the fatality rate of the DTAP+IPV+HIB vaccine and of the DTAP+HEPB+IPV vaccine.
Figure 1.
Distribution of the COVID19 vaccine manufacturer, by sex and age bin, in the entire VAERS sample. Left panel: Size of the sample of each vaccine manufacturer; Centre panel: Size of the sample per sex. Right panel: Size of the sample per age bin, normalised to the size of the sample.
Figure 1.
Distribution of the COVID19 vaccine manufacturer, by sex and age bin, in the entire VAERS sample. Left panel: Size of the sample of each vaccine manufacturer; Centre panel: Size of the sample per sex. Right panel: Size of the sample per age bin, normalised to the size of the sample.
Figure 2.
Distribution of the COVID19 vaccine manufacturer, by sex and age bin, in the VAERS subsample restricted to deaths. Left panel: Size of the sample of each vaccine manufacturer; Centre panel: Size of the sample per sex. Right panel: Size of the sample per age bin, normalised to the size of the sample.
Figure 3.
Fatality rate per age bin of COVID19 infection and of COVID19 vaccination (per vaccine manufacturer). Filled lines: Fatality rates (of infection [
11] and of vaccination) per age bin up to 70 years old. Dashed lines: Fatality rates (of vaccination only) per age bin larger than or equal to 70 years old. In the legend, we indicate the fatality rate over all age bins up to 70 years old.
Figure 4.
Distribution of vaccine name, in the entire VAERS sample. Top panel: Number of entries per vaccine name. Middle panel: Number of death entries per vaccine name. Bottom panel: Number of death entries per vaccine name, normalised to the number of entries per vaccine name.
Figure 4.
Distribution of vaccine name, in the entire VAERS sample. Top panel: Number of entries per vaccine name. Middle panel: Number of death entries per vaccine name. Bottom panel: Number of death entries per vaccine name, normalised to the number of entries per vaccine name.
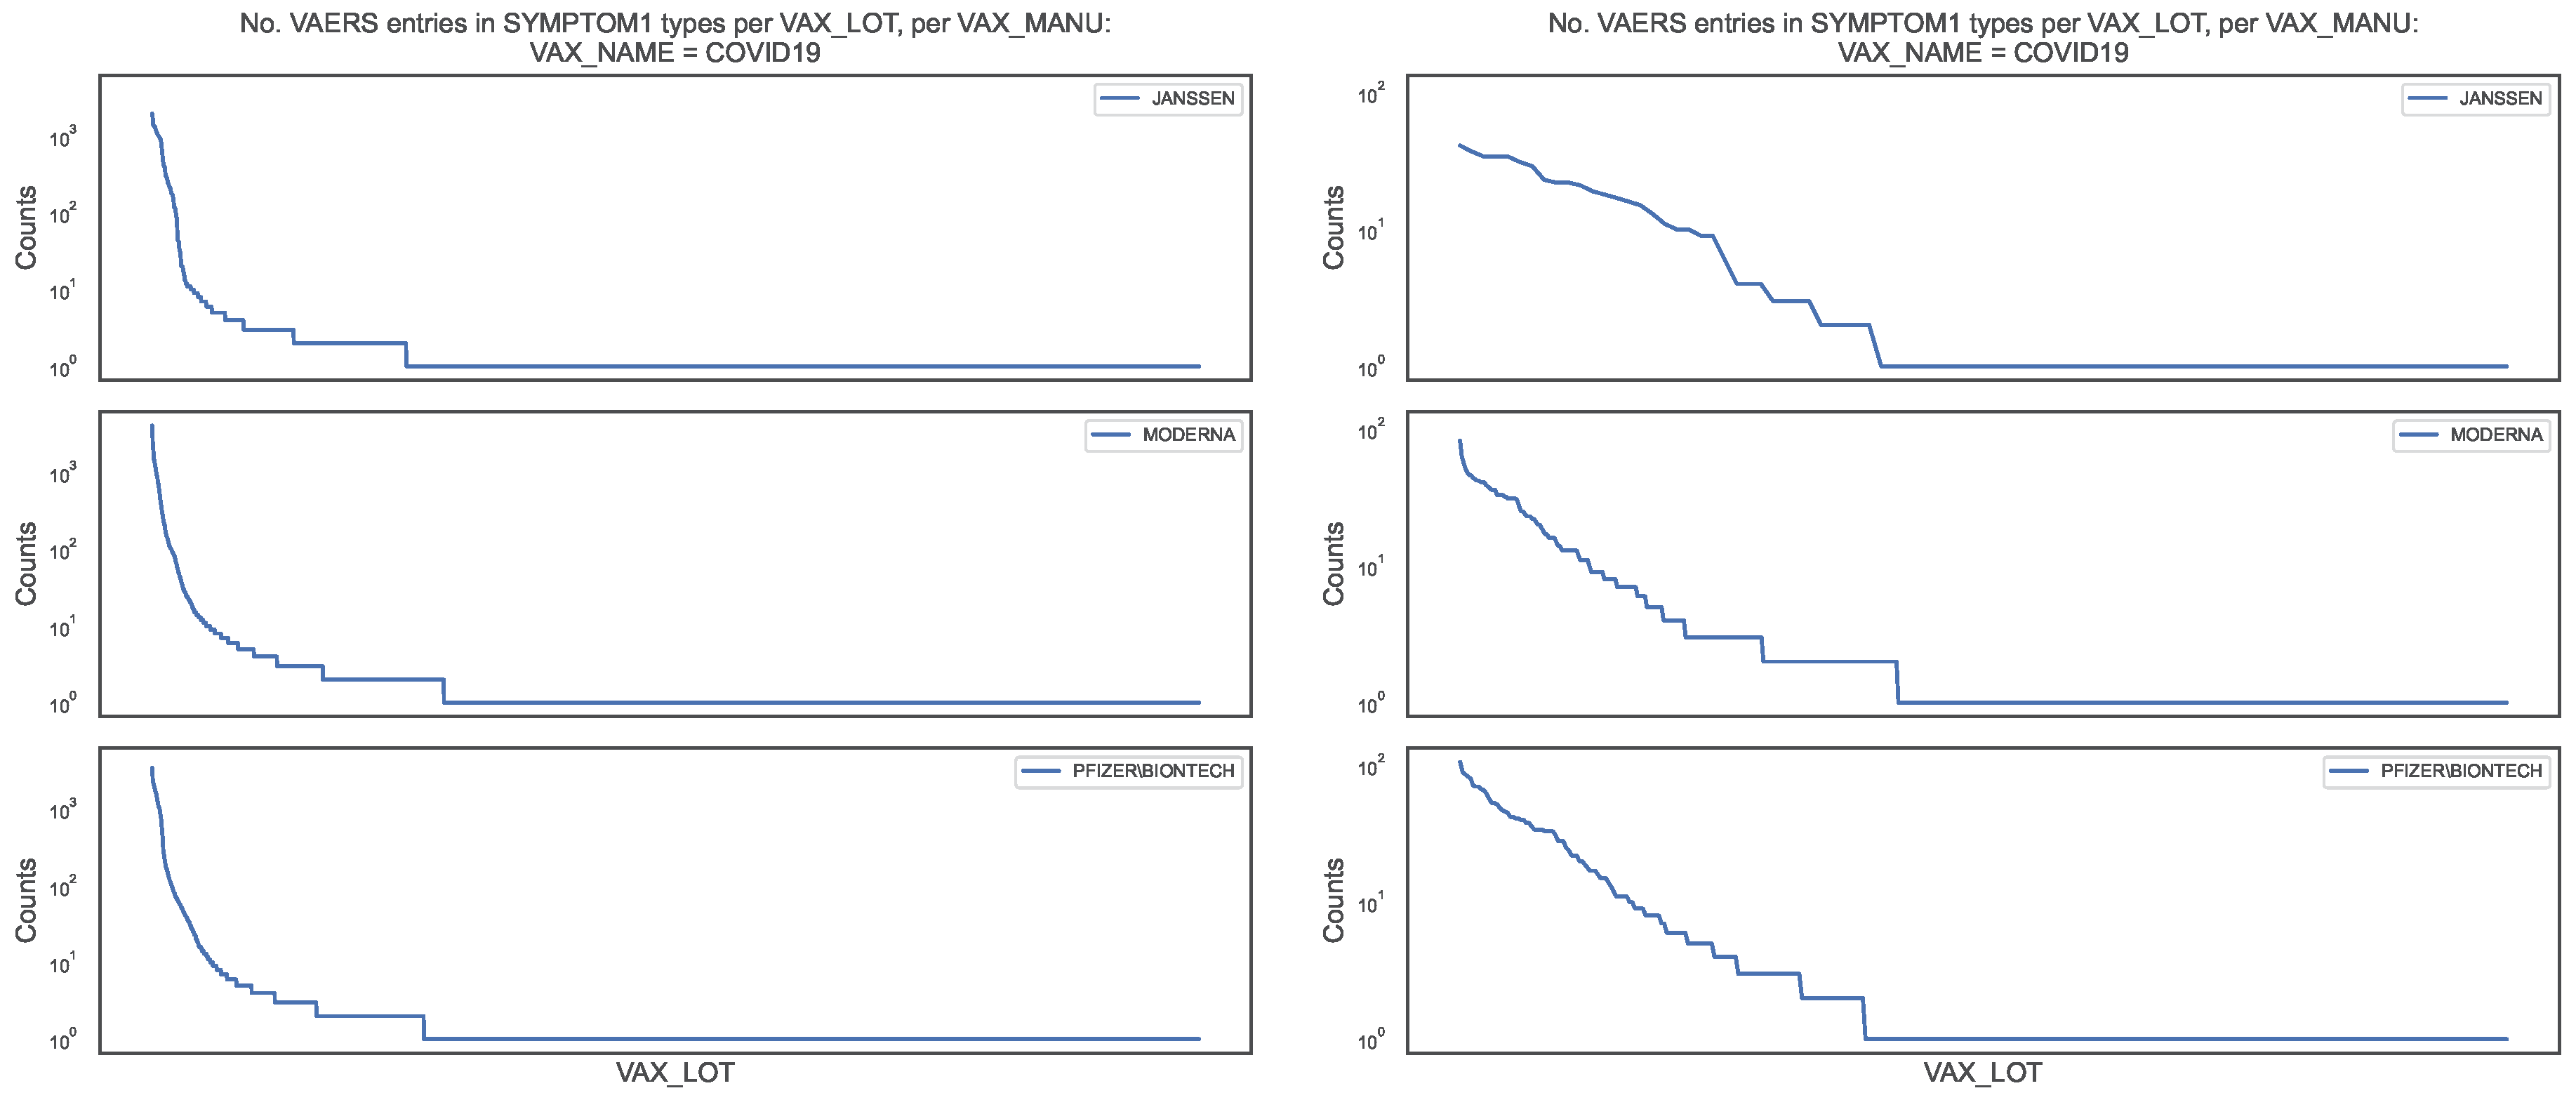
Figure 5.
Distribution of the COVID19 vaccine manufacturer, by vaccine lot, in the VAERS data. Left panel: Counts of column SYMPTOM1 per vaccine lot for entire sample; Right panel: Counts of column SYMPTOM1 per vaccine lot for the DIED = True subsample.
Figure 5.
Distribution of the COVID19 vaccine manufacturer, by vaccine lot, in the VAERS data. Left panel: Counts of column SYMPTOM1 per vaccine lot for entire sample; Right panel: Counts of column SYMPTOM1 per vaccine lot for the DIED = True subsample.
Figure 6.
Distribution of the COVID19 vaccine manufacturer, by vaccine lot, in the VAERS data,
for the entire sample (blue line) and for theDIED = Truesubsample (orange dots). Left panel:
Counts of column SYMPTOM1 per vaccine lot; Right panel: Top–100 vaccine lots in the counts of column
SYMPTOM1.
Figure 6.
Distribution of the COVID19 vaccine manufacturer, by vaccine lot, in the VAERS data,
for the entire sample (blue line) and for theDIED = Truesubsample (orange dots). Left panel:
Counts of column SYMPTOM1 per vaccine lot; Right panel: Top–100 vaccine lots in the counts of column
SYMPTOM1.
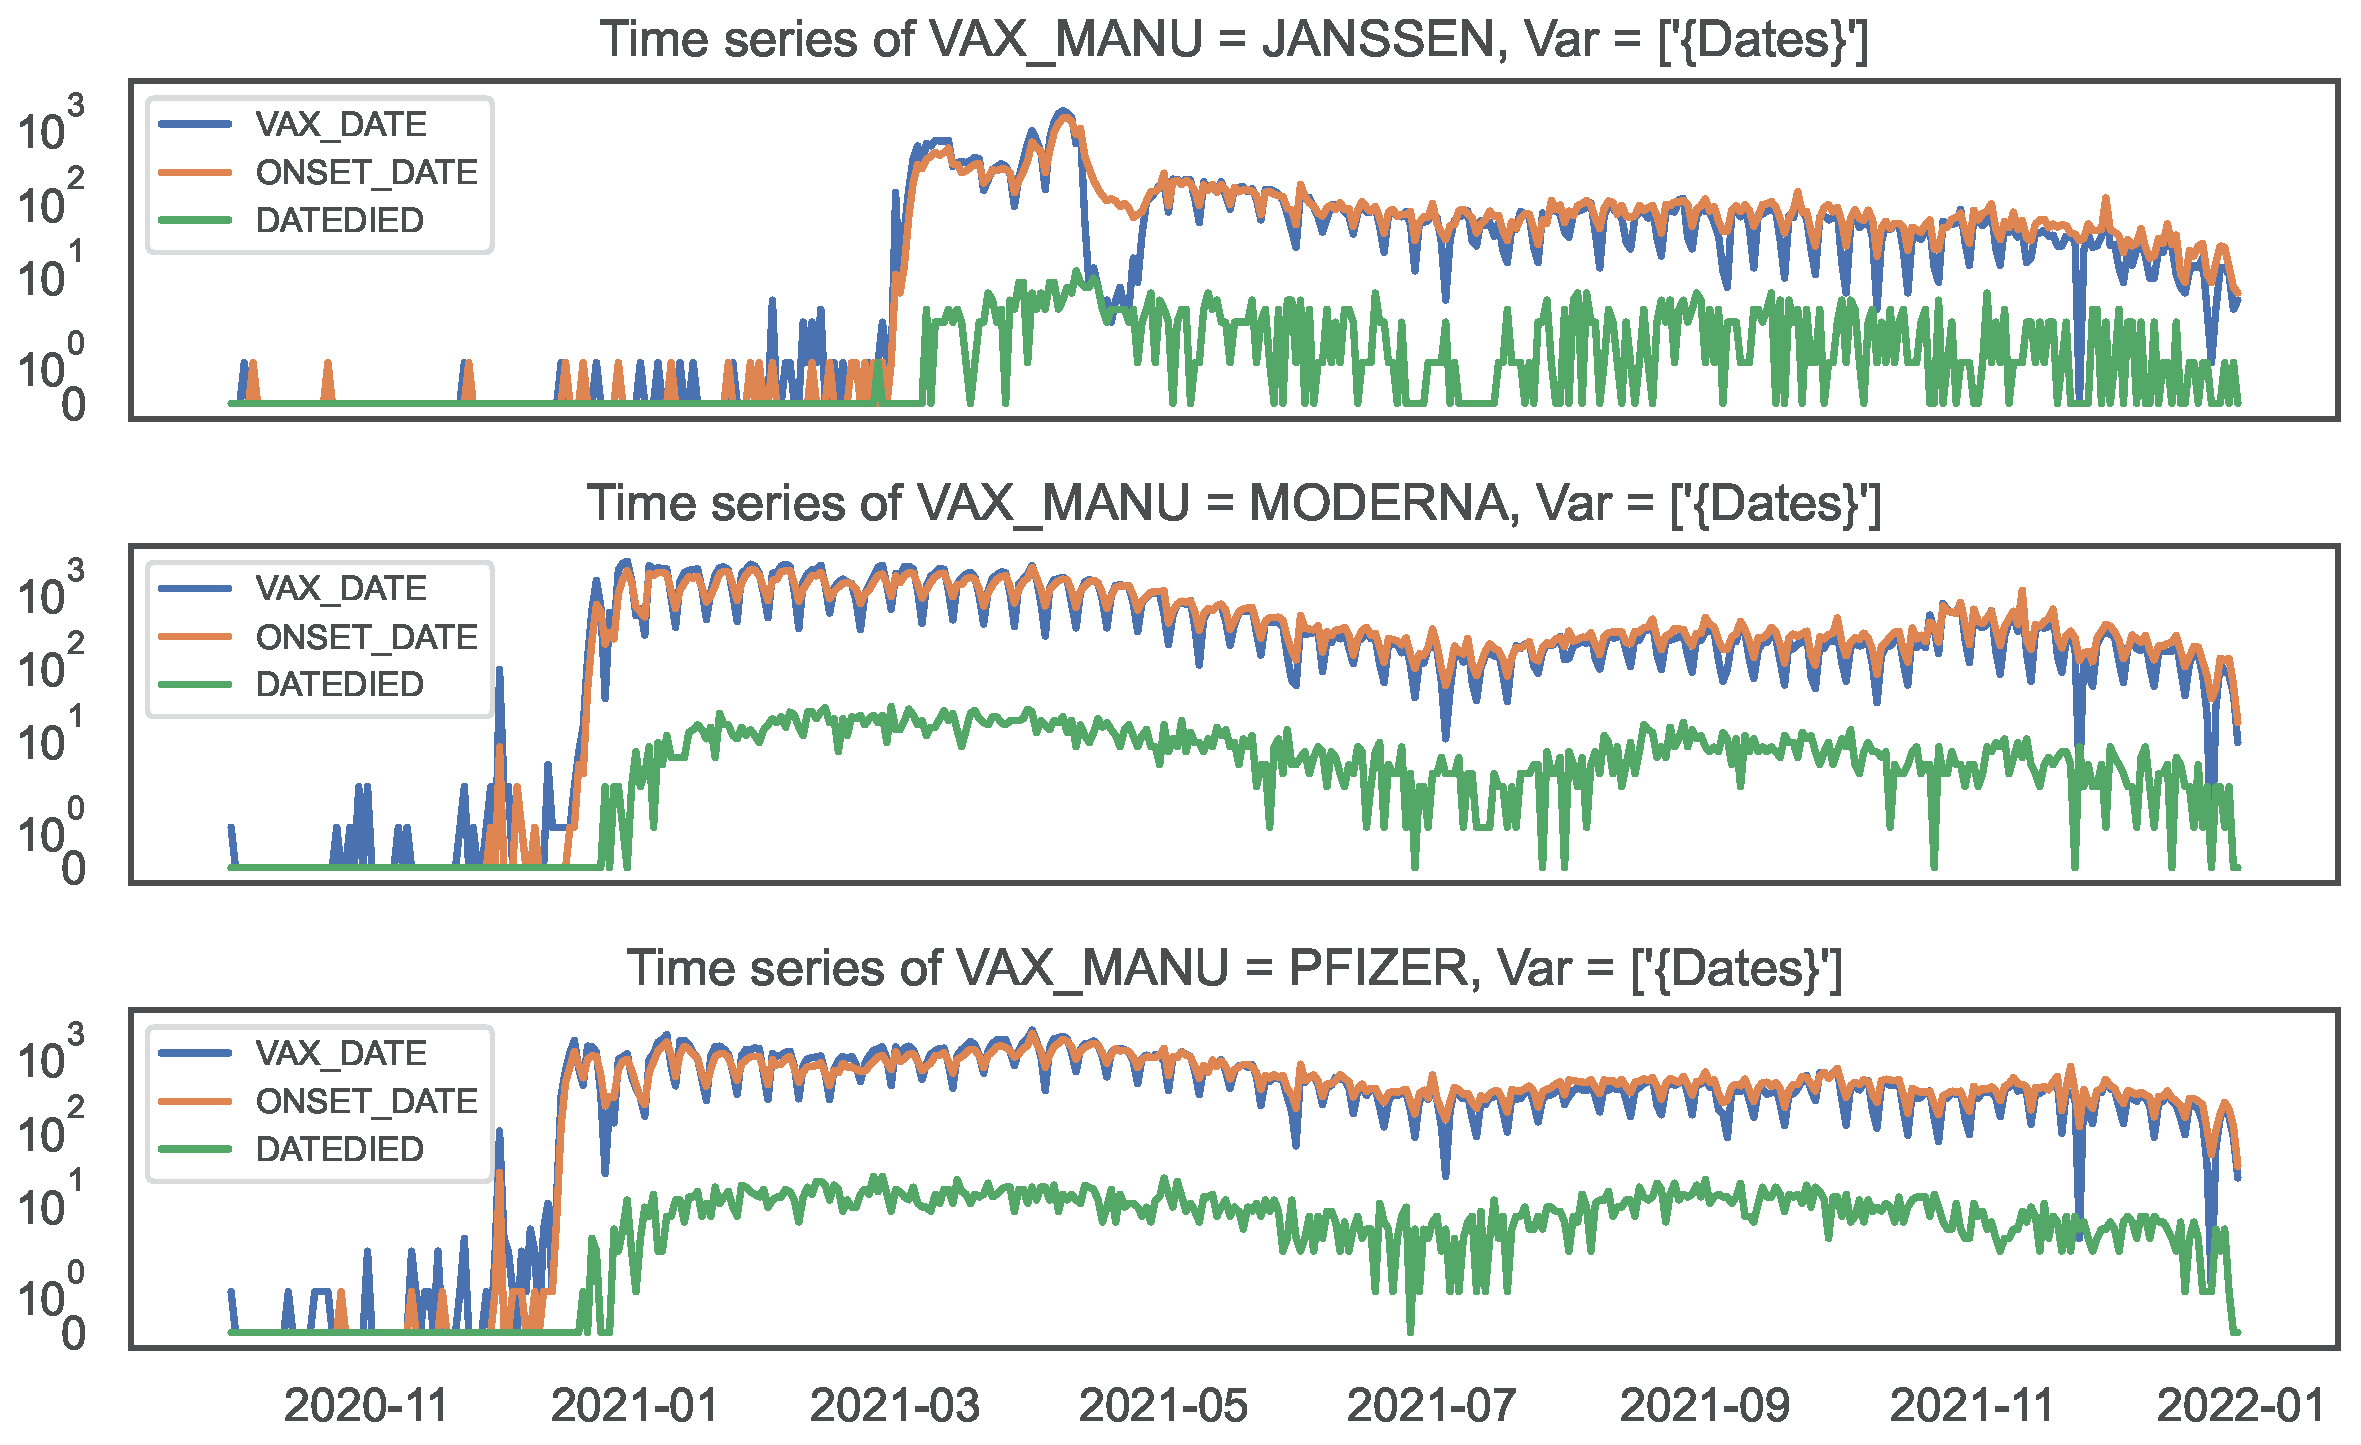
Figure 7.
Time series of counts by date, by COVID19 vaccine manufacturer, in the VAERS data.
Top panel: JANSSEN; Middle panel: MODERNA; Bottom panel: PFIZER\BIONTECH.
Figure 7.
Time series of counts by date, by COVID19 vaccine manufacturer, in the VAERS data.
Top panel: JANSSEN; Middle panel: MODERNA; Bottom panel: PFIZER\BIONTECH.
Figure 8.
Lag–correlation between the time series at VAX_DATE, ONSET_DATE and DATEDIED, per
COVID19 vaccine manufacturer, in the entire VAERS sample. Left panel: JANSSEN; Centre panel:
MODERNA; Right panel: PFIZER\BIONTECH
Figure 8.
Lag–correlation between the time series at VAX_DATE, ONSET_DATE and DATEDIED, per
COVID19 vaccine manufacturer, in the entire VAERS sample. Left panel: JANSSEN; Centre panel:
MODERNA; Right panel: PFIZER\BIONTECH
Figure 9.
Maximum lag–correlation between the time series at VAX_DATE, ONSET_DATE and
DATEDIED, per COVID19 vaccine manufacturer, in the entire VAERS sample. Left panel:
LagCorr(VAX_DATE, ONSET_DATE, lmax); Centre panel: LagCorr(ONSET_DATE, DATEDIED, lmax); Right
panel: LagCorr(VAX_DATE, DATEDIED, lmax).
Figure 10.
Time lag corresponding to the maximum lag–correlation between the time
series at VAX_DATE, ONSET_DATE and DATEDIED, per COVID19 vaccine manufacturer, in
the entire VAERS sample. Left panel: LagCorr(VAX_DATE, ONSET_DATE, lmax); Centre panel:
LagCorr(ONSET_DATE, DATEDIED, lmax); Right panel: LagCorr(VAX_DATE, DATEDIED, lmax).
Figure 11.
Maximum lag–correlation between the time series at VAX_DATE, ONSET_DATE and
DATEDIED, per COVID19 vaccine manufacturer, in the VAERS subsample restricted to deaths. Left
panel: LagCorr(VAX_DATE, ONSET_DATE, lmax); Centre panel: LagCorr(ONSET_DATE, DATEDIED, lmax);
Right panel: LagCorr(VAX_DATE, DATEDIED, lmax).
Figure 12.
Time lag corresponding to the maximum lag–correlation between the time series
at VAX_DATE, ONSET_DATE and DATEDIED, per COVID19 vaccine manufacturer, in the VAERS
subsample restricted to deaths. Left panel: LagCorr(VAX_DATE, ONSET_DATE, lmax); Centre panel:
LagCorr(ONSET_DATE, DATEDIED, lmax); Right panel: LagCorr(VAX_DATE, DATEDIED, lmax).
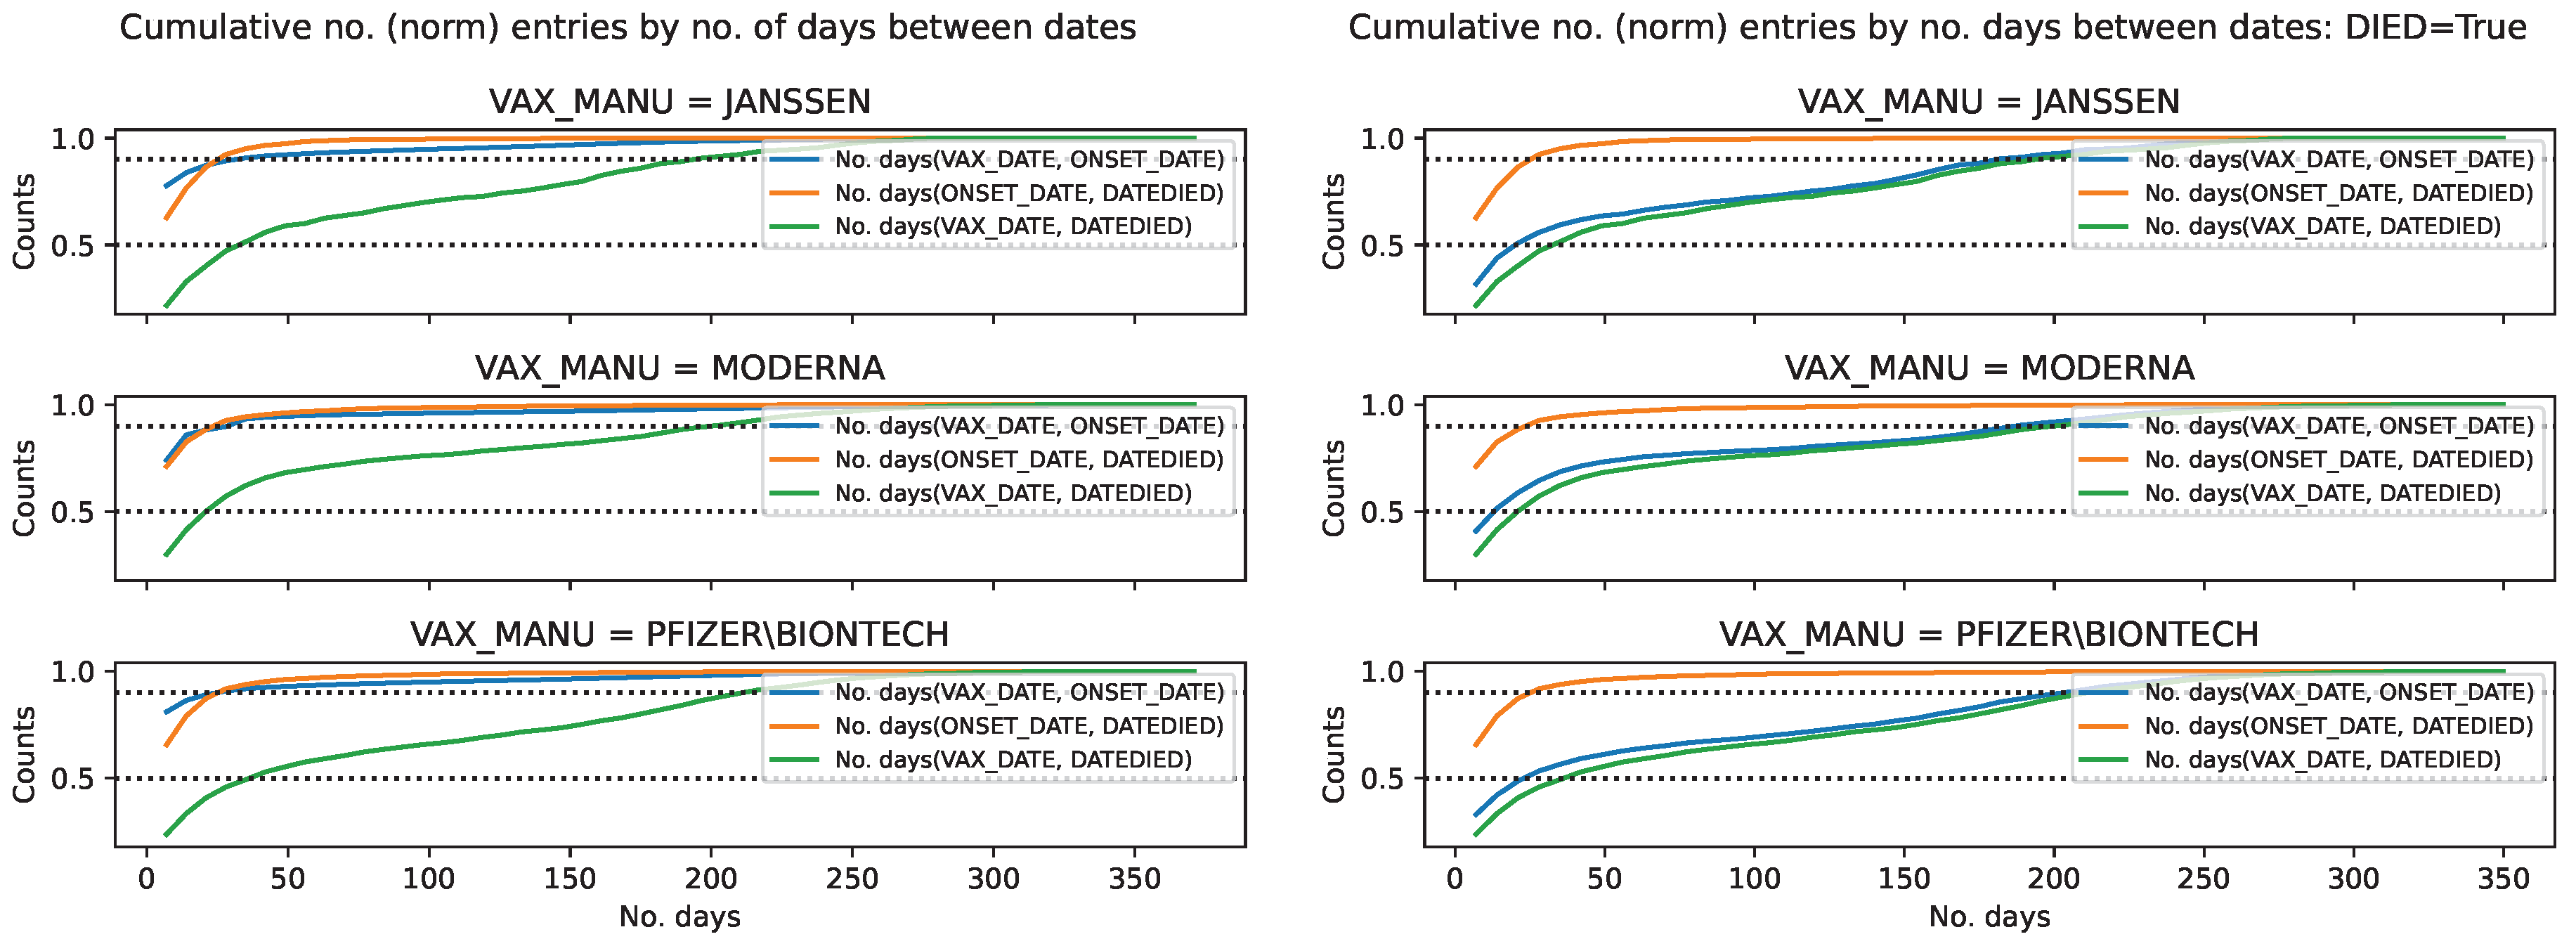
Figure 13.
Cumulative distribution of the COVID19 vaccine manufacturer, by the difference
between pairs of dates, in the VAERS data. Normalised cumulative number of entries for the
difference between pairs of dates, per COVID19 vaccine manufacturer, with the horizontal lines
at 0.5 and 0.9 marking the 50 and 90 percentile respectively. Left panel: Entire sample. Right panel:
Subsample restricted to deaths.
Table 1.
Fatality rate per age bin. Column 1: Age bin over which the infection rates were computed. Columns 2–4: Infection fatality rate of COVID19 vaccine per vaccine manufacturer per age bin. Column 5: Median infection fatality rate of COVID19 infection per age bin. The errors of the fatality rate were computed by the propagation of the errors of a division of counts, where the error of each count n is given by .
| Age bin |
JANSSEN |
MODERNA |
PFIZER\BIONTECH |
COVID19 |
|
|
|
|
|
|
|
|
|
|
|
|
|
|
|
|
|
|
|
|
|
|
|
|
|
|
|
|
|
|
|
|
|
|
|
|
|
|
|
|
|
|
|
|
|
|
|
|
|
|
Table 2.
Symptoms with the top number of entries per columnSYMPTOM1, per COVID19 vaccine manufacturer. Row 1: COVID19 vaccine manufacturers. Row 2: Specification of the sample used to count vaccine lots: entire sample (denoted by “All") and subsample restricted to deaths (denoted by ); Row 3: Number of vaccine lots per sample (fraction of lots with respect to the number of lots in entire sample); Row 4: List of symptoms with the top number of entries per column SYMPTOM1, per sample.
| |
JANSSEN |
MODERNA |
PFIZER\BIONTECH |
| SYMPTOM1 |
All |
|
All |
|
All |
|
| No. |
2047 |
88 |
14874 |
567 |
11266 |
396 |
| (fraction wrt All) |
|
(0.043) |
|
(0.038) |
|
(0.035) |
| Top–10 |
Chills |
Death |
Chills |
Death |
Dizziness |
Death |
| |
Dizziness |
COVID–19 |
Arthralgia |
COVID–19 |
Chills |
COVID–19 |
| |
Arthralgia |
Acute resp fail |
Inj erythema |
Asthenia |
Arthralgia |
Acute resp fail |
| |
Asthenia |
Asthenia |
Dizziness |
Acute resp fail |
COVID–19 |
Acute kidney inj |
| |
COVID–19 |
Acute kidney inj |
Exp product |
Cardiac arrest |
Asthenia |
Asthenia |
| |
Headache |
Autopsy |
Asthenia |
Acute kidney inj |
Product err |
Cardiac arrest |
| |
Fatigue |
Abd pain |
Erythema |
Autopsy |
Fatigue |
Autopsy |
| |
Blood test |
Cardiac arrest |
Fatigue |
Cerebrovasc acc |
Headache |
Abd pain |
| |
Product admin |
Acute RDS |
COVID–19 |
COVID–19 pneum |
Chest discom |
Acute myocard inf |
| |
Abd pain |
COVID–19 pneum |
Headache |
Cardio-resp arrest |
Anxiety |
COVID–19 pneum |
Table 3.
Vaccine lots with the top number of adverse effects per columnSYMPTOM1, per COVID19 vaccine manufacturer. Row 1: COVID19 vaccine manufacturers. Row 2: Specification of the sample used to count vaccine lots: entire sample (denoted by “All") and subsample restricted to deaths (denoted by ); Row 3: Number of vaccine lots per sample (fraction of lots with respect to the number of lots in entire sample); Row 4: List of vaccine lots with the top number of adverse effects per column SYMPTOM1, per sample.
| |
JANSSEN |
MODERNA |
PFIZER\BIONTECH |
| VAX_LOT |
All |
|
All |
|
All |
|
| No. |
2047 |
88 |
14874 |
567 |
11266 |
396 |
| (fraction wrt All) |
|
(0.043) |
|
(0.038) |
|
(0.035) |
| Top–10 |
043A21A |
1805031 |
026L20A |
039K20A |
EK5730 |
EN6201 |
| |
042A21A |
043A21A |
039K20A |
012L20A |
EK9231 |
EL9261 |
| |
202A21A |
1805018 |
011J20A |
013L20A |
EH9899 |
EN5318 |
| |
1805018 |
042A21A |
025L20A |
037K20A |
ER2613 |
EL3248 |
| |
201A21A |
1805029 |
013L20A |
025L20A |
EJ1685 |
EN6200 |
| |
1805022 |
205A21A |
012L20A |
010M20A |
EN6201 |
EL9269 |
| |
1805029 |
1805022 |
011L20A |
012M20A |
EL1284 |
EN6202 |
| |
203A21A |
203A21A |
041L20A |
029L20A |
EN5318 |
EN6198 |
| |
205A21A |
202A21A |
029L20A |
007M20A |
ER8733 |
EM9810 |
| |
206A21A |
1805025 |
037K20A |
030L20A |
ER8732 |
EL3249 |


