Submitted:
15 December 2023
Posted:
19 December 2023
You are already at the latest version
Abstract

Keywords:
Article
1. Introduction
2. Results
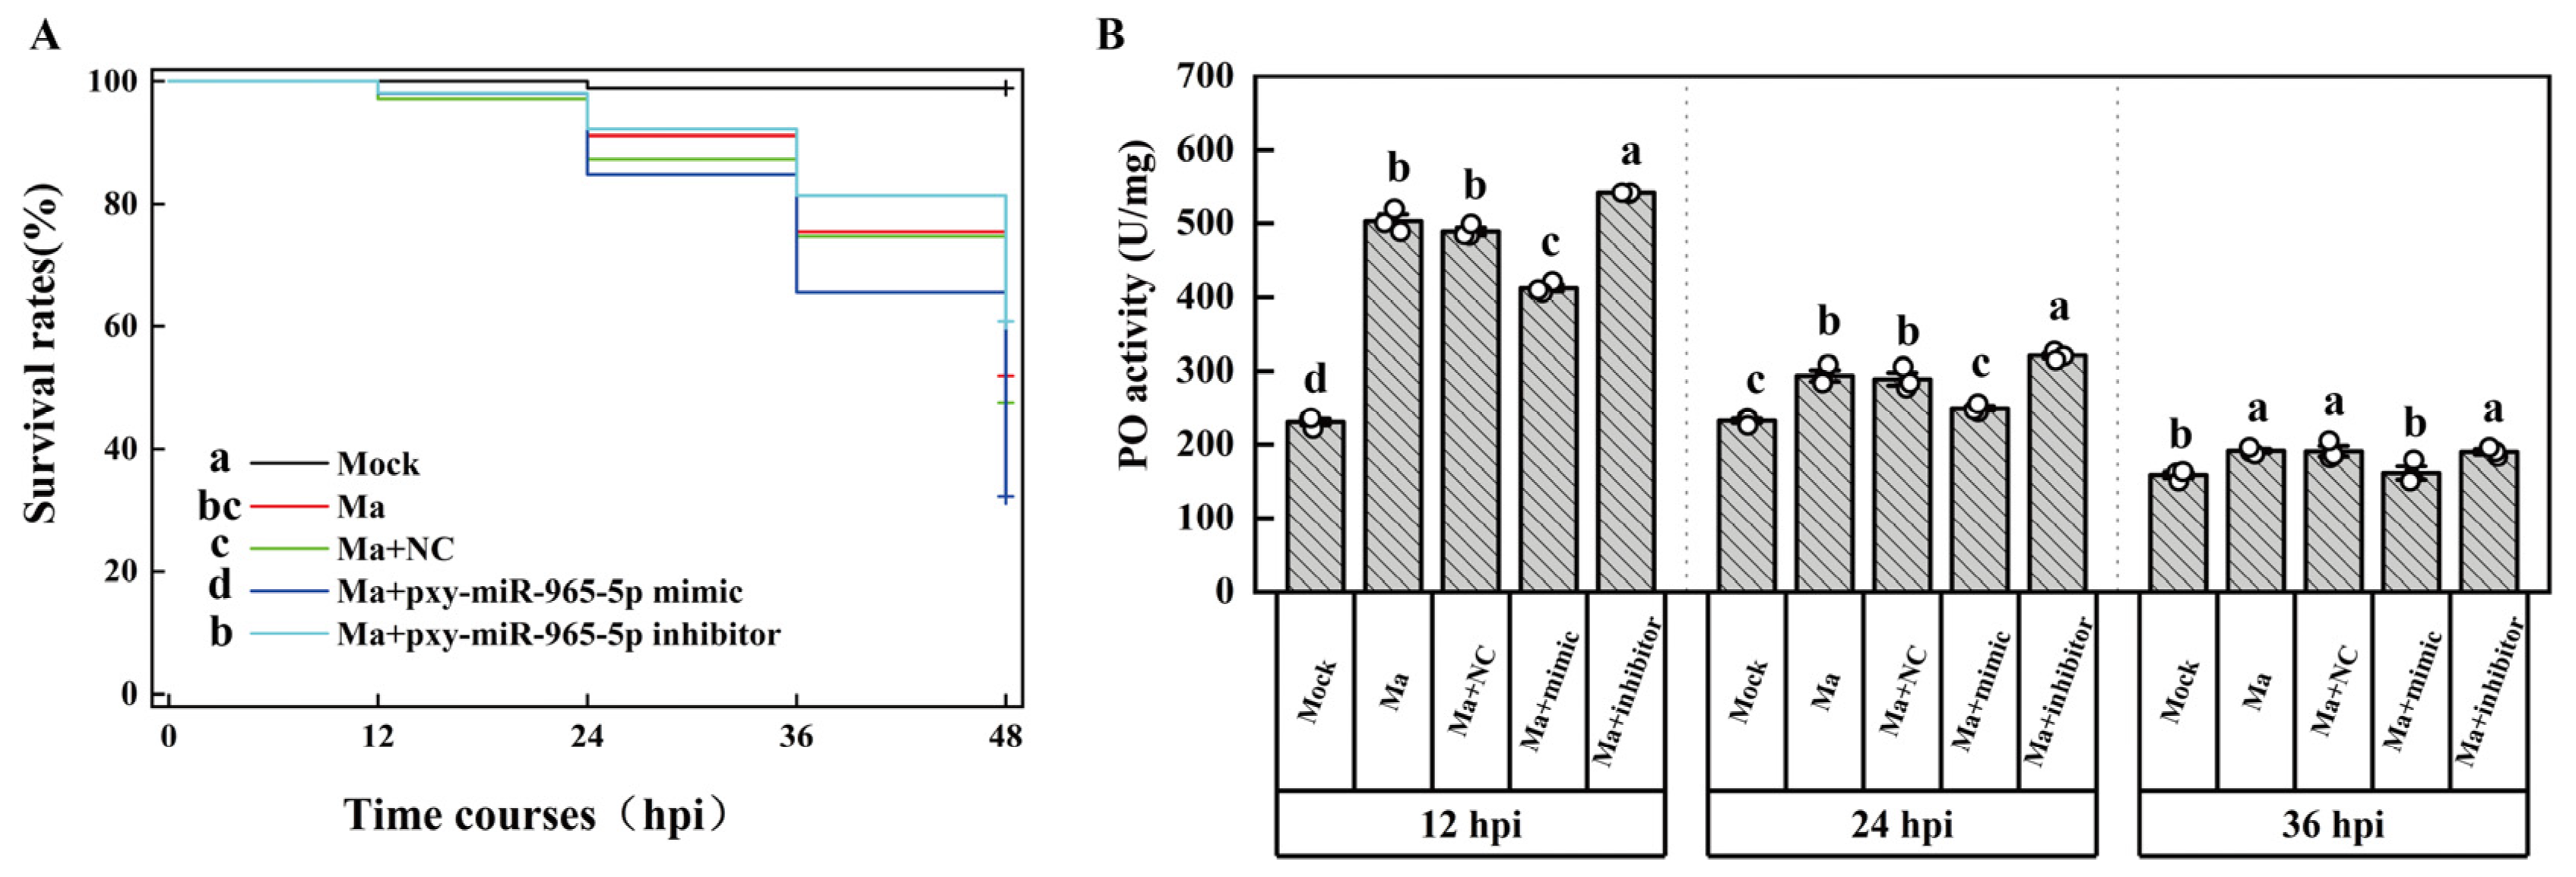
2.1. The infection of P. xylostella by M. anisopliae
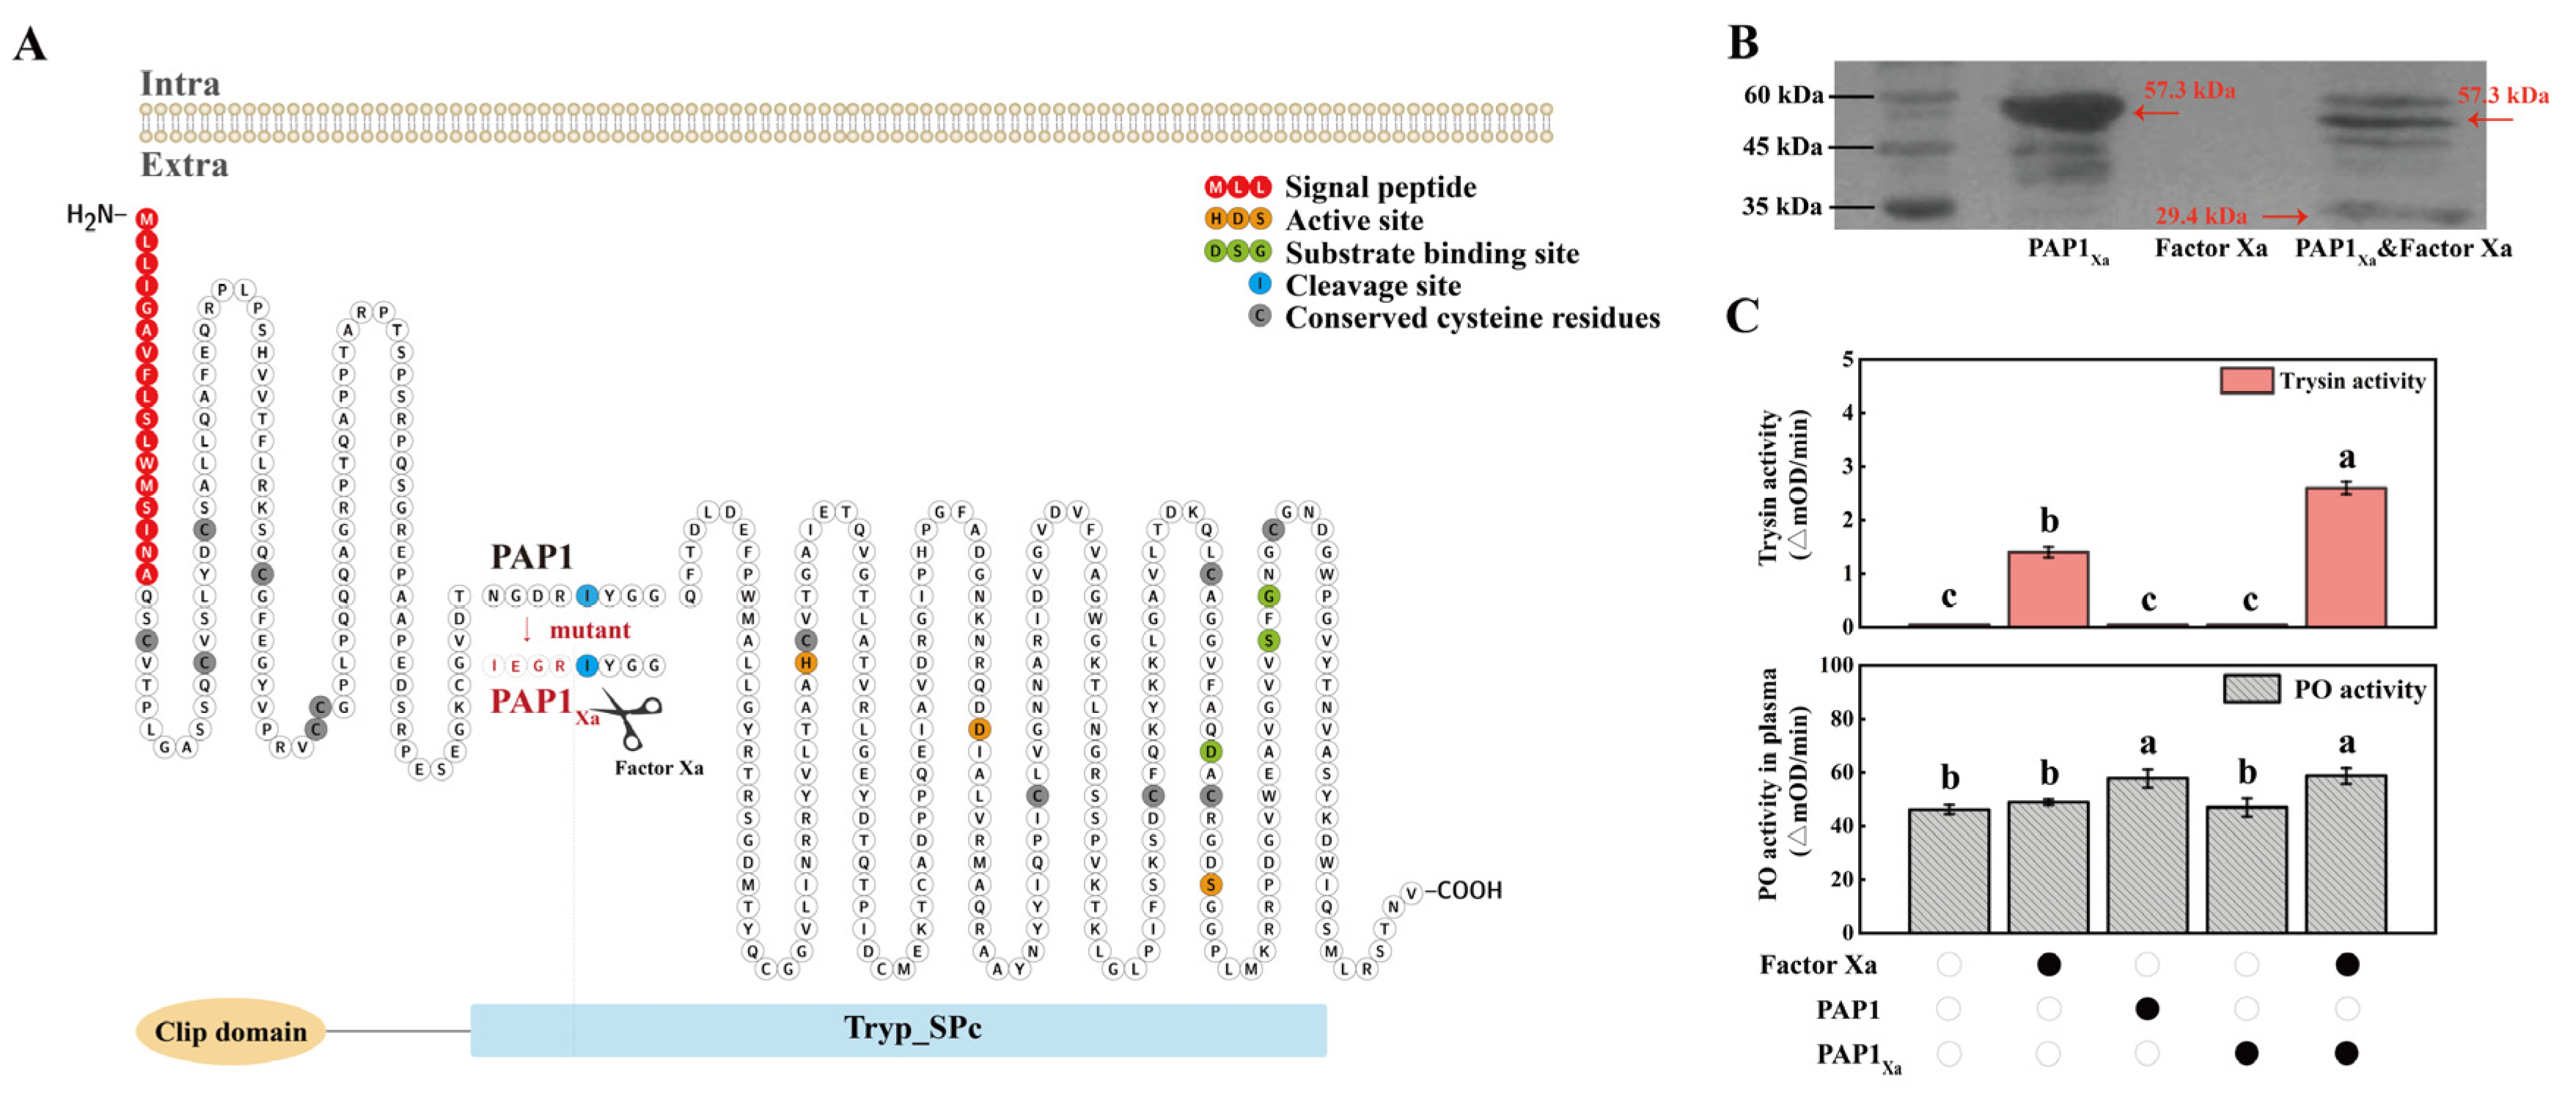
2.2. The functional analysis of PAP1
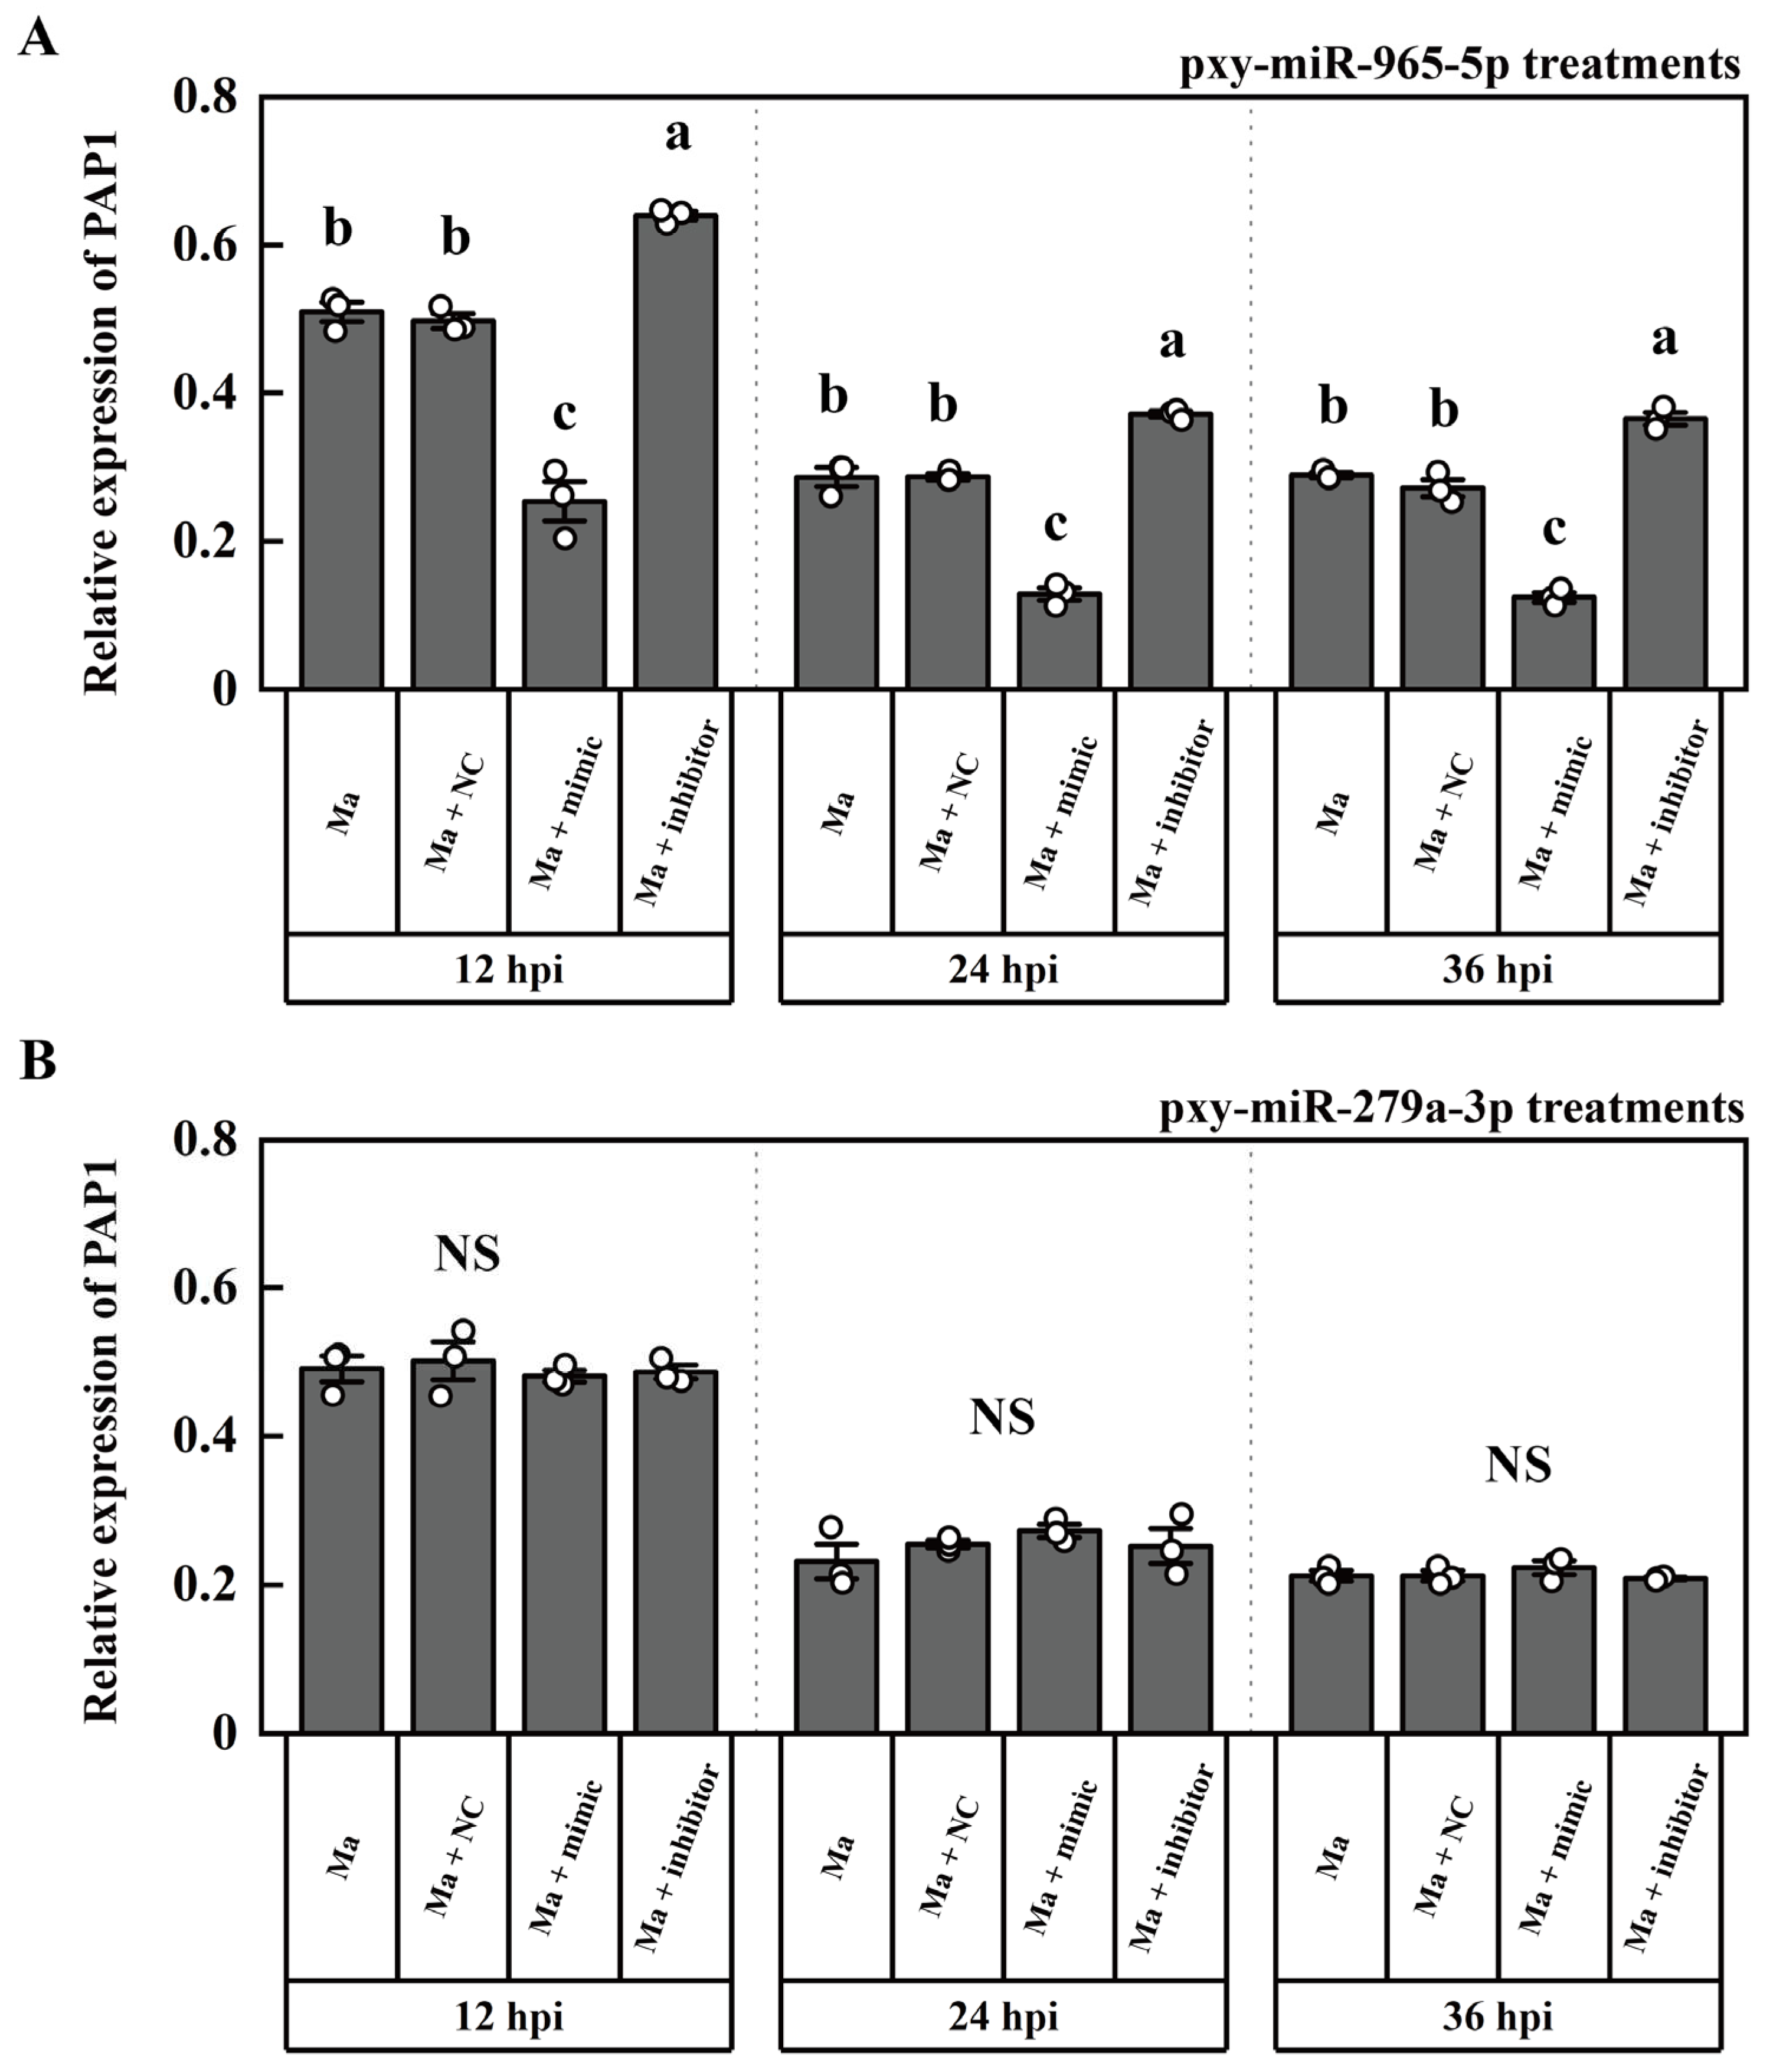
2.3. The targeting miRNA of PAP1
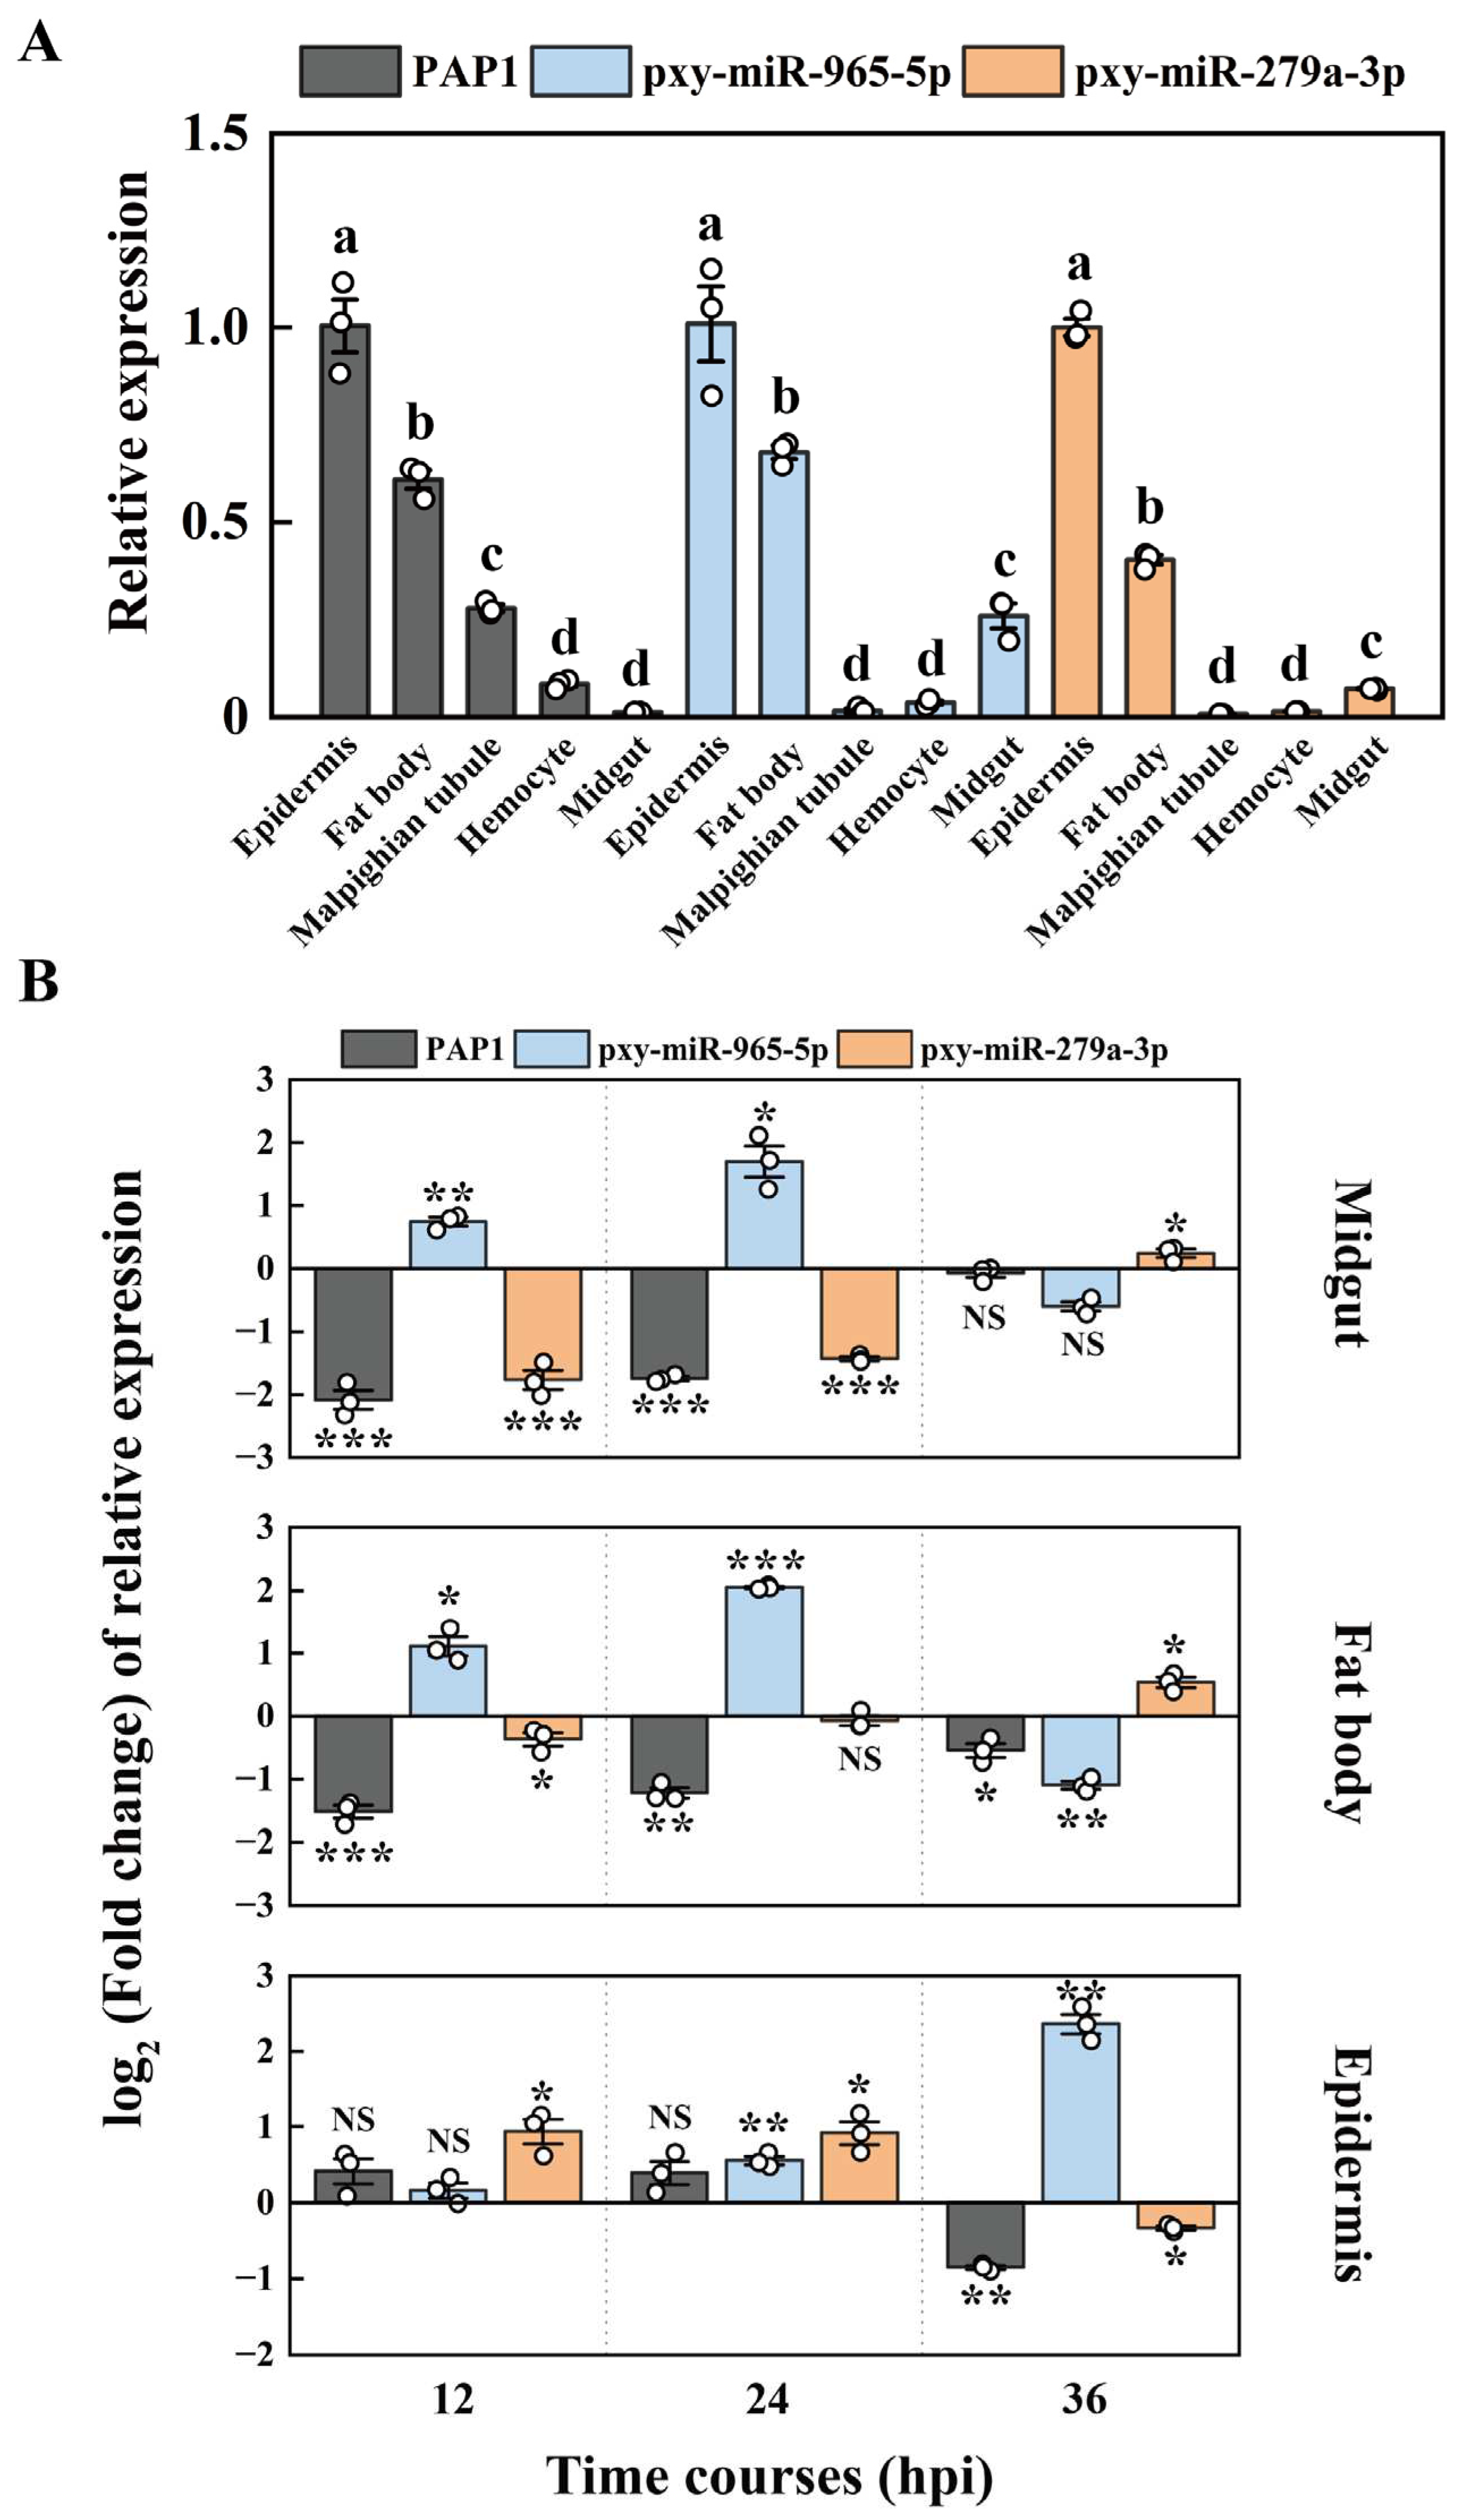
2.4. The expression patterns of PAP1, pxy-miR-279a-3p and pxy-miR-965-5p
2.6. Interaction of LncRNAs with pxy-miR-965-5p
3. Discussion
4. Materials and Methods
4.1. Insects, pathogens and cell lines
4.2. P. xylostella infection by M. anisopliae
4.3. PO activity assay
4.4. The prokaryotic expression and purification of recombinant proteins
4.5. The enzyme activity of PAP1
4.6. Prediction of Interactions Among mRNA, miRNA, and LncRNAs
4.7. The synthesis of miRNA mimic, miRNA inhibitors, and ASO for LncRNAs
4.8. Total RNA extraction and real-time quantitative PCR (RT-qPCR)
4.9. The microinjection of P. xylostella
4.10. Statistical analysis
5. Conclusions
Supplementary Materials
Author Contributions
Funding
Institutional Review Board Statement
Informed Consent Statement
Data Availability Statement
Acknowledgments
Conflicts of Interest
References
- Ponting, C.P.; Oliver, P.L.; Reik, W. Evolution and functions of long non-coding RNAs. Cell 2009, 136, 629–641. [Google Scholar] [CrossRef] [PubMed]
- Choudhary, C.; Sharma, S.; Meghwanshi, K.K.; Patel, S.; Mehta, P.; Shukla, N.; Do, D.N.; Rajpurohit, S.; Suravajhala, P.; Shukla, J.N. Long Non-Coding RNAs in Insects. Animals (Basel) 2021, 11, 1118. [Google Scholar] [CrossRef] [PubMed]
- Fernandes, J.C.R.; Acuña, S.M.; Aoki, J.I.; Floeter-Winter, L.M.; Muxel, S.M. Long non-coding RNAs in the regulation of gene expression: physiology and disease. Non-coding RNA 2019, 5, 17. [Google Scholar] [CrossRef] [PubMed]
- Gomes, A.Q.; Nolasco, S.; Soares, H. Non-coding RNAs: multi-tasking molecules in the cell. International journal of molecular sciences 2013, 14, 16010–16039. [Google Scholar] [CrossRef]
- Liu, F.; Shi, T.; Qi, L.; Su, X.; Wang, D.; Dong, J.; Huang, Z.Y. lncRNA profile of Apis mellifera and its possible role in behavioural transition from nurses to foragers. Bmc Genomics 2019, 20, 1–11. [Google Scholar] [CrossRef] [PubMed]
- Zhu, B.; Li, L.; Wei, R.; Liang, P.; Gao, X. , Regulation of GSTu1-mediated insecticide resistance in Plutella xylostella by miRNA and lncRNA. Plos Genetics 2021, 17, e1009888. [Google Scholar] [CrossRef] [PubMed]
- Ylla, G.; Piulachs, M.-D.; Belles, X. Comparative analysis of miRNA expression during the development of insects of different metamorphosis modes and germ-band types. BMC genomics 2017, 18, 1–13. [Google Scholar] [CrossRef]
- Jiang, S.; Wu, H.; Liu, H.; Zheng, J.; Lin, Y.; Chen, H. The overexpression of insect endogenous small RNAs in transgenic rice inhibits growth and delays pupation of striped stem borer (Chilo suppressalis). Pest Management Science 2017, 73, 1453–1461. [Google Scholar] [CrossRef] [PubMed]
- Etebari, K.; Asgari, S. Conserved microRNA miR-8 blocks activation of the Toll pathway by upregulating Serpin 27 transcripts. RNA Biology 2013, 10, 1356–1364. [Google Scholar] [CrossRef]
- Yang, M.; Wang, Y.; Jiang, F.; Song, T.; Wang, H.; Liu, Q.; Zhang, J.; Zhang, J.; Kang, L. miR-71 and miR-263 Jointly Regulate Target Genes Chitin synthase and Chitinase to Control Locust Molting. Plos Genetics 2016, 12, e1006257. [Google Scholar] [CrossRef]
- Liu, Z.; Ling, L.; Xu, J.; Zeng, B.; Huang, Y.; Shang, P.; Tan, A. MicroRNA-14 regulates larval development time in Bombyx mori. Insect Biochemistry and Molecular Biology 2018, 93, 57–65. [Google Scholar] [CrossRef]
- Wang, Y.; Cui, C.; Wang, G.; Li, Y.; Wang, S. Insects defend against fungal infection by employing microRNAs to silence virulence-related genes. Proceedings of the National Academy of Sciences 2021, 118, e2023802118. [Google Scholar] [CrossRef] [PubMed]
- Fullaondo, A.; Lee, S.Y. Regulation of Drosophila-virus interaction. Developmental & Comparative Immunology 2012, 36, 262–266. [Google Scholar] [CrossRef] [PubMed]
- Lemaitre, B.; Hoffmann, J. The Host Defense of Drosophila melanogaster. Annual Review of Immunology 2007, 25, 697–743. [Google Scholar] [CrossRef] [PubMed]
- Chae, J.-H.; Kurokawa, K.; So, Y.-I.; Hwang, H.O.; Kim, M.-S.; Park, J.-W.; Jo, Y.-H.; Lee, Y.S.; Lee, B.L. Purification and characterization of tenecin 4, a new anti-Gram-negative bacterial peptide, from the beetle Tenebrio molitor. Developmental & Comparative Immunology 2012, 36, 540–546. [Google Scholar] [CrossRef]
- Sackton, T.B.; Lazzaro, B.P.; Schlenke, T.A.; Evans, J.D.; Hultmark, D.; Clark, A.G. Dynamic evolution of the innate immune system in Drosophila. Nature Genetics 2007, 39, 1461–1468. [Google Scholar] [CrossRef] [PubMed]
- Hampson, G.F. The Fauna of British India, including Ceylon and Burma. Moths. Volume 1. The Fauna of British India, including Ceylon and Burma. Moths. Volume 1. 1892. [Google Scholar]
- Ferrandon, D.; Imler, J.-L.; Hetru, C.; Hoffmann, J.A. The Drosophila systemic immune response: sensing and signalling during bacterial and fungal infections. Nature Reviews Immunology 2007, 7, 862–874. [Google Scholar] [CrossRef] [PubMed]
- Lazzaro, B.P. Natural selection on the Drosophila antimicrobial immune system. Current Opinion in Microbiology 2008, 11, 284–289. [Google Scholar] [CrossRef] [PubMed]
- Jiravanichpaisal, P.; Lee, B.L.; Söderhäll, K. Cell-mediated immunity in arthropods: Hematopoiesis, coagulation, melanization and opsonization. Immunobiology 2006, 211, 213–236. [Google Scholar] [CrossRef]
- Wang, Q.; Ren, M.; Liu, X.; Xia, H.; Chen, K. Peptidoglycan recognition proteins in insect immunity. Molecular Immunology 2019, 106, 69–76. [Google Scholar] [CrossRef]
- Chen, X.; Yu, J.; Wang, W.; Lu, H.; Kang, L.; Cui, F.; Lemaitre, B. A Plant Virus Ensures Viral Stability in the Hemolymph of Vector Insects through Suppressing Prophenoloxidase Activation. mBio 2020, 11, e01453–01420. [Google Scholar] [CrossRef] [PubMed]
- Li, B.; Li, H.; Tian, Y.; Abro, N.A.; Nong, X.; Zhang, Z.; Wang, G. Molecular Identification and Immunity Functional Characterization of Lmserpin1 in Locusta migratoria manilensis. Insects 2021, 12, 178. [Google Scholar] [CrossRef] [PubMed]
- Shi, M.; Chen, X.-Y.; Zhu, N.; Chen, X.-X. Molecular identification of two prophenoloxidase-activating proteases from the hemocytes of Plutella xylostella (Lepidoptera: Plutellidae) and their transcript abundance changes in response to microbial challenges. Journal of Insect Science 2014, 14, 179. [Google Scholar] [CrossRef] [PubMed]
- Zhou, L.; Lim, M.Y.T.; Kaur, P.; Saj, A.; Bortolamiol-Becet, D.; Gopal, V.; Tolwinski, N.; Tucker-Kellogg, G.; Okamura, K. Importance of miRNA stability and alternative primary miRNA isoforms in gene regulation during Drosophila development. Elife 2018, 7, e38389. [Google Scholar] [CrossRef]
- Zhao, A.; Yuan, X.; Hu, D.; Leng, C.; Li, Y.; Wang, P.; Li, Y. The effect of host plant on the development and larval midgut protease activity of Plutella xylostella (Lepidoptera: Plutellidae). Phytoparasitica 2019, 47, 475–483. [Google Scholar] [CrossRef]
- You, M.S.; Ke, F.S.; You, S.J.; Wu, Z.Y.; Liu, Q.F.; He, W.Y.; Baxter, S.W.; Yuchi, Z.G.; Vasseur, L.; Gurr, G.M. , et al. Variation among 532 genomes unveils the origin and evolutionary history of a global insect herbivore. Nature Communications 2020, 11, 2321. [Google Scholar] [CrossRef] [PubMed]
- Sarauer, B.L.; Gillott, C.; Hegedus, D. Characterization of an intestinal mucin from the peritrophic matrix of the diamondback moth, Plutella xylostella. Insect Molecular Biology 2003, 12, 333–343. [Google Scholar] [CrossRef] [PubMed]
- Zhu, X.; Lei, Y.; Yang, Y.; Baxter, S.W.; Li, J.; Wu, Q.; Wang, S.; Xie, W.; Guo, Z.; Fu, W. , et al. Construction and characterisation of near-isogenic Plutella xylostella (Lepidoptera: Plutellidae) strains resistant to Cry1Ac toxin. Pest Management Science 2015, 71, 225–233. [Google Scholar] [CrossRef] [PubMed]
- Islam, W.; Adnan, M.; Shabbir, A.; Naveed, H.; Abubakar, Y.S.; Qasim, M.; Tayyab, M.; Noman, A.; Nisar, M.S.; Khan, K.A. , et al. Insect-fungal-interactions: A detailed review on entomopathogenic fungi pathogenicity to combat insect pests. Microbial Pathogenesis 2021, 159, 105122. [Google Scholar] [CrossRef]
- Peng, Y.; Tang, J.; Xie, J. Transcriptomic Analysis of the Brown Planthopper, Nilaparvata lugens, at Different Stages after Metarhizium anisopliae Challenge. Insects (2075-4450) 2020, 11, 139. [Google Scholar] [CrossRef]
- Shin, T.Y.; Lee, M.R.; Park, S.E.; Lee, S.J.; Kim, W.J.; Kim, J.S. Pathogenesis-related genes of entomopathogenic fungi. Archives of Insect Biochemistry and Physiology 2020, 105, e21747. [Google Scholar] [CrossRef] [PubMed]
- Shoukat, R.F.; Hassan, B.; Shakeel, M.; Zafar, J.; Li, S.; Freed, S.; Xu, X.; Jin, F. Pathogenicity and Transgenerational Effects of Metarhizium anisopliae on the Demographic Parameters of Aedes albopictus (Culicidae: Diptera). J Med Entomol 2020, 57, 677–685. [Google Scholar] [CrossRef]
- Zafar, J.; Freed, S.; Khan, B.A.; Farooq, M. Effectiveness of Beauveria bassiana against cotton whitefly, Bemisia tabaci (Gennadius)(Aleyrodidae: Homoptera) on different host plants. Pak. J. Zool 2016, 48, 91–99. [Google Scholar]
- Mwamburi, L.A. Endophytic fungi, Beauveria bassiana and Metarhizium anisopliae, confer control of the fall armyworm, Spodoptera frugiperda (JE Smith)(Lepidoptera: Noctuidae), in two tomato varieties. Egyptian Journal of Biological Pest Control 2021, 31, 1–6. [Google Scholar] [CrossRef]
- Zafar, J.; Shoukat, R.F.; Zhang, Y.; Freed, S.; Xu, X.; Jin, F. Metarhizium Anisopliae Challenges Immunity and Demography of Plutella xylostella. Insects 2020, 11, 694. [Google Scholar] [CrossRef]
- Evans, J.; Aronstein, K.; Chen, Y.P.; Hetru, C.; Imler, J.L.; Jiang, H.; Kanost, M.; Thompson, G.; Zou, Z.; Hultmark, D. Immune pathways and defence mechanisms in honey bees Apis mellifera. Insect Mol Biol. 2006, 15, 645–656. [Google Scholar] [CrossRef]
- Muthu Lakshmi Bavithra, C.; Murugan, M.; Pavithran, S.; Naveena, K. , Enthralling genetic regulatory mechanisms meddling insecticide resistance development in insects: role of transcriptional and post-transcriptional events. Front Mol Biosci 2023, 10, 1257859. [Google Scholar] [CrossRef]
- Zhang, Q.; Dou, W.; Taning, C. N. T.; Smagghe, G.; Wang, J. J. , Regulatory roles of microRNAs in insect pests: prospective targets for insect pest control. Curr Opin Biotechnol 2021, 70, 158–166. [Google Scholar] [CrossRef]
- Zhang, Z.; Zhu, S.; De Mandal, S.; Gao, Y.; Yu, J.; Zeng, L.; Huang, J.; Zafar, J.; Jin, F.; Xu, X. Combined transcriptomic and proteomic analysis of developmental features in the immune system of Plutella xylostella during larva-to-adult metamorphosis. Genomics 2022, 114, 110381. [Google Scholar] [CrossRef]
- Lavine, M.D.; Strand, M.R. Insect hemocytes and their role in immunity. Insect Biochemistry and Molecular Biology 2002, 32, 1295–1309. [Google Scholar] [CrossRef]
- Jiang, H.; Vilcinskas, A.; Kanost, M.R. Immunity in Lepidopteran insects. In Invertebrate Immunity, Soderhall, K., Ed. 2010; Vol. 708, pp. 181-204.
- Cerenius, L.; Lee, B.L.; Söderhäll, K. The proPO-system: pros and cons for its role in invertebrate immunity. Trends in Immunology 2008, 29, 263–271. [Google Scholar] [CrossRef] [PubMed]
- An, C.J.; Ragan, E.J.; Kanost, M.R. Regulation of Manduca sexta hemolymph proteinase 8 by serpin-1 isoforms. Faseb Journal 2009, 23. [Google Scholar] [CrossRef]
- Meekins, D.A.; Kanost, M.R.; Michel, K. Serpins in arthropod biology. Seminars in Cell & Developmental Biology 2017, 62, 105–119. [Google Scholar] [CrossRef]
- Gao, G.; Xu, X.-X.; Yu, J.; Li, L.-M.; Ju, W.-Y.; Jin, F.-L.; Freed, S. Identification and molecular characterization of two serine proteases and their potential involvement in prophenoloxidase activation in Plutella xylostella. Archives of Insect Biochemistry and Physiology 2016, 93, 25–39. [Google Scholar] [CrossRef] [PubMed]
- Shakeel, M.; Xu, X.; De Mandal, S.; Jin, F. Role of serine protease inhibitors in insect-host-pathogen interactions. Archives of Insect Biochemistry and Physiology 2019, 102, e21556. [Google Scholar] [CrossRef] [PubMed]
- Yuan, C.; Xing, L.; Wang, M.; Wang, X.; Yin, M.; Wang, Q.; Hu, Z.; Zou, Z. Inhibition of melanization by serpin-5 and serpin-9 promotes baculovirus infection in cotton bollworm Helicoverpa armigera. Plos Pathogens 2017, 13, e1006645. [Google Scholar] [CrossRef] [PubMed]
- Han, P.F.; Fan, J.Q.; Liu, Y.; Cuthbertson, A.G.S.; Yan, S.Q.; Qiu, B.L.; Ren, S.X. RNAi-Mediated Knockdown of Serine Protease Inhibitor Genes Increases the Mortality of Plutella xylostella Challenged by Destruxin A. Plos One 2014, 9. [Google Scholar] [CrossRef] [PubMed]
- Dong, W.; Tang, B.Z.; Sonoda, S.; Liang, P.; Gao, X.W. Sequencing and characterization of two cDNAs putatively encoding prophenoloxidases in the diamondback moth, Plutella xylostella (L.) (Lepidoptera: Yponomeutidae). Applied Entomology and Zoology 2011, 46, 211–221. [Google Scholar] [CrossRef]
- Piao, S.; Song, Y.L.; Kim, J.H.; Park, S.Y.; Park, J.W.; Lee, B.L.; Oh, B.H.; Ha, N.C. Crystal structure of a clip-domain serine protease and functional roles of the clip domains. Embo Journal 2005, 24, 4404–4414. [Google Scholar] [CrossRef]
- Wang, Y.; Jiang, H. Purification and characterization of Manduca sexta serpin-6: a serine proteinase inhibitor that selectively inhibits prophenoloxidase-activating proteinase-3. Insect Biochemistry and Molecular Biology 2004, 34, 387–395. [Google Scholar] [CrossRef]
- Jiang, H.B.; Wang, Y.; Yu, X.Q.; Zhu, Y.F.; Kanost, M. Prophenoloxidase-activating proteinase-3 (PAP-3) from Manduca sexta hemolymph: a clip-domain serine proteinase regulated by serpin-1J and serine proteinase homologs. Insect Biochemistry and Molecular Biology 2003, 33, 1049–1060. [Google Scholar] [CrossRef] [PubMed]
- Gupta, S.; Wang, Y.; Jiang, H.B. Manduca sexta prophenoloxidase (proPO) activation requires proPO-activating proteinase (PAP) and serine proteinase homologs (SPHs) simultaneously. Insect Biochemistry and Molecular Biology 2005, 35, 241–248. [Google Scholar] [CrossRef] [PubMed]
- Jiang, H.B.; Wang, Y.; Yu, X.Q.; Kanost, M.R. Prophenoloxidase-activating proteinase-2 from hemolymph of Manduca sexta. Journal of Biological Chemistry 2003, 278, 3552–3561. [Google Scholar] [CrossRef] [PubMed]
- He, K.; Sun, Y.; Xiao, H.; Ge, C.; Li, F.; Han, Z. Multiple miRNAs jointly regulate the biosynthesis of ecdysteroid in the holometabolous insects, Chilo suppressalis. Rna 2017, 23, 1817–1833. [Google Scholar] [CrossRef] [PubMed]
- Jiang, J.; Ge, X.; Li, Z.; Wang, Y.; Song, Q.; Stanley, D.W.; Tan, A.; Huang, Y. MicroRNA-281 regulates the expression of ecdysone receptor (EcR) isoform B in the silkworm, Bombyx mori. Insect Biochem Mol Biol. 2013, 43, 692–700. [Google Scholar] [CrossRef]
- Fullaondo, A.; García-Sánchez, S.; Sanz-Parra, A.; Recio, E.; Lee, S.Y.; Gubb, D. Spn1 Regulates the GNBP3-Dependent Toll Signaling Pathway in Drosophila melanogaster. Molecular and Cellular Biology 2011, 31, 2960–2972. [Google Scholar] [CrossRef] [PubMed]
- Choi, I.K.; Hyun, S. Conserved microRNA miR-8 in fat body regulates innate immune homeostasis in Drosophila. Developmental & Comparative Immunology 2012, 37, 50–54. [Google Scholar] [CrossRef] [PubMed]
- Bhattacharya, A.; Cui, Y. Systematic Prediction of the Impacts of Mutations in MicroRNA Seed Sequences. Journal of Integrative Bioinformatics 2017, 14. [Google Scholar] [CrossRef] [PubMed]
- Salomon, W.E.; Jolly, Samson M.; Moore, Melissa J.; Zamore, Phillip D.; Serebrov, V. Single-Molecule Imaging Reveals that Argonaute Reshapes the Binding Properties of Its Nucleic Acid Guides. Cell 2015, 162, 84–95. [Google Scholar] [CrossRef]
- Schirle, N.T.; Sheu-Gruttadauria, J.; MacRae, I.J. Structural basis for microRNA targeting. Science 2014, 346, 608–613. [Google Scholar] [CrossRef]
- Brennecke, J.; Stark, A.; Russell, R.B.; Cohen, S.M. Principles of microRNA-target recognition. PLoS Biol 2005, 3, e85. [Google Scholar] [CrossRef] [PubMed]
- Doench, J.G.; Sharp, P.A. Specificity of microRNA target selection in translational repression. Genes Dev 2004, 18, 504–511. [Google Scholar] [CrossRef] [PubMed]
- Chipman, L.B.; Pasquinelli, A.E. miRNA Targeting: Growing beyond the Seed. Trends in Genetics 2019, 35, 215–222. [Google Scholar] [CrossRef] [PubMed]
- Duan, Y.; Veksler-Lublinsky, I.; Ambros, V. Critical contribution of 3′ non-seed base pairing to the in vivo function of the evolutionarily conserved let-7a microRNA. Cell Reports 2022, 39, 110745. [Google Scholar] [CrossRef] [PubMed]
- Vilcinskas, A. The role of epigenetics in host–parasite coevolution: lessons from the model host insects Galleria mellonella and Tribolium castaneum. Zoology 2016, 119, 273–280. [Google Scholar] [CrossRef] [PubMed]
- Skalsky, R.L.; Vanlandingham, D.L.; Scholle, F.; Higgs, S.; Cullen, B.R. Identification of microRNAs expressed in two mosquito vectors, Aedes albopictus and Culex quinquefasciatus. BMC Genomics 2010, 11, 119. [Google Scholar] [CrossRef] [PubMed]
- Mohr, A.M.; Mott, J.L. Overview of MicroRNA Biology. Semin Liver Dis 2015, 35, 003–011. [Google Scholar] [CrossRef] [PubMed]
- Rodriguez, A.; Griffiths-Jones, S.; Ashurst, J.L.; Bradley, A. Identification of mammalian microRNA host genes and transcription units. Genome Research 2004, 14, 1902–1910. [Google Scholar] [CrossRef] [PubMed]
- Achkar, N.P.; Cambiagno, D.A.; Manavella, P.A. miRNA Biogenesis: A Dynamic Pathway. Trends in Plant Science 2016, 21, 1034–1044. [Google Scholar] [CrossRef]
- Chen, Z.M.; Liang, S.S.; Zhao, Y.; Han, Z. miR-92b regulates Mef2 levels through a negative-feedback circuit during Drosophila muscle development. Development 2012, 139, 3543–3552. [Google Scholar] [CrossRef]
- He, Q.; Zhang, Y.; Dong, W. MicroRNA miR-927 targets the juvenile hormone primary response geneKruppel homolog1to controlDrosophiladevelopmental growth. Insect Molecular Biology 2020, 29, 545–554. [Google Scholar] [CrossRef] [PubMed]
- Wang, Y.-L.; Wu, L.-X.; Li, H.-Y.; Wen, X.-Q.; Ma, E.-B.; Zhu, K.-Y.; Zhang, J.-Z. The microRNA miR-184 regulates the CYP303A1 transcript level to control molting of Locusta migratoria. Insect Science 2021, 28, 941–951. [Google Scholar] [CrossRef]
- Li, L.; Zhu, B.; Sun, X.; Zheng, K.; Liang, P.; Gao, X. miR-34-5p, a novel molecular target against lepidopteran pests. Journal of Pest Science, 2022. [Google Scholar] [CrossRef]
- Ma, L.; Liu, L.; Zhao, Y.J.; Yang, L.; Chen, C.H.; Li, Z.F.; Lu, Z.Q. JNK pathway plays a key role in the immune system of the pea aphid and is regulated by microRNA-184. Plos Pathogens 2020, 16. [Google Scholar] [CrossRef] [PubMed]
- Han, P.; Gong, Q.; Fan, J.; Zhang, M.; Abbas, M.; Zhu, W.; Deng, S.; Xing, S.; Zhang, J. 20-Hydroxyecdysone regulates the prophenoloxidase cascade to immunize Metarhizium anisopliae in Locusta migratoria. Pest Management Science 2020, 76, 3149–3158. [Google Scholar] [CrossRef]
- Wang, Q.; Yin, M.; Yuan, C.; Liu, X.; Hu, Z.; Zou, Z.; Wang, M. Identification of a Conserved Prophenoloxidase Activation Pathway in Cotton Bollworm Helicoverpa armigera. Frontiers in Immunology 2020, 11. [Google Scholar] [CrossRef]
- Sanbonmatsu, K.Y. Towards structural classification of long non-coding RNAs. Biochim Biophys Acta 2016, 1859, 41–45. [Google Scholar] [CrossRef]
- Long, Y.; Wang, X.; Youmans, D.T.; Cech, T.R. How do lncRNAs regulate transcription? Sci Adv 2017, 3, eaao2110. [Google Scholar] [CrossRef] [PubMed]
- Sanli, I.; Lalevée, S.; Cammisa, M.; Perrin, A.; Rage, F.; Llères, D.; Riccio, A.; Bertrand, E.; Feil, R. Meg3 Non-coding RNA Expression Controls Imprinting by Preventing Transcriptional Upregulation in cis. Cell Rep 2018, 23, 337–348. [Google Scholar] [CrossRef] [PubMed]
- Engreitz, J.M.; Ollikainen, N.; Guttman, M. Long non-coding RNAs: spatial amplifiers that control nuclear structure and gene expression. Nat Rev Mol Cell Biol 2016, 17, 756–770. [Google Scholar] [CrossRef]
- Kondo, Y.; Shinjo, K.; Katsushima, K. Long non-coding RNAs as an epigenetic regulator in human cancers. Cancer Sci 2017, 108, 1927–1933. [Google Scholar] [CrossRef]
- Wang, Y.; Fu, Y.; Cheng, H.; Zhao, C.; Huang, Q.; Chang, M.; Qiu, W.; Shen, Y.; Li, D. lncR26319/miR-2834/EndophilinA axis regulates oogenesis of the silkworm, Bombyx mori. Insect Sci 2023, 30, 65–80. [Google Scholar] [CrossRef] [PubMed]
- Drozd, V.S.; Eldeeb, A.A.; Kolpashchikov, D.M.; Nedorezova, D.D. Binary Antisense Oligonucleotide Agent for Cancer Marker-Dependent Degradation of Targeted RNA. Nucleic Acid Ther 2022, 32, 412–420. [Google Scholar] [CrossRef] [PubMed]
- Ashida, M. Purification and characterization of pre-phenoloxidase from hemolymph of the silkworm Bombyx mori. Archives of Biochemistry & Biophysics 1971, 144, 749–762. [Google Scholar]
- Shakeel, M.; Xu, X.; Xu, J.; Li, S.; Yu, J.; Zhou, X.; Xu, X.; Hu, Q.; Yu, X.; Jin, F. Genome-Wide Identification of Destruxin A-Responsive Immunity-Related MicroRNAs in Diamondback Moth, Plutella xylostella. Frontiers in Immunology 2018, 9, 185. [Google Scholar] [CrossRef] [PubMed]
- Xu, J.; Xu, X.; Li, S.; Wang, S.; Xu, X.; Zhou, X.; Yu, J.; Yu, X.; Shakeel, M.; Jin, F. Genome-Wide Profiling of Plutella xylostella Immunity-Related miRNAs after Isaria fumosorosea Infection. Frontiers in Physiology 2017, 8, 1054. [Google Scholar] [CrossRef]
- Li, S.; Xu, X.; Zheng, Z.; Zheng, J.; Shakeel, M.; Jin, F. MicroRNA expression profiling of Plutella xylostella after challenge with B. thuringiensis. Developmental & Comparative Immunology 2019, 93, 115–124. [Google Scholar] [CrossRef] [PubMed]
- Zafar, J.; Zhang, Y.; Huang, J.; Freed, S.; Shoukat, R.F.; Xu, X.; Jin, F. Spatio-Temporal Profiling of Metarhizium anisopliae-Responsive microRNAs Involved in Modulation of Plutella xylostella Immunity and Development. Journal of fungi (Basel, Switzerland) 2021, 7. [Google Scholar] [CrossRef] [PubMed]
- Fu, W.; Xie, W.; Zhang, Z.; Wang, S.L.; Wu, Q.J.; Liu, Y.; Zhou, X.M.; Zhou, X.G.; Zhang, Y.J. Exploring Valid Reference Genes for Quantitative Real-time PCR Analysis in Plutella xylostella (Lepidoptera: Plutellidae). Int. J. Biol. Sci. 2013, 9, 792–802. [Google Scholar] [CrossRef]
- Yang, Y.; Li, Z.; Cao, J.; Li, Y.; Li, H.; Yang, Q.; Zhang, Q.; Liu, X. Identification and Evaluation of Suitable Reference Genes for Normalization of MicroRNA Expression in Helicoverpa armigera (Lepidoptera: Noctuidae) Using Quantitative Real-Time PCR. J Insect Sci 2017, 17. [Google Scholar] [CrossRef]
- Livak, K.J.; Schmittgen, T.D. Analysis of Relative Gene Expression Data Using Real-Time Quantitative PCR and the 2−ΔΔCT Method. Methods 2001, 25, 402–408. [Google Scholar] [CrossRef]
- Chen, C.J.; Chen, H.; Zhang, Y.; Thomas, H.R.; Frank, M.H.; He, Y.H.; Xia, R. TBtools: An Integrative Toolkit Developed for Interactive Analyses of Big Biological Data. Mol Plant 2020, 13, 1194–1202. [Google Scholar] [CrossRef] [PubMed]



Disclaimer/Publisher’s Note: The statements, opinions and data contained in all publications are solely those of the individual author(s) and contributor(s) and not of MDPI and/or the editor(s). MDPI and/or the editor(s) disclaim responsibility for any injury to people or property resulting from any ideas, methods, instructions or products referred to in the content. |
© 2024 by the authors. Licensee MDPI, Basel, Switzerland. This article is an open access article distributed under the terms and conditions of the Creative Commons Attribution (CC BY) license (https://creativecommons.org/licenses/by/4.0/).


