Preprint
Article

Genome-Wide Association Study for Biomass Yield and Feed Quality in Buffel Grass (Cenchrus ciliaris L.)

Altmetrics

Downloads

85

Views

79

Comments

0

A peer-reviewed article of this preprint also exists.

Submitted:

19 December 2023

Posted:

20 December 2023

You are already at the latest version

Alerts
Abstract
The development of modern genomic tools has sped up the breeding program of food crops. More recently, genomic resources are being developed for tropical forages and will be key resources for developing climate resilient high yielding forage varieties. In this study, we present a genome-wide association study for biomass yield and feed quality traits in buffel grass (Cenchrus ciliaris L. aka Pennisetum ciliare L.,). Genome-wide markers generated using the DArTSeq platform and mapped onto the reference genome of Setaria italica were used for the genome-wide association study. The results revealed several markers associated with biomass yield and feed quality traits. A total of 78 marker trait associations were identified with R2 values ranging from 0.138 to 0.236. The marker trait associations were distributed across different chromosomes. Of these associations, the most marker trait associations (23) were observed on Chr9, followed by Chr5 with 12. The fewest number of marker trait associations were observed on Chr4 with 2. In terms of traits, 17 markers were associated with biomass yield, 24 with crude protein, 26 with TDN, 14 with ADF, 10 with NDF and six with DMI. Twenty of the identified markers were associated with at least two traits. The identified marker trait associations provide a useful genomic resource for future improvement and breeding of buffel grass.
Keywords: 
Subject: Biology and Life Sciences  -   Plant Sciences

1. Introduction

Achieving improved livelihoods, reduced poverty and malnutrition in the world would be very difficult without addressing the challenges of sustainable livestock production in low- and middle-income countries (LMIC). Livestock play multiple crucial roles in rural livelihoods and the economy of LMIC [1,2,3] where smallholder farmers account for most of the crop-livestock production. Under smallholder farmers’ conditions, natural pasture is the main source of feeds for livestock animals and, among others, feed resources are the major limiting factor for livestock production and productivity [4]. Hence, there is a strong need to increase feed resource availability through the development of climate resilient, low-input forage varieties that provide better yields of quality forage in the current trend of climate change and enables expanding livestock production to marginally suitable areas and agroecological conditions.
Among agricultural technologies, plant breeding has played a considerable role in crop yield improvements over the last several decades [5]. In the past few years, the development and integration of modern genomic tools has benefited plant breeding programs [6] and contributed to the development of new varieties of major food crops. In more recent years, genomic resources have also been developed for a limited number of important species of tropical forages. For example, during the last few years, in our institute genome-wide markers were generated for Napier grass, buffel grass, Rhodes grass, lablab and Sesbania sesban [7,8,9,10,11,12] and are being developed for Urochlao spp. and Megathyrus maximus (unpublished data). Similarly, high throughput genome-wide markers have also been developed for tropical forages elsewhere[13,14,15]. Reference genomes have also been developed for a few of the key tropical forage crops [16,17,18,19,20,21,22,23]. These genomic resources have been used for the analysis of genetic diversity, subsetting, genome-wide association and population genetic studies, and will continue to be useful tools and resources for tropical forage research and development. The integration of these genomic tools into field screening and evaluation will enable efficient and accelerated forage breeding programs to develop adaptive and climate resilient varieties to transform livestock production in the tropical regions.
Among the tropical forages, buffel grass is an important drought tolerant perennial species [24] grown throughout the tropical and subtropical regions of the world [24,25]. It is an apomictic species with a basic chromosome number of nine and three ploidy levels: tetraploid (2n=4x=36), pentaploid (2n=5x=45) and hexaploid (2n=6x=54) [26,27]. It is an important grass cultivated as a pasture or for hay production [28]. Under no input production conditions, it can produce up to 18 t DM (dry matter)/ha/annum [28] and forage with a crude protein content of 6-16% [25]. Buffel grass has been reported to produce DM yields of up to 12 t/ha in Kenya [29,30], 8 t/ha in USA [31], 7 t/ha in Pakistan [32] and 21 t/ha in Ethiopia [33]. Improved forage varieties that are better adapted to produce more quality biomass across a range of agroecologies and production systems are a prerequisite, and required more than ever, for supporting enhanced livestock production in a sustainable manner [34]. Despite limited improvement efforts, conventional tropical forage breeding programs have contributed to the development of improved forage cultivars with a number of buffel grass cultivars developed over the last few decades [25]. However, genetic gains from conventional tropical forage breeding programs have been low, particularly in view of the growing demand for animal source foods globally, and breeding programs should leverage the combination of phenotyping, genotyping, and envirotyping strategies in order to increase genetic gains and help secure the future of livestock production in the tropics [34]. The International Livestock Research Institute (ILRI) holds a large collection of buffel grass germplasm collected from different countries in Africa and Asia [9]. Agro-morphological studies have revealed the diversity embedded in the buffel grass collection maintained in the forage genebank at ILRI [35,36]. Facultative apomictic lines, that could offer a potential resource for forage breeding programs to generate new and improved varieties, have also been identified in the collection [37]. Recently, we generated a large set of genome-wide markers using a next generation sequencing approach and reported on the large amount of genetic diversity held in the collection [9]. To our knowledge, there have been no genomic studies in buffel grass that combine phenotypic and genotypic data analysis to investigate the crops genetic architecture. Thus, in the current study, we envisage filling this gap by employing a genome-wide association study for biomass yield and feed quality traits. Here we leveraged the data generated from previous agro-morphological [36] and genotyping studies [9], and present a genome-wide association study (GWAS) for biomass yield and feed quality traits in buffel grass.

2. Materials and Methods

2.1. High-density genome-wide markers

Genome-wide SNP and SilicoDArT markers, generated using the DArTSeq platform [38], were used in this study. The markers were mapped onto the Setaria italica reference genome [39] as described previously [9].

2.2. Phenotypic data

The phenotypic data reported in an earlier study [36] were used for this GWAS. The experiment was established in 2014 during the main rainy season at the Bishoftu field genebank, Bishoftu, Ethiopia [36]. All the accessions evaluated in the experiment were obtained from the Zwai field genebank, Zwai, Ethiopia. Passport data of the accessions is provided in Supplementary Table S1. The experiment was conducted using a randomized complete block design with three replications and data were collected during the main growing seasons (August-September) of 2015 and 2016. During both growing seasons, the plants were clean cut at 10 cm above ground, and the data were collected 45 days after the clean cut. The data collected include biomass yield (YLD, kg/ha/annum), plant height (PH, cm), crude protein (CP, % of dry matter (DM)), Neutral Detergent Fibre (NDF, % of DM), Acid Detergent Fibre (ADF, % of DM), total digestible nutrients (TDN, % of DM) and dry matter intake (DMI, % of body weight). For biomass yield estimation, the plants within a quadrat with an area of one square metre were harvested at 10 cm above the ground, weighed immediately and the weight converted to yield per hectare. For plant height, three plants per plot were measured from the ground to the tip of the tallest inflorescence and the average was used for further analysis. For feed quality analysis, 300 grams of freshly harvested material was oven dried (72 hours at 55 °C), ground to pass through a one mm sieve and used for NIRS scanning as described previously [40]. TDN and DMI were estimated using ADF and NDF values from the NIRS data using the equations TDN= 88.9 –(0.779*ADF), and DMI=1.2/NDF*100 [41].

2.3. Data analysis

A normality test analysis was conducted using the R package nortest in R software [42]. Statistical analysis was conducted using analysis of variance (ANOVA) in R software to determine the significance of the main effects and the interactions using the model:
Y i j k = μ + G i + B j + T k + G i × T i k + ε i j k
where Yijk is the response, μ = overall mean, Gi = effect of the ith Buffel grass genotype, Bj = effect of the jth Block effect, Tk = effect of the kth growing season, G * Tij = the interaction of ith genotype and jth growing season and εijk = the residual error. The least significant difference (LSD), for comparison of mean values of traits, was employed to compare genotypes for traits with significant differences. Genetic parameters, genotypic coefficient of variation (GCV) and phenotypic coefficient of variation (PCV) were estimated using the formulae[43]
G C V = σ g 2 X × 1
P C V = σ p 2 X × 100
where GCV = genotypic coefficient of variation, PCV = phenotypic coefficient of variation, σ2g = genotypic variance, σ2p = phenotypic variance, and X = grand mean. The Broad-sense heritability (H2) for the traits were captured using the equation:
H 2 = σ g 2 σ g 2 + σ e 2
where σ2g and σ2e are the variance components for the genotype effect and the residual error, respectively.

2.4. Marker trait association analysis

A Barlet test, using the barlett.test() function of the R package Stats [44], was used to assess the homogeneity of error variance prior to pooling the data for the GWAS. The GWAS were performed as described by Muktar et al. [7] using fixed and random model circulating probability unification (FarmCPU) [45], Bayesian-information and Linkage-disequilibrium Iteratively Nested Keyway (BLINK) [46], and General linear model (GLM) algorithms [47], implemented in the R package Genomic Association and Prediction integrated tool version 3(GAPIT3) [48]. Linkage maps of the markers associated with traits of interest were generated using the R package LinkageMapView [49]. To assess the putative functional genes underlying the genomic regions of the identified marker trait associations, an NCBI blast search was conducted using the sequence of the markers.

3. Results

Genotyping data were available for 205 accessions [9] while phenotypic evaluation data were available for 126 accessions [36]. When these resources were combined, 120 accessions had both genotypic and phenotypic data and hence, data from these 120 accessions were considered for the marker trait association studies. The normality test analysis showed that the agronomic and feed nutrition trait data were normally distributed. Following a normality test, outliers were removed resulting in 110 and 114 accessions being used for the GWAS for the 2015 and 2016 growing seasons, respectively. The homogeneity of variance test showed that there was a significant difference between the 2015 and 2016 seasons’ data for all traits except for CP and NDF, hence the GWAS analysis was conducted for the 2015 and 2016 seasons separately as well as after combining the two growing seasons’ data.

3.1. Variation in biomass yield, plant height and feed quality traits of buffel grass accessions

The average biomass yield per annum in 2015 and 2016 was 3,231.47 and 5,926.96 kg/ha, respectively, whereas the two seasons combined mean biomass yield per annum was 4,562.22 kg/ha. Figure 1 shows the boxplot visualization of the distribution and outliers of the data for biomass yield, plant height and feed quality traits by growing seasons. The mean performance of each accession over the two growing seasons for agronomic and feed quality traits are presented in Supplementary information (Supplementary Table S2 and S3). The mean plant height was 85.58 cm, 121.18 cm and 103.31 cm for 2015, 2016 and the combined seasons, respectively. The mean value for crude protein (CP) was 12.49 %, 8.33 % and 10.02 % for 2015, 2016 and the combined data, respectively. The mean value for NDF and ADF for the combined seasons was 72.37 % (70.42 % for 2015 and 73.78 % for 2016) and 43.77 % (40.31% for 2015 and 47.78% for 2016), respectively. Similarly, the mean value for TDN and DMI over the two seasons was 48.03 % (52.54 % for 2015 and 44.72 % for 2016) and 1.66 % (1.71 % for 2015 and 1.63 % for 2016), respectively.

3.2. Correlation of phenotypic and feed quality traits

There was a positive and significant correlation among biomass yield, plant height, NDF and ADF. Similarly, a positive and significant correlation was observed among CP, TDN and DMI. On the other hand, CP and DMI had a negative and significant correlation with biomass yield, plant height, NDF, and ADF. Supplementary Figure S1 shows correlation coefficients between yield, plant height and nutritional quality traits among the buffel grass accessions for the two growing seasons and the combined data.

3.3. Effect of genotype and seasonality on buffel grass forage performance

ANOVA results for all of the traits revealed highly significant (<0.001) differences among genotypes, blocks and season except for interaction effects of genotype: season (Table 1). Overall, the results showed that the performance of buffel grass was primarily affected by the genotype and season of production. The significant difference for Block effect shows that blocking was effective in reducing the soil heterogeneity.

3.4. Quantitative genetic variation

The phenotypic coefficient of variation (PCV), the genotypic coefficient of variation (GCV) and broad sense heritability (H2) were calculated to assess the contribution of the factors to the respective traits (Table 2). The PCV value for biomass yield was equivalent to the GCV values. PCV values for plant height and feed quality traits were higher than the corresponding GCV values. The broad sense heritability estimates were higher for biomass yield (99%) and plant height (71%), while the heritability estimates were lowest for DMI (2%) and NDF (10%).

3.5. Buffel grass accession clustering based on phenotypic and feed quality traits

Principal component analysis was used to group the buffel grass accessions based on phenotypic and feed quality trait data from individual growing seasons and the combined seasons. Supplementary Figure S2 shows the clustering of buffel grass accessions based on phenotypic and feed quality traits from the two growing seasons. The first two principal components accounted for 87.2 % of the total variation for the combined seasons’ data. The PCA grouped the accessions into those with better biomass yield, better feed quality and poor feed quality accessions. For example, accessions such as 19369, 13406, 19425, 19467 and 12884 are among the group of accessions with high crude protein content during both growing seasons. Accessions 19459, 19448 and 19439 had the lowest CP content. Accessions 19442, 6646 and 19459 are among those with high biomass yield while accessions 15688, 13121 and 12769 produced the lowest biomass yield. The tallest accessions were 13461, 16609 and 19414 while the shortest accessions were 6645, 19470 and 19371. NDF contents were highest in accessions 13461, 16609 and 19442 while accessions 6645, 19420 and 19367 contained the lowest NDF. Accessions 13461, 19462, 19442, 19448, and 16609 are a few of those with high ADF (poor feed quality accessions) while accessions 12769, 19367 and 13284 are among those with lowest ADF. Highest values for TDN and DMI was observed in accessions 12769, 18094 and 19467 and lowest values were obtained from accessions 19442, 13461 and 19448. Accessions 19367, 12769, 18094, 19425 and 19420 were among the accessions with the highest DMI while accessions 13461, 16609, 19442, and 19442 were among those with the lowest DMI.

3.6. Performance of genetic clusters identified using DArTSeq genome-wide markers

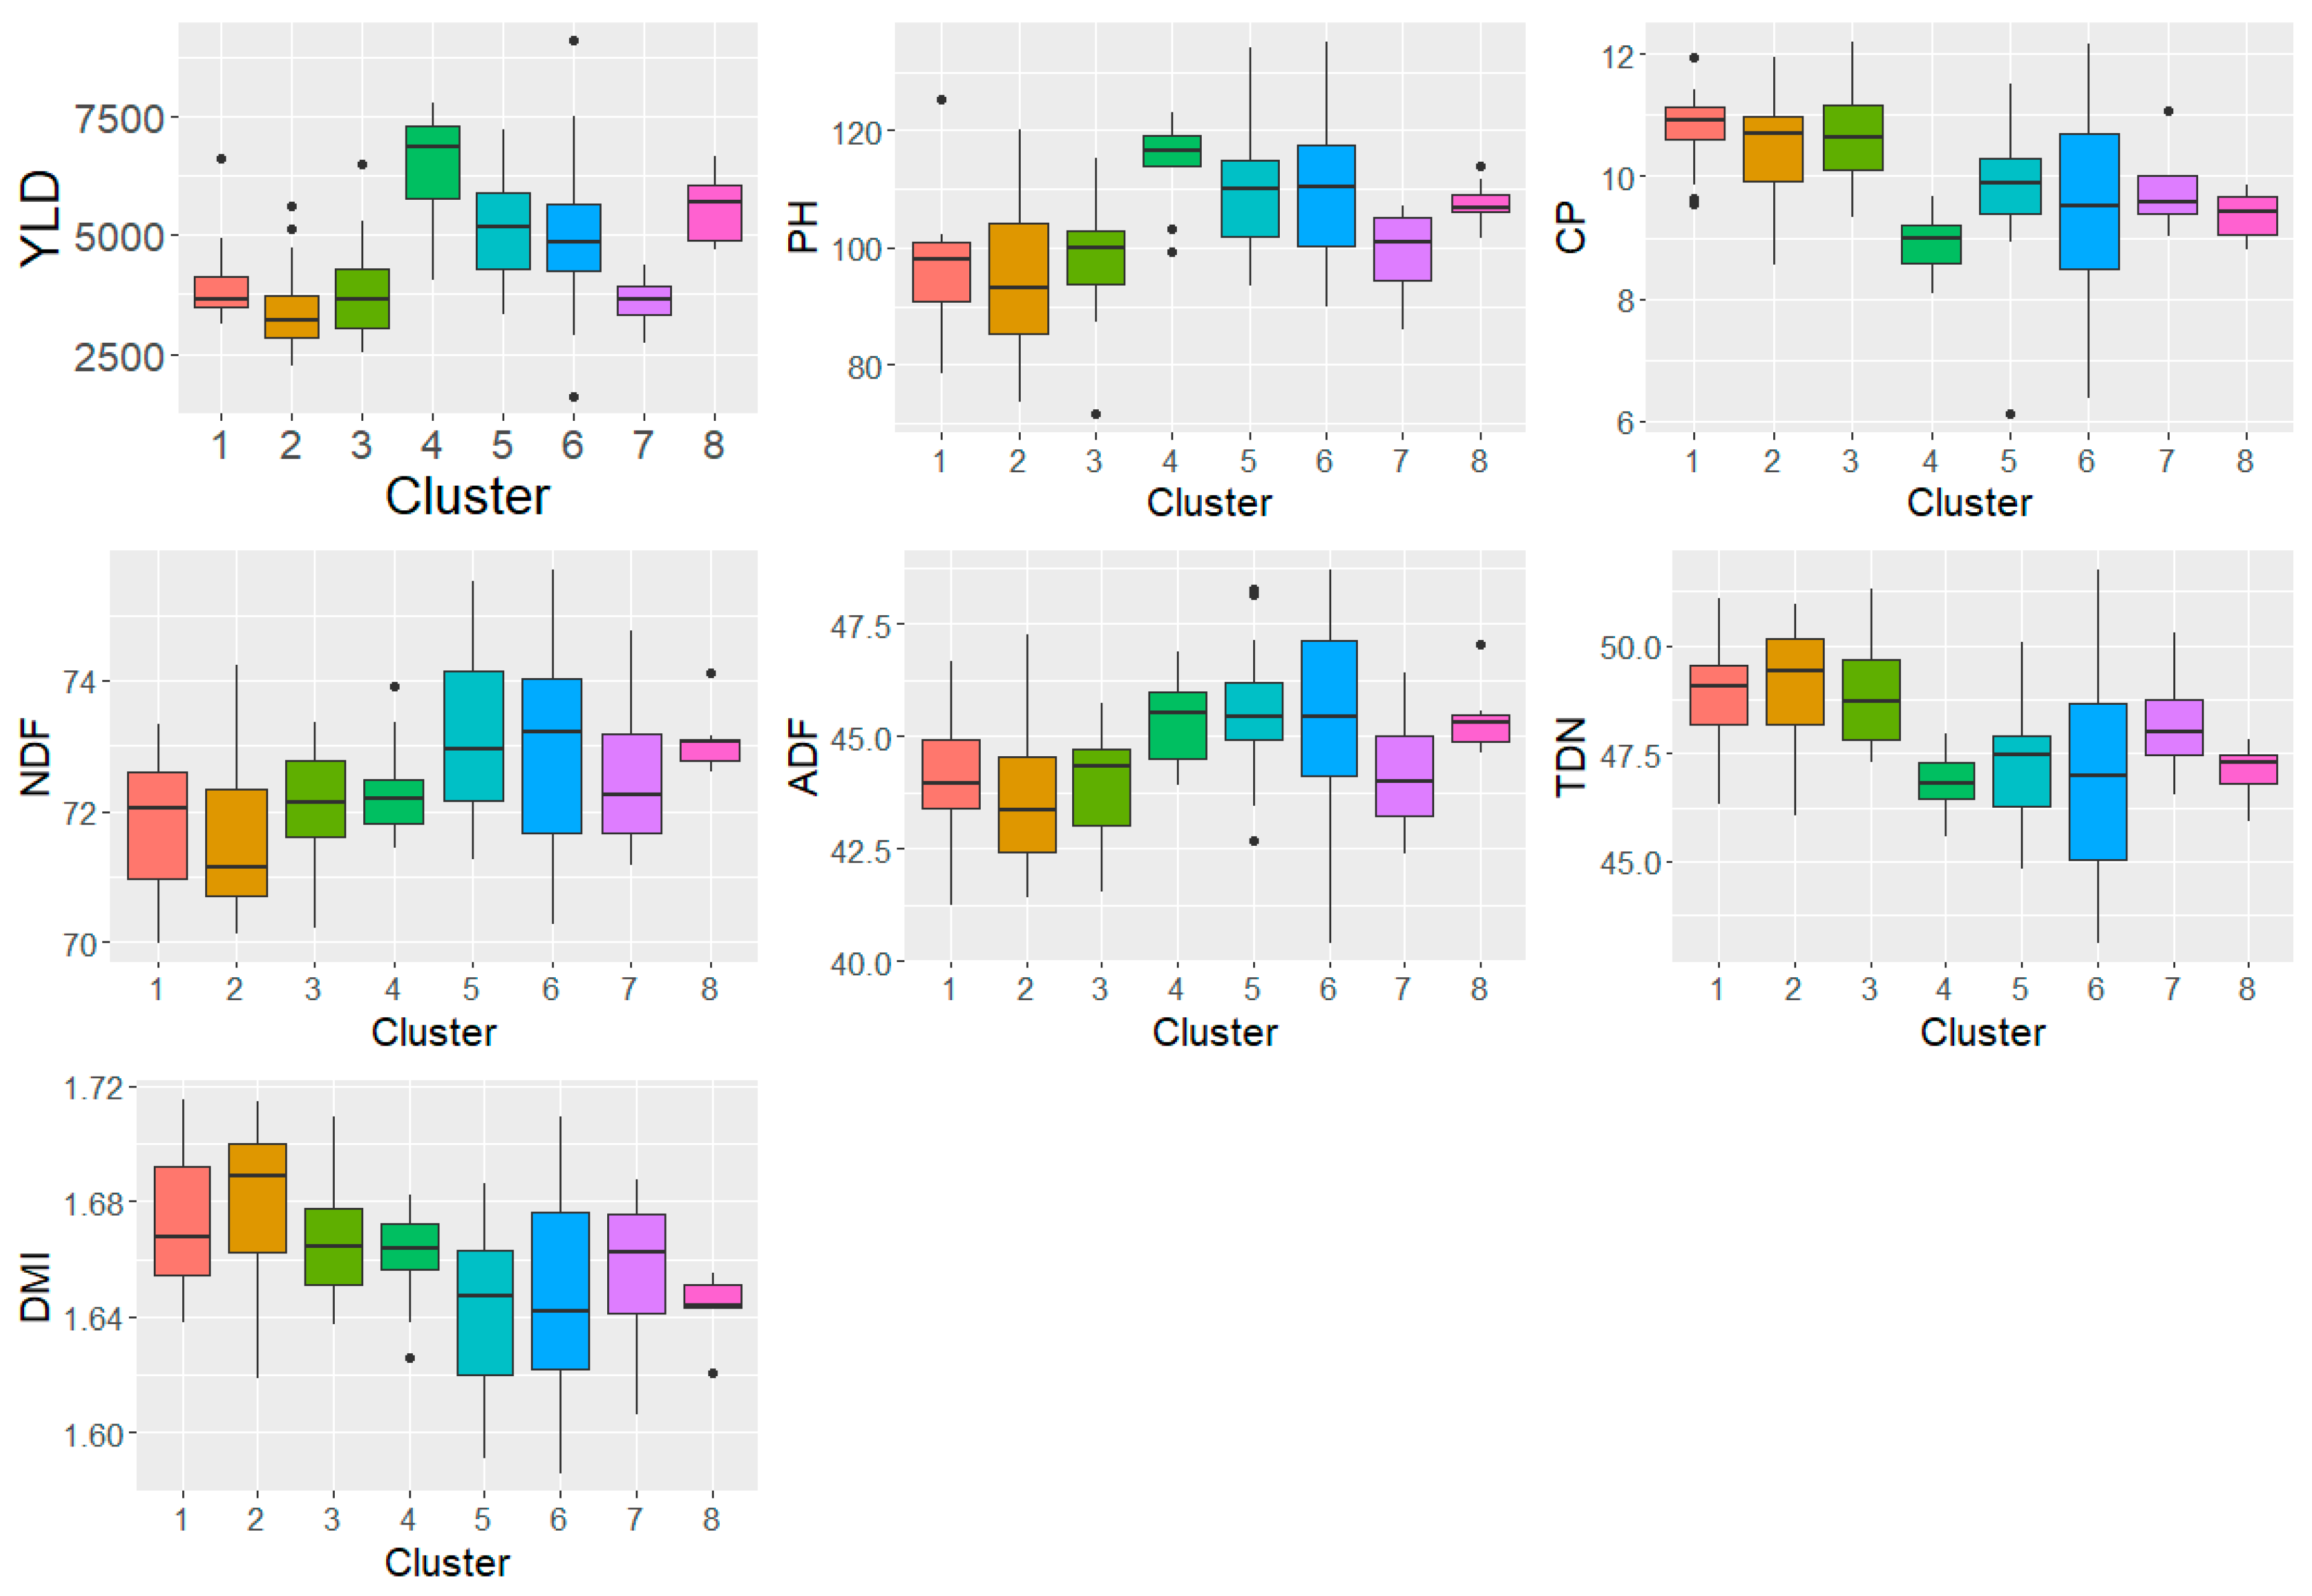
The performance of clusters identified using DArTSeq markers [9] were assessed. Figure 2 shows the performance of the different clusters (Supplementary Table S4). Cluster IV had the highest biomass yield followed by cluster VIII. Cluster II had the lowest biomass yield. Similarly, cluster IV had the tallest plants while cluster II had the shortest plants. In terms of feed quality, clusters I, II and III were a higher quality than the rest of the clusters. These three clusters had the highest CP (10.69-10.78 %) and TDN (48.90-49.06 %). Cluster IV had the lowest CP (9.95 %) and TDN (46.82 %). Cluster II had the highest TDN and DMI values.

3.7. Genome-wide distribution and density of markers

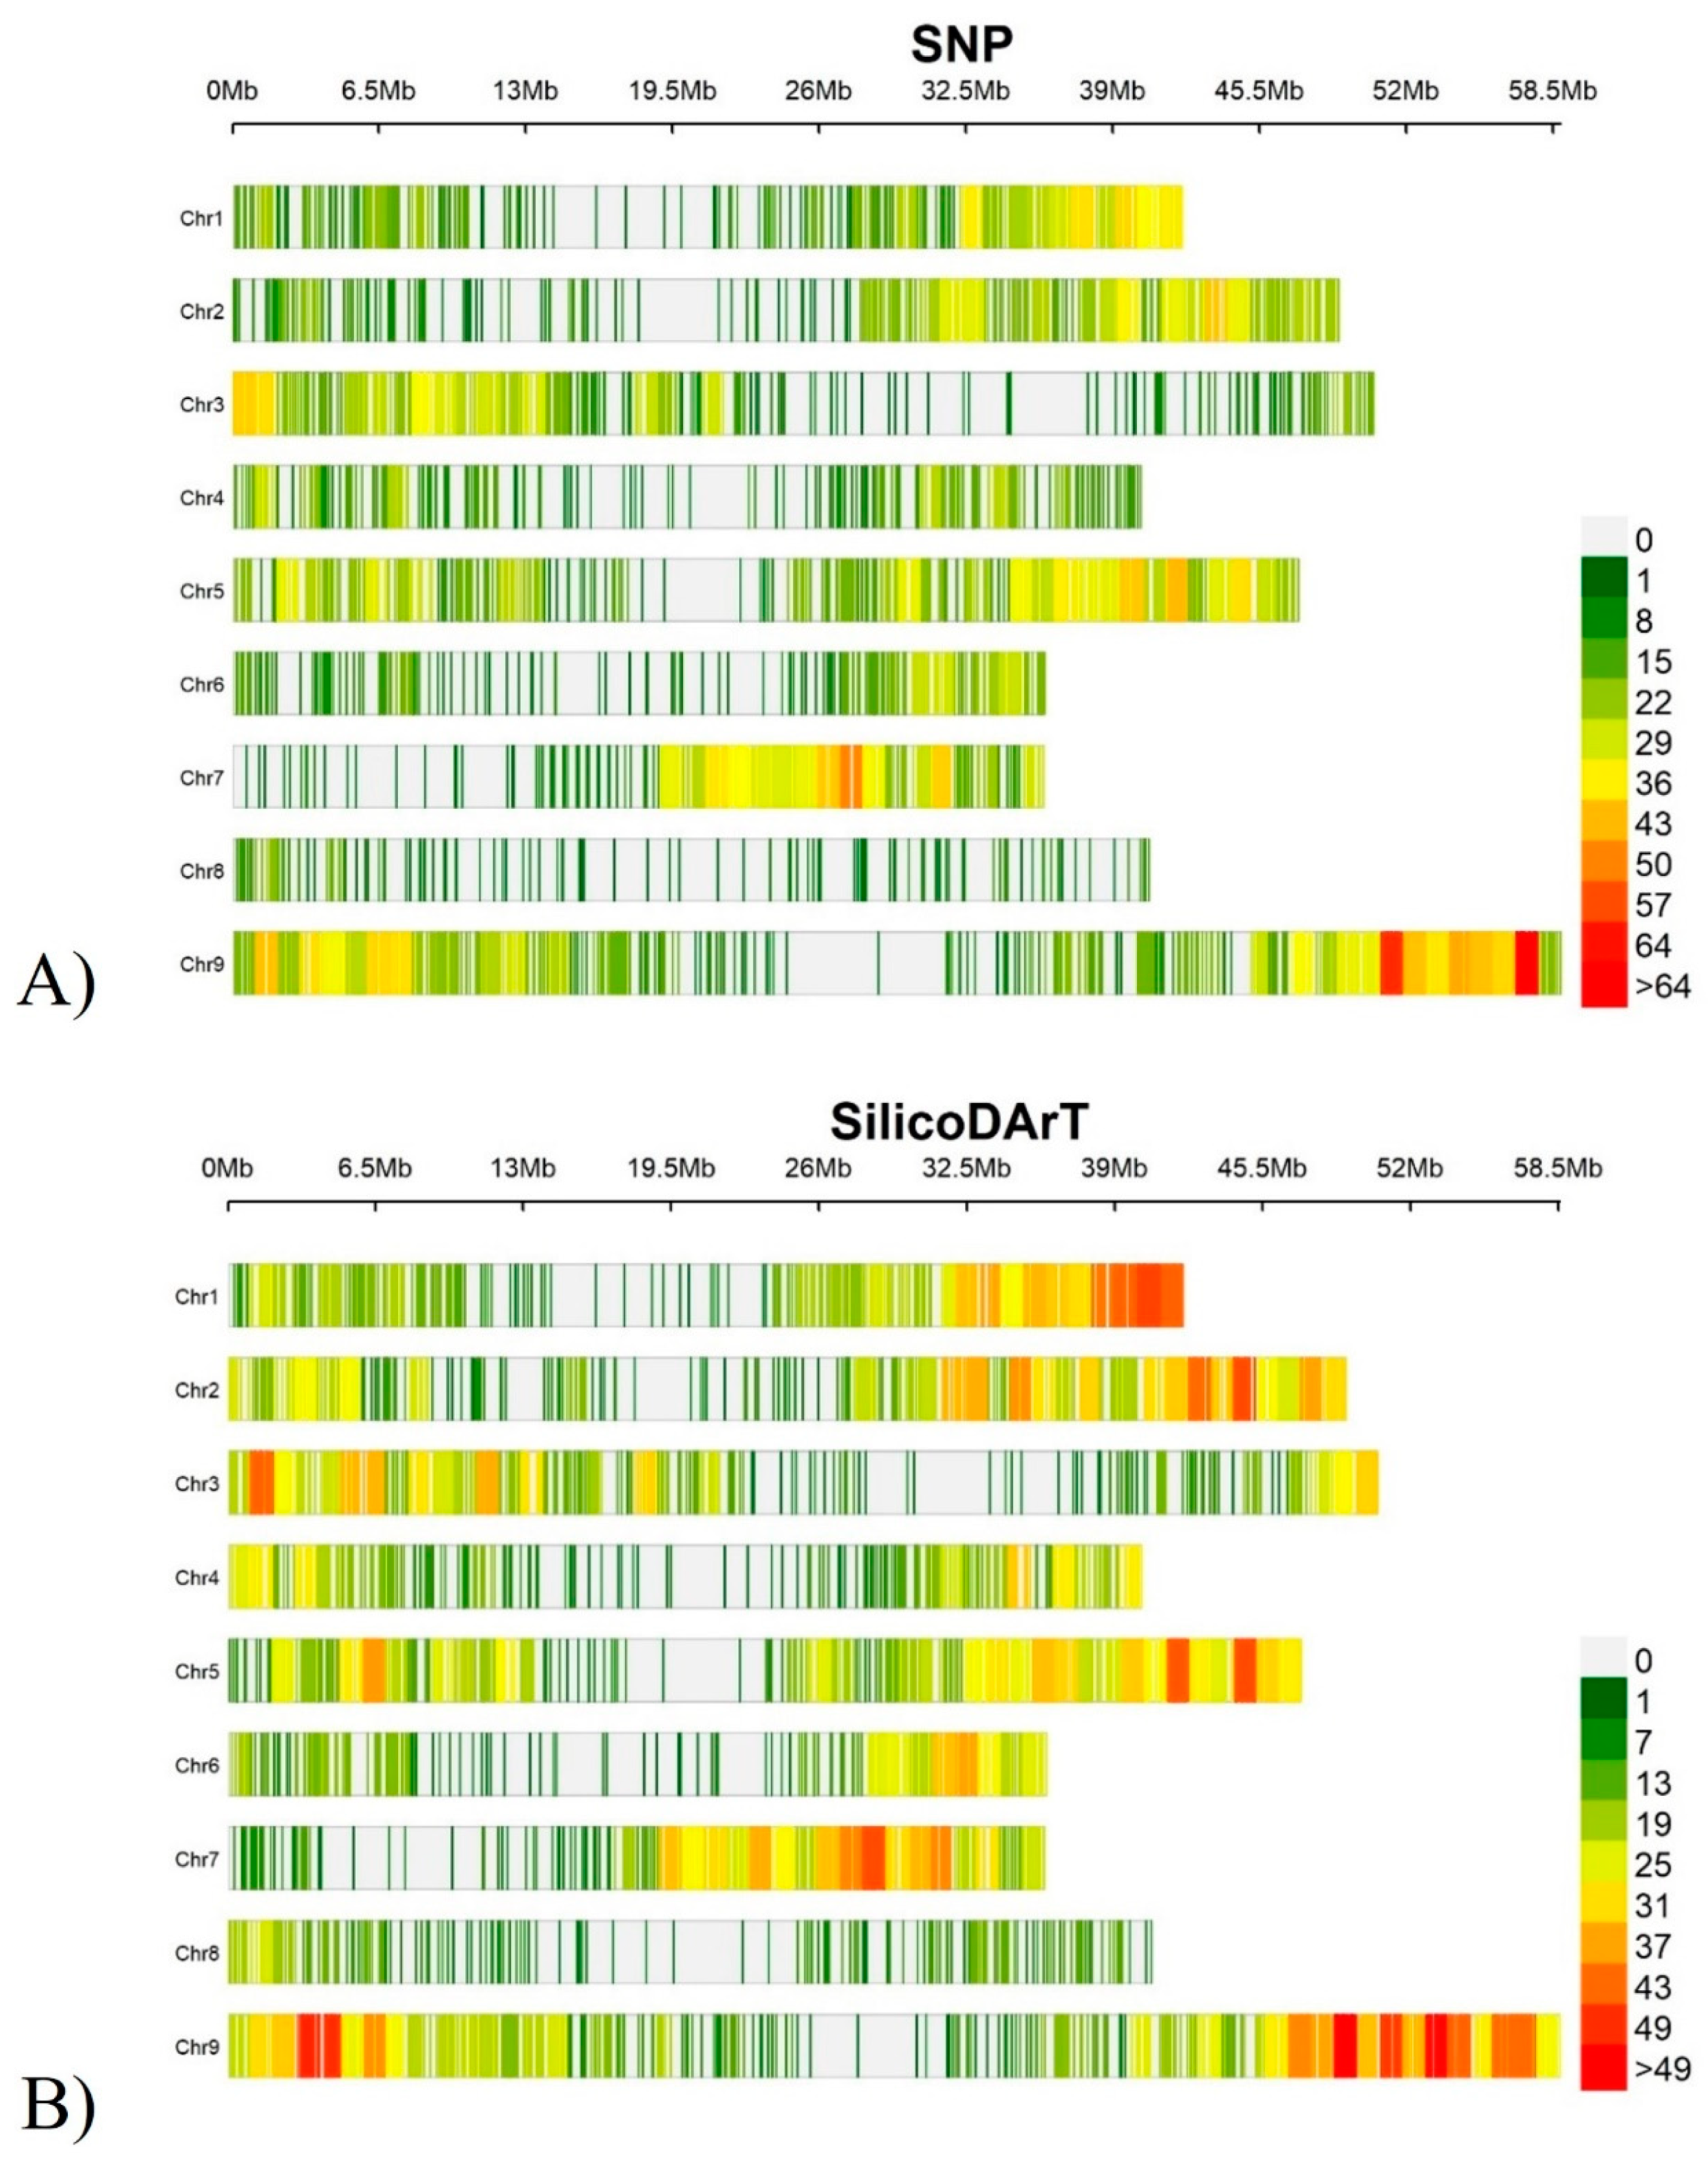
The DArTSeq markers were mapped onto the Setaria italica reference genome [39]. Figure 3 shows the genome-wide distribution and density of the markers on the reference genome. These mapped markers were used for genome-wide association studies for the different traits. Accordingly, the total number of SNP and SilicoDArT markers used for GWAS was 7,206 and 8,342, respectively (Supplementary Table S5).

3.8. Data filtering for association studies

For association studies, markers with known genomic positions were used. The markers were also filtered for missing data (≤20%), polymorphic information content (≥ 0.2) and minor allele frequency (MAF, 0.05). The phenotypic and feed quality data were checked for normality distribution (Supplementary Figure S3), and outliers were removed from the genome-wide association studies.

3.9. Markers associated with biomass yield and plant height

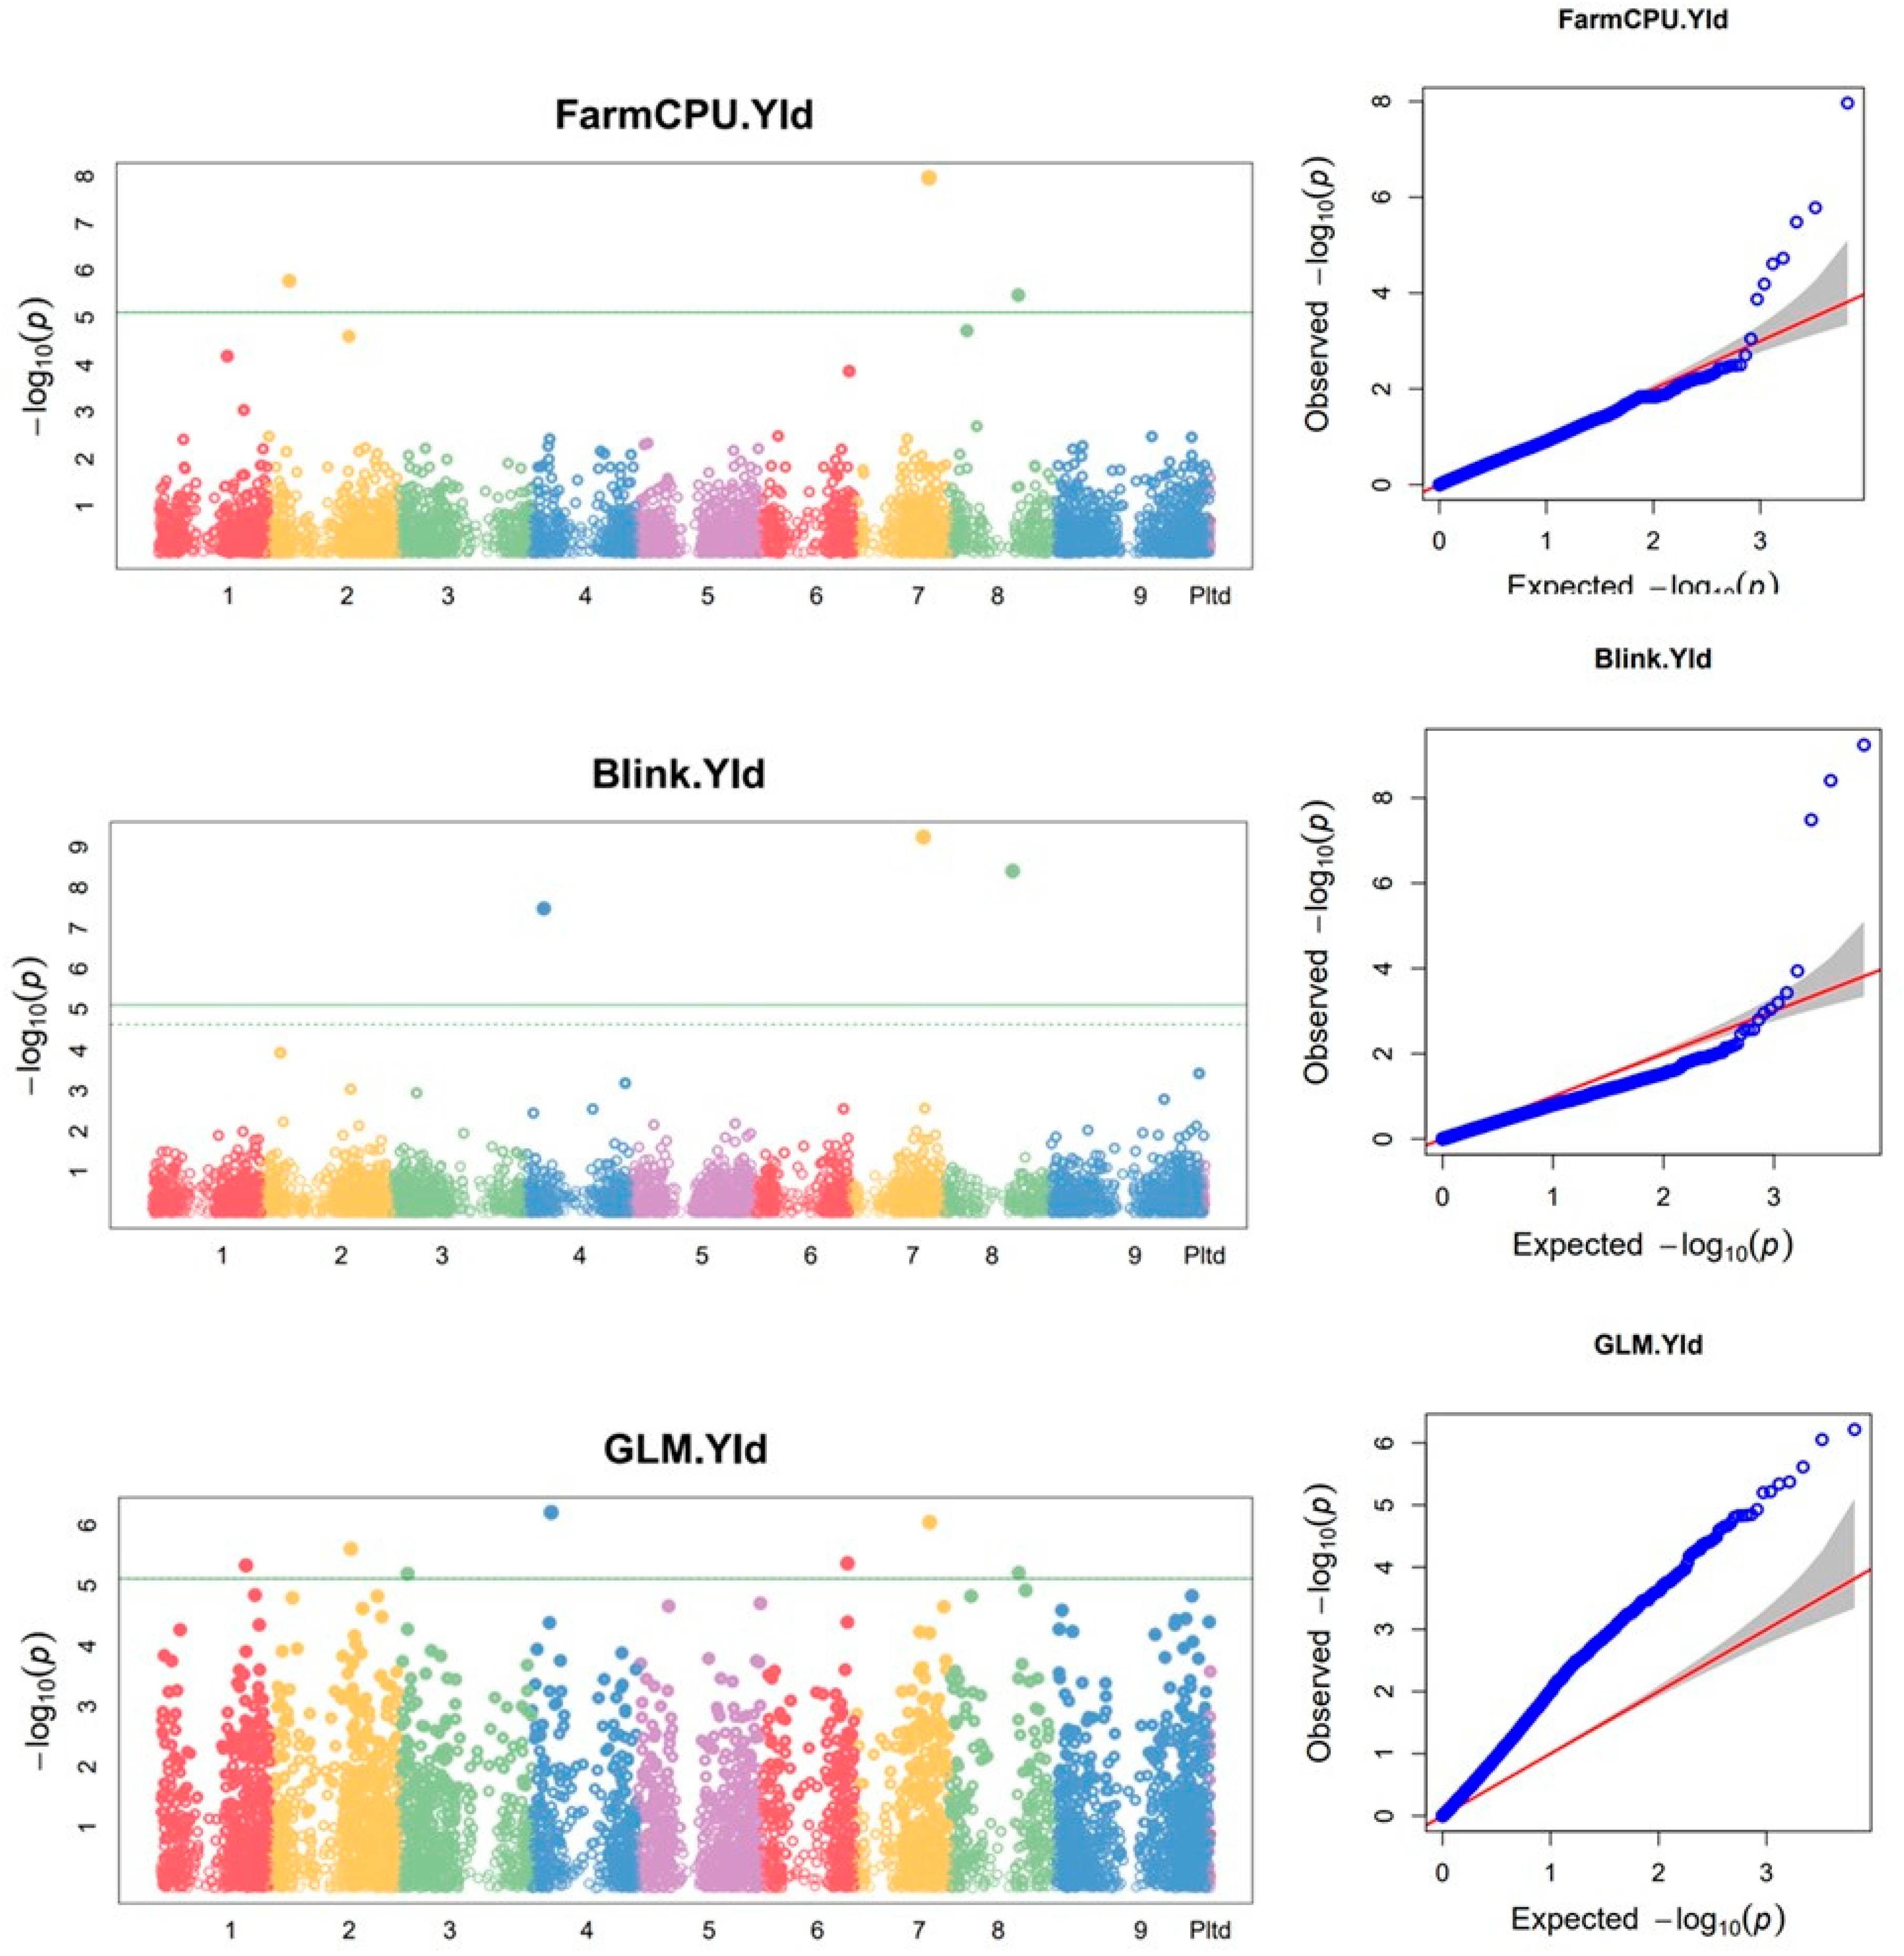
Using combined data from the two growing seasons, eight SilicoDArt markers were found to be associated with biomass yield. Of these markers, two were detected by three of the models (FarmCPU, BLINK and GLM) while one was detected by both Blink and GLM models (Figure 4 and Table 3). In 2015, one SilicoDArT marker on Chr1 and one on Chr8 was associated with biomass yield and plant height, respectively, using the BLINK model (Supplementary Figure S4a, Supplementary Table S6), while no SNP marker was found to be associated with biomass yield or plant height. In 2016, six silicoDArT markers were found to be associated with biomass yield (Supplementary Figure S4b, Supplementary Table S6). Of these markers, one marker on Chr8 was detected by all three of the models (FarmCPU, BLINK and GLM).
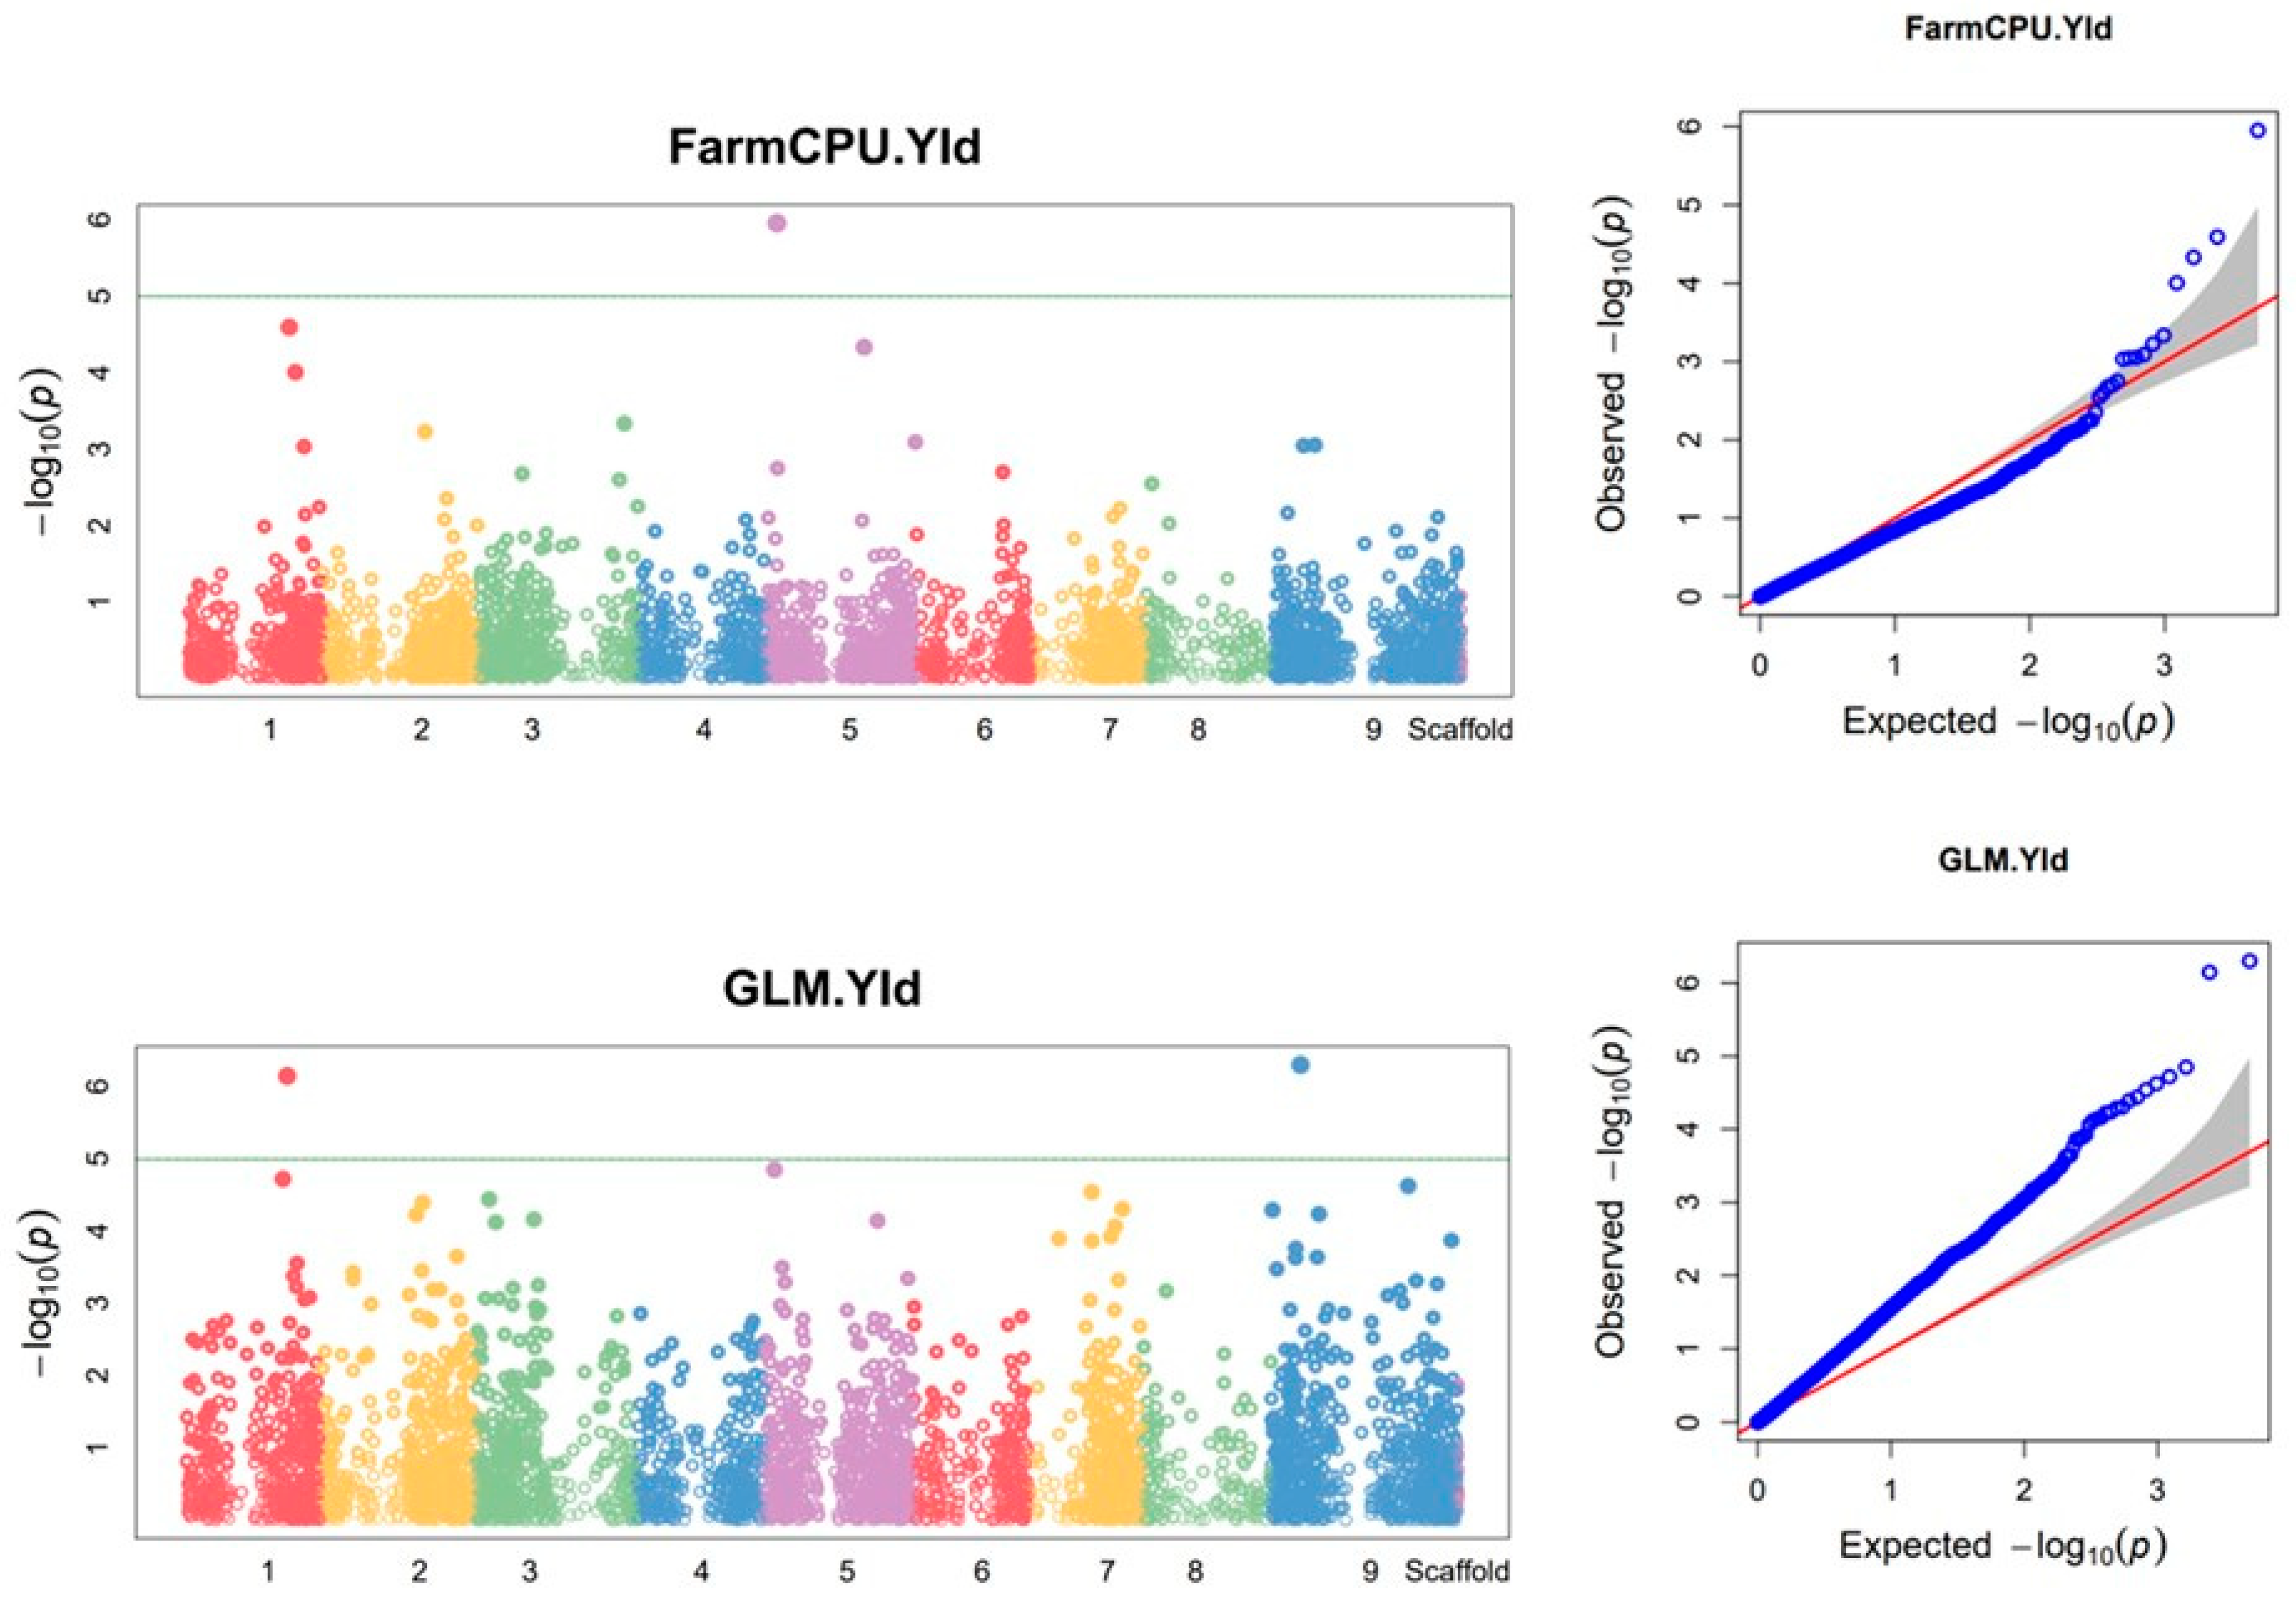
Using the combined data, three SNP markers were found to be associated with biomass yield (Figure 5 and Table 4). Two of these markers were detected with the GLM model while the other one was detected using the FarmCPU model. Using 2016 data, three SNP markers were associated with biomass yield (Supplementary Figure S5, Supplementary Table S7), of which one, on Chr1, was detected using both BLINK and GLM models. The other two SNP markers associated with biomass yield were located on Chr3.

3.10. Markers associated with feed quality traits

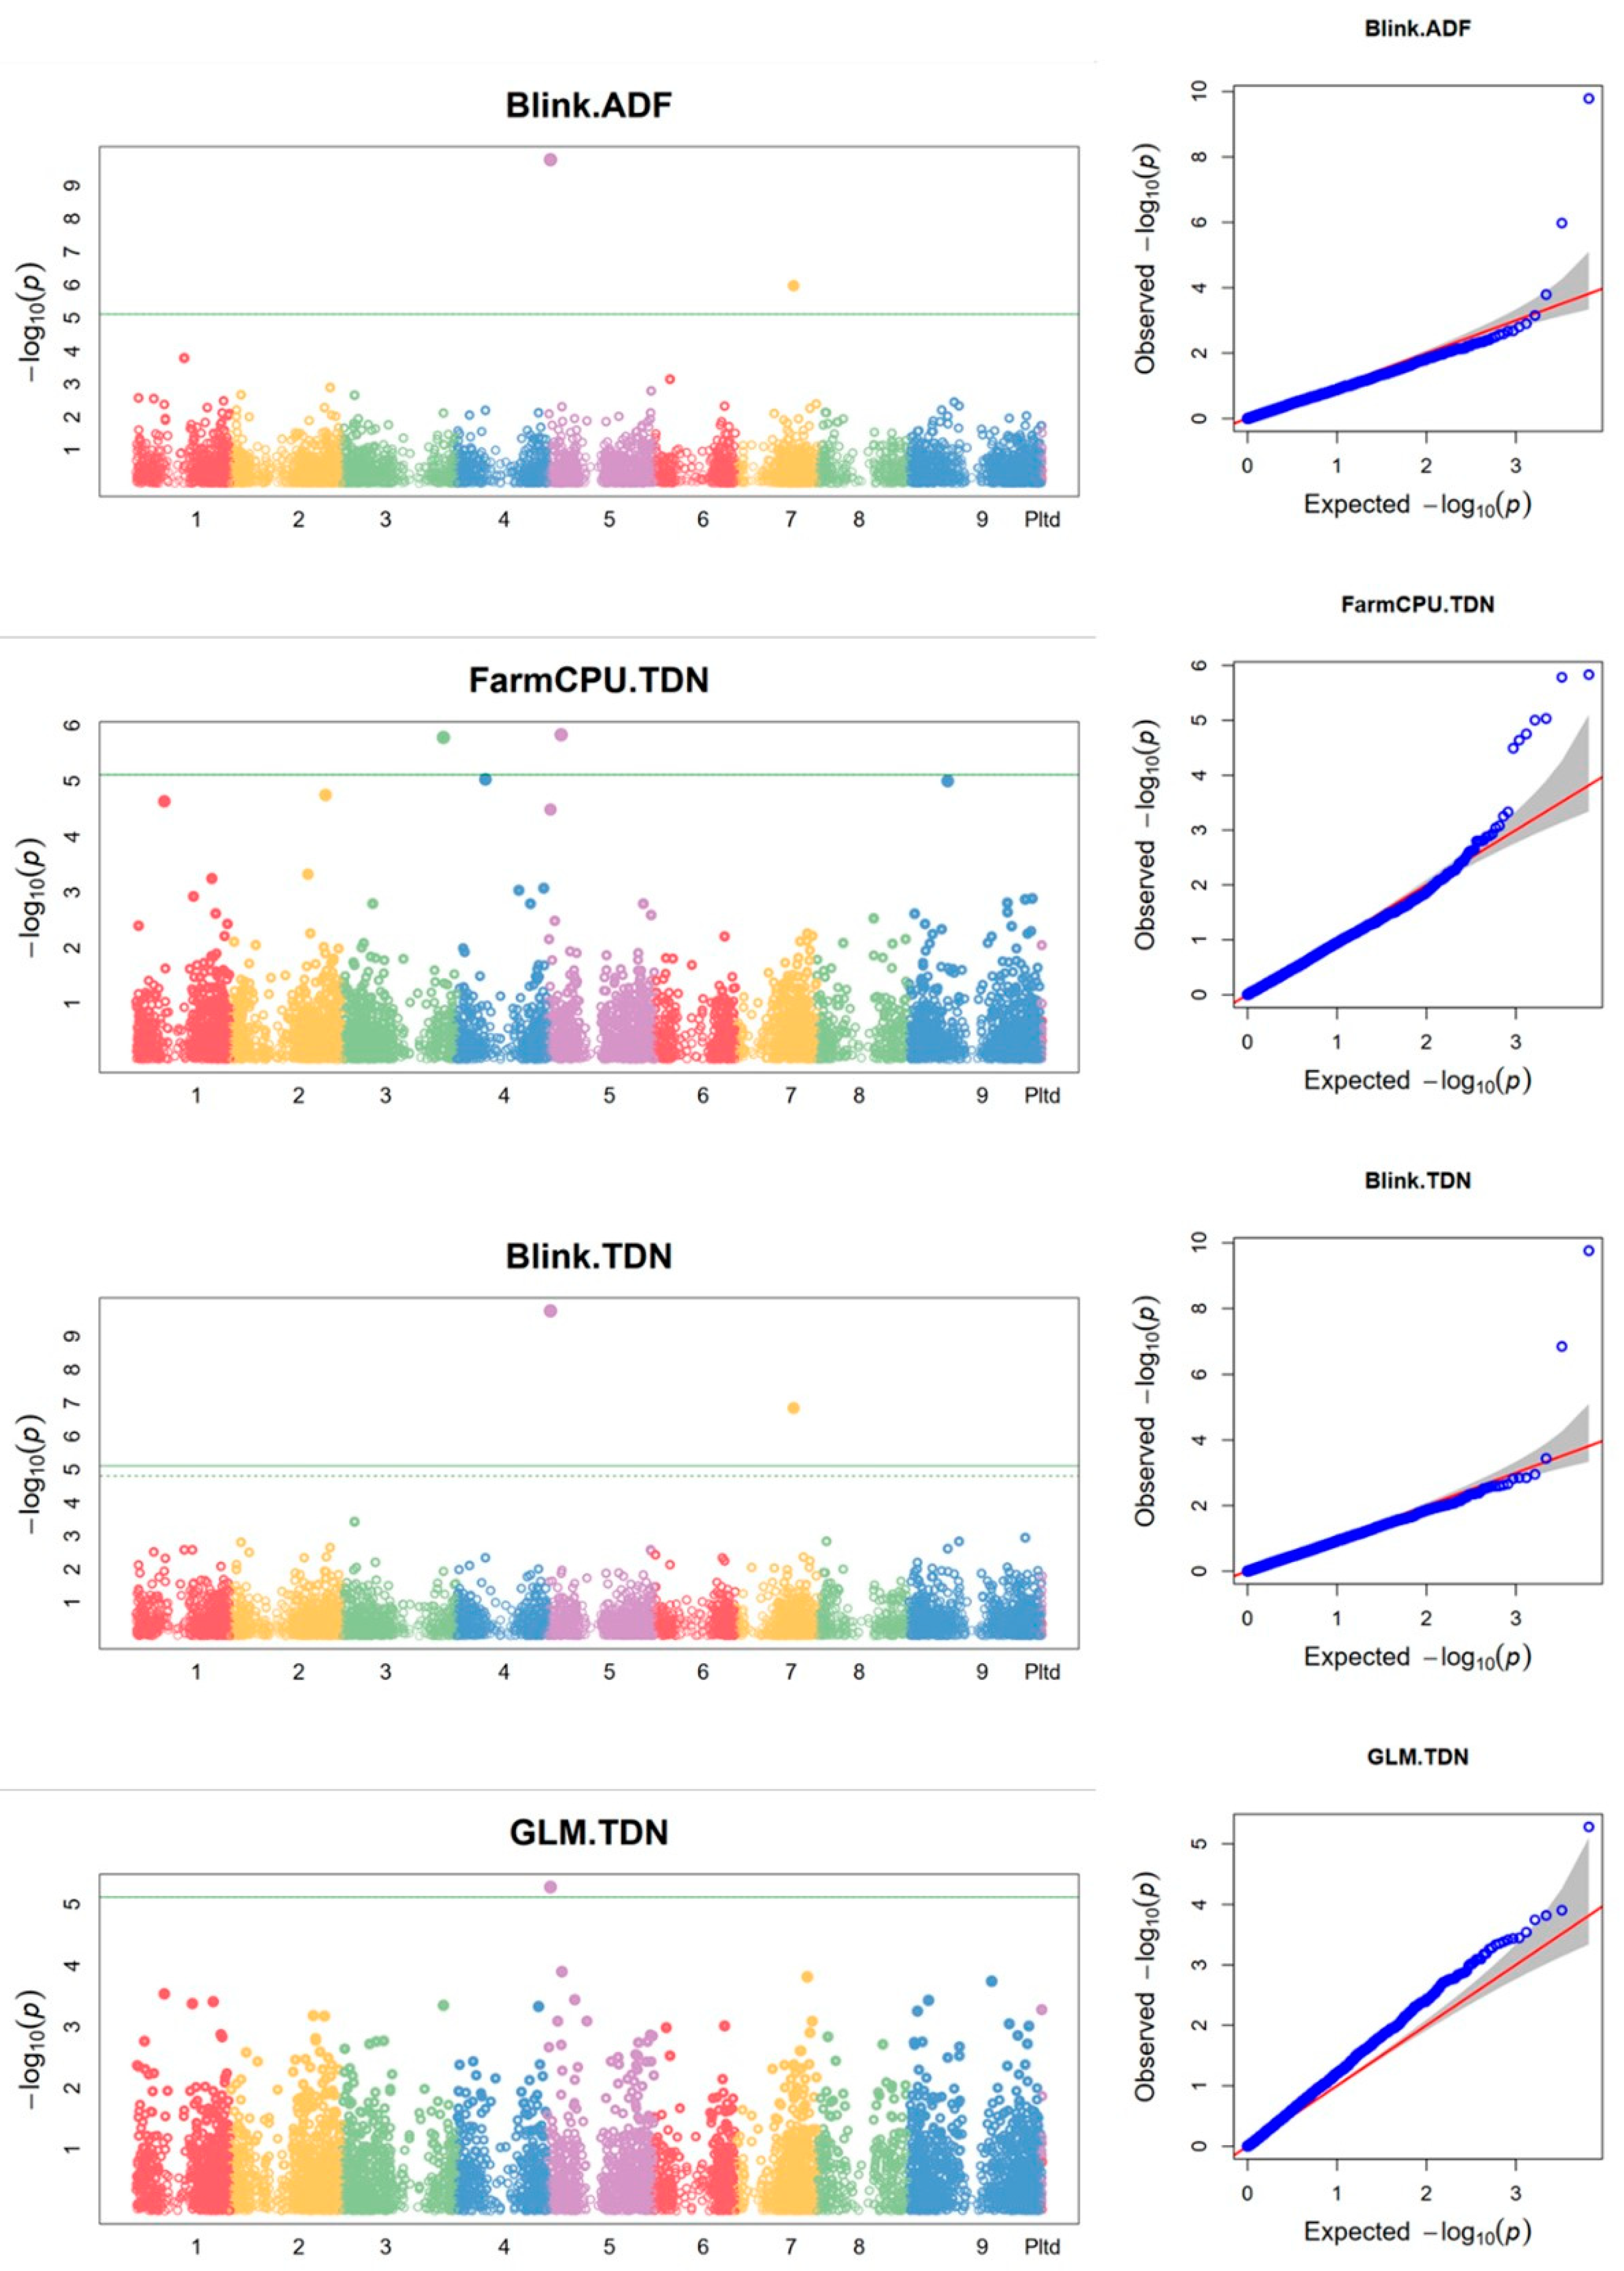
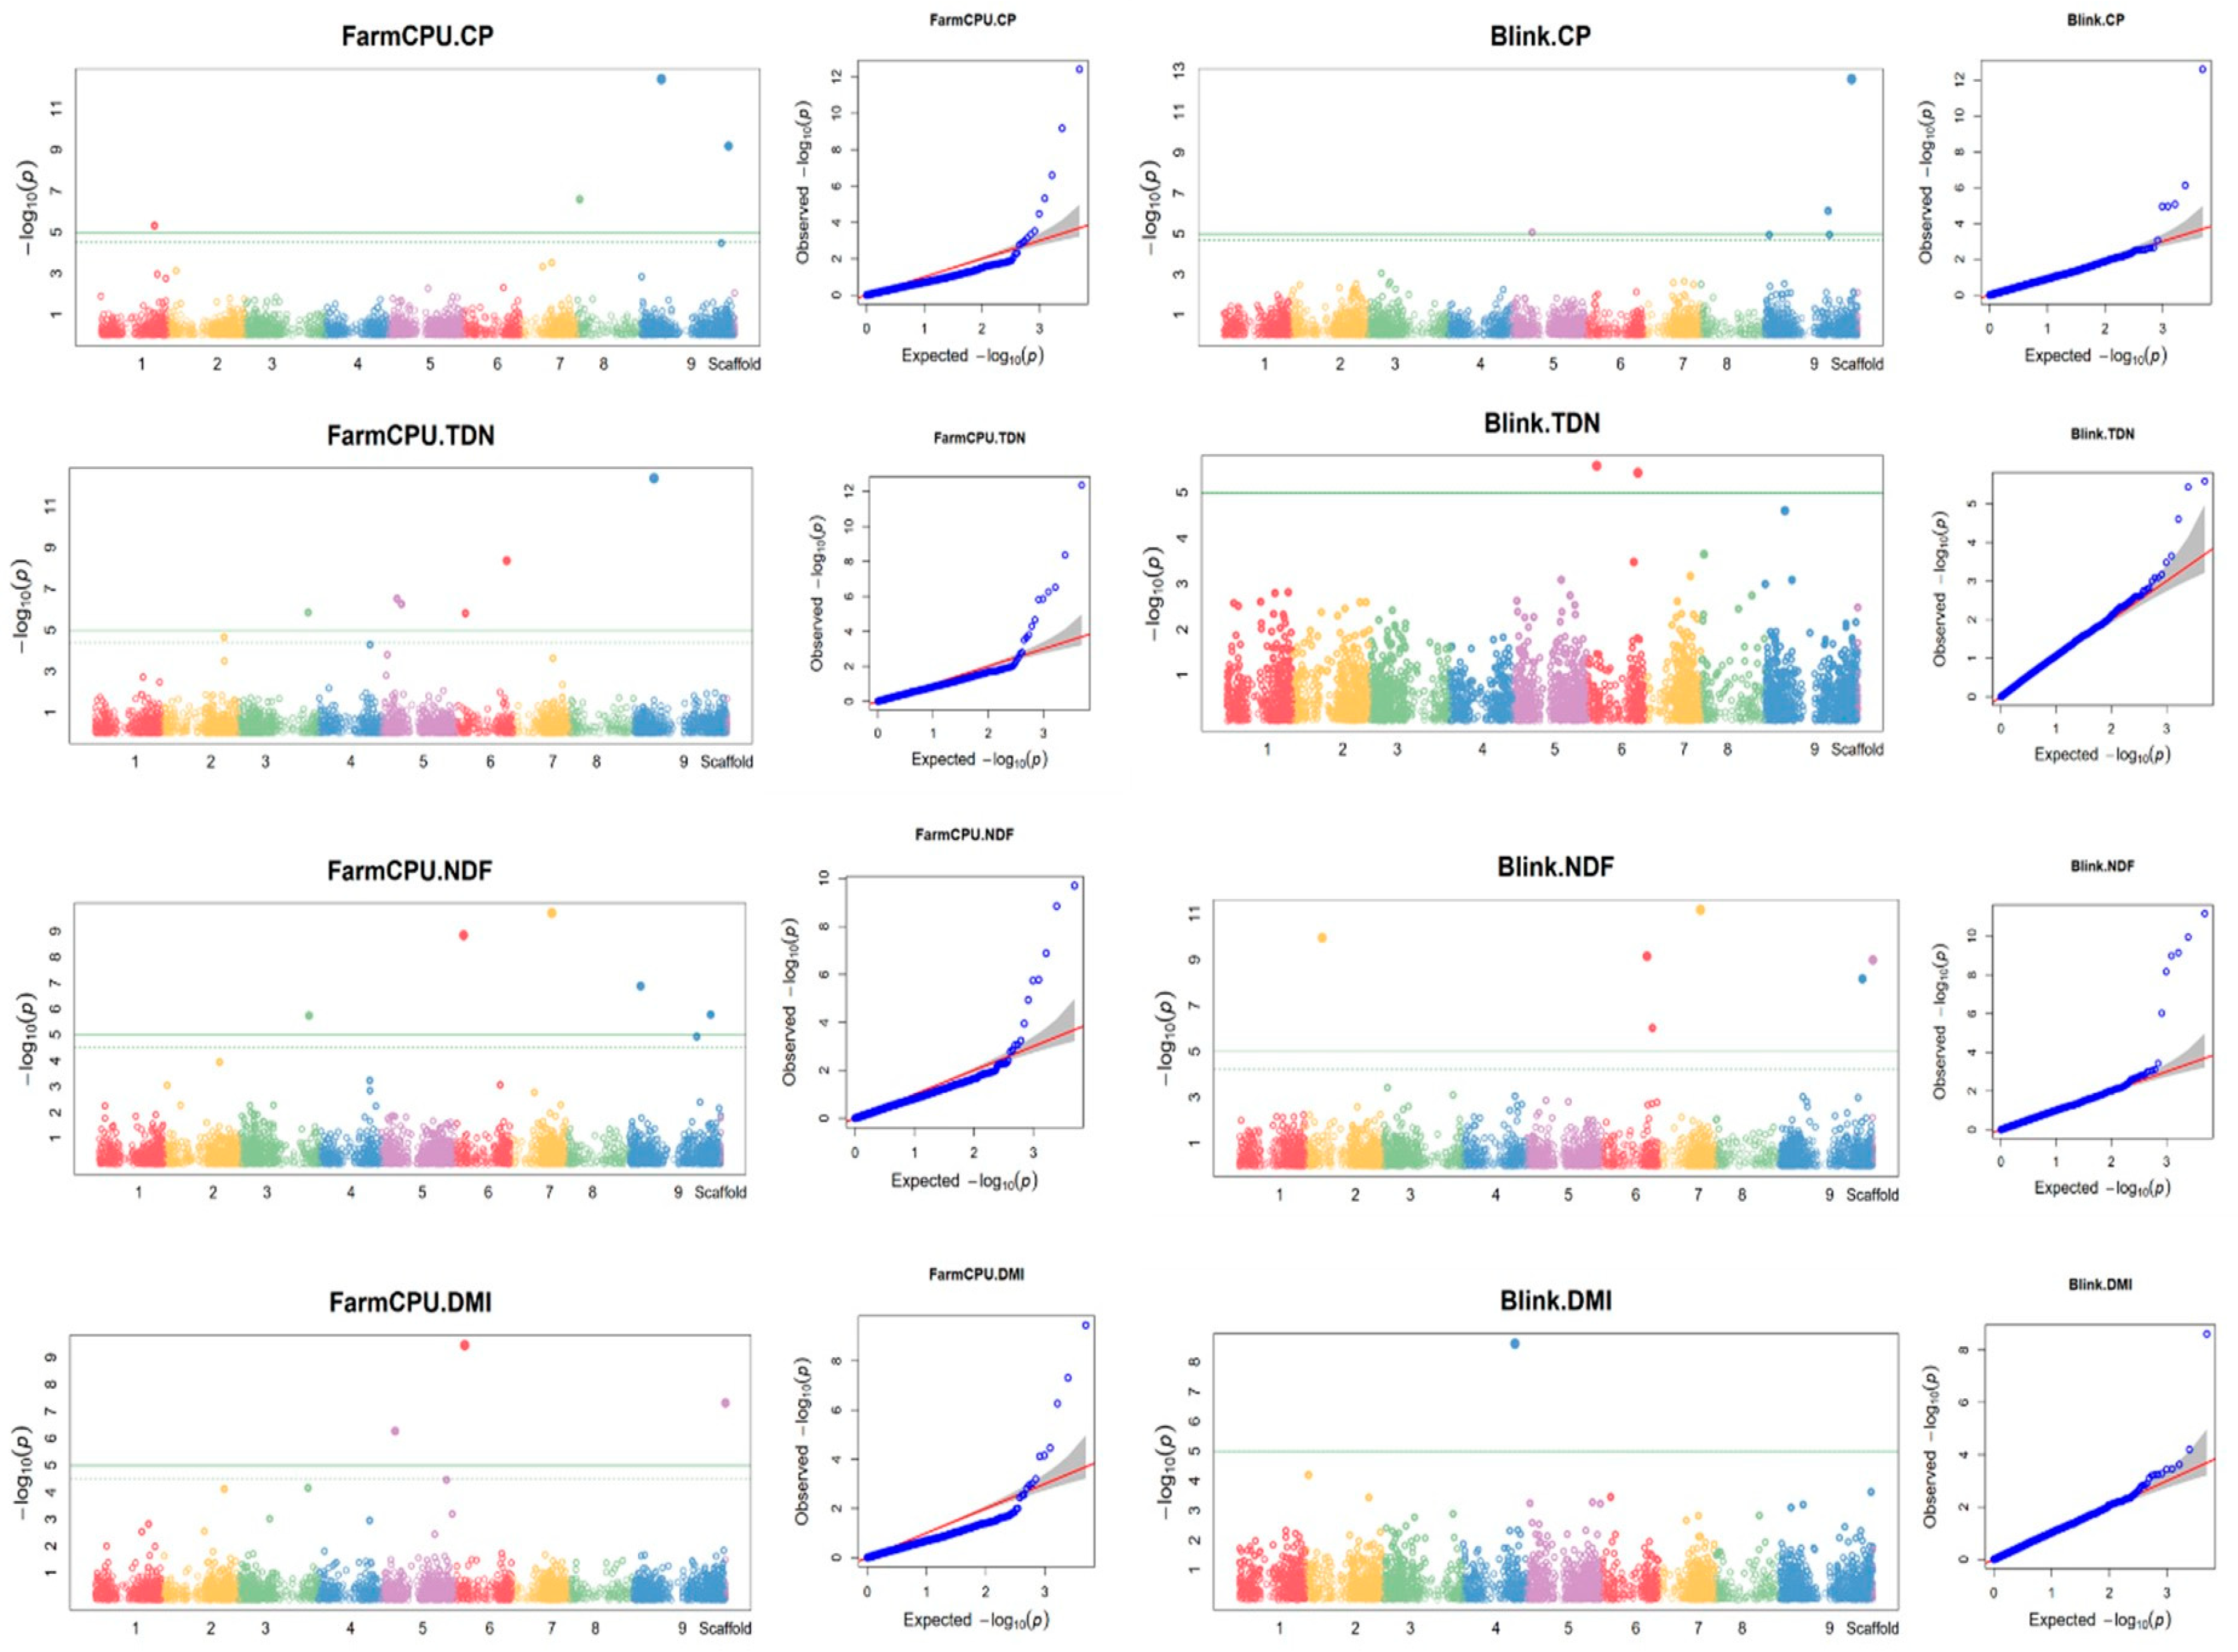
Using the combined data from the two growing seasons, four SilicoDArT markers were found to be associated with feed quality traits. Of these markers, two were associated with both ADF and TDN (Figure 6 and Table 5). In addition, some additional markers were also found to be associated with feed quality traits using the individual season data. In the 2015 season, four SilicoDArT markers were associated with CP using the BLINK model (Supplementary Figure S6a, Supplementary Table S8) while no other SNP marker was found to be associated with any of the feed quality traits in 2015. In 2016, two and three SilicoDArT markers were associated with CP and TDN, respectively (Supplementary Figure S6b, Supplementary Table S8).
Using the combined data, 19 SNP markers were found to be associated with CP, 11 with NDF, six with ADF, 19 with TDN and seven with DMI (Figure 7 and Supplementary Table S9). In addition, using the 2016 season data, four SNP markers were found to be associated with TDN, two with CP and seven with ADF (Supplementary Figure S7 and Supplementary Table S10). One of the SNP markers associated with CP was detected using both BLINK and GLM models and one marker associated with TDN was detected using both FarmCPU and BLINK models.

4. Discussion

4.1. Markers associated with feed quality traits

Buffel grass is an important forage grass in the tropical and subtropical regions of the world [24,25]. Substantial variation in agronomic and nutritional quality traits was observed in the buffel grass accessions which shows the rich genetic variation embedded in the collection from which to select lines with superior performance. Genotypes × season interaction was also significant for all traits indicating that multiyear evaluation of buffel grass is essential to determine consistent performance of the genotypes. However, the maximum biomass yield recorded in the current report is less than the biomass yield reported elsewhere [25,28,33]. The relatively lower biomass yield observed at Bishoftu could be related to the environmental conditions and difference in management practices. On the other hand, the range of CP content of the studied accessions was wider than what has been reported elsewhere for the grass [28,50]. Based on genome-wide DArTSeq markers, the collection was clustered into eight clusters [9]. The accessions in clusters I, II and III showed low biomass yield but a relatively higher feed quality (CP, TDN and DMI) than the rest of the clusters. Cluster IV had the highest biomass yield and the tallest plants compared to the other clusters. Similarly, Jorge and colleagues [35] also studied 68 accessions and classified them based on the robustness of the plant, flowering characters and growth forms. Accordingly, some of the accessions with the highest biomass yield and tallest plants belong to the most robust and leafiness cluster group while accessions with the lowest biomass yield belong to the cluster with short leaves and thin stems.
The present study also revealed different levels of variability and heritability (H2) among genotypes. Biomass yield and plant height recorded the highest value for PCV and GCV indicating the presence of high genetic variability for the traits. The PCV value for biomass yield was equivalent to the corresponding GCV value while the PCV value for plant height was close to GCV value. The heritability estimates were high for both biomass yield and plant height. This shows the substantial contribution of genetic factors to the observed performance for both traits. Thus, directional selection might be effective to improve these two traits. On the other hand, NDF, TDN, CP, ADF and DMI showed low PCV, GCV and H2 estimates indicating low genetic variability. PCV values for feed quality traits were greater than the corresponding GCV values, indicating the significant effect of environmental factors on the expression of these traits. This is in line with the observed low heritability estimates for the feed quality traits. In general, the evaluated accessions showed significant variation in performance. Hence, given the observed genetic and phenotypic performance variation in the collection [9,35,51], there is a potential improvement opportunity in the buffel grass germplasm to develop high yielding climate resilient varieties.

4.2. Correlation of biomass yield, plant height and feed quality traits in buffel grass

Biomass yield and feed quality traits are important parameters in forage improvement. Understanding the relationship between biomass yield and feed quality traits and the genetic basis of their relationship would be of great importance to breeding programs. A positive correlation was observed between biomass yield and plant height (0.64**). Biomass yield had a positive correlation with NDF (0.48***) and ADF (0.60**), and a negative correlation with CP (-0.51***), TDN (-0.59***), DMI (-0.48***). Plant height also had a similar trend in correlation with feed quality traits. It is also worth noting that DMI and TDN had a strong negative correlation with NDF (-0.999***, and -0.870***, respectively). NDF also had a similar correlation with DMI (-0.981***) and TDN (-0.885***). The observed relationship between the traits was very similar during the two growing seasons. The correlation observed between biomass yield and plant height, and biomass yield and feed quality traits have implications for the improvement programs. For example, plant height could be used a good indicator for biomass yield under field conditions. However, the negative correlation between biomass yield and the feed quality traits (CP, TDN and DMI) needs special attention in the improvement programs as varieties with higher biomass yield might be poor in feed quality. Thus, the high biomass yielding accessions and accessions that produce high CP contents would be the candidate accessions for further field performance evaluation in different tropical agroecologies and seasons.

4.3. Marker trait associations in buffel grass

In the present study, we used a buffelgrass germplasm collection in the forage genebank at ILRI and conducted GWAS to identify marker trait associations. Several marker trait associations were identified. Using the combined data from the two seasons, three SNP and eight SilicoDArT markers were found to be associated with biomass yield. A total of nine markers (six SilicoDArT and three SNP) were found to be associated with biomass yield in the 2016 growing season. One of the SNP and two of the SilicoDArT markers were detected both using the 2016 season and the combined data. In the 2015 growing season, one SilicoDArT marker was associated with biomass yield. One SilicoDArT marker was associated with plant height in 2015. No marker was associated with plant height using the 2016 season and the combined data.
Using the combined data, four SilicoDArT markers were found to be associated with ADF and TDN, while no marker was found to be associated with the other feed quality traits (CP, NDF and DMI). One of the four markers was also detected using individual season data and it was associated with CP in 2015 and TDN in 2016. A total of eight SilicoDArT markers (four in 2015 associated with CP, two in 2016 associated with CP, three in 2016 associated with TDN) were found associated with feed quality traits.
Using the combined data, a total 42 SNP markers were associated with feed quality traits, of which four were also detected using the 2016 season data. Of the four markers detected using both combined and 2016 season data, two were associated with the same trait (one with ADF and the other with TDN). The other two markers were associated with different traits depending on the dataset. Seven SNP markers were associated with DMI using the combined data while no marker was found to be associated with the trait using the individual season data. Thirteen SNP markers were found to be associated with feed quality using data from the 2016 growing season. Of these markers, four were associated with TDN, two with CP and seven with ADF. The different marker trait associations identified between the two growing seasons (2015 and 2016) could be related to the difference in weather conditions (Supplementary Table S11). For example, the average monthly rainfall of the location during the months of July to September was 117 mm in 2015 and 142 mm in 2016. In addition, in 2015, the minimum and maximum daily temperature during July to August was 12°C and 26°C while it was 13°C and 28°C, respectively, during the same months in 2016. The variation in growing conditions would affect the performance of the genotypes and result in variation in the marker trait associations for the different years. Another reason could be that the plants were well established during the second season and therefore more able to reach a performance towards the crops genetic potential.

4.4. Genome wide distribution and co-localization of the marker trait associations

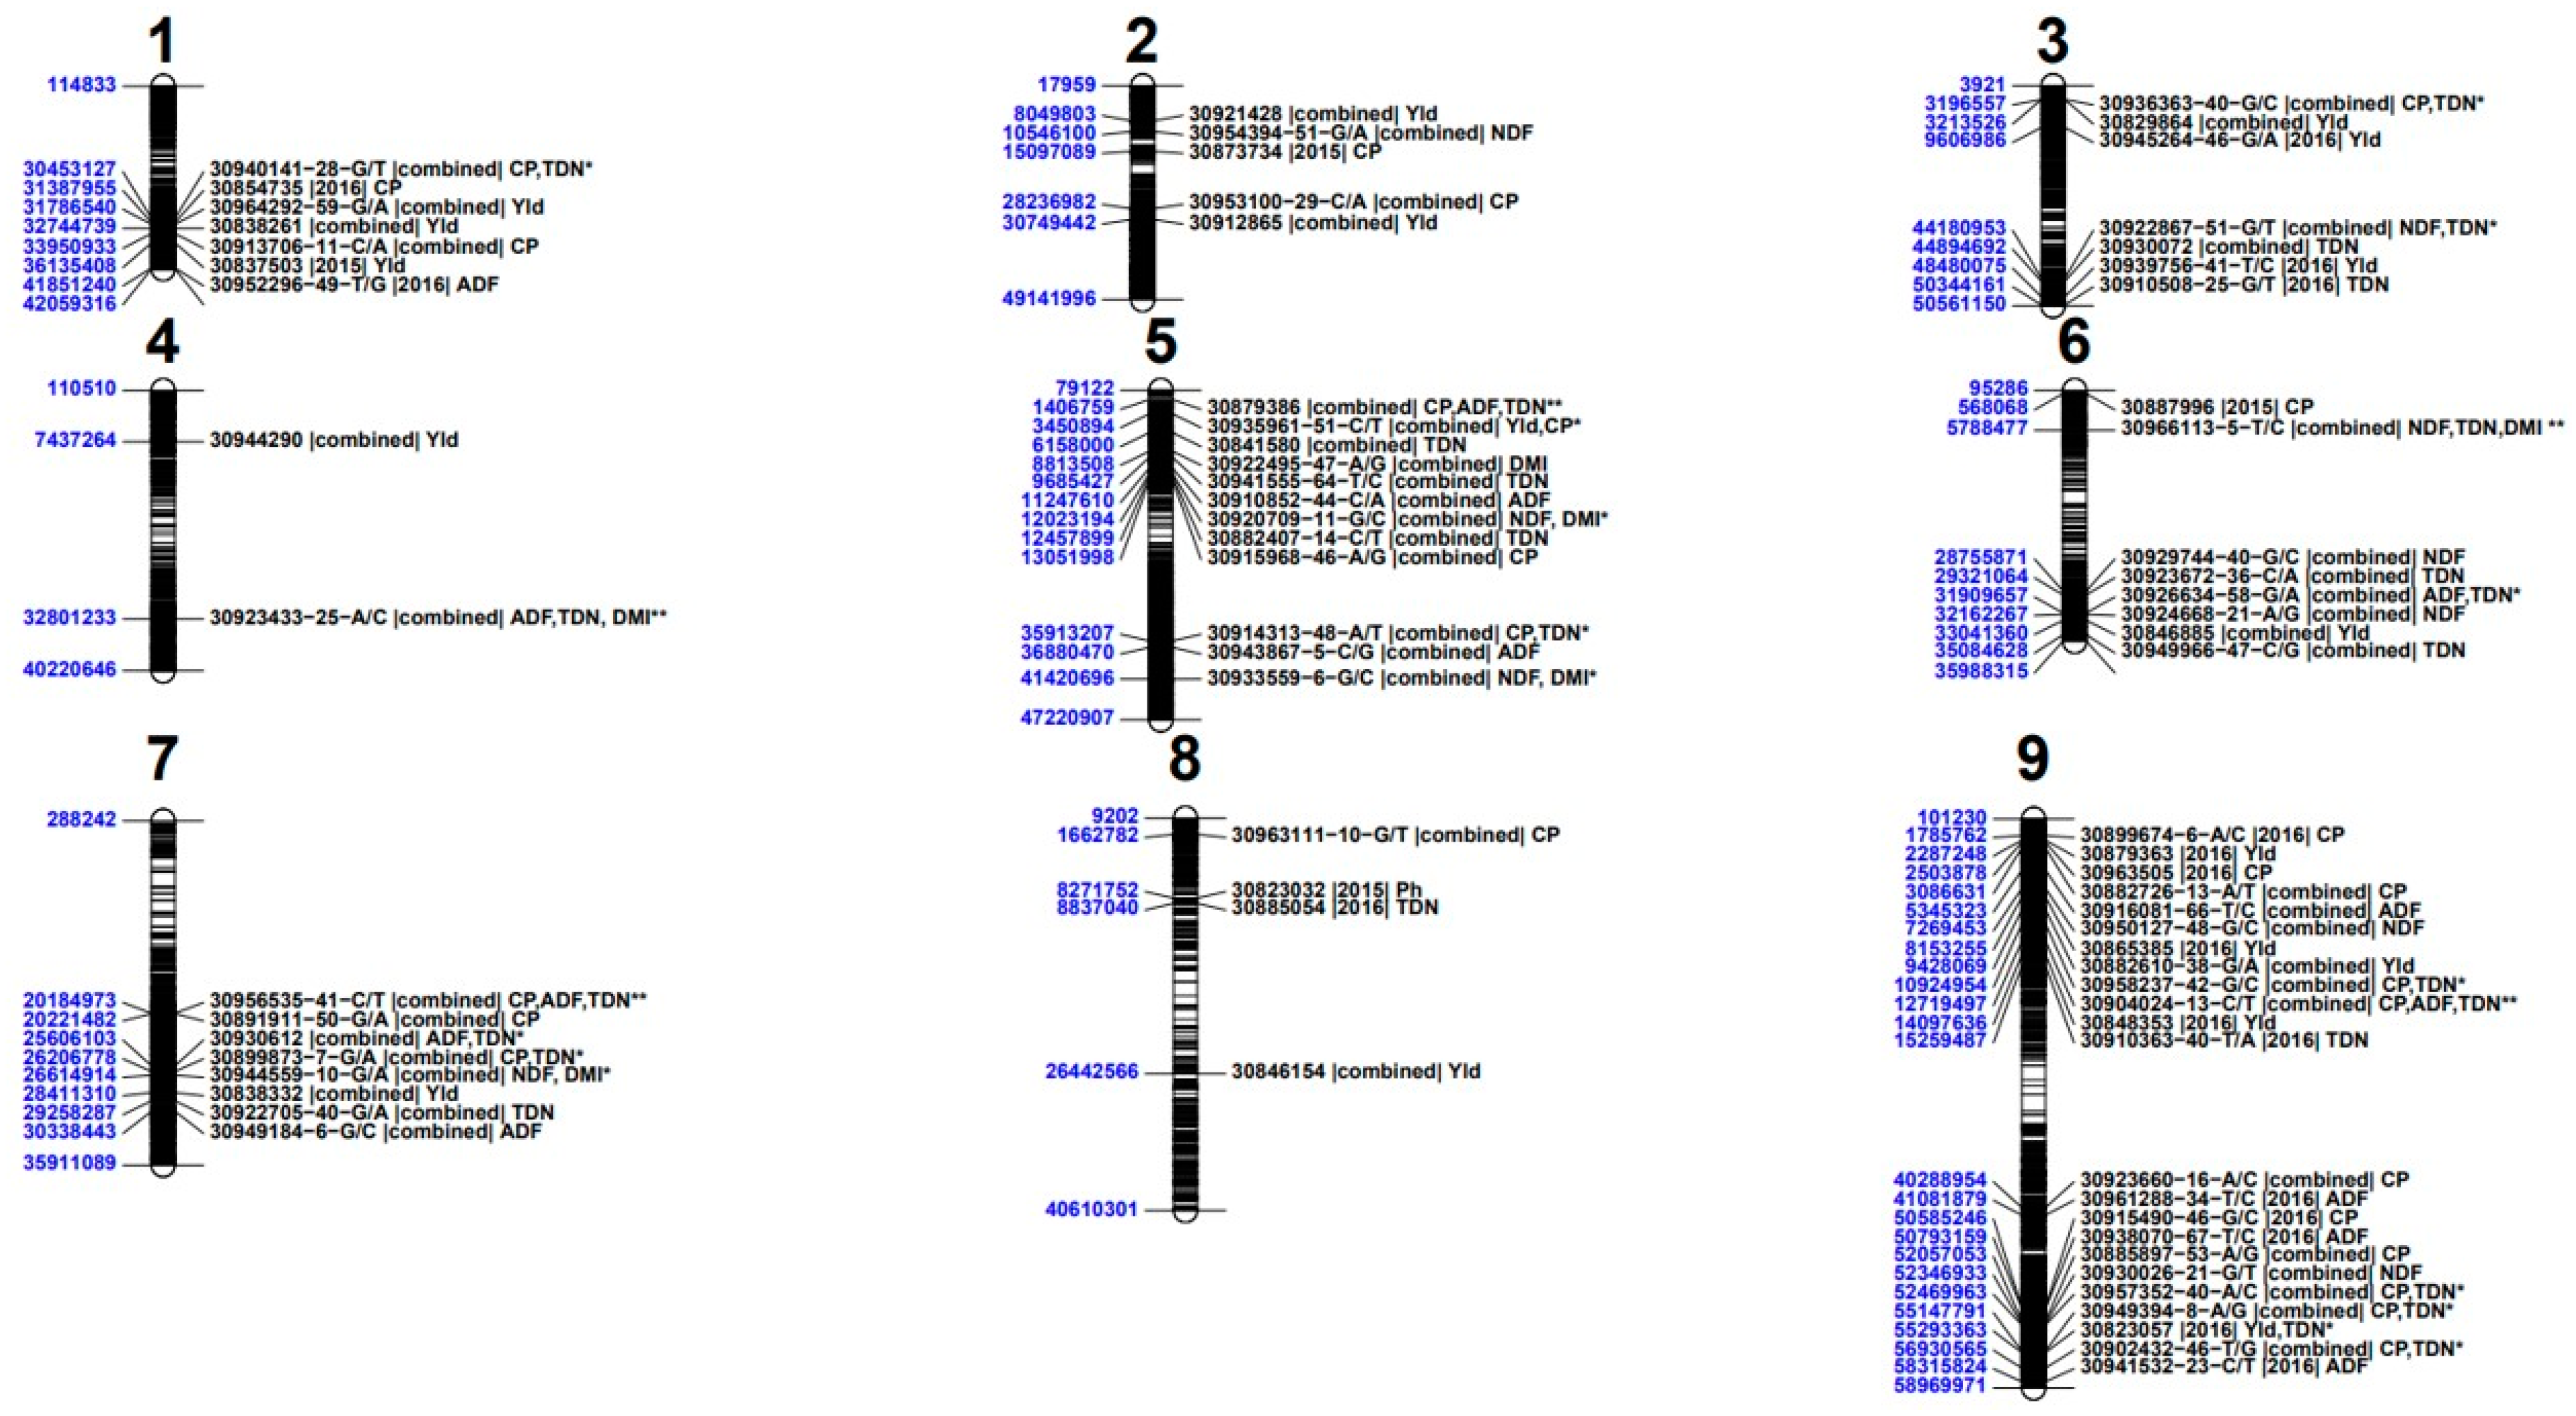
Except for a few studies with conventional molecular markers[52], genomic studies are limited in buffel grass. A reference genome has not been developed to date. The lack of its own reference genome has hindered mapping and selection of genome wide representative markers for further molecular studies. As a result, the reference genome of Setaria italica [39] was used to map the generated markers. However, only a small percentage of the total markers were successfully mapped [9]. Despite this challenge, we conducted a GWAS using the mapped markers and identified several marker trait associations with R2 values ranging from 0.138 to 0.236. The identified marker trait associations were distributed across the different chromosomes of the Setaria italica genome (Figure 8). On Chr1, three SilicoDArT markers (one for CP and two for biomass yield) and four SNPs (one associated with CP and TDN, and one each for biomass yield, CP and ADF) were identified. The SNP associated with ADF was detected using the 2016 season while the SNPs with biomass yield, CP and TDN were identified using the combined data. Three SilicoDArT markers (one for CP and three for biomass yield using the 2016 season data) and two SNP markers (one each for CP and NDF using combined data) were identified on Chr2. Five SNP markers (two associated with biomass yield, one with TDN, one with both NDF and TDN and one with both CP and TDN) and two SilicoDArT markers (one each for yield and TDN) were located on Chr3. On Chr4, one SilicoDArT marker associated with biomass yield and one SNP marker associated with multiple traits (ADF, TDN and DMI) were identified using the combined data. No marker on this chromosome was found to be associated with these traits using individual season data.
On Chr5, 13 markers were associated with different traits. One SilicoDArT marker was associated with both CP (2015 season data) and TDN (2016 season data) while it was associated with ADF and TDN using the combined data. Another two SilicoDArT markers associated with CP (2016 season) and TDN (combined data) were also located on this chromosome. In addition to the SilicoDArT markers, ten SNP markers associated with different traits (one with biomass yield, three with TDN, three with DMI, three with CP, two with ADF and two with NDF) were also found on this chromosome. Four of these SNP markers were associated with two different traits.
On Chr6, there were two SilicoDArT markers (one each associated with CP and biomass yield) and six SNP markers (two with TDN, two with ADF, one with both TDN and ADF, and one with TDN and DMI) associated with different traits. One of the SNP markers was associated with three feed quality traits (NDF, TDN and DMI) while one was associated with both ADF and TDN. Six SNP and two SilicoDArT markers associated with different traits were located on Chr7. One of these markers was associated with three feed quality traits (CP, ADF and TDN) while the other three markers were associated with two different traits. Three SilicoDArT markers (one each for plant height, biomass yield, and TDN) and one SNP marker associated with CP were located on Chr8. A total of 23 markers associated with traits (18 SNP and 5 SilicoDArT) were located on Chr9. Of these markers, nine were associated with CP, five with ADF, two with NDF, one with biomass yield and five with TDN. Among the SilicoDArT markers, one is associated with both biomass yield and TDN, two with CP and three with biomass yield. One of the SNP markers was associated with three feed quality traits (CP, ADF and TDN) while four SNP markers were associated with two of the traits.
In a few cases, a single marker was associated with two and three traits or markers associated with two different traits were closely located on the same chromosome. Markers associated with three traits were found on Chr4, Chr5, Chr6, Chr7 and Chr9. The markers on Chr4 and Chr6 were associated with ADF, TDN and DMI while the markers on Chr5, Chr7 and Chr9 were associated CP, ADF and TDN. In addition, several markers associated with two traits were also found on Chr1, Chr3, Chr5, Chr6, Chr7 and Chr9. For example, a SilicoDArT marker on Chr5 was associated with both CP and TDN while another SilicoDArT marker on Chr9 was associated with both biomass yield and TDN. Closely located marker trait associations were also found on six of the nine chromosomes. On Chr1, a SilicoDArT marker associated with CP and a SNP marker associated with biomass yield are located at 398,585 bp from each other. Similarly, on Chr8, markers associated with plant height and biomass yield have a physical distance of 565,288 bp from each other. Among the markers on Chr9, a SNP marker associated with CP and a SilicoDArT marker associated with biomass yield are located at 501,486 bp from each other. Other closely located marker trait associations are also found on Chr1 (biomass yield and CP/TDN), Chr3 (ADF/TDN and NDF), Chr5 (TDN and NDF/DMI), Chr6 (NDF and ADF/TDN), Chr7 (CP and CP/ADF/TDN), and Chr9 (biomass yield and CP, CP and ADF, NDF and CP/TDN). In summary, a total of 78 marker-trait associations (one based on both individual growing season and combined data, 47 based on combined data only, 21 based on individual growing season data only and 9 based on both combined and 2016 growing season data) were identified in this study. The generated information on the genome distribution of the marker trait associations will be a useful resource for future improvement programs in this important tropical forage. Furthermore, an additional study is required to validate the associations and co-localization of the identified markers. In line with this suggestion, it is very important to develop a buffel grass reference genome to facilitate genomic studies and the development of markers for efficient marker-assisted selection/breeding. Developing a species specific reference genome will increase the number of mappable markers and thereby improve the discovery and accuracy of the marker trait associations in this drought tolerant tropical forage.

4.5. Marker trait association in functional putative genomic regions

Some of the identified marker trait associations were in genomic regions related to key enzymes and proteins involved in different biochemical reactions and processes in plants. Among the identified SNP markers associated with biomass yield, one is located on Chr1 in the genomic region linked to a gene encoding a Phenylalanine ammonia-lyase (PAL)-like protein. PAL catalyzes the deamination of phenylalanine to produce trans-cinnamic acid, a precursor of lignins, flavanoids, and coumarins and it is a key enzyme that induces the synthesis of salicylic acid that causes systemic resistance in many plants [53,54]. A recent study has shown that PAL-knockdown plants in the model grass Brachypodium distachyon have exhibited delayed development, reduced root growth as well as increased susceptibility to diseases [55]. Another marker associated with biomass yield is located on Chr3 in the region related to a gene encoding a U-box domain-containing protein 1. This protein is in the family of ubiquitin ligase (E3) enzymes that are involved in various biological processes and in stress response in plants[56]. Similarly, the SilicoDArT marker associated with plant height is located on Chr8 in the genomic region harboring a gene annotated as a Setaria italica ankyrin-1 protein. This protein family is conserved in plants and involved in biochemical processes in response to biotic and abiotic stresses [57,58,59].
Several markers were found to be associated with feed quality traits. These markers were distributed over the different chromosomes of the Setaria italica genome. Some of the marker trait associations are located in the genomic regions linked to different biophysiological processes in plants. One of the marker trait (CP) associations on Chr2 is close to a gene encoding a E3 ubiquitin-protein ligase RGLG1-like in Setaria viridis. E3 ubiquitin-protein ligase is a family of proteins that catalyse the ubiquitination of protein substrates for targeted degradation[60] and have been known as an important regulator of drought stress response in plants [61]. A SilicoDArT marker associated with TDN (on Chr8) is close to a gene encoding a predicted Setaria italica chlorophyll a-b binding protein CP26, chloroplastic. This protein is conserved in plants and green algae and plays a key role in absorbing and transferring sunlight energy into chemical energy [62]. Both E3 ubiquitin-protein ligases and chlorophyll a-b binding proteins are involved in many other biophysiological processes that contribute to plant growth and development.
Among the SNP markers associated with feed quality traits, the marker associated with TDN (on Chr6) is close to genes encoding a tryptophan decarboxylase 1-like and aromatic-L-amino-acid decarboxylase in grass which are involved in many biochemical reactions contributing to the formation of many metabolites involved in biotic and abiotic stress defence in plants [63,64]. A marker associated with CP (on Chr9) is located in the genomic region containing a gene encoding a pentatricopeptide repeat (PPR)-containing protein. PPR proteins are one of the largest nuclear-encoded protein families in higher plants and interact with RNA to affect gene expressions necessary for organelle development [65]. On Chr9, another SNP marker associated with ADF is found in the genomic region harbouring a gene encoding a Detoxification 40-like protein, which is believed to play a role in response to stresses in plants (e.g., detoxification of a heavy metal Cd(2+) in rice) [66]. In general, marker trait associations in genomic regions containing genes linked to important enzymes and proteins were identified. This result could be used as a starting point for a further study to elucidate genomic regions with genes controlling important traits such as drought tolerance, disease resistance and feed quality traits.

5. Conclusions and recommendations

Here we reported the first genome wide association study in buffel grass, an important drought tolerant tropical forage grass. Several markers were found to be associated with biomass yield and feed quality traits. The observed marker trait associations were distributed across the different chromosomes with the largest number of markers located on Chr9 while the lowest number of markers were located on Chr4. In terms of traits, the largest number of markers was associated with TDN followed by CP and biomass yield. Some of the markers were associated with multiple traits: eight markers were associated with CP and TDN; two markers with ADF and TDN; two markers with CP, TDN and DMI; two markers with NDF and DMI; one marker with ADF, TDN and DMI; one marker with NDF, TDN and DMI and one marker with biomass yield and TDN. Some of the associated markers are located in the genomic regions containing genes related to key biochemical processes that affect yield, stress responses and feed quality traits in plants. In general, the identified marker trait associations will be a useful genomic resource for buffel grass genomic studies and will have a significant implication on future buffel grass improvement programs.
One of the challenges in the genomic studies of tropical forages such as buffel grass is the lack of a reference genome. In this study, we used the reference genome of Setaria italica, a model grass species, to map the generated buffel grass DArTSeq markers which enabled us to map only a small percentage of the generated markers. On several occasions, developing and using the species-specific reference genome have increased the efficiency of mappable markers. Similarly, we believe that developing the buffel grass reference genome would be of paramount importance to the genomic studies and improvement of this important forage grass. Hence, we recommend the following as future lines of research in buffel grass:
  • Developing a reference genome that can be used for marker mapping and genome wide association studies to identify major QTL for traits of interest with improved association accuracy.
  • Buffel grass has different ploidy levels. Hence, determining the ploidy level, coupled with identification of sexually reproducing lines, will facilitate a breeding program for developing new improved varieties of this economically important forage species.
  • Buffel grass is a drought tolerant grass species. Being an underutilized crop, little is known about the genetic basis of its drought tolerance trait. Hence, it is important to study the genetic and physiological basis of drought tolerance and other important traits to develop a climate resilient variety.
  • The results of this study can also be used as a basis to develop a set of markers for future marker assisted selection and breeding.

Supplementary Materials

The following supporting information can be downloaded at the website of this paper posted on Preprints.org. Supplementary Figure S1. Correlation coefficient among agronomic and quality traits in the buffel grass collection. Supplementary Figure S2. Clustering of accessions based on phenotypic and feed quality traits using (A) 2015, (B) 2016 and (C) combined growing seasons data. Supplementary Figure S3. Histogram showing data distribution for the different traits. Supplementary Figure S4. SilicoDArT markers associated with biomass yield and plant height in 2015 (A) and 2016 (B) growing seasons. Supplementary Figure S5. SNP markers associated with biomass yield in 2016 growing season. Supplementary Figure S6. SilicoDArT markers associated with feed quality traits in buffel grass. Supplementary Figure S7. SNP markers associated with feed quality traits detected using different models in buffel grass. Supplementary Table S1. Passport data of Buffelgrass accessions used in the study. Supplementary Table S2. Mean performance of the accessions for the two growing seasons (2015 and 2016). Supplementary Table S3. Mean performance of the accessions for during 2015 and 2016 growing seasons. Supplementary Table S4. Mean performance of the genetic clusters identified based on DArTSeq markers. Supplementary Table S5. Number of markers mapped per each chromosome. Supplementary Table S6. Sequence and chromosome position of SilicoDArT markers associated with biomass yield (YLD) and plant height (PH) using different models during the 2015 and 2016 growing seasons. Supplementary Table S7. Summary of SNP markers associated with biomass yield in 2016 growing season. Supplementary Table S8. SilicoDArT markers associated with feed quality using the 2015 and 2016 growing seasons data. Supplementary Table S9. List of SNP markers associated with feed quality traits using the combined data from 2015 and 2016 growing seasons. Supplementary Table S10. SNP markers associated with feed quality traits in 2016 growing season. Supplementary Table S11. Monthly temperature and precipitation data for 2014 to 2016.

Author Contributions

Conceptualization, C.S.J; methodology, A.T.N; formal analysis, A.T.N and E.H.; investigation, A.T.N. and R.A.S.G; resources, C.S.J.; data curation, A.T.N and R.A.S.G; writing—A.T.N; writing—review and editing, A.T.N, M.S.M, R.A.S.G, E.H., A.M and C.S.J; visualization, A.T.N; supervision, M.S.M and C.S.J; funding acquisition, C.S.J and A.M. All authors have read and agreed to the published version of the manuscript.

Funding

This research was conducted as part of the CGIAR Initiatives Genebanks and Sustainable Animal Productivity (SAPLING) which are supported by contributors to the CGIAR Trust Fund. CGIAR is a global research partnership for a food-secure future dedicated to transforming food, land, and water systems in a climate crisis.

Institutional Review Board Statement

Not applicable.

Informed Consent Statement

Not applicable.

Data Availability Statement

All data generated in this study are freely available as international public goods.

Acknowledgments

The authors acknowledge the support of contributors to the CGIAR Trust Fund.

Conflicts of Interest

The authors declare no conflict of interest. The funders had no role in the design of the study; in the collection, analyses, or interpretation of data; in the writing of the manuscript; or in the decision to publish the results.

References

  1. Herrero, M.; Grace, D.; Njuki, J.; Johnson, N.; Enahoro, D.; Silvestri, S.; Rufino, M.C. The roles of livestock in developing countries. Animal 2013, 7, 3–18. [Google Scholar] [CrossRef] [PubMed]
  2. Moyo, S.; Swanepoel, F. Multifunctionality of livestock in developing communities. The role of livestock in developing communities: Enhancing multifunctionality 2010, 3, 69. [Google Scholar]
  3. Stroebel, A.; Swanepoel, F.; Pell, A. Sustainable smallholder livestock systems: A case study of Limpopo Province, South Africa. Livestock Science 2011, 139, 186–190. [Google Scholar] [CrossRef]
  4. Mekuriaw, Z.; Harris-Coble, L. Ethiopia’s livestock systems: Overview and areas of inquiry; Feed the Future Innovation Lab for Livestock Systems: Gainesville, FL, USA, 2021. [Google Scholar]
  5. Qaim, M. Role of new plant breeding technologies for food security and sustainable agricultural development. Applied Economic Perspectives and Policy 2020, 42, 129–150. [Google Scholar] [CrossRef]
  6. Nerkar, G.; Devarumath, S.; Purankar, M.; Kumar, A.; Valarmathi, R.; Devarumath, R.; Appunu, C. Advances in crop breeding through precision genome editing. Frontiers in Genetics 2022, 13, 880195. [Google Scholar] [CrossRef] [PubMed]
  7. Muktar, M.S.; Habte, E.; Teshome, A.; Assefa, Y.; Negawo, A.T.; Lee, K.W.; Zhang, J.Y.; Jones, C.S. Insights Into the Genetic Architecture of Complex Traits in Napier Grass (Cenchrus purpureus) and QTL Regions Governing Forage Biomass Yield, Water Use Efficiency and Feed Quality Traits. Frontiers in Plant Science 2022, 12. [Google Scholar] [CrossRef] [PubMed]
  8. Muktar, M.S.; Teshome, A.; Hanson, J.; Negawo, A.T.; Habte, E.; Entfellner, J.-B.D.; Lee, K.-W.; Jones, C.S. Genotyping by sequencing provides new insights into the diversity of Napier grass (Cenchrus purpureus) and reveals variation in genome-wide LD patterns between collections. Sci Rep-Uk 2019, 9, 6936. [Google Scholar] [CrossRef]
  9. Negawo, A.T.; Assefa, Y.; Hanson, J.; Abdena, A.; Muktar, M.S.; Habte, E.; Sartie, A.M.; Jones, C.S. Genotyping-By-Sequencing Reveals Population Structure and Genetic Diversity of a Buffelgrass (Cenchrus ciliaris L.) Collection. Diversity-Basel 2020, 12. [Google Scholar] [CrossRef]
  10. Negawo, A.T.; Muktar, M.S.; Assefa, Y.; Hanson, J.; Sartie, A.M.; Habte, E.; Jones, C.S. Genetic diversity and population structure of a Rhodes grass (Chloris gayana) collection. Genes 2021, 12, 1233. [Google Scholar] [CrossRef] [PubMed]
  11. Negawo, A.T.; Akinmade, H.O.; Muktar, M.S.; Habte, E.; Assefa, Y.; Muchugi, A.; Sartie, A.M.; Jones, C.S. Genetic Diversity, Population Structure and Subset Development in a Sesbania sesban Collection. Plants 2022, 12, 13. [Google Scholar] [CrossRef]
  12. Muktar, M.S.; Sartie, A.; Neawo, A.T.; Habte, E.; Jones, C.S. In Genetic diversity among and within accessions of a lablab (Lablab purpureus) collection maintained in the ILRI forage genebank, The XXIV International Grassland Congress / XI International Rangeland Congress, 2021; Kenya Agricultural and Livestock Research Organization.
  13. Higgins, J.; Tomaszewska, P.; Pellny, T.K.; Castiblanco, V.; Arango, J.; Tohme, J.; Schwarzacher, T.; Mitchell, R.A.; Heslop-Harrison, J.; De Vega, J.J. Diverged subpopulations in tropical Urochloa (Brachiaria) forage species indicate a role for facultative apomixis and varying ploidy in their population structure and evolution. Annals of Botany 2022, 130, 657–669. [Google Scholar] [CrossRef] [PubMed]
  14. Sserumaga, J.P.; Kayondo, S.I.; Kigozi, A.; Kiggundu, M.; Namazzi, C.; Walusimbi, K.; Bugeza, J.; Molly, A.; Mugerwa, S. Genome-wide diversity and structure variation among lablab [Lablab purpureus (L.) Sweet] accessions and their implication in a Forage breeding program. Genetic Resources and Crop Evolution 2021, 68, 2997–3010. [Google Scholar] [CrossRef] [PubMed]
  15. Deo, T.G.; Ferreira, R.C.; Lara, L.A.; Moraes, A.C.; Alves-Pereira, A.; De Oliveira, F.A.; Garcia, A.A.; Santos, M.F.; Jank, L.; de Souza, A.P. High-resolution linkage map with allele dosage allows the identification of regions governing complex traits and apospory in guinea grass (Megathyrsus maximus). Frontiers in plant science 2020, 11, 15. [Google Scholar] [CrossRef]
  16. Carballo, J.; Santos, B.; Zappacosta, D.; Garbus, I.; Selva, J.P.; Gallo, C.A.; Díaz, A.; Albertini, E.; Caccamo, M.; Echenique, V. A high-quality genome of Eragrostis curvula grass provides insights into Poaceae evolution and supports new strategies to enhance forage quality. Sci Rep-Uk 2019, 9, 1–15. [Google Scholar] [CrossRef] [PubMed]
  17. Njaci, I.; Waweru, B.; Kamal, N.; Muktar, M.S.; Fisher, D.; Gundlach, H.; Muli, C.; Muthui, L.; Maranga, M.; Kiambi, D.; Maass, B.L.; Emmrich, P.M.; Entfellner, J.-B.D.; Spannagl, M.; Chapman, M.A.; Shorinola, O.; Jones, C.S. Chromosome-scale assembly of the lablab genome - A model for inclusive orphan crop genomics. bioRxiv 2005. [Google Scholar] [CrossRef]
  18. Pessoa Filho, M.d.P.; Sousa Sobrinho, F.d.; Fragoso, R.d.R.; da Silva Junior, O.; Ferreira, M. In A draft genome assembly for the forage grass Urochloa ruziziensis based on single-molecule real-time sequencing, 2018; In: BRAZILIAN BIOTECHNOLOGY CONGRESS, 7.; BIOTECHNOLOGY IBERO-AMERICAN …. 2018. [Google Scholar]
  19. Worthington, M.; Perez, J.G.; Mussurova, S.; Silva-Cordoba, A.; Castiblanco, V.; Cardoso Arango, J.A.; Jones, C.; Fernandez-Fuentes, N.; Skot, L.; Dyer, S.; Tohme, J.; Di Palma, F.; Arango, J.; Armstead, I.; De Vega, J.J. A new genome allows the identification of genes associated with natural variation in aluminium tolerance in Brachiaria grasses. Journal of Experimental Botany 2020, 72, 302–319. [Google Scholar] [CrossRef] [PubMed]
  20. Yan, Q.; Wu, F.; Xu, P.; Sun, Z.Y.; Li, J.; Gao, L.J.; Lu, L.Y.; Chen, D.D.; Muktar, M.; Jones, C.; Yi, X.F.; Zhang, J.Y. The elephant grass (Cenchrus purpureus) genome provides insights into anthocyanidin accumulation and fast growth. Mol Ecol Resour 2021, 21, 526–542. [Google Scholar] [CrossRef] [PubMed]
  21. Zhang, S.; Xia, Z.; Li, C.; Wang, X.; Lu, X.; Zhang, W.; Ma, H.; Zhou, X.; Zhang, W.; Zhu, T. Chromosome-scale genome assembly provides insights into speciation of allotetraploid and massive biomass accumulation of elephant grass (Pennisetum purpureum Schum.). Mol Ecol Resour 2022, 22, 2363–2378. [Google Scholar] [CrossRef]
  22. Zheng, H.; Wang, B.; Hua, X.; Gao, R.; Wang, Y.; Zhang, Z.; Zhang, Y.; Mei, J.; Huang, Y.; Huang, Y. A near-complete genome assembly of the allotetrapolyploid Cenchrus fungigraminus (JUJUNCAO) provides insights into its evolution and C4 photosynthesis. Plant Communications 2023. [Google Scholar] [CrossRef] [PubMed]
  23. Marks, R.A.; Hotaling, S.; Frandsen, P.B.; VanBuren, R. Representation and participation across 20 years of plant genome sequencing. Nature plants 2021, 7, 1571–1578. [Google Scholar] [CrossRef] [PubMed]
  24. Marshall, V.M.; Lewis, M.M.; Ostendorf, B. Buffelgrass (Cenchrus ciliaris) as an invader and threat to biodiversity in arid environments: A review. Journal of Arid Environments 2012, 78, 1–12. [Google Scholar] [CrossRef]
  25. Cook, B.; Pengelly, B.; Schultze-Kraft, R.; Taylor, M.; Burkart, S.; Cardoso Arango, J.; González Guzmán, J.; Cox, K.; Jones, C.; Peters, M. Tropical Forages: An interactive selection tool. 2nd and Revised Edn. International Center for Tropical Agriculture (CIAT), Cali, Colombia and International Livestock Research Institute (ILRI), Nairobi, Kenya. www. tropicalforages. info 2020.
  26. Kharrat-Souissi, A.; Siljak-Yakovlev, S.; Brown, S.C.; Baumel, A.; Torre, F.; Chaieb, M. The polyploid nature of Cenchrus ciliaris L. (Poaceae) has been overlooked: new insights for the conservation and invasion biology of this species - a review. Rangeland J 2014, 36, 11–23. [Google Scholar] [CrossRef]
  27. Kharrat-Souissi, A.; Siljak-Yakovlev, S.; Brown, S.C.; Chaieb, M. Cytogeography of Cenchrus ciliaris (Poaceae) in Tunisia. Folia Geobot 2013, 48, 95–113. [Google Scholar] [CrossRef]
  28. Heuzé, V.; Tran, G.; Baumont, R.; Lebas, F. Buffel grass (Cenchrus ciliaris). Feedipedia, a programme by INRA, CIRAD, AFZ and FAO. 2016.
  29. Kisambo, B.K.; Wasonga, O.V.; Koech, O.K.; Karuku, G.N. Morphological and productivity responses of Buffel grass (Cenchrus ciliaris) and Guinea grass (Panicum maximum) ecotypes to simulated grazing in a semi-arid environment. Grassland Research 2022, 1, 290–300. [Google Scholar] [CrossRef]
  30. Alhammad, B.A.; Mohamed, A.; Raza, M.A.; Ngie, M.; Maitra, S.; Seleiman, M.F.; Wasonga, D.; Gitari, H.I. Optimizing productivity of Buffel and Sudan grasses using optimal nitrogen fertilizer application under arid conditions. Agronomy 2023, 13, 2146. [Google Scholar] [CrossRef]
  31. Sanderson, M.; Voigt, P.; Jones, R. Yield and quality of warm-season grasses in central Texas. Rangeland Ecology & Management/Journal of Range Management Archives 1999, 52, 145–150. [Google Scholar]
  32. Arshadullah, M.; Malik, M.A.; Rasheed, M.; Jilani, G.; Zahoor, F.; Kaleem, S. Seasonal and genotypic variations influence the biomass and nutritional ingredients of Cenchrus ciliaris grass forage. International Journal of Agriculture and Biology 2011, 13. [Google Scholar]
  33. Yigzaw, G.W. Effect of harvesting stage on yield and nutritive value of buffel grass (Cenchrus ciliaris linn) under irrigation at Gewane district, north eastern Ethiopia. J. Sci. Innov. Res 2019, 8, 7–12. [Google Scholar] [CrossRef]
  34. Simeão, R.M.; Resende, M.D.; Alves, R.S.; Pessoa-Filho, M.; Azevedo, A.L.S.; Jones, C.S.; Pereira, J.F.; Machado, J.C. Genomic selection in tropical forage grasses: Current status and future applications. Frontiers in Plant Science 2021, 12, 665195. [Google Scholar] [CrossRef] [PubMed]
  35. Jorge, M.A.B.; Van De Wouw, M.; Hanson, J.; Mohammed, J. Characterisation of a collection of buffel grass (Cenchrus ciliaris). Tropical Grasslands 2008, 42, 27–39. [Google Scholar]
  36. Sánchez Gutiérrez, R.A.; Morales Nieto, C.R.; Hanson, J.; Santellano Estrada, E.; Jurado Guerra, P.; Villanueva Avalos, J.F.; Melgoza Castillo, A. Forage characterization of ecotypes of buffel grass under temporary conditions in Debre Zeit, Ethiopia. Revista Mexicana De Ciencias Agrícolas 2017, 8, 14. [Google Scholar]
  37. Negawo, A.T.; Habte, E.; Muktar, M.S.; Sartie, A.; Jones, C.S. In Molecular characterization of apomixis in Cenchrus ciliaris and its application in genetic resources improvement, Conference on International Research on Food Security, 2021.
  38. Kilian, A.; Wenzl, P.; Huttner, E.; Carling, J.; Xia, L.; Blois, H.; Caig, V.; Heller-Uszynska, K.; Jaccoud, D.; Hopper, C.; Aschenbrenner-Kilian, M.; Evers, M.; Peng, K.; Cayla, C.; Hok, P.; Uszynski, G. Diversity arrays technology: a generic genome profiling technology on open platforms. Methods in molecular biology 2012, 888, 67–89. [Google Scholar] [PubMed]
  39. Bennetzen, J.L.; Schmutz, J.; Wang, H.; Percifield, R.; Hawkins, J.; Pontaroli, A.C.; Estep, M.; Feng, L.; Vaughn, J.N.; Grimwood, J.; Jenkins, J.; Barry, K.; Lindquist, E.; Hellsten, U.; Deshpande, S.; Wang, X.W.; Wu, X.M.; Mitros, T.; Triplett, J.; Yang, X.H.; Ye, C.Y.; Mauro-Herrera, M.; Wang, L.; Li, P.H.; Sharma, M.; Sharma, R.; Ronald, P.C.; Panaud, O.; Kellogg, E.A.; Brutnell, T.P.; Doust, A.N.; Tuskan, G.A.; Rokhsar, D.; Devos, K.M. Reference genome sequence of the model plant Setaria. Nat Biotechnol 2012, 30, 555. [Google Scholar] [CrossRef] [PubMed]
  40. Habte, E.; Muktar, M.S.; Abdena, A.; Hanson, J.; Sartie, A.M.; Negawo, A.T.; Machado, J.C.; Ledo, F.J.d.S.; Jones, C.S. Forage performance and detection of marker trait associations with potential for Napier grass (Cenchrus purpureus) improvement. Agronomy 2020, 10, 542. [Google Scholar] [CrossRef]
  41. Endecott, R.L.; Mathis, C.P. Ration Balancing on the Ranch. New Mexico State University, Cooperative Extension Service. 2006.
  42. Juergen, G.; Uwe, L. nortest: Tests for Normality. R package version 1.0-4. 2015.
  43. Burton, G.W.; Devane, d.E. Estimating heritability in tall fescue (Festuca arundinacea) from replicated clonal material 1. Agronomy journal 1953, 45, 478–481. [Google Scholar] [CrossRef]
  44. Team, R.C. R: A language and environment for statistical computing; R Foundation for Statistical Computing: Vienna, Austria, URL https://www.R-project.org/. 2022.
  45. Liu, X.L.; Huang, M.; Fan, B.; Buckler, E.S.; Zhang, Z.W. Iterative Usage of Fixed and Random Effect Models for Powerful and Efficient Genome-Wide Association Studies. Plos Genet 2016, 12. [Google Scholar] [CrossRef] [PubMed]
  46. Huang, M.; Liu, X.L.; Zhou, Y.; Summers, R.M.; Zhang, Z.W. BLINK: a package for the next level of genome-wide association studies with both individuals and markers in the millions. Gigascience 2019, 8. [Google Scholar] [CrossRef]
  47. Price, A.L.; Patterson, N.J.; Plenge, R.M.; Weinblatt, M.E.; Shadick, N.A.; Reich, D. Principal components analysis corrects for stratification in genome-wide association studies. Nat Genet 2006, 38, 904–909. [Google Scholar] [CrossRef] [PubMed]
  48. Wang, J.B.; Zhang, Z.W. GAPIT Version 3: Boosting Power and Accuracy for Genomic Association and Prediction. Genom Proteom Bioinf 2021, 19, 629–640. [Google Scholar] [CrossRef] [PubMed]
  49. Ouellette, L.A.; Reid, R.W.; Blanchard, S.G.; Brouwer, C.R. LinkageMapView—rendering high-resolution linkage and QTL maps. Bioinformatics 2018, 34, 306–307. [Google Scholar] [CrossRef] [PubMed]
  50. Hanselka, C.W. Forage quality of common buffelgrass as influenced by prescribed fire. Texas Journal of Agriculture and Natural Resources 1989, 3, 15–18. [Google Scholar]
  51. Sánchez-Gutiérrez, R.A.; Hanson, J.; Jones, C.; Jurado-Guerra, P.; Santellano-Estrada, E.; Melgoza-Castillo, A.; Morales-Nieto, C. Caracterización morfológica de genotipos de pasto Buffel con potencial para producción de forraje y semilla. Rev Fitotec Mex 2020, 43, 343–343. [Google Scholar] [CrossRef]
  52. Tyagi, V.C.; Singh, T.; Dikshit, N.; Singh, S.; Rana, M.; Kaldate, R.; Govindaswamy, P.; Halli, H.M.; Ghosh, A.; Singhal, R.K. Genetic and Genomic Resources of Range Grasses: Status and Future Prospects. Molecular Interventions for Developing Climate-Smart Crops: A Forage Perspective 2023, 3–34. [Google Scholar]
  53. Gurikar, C.; Gowda, N.N.; Hanumantharaju, K.; Netravati, B. Role of Bacillus species in soil fertility with reference to rhizosphere engineering. In Rhizosphere Engineering; Elsevier, 2022; pp. 65–76. [Google Scholar]
  54. Shine, M.; Yang, J.W.; El-Habbak, M.; Nagyabhyru, P.; Fu, D.Q.; Navarre, D.; Ghabrial, S.; Kachroo, P.; Kachroo, A. Cooperative functioning between phenylalanine ammonia lyase and isochorismate synthase activities contributes to salicylic acid biosynthesis in soybean. New Phytologist 2016, 212, 627–636. [Google Scholar] [CrossRef]
  55. Cass, C.L.; Peraldi, A.; Dowd, P.F.; Mottiar, Y.; Santoro, N.; Karlen, S.D.; Bukhman, Y.V.; Foster, C.E.; Thrower, N.; Bruno, L.C. Effects of PHENYLALANINE AMMONIA LYASE (PAL) knockdown on cell wall composition, biomass digestibility, and biotic and abiotic stress responses in Brachypodium. Journal of Experimental Botany 2015, 66, 4317–4335. [Google Scholar] [CrossRef] [PubMed]
  56. Wang, C.; Song, B.; Dai, Y.; Zhang, S.; Huang, X. Genome-wide identification and functional analysis of U-box E3 ubiquitin ligases gene family related to drought stress response in Chinese white pear (Pyrus bretschneideri). BMC Plant Biology 2021, 21, 235. [Google Scholar] [CrossRef] [PubMed]
  57. Zhao, J.-Y.; Lu, Z.-W.; Sun, Y.; Fang, Z.-W.; Chen, J.; Zhou, Y.-B.; Chen, M.; Ma, Y.-Z.; Xu, Z.-S.; Min, D.-H. The ankyrin-repeat gene GmANK114 confers drought and salt tolerance in Arabidopsis and soybean. Frontiers in Plant Science 2020, 11, 584167. [Google Scholar] [CrossRef] [PubMed]
  58. Lopez-Ortiz, C.; Peña-Garcia, Y.; Natarajan, P.; Bhandari, M.; Abburi, V.; Dutta, S.K.; Yadav, L.; Stommel, J.; Nimmakayala, P.; Reddy, U.K. The ankyrin repeat gene family in Capsicum spp: Genome-wide survey, characterization and gene expression profile. Sci Rep-Uk 2020, 10, 4044. [Google Scholar] [CrossRef] [PubMed]
  59. Kolodziej, M.C.; Singla, J.; Sánchez-Martín, J.; Zbinden, H.; Šimková, H.; Karafiátová, M.; Doležel, J.; Gronnier, J.; Poretti, M.; Glauser, G. A membrane-bound ankyrin repeat protein confers race-specific leaf rust disease resistance in wheat. Nature communications 2021, 12, 956. [Google Scholar] [CrossRef] [PubMed]
  60. Yang, Q.; Zhao, J.; Chen, D.; Wang, Y. E3 ubiquitin ligases: styles, structures and functions. Molecular Biomedicine 2021, 2, 1–17. [Google Scholar] [CrossRef] [PubMed]
  61. Al-Saharin, R.; Hellmann, H.; Mooney, S. Plant E3 Ligases and Their Role in Abiotic Stress Response. Cells-Basel 2022, 11. [Google Scholar] [CrossRef]
  62. van Amerongen, H.; van Bolhuis, B.M.; Betts, S.; Mei, R.; van Grondelle, R.; Yocum, C.F.; Dekker, J.P. Spectroscopic characterization of CP26, a chlorophyll ab binding protein of the higher plant Photosystem II complex. Biochimica et Biophysica Acta (BBA)-Bioenergetics 1994, 1188, 227–234. [Google Scholar] [CrossRef]
  63. Huang, Q.; Li, L.; Zheng, M.; Chen, F.; Long, H.; Deng, G.; Pan, Z.; Liang, J.; Li, Q.; Yu, M. The tryptophan decarboxylase 1 gene from Aegilops variabilis No. 1 regulate the resistance against cereal cyst nematode by altering the downstream secondary metabolite contents rather than auxin synthesis. Frontiers in Plant Science 2018, 9, 1297. [Google Scholar] [CrossRef] [PubMed]
  64. Facchini, P.J.; Huber-Allanach, K.L.; Tari, L.W. Plant aromatic L-amino acid decarboxylases: evolution, biochemistry, regulation, and metabolic engineering applications. Phytochemistry 2000, 54, 121–138. [Google Scholar] [CrossRef] [PubMed]
  65. Wang, X.; An, Y.; Xu, P.; Xiao, J. Functioning of PPR proteins in organelle RNA metabolism and chloroplast biogenesis. Frontiers in plant science 2021, 12, 627501. [Google Scholar] [CrossRef] [PubMed]
  66. Li, L.; He, Z.; Pandey, G.K.; Tsuchiya, T.; Luan, S. Functional cloning and characterization of a plant efflux carrier for multidrug and heavy metal detoxification. Journal of Biological Chemistry 2002, 277, 5360–5368. [Google Scholar] [CrossRef]
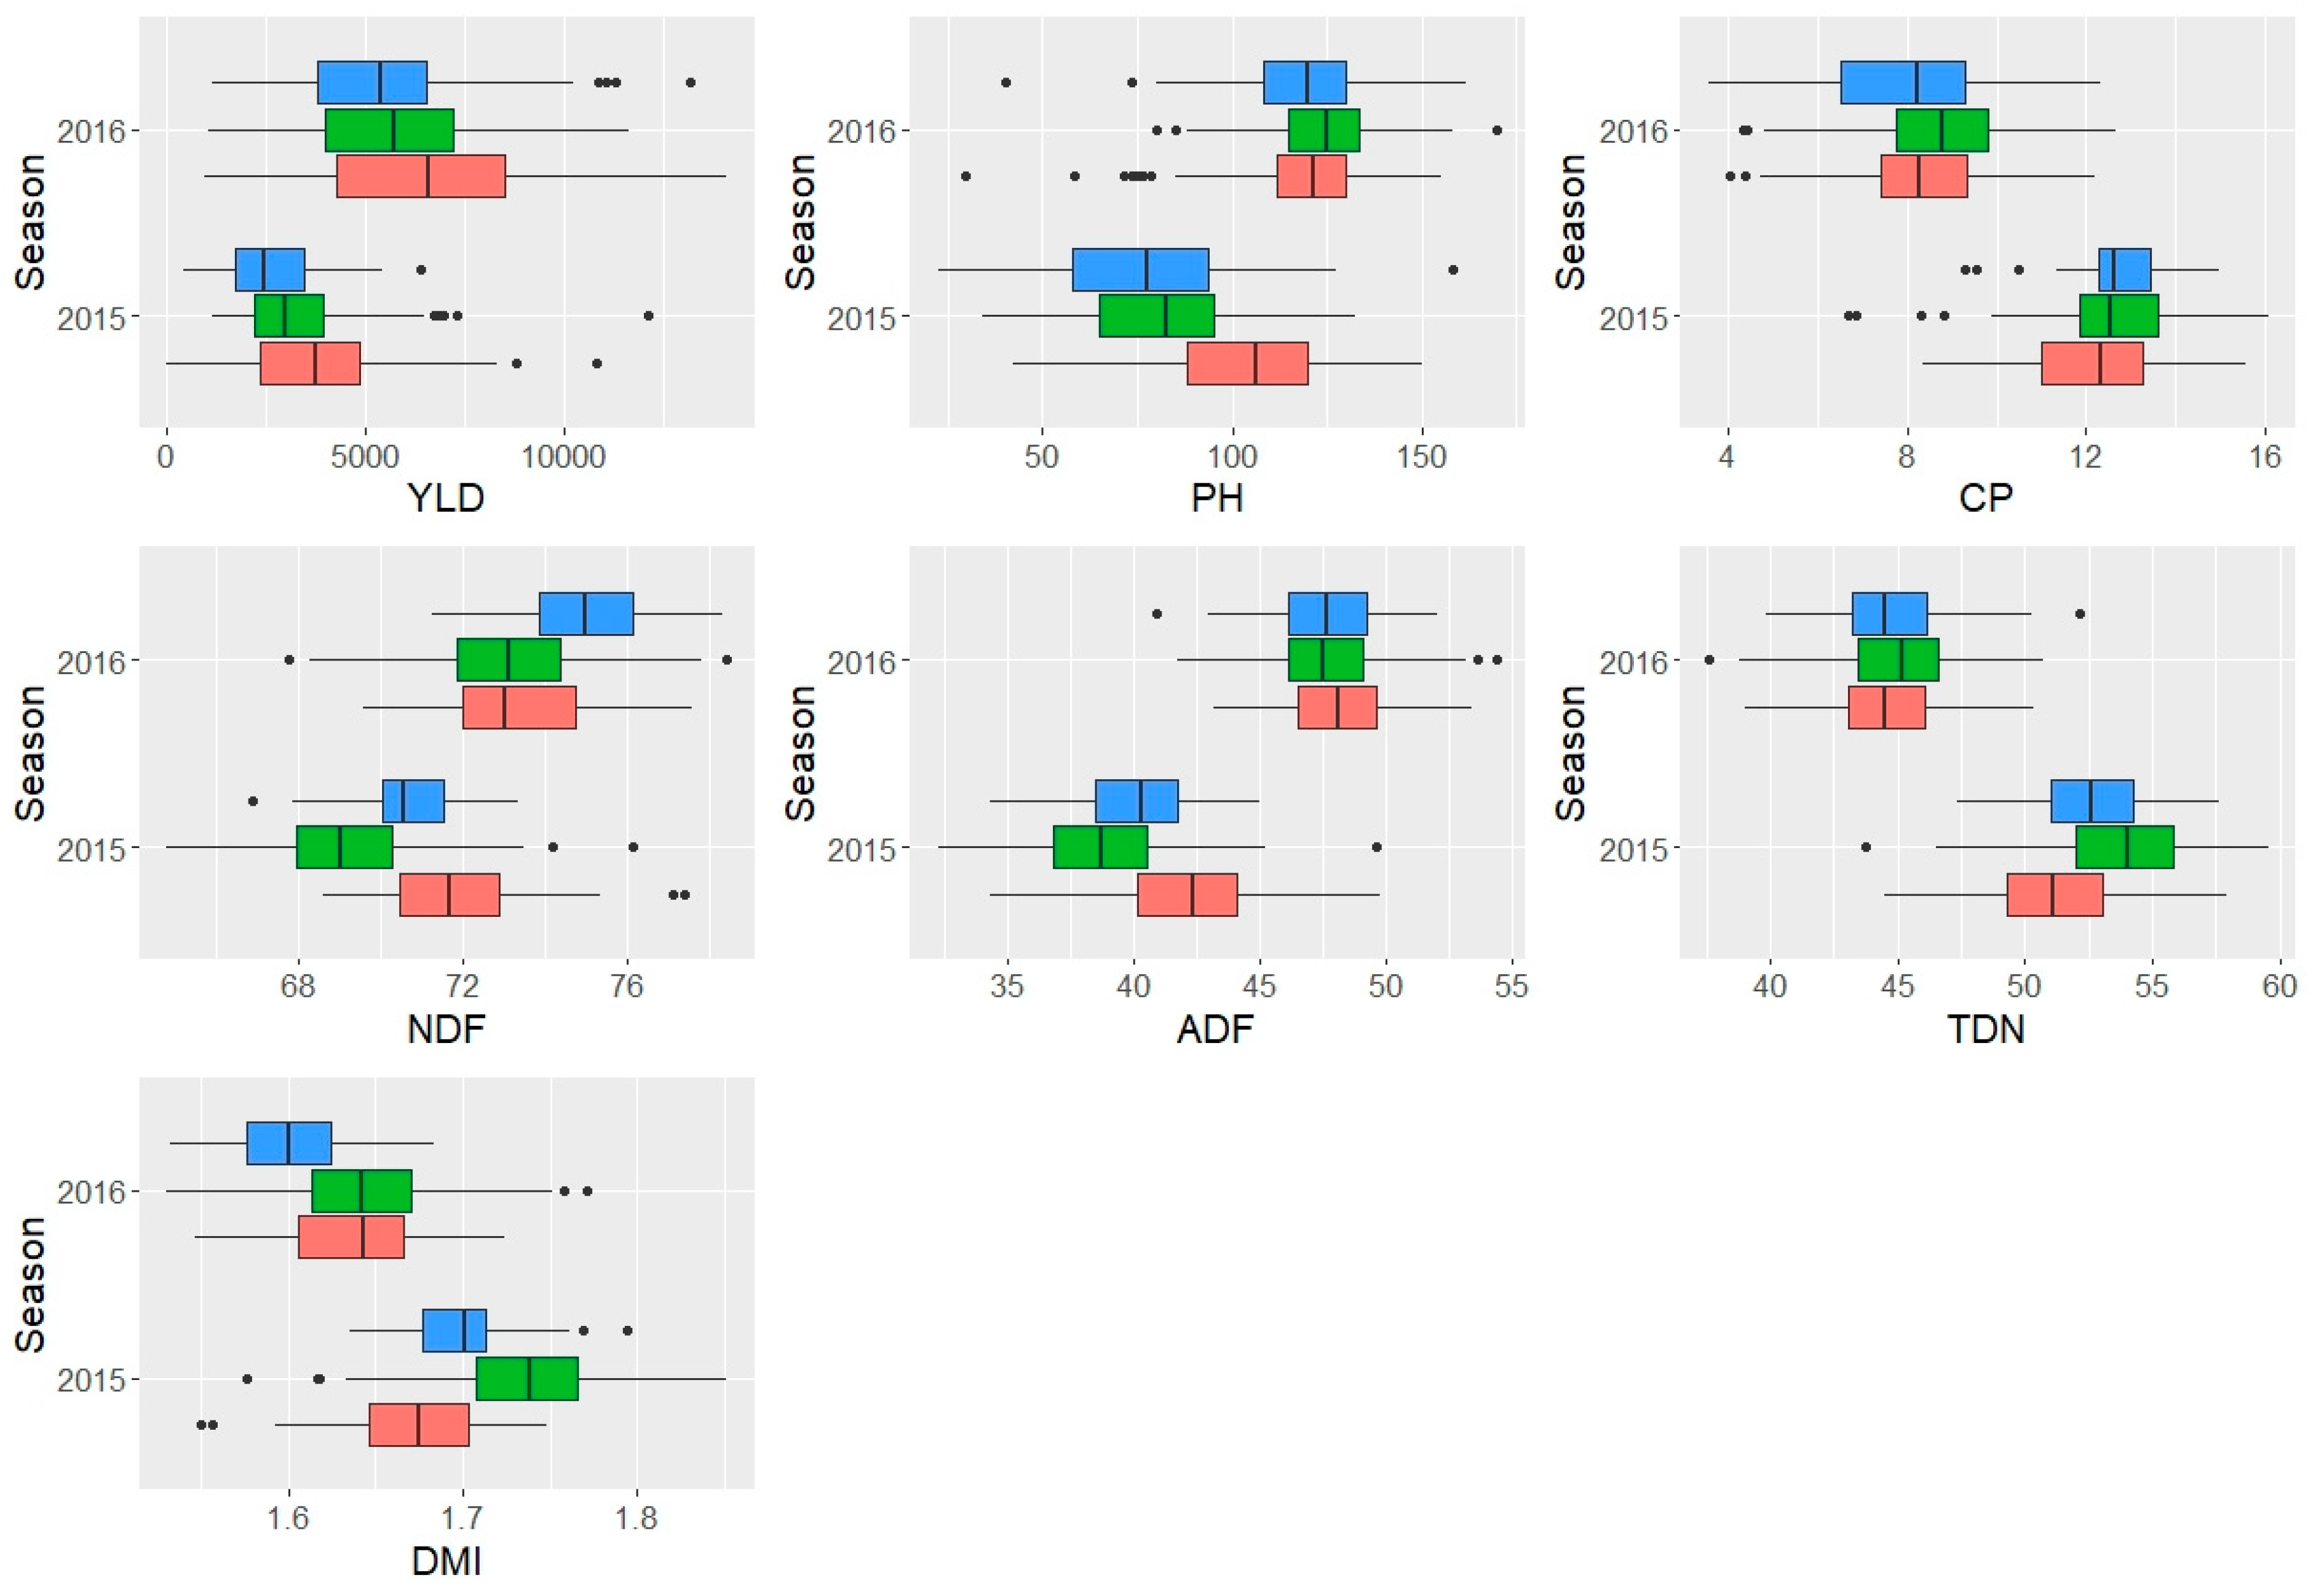
Figure 1. Boxplot visualization showing the distribution and outliers of the data for biomass yield (YLD, kg/ha/annum), plant height (PH, cm), and feed quality traits by growing seasons. The red, green and blue boxes are for replications 1, 2 and 3, respectively. CP=Crude protein, NDF= Neutral Detergent Fibre, ADF= Acid Detergent Fibre, TDN= total digestible nutrients, and DMI= dry matter intake.
Preprints 93823 g001
Figure 2. Performance of the clusters reported using DArTSeq markers [9]. The clusters are indicated on the x-axis while the different traits are indicated on the y-axis. YLD=Biomass yield, PH=Plant height, CP=Crude protein, NDF= Neutral Detergent Fibre, ADF= Acid Detergent Fibre, TDN= total digestible nutrients, and DMI= Dry matter intake.
Preprints 93823 g002
Figure 3. Chromosome wide distribution and density of DArTSeq markers on the Setaria italica genome: A) SNP markers and B) SilicoDArT markers.
Preprints 93823 g003
Figure 4. SilicoDArT markers associated with biomass yield using the combined data from 2015 and 2016 growing seasons. On the Manhattan plots, the x-axis is the code of the chromosomes, and the y-axis is the negative log base 10 of the p-values. The green horizontal line indicates the significance level. QQ plot: the y-axis is the observed negative base 10 logarithm of the p-values, and the x-axis is the expected observed negative base 10 logarithm of the p-values.
Preprints 93823 g004
Figure 5. SNP markers associated with biomass yield using the combined data from 2015 and 2016 growing seasons. On the Manhattan plots, the x-axis is the code of the chromosomes, and the y-axis is the negative log base 10 of the p-values. The green horizontal line indicates the significance level. QQ plot: the y-axis is the observed negative base 10 logarithm of the p-values, and the x-axis is the expected observed negative base 10 logarithm of the p-values.
Preprints 93823 g005
Figure 6. SilicoDArT markers associated with feed quality traits using the combined data from 2015 and 2016 growing seasons. On the Manhattan plots, the x-axis is the code of the chromosomes, and the y-axis is the negative log base 10 of the p-values. The green horizontal line indicates the significance level. QQ plot: the y-axis is the observed negative base 10 logarithm of the p-values, and the x-axis is the expected observed negative base 10 logarithm of the p-values.
Preprints 93823 g006
Figure 7. SNP markers associated with feed quality traits using the combined data from 2015 and 2016 growing seasons. On the Manhattan plots, the x-axis is the code of the chromosomes, and the y-axis is the negative log base 10 of the p-values. The green horizontal line indicates the significance level. QQ plot: the y-axis is the observed negative base 10 logarithm of the p-values, and the x-axis is the expected observed negative base 10 logarithm of the p-values.
Preprints 93823 g007
Figure 8. Genomic map position of the marker trait associations. The labels on the right of the linkage groups indicate the marker code, followed by the growing season of the data used for GWAS (2015, 2016 or combined) and the traits (Yld= Biomass Yield, Ph=Plant height, CP=Crude Protein, NDF=Neutral Detergent Fibre, ADF=Acid Detergent Fibre, TDN=Total Digestible Nutrients, DMI=Dry Matter Intake). The number on the left of the linkage groups indicates the physical genomic position of the markers in base pairs. * Indicates markers associated with two traits and ** indicates markers associated with three traits.
Preprints 93823 g008
Table 1. ANOVA summary for agronomic and feed quality traits from 126 Buffel grass accessions in 2015 and 2016 growing at Bishoftu, Ethiopia.
Traits /Sources of variation YLD PH NDF ADF CP TND DMI
Genotype <.001 <.001 <.001 <.001 <.001 <.001 <.001
Replication <.001 <.001 <.001 <.001 <.001 <.001 <.001
Season <.001 <.001 <.001 <.001 <.001 <.001 <.001
Genotype: Season NS NS NS 0.001 NS NS NS
CV% 34.9 17.9 2.3 4.7 13.4 4.1 2.3
R-square % 73 73 77 88 85 89 78
Coefficient of variation (CV), Yield=Biomass yield, PH=Plant height, CP=Crude protein, NDF= Neutral Detergent Fibre, ADF= Acid Detergent Fibre, TDN= total digestible nutrients, and DMI= dry matter intake and NS= non-significant.
Table 2. Variations and heritability for biomass yield, plant height and feed quality traits of 126 Buffel grass accessions for 2015 and 2016 growing seasons at Bishoftu Ethiopia.
Traits/statistics Minimum Maximum Mean PCV GCV H2 (%)
YLD (Kg/ha) 1609.65 9097.54 4562.22 28.1 28.1 99.9
PH (cm) 71.50 135.22 103.31 13.9 9.9 70.9
CP (%) 6.11 12.21 10.02 32.8 8.9 27.0
NDF (%) 69.98 75.68 72.37 11.8 1.2 10.2
ADF (%) 40.40 48.69 44.62 15.2 2.8 18.5
TND (%) 43.10 51.73 48.03 14.7 2.9 19.7
DMI (%) 1.59 1.72 1.66 77.6 1.2 1.6
Yield=Biomass yield, PH=Plant height, CP=Crude protein, NDF= Neutral Detergent Fibre, ADF= Acid Detergent Fibre, TDN= total digestible nutrients, and DMI= dry matter intake, GCV=genotypic coefficient of variation; PCV= Phenotypic coefficient of variation, and H2 =Heritability in broad sense.
Table 3. List of SilicoDArT markers associated with biomass yield using the combined data from 2015 and 2016 growing seasons.
No. Model Marker ID Marker sequence RefSeq sequence Chr pos P.value maf R2.without.SNP R2.with.SNP R2* FDR_Adjusted_P-values Effect
1 GLM 30838261 TGCAGGTTTGAGGCTTGTCAGTGTGCTCGTCCCCTTGTGCCGACCTTTCCCAGGCGTCCCTGTCCGAGA NC_028450.1 1 32744739 4.60E-06 0.0789 0.296 0.445 0.149 0.0059 2009.3639
2 FarmCPU 30921428 TGCAGCAAATACTTACCAGAGCACAGGTTGCCAGAAAATATTGTTGCAACAACAAGTGCTGCTGATGCT NC_028451.1 2 8049803 1.65E-06 0.0965 NA NA NA 0.0054 -969.2590
3 GLM 30912865 TGCAGAGAGTTGCAAAACGTATCGAAACAAATGTTGGAGACTTGCCGTGGGGTGAGGTGAAGACGGACT NC_028451.1 2 30749442 2.45E-06 0.0965 0.296 0.455 0.158 0.0053 1608.4054
4 GLM 30829864 TGCAGGCCGATCACGCTGTACGCCATGTGACCCAGCCGCGACGCCACCTGCACCGCGAACCGCAAAATG NC_028452.1 3 3213526 6.32E-06 0.1184 0.296 0.441 0.144 0.0059 -1985.8887
5 GLM 30944290 TGCAGCTGCTCCACTGTTTTCGCACTGCTGAACTGTTCTTCTCTAACTGAAGAATATTTGTGGGCAACC NC_028453.1 4 7437264 6.10E-07 0.0746 0.296 0.476 0.180 0.0029 1779.3729
6 Blink 30944290 TGCAGCTGCTCCACTGTTTTCGCACTGCTGAACTGTTCTTCTCTAACTGAAGAATATTTGTGGGCAACC NC_028453.1 4 7437264 3.27E-08 0.0746 NA NA NA 0.0001 NA
7 GLM 30846885 TGCAGAGAGAGGGAGAGAGAGGCTATCCTACTATGCAACGGTCAAAAGGCTTCAAAGGAGGAGAAATCA NC_028455.1 6 33041360 4.25E-06 0.1053 0.296 0.447 0.150 0.0059 -1877.6778
8 GLM 30838332 TGCAGTCCTAAACACCAGCACAGCACTCTCCTCTCCTTCCATCCCTAACATACATCATCAGCGATACAG NC_028456.1 7 28411310 8.87E-07 0.0789 0.296 0.470 0.174 0.0029 1764.3647
9 FarmCPU 30838332 TGCAGTCCTAAACACCAGCACAGCACTCTCCTCTCCTTCCATCCCTAACATACATCATCAGCGATACAG NC_028456.1 7 28411310 1.08E-08 0.0789 NA NA NA 0.0001 1528.8742
10 Blink 30838332 TGCAGTCCTAAACACCAGCACAGCACTCTCCTCTCCTTCCATCCCTAACATACATCATCAGCGATACAG NC_028456.1 7 28411310 5.72E-10 0.0789 NA NA NA 0.0000 NA
11 GLM 30846154 TGCAGTCTCCCAATCTCCCGTGGGAGCTCTGTGATTTGATCGCAGTCCTTGAGATCCAGATACCTAAGC NC_028457.1 8 26442566 6.10E-06 0.0877 0.296 0.441 0.145 0.0059 -1463.6930
12 FarmCPU 30846154 TGCAGTCTCCCAATCTCCCGTGGGAGCTCTGTGATTTGATCGCAGTCCTTGAGATCCAGATACCTAAGC NC_028457.1 8 26442566 3.30E-06 0.0877 NA NA NA 0.0072 -853.8910
13 Blink 30846154 TGCAGTCTCCCAATCTCCCGTGGGAGCTCTGTGATTTGATCGCAGTCCTTGAGATCCAGATACCTAAGC NC_028457.1 8 26442566 3.91E-09 0.0877 NA NA NA 0.0000 NA
R2*= R2.with.SNP- R2without.SNP.
Table 4. List of SNP markers associated with biomass yield using the combined data from 2015 and 2016 growing seasons.
No. Model Marker ID Marker sequence Alleles RefSeq sequence Chr pos P.value maf R2without.SNP R2.with.SNP R2* FDR_Adjusted_P-values Effect
1 GLM 30964292-59-G/A TGCAGCTCAGAGCAGTACGACGCCATGGCGATCTCGGCGCCCTTGAACCCGTAGTCCAGGCTCGGGTTG G/A NC_028450.1 1 31786540 7.11E-07 0.179 0.437 0.571 0.314 0.0017 -1149.0389
2 FarmCPU 30935961-51-C/T TGCAGATCTACTAAAATCTAGCCGCGCCAGCAGCGACGCGAACCGCTAAATCCACCCAAACCTAGCACC C/T NC_028454.1 5 3450894 1.12E-06 0.058 NA NA NA 0.0055 992.5899
3 GLM 30882610-38-G/A TGCAGCGTGCGGCAGCAGACCAGATCCGTCGGGTTGAAGTTCACCG G/A NC_028458.1 9 9428069 4.99E-07 0.079 0.437 0.575 0.138 0.0017 1629.3846
R2*= R2.with.SNP- R2without.SNP.
Table 5. List of SilicoDArT markers associated with feed quality traits using combined data from 2015 and 2015 growing seasons.
No. Trait Model Marker ID Marker sequence RefSeq sequence Chr pos P.value maf R2.without.SNP R2.with.SNP R2* FDR_Adjusted_P-values Effect
1 TDN FarmCPU 30930072 TGCAGCTGGCGTCGGCGACGGCGTGCGTCGCGCTGTCGGCGGCGCGGCTCGCCCG NC_028452.1 3 44894692 1.64E-06 0.32 NA NA NA 0.0054 -0.8184
2 ADF Blink 30879386 TGCAGTAGTGGCGGTGGACTACGACGCCTCCCCCTGCGAGCACATCATATCCCAGACGCCTGCTCGACG NC_028454.1 5 1406759 1.64E-10 0.272 NA NA NA 1.07E-06 NA
TDN GLM 30879386 TGCAGTAGTGGCGGTGGACTACGACGCCTCCCCCTGCGAGCACATCATATCCCAGACGCCTGCTCGACG NC_028454.1 5 1406759 5.22E-06 0.272 0.202 0.368 0.167 0.0341 1.4635
TDN Blink 30879386 TGCAGTAGTGGCGGTGGACTACGACGCCTCCCCCTGCGAGCACATCATATCCCAGACGCCTGCTCGACG NC_028454.1 5 1406759 1.74E-10 0.272 NA NA NA 0.0000 NA
ADF GLM 30879386 TGCAGTAGTGGCGGTGGACTACGACGCCTCCCCCTGCGAGCACATCATATCCCAGACGCCTGCTCGACG NC_028454.1 5 1406759 3.65E-06 0.272 0.169 0.349 0.180 0.0238 -1.5094
3 TDN FarmCPU 30841580 TGCAGAACGTTCAGACTTCAAACCACATGCTGCCGTGCGCATCAGCACATGTGCTTGACTTGTGACCTG NC_028454.1 5 6158000 1.47E-06 0.145 NA NA NA 0.0054 -1.1296
4 ADF Blink 30930612 TGCAGCTCCCGCCGTGGCAGCACTCCAGCGCGTCCCAGCCG NC_028456.1 7 25606103 1.06E-06 0.18 NA NA NA 0.0034 NA
TDN Blink 30930612 TGCAGCTCCCGCCGTGGCAGCACTCCAGCGCGTCCCAGCCG NC_028456.1 7 25606103 1.40E-07 0.18 NA NA NA 0.0005 NA
R2*= R2.with.SNP- R2without.SNP.
Disclaimer/Publisher’s Note: The statements, opinions and data contained in all publications are solely those of the individual author(s) and contributor(s) and not of MDPI and/or the editor(s). MDPI and/or the editor(s) disclaim responsibility for any injury to people or property resulting from any ideas, methods, instructions or products referred to in the content.
Copyright: This open access article is published under a Creative Commons CC BY 4.0 license, which permit the free download, distribution, and reuse, provided that the author and preprint are cited in any reuse.
Prerpints.org logo

Preprints.org is a free preprint server supported by MDPI in Basel, Switzerland.

Subscribe

© 2024 MDPI (Basel, Switzerland) unless otherwise stated