Preprint
Article

A Comprehensive Strategy for Stepwise Design of a Lab Prototype for the Removal of Emerging Contaminants in Water Using Cyclodextrin Polymers as Adsorbent Material

Altmetrics

Downloads

109

Views

40

Comments

0

A peer-reviewed article of this preprint also exists.

Submitted:

18 December 2023

Posted:

20 December 2023

You are already at the latest version

Alerts
Abstract
The significant environmental issue of water pollution caused by emerging contaminants un-derscores the imperative for developing novel cleanup methods that are efficient, economically viable, and that are intended to operate at high capacity and under continuous flows at the in-dustrial scale. This study shows the results of the operational design to build a prototype for the retention at lab scale of pollutants residues in water by using as adsorbent material, insoluble polymers prepared by β-cyclodextrin and epichlorohydrin as a cross-linking agent. Laboratory in batch tests were run to find out the adsorbent performances against furosemide and hydro-chlorothiazide as pollutants model. The initial evaluation concerning the dosage of adsorbent, pH levels, agitation, and the concentration of pharmaceutical pollutants enabled us to identify the optimal conditions for conducting the subsequent experiments. The adsorption kinetic and the mechanisms involved were evaluated revealing that that the experimental data perfectly fit the pseudo second order model being the adsorption process mainly governed by chemisorption. According to the KF constants values of 0.044 (L/g) and 0.029 (L/g) for furosemide and hydro-chlorothiazide, respectively and determination coefficient (R2) higher than 0.9 for both com-pounds, Freundlich yielded the most favorable outcomes, suggesting that the adsorption process occurs on heterogeneous surfaces involving both chemisorption and physisorption processes. The maximum monolayer adsorption capacity (qmax) obtained by Langmuir isotherm reveal a saturation of the β-CDs-EPI polymer surface 1.45 times higher for furosemide (qmax = 1.282 mg/g) than hydrochlorothiazide (qmax = 0.844 mg/g). Based on these results, the sizing design and building of a lab scale model were conducted, which in turn will be used later to evaluate its performances working in continuous flow in a real scenario.
Keywords: 
Subject: Chemistry and Materials Science  -   Chemical Engineering

1. Introduction

Global water scarcity is now a widespread issue impacting every continent, posing a significant challenge in today's world. Over the past century, the consumption and depletion of water resources have surged at twice the rate of population growth. Despite an overall abundance of drinking water on Earth, it is unevenly distributed, subject to wastage, pollution in certain regions, and frequently lacks sustainable management [1,2].
The distribution and quality of water in Europe have raised significant concerns, leading member states to initiate efforts for water conservation and improved water management. The European Union has instituted a comprehensive framework with the goal of actively preventing and efficiently managing water pollution. This framework includes various measures designed to assess the chemical condition of water and reduce the presence of pollutants [3]. Directive 2013/39/EU, an amendment to Directives 2000/60/EC and 2008/105/EC pertaining to priority substances within the domain of water policy [4], places considerable importance on pinpointing the underlying causes of pollution. It advocates for the adoption of environmentally sustainable approaches to treat and curtail pollutant emissions at their source. Additionally, the Sustainable Development Goals (SDGs) have incorporated several strategies initially outlined in the Millennium Development Goals (MDGs), with a specific focus on Goal 6, which strives to "Ensure availability and sustainable management of water and sanitation for all." [5].
Despite the implementation of significant pollution control measures throughout the past century, which have successfully led to substantial reductions in various pollutants, such as persistent organic pollutants, a troubling trend has surfaced. There is a noticeable increase in the prevalence of emerging contaminants (ECs), presenting potential risks to both the environment and human health [6]. These contaminants encompass a variety of natural or synthetic chemical substances originating from diverse sources, including pharmaceuticals (PhACs), personal care products, drugs, preservatives, plasticizers, pesticides and among others [7,8].
Urban wastewater is a major source of water pollution when it is not properly collected and treated [8,9]. Consequently, in recent years, developed countries have tightened regulations governing effluents and their permissible composition for release into the environment. The current European Directive sets minimum requirements for the collection, treatment and discharge of urban wastewater [10]. This directive has proven to be very effective in reducing water pollution and improving the treatment of wastewater discharges over the last three decades, but the European authorities are reviewing this standard in order to align it with the objectives of the European Green Pact. The revision of Directive 91/271 aims to improve the protection of Europeans' health and the environment by addressing issues such as pollution in smaller cities, stormwater overflows, micropollutants, climate change, energy efficiency and resource management. It also seeks to ensure access to basic sanitation for all EU citizens, especially for the most vulnerable and marginalized groups.
Conventional technologies employed in wastewater treatment plants (WWTPs) have proven ineffective in removing ECs [8,11]. Current WWTPs were not specifically developed for the elimination of ECs, the traditional methods used such as coagulation/flocculation, precipitation, biodegradation, filtration or carbon filters are not capable of successfully removing ECs, or have the disadvantage of being expensive and a high cost of regeneration as is the case of adsorption with activated carbon [11,12]. As a result, various studies are exploring alternatives to eliminate ECs while remaining environmentally and economically sustainable [13,14,15].
Cyclodextrins (CDs), cyclic oligosaccharide derived from the enzymatic breakdown of starch, have been extensively researched in the past century because their capability to form inclusion complexes [16,17]. CDs have a torus-shaped structure, with the internal cavity being hydrophobic and the external cavity being hydrophilic. Inside the internal cavity CDs are capable of hosting numerous molecules of an organic or inorganic nature, forming the so-called inclusion complexes [18,19]. The formation of these inclusion complexes with numerous ECs have been and are currently one of the most important applications of CDs, they are part of numerous formulations available on the market [16,18]. Consequently, CDs have been considered as a potential solution for enhancing water quality [20,21].
However, their water-soluble nature needs chemical synthesis to render them suitable for treating contaminated water. This involves using different crosslinking agents like epichlorohydrin (EPI) [22], EDTA [23], citric acid [24], glutaraldehyde [25], tetrafluoroterephthalonitrile [26] or 1-4-diazabicyclooctane-1,4-butanediol diglycidyl ether [27].
Water insoluble CDs polymer have emerged as a crucial option for removing pollutants from water. They have successfully eliminated heavy metals [28,29,30], dyes [31,32,33], pesticides [34,35,36] and others micro pollutants [26,37,38]. Despite how successful the adsorption of ECs on CDs polymer is, not many pilot-scale demonstrations have been published [38].
CDs and EPI polymers have been widely studied in the last decade to their relative ease of synthesis and the excellent results obtained for the adsorption of different molecules and other applications such as biomedicine [39].
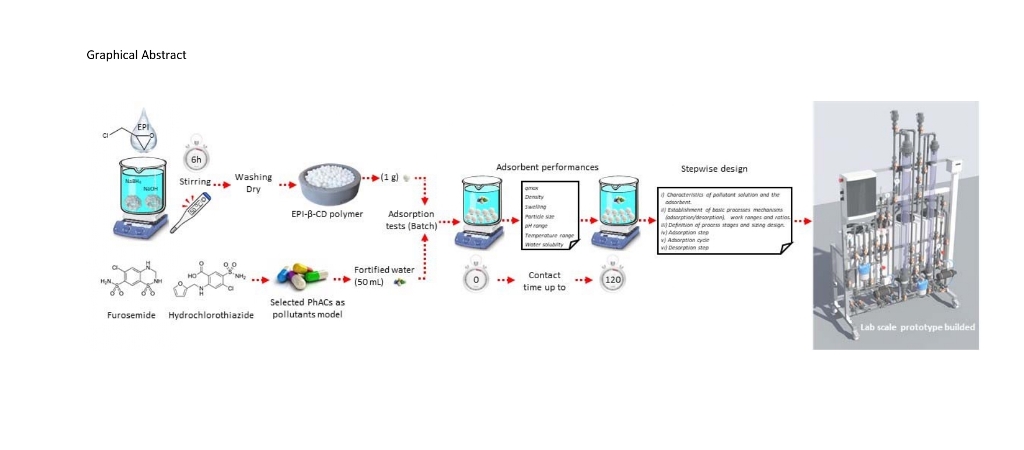
The present manuscript examines by in batch assays, the performances of a β-CDs-EPI polymer, to obtain the required parametric values for a correct design of a prototype that could operate under a real scenario at continuous flows. For that, the adsorption phenomena on β-CDs-EPI polymer of two diuretics drugs of widespread use and recurrent in wastewater, like furosemide and hydrochlorothiazide, were evaluated as model pollutants. Experimental data obtained in batch assays were adjusted to different kinetics models and adsorption isotherms to understand the physic-chemical characteristics of this adsorbent material for pollutants removal. The results obtained were used as inputs parameters for the theoretical design of the flow-through prototype.

2. Results and discussion

2.1. Effect contact time

Once equilibrium is established, there is a balance between the adsorption and desorption of pollutant within and outside the polymer. The interval required to achieve this equilibrium is denoted as the time at equilibrium, and the quantity of pollutant retained by the polymer specifies its maximum absorption capacity. Figure 1A and Figure 1B showed the adsorption data of β-CDs-EPI polymer against different concentrations of the diuretics studied (between 5 and 20 mg/L), as a function of the time of contact.
The analysis of the results shows that in all the tested concentrations, the adsorption of the pollutant by the polymer increases until reaching a constant value in a determined time. At that point, the polymer is in dynamic equilibrium between the amount of PhACs adsorbed and the amount of PhACs desorbed from the polymer, being the equilibrium time the time required for the uptake of pollutants from solution by the polymer to stop. The amount of PhACs that is adsorbed up to the equilibrium time is the maximum adsorption capacity of the polymer under the conditions in which the experiment was accomplished [40].
Several stages can be identified in the furosemide adsorption process, in the first 10 minutes of contact time a very rapid adsorption occurs, between 10 and 20 min of adsorption process the equilibrium was reached. However, as can be seen in Figure 1B, for hydrochlorothiazide the equilibrium time was reached at 60 minutes of contact time, except for 5 mg/L where the maximum adsorption capacity occurred at 40 minutes.

2.2. Kinetic Analysis

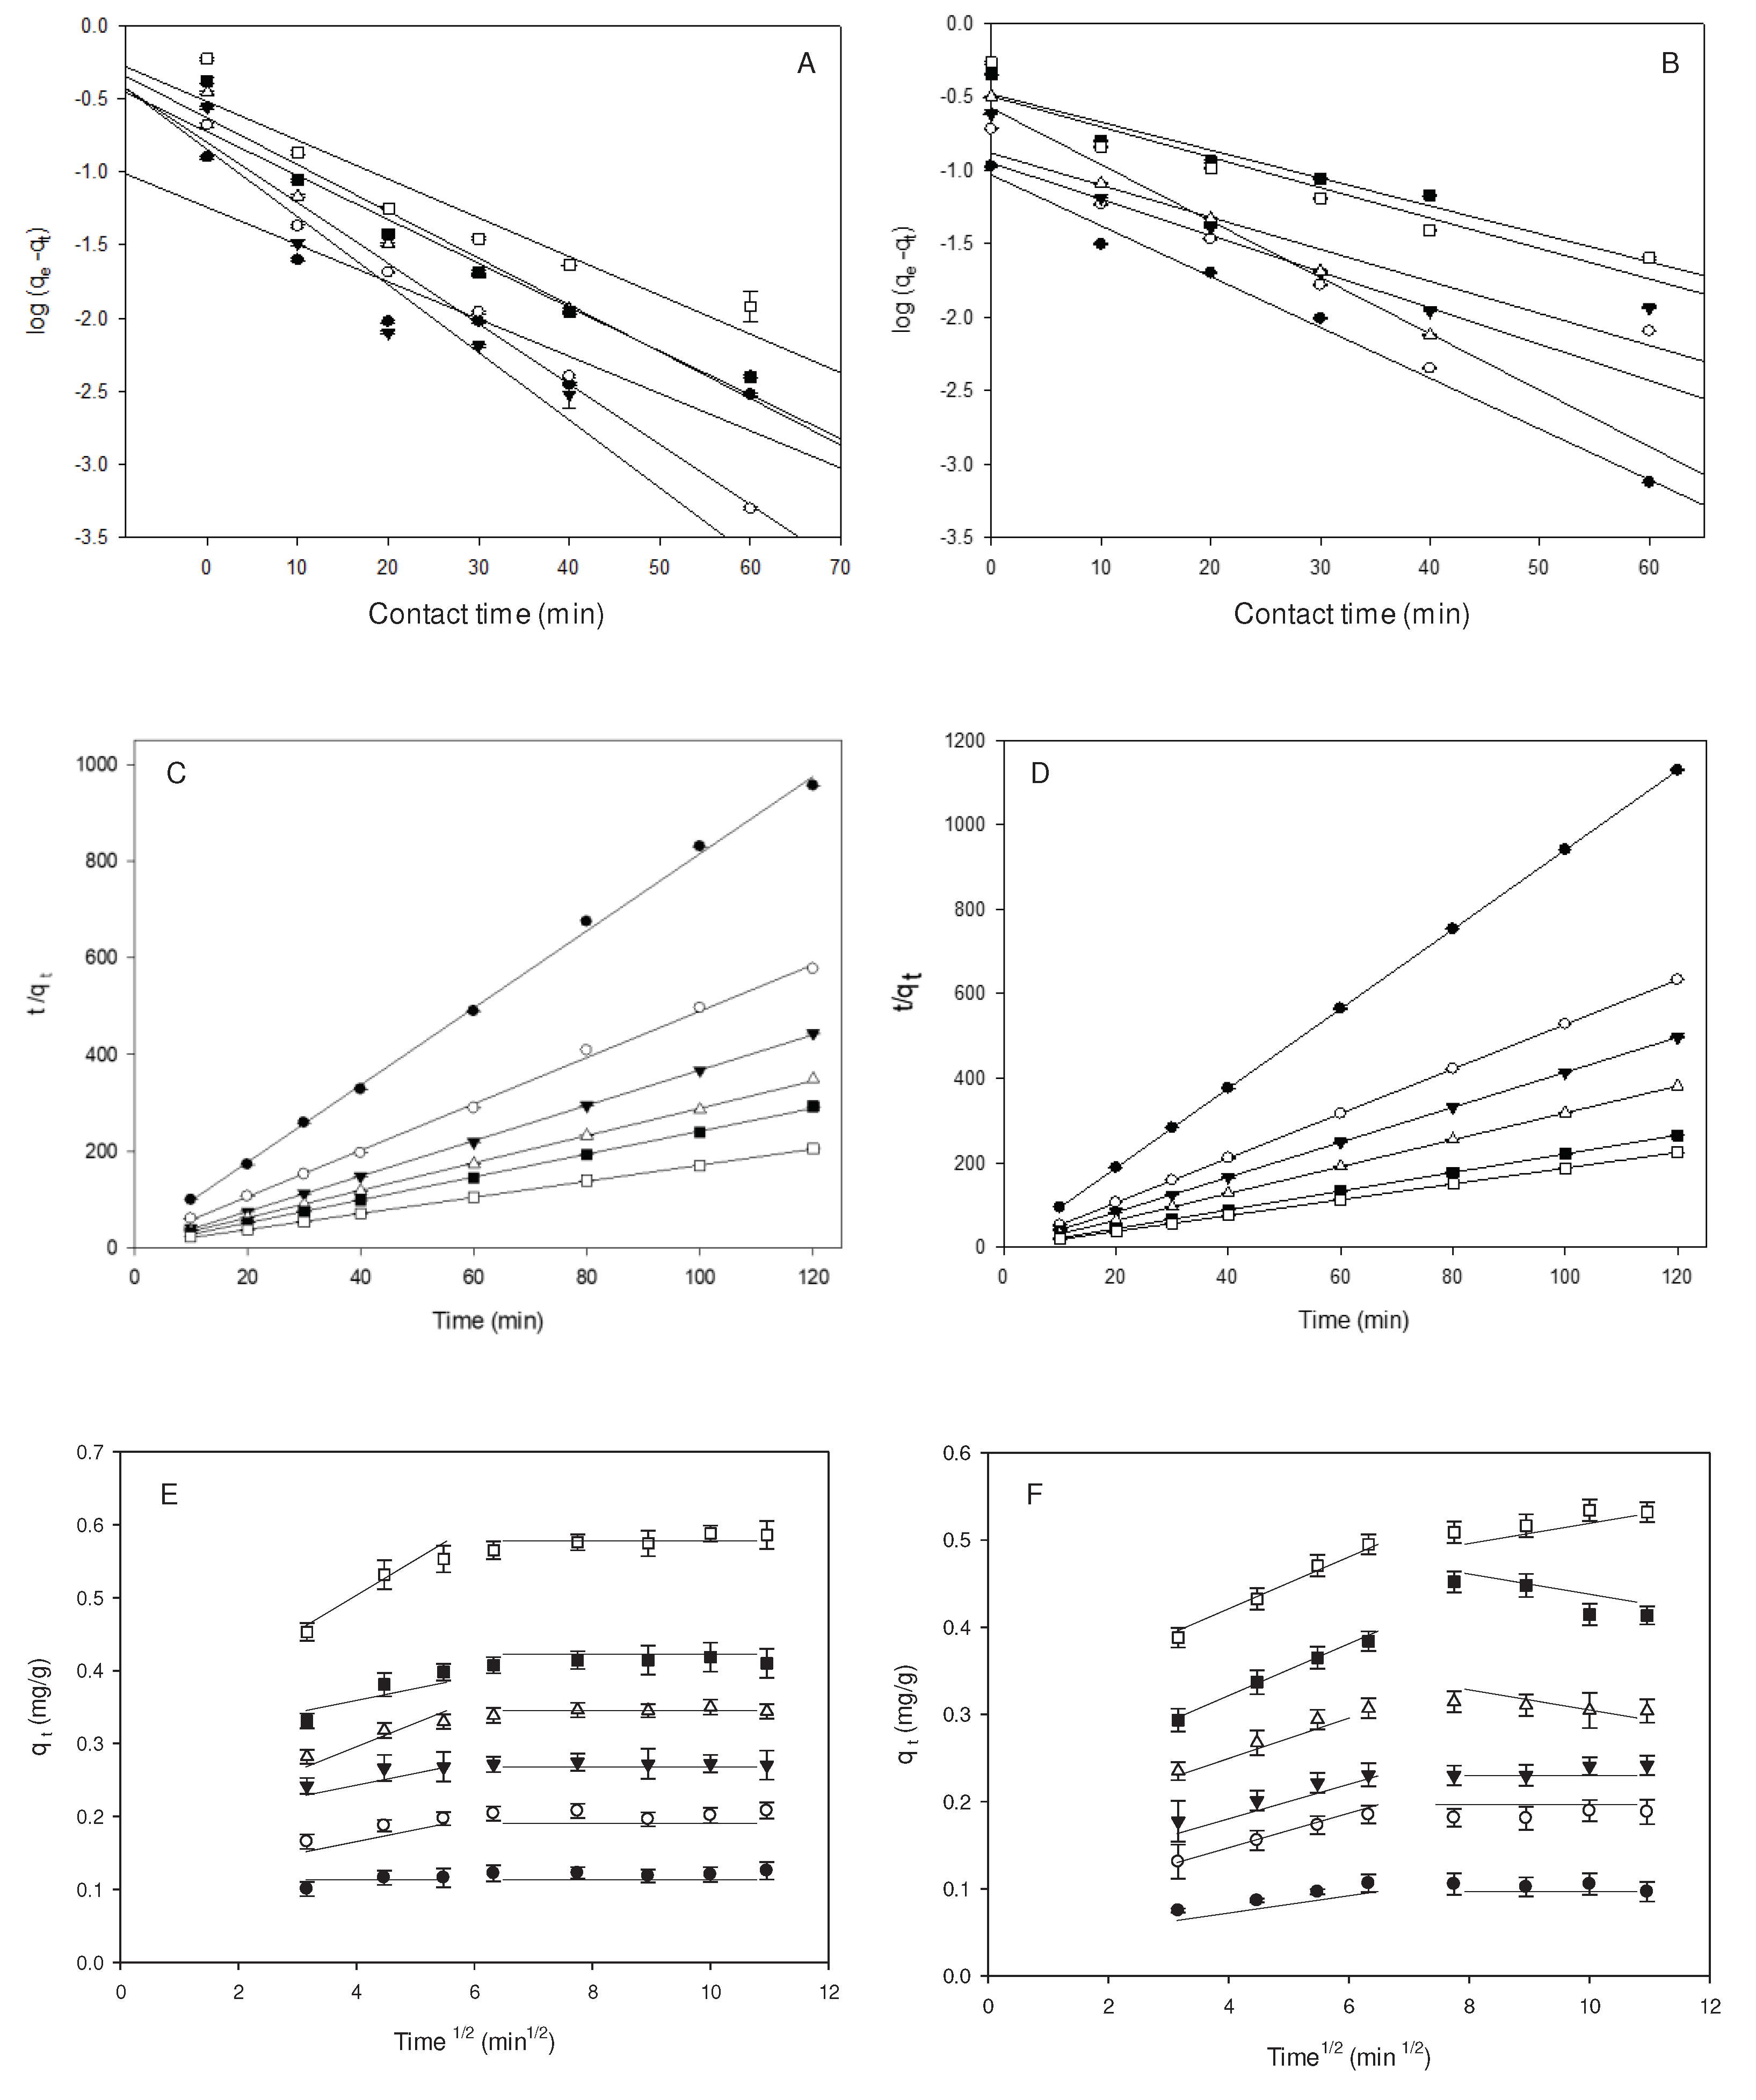
To clarify the adsorption kinetic process and the involved mechanisms, the experimental data underwent analysis using various kinetic models: pseudo first order, pseudo-second order and intraparticle diffusion (see Table S1 Supplementary Materials). The determination coefficient obtained in the adjustment (R2) was the key to understand the mechanism underlying the adsorption process.
For furosemide, the R2 values obtained for pseudo first order model are in a range of 0.987 to 0.834 for β-CDs-EPI. In the case of hydrochlorothiazide, the R2 values are in a similar range (0.991 to 0.805).
The values of experimental qe and calculated qe were different, indicating that the adsorption process does not fit the pseudo first order model (Figure 2A and Figure 2B), these results are in agreement with those published for other PhACs with CDs polymers such as the case of ciprofloxacin and different organic pollutants where the pseudo first order model did not show a suitable adjustment to the experimental data [27,41,42]; therefore, the pseudo second order model was applied.
The results of the graphical representation (Figure 2C and 2D) of t/qt versus contact time show straight line for the two PhACs studied and the polymer used. The fit values (R2), all higher than 0.99, reveal that the experimental data perfectly fit this kinetic model. Furthermore, the values of experimental qe and qe calculated are similar (see Table S1 Supplementary Materials). The adjustment to the PSOM model indicates that the adsorption process is mainly governed by chemisorption. These results are in agreement with those published for other pharmaceuticals such as ciprofloxacin and different dyes [27].
Different stages are involved in the adsorption process, such as the transport of pharmaceuticals molecules to the surface of the adsorbent material and the subsequent diffusion of PhACs molecules into the polymer. In addition, it was studied whether the intraparticle diffusion is the process that determines the rate of adsorption.
From the graphical representation of the model (Figure 2E), two zones can be distinguished for furosemide, the first one more curved and later stable zone corresponding to an intraparticle diffusion. On the other hand, for hydrochlorothiazide, a linear rise was observed at the beginning and later a plateau (Figure 2F), especially at the highest concentrations (15 and 20 mg/L).
The plateau stage means that intraparticle diffusion begins to decrease because there is not enough pollutant available. As could see in Table S1 (see Supplementary Materials), the value of ki increases with the concentration. These result show that intraparticle diffusion is involved in the adsorption processes, but that it is not the only mechanism implied, there being other mechanisms such as the formation of inclusion complexes, adsorption on the external surface of the polymer, ionic exchange and the diffusion into the polymeric network [41]. The amphiphilic cross-linked EPI-β-CD polymer exhibits both hydrophobic and hydrophilic cavities with a chaotic nature, resulting in a random distribution of shapes and sizes. This aspect is crucial for interpreting the obtained results. The hydrophilic properties of the polymer facilitate interaction with water, enhancing hydration through the potential formation of hydrogen bonds. Additionally, the polymer's hydrophilicity promotes better swelling of the network, thereby increasing its potential for diffusion. Furthermore, the hydrophobic cavities of the CDs and the cage structures formed by the cross-linker, abundant in ethylene oxide groups, attract hydrophobic PhACs [37].

2.3. Adsorption equilibrium

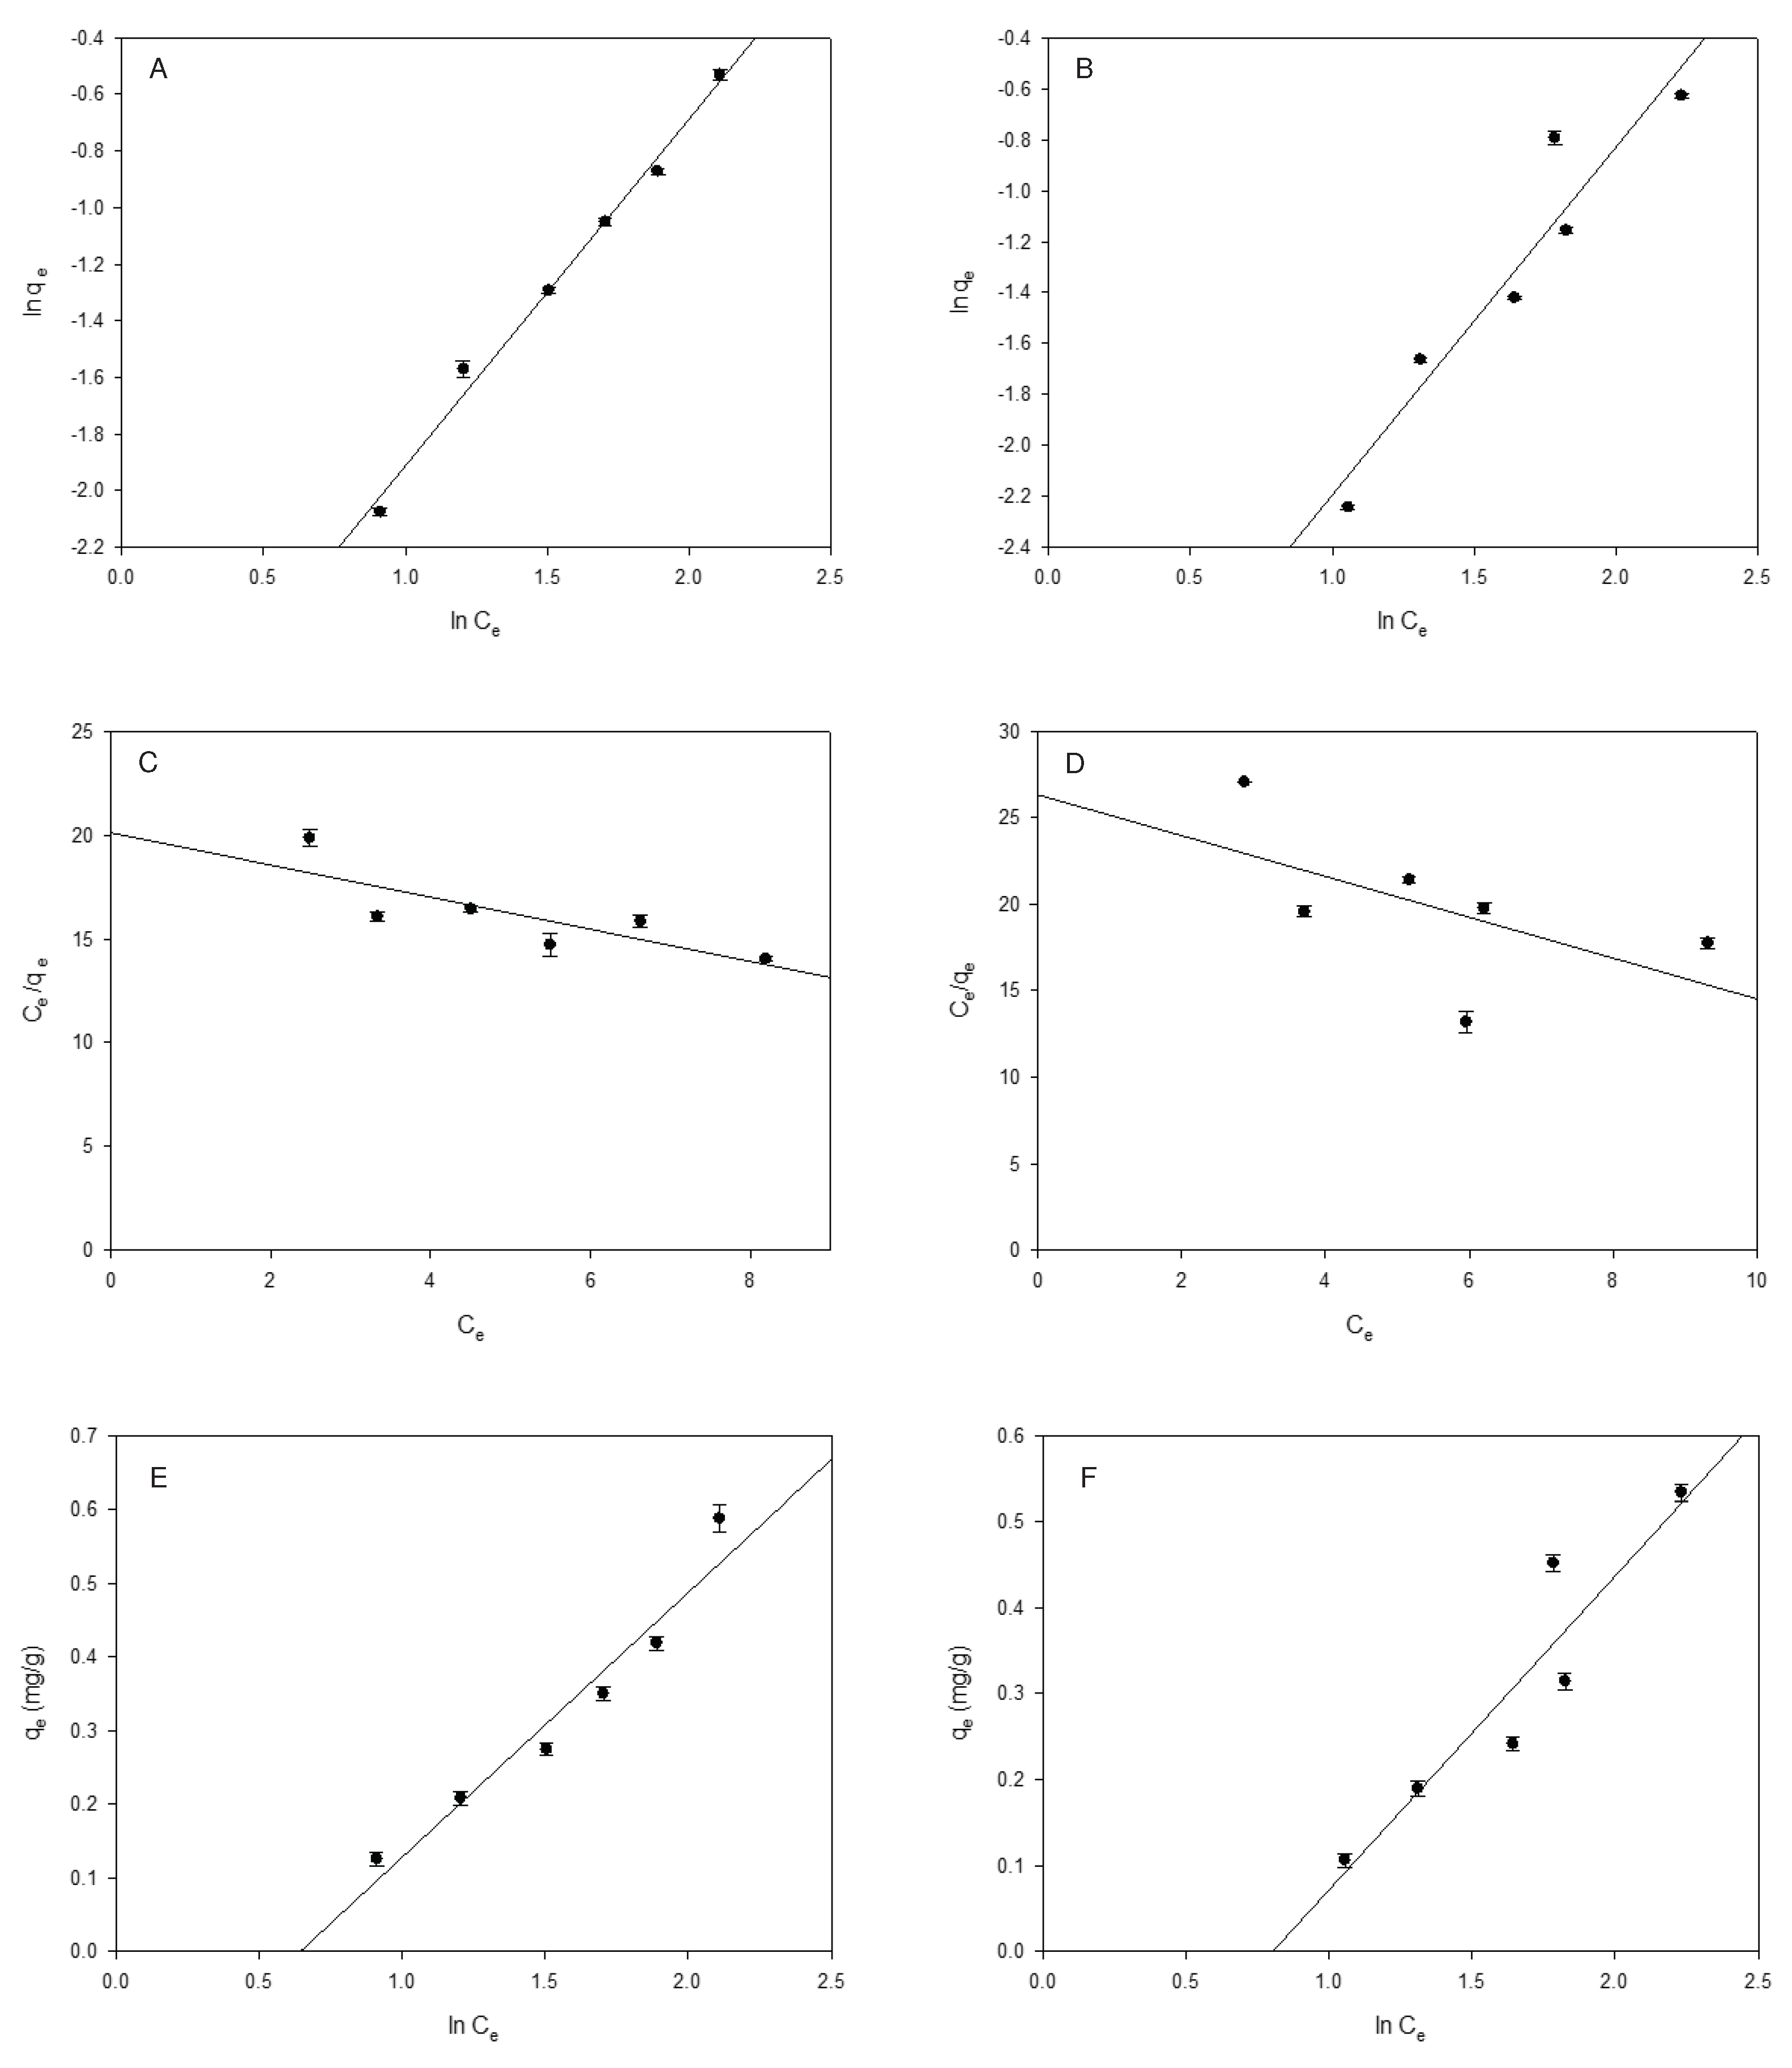
The distribution in the equilibrium of the PhACs between the polymer and the solution was studied, it was carried out applying the Freundlich, Langmuir and Tempkin isotherm models [43]. Table 1 shows the parametric values obtained for each model.
For the Freundlich isotherm, which describes the adsorption processes on heterogeneous surfaces, a linear representation was obtained for the two diuretics studied (Figure 3), reaching KF constants values of 0.044 (L/g) for furosemide and 0.029 (L/g) for hydrochlorothiazide. The order of KF values suggests that furosemide exhibits the strongest adsorption and the highest capacity at the β-CDs-EPI polymer surface, followed by hydrochlorothiazide. In addition, the determination coefficients (R2) of 0.991 and 0.905 for furosemide and hydrochlorothiazide, respectively (Table 1), indicated that the Freundlich equation fitted the adsorption data better than the Langmuir and Temkin models.
The magnitude of the Freundlich exponent nF for hydrochlorothiazide and furosemide, that ranged from 0.737 to 0.817 respectively, indicates that that the sorption mechanism is controlled by adsorption and not absorption to the Freundlich model, giving a rational description of the experimental data, involving both chemisorption and physisorption processes, agreeing with other published studies [27,44]. The role of the Freundlich isotherm in adsorption lies in its ability to describe multilayer adsorption onto heterogeneous surfaces. It is particularly useful when the adsorption process does not follow a straightforward monolayer adsorption (as assumed in models like Langmuir isotherm) and when multiple layers of solute can be adsorbed onto the surface with varying energies. Moreover, the exponent highlights the variety of energies linked to adsorption of both diuretics on the β-CDs-EPI polymer surface. Moreover, n < 1 for furosemide and hydrochlorothiazide indicates that upon increasing the PhACs concentration/loading the binding energy between the surfaces and both compounds is reduced.
Table 1. Adsorption isotherm coefficients obtained for β-CDs-EPI polymer by the Freundlich, Langmuir and Tempkin models.
Isotherm Parameter Furosemide Hydrochlorothiazide
Freundlich KF (L/g) 0.044 0.029
nF 0.817 0.737
R2 0.991 0.905
Langmuir qmax(mg/g) 1.282 0.844
KL 0.050 0.038
aL 0.039 0.045
∆G -16919.810 -16730.651
R2 0.516 0.514
RL 0.838-0.564 0.817-0.527
Tempkin aT 0.525 0.448
bT (kJ/mol) 6.890 6.79
R2 0.943 0.872
On the other hand, the Langmuir model proved suitable for scenarios where materials exhibited regularly energetic adsorption sites and monolayer adsorbate coverage. The isotherm postulated that all sites showed uniform surface coverage [45]. Unlike the Freundlich isotherm, the values of determination coefficients (R2) (Table 1) for Langmuir model were lower in all cases, which shows that the data does not fit well to this isotherm.
The most important parameter obtained with the Langmuir model is the maximum monolayer adsorption capacity (qmax), under the studied conditions, being 1.282 mg/g for furosemide and 0.844 mg/g for hydrochlorothiazide, showing that that the order of saturation of the β-CDs-EPI polymer surface with diuretic per mg diuretic was 1.45 times higher for furosemide. This trend fits well with KF values previously described by Freundlich model.
In addition, with the Langmuir isotherm it was analyzed whether the adsorption process is favorable or not, with the separation factor (RL). The adsorption process is considered favorable when it is between 0 and 1. In the case, of furosemide and hydrochlorothiazide, at the concentrations studies, the adsorption process on β-CDs-EPI polymer is favorable.
The Langmuir parameter KL increased in the order 0.038 L/g (hydrochlorothiazide) < 0.050 L/g (furosemide). This constant is mainly related to the adsorption energy and could give information about the β-CDs-EPI polymer–PhACs interaction and binding process strengthens.
Thus, based on Langmuir model, one expects that the β-CDs-EPI polymer–PhACs interaction increases in the order hydrochlorothiazide < furosemide. The same order but with different values 0.448 L/g (hydrochlorothiazide) < 0.525 L/g (furosemide), was obtained from Temkin binding constant aT which is also related to the binding strength.
Lastly, the equilibrium experimental data were analyzed by fitting the results to the Tempkin isotherm (Figure 3). It assumes the linear decrease in the heat of adsorption of all the molecules found in the external layer, as a consequence of the interactions that occur between the polymer and the PhACs, in this case the binding energies are uniformly distributed [46].
For ionic exchange, the binding energies are between 8 and 16 kJ/mol and for physisorption they are between -40 kJ/mol. The Temkin bT values for furosemide (6.890 kJ/mol) and hydrochlorothiazide (6.79 kJ/mol), suggests that the heat of adsorption on the β-CDs-EPI polymer increases in the order hydrochlorothiazide < furosemide as well as that physical and chemical processes are involved in the adsorption. Regardless the Temkin constant bT, all other parameters from the represented isotherm models in Figure 3, refer to stronger adsorption and higher capacity for the furosemide diuretic compared to hydrochlorothiazide by considering the number of PhAC mg.
Figure 3. Isotherm analysis (A,B) Freundlich model; (C,D) Langmuir model; (E,F) Tempkin model for Furosemide (A, C, E) and Hydrochlorothiazide (B, D, F) by β-CDs-EPI polymer. N=3.
Preprints 93653 g003

2.4. Thermodynamic parameters

The spontaneity of chemical reactions is related to the value of the Gibbs free energy (ΔG°). To determine this value, equation (1) was used:
K ° = K p M a d s o r b a t e   55.5
were Kp is the equilibrium constant (L/g), Madsorbate is the molecular weight of furosemide or hydrochlorothiazide; and 55.5 is the constant related to the mole concentration of water (mol/L) [47,48]. The values obtained with equation (1) for K ° , were used in equation (2).
G ° = R T l n ln K °
At room temperature, the standard free energy (ΔG°) for β-CDs-EPI polymer was determined to be – 16.919,810 J/mol for furosemide and -16.730,651 J/mol for hydrochlorothiazide, thus negative ΔG° values obtained at 25 °C demonstrating the inherent spontaneity of the adsorption process.

2.5. Polymer reusability

The β-CD-EPI polymer could be reused by at least ten cycles without losing capability significantly (> 90 %), which allows the reuse of both the PhACs and water, in a new adsorption cycle. Additionally, the polymer can be recycled for a subsequent round of pharmaceuticals removal, aligning with the principles of the circular economy.

2.6. Design continuous flow Prototype Adsorption

Once the batch adsorption data of the β-CDs-EPI polymer, using two PhACs as pollutants model, has been determined in distilled water, and the adsorption mechanism established by applying kinetic (pseudo-first order, pseudo-second order and intraparticle diffusion) and equilibrium (Freundlich, Langmuir and Tempkin isotherm) models, where are involved both physical and chemical processes, a laboratory-scale prototype was design to validate in subsequent tests, its behavior in real scenarios working continuously.
For that, a stepwise approach was followed starting with, i) the characteristics of the pollutant solution and the adsorbent (synthesized as described in Section 3.2). In our case we used to ascertain the adsorbent performances in batch assays of β-CDs-EPI polymer (Table 2), working solutions of furosemide and hydrochlorothiazide in distilled water at concentrations between 5 and 20 mg/L; ii) the establishment of basic processes of adsorption/desorption mechanisms, including work ranges and ratios. As in any engineering process, these two points are key to obtaining good execution and results of the engineering project.
In this sense, we confront a substantial challenge since we must design and build equipment that works in continuous flow in a way that allows us to confirm the results obtained in the laboratory, and also provide sufficient information to validate in a future the operation of the process on an industrial scale.
Once these two points are stated, we must define the adsorption and desorption processes steps, as well as the equipment necessary for their accomplishment. To do this, as a starting point we must prepare a summary (Table 3) with the recommended design parameters for a standard adsorption system.
As a result of these input parameters, the next step is iii) the definition of the stages of the process, together with the elaboration of a flowchart that helps us identify and understand each of the stages and equipment involved.
Table 2. Values of physical-chemical parameters obtained for β-CDs-EPI polymer for Furosemide and Hydrochlorothiazide by in batch assay.
Parameter Value
qmax (furosemide) (mg/g) 1.282
qmax (hydrochlorothiazide) (mg/g) 0.844
Density (g/cm³) 1.06
Swelling 4 ± 1
Particle size (mm) 0.1→0.3
Stability range (pH) 2→11
Temperature range (ºC) 5→35
Solubilty in H2O Insoluble
Table 3. Values of recommended design parameters for a standard adsorption system.
Parameter Value
Adsorbent Volume (L) 1→3
Column diameter To define
Adsorbent bed depth (mm) 150→550
Adsorbent expansion (%) Up to 100
Contact time (min) 1→7.5
Loading flow rate (BV/h) 8→40
Desorbent flow rate (BV/h) 2→5
Desorbent contact time (min) 20→60
Desorbent displacement (BV of water) 2→4
Final rinse (BV service flow rate) 2→10
Thus, to get started with the design we selected an acceptable adsorbent volume for continuous work in the range of 1 to 3 L. After that, we carry out the necessary calculations to define the necessary column for the piloting. The selection of the column is the point of outmost importance in the design, conditioning its configuration the design of the rest of the prototype components.
For that, adsorbents volumes of 1 L, 2 L and 3 L were used to determine the necessary height and diameter of the column for the continuous process setting for each adsorbent filling volume, a loading flow rates relation of 1:8 and 1:40 (i.e: 1 L adsorbent volume:8 L/h flow; 1 L adsorbent volume:40 L/h flow; 2 L adsorbent volume:16 L/h flow; 2 L adsorbent volume:80 L/h flow; 3 L adsorbent volume:24 L/h flow; 2 L adsorbent volume:120 L/h flow) and contact times of 7.5 min for 1:8 and 1.5 min for 1:40 rates. A column of Ø 90 mm capable of accommodating the β-CDs-EPI adsorbent polymer volumes chosen, with a final adsorbent bed depth do not exceeding 550 mm nor 1,200 mm for backwash expansion column height (the maximum recommended height), was selected.
Transparent polyvinyl chloride with a design pressure of 6 bar, as construction material of the column was selected. This material has chemical compatibility with the PhACs and desorbing (220 mM acetate buffer pH 4.0) solutions proposed for the pilot tests, while allowing us to visualize the behavior of the process at different adsorption/desorption stages.
The columns shall be equipped with two polypropylene nozzles at the top and bottom that will retain the adsorbent within the column. The light passage is set at 100 μm, measured below the particle size of the adsorbent used. The loading and emptying operations of the adsorbent will be carried out through a removable accessory located at both ends of the column.
Taking into account all the design criteria established above, we proceeded to determine the parametric values of the prototype for a column of 90 mm diameter (Ø) and one of 63 mm diameter (Table 4).
Taking into account the stated criteria 1,200 mm for the maximum recommended height in expansion backwash process and 550 mm of bed depth column, we select Ø90 mm columns because the height for a smaller diameter column Ø63 mm, exceeding the necessary heights in 350 mm for 2 L of adsorbent volume and flow rates of 16 L/h or 80 L/h, and 1,130 mm for 3 L of adsorbent volume and flow rates of 24 L/h or 120 L/h.
Once the column was selected we proceeded with the definition of process stages, iv) adsorption step. As defined in the design parameters, the flow rates established for the adsorption process are in the range from 8 to 120 L/h, ensuring that the contact time between the emergent pollutant solution and the adsorbent β-CDs-EPI polymer will be within the values established in the stated design parameters (1 to 7.5 min).
Table 4. Column size design calculations of the prototype.
Column size design calculations
Parameters Ø90 mm Ø63 mm
Flow (L/h) 8 40 8 40
Flow rate (m/h) 1.43 7.17 3.10 15.51
Ad volume (L) 1 1 1 1
BV (BV/h) 8 40 8 40
Area (m²) 0.0056 0.0056 0.0026 0.0026
Bed depth (m) 0.18 0.18 0.39 0.39
Expansion (%) 100 100 100 100
Column height (m) 0.36 0.36 0.78 0.78
Contact time (min) 7.5 1.5 7.5 1.5
Flow (L/h) 16 80 16 80
Flow rate (m/h) 2.87 14.33 6.20 31.02
Ad volume (L) 2 2 2 2
BV (BV/h) 8 40 8 40
Area (m²) 0.0056 0.0056 0.0026 0.0026
Bed depth (m) 0.36 0.36 0.78 0.78
Expansion (%) 100 100 100 100
Column height (m) 0.72 0.72 1.55 1.55
Contact time (min) 7.5 1.5 7.5 1.5
Flow (L/h) 24 120 24 120
Flow rate (m/h) 4.30 21.50 9.31 46.54
Ad volume (L) 3 3 3 3
BV (BV/h) 8 40 8 40
Area (m²) 0.0056 0.0056 0.0026 0.0026
Bed depth (m) 0.54 0.54 1.16 1.16
Expansion (%) 100 100 100 100
Column height (m) 1.07 1.07 2.33 2.33
Contact time (min) 7.5 1.5 7.5 1.5
The adsorption stage begins with the preparation of the PhACs solution in a 50 L tank TK-01 (as described in Section 3.9). This solution is sent to the adsorption column through a self-priming diaphragm pump (P-01), responsible for propelling the solution towards the column at the determined flow rate and pressure (2 to 4 bar). This flow rate will be measured by an in-line flow meter FI-01 installed in the feed pipe, while the pressure is measured in the inlet and pressure gauges output of column at PI-01 and PI-02, respectively. To regulate the flow, a needle valve RG-01will be used. At the exit of the adsorption column, the treated PhACs solution will be collected in the product tank TK-02 (50 L).
Next, it is necessary to estimate the v) adsorption cycle. Based on the capacity data obtained from the adsorption isotherms in batch, and once stated the volumes to be used in the columns, we carried out the necessary calculations to estimate the depletion of the β-CDs-EPI polymer used as adsorbent. These theoretical values are based on the data obtained for in batch absorption processes with continuous stirring, but they provide us with the necessary information for a preliminary calculation of the pilot plant design (Table 5).
Table 5. Theoretical values for flow adsorption cycle estimation of β-CDs-EPI polymer for Furosemide and Hydrochlorothiazide based in batch assay data.
Parameter Value
PhACs concentration (mg/L) 5→20
Tank volume of PhACs solution (L) 50
Amount PhACs concentration (mg) 250→1000
β-CDs-EPI qmax (furosemide) (mg/g) 1.282
β-CDs-EPI qmax (hydrochlorothiazide) (mg/g) 0.844
β-CDs-EPI volume (L) 1→3
β-CDs-EPI weight (g/column) 1,060→3,180
Amount β-CDs-EPI qmax (furosemide) (mg) 1,358→3,846
Amount β-CDs-EPI qmax (hydrochlorothiazide) (mg) 894→2,683
Now, we must propose in the design the two possible flow operation scenarios, co-current and counter-current (as described in Section 3.9).
To operate co-current, the flow direction is downward. The PhACs solution enters through the upper part of the column, while the effluent exits through the lower part of the column through a polypropylene nozzle with a passage light of 100 µm.
On the other hand, to operate counter-current, the flow direction is upward. The PhACs solution exits through the upper part of the column through a polypropylene nozzle (passage light of 100 µm) located at the upper part of the column. Table S2 and S3 of Supplementary Materials details the on/off positions of the valves when working in co-current (Table S2) and counter-current (Table S3) way, respectively.
As the prototype is designed to function continuously, the adsorbent polymer must undergo proper regeneration upon reaching its capacity limit by a backwash process.
This involves introduction of a desorbing solution to sponge the adsorbent restoring the capacity of the β-CDs-EPI polymer, ensuring complete contact of the solution with the adsorbent when the operating flow rate is between 55 and 110 L/h. The on/off positions of the valves to carry out the backwash process is the same as described above when working in counter-current flow (see Table S3 Supplementary Materials).
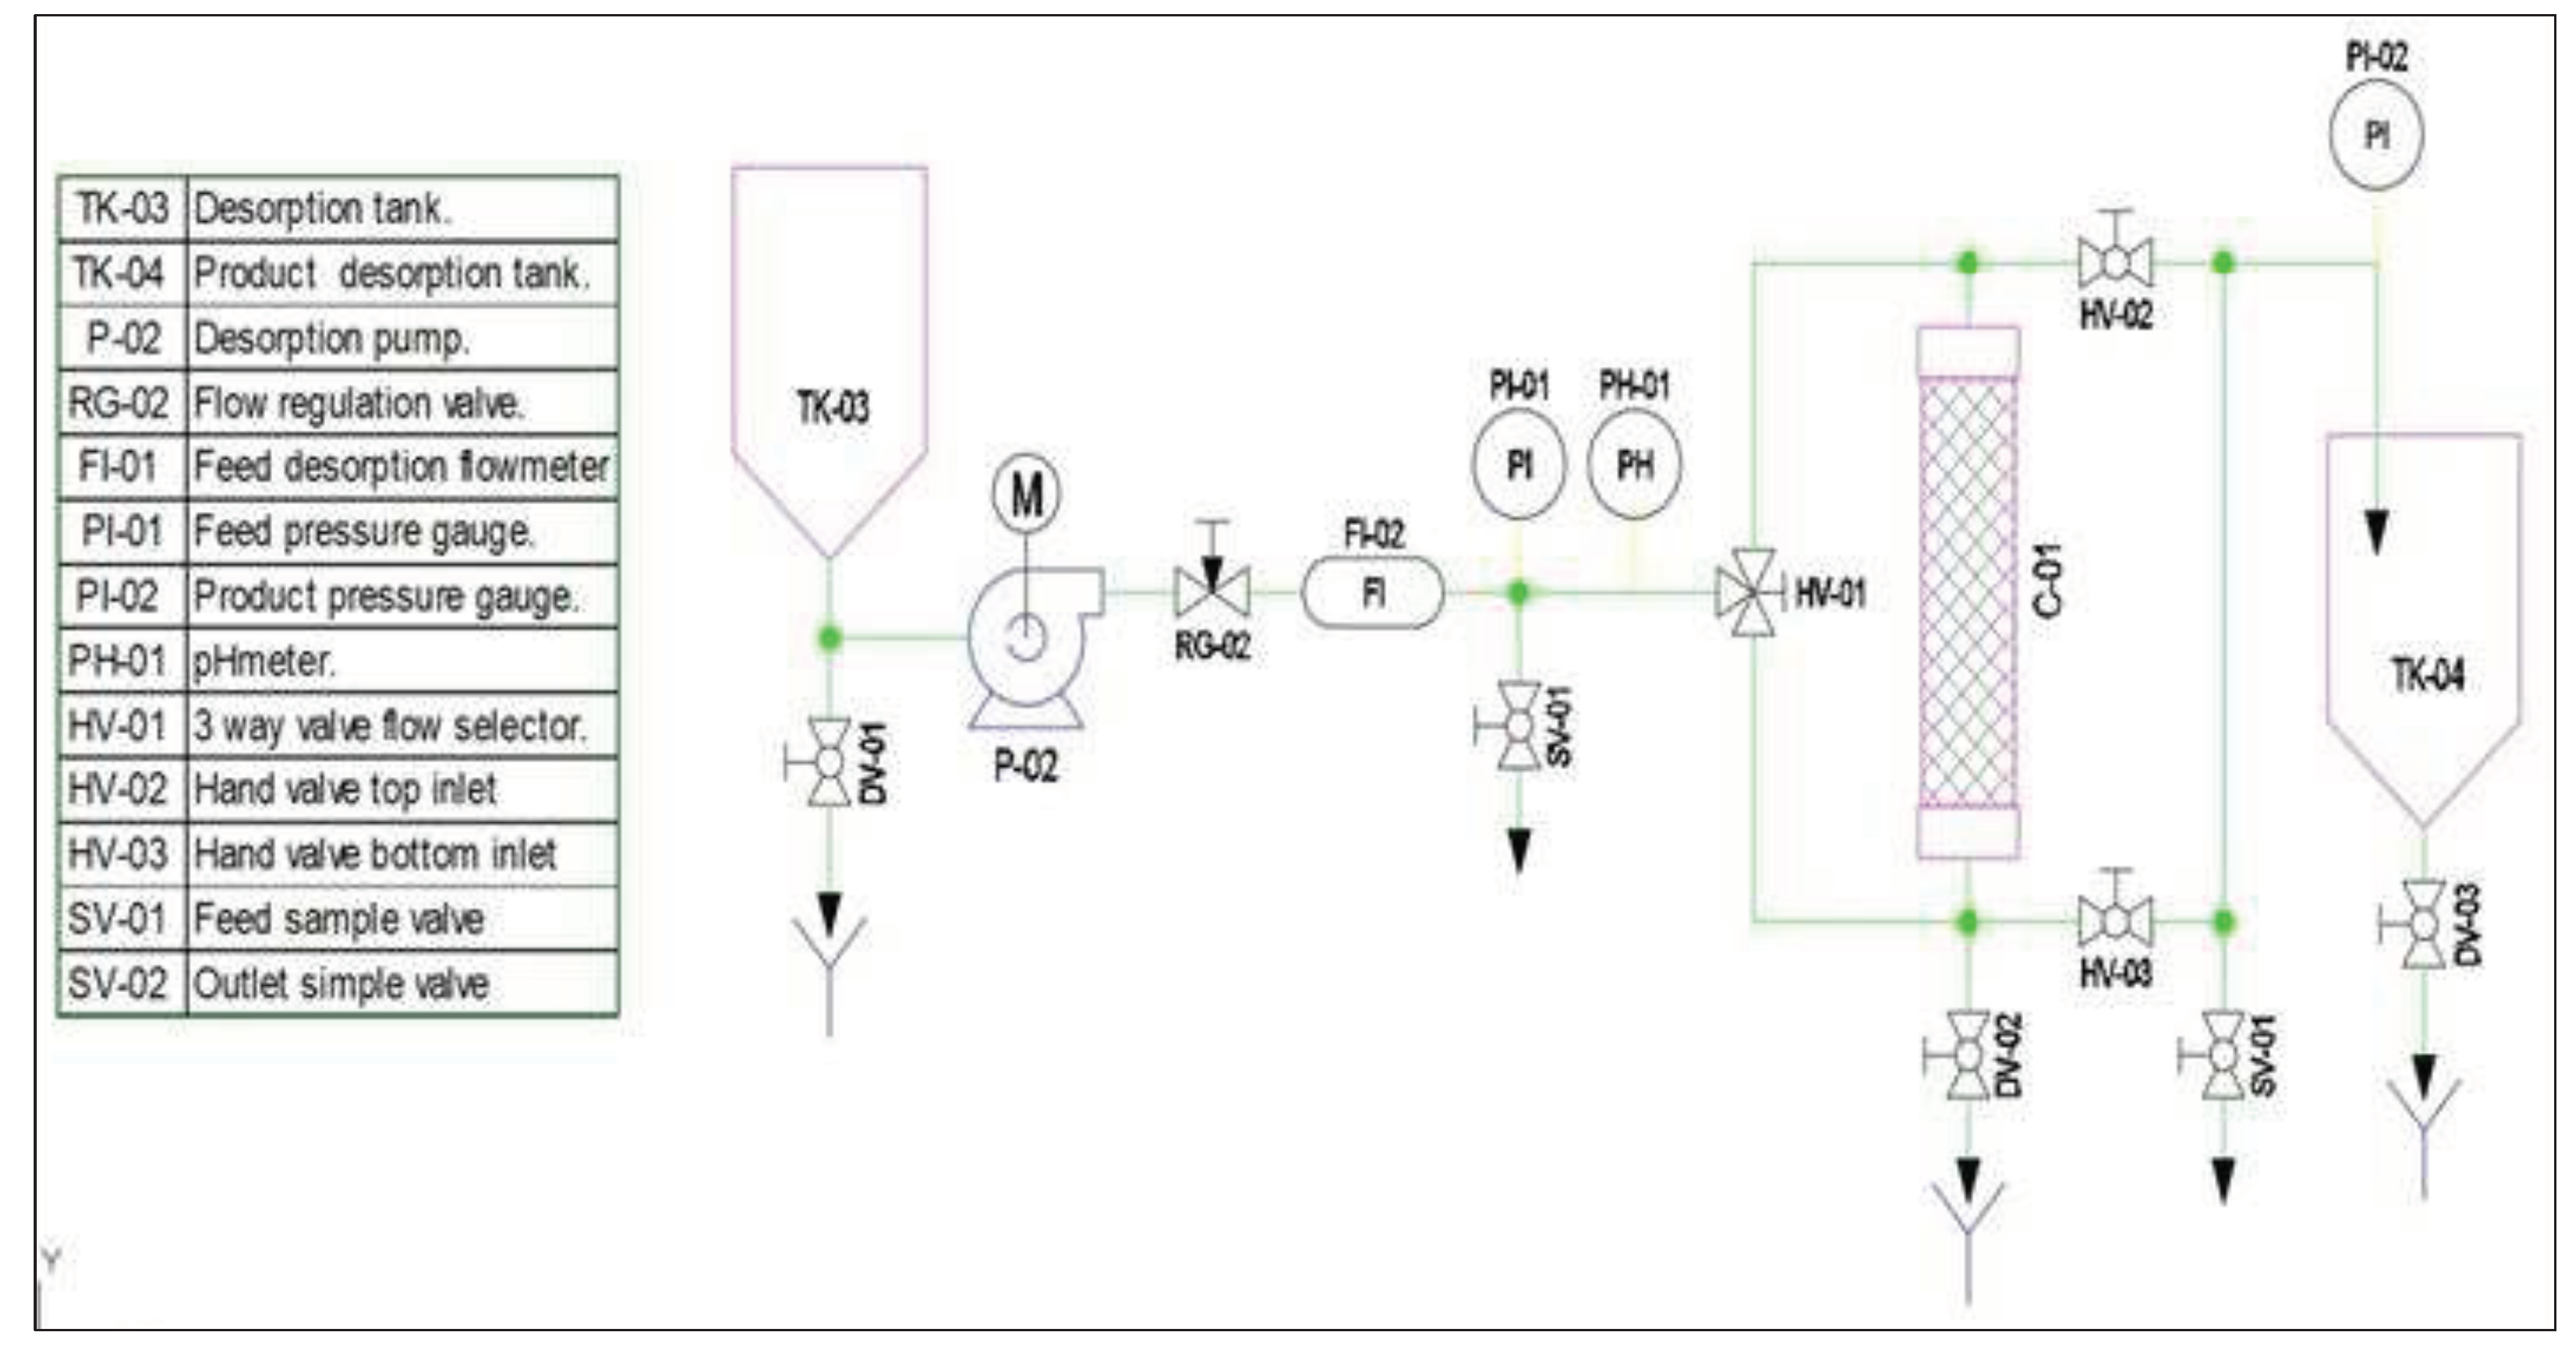
The vi) desorption step starts when the β-CDs-EPI polymer lost their adsorbent capacity passing through a desorbing solution (as described in Section 3.9), to restore its adsorption capacity for the removal of PhACs. This solution is introduced in a 50 L tank TK-03, and the valves HV are placed in the desorption position (see Table S4 Supplementary Materialswhen working in co-current flow)., turning on the pump P02. The desorbing solution flow rate (2 to 5 BV/h) is regulated with the RG-02 valve and the FI-01 flowmeter, while the pressure is measured in the inlet and pressure gauges output of column at PI-01 and PI-02, respectively. The contact time between the desorbing solution and the adsorbent β-CDs-EPI polymer will be within 20 to 60 min with a displacement of desorbing solution between 2 to 4 BV of water. At the exit of the desorption column, the desorbing solution will be returned to the tank TK-04 (50 L).
Finally, a rinsing process is carried out in order to remove possible traces of desorbing solution that remain in the column before starting a new adsorption process. The volume of effluent used will be between 2 and 10 times higher than the volume of β-CDs-EPI adsorbent polymer filled in the column. The on/off positions of the valves to carry out the rinsing process is the same as described above when working in co-current flow (see Table S2 Supplementary Materials).
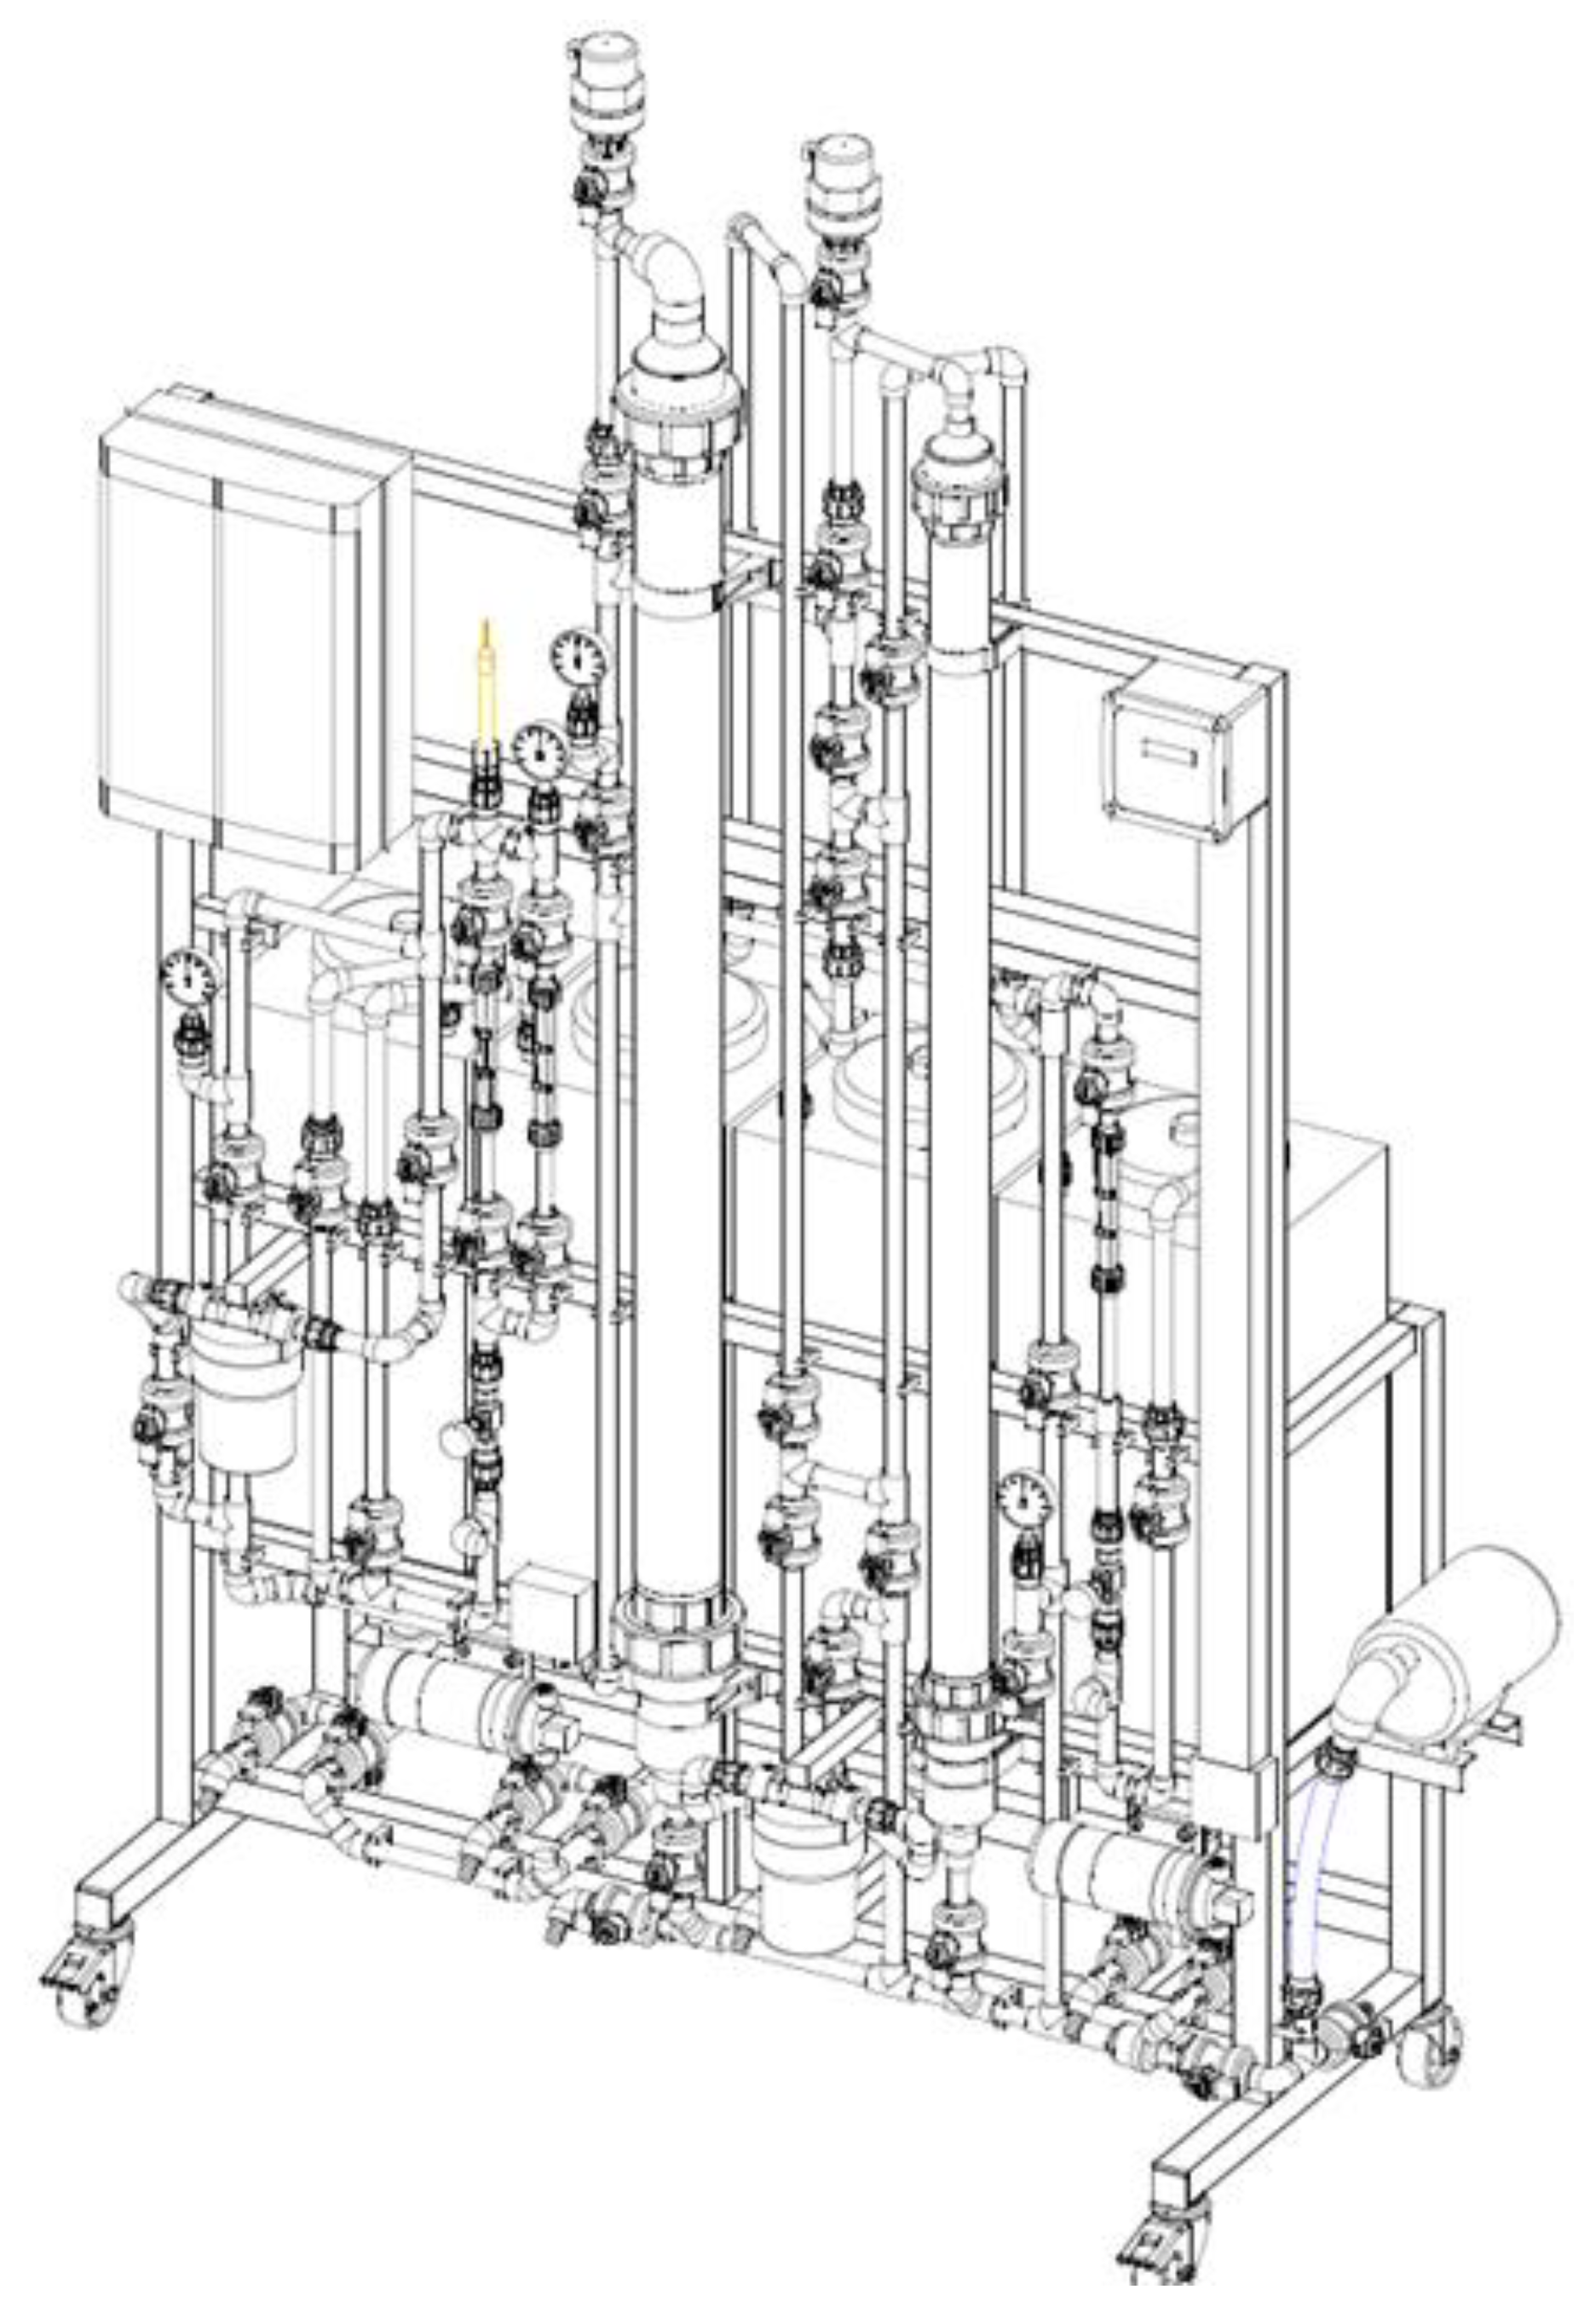
Taking into account the theoretical calculations obtained using previous inputs, a pilot-plant laboratory scale prototype (PPLSP) was built to validate under continuous flows in subsequent tests (Figure 4), if fulfilled the design criteria regarding the parameters obtained in batch adsorption process.
Figure 4. Image of the designed pilot-plant laboratory scale prototype (PPLSP).
Preprints 93653 g004
As can be seen in Figure 4, we decided to include, in addition to the selected one (Ø90 mm), an additional smaller diameter column Ø63 mm not exceeding the necessary 1,200 mm height (but lower bed depth working), in order to obtain comparative data of the adsorption process in continuous way, as a function of the column size.
Theory results of pharmaceutic retention using this prototype suggest that this simple and inexpensive technological setup could be scaled up to a functional field application to effectively capture emerging pollutants. To confirm this theoretical postulate, the built prototype should be subjected to representative continuous assays with water and wastewater samples enriched with emerging contaminants and the obtained results will be displayed in a succeeding work.

3. Materials and Methods

3.1. Chemicals and reagents

The β-cyclodextrins (β-CDs, CID 444041) used for the synthesis of the polymer were supplied by Arachem (Tilburgo, The Netherlands). The rest of chemicals: epichlorohydrin (99%), sodium borohydride (98%), sodium hydroxide (98%) and acetone were from Sigma-Aldrich (Barcelona, Spain). The PhACs standards of Furosemide (CAS No.: 54-31-9, 100% purity) and Hydrochlorothiazide (CAS No.: 58-93-5, 100% purity) were supplied by Sigma Aldrich (Barcelona, Spain).

3.2. Epichlorohydrin-β-cyclodextrin polymer preparation

The β-CD-EPI polymer was synthesized following the method described by Pellicer et al. 2018 [32]. Firstly, 60 mg of sodium borohydride were mixed with 24 g of β-CDs and 24 mL of water at 50 ˚C. After 10 minutes of stirring, 26 mL of sodium hydroxide were added and the mixture was kept stirring for 5 minutes. Subsequently, 264 g of EPI were added dropwise. The mixture was kept under constant stirring for 6 hours until the polymer was obtained. The adsorbent was washed with acetone and dried at 60 ˚C overnight. This work does not include the characterization of β-CDs-EPI polymer since it was already published by this research group [40].

3.3. Diuretics solution preparation

For accomplish the adsorption experiments in batch, standards solutions of furosemide and hydrochlorothiazide, with molecular weights of 330.74 g/mol and 297.7 g/mol, respectively, were daily prepared at several concentrations (5.0; 7.5; 10.0; 12.5; 15.0 and 20.0 mg/L), in distilled water, and used to enrich water aliquots at the described concentrations of each compound. After treatment with the polymer, the remaining PhACs concentration was measured in the supernatant using a spectrophotometer (Shimadzu UV-1603, Schimadzu Europe GmbH, Duisburg, Germany). Absorbance signatures were monitored upon treatment at the maximum absorbance of each compound (λmax = 243 nm for furosemide; λmax = 273 nm for hydrochlorothiazide) from the corresponding absorption spectra included in Supplementary Materials (see Figure S1 and Figure S2).

3.4. Adsorption experiments

Adsorption tests were carried out at room temperature (25 °C), using solutions containing different concentrations of PhACs ranging from 5 to 20 mg/L. In each assay test, a combination of 1 g of β-CDs-EPI polymer and 50 mL of PhACs solution was thoroughly mixed. After that, the mixture was stirred at 500 rpm. The amount of pollutant that remained unadsorbed by the polymer was determined at 10 min intervals (up to 40 min), and at 20 min interval from 40 min to 120 min. The supernatant of the mixture was measured, after being subject to centrifugation (3,000 rpm) for 5 min. Susbsequently, the PhACs concentration was determined. Notably, all experiments were conducted in set of three replicates. The measure of PhACs captured by the polymer (qe) was calculated using the following equation (3)[49]:
q e = V ( C 0 C e ) m
where V is the volume of PhACs solution (L), m is the mass of the employed polymer (g), C0 represent the initial concentration of PhACs in the liquid phase (mg/L), and Ce indicates the equilibrium concentration of PhACs in the liquid phase (mg/L). All experiments were conducted in triplicate.

3.5. Kinetics analysis

With the aim of examining the PhACs adsorption mechanisms onto β-CDs-EPI polymer, three kinetics model were explored to assess the adsorption processes. These model include the pseudo-first-order kinetic model [50], the pseudo-second-order kinetic model [51,52], and the intraparticle diffusion model [53], were evaluated using equations (4), (5) and (6), respectively.
log ( q e q t ) = l o g q e k 1 2.303 t
t q t = 1 k 2 q e 2 + 1 q e t
q t = k i t + C
where qe and qt represent the quantity of adsorbed PhACs (mg/g) at equilibrium and at time t (min), respectively; k1 indicates the pseudo 1st order rate constant (min-1), k2 represents the equilibrium rate constant of pseudo 2nd order (g/mg min), ki the intraparticle diffusion rate constant (mg/g min1/2), t is the time and C is the intercept (mg/g).

3.6. Isotherms analysis

For the optimizarion of the adsorption process of pollutants in adsorbent materials such as polymers, the study of their interactions is essential, for this reason the experimental data were adjusted to the theoretical models of adsorptions isotherms [53]. Equilibrium sorption data from experiments were described using equations based on isotherms. The equilibrium isotherm parameters offer valuable insights into adsorption mechanisms, the adsorbent´s affinity, and surface characteristics [51]. In this study, various isotherm models, namely Freundlich, Langmuir, and Tempkin, were investigated to assess adsorption equilibrium [54,55,56].
The Freundlich isotherm model indicates the presence of heterogeneity in adsorption sites and considers adsorption taking place at sites with varying energy of adsorption. The isotherm is derived from the linear version of Freundlich expresion equation (7) [54].
l n q e = l n K F + 1 n F l n C e
where qe is the quantity of adsorbed pollutant (mg/g) at equilibrium, KF is the Freundlich constant (L/g), Ce is the equilibrium concentration of pollutant in solution (mg/L), 1/nF is the heterogeneity factor.
The Langmuir isotherm model postulates that adsorption takes place at distinct and uniform sites on the adsorbent. This model is widely utilized as an adsorption isotherm, particularly in effectively removing constaminants from aqueous solutions. The Langmuir model´s linearized version is represented by the following equation (8) [49,55]:
C e q e = 1 K L + a L K L C e
where qe represent the quantity of adsorbed pollutant (mg/g) at equilibrium, Ce is the equilibrium concentration of pollutant in solution (mg/L), KL (L/g) and aL (L/mg) are the Langmuir isotherm constants. The parameter qmax stands for the utmost adsorption capacity of the adsorbent (mg/g), and its calculation relies on kL/aL; The separation factor RL determined by equation (9), is the most important parameter that gives us the Langmuir isotherm, since determines the nature of the adsorption process as unfavorable (RL > 1), linear (RL = 1), favorable (0 < RL < 1) or irreversible (RL = 0) [57].
R L = 1 1 + a L C 0
where C0 is the initial pollutant concentrations (mg/L.
The Tempkin equation establishes that the reduction in adsorption heat as coverage increases follow a lineal pattern due to specific interactions between the adsorbate and adsorbent. This adsorption is marked by an even dispersion of bond energies, up to a maximum value [56]. The linear representation of the Tempkin isotherm is given by equation (10):
q e = R T b T ln a T + R T b T ln C e
were T representing the absolute temperature in Kelvin; aT is the constant of the Tempkin isotherm (L/g), R is the universal gas constant (8.314 J/mol K) and bT is the Tempkin constant (kJ/mol) associated with the heat of adsorption.

3.8. Polymer reusability

The reusability of the EPI-β-CDs polymer was evaluated using the same PhACs at 20 mg/L. For that, fifty mL of each PhACs solution was mixed with 1 g of polymer and stirred at 500 rpm for 1 hour. Subsequently, the polymer underwent a 10-min separation, and the residual concentration of PhACs was determined spectrophotometrically, as described earlier. The solution containing PhACs was decanted, and the separated polymer was regenerated using a 50 mL acetate buffer solution, pH 4, at a concentration of 220 mM, over a 30 min period. Following this, the polymer was again separated and reloaded with each PhACs for a new usage cycle, up to ten rounds.

3.9. Design of a pilot-scale prototype cyclodextrin polymer adsorption of pollutants
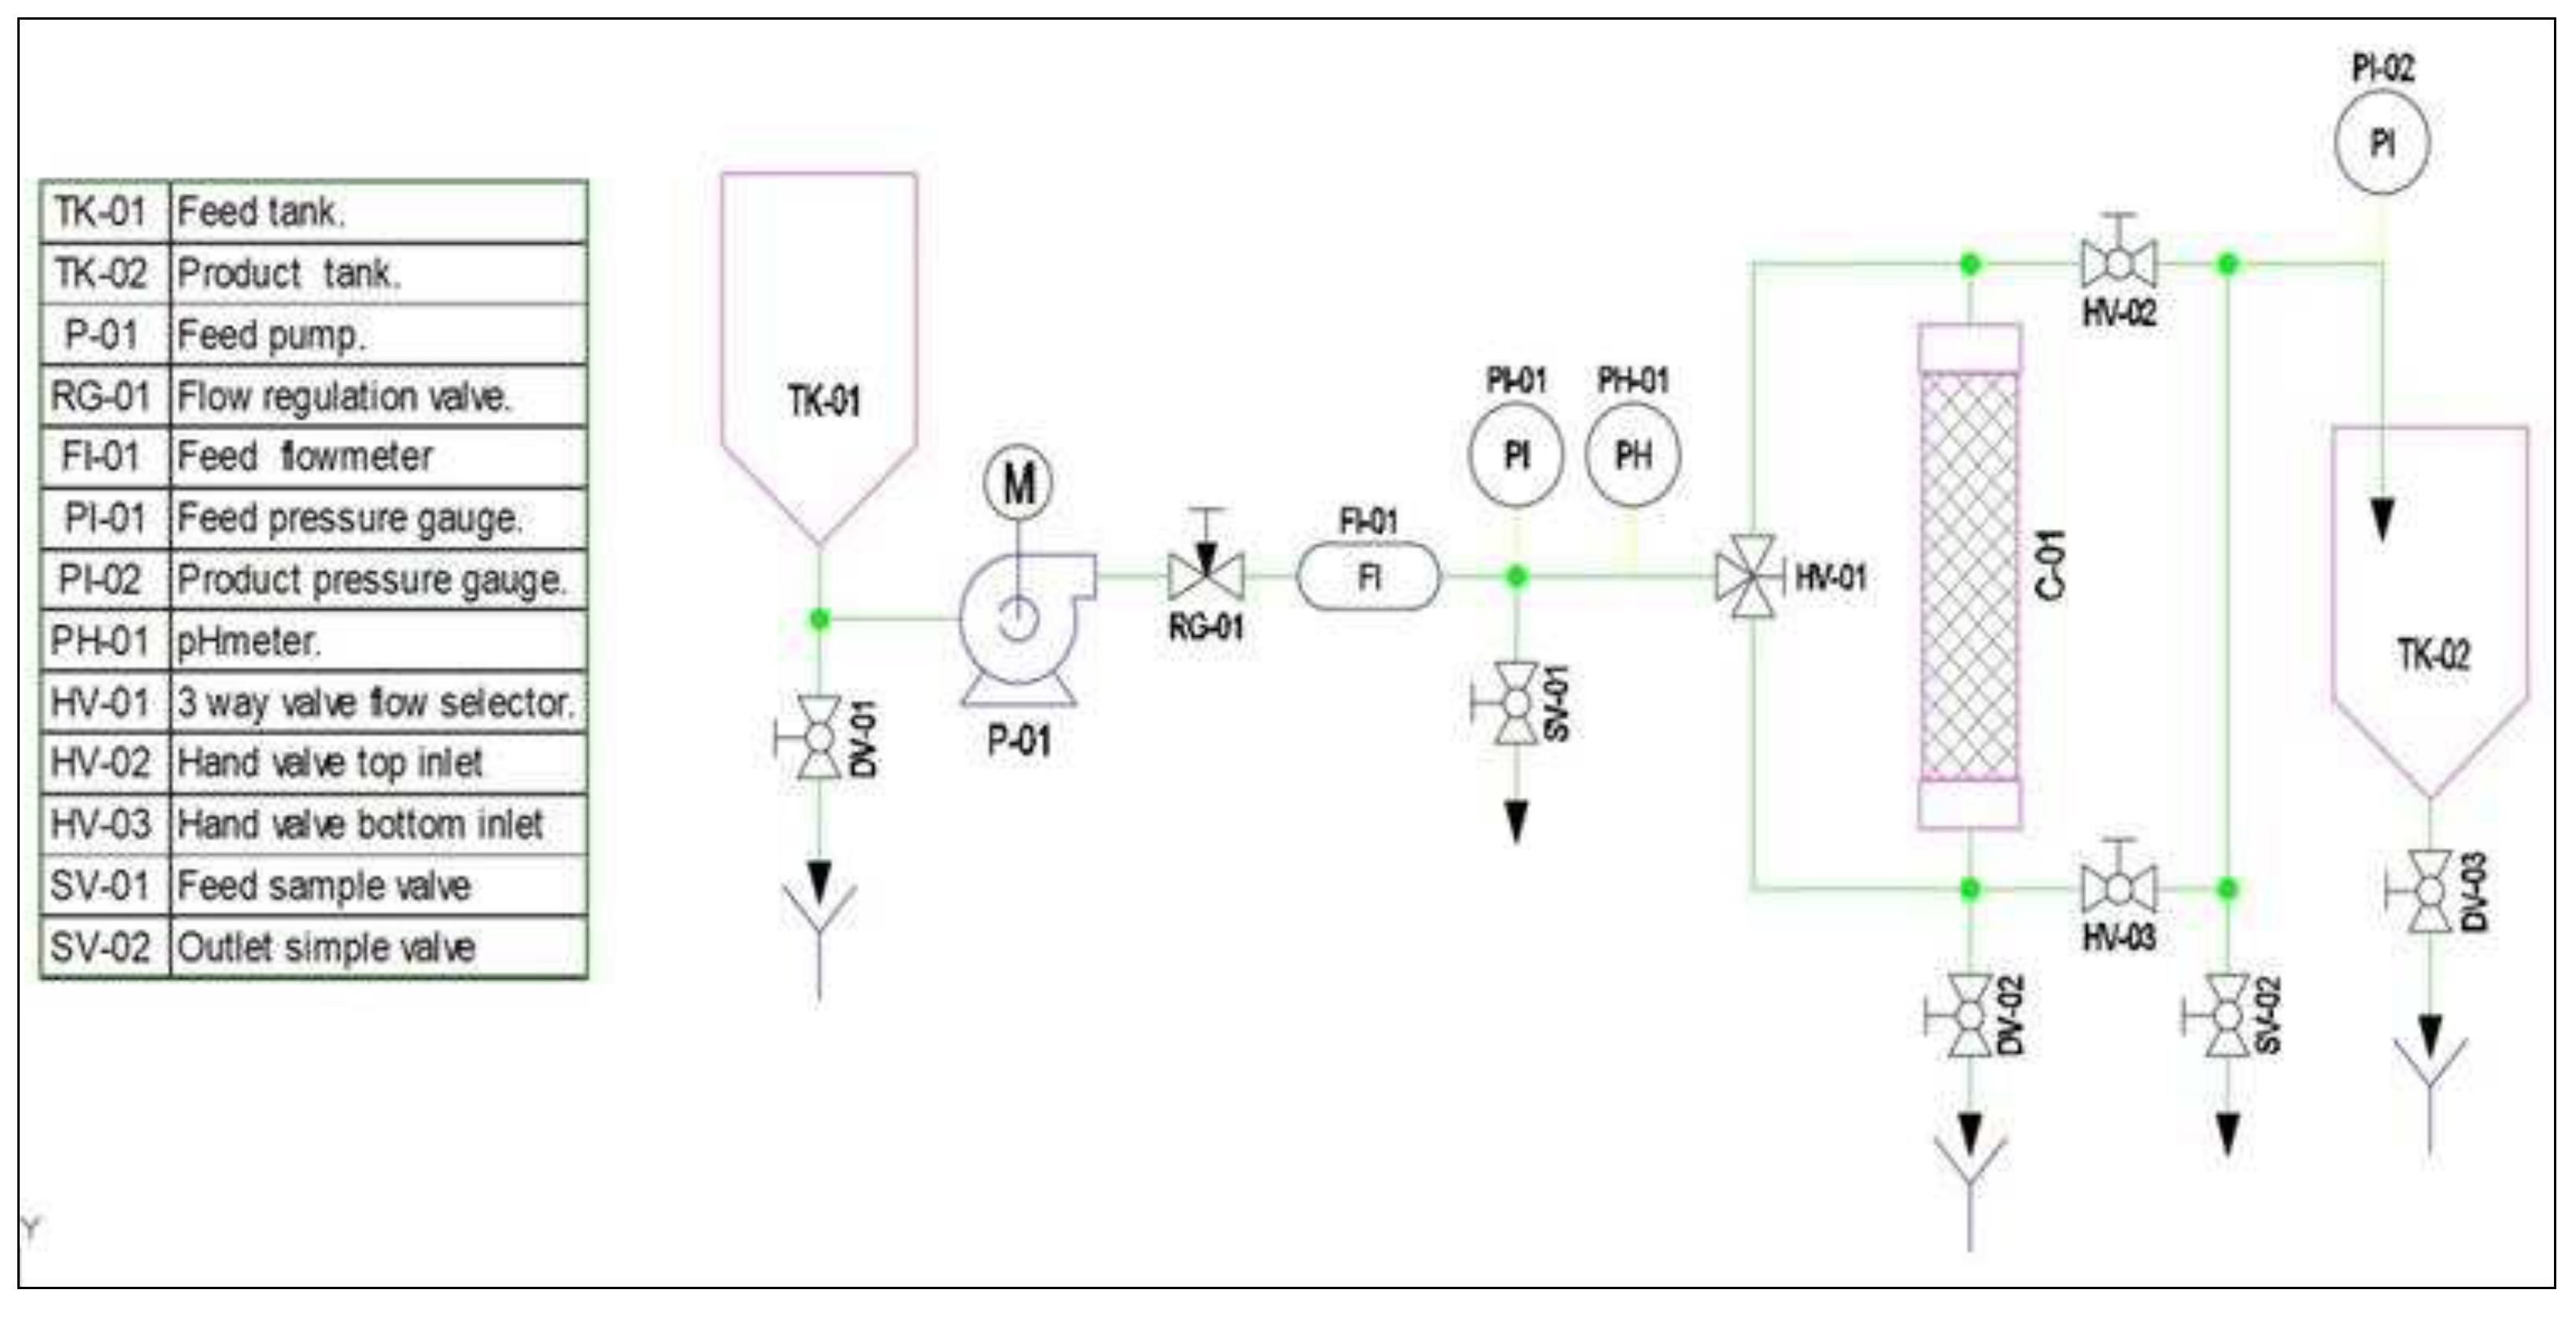
The pilot-plant laboratory scale prototype (PPLSP) was built to ascertain the performances of synthesized EPI-β-CDs polymer in continuous way (Figure 5) in hereafter studies.
This PPLSP technological system, consisting of two 50-liter capacity containers named TK-01 and TK-02; a self-priming polypropylene diaphragm pump P-01, an AISI 316 stainless steel needle valve RG-01; an in-line flow meter FI-01, two pressure gauges, at inlet PI-01 and output PI-02 of the column, a pH meter PH-01, a Ø90 mm adsorption column C-01 to be filled with EPI-β-CDs adsorbent polymer, three-way valve flow selector HV-01 and two hand valves at top HV-02 and bottom HV-03 inlet, two sample valves for flow feed SV-01 and flow outlet SV-01.
Since the prototype will be intended to operate under continuous flows, the adsorbent polymer should be properly regenerated when lost their capacity, passing through a desorbing solution, to be used repeatedly for the removal of PhACs (Figure 6).
For desorption, the following additional elements: two new 50-liter tanks TK-03 and TK-04; a self-priming polypropylene diaphragm pump P-02, an AISI 316 stainless steel needle valve RG-02; and one in-line flow meter FI-02, were included.
Figure 5. Flow chart of the designed pilot-plant laboratory scale prototype EPI-β-CDs polymer adsorption.
Preprints 93653 g005
Figure 6. Flow chart of the designed pilot-plant laboratory scale prototype EPI-β-CDs polymer desorption.
Preprints 93653 g006

4. Conclusions

The current study contributes to the efforts in understanding the interaction of furosemide and hydrochlorothiazide with EPI-β-CDs insoluble polymers (particle sizes between 100 and 300 μm), to design a lab scale prototype prediction of continuous adsorption breakthrough from batch assay data.
The experimental data followed the pseudo 2nd and intraparticle diffusion models. Adsorption occurred onto heterogeneous surfaces according to the three isotherms analyzed. The isotherm models refer a stronger adsorption and higher capacity of EPI-β-CDs polymer for the furosemide diuretic (1.282 mg/g) compared to hydrochlorothiazide (1.282 mg/g) by considering the number of PhAC mg per g of adsorbent polymer.
The adsorption was exergonic according to the Gibbs free energy results, which indicates the spontaneity of this adsorption process. The polymer demonstrated enhanced reusability, maintaining 90% of its capacity through multiple cycles of loading and desorption for both diuretics. This aligns well with the principles of the circular economy.
The qmax, density, swelling, particle size, temperature and EPI-β-CDs polymer water solubility values obtained in batch next to input parameters and process steps, were used to identify and understand each of the stages and equipment involved in the build prototype.

Supplementary Materials

The following supporting information can be downloaded at the website of this paper posted on Preprints.org, Figure S1 Absorption spectra of furosemide. Figure S2 (Absorption spectra of hydrochlorothiazide, Table S1. β-CD-EPI-Fe polymer kinetic parameters (pseudo 1st, pseudo 2nd and intraparticle diffusion models). Table S2. On/off positions of the valves when working co-current flow. Table S3. On/off positions of the valves when working counter-current flow. Table S4. On/off positions of the valves to carry out the desorption process.

Author Contributions

The authors who sign the following manuscript have made significant contributions, allowing achieving the set objectives: E.N.-D. and J.A.G. were responsible for the conception, design and assessment of the work. In addition, substantively revised and corrected the manuscript previous remission; A.T.H.-C. carried out the theory design of pilot prototype. M.I.R.-L. and T.G-M. carried out epichlorohydrin-β-cyclodextrin polymer preparation; the adsorption experiments and interpretation of the results; J. A.P and N.V. were in charge of accomplish the adsorption kinetics and interpretation of adsorption isotherm models to know the interaction of the PhACs with the polymer adsorbent, also participating in the manuscript writing

Funding

This research was supported by the European project “CLEANUP” (Validation of adsorbent materials and advanced oxidation techniques to remove emerging pollutants in treated wastewater, LIFE 16 ENV/ES/000169).

Conflicts of Interest

The authors declare no conflict of interest.

References

  1. Liu, J.; Yang, H.; Gosling, S.N.; Kummu, M.; Flörke, M.; Pfister, S.; et al. Water scarcity assessments in the past, present, and future. Earth’s Future. 2017, 5, 545–559. [Google Scholar] [CrossRef] [PubMed]
  2. He, C.; Liu, Z.; Wu, J.; Pan, X.; Fang, Z.; Li, J.; et al. Future global urban water scarcity and potential solutions. Nature Communications. 2021, 12, 4667. [Google Scholar] [CrossRef] [PubMed]
  3. European Parliament. Directive 2000/60/EC of the European Parliament and of the Council of 23 October 2000 establishing a framework for Community action in the field of water policy. Official Journal of the European Communities 2000, 327, 1–72. Available online: https://eur-lex.europa.eu/eli/dir/2000/60/oj.
  4. European Commission. Directive 2013/39/EU of the European Parliament and of the Council of 12 August 2013 amending Directives 2000/60/EC and 2008/105/EC as regards priority substances in the field of water policy. Official Journal of the European Community 2013, 1–17. Available online: https://eur-lex.europa.eu/LexUriServ/LexUriServ.do?uri=OJ:L:2013:226:0001:0017:en:PDF.
  5. World Health Organization. State of the World’s Sanitation: An Urgent Call to Transform Sanitation for Better Health, Environments, Economies and Societies. New York (NY): United Nations Children’s Fund (UNICEF) and the World Health Organization. 2020. Available online: https://www.who.int/publications/i/item/9789240014473.
  6. Lopez-Pacheco, I.Y.; Silva-Nunez, A.; Salinas-Salazar, C.; Arevalo-Gallegos, A.; Lizarazo-Holguin, L.A.; Barcelo, D.; et al. Anthropogenic contaminants of high concern: Existence in water resources and their adverse effects. Science of the Total Environment. 2019, 690, 1068–1088. [Google Scholar] [CrossRef] [PubMed]
  7. Sauve, S.; Desrosiers, M. A review of what is an emerging contaminant. Chemistry Central Journal. 2014, 8, 15. [Google Scholar] [CrossRef] [PubMed]
  8. Petrie, B.; Barden, R.; Kasprzyk-Hordern, B. A review on emerging contaminants in wastewaters and the environment: current knowledge, understudied areas and recommendations for future monitoring. Water Research. 2015, 7, 3–27. [Google Scholar] [CrossRef] [PubMed]
  9. Geissen, V.; Mol, H.; Klumpp, E.; Umlauf, G.; Nadal van der Ploeg, M.; et al. Emerging pollutants in the environment: A challenge for water resource management. International Soil Water Conservation Research. 2015, 3, 57–65. [Google Scholar] [CrossRef]
  10. Council Directive 91/271/EEC of 21 May 1991 concerning urban waste-water treatment. Official Journal of the European Communities 1991. Available online: https://eur-lex.europa.eu/legal-content/EN/TXT/PDF/?uri=CELEX:31991L0271.
  11. Crini, G.; Lichtfouse, E. Advantages and disadvantages of techniques used for wastewater treatment. Environmental Chemistry Letters. 2019, 17, 145–155. [Google Scholar] [CrossRef]
  12. Choudri, B.S.; Al-Awadhi, T.; Charabi, Y.; Al-Nasiri, N. Wastewater treatment, reuse, and disposal-associated effects on environment and health. Water Environment Research. 2020, 92, 1595–1602. [Google Scholar] [CrossRef] [PubMed]
  13. Foroutan, R.; Mohammadi, R.; Farjadfard, S.; Esmaeili, H.; Saberi, M.; Sahebi, S.; Dobaradaran, S.; Ramavandi, B. Characteristics and performance of Cd, Ni, and Pb bio-adsorption using Callinectes sapidus biomass: real wastewater treatment. Environmental Science and Pollution Research. 2019, 26, 6336–6347. [Google Scholar] [CrossRef] [PubMed]
  14. Fakhri, V.; Jafari, A.; Vahed, F.L.; Su, C.H.; Pirouzfar, V. Polysaccharides as eco-friendly bio-adsorbents for wastewater remediation: Current state and future perspective. Journal of Water Process Engineering. 2023, 54, 103980. [Google Scholar] [CrossRef]
  15. Murcia-Salvador, A.; Pellicer, J.A.; Fortea, M.I.; Gómez-López, V.M.; Rodríguez-López, M.I.; Núñez-Delicado, E.; Gabaldón, J.A. Adsorption of Direct Blue 78 using chitosan and cyclodextrins as adsorbents. Polymers 2019, 11, 1003. [Google Scholar] [CrossRef] [PubMed]
  16. Duchêne, D.; Bochot, A. Thitry years with cyclodextrins. International Journal of Pharmaceutics. 2016, 514, 58–72. [Google Scholar] [CrossRef] [PubMed]
  17. Crini, G. Review: a history of cyclodextrins. Chemical Reviews. 2014, 114, 10940–10975. [Google Scholar] [CrossRef]
  18. Jansook, P.; Ogawa, N.; Loftsson, T. Cyclodextrins: structure, physicochemical properties and pharmaceutical applications. International Journal of Pharmaceutics. 2018, 535, 272–284. [Google Scholar] [CrossRef] [PubMed]
  19. González-Louzao, R.; Lucas-Abellán, C.; Pérez-Sánchez, H.; Cerón-Carrasco, J.P.; Gabaldón, J.A.; López-Miranda, S.; Yañez-Gascón, M.J.; Asín-Lorca, M.; Núñez-Delicado, E. Encapsulation of finasteride with native and modified γ-cyclodextrins. Extensive characterization of the complexes. International Journal of Pharmaceutics. 2020, 587, 119619. [Google Scholar] [CrossRef]
  20. Tian, B.; Hua, S.; Tian, Y.; Jiayue, L. Cyclodextrin-based adsorbents for the removal of pollutants from wastewater: a review. Environmental Science and Polutation Research. 2021, 28, 1317–1340. [Google Scholar] [CrossRef] [PubMed]
  21. Crini, G. Cyclodextrin–epichlorohydrin polymers synthesis, characterization and applications to wastewater treatment: a review. Environmental Chemistry Letters. 2021, 1–21. [Google Scholar] [CrossRef]
  22. Morin-Crini, N.; Crini, G. Environmental applications of water-insoluble β-cyclodextrin–epichlorohydrin polymers. Progress in Polymer Science. 2013, 38, 344–368. [Google Scholar] [CrossRef]
  23. Zhao, F.; Repo, E.; Yin, D.; Chen, L.; Kalliola, S.; Tang, J.; Iakovleva, E.; Tam, C.K.; Sillanpää, M. One-pot synthesis of trifunctional chitosan-EDTA-β-cyclodextrin polymer for simultaneous removal of metals and organic micropollutants. Scientific Reports. 2017, 7, 1–14. [Google Scholar] [CrossRef] [PubMed]
  24. Karpkird, T.; Manaprasertsak, A.; Penkitti, A.; Sinthuvanich, C.; Singchuwong, T.; Leepasert, T. A novel chitosan-citric acid crosslinked beta-cyclodextrin nanocarriers for insoluble drug delivery. Carbohydrate Research. 2020, 498, 108184. [Google Scholar] [CrossRef]
  25. Rahman, N.; Nasir, M. Effective removal of acetaminophen from aqueous solution using Ca (II)-doped chitosan/β-cyclodextrin composite. Journal of Molecular Liquids. 2020, 301, 112454. [Google Scholar] [CrossRef]
  26. Alsbaiee, A.; Smith, B.J.; Xiao, L.; Ling, Y.; Helbling, D.E.; Dichtel, W.R. Rapid removal of organic micropollutants from water by a porous β-cyclodextrin polymer. Nature 2016, 529, 190–194. [Google Scholar] [CrossRef] [PubMed]
  27. Rizzi, V.; Gubitosa, J.; Signorile, R.; Fini, P.; Cecone, C.; Matencio, A.; Trotta, F.; Cosma, P. Cyclodextrin nanosponges as adsorbent material to remove hazardous pollutants from water: The case of ciprofloxacin. Chemical Engineering Journal. 2021, 411, 128514. [Google Scholar] [CrossRef]
  28. Chen, B.; Chen, S.; Zhao, H.; Liu, Y.; Long, F.; Pan, X. A versatile β-cyclodextrin and polyethyleneimine bi-functionalized magnetic nanoadsorbent for simultaneous capture of methyl orange and Pb (II) from complex wastewater. Chemosphere. 2019, 216, 605–616. [Google Scholar] [CrossRef]
  29. Sikder, M.T.; Rahman, M.M.; Jakariya, M.; Hosokawa, T.; Kurasaki, M.; Saito, T. Remediation of water pollution with native cyclodextrins and modified cyclodextrins: A comparative overview and perspectives. Chemical Engineering Journal. 2019, 355, 920–941. [Google Scholar] [CrossRef]
  30. Samuel, M.S.; Selvarajan, E.; Subramaniam, K.; Mathimani, T.; Seethappan, S.; Pugazhendhi, A. Synthesized β-cyclodextrin modified graphene oxide (β-CD-GO) composite for adsorption of cadmium and their toxicity profile in cervical cancer (HeLa) cell lines. Process Biochemistry. 2020, 93, 28–35. [Google Scholar] [CrossRef]
  31. Semeraro, P.; Gabaldón, J.; Fini, P.; Núñez-Delicado, E.; Pellicer, J.A.; Rizzi, V.; Cosma, P. Removal of an azo textile dye from wastewater by cyclodextrin-epichlorohydrin polymers; IntechOpen: London, UK, 2018; Volume 303. [Google Scholar]
  32. Pellicer, J.A.; Rodríguez-López, M.I.; Fortea, M.I.; Hernández, J.A.; Lucas-Abellán, C.; Mercader-Ros, M.T.; Serrano-Martínez, A.; Núñez-Delicado, E.; Cosma, P.; Fini, P.; Franco, E. Removing of Direct Red 83: 1 using α-and HP-α-CDs polymerized with epichlorohydrin: Kinetic and equilibrium studies. Dyes and Pigments. 2018, 149, 736–746. [Google Scholar] [CrossRef]
  33. Liu, J.; Zhang, C.; Zhang, S.; Yu, H.; Xie, W. A versatile β-cyclodextrin functionalized silver nanoparticle monolayer for capture of methyl orange from complex wastewater. Chinese Chemical Letters. 2020, 31, 539–542. [Google Scholar] [CrossRef]
  34. Romita, R.; Rizzi, V.; Semeraro, P.; Gubitosa, J.; Gabaldón, J.A.; Gorbe MI, F.; Gómez, V.M.; Cosma, P.; Fini, P. Operational parameters affecting the atrazine removal from water by using cyclodextrin based polymers as efficient adsorbents for cleaner technologies. Environmental Technology & Innovation. 2019, 16, 100454. [Google Scholar]
  35. Liu, G.; Li, L.; Xu, D.; Huang, X.; Xu, X.; Zheng, S.; Zhang, Y.; Lin, H. Metal–organic framework preparation using magnetic graphene oxide–β-cyclodextrin for neonicotinoid pesticide adsorption and removal. Carbohydrate Polymers. 2017, 175, 584–591. [Google Scholar] [CrossRef] [PubMed]
  36. Liu, H.; Cai, X.; Wang, Y.; Chen, J. Adsorption mechanism-based screening of cyclodextrin polymers for adsorption and separation of pesticides from water. Water Research. 2011, 45, 3499–3511. [Google Scholar] [CrossRef] [PubMed]
  37. Gómez-Morte, T.; Gómez-López, V.M.; Lucas-Abellán, C.; Martínez-Alcalá, I.; Ayuso, M.; Martínez-López, S.; Montemuro, N.; Pérez, S.; Barceló, D.; Fini p Cosma, P.; Cerón, J.P.; Forte, M.I.; Núñez-Delicado, E.; Gabaldón, J.A. Removal and toxicity evaluation of a diverse group of drugs from water by a cyclodextrin polymer/pulsed light system. Journal of Hazardous Materials. 2021, 402, 123504. [Google Scholar] [CrossRef] [PubMed]
  38. Fenyvesi, É.; Barkács, K.; Gruiz, K.; Varga, E.; Kenyeres, I.; Záray, G.; Szente, L. Removal of hazardous micropollutants from treated wastewater using cyclodextrin bead polymer–A pilot demonstration case. Journal of Hazardous Materials. 2020, 383, 121181. [Google Scholar] [CrossRef] [PubMed]
  39. Utzeri, G.; Matias, P.M.; Murtinho, D.; Valente, A.J. Cyclodextrin-based nanosponges: Overview and opportunities. Frontiers in Chemistry. 2022, 10. [Google Scholar] [CrossRef] [PubMed]
  40. Pellicer, J.; Rodríguez-López, M.; Fortea, M.; Lucas-Abellán, C.; Mercader-Ros, M.; López-Miranda, S.; Gómez-López, V.; Semeraro, P.; Cosma, P.; Fini, P.; et al. Adsorption Properties of β- and Hydroxypropyl-β-Cyclodextrins Cross-Linked with Epichlorohydrin in Aqueous Solution. A Sustainable Recycling Strategy in Textile Dyeing Process. Polymers 2019, 11, 252. [Google Scholar] [CrossRef] [PubMed]
  41. Morin-Crini, N.; Winterton, P.; Fourmentin, S.; Wilson, L.D.; Fenyvesi, E.; Crini, G. Water-insoluble β-cyclodextrin–epichlorohydrin polymers for removal of pollutants from aqueous solutions by sorption processes using batch studies: A review of inclusion mechanisms. Progress in Polymer Science. 2018, 78, 1–23. [Google Scholar] [CrossRef]
  42. Hemine, K.; Łukasik, N.; Gazda, M.; Nowak, I. β-cyclodextrin-containing polymer based on renewable cellulose resources for effective removal of ionic and non-ionic toxic organic pollutants from water. Journal of Hazardous Materials. 2021, 2021 418, 126286. [Google Scholar] [CrossRef]
  43. Crini, G.; Gimbert, F.; Robert, C.; Martel, B.; Adam, O.; Morin-Crini, N.; De Giorgi, F.; Badot, P.-M. The Removal of Basic Blue 3 from Aqueous Solutions by Chitosan-Based Adsorbent: Batch Studies. Journal of Hazardous Materials. 2008, 153, 96–106. [Google Scholar] [CrossRef] [PubMed]
  44. Yadav, S.; Asthana, A.; Singh, A.K.; Chakraborty, R.; Vidya, S.S.; Susan MA, B.H.; Carabineiro, S.A. Adsorption of cationic dyes, drugs and metal from aqueous solutions using a polymer composite of magnetic/β-cyclodextrin/activated charcoal/Na alginate: Isotherm, kinetics and regeneration studies. Journal of Hazardous Materials. 2021, 409, 124840. [Google Scholar] [CrossRef] [PubMed]
  45. Fan, H.-T.; Shi, L.-Q.; Shen, H.; Chen, X.; Xie, K.-P. Equilibrium, Isotherm, Kinetic and Thermodynamic Studies for Removal of Tetracycline Antibiotics by Adsorption onto Hazelnut Shell Derived Activated Carbons from Aqueous Media. RSC Advances. 2016, 6, 109983–109991. [Google Scholar] [CrossRef]
  46. Hu, X.J.; Wang, J.S.; Liu, Y.G.; Li, X.; Zeng, G.M.; Bao, Z.L.; Zeng, X.-X.; Chen, A.W.; Long, F. Adsorption of chromium (VI) by ethylenediamine-modified cross-linked magnetic chitosan resin: isotherms, kinetics and thermodynamics. Journal of Hazardous Materials. 2011, 185, 306–314. [Google Scholar] [CrossRef] [PubMed]
  47. Zhou, X.; Zhou, X. The Unit Problem in the Thermodynamic Calculation of Adsorption Using the Langmuir Equation. Chemical Engineering Communications. 2014, 201, 1459–1467. [Google Scholar] [CrossRef]
  48. Murcia-Salvador, A.; Pellicer, J.A.; Rodríguez-López, M.I.; Gómez-López, V.M.; Núñez-Delicado, E.; Gabaldón, J.A. Egg By-Products as a Tool to Remove Direct Blue 78 Dye from Wastewater: Kinetic, Equilibrium Modeling, Thermodynamics and Desorption Properties. Materials 2020, 13, 1262. [Google Scholar] [CrossRef] [PubMed]
  49. Crini, G.; Peindy, H.N.; Gimbert, F.; Robert, C. Removal of CI Basic Green 4 (Malachite Green) from Aqueous Solutions by Adsorption Using Cyclodextrin-Based Adsorbent: Kinetic and Equilibrium Studies. Separation and Purification Technology. 2007, 53, 97–110. [Google Scholar] [CrossRef]
  50. Lagergren, S. Zur Theorie Der Sogenannten Adsorption Geloster Stoffe. K. Sven. Vetensk. Handl. 1898, 24, 1–39. [Google Scholar]
  51. Ho, Y.S.; Mckay, G. Kinetic Models for the Sorption of Dye from Aqueous Solution by Wood. Process Safety and Environmental Protection. 1998, 76, 183–191. [Google Scholar] [CrossRef]
  52. Ho, Y.-S. Review of Second-Order Models for Adsorption Systems. ChemInform. 2006, 37. [Google Scholar]
  53. Weber, W.J., Jr.; Morris, J.C. Kinetics of Adsorption on Carbon from Solution. Journal of the Sanitary Engineering Division. 1963, 89, 31–59. [Google Scholar] [CrossRef]
  54. Freundlich, H.M.F. Over the Adsorption in Solution. Journal of Physical Chemistry. 1906, 57, 1100–1107. [Google Scholar]
  55. Langmuir, I. The Constitution and Fundamental Properties of Solids and Liquids. Part I. Solids. Journal of the American Chemical Society. 1916, 38, 2221–2295. [Google Scholar] [CrossRef]
  56. Temkin, M.I. Kinetics of Ammonia Synthesis on Promoted Iron Catalysts. Acta Physiochimica. URSS 1940, 12, 327–356. [Google Scholar]
  57. Rodríguez-López, M.I.; Pellicer, J.A.; Gómez-Morte, T.; Auñón, D.; Gómez-López, V.M.; Yáñez-Gascón, M.J.; Gil-Izquierdo, Á.; Cerón-Carrasco, J.P.; Crini, G.; Núñez-Delicado, E.; Gabaldón, J.A. Removal of an azo dye from wastewater through the use of two technologies: Magnetic cyclodextrin polymers and pulsed light. International Journal of Molecular Sciences. 2022, 23, 8406. [Google Scholar] [CrossRef] [PubMed]
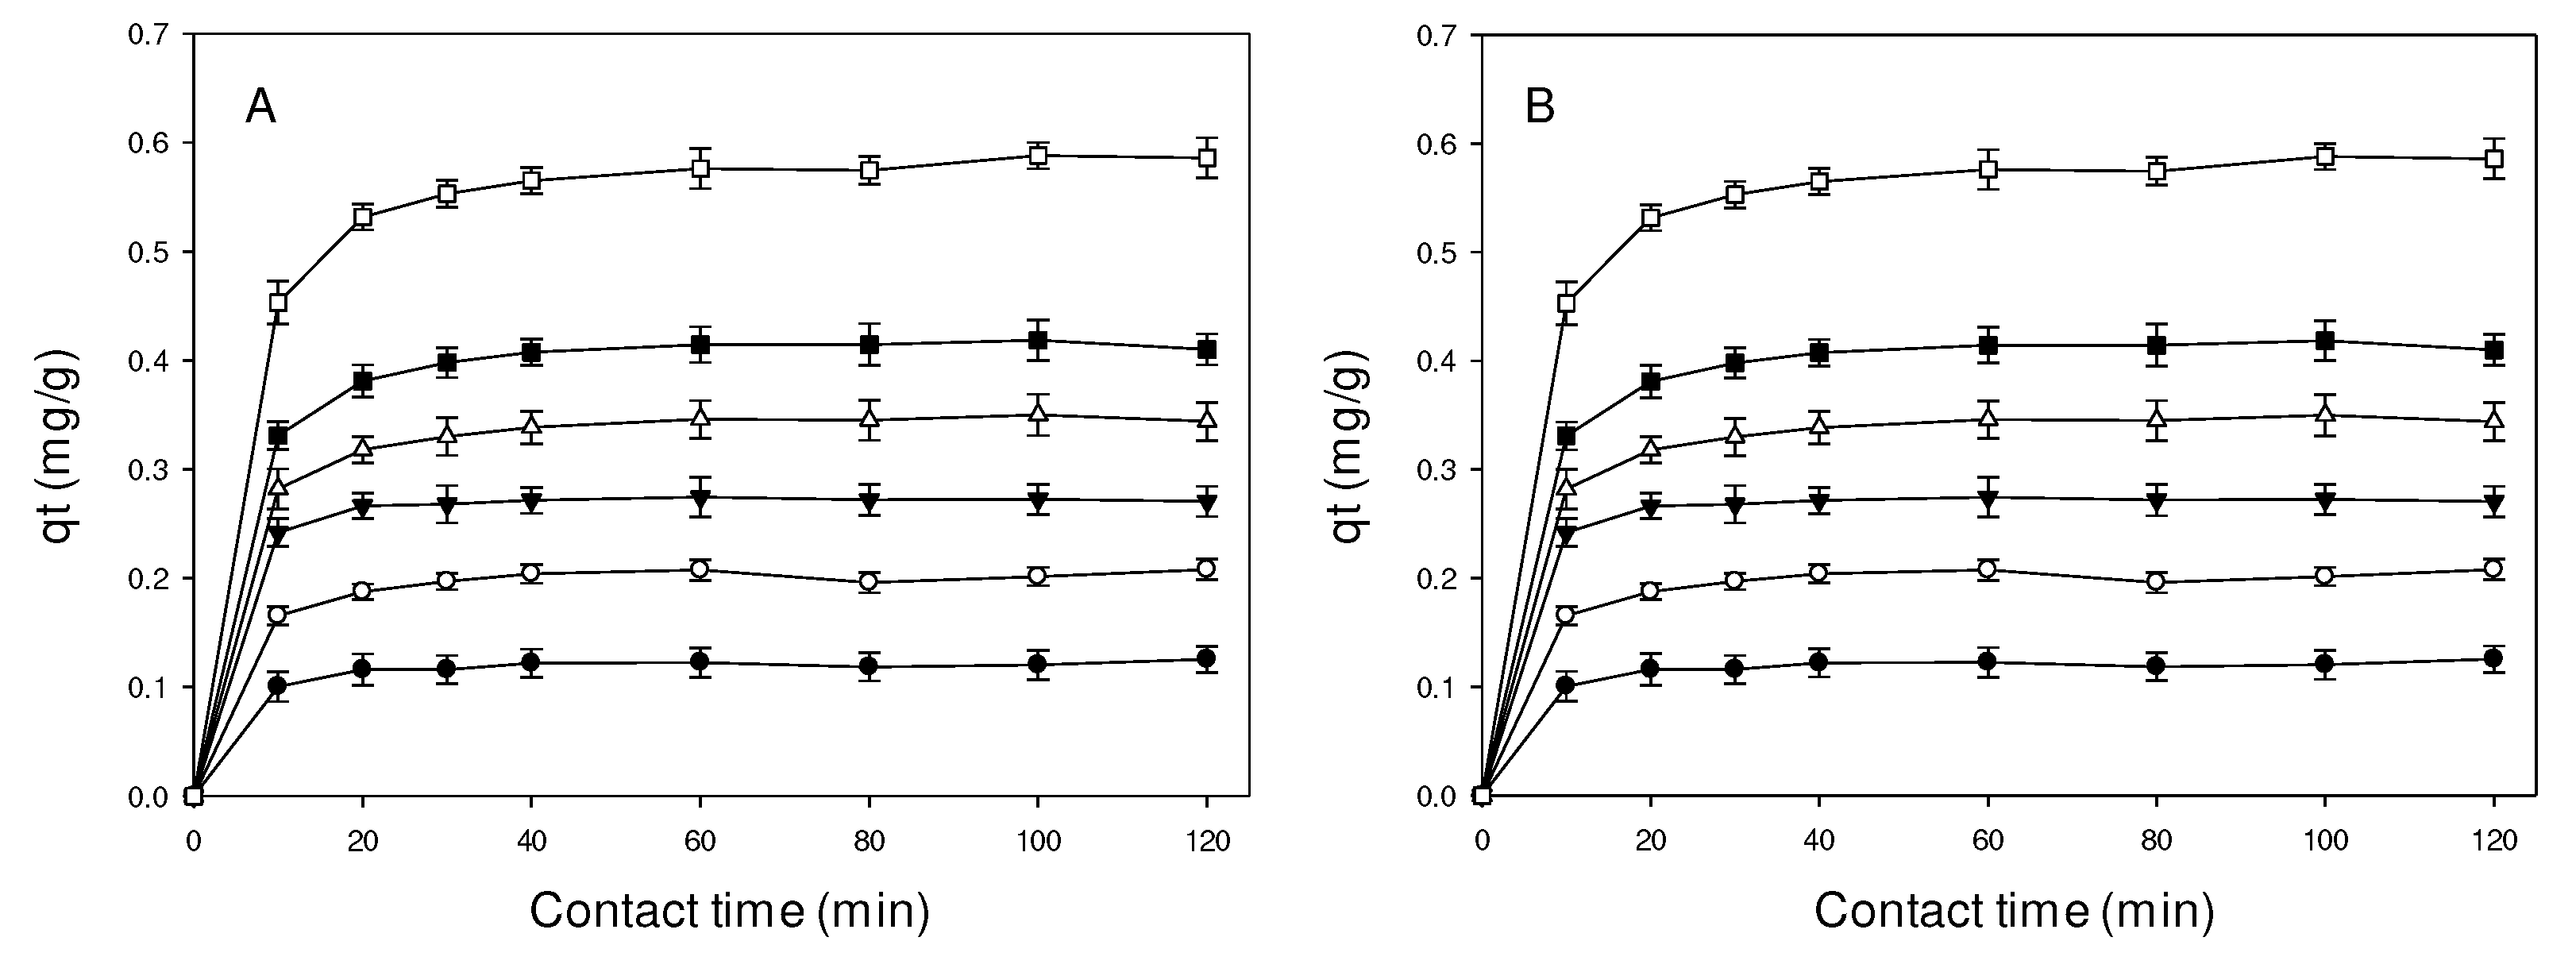
Figure 1. The effect of the time of contact on adsorption capacity of β-CDs-EPI polymer at different concentrations of pharmaceuticals. (A) Furosemide 5.0 mg/L (●), 7.5 mg/L (), 10 mg/L (), 12.5 mg/L (Δ), 15 mg/L (), 20 mg/L (□). (B) Hydrochlorothiazide 5.0 mg/L (●), 7.5 mg/L (), 10 mg/L (), 12.5 mg/L (Δ), 15 mg/L (), 20 mg/L (□). N=3.
Preprints 93653 g001
Figure 2. Kinetic analysis at different concentrations: 5.0 mg/L (●), 7.5 mg/L (), 10 mg/L (), 12.5 mg/L (Δ), 15 mg/L (), 20 mg/L (□) of of pharmaceuticals. Furosemide (A) Pseudo 1st model, (C) Pseudo 2nd model, (E) Intraparticle diffusion mode; Hydrochlorothiazide (B) Pseudo 1st model, (D) Pseudo 2nd model, (F) Intraparticle diffusion mode; N=3.
Preprints 93653 g002
Disclaimer/Publisher’s Note: The statements, opinions and data contained in all publications are solely those of the individual author(s) and contributor(s) and not of MDPI and/or the editor(s). MDPI and/or the editor(s) disclaim responsibility for any injury to people or property resulting from any ideas, methods, instructions or products referred to in the content.
Copyright: This open access article is published under a Creative Commons CC BY 4.0 license, which permit the free download, distribution, and reuse, provided that the author and preprint are cited in any reuse.
Prerpints.org logo

Preprints.org is a free preprint server supported by MDPI in Basel, Switzerland.

Subscribe

© 2024 MDPI (Basel, Switzerland) unless otherwise stated