1. Introduction
IoT technologies can enhance customer-centricity by providing real-time data and insights that enable businesses to better understand and cater to customer preferences. The use of advanced analytics, can help extract meaningful information from IoT data to improve customer satisfaction, loyalty, and retention [1].
In the realm of IoT, everyday products like shampoo, are not exempt from the transformative potential of connected technologies. Shampoo holds a pivotal role in the daily routines of individuals worldwide. As an essential hygiene product for hair care, it enjoys universal consumption, positioning itself as a quintessential mass-market commodity [2]. IoT can revolutionize the way shampoo manufacturers approach their product. By incorporating IoT sensors and connectivity into shampoo bottles or packages, producers can gain real-time insights into customer usage patterns. These sensors could track factors such as frequency of use, preferred usage times, and even the specific hair types and needs of individual customers, with this wealth of data, companies cannot only better understand and cater to customer preferences but also maximize profitability through more targeted product offerings. The responsibility for translating these IoT-driven into effective marketing campaigns and product innovations still falls upon marketing experts. IoT technologies provide the data, but it is the marketing professionals who can harness this information to create personalized marketing strategies, offer tailored product recommendations, and enhance customer engagement [3].
The concept of customer segmentation, as introduced by Wendell R. Smith in 1956, has been a foundational approach in marketing and business. It offers a structured method for categorizing customers based on specific criteria, which is essential for tailoring marketing strategies and improving customer satisfaction [4]. Data mining is crucial across divers human activities as it uncovers valuable, previously unknown patterns and knowledge (Gupta & Chandra, 2020) [5]. A self-organizing map (SOM) is like a special type of artificial Neural Network (ANN) that simplifies data into easy-to-understand maps. Unlike typical ANNs that fix mistakes, SOM works by having nodes compete and rearrange information. It keeps the original shape of the data while making it simpler to spot patterns. It’s really handy for making complex data easier to visualize. SOM indeed is a popular technique used in data mining for clustering, visualization and dimensionality reduction tasks. SOM can help identify patterns in customer behaviour by analyzing the data generated from IoT devices.
SOM algorithm diverges from traditional biologically inspired neural network models by employing competitive learning, where units vie for dominance, and by preserving topology through a neighborhood function that adjusts weights in parallel [6]. Over the years, various interactions of SOM models have found practical applications across diverse fields, ranging from meteorology and oceanography to finance, bioinformatics, and image retrieval [7]. In IoT, these techniques can be applied to extract valuable insights from a wide range of data sources, making IoT a transformative technology in various domains.
In today’s intricate and competitive business landscape, systematic customer segmentation based on specific criteria enhances customer loyalty and broadens the portfolio of profitable customers, ultimately fostering long-term relationships [8]. Given the colossal volumes of customer data, data mining emerges as potent tool for comprehensive customer behaviour, particularly, in CRM applications [9]. In the context of data mining, clustering methods group data points, such that those within a cluster exhibit greater similarity compared to those in other clusters, typically measured in terms of distance [24].
Furthermore, Artificial Intelligence (AI) techniques, including SOM, Bee Colony, Particle Swarm Optimization (PSO), and Genetic Algorithm (GA), have demonstrated the capability to segment customers effectively. While GA, rooted in evolutionary computing, harnesses processes such as mutation and crossing, its drawback lies in its time-consuming nature and the challenges of converging towards optimal solutions. On the other hand, SOM a neural network-based unsupervised algorithm, relies on a trial-and-error approach but suffers from extended training times [10].
Distinguishing itself from prior research, our study aims to address the following key research questions:
A) Given the competitiveness within the shampoo market, what factors influence customer re-purchase decisions in the context of IoT? and what are their product preferences? Which parameters hold significance for consumers?
B) Do consumer preferences for purchasing shampoo differ when IoT capabilities are introduced?
To unravel these inquiries, we employ cluster analysis, identifying intriguing patterns that can inform marketing strategies for companies in the hair care product market. Our research entails a comprehensive analysis of cutomer preferences across everal dimensions and involve a two-phase modeling approach. In the initial phase, we employ SOM algorithm for segmentation followed by thr utilization of the decision tree methodology in the decond phase. subsequently, we investigate customer behaviour by ranking factors effecting preferences within cluster. This segmentation is critical for understanding customrs baed on their purchasing behaviour. Our study is dedicated to segmenting customers based on their purchasing behaviour and subsequently conducting experimental analysis using SOM to infer insights into customer loyalty and cutomer return.
The remainder of this paper is structured as follows:
Section 2 delve into a literature review on customer segmentation methods, while
Section 3 provides detailed insights into the dataset.
Section 4 and
Section 5 encompass data processing, clustering, experiments and results. Finally,
Section 6 offers a discussion of our findings and outlines future research avenues.
2. Literature Review
Customer segmentation is a widely explored area in market research (Das & Nayak, 2022) [24], typically focusing on categorizing customers based on their preferences or specific requirements. However, this study takes a novel approach by utilizing the concept of Customer Lifetime Value (CLV), offering a more efficient and practical means of segmentation. The research framework developed in this study involves segmenting customers, calculating CLV for each segment, and estimating their future value (Nguyen et. al., 2020) [26]. To achieve this, a two-tier clustering method is employed, leveraging a substantial database of customer transactions.
In a related study conducted by Zadeh et. al., (2011) [11], the authors aimed to segment bank customers based on their behaviors to facilitate the bank’s retention strategies and acquisition efforts. The study utilized a comprehensive database comprising three interconnected tables. The first table contained demographic information, including age, gender, marital status, and other relevant attributes. The second table comprised transaction data, detailing customer transactions, while the third table provided information on bank issued cards. The study combined these attributes with transaction specific details such as transaction type, frequency, service type, bank affiliation, and channel used (e.g ATM, Web, and Terminal). Notably, Zadeh et. al., (2011) categorized these factors based on their profitability, employing SOM to simplify complex high dimensional data. It’s worth noting that the SOM approach involves a trade off between data presentation accuracy and topology preservation quality.
The concept of decision tree, a structure resembling a traditional tree with root nodes, branches, and leaf nodes, is another relevant aspect discussed in the literature. Decision trees are used for attributes testing at internal nodes, branching based on test outcomes, and labeling leaf nodes with class results. Common decision tree algorithms such as ID3, CART and C4.5, are frequently employed in data mining to create homogeneous nodes.
Classification and Regression Trees (CART) was introduced by Breiman et. al., (1984), which was particularly distinctive in its construction of binary trees, with each internal node having precisely two outgoing edges. Splits are determined using the towing criteria, and the resulting tree is pruned using cost-complexity pruning. CART can also incorporate misclassification cots and prior profitability distributions. Notably, it excels in generating regression trees, which predict real numbers rather than classes, minimizing squared prediction errors.
Some recent research such as Mach-Krol & Hadasik (2021) [25] and Hassouna et. al., (2016) [13], sought to compare data mining methods, specifically decision trees and logistic regression, in constructing a customer churn model. The study involved a real-world dataset from and English mobile operator, employing two balanced datasets, one for training with 17 variables and 19,919 customers and another for testing with 17 variables and 15,519 customers. The authors utilized various decision tree algorithms, including CAR, C5.0, and CHAID, for comparison against logistic regression. Evaluation criteria included AUC of the ROC curve, top decile performance, and overall accuracy. Surprisingly, the C5.0 decision tree outperformed other algorithms, including logistic regression, with AUC of 0.763, contradicting earlier findings [14].
Customer segmentation, a critical marketing strategy, aims to group customers based on their shared behaviors, needs, and expectations. This allows businesses to gain deeper insights into their customers and tailor marketing strategies accordingly and maintain more effective Customer Relationship Management (Pynadath et. al., 2023) [26]. In this study, we will develop a predictive model capable of forecasting future customer sales using the proposed segmentation models. Competitive learning, a clustering technique, is among the methods employed to describe customer behavior. Competitive learning identifies artificial representatives closely resembling objects within a specific cluster, with the Kohonen SOM being a notable application of this approach, as initially introduced by Kohonen (1982) [12].
3. The Database
Data was collected within the hair care industry in Tehran, Iran, using an online survey specifically designed to investigate consumer behaviour when in the context of shampoo purchases. The survey was administered through Google Docs and garnered a total of 207 valid responses. The questionnaire was divided into two parts. The first part consisted of general questions that aimed to collect information on participants’ gender, marital status, age, number of family members, employment status, education level, and disposable income. The second part focused on assessing the various factors considered by customers when purchasing shampoo. These consumer characteristics were presented by 17 essential attributes (as illustrated in the table below). Respondents were asked to rate the importance of these factors on a five-point Likert scale, ranging from 1 (indicating very low importance) to 5 (indicating very high importance). The main objective of this research phase was to apply clustering techniques to these variables in order to reveal distinct dimensions of customer references and priorities in the context of shampoo purchases.
Table 1.
Consumer Attributes Influencing Shampoo Purchases.
Table 1.
Consumer Attributes Influencing Shampoo Purchases.
| Question |
Attributes |
| 1 |
Fragrance |
| 2 |
Moisturizing effectiveness |
| 3 |
Cleansing efficacy |
| 4 |
Being-anti-dandruff |
| 5 |
Being-anti-allergic |
| 6 |
Transparency |
| 7 |
Being herbal |
| 8 |
Price |
| 9 |
Brand familiarity |
| 10 |
Volume of content |
| 11 |
Advertising |
| 12 |
Family/friends recommendations |
| 13 |
Seller advice and suggestion |
| 14 |
Lotto draw, prize and discount |
| 15 |
Shampoo container design |
| 16 |
Consistent in quality |
| 17 |
Product variety |
Determining the appropriate number of clusters was the next crucial step. One method for indexing clusters involves using the mean of the attributes used for clustering within each cluster. To achieve this, we conducted the clustering process with options for 2, 3, and 4 clusters, and the results were presented to domain experts for validation. Ultimately, three distinct clusters were identified as the most appropriate.
Three clusters revealed three levels of consumer attitudes: very high importance, medium importance, and low importance. This segmentation of consumer attitudes served as a valuable indicator for market segmentation strategies.
Objective Definition: Drawing from the available data and capabilities of data mining techniques, the research objectives were framed as follows:
a) Customer Segmentation: Using a self-constructed neural network (SOM) to cluster customers based on the importance of factors influencing their product choices during shampoo usage.
b) Customer Classification: Employing the Decision Tree technique to categorize customers based on the factors influencing their purchasing and product usage behavior.
c) Key Factor Identification: Identifying the most influential factors in shampoo purchase among customers.
d) Relative Prioritization: Determining the relative prioritization of these influential factors and analyzing their impact on consumers’ purchasing and consumption decisions.
4. Data Preprocessing and Clustering
In the data preprocessing phase, we carefully curated the dataset by selecting 17 relevant columns out of the initial 22. We also systematically removed all null values and excluded travel records with a duration of 0 between January 2017 and 2018. As a result of these steps, we successfully refined the dataset to a final set of 207 data point with 17 essential attributes, which were subsequently employed for the clustering analysis. The participants distribution in each cluster was as follows: Cluster one 42, Cluste two 106, Cluster three 59.
4.1. Utilizing Self-Organizing Maps (SOM) for Customer Clustering
In this section, we employed SOM, a neural network technique, to cluster customers based on their preferences for shampoo products. The analysis was performed considering three clusters, representing customers seeking product with very high, average, or low importance across the attributes studied. Below is the summary of the clustering results:
Table 2.
Consumer Attribute Cluster Analysis.
Table 2.
Consumer Attribute Cluster Analysis.
| Attributes |
Cluster 1 (High Importance)C-SOM-1-1 |
Cluster 2 (Medium Importance)C-SOM-1-2 |
Cluster 3 (Poor Importance)C-SOM-1-3 |
| Number of Records |
42 |
106 |
59 |
| Fragrance |
3.55 |
3.22 |
2.27 |
| Moisturizing effectiveness |
3.98 |
3.28 |
2.22 |
| Cleansing efficacy |
4.62 |
4.02 |
2.81 |
| Being-anti-dandruff |
4.05 |
3.01 |
2.15 |
| Being-anti-allergic |
4.21 |
3.54 |
2.02 |
| Transparency |
4.14 |
3.55 |
2.34 |
| Being herbal |
4.31 |
3.30 |
2.29 |
| Price |
3.71 |
3.12 |
2.49 |
| Brand familiarity |
4.36 |
3.73 |
2.69 |
| Volume of content |
4.07 |
3.24 |
2.10 |
| Advertising |
3.60 |
2.64 |
1.54 |
| Family/friends recommendation |
3.71 |
3.07 |
2.03 |
| Seller advice and suggestion |
3.64 |
2.56 |
1.90 |
| Lotto draw, prize and discount |
2.95 |
1.52 |
1.19 |
| Shampoo container design |
3.31 |
2.12 |
1.47 |
| Consistency in quality |
4.79 |
4.32 |
3.15 |
| Product variety |
3.95 |
3.19 |
1.86 |
In the context of high-dimensional input spaces, SOM play a crucial role in generating lower-dimensional representation of training data. Let’s denote ‘S’ as the set of training points residing in an n-dimensional input space, while the latent space is defined as (m - 1) dimensional. Within this latent space, we have ‘D’ neurons, represented a D = D1 x … x Dm-1. Each of these neurons, labeled as ‘u’ and ranging from 1 to D, possesses two key attributes.
1. A predefined position in the latent space denoted as zu = (
,… ,), where ∈ {1,···, Di} for i = 1, ··· , m−1.
2. A representation or weight vector, defined as wu = (
,… ,), which resides within the input space.
To illustrate a typical SOM topology, consider
Figure 1. in this example, the input space is n-dimensional, while the latent space is 2-dimensional [15]. The primary objective of SOM is to identify the representation vectors that are embedded within the latent space through the training data.
The SOM learning process initiates with the assignment of randomly selected training from the set ‘S’ to each neuron’s weight vector. These weight vectors are subsequently updated by iteratively considering training points that are in proximity to of them [15].
Figure 1.
An illustration of a 2- dimensional SOM.
Figure 1.
An illustration of a 2- dimensional SOM.
4.2. Assessing Data Clustering Tendency
Before embarking on our experimentation and the application of any clustering technique to our database, it is essential to examine the inherent tendency of the data to form clusters or exhibit similarities among objects. These diverse tendencies must be carefully analyzed, as they influence a company’s decision to select specific customer segments and customize their marketing strategies to align with unique customer needs.
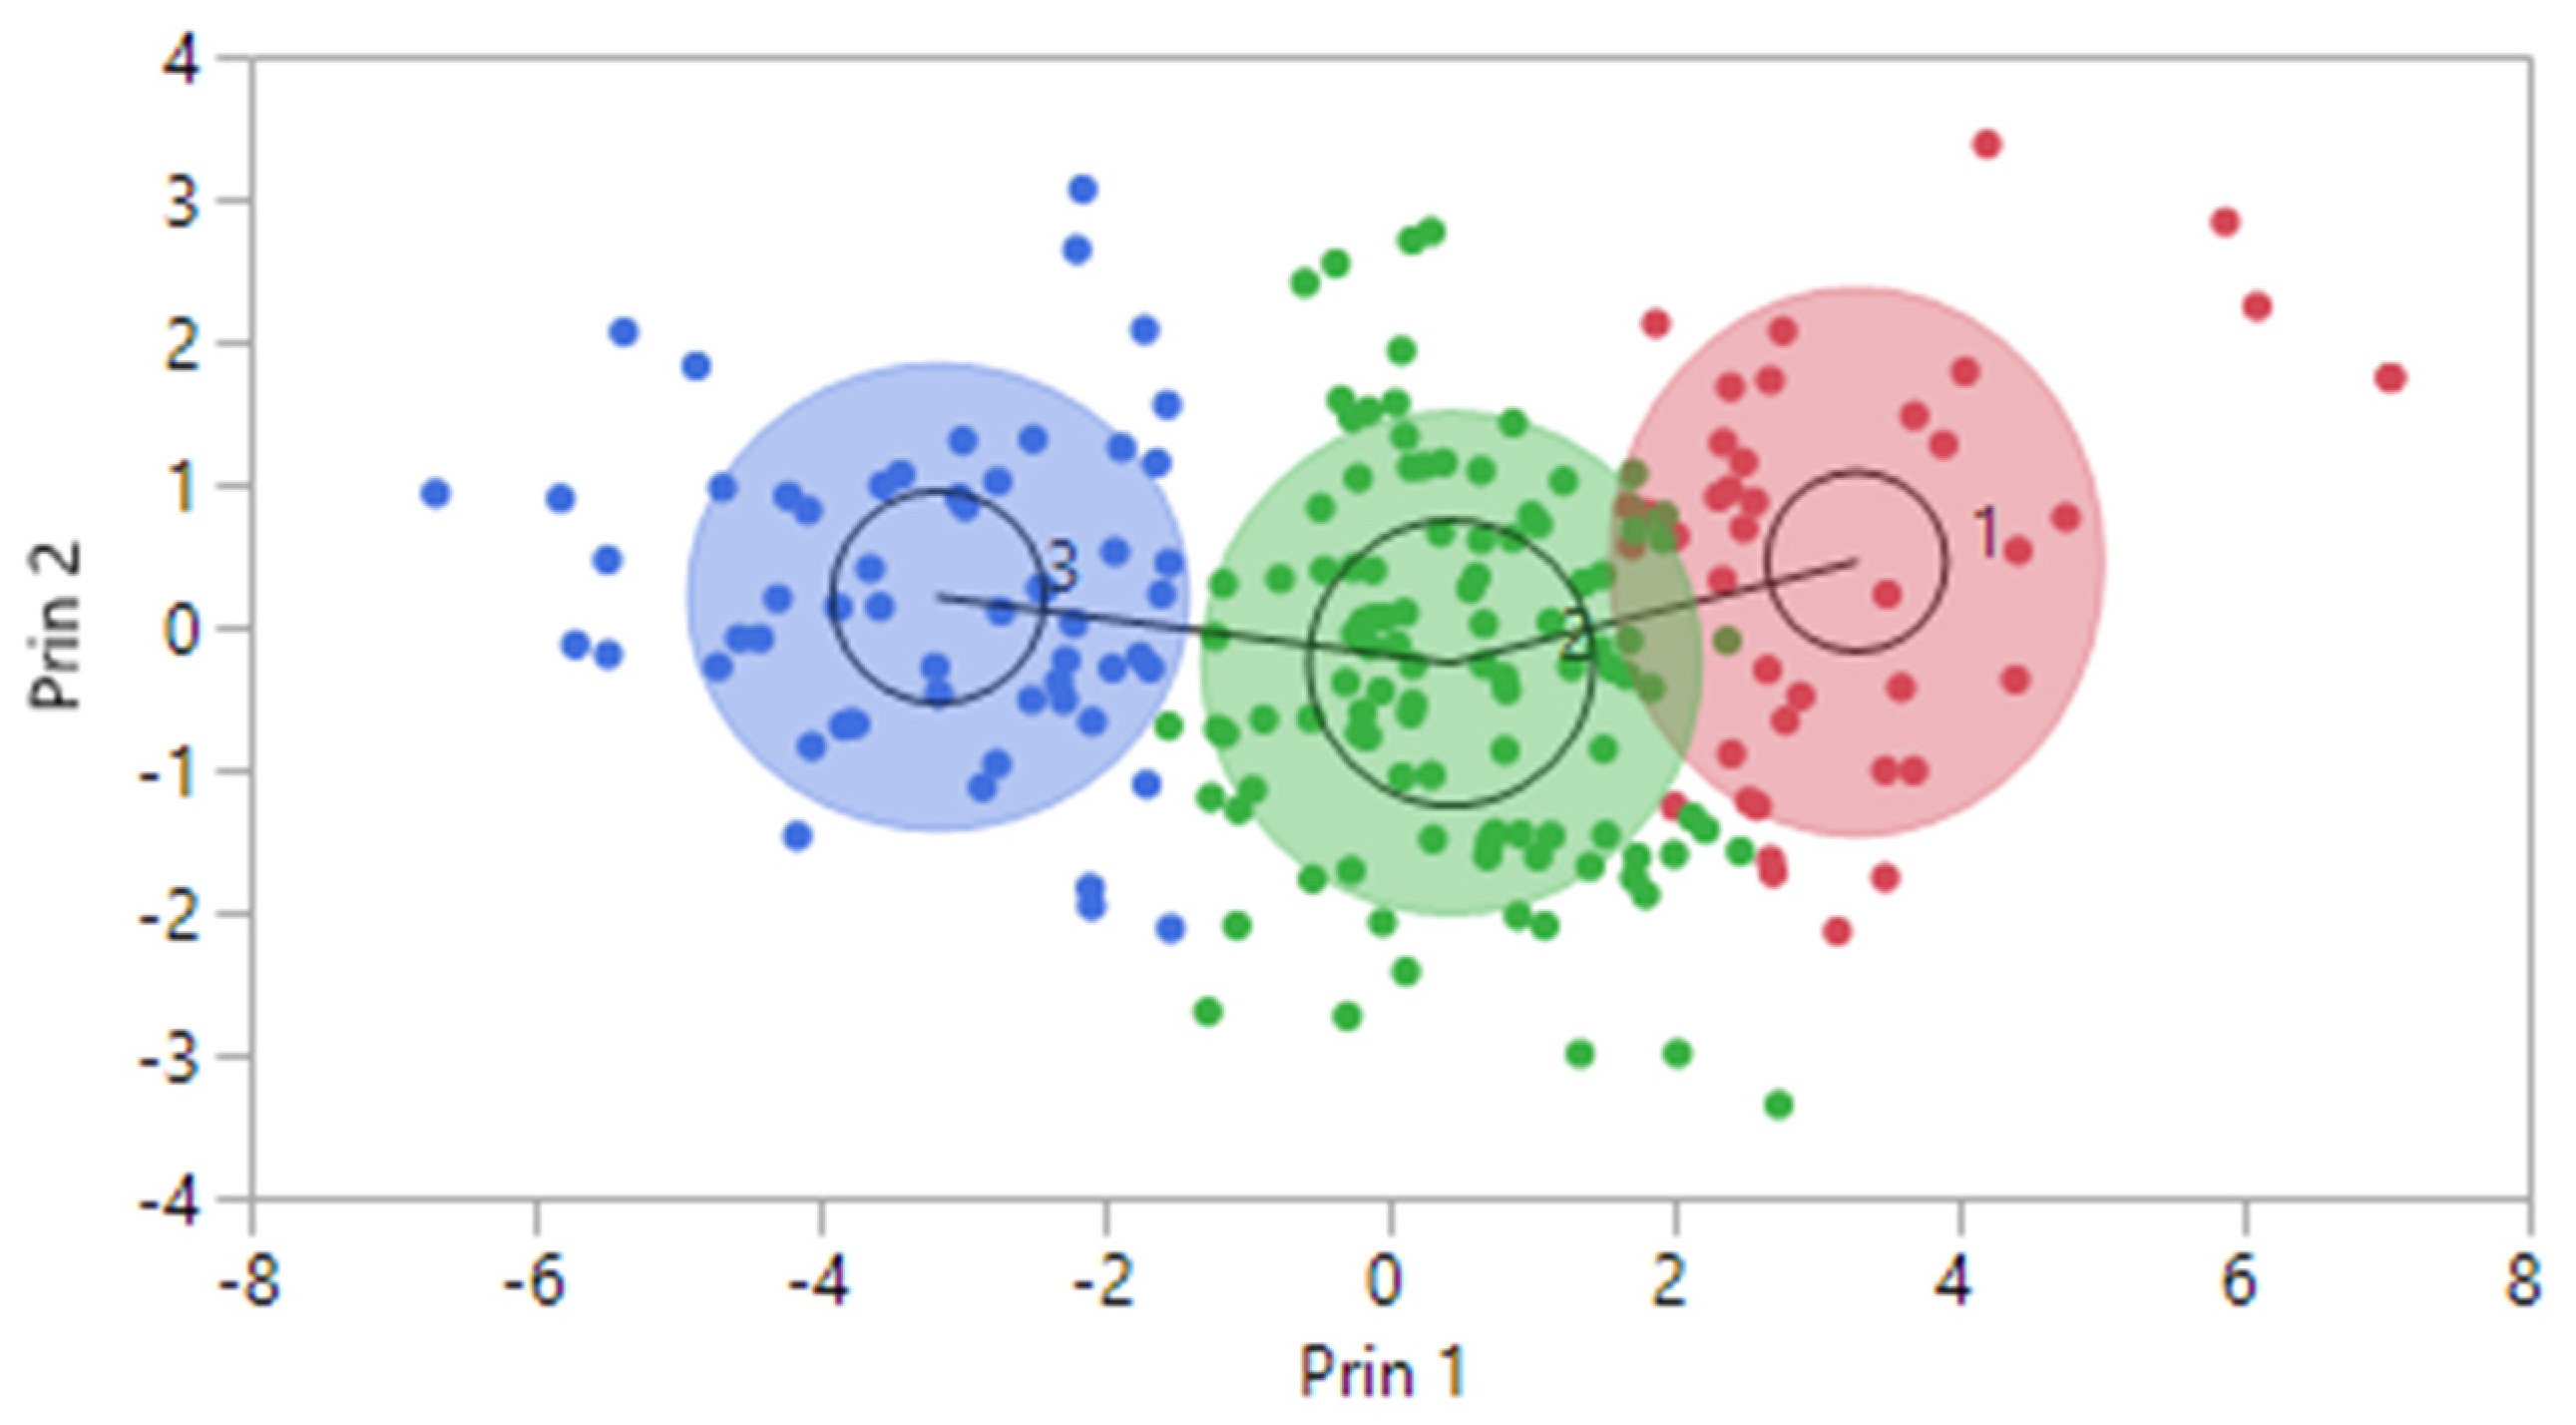
Furthermore, we can visualize the clustering results in a comprehensive two-dimensional representation using dimensions derived from Principal Component Analysis (PCA). In pursuit of this objective, we condensed the 17 purchasing stimulus characteristics utilized in the clustering process by applying PCA to instill essential information into two key dimensions (refer to Figure. 2). Notably, the SOM method, employed in our analysis, possesses the capability to effectively distinguish and delineate clusters within the data, enhancing our understanding of the underlying patterns and groupings.
Figure 2.
Clusters using the Principal Component Analysis-based visualization method.
Figure 2.
Clusters using the Principal Component Analysis-based visualization method.
4.3. Self-Organized Maps (SOM)
Visualization of high -dimensional databases is a complex task, often fraught with challenges due to the sheer number of features and data points involved. In this study, we employ SOM, also known as Kohonen Maps, to simplify the presentation of high dimensional data and explore meaningful relationships within it. SOMs, a form of artificial neural networks, serves as a powerful tool for transforming multidimensional data into a visually intuitive two-dimensional representation, elucidating the intrinsic relationships among data objects.
The fundamental concept underlying SOMs is to map data objects onto a two-dimensional grid of lattice in such a way that their positions reflect their similarity in the original feature space. This not only simplifies the visualization of complex data but also facilitates the clustering of similar data points. By transforming high-dimensional data into a map, we make visualizations more accessible and aesthetically pleasing.
At the core of SOMs lies competitive learning. For each sample vector, weights of the same dimension as the output network (equal to the number of nodes) are initialized randomly. Subsequently, the Euclidean distance, a commonly used metric, is computed between the sample vector and these weights. The node with the minimum distance is declared the winner, effectively representing a cluster of similar objects or a neighborhood. Following the competitive phase is the adaptation phase, where the wights of all neighboring nodes are adjusted. Importantly, the learning rate decreases progressively as a function of training epochs, ensuring a gradual convergence towards the optimal representation of.
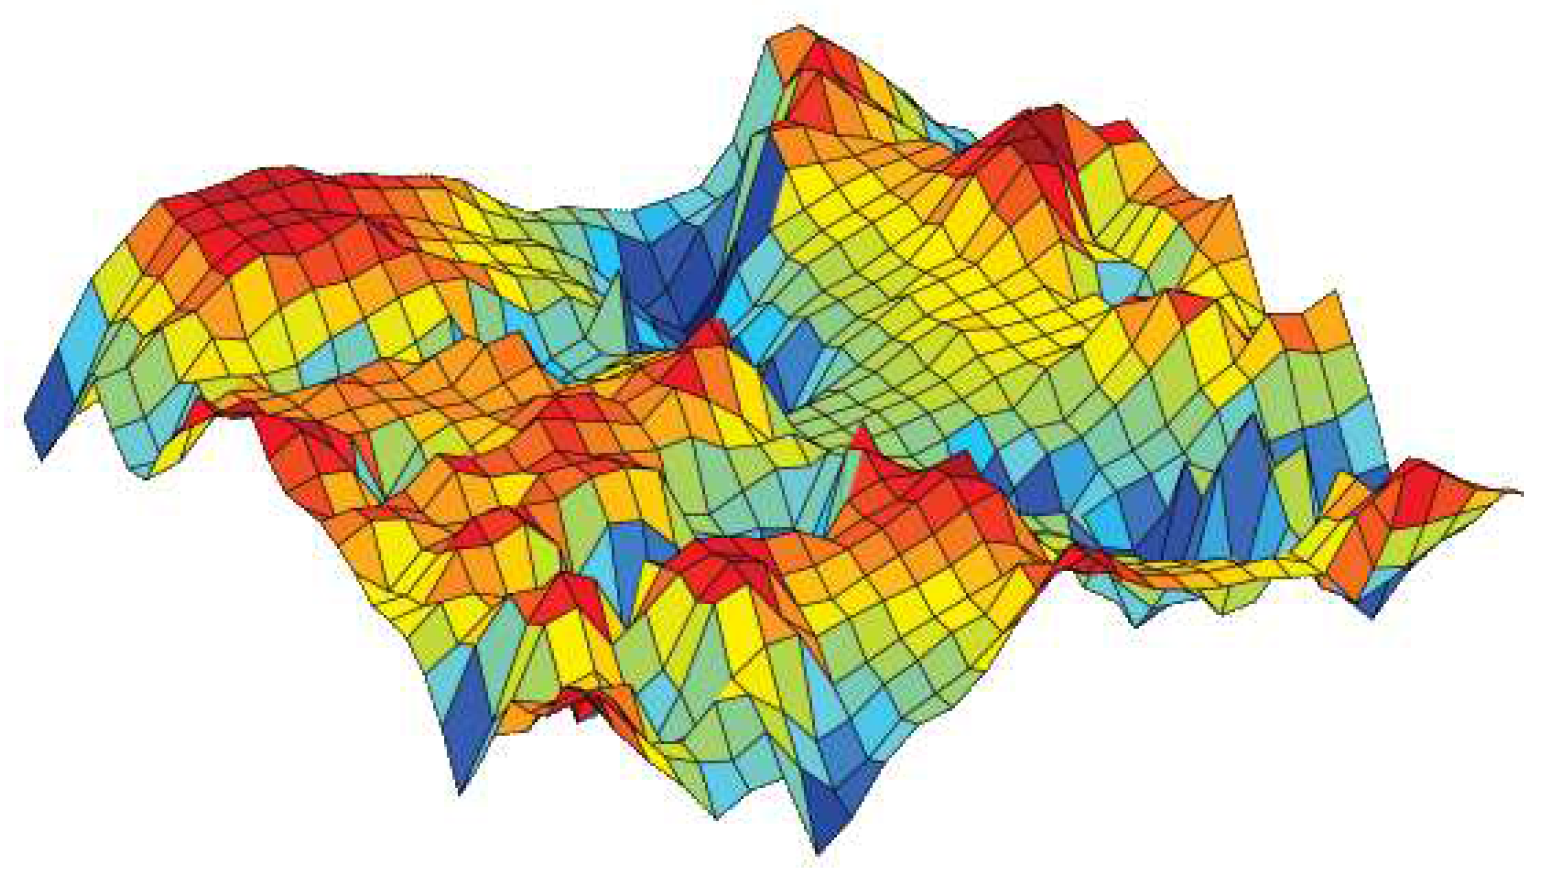
Tom Heskes (2001) [17] demonstrated a direct correspondence between minimum distortion topographic map formation and maximum likelihood Gaussian mixture density modeling, particularly in the homoscedastic case. This research builds upon the traditional distortion (vector quantization) formulation of the self-organizing map. Heskes’ work showcases the practical applications of SOMs, including market basket analysis. In this context, the objective is to map products onto a two-dimensional lattice in such a way that proximate products exhibit similarities in purchasing behaviour. Products with similar conditional probabilities of being purchased together are clustered together on the map. In another application, Heskes explores the use of SOMs in analyzing supermarket transactions. Here, products are grouped into categories, and co-occurrence frequencies are considered. The result is a two-dimensional density map that reveals clusters of products that are frequently purchased together, such as prominent cluster of household products (as illustrated in
Figure 3). This demonstrates the versatility and power of SOMs in uncovering meaningful patterns within high-dimensional data, with implications for various fields, including market analysis and product recommendation systems.
Figure 3.
Visualization of Market Basket Data According to Heskes, [20].
Figure 3.
Visualization of Market Basket Data According to Heskes, [20].
4.4. Experiment 1: Clustering by SOM
4.4.1. Execution
Following the clustering methodology described earlier, we conducted clustering experiment with 2, 3, and 4 clusters. After consulting with domain experts, we determined that 3 clusters provided the most meaningful results. The outcomes of this clustering are presented below.
4.4.2. Evaluation
Table 1 displays the average importance of each question. Notably, customers in cluster 1 consistently scored above 4 points across all studied features. In cluster 2, the same customers scored above 3 points, and in cluster 3, customers had an average score of less than 3 for all features.
4.4.3. Analysis
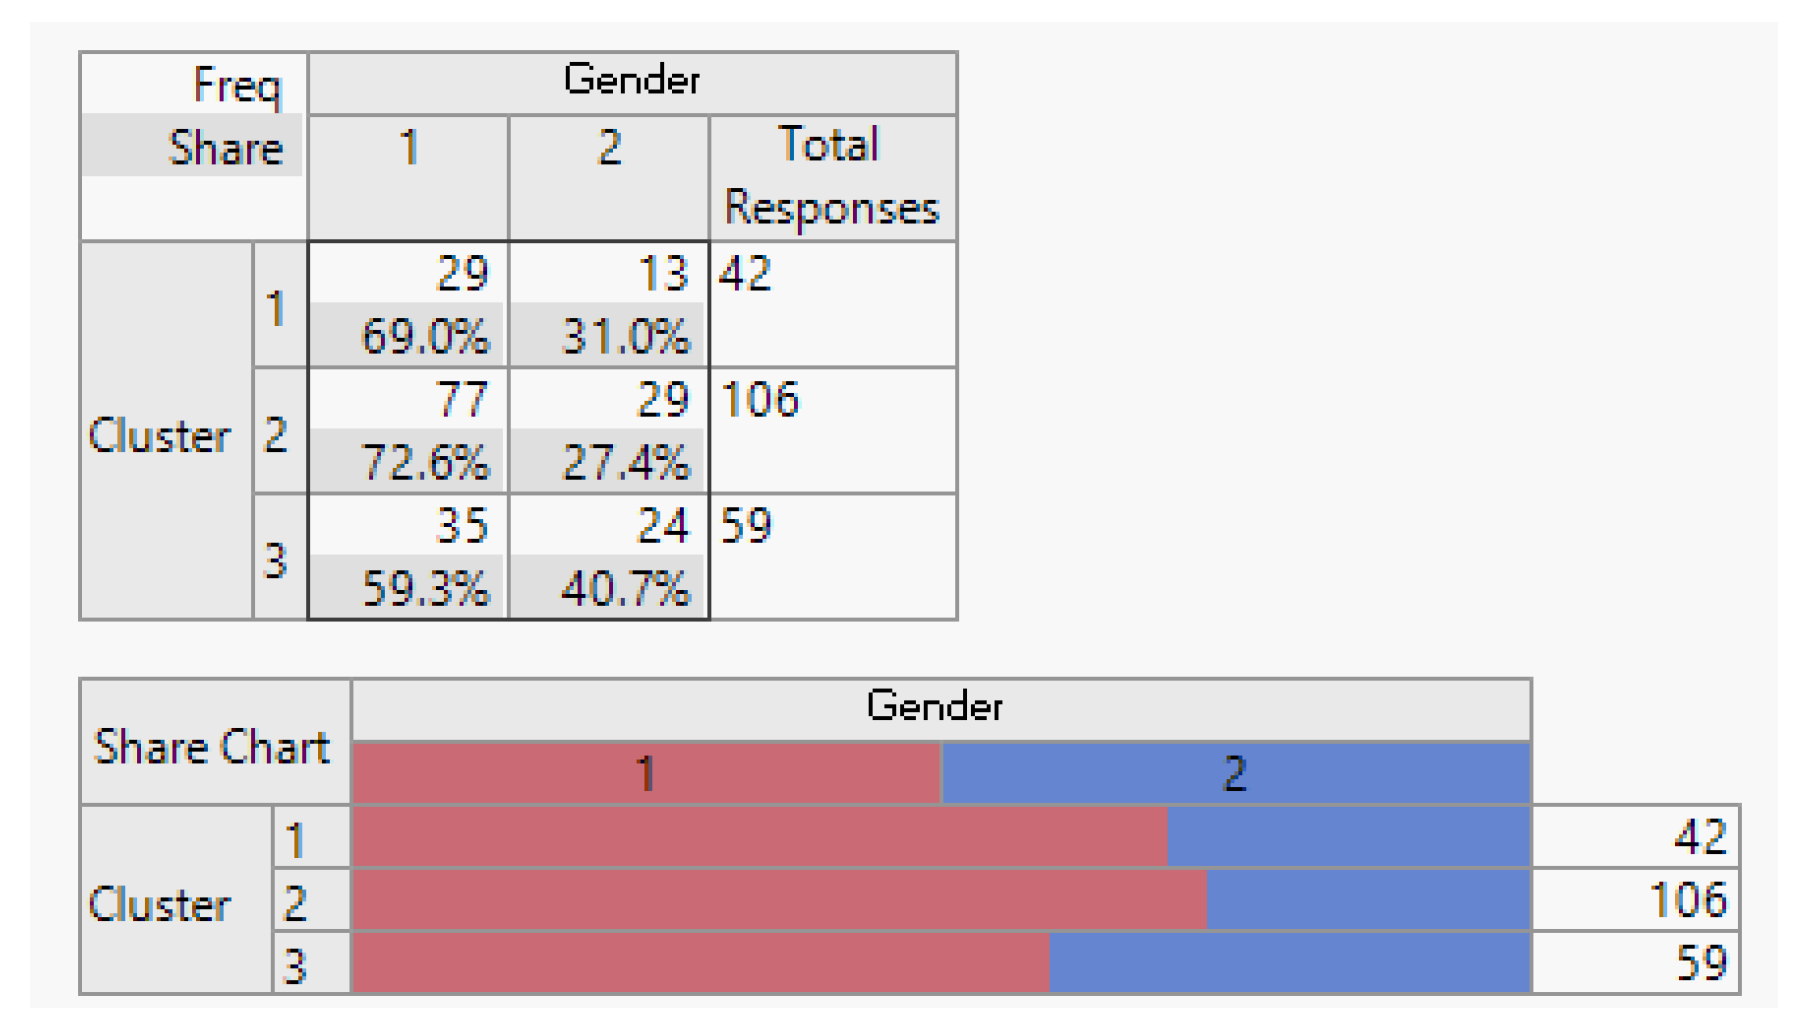
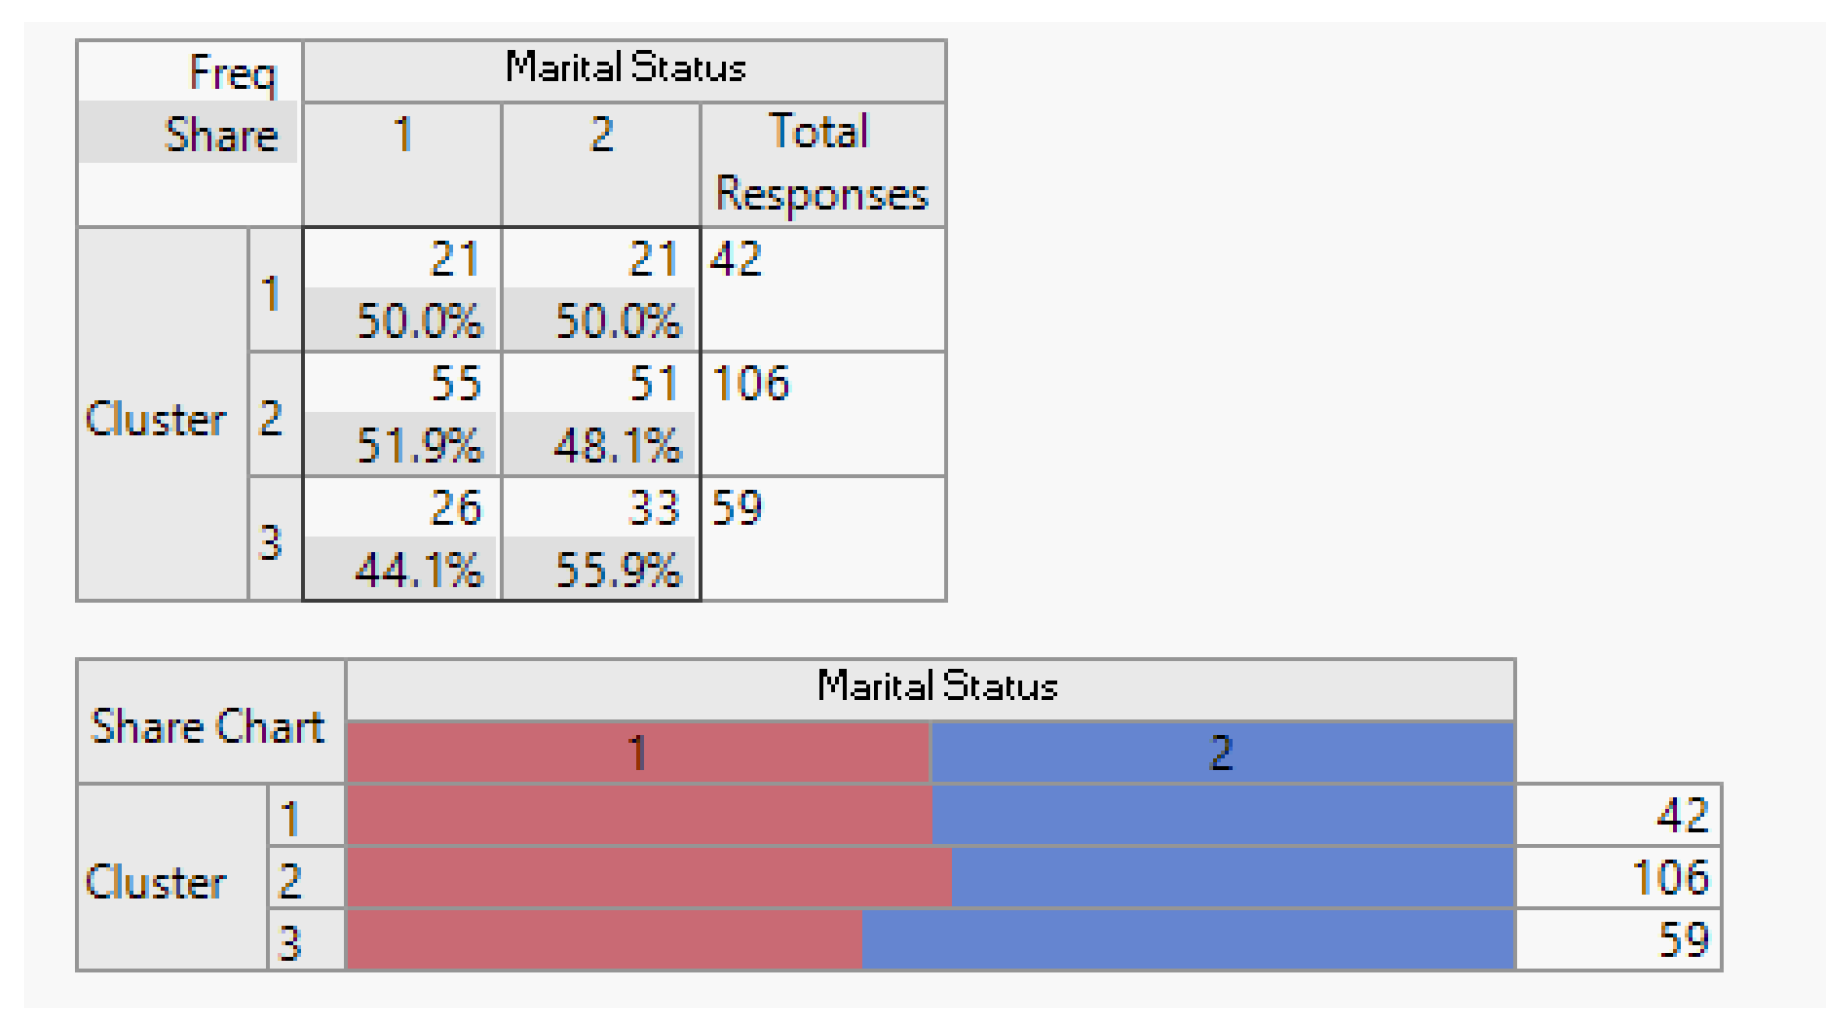
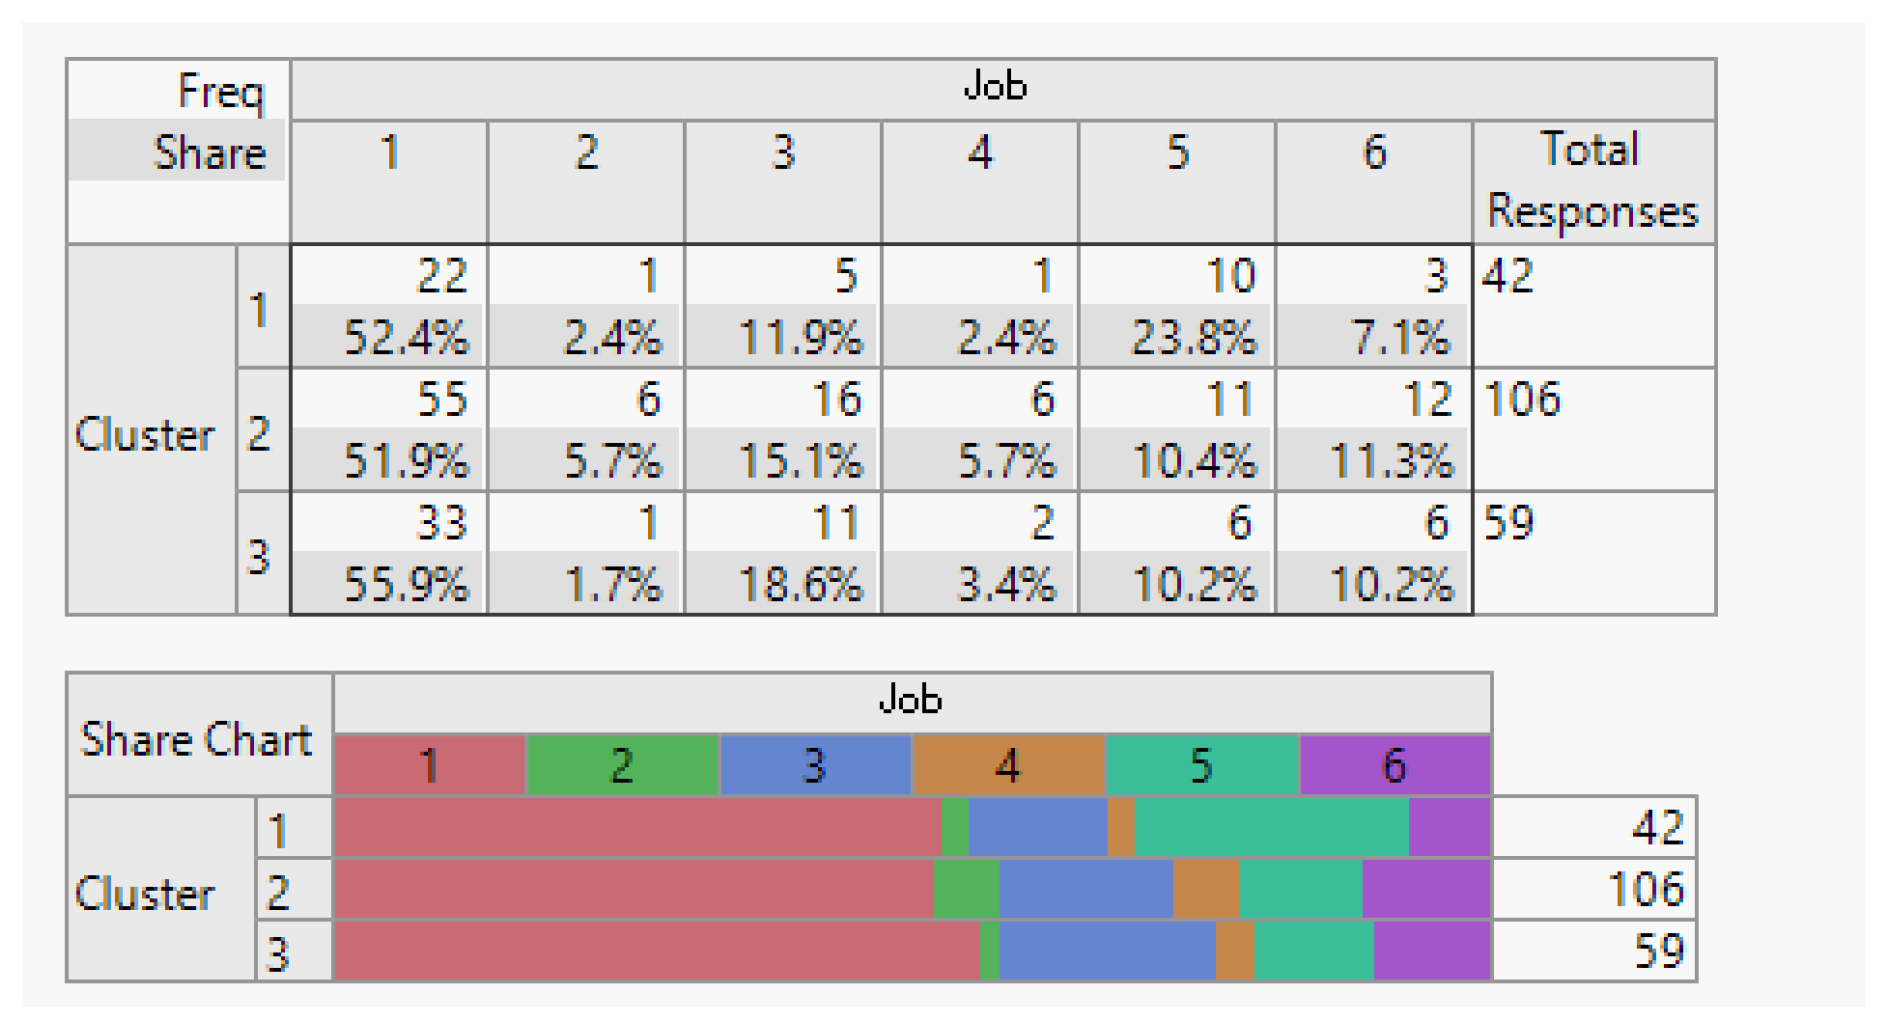
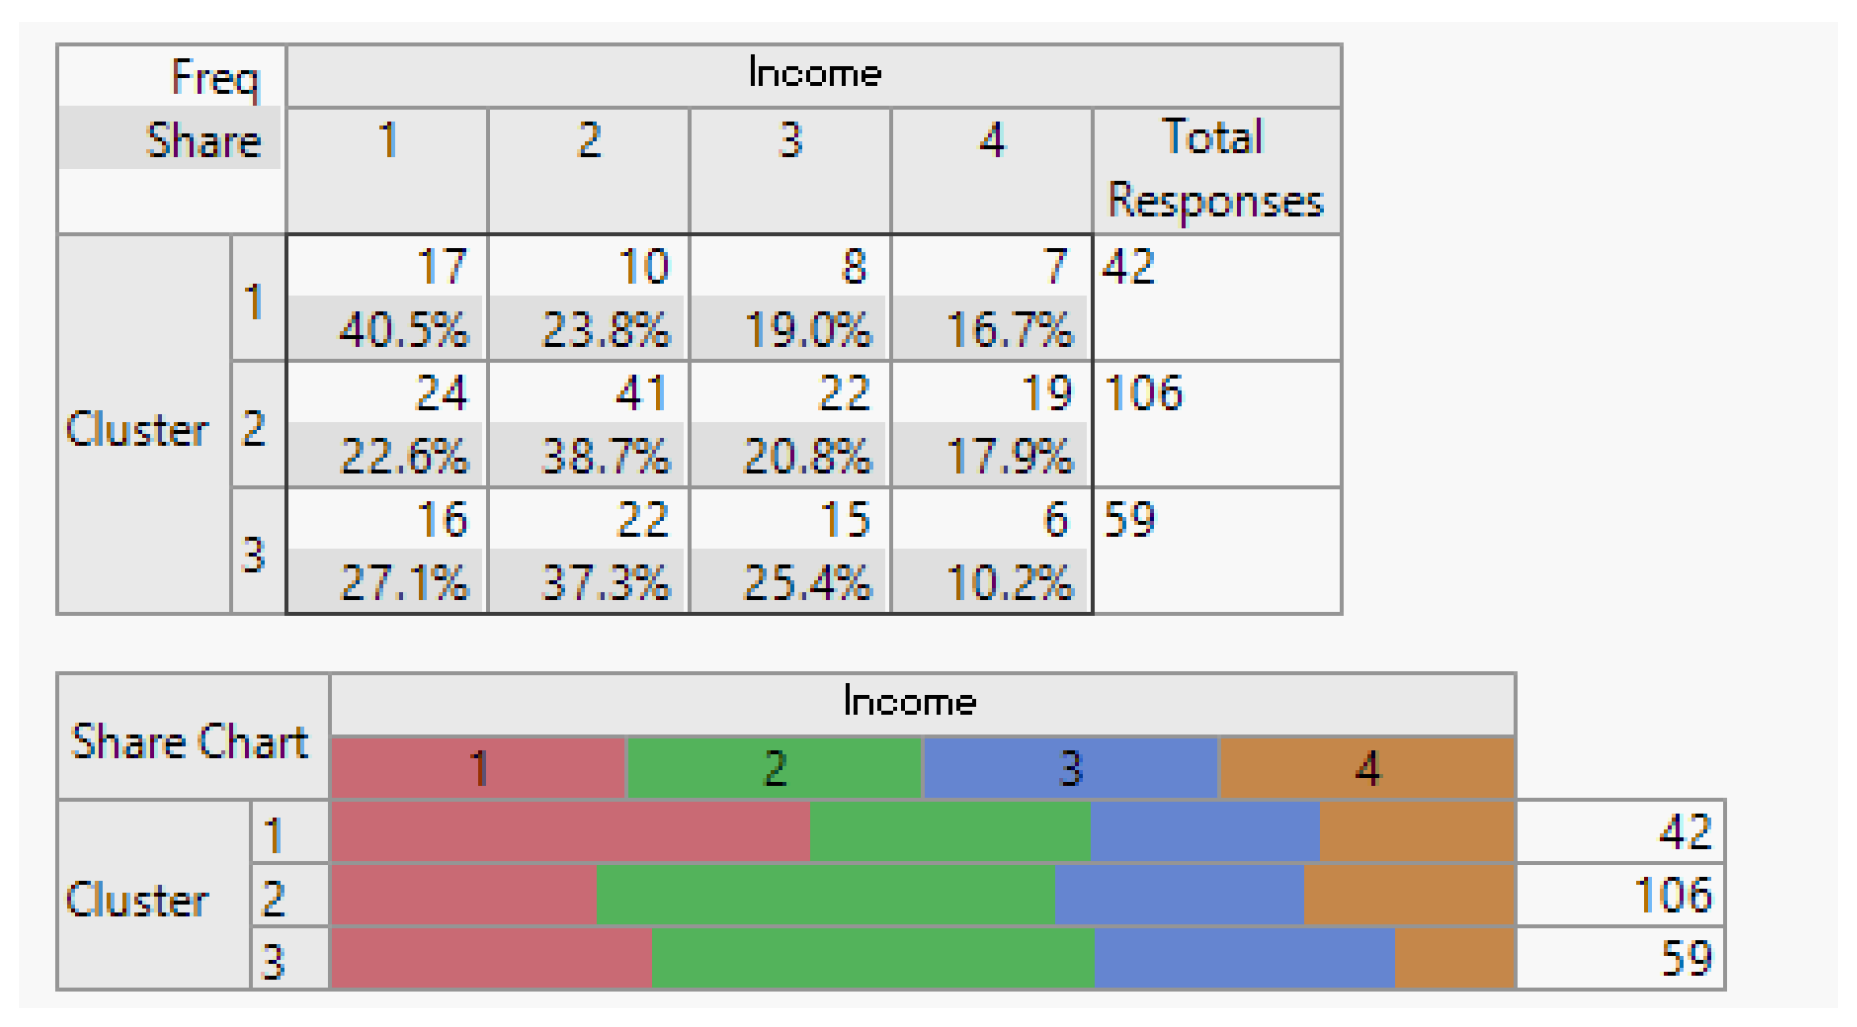
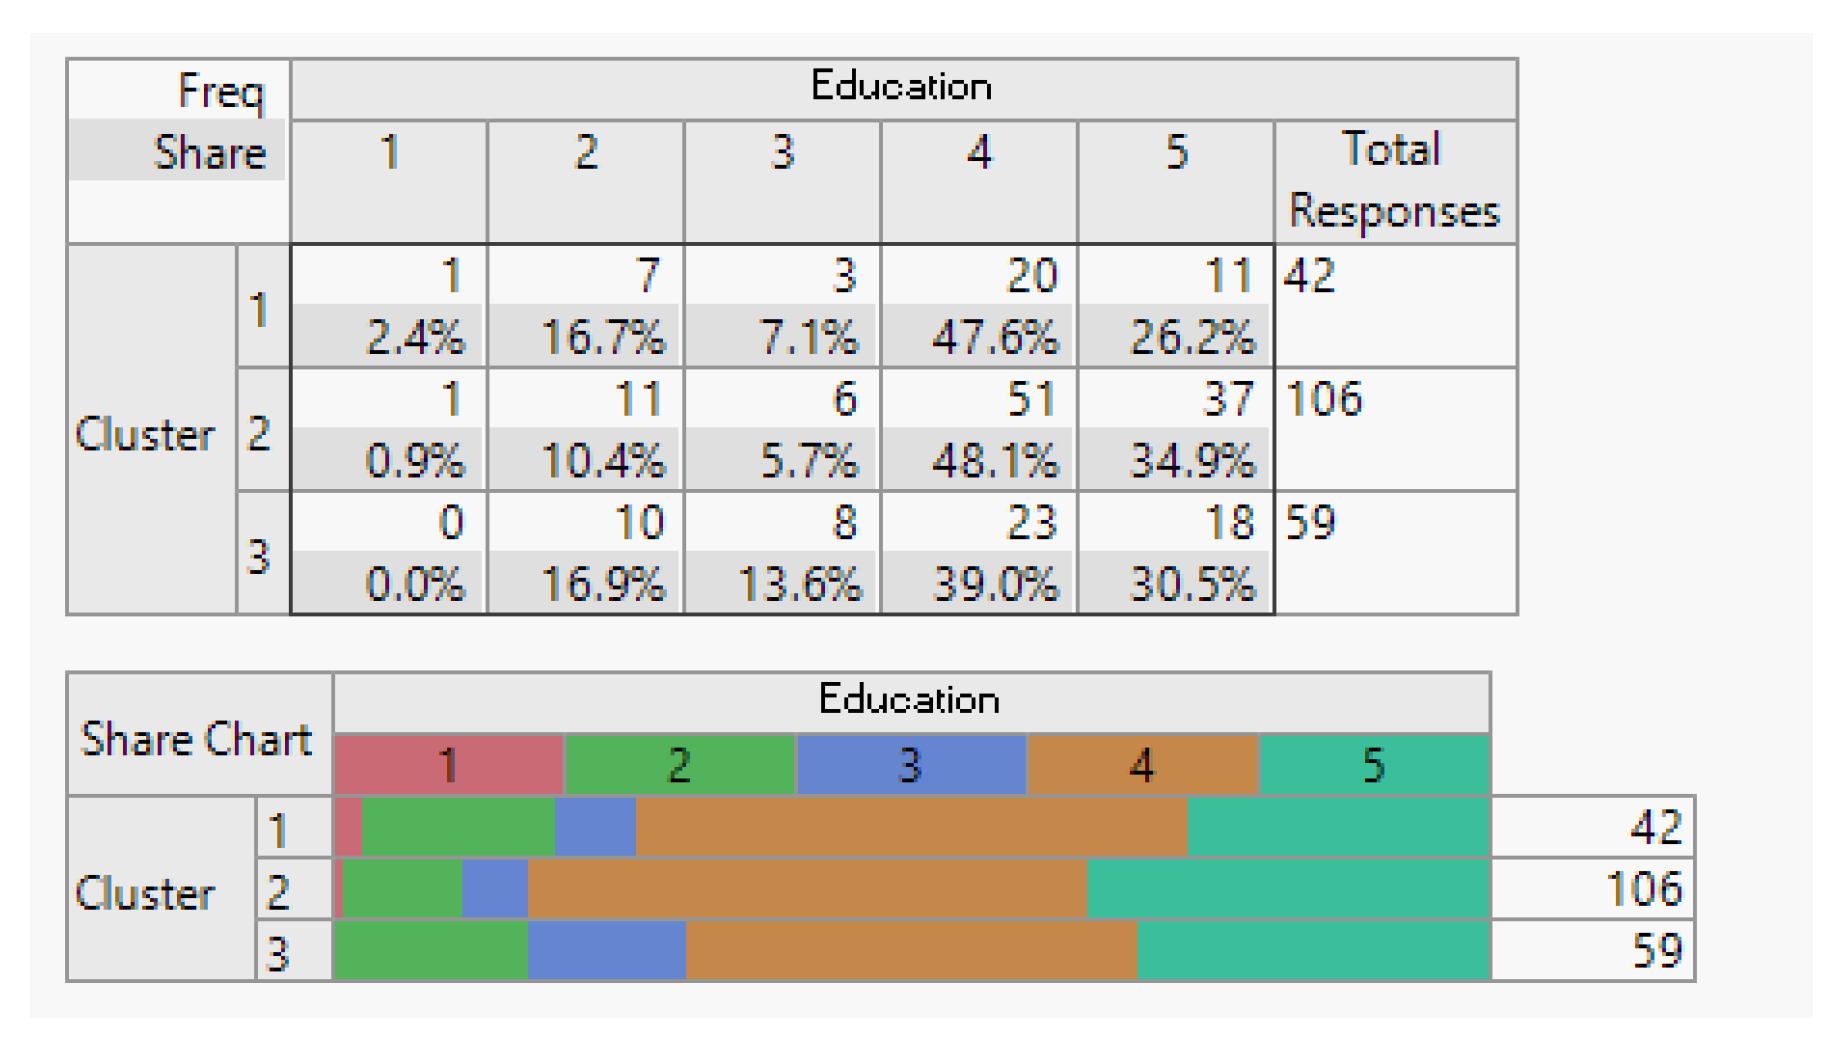
To facilitate the interpretation of the clustering results, we visualized the clusters, attributes, and the target class as a scatter plot for the top 17 informative attributes. The analysis results are depicted in the following figures.
Figure 4.
Gender Demographic Breakdown (Male/Female).
Figure 4.
Gender Demographic Breakdown (Male/Female).
Figure 5.
Age Demographic Range (20 to 40).
Figure 5.
Age Demographic Range (20 to 40).
Figure 6.
Marital Status Demographic Breakdown (Single/Married).
Figure 6.
Marital Status Demographic Breakdown (Single/Married).
Figure 7.
Household Demographic Date (Number of Household Members).
Figure 7.
Household Demographic Date (Number of Household Members).
Figure 8.
Employment Status Demographic Breakdown (Employed/Unemployed).
Figure 8.
Employment Status Demographic Breakdown (Employed/Unemployed).
Figure 9.
Income Demographic Segmentation.
Figure 9.
Income Demographic Segmentation.
Figure 10.
Overview of Education Demographics.
Figure 10.
Overview of Education Demographics.
4.5. Experiment 2: Decision Tree by CART
4.5.1. Classification
Classification is the process of categorizing newly encountered entities into predefined classes by analyzing their features. It involves making informed decisions based on past examples [18]. One popular classification technique is the use of decision tree.
4.5.2. Decision trees
A decision tree is a tree-like structure in which each internal node represents a feature and a split point, while each leaf node corresponds to a class label. These trees are constructed from training data and used to classify new instances [18]. Decision tree learning methods are widely applied in data mining, aiming to predict target variable values based on input attributes. The process begins by selecting an attribute that efficiently splits the data, becoming the root node. The attribute with the highest information gain is chosen as the splitting attribute [19].
4.5.3. CART Algorithm
The CART algorithm, developed by Quinlan [16], employs information gain as its splitting criterion. The topmost node in the tree is the root node, and the attribute with the highest information gain is selected as the split attribute. The tree is built from training instances and used for classifying test data. When information gain becomes minimal or when all instances belong to a single target class, tree growth halts [18]. CART introduces the concept of a cost function, given by [20]: 𝑅𝛼(𝑇) = 𝑅(𝑇) + 𝛼 . |𝐿𝑒𝑎𝑣𝑒𝑠(𝑇)|
where 𝑅(𝑇) represents the misclassification cost of the sub-tree after pruning a specific branch, and 𝛼 is the cost complexity parameter. Gradually increasing 𝛼, starting from 0, leads to a series of nested trees decreasing in size. The optimal tree size is determined through 10-fold cross-validation, where the dataset is divided into subsets. One subset is used as an independent test set, while the others are used for training. The tree growing and pruning process is repeated N times, and the tree with the lowest misclassification error is considered optimal. Additionally, Breiman’s 1 S.E. rule is used to select the smallest tree within one standard error of the minimum misclassification error. CART is implemented in the R system as RPART [21].
4.5.4. Application and Insights
CART analysis serves as a valuable tool for researchers, allowing them to identify key variables for potential interventions and decision-making. For instance, it reveals the significant role of the cleaning property, achieving a high success rate of approximately 90% in prediction. Furthermore, the resulting model exhibits a high true negative rate, and meaningful rules are extracted from the dataset, showcasing the efficacy of the Decisions tree in predicting customer preferences in the hair care industry.
4.5.5. Correlating Customer Importance and Classification
In this experiment, we aimed to establish a correlation between customer-related variables used in clustering and their importance class using the CART decision tree technique within the SPSS software. The GINI index serves as the impurity criterion in the CART model, and tree pruning is applied. Based on the target variable, the decision tree is constructed. Since classification is a data-driven and supervised data mining approach, a target variable is essential. Building upon the results obtained from previous customer segmentation modeling, we utilize the groups derived from clustering based on customer behaviour and characteristics as categorical target variables. It’s worth noting that the classification is performed separately for customers seeking excellent, medium, and poor products [23]. The ultimate objective is to establish a connection between the variables used in clustering, describing a customer’s importance, and their respective importance classes.
5. Results of Model implementation
Upon applying the CART decision tree technique to classify the factors outlines in
Table 2, the results revealed valuable insights into their impact on customer satisfaction.
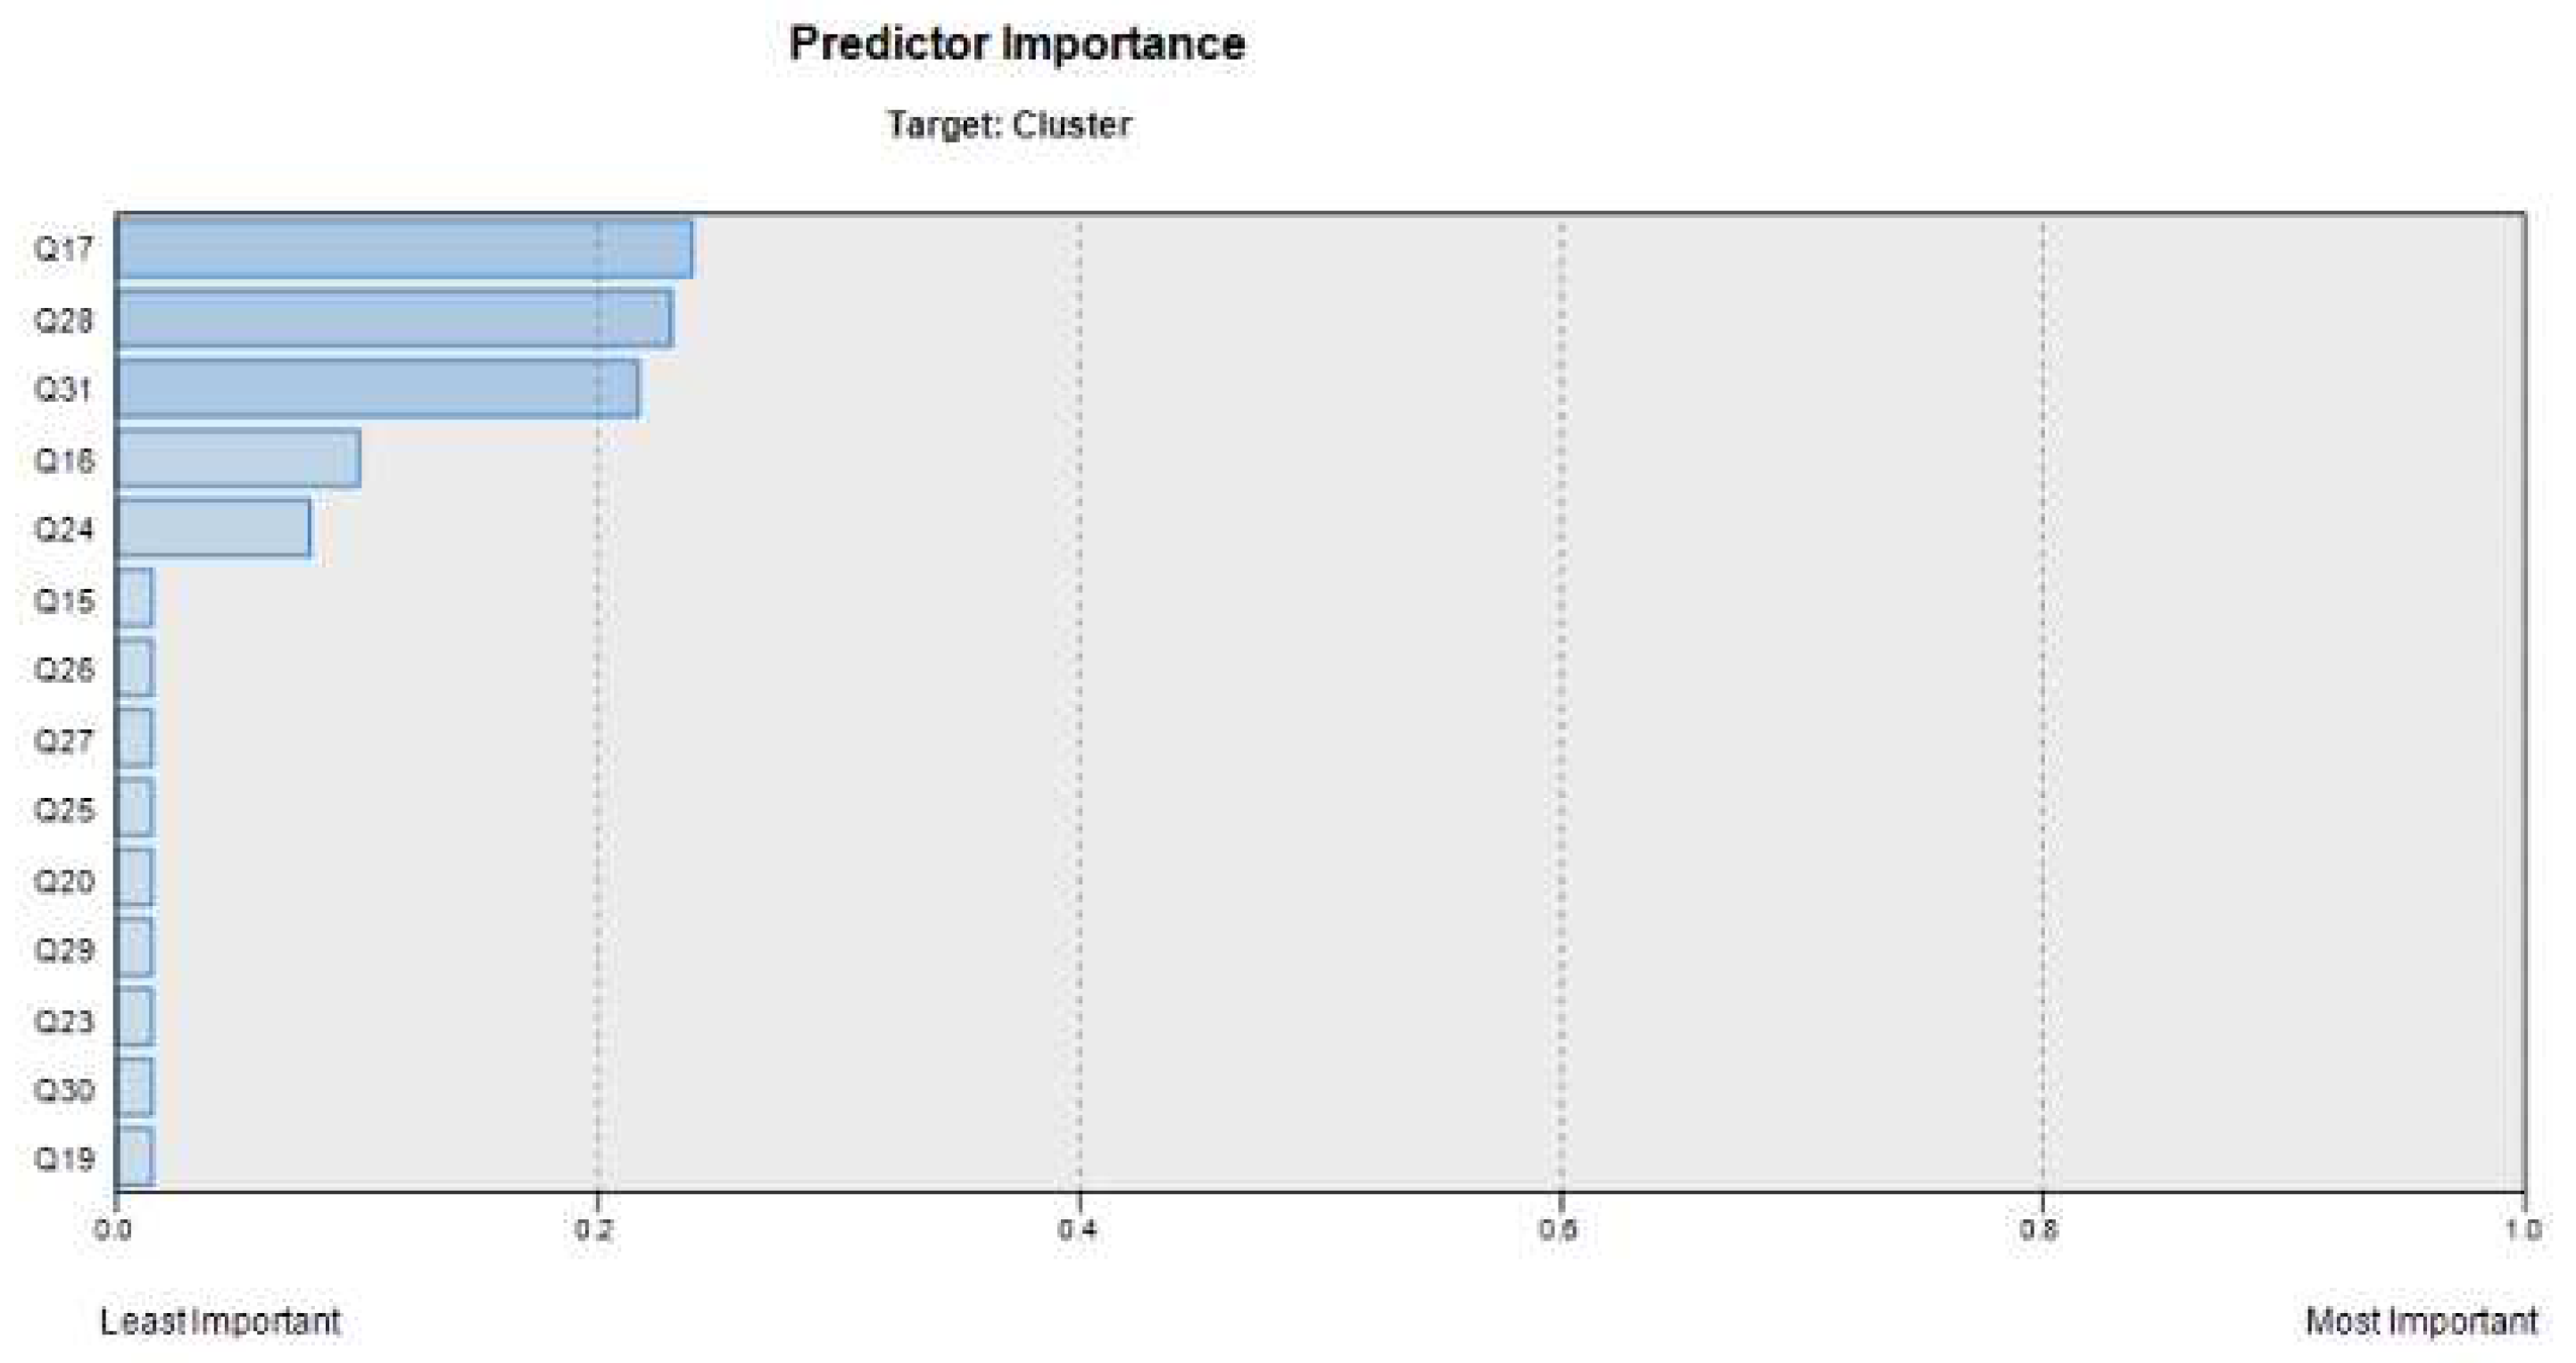
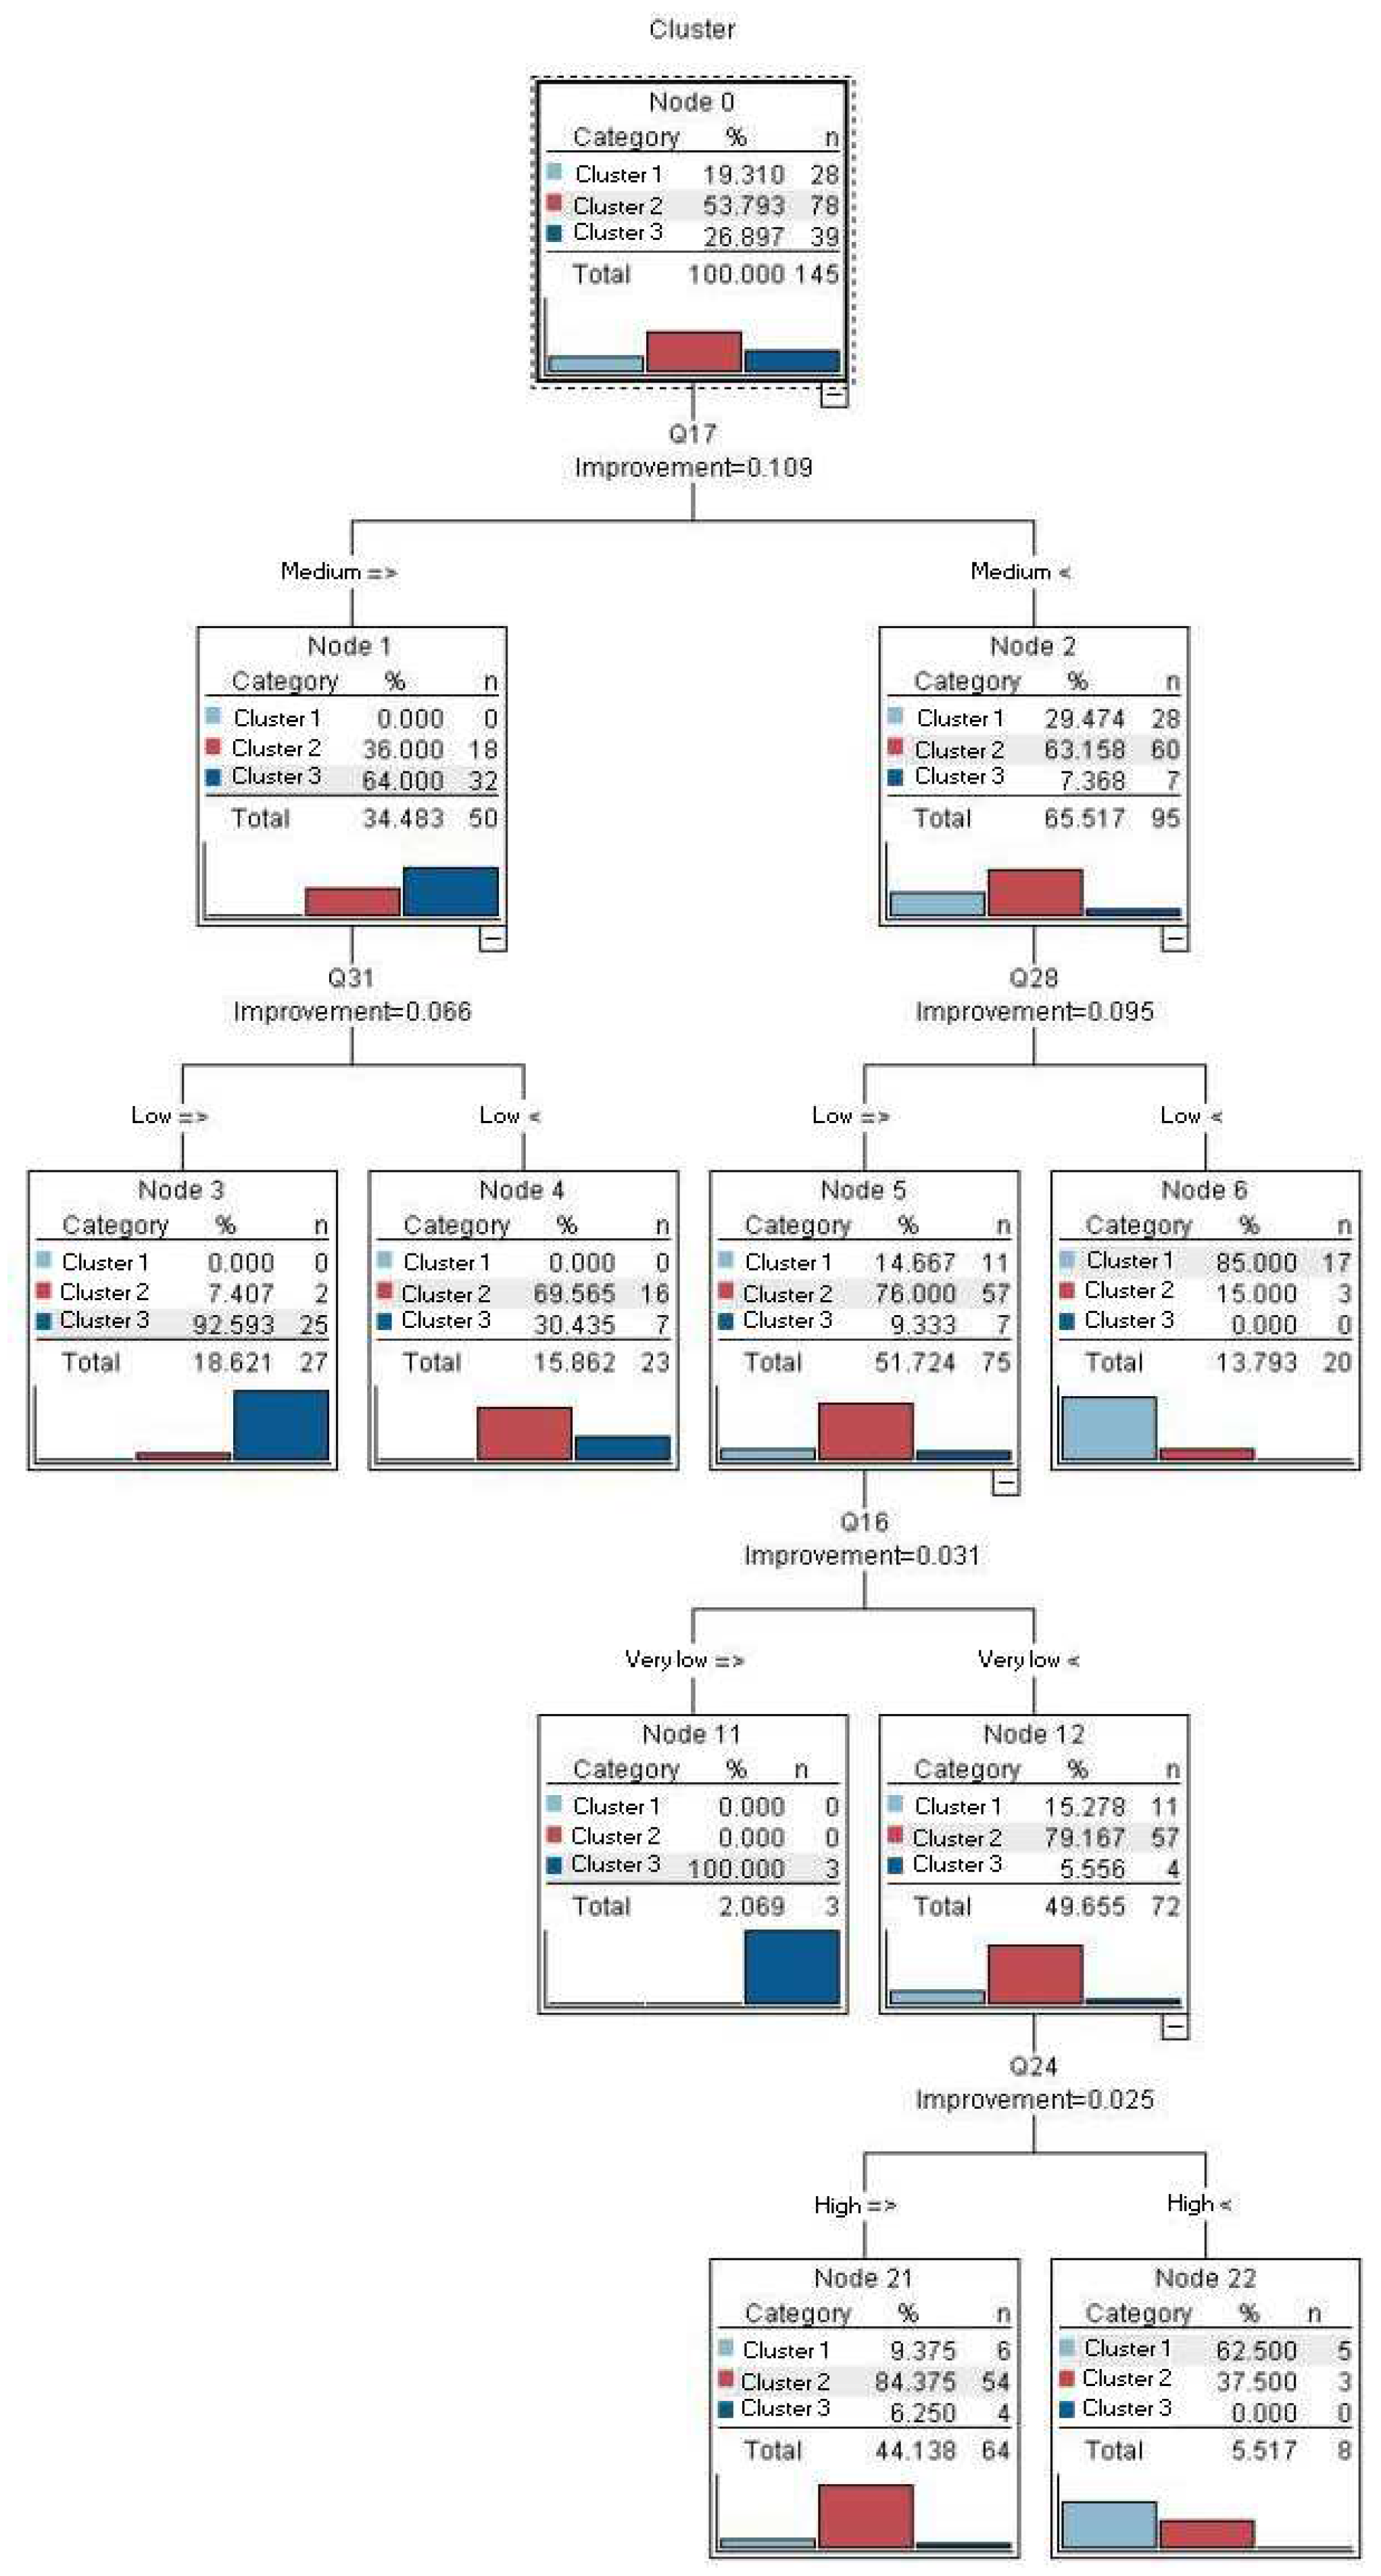
Figure 11 provides a visual representation of the factors ranked by their influence on customer satisfaction, while
Figure 12 represents the decision tree, showcasing how each factor contributes to the model’s predictions.
As illustrated in
Figure 12, the cleansing ability of shampoo (question 17) emerges as the primary determinant in customer satisfaction. At the top level of the decision tree, it becomes evident that when customers express a satisfaction level of approximately 30% regarding the shampoo’s cleansing properties, they invariably belong to the high-satisfaction customer class. Furthermore, if satisfaction with this aspect surpasses 63%, irrespective of the status of other examined factors, customers are unequivocally placed in the category of average satisfaction. This finding underscores the pivotal role of shampoo cleansing efficacy in shaping overall customer satisfaction.
Figure 11.
Overview of Investigated Factor Prioritization.
Figure 11.
Overview of Investigated Factor Prioritization.
Figure 12.
Decision Tree Model Developed in the Current Study.
Figure 12.
Decision Tree Model Developed in the Current Study.
As depicted in
Figure 12, the influence of various factors on customer satisfaction are as follows:
Top Priority: The significance of shampoo cleansing properties
Second Priority: The relevance of lotto draws prizes and discounts
Third Priority: The Importance of product diversity
Fourth Priority: The value of moisturizing properties
Fifth Priority: The significance of shampoo volume
While
Figure 12 presents additional factors within this context, our primary focus and interpretation lie with the above priorities. These findings provide the shampoo company with valuable insights for enhancing customer satisfaction. By recognizing the relative importance and prioritization of factors influencing customer satisfaction customer satisfaction, the company can strategically allocate resources and efforts to prioritize the most impactful and higher-priority factors, thereby optimizing results efficiently and cost-effectively.
6. Discussion and Conclusions
In this study, we provided a valuable insight into the preferences and priorities of shampoo buyers, and these findings can be related to the IoT in the following ways:
1. Data collections and analysis:
The comprehensive database complied in this study encompasses both demographic and behavioral attributes of shampoo buyers. Data collection from IoT-enabled shampoo products could extend beyond traditional demographics to include real-time usage patterns. IoT devices can collect data on how and when customers use shampoo, their preferred product attributes, and their overall satisfaction. The analysis of such data can provide even more detailed and dynamic insights into consumer behaviour and preferences.
2. Customer clustering:
The categorization of customers into three distinct clusters, each characterized by unique preferences, is a valuable approach. In the IoT era, customer clustering can become more dynamic and precise. IoT devices can continuously collect data to identify changing consumer preferences in real time, allowing companies to adapt their strategies and products accordingly.
3. Quality and product attributes:
The study emphasizes the importance of product quality and attributes like cleansing properties in customer preferences. In an IoT context, smart shampoo bottles or packaging could collect and transmit data related to product usage and attributes. IoT technology allows companies to monitor and maintain product quality, ensuring that it meets customer expectations, which is essential for customer satisfaction and loyalty.
4. Decision tree insights:
the decision tree analysis highlights the pivotal role of specific shampoo attributes in customer segmentation. IoT can enhance this by providing real-time data on customer satisfaction and attribute preferences. IoT devices can also enable targeted marketing based on these preferences, improving customer satisfaction and loyalty.
5. Competitive advantage:
Understanding customer preferences through IoT data collection can give companies a competitive advantage. By utilizing IoT technology to gather and analyze data, companies can tailor their strategies to enhance customer satisfaction and achieve long-term success in the competitive shampoo industry. This approach can lead to personalized marketing, better product development, and improved customer retention.
In conclusion, the study’s findings on customer preferences and priorities within the shampoo market highlights the potential of IoT technology to gather real-time data, enhance customer segmentation, and provide companies with valuable insights to optimize their strategies and achieve success in a competitive market.
References
- Rane, Nitin, (2023). Enhancing Customer Loyalty through AI, Internet of Things (IoT), and Big Data Technologies: Improving Customer Satisfaction, Engagement, Relationship, and Experience.
- Naim, A., Muniasamy, A., Clementking, A., Rajkumar, R. (2022). Relevance of Green Manufacturing and IoT in Industrial Transformation and Marketing Management. Computational Intelligence Techniques for Green Smart Cities. Green Energy and Technology. Springer. [CrossRef]
- Kopalle, P.K., Kumar, V. & Subramaniam, M. (2020). How legacy firms can embrace the digital ecosystem via digital customer orientation. J. of the Acad. Mark. Sci. 48, 114–131. [CrossRef]
- Haotian Liu, (2021). The Application of Topological Structure of Interpersonal Relationships to Optimize Customer Segmentation- Proceedings of the 6th International Conference on Financial Innovation and Economic. [CrossRef]
- Gupta, M.K., Chandra, P. (2020) A comprehensive survey of data mining. Int. j. inf. tecnol. 12, 1243–1257. [CrossRef]
- Gawehn, E. (2022) Leveraging Self-Organizing Maps with Convolutional Neural Networks for Virtual Chemical Library Screening; ETH: Zurich, Switzerland.
- Y. Liu and R. H. Weisberg. A review of self-organizing map applications in meteorology and oceanography. In Self Organizing Maps-Applications and Novel Algorithm Design. InTech, 2011. [CrossRef]
- K. Khalili-Damghani, K., F. Abdi, and S. Abolmakarem, “Hybrid soft computing approach based on clustering, rule mining, and decision tree analysis for customer segmentation problem: Real case of customercentric industries,” Applied Soft Computing, vol. 73, pp. 816-828, 2018. [CrossRef]
-
9. E. W. Ngai, L. Xiu, and D. C. Chau, “Application of data mining techniques in customer relationship management: A literature review and classification,” Expert systems with applications, vol. 36, pp. 2592- 2602, 2009. [CrossRef]
-
10. C. H. Cheng, and Y. S. Chen, “Classifying the segmentation of customer value via RFM model and RS theory,” Expert systems with applications, vol. 36, pp. 4176-4184, 2009. [CrossRef]
-
11. Zadeh, R. B. K., Faraahi, A. and Mastali, A. (2011). Profiling bank customers’ behavior using cluster analysis for profitability. International Conference on Industrial Engineering and Operations Management Kuala Lumpur, Malaysia.
-
12. S. Wang and H. Wang, Knowledge Discovery Through Self-Organizing Maps: Data Visualization and Query Processing, Knowledge and Information Systems, 4, 31–45 (2002). [CrossRef]
-
13. Hassouna, M., Tarhini, A., Elyas, T. and AbouTrab, M.S., (2016). Customer Churn in Mobile Markets A Comparison of Techniques. arXivpreprint arXiv:1607.07792. International Business Research, 8(6), 224–237. [CrossRef]
-
14. Owczarczuk, M. (2010). Churn models for prepaid customers in the cellular telecommunication industry using large data marts. Expert Systems with Applications, 37(6), 4710–4712. [CrossRef]
- S. S. Haykin, Neural networks and learning machines, New Jersey: Pearson Education, Inc., 2009.
- H. Zhang, A. Zhou, S. Song, Q. Zhang, X. Z. Gao, and J. Zhang, “A self-organizing multiobjective evolutionary algorithm,” IEEE Transactions on Evolutionary Computation, vol. 20, pp. 792-806, 2016. [CrossRef]
-
17. Heskes, T. (2001). Self-organizing maps, vector quantization, and mixture modeling. IEEE Trans. Neural Networks, 12(6), 1299-1305. [CrossRef]
- Kabra, R.R., and Bichkar, R.S. (2011),” Performance Prediction of Engineering Students using Decision Tree”, International Journal of Computer Applications, Vol.36, No.11, December 2011, pp. 8-12.
- Kesavraj, G. and Sukumaran, S. (2013), “A Study on Classification Technique in Data Mining”, 4th ICCNT-2013. [CrossRef]
- Breiman, L., Friedman, J., Stone, C., & Olshen, R. A. (1984). Classification and Regression Trees (Wadsworth Statistics/Probability). Chapman & Hall/CRC. Retrieved from citeulike-article-id:801011.
- Therneau, T. M., & Atkinson, E. J. (1997). An introduction to recursive partitioning using the {RPART} routines. Retrieved from citeulike-article-id:3462048.
- T. Kohonen, Self-Organizing Maps, Springer, Berlin, (2001).
- Nguyen, T.V., Zhou, L., Chong, A.Y.L., Li, B., Pu, X., Predicting customer demand for remanufactured products: A data-mining approach, European Journal of Operational Research, V 281, Issue 3, (2020), Pages 543-558, ISSN 0377-2217. [CrossRef]
- Das, S., & Nayak, J. (2022). Customer segmentation via data mining techniques: State-of-the-art review. In J. Nayak, H. Behera, B. Naik, S. Vimal, & D. Pelusi (Eds.), Computational Intelligence in Data Mining. Smart innovation, systems and technologies (Vol. 281). Springer. [CrossRef]
- Mach-Król, M.; Hadasik, B. (2021) On a Certain Research Gap in Big Data Mining for Customer Insights. Appl. Sci, 11, 6993. MDPI. [CrossRef]
- Pynadath, M.F., Rofin, T.M. & Thomas, S. (2023), Evolution of customer relationship management to data mining-based customer relationship management: a scientometric analysis. Qual Quant 57, 3241–3272. [CrossRef]
|
Disclaimer/Publisher’s Note: The statements, opinions and data contained in all publications are solely those of the individual author(s) and contributor(s) and not of MDPI and/or the editor(s). MDPI and/or the editor(s) disclaim responsibility for any injury to people or property resulting from any ideas, methods, instructions or products referred to in the content. |
© 2023 by the authors. Licensee MDPI, Basel, Switzerland. This article is an open access article distributed under the terms and conditions of the Creative Commons Attribution (CC BY) license (http://creativecommons.org/licenses/by/4.0/).

