1. Introduction
Renowned physicists believe that humanity's fate would hinge on the imperative of interstellar travel, asserting that either the human race must expand its extraterrestrial horizons or confront the specter of eventual extinction [
1]. Space exploration has countless benefits, including inspiring young people to pursue Science, Technology, Engineering and Mathematics (STEM) fields, advancing our understanding of the universe, and driving technological innovation that can be applied on Earth [
2]. Also, space biology research has the potential to revolutionize human health by discovering new treatments for conditions such as bone loss, muscle atrophy, and immune system dysfunction. In addition, the commercial applications of this research could have a profound impact on industries such as agriculture and medicine [
3].
Lack of Earth resources, and potential pandemics like COVID-19 could all be concerns for outer space colonization [
4]. Besides, such limited resources can increase the need for space-based solutions [
5]. The investigation and potential use of key extraterrestrial resources, including habitable planets-exoplanets, and valuable minerals and water, has the capacity to offer prospects for human habitation and endurance in the event of catastrophic occurrences on Earth. In this way, the continuity of human civilization is guaranteed in the long run [
6,
7].
The discovery of new resources through space exploration, such as asteroids and planets mining, can create new economic opportunities [
8]. Instead of relying solely on Earth's resources, the use of space resources can be more economically attractive [
9]. Space mining has the potential to provide access to resources that are rare or in limited supply on Earth, such as precious metals, rare earth elements, and water [
10].
Furthermore, space mining can lead to the development of new technologies and services that can improve life in various ways [
11]. The development of new alloys through harvesting resources from space has the potential to improve technology and bring economic benefits [
12]. As space mining technology advances, new alloys can be created with unique properties that can improve the design and functionality of vehicles, machinery, and equipment [
13]. Additionally, the availability of rare and valuable materials from space can reduce the cost of manufacturing and improve the efficiency of various industries. This potential has led to increased interest and investment in space mining and related research [
14].
Moreover, the discovery of water on extraterrestrial planets or moons in our solar system can offer indispensable resources for prospective space exploration and colonization endeavors [
15]. Water serves as a pivotal component in various applications, such as sustenance, vegetation cultivation, and production of rocket fuel, thus enabling humans to establish long-term settlements on other celestial bodies [
16].
Several space investors are currently soliciting proposals for space exploration missions. The National Aeronautics and Space Administration (NASA) has planned to dispatch human astronauts to the planet Mars by the year 2030 as Mars once hosted ecosystem and it might consist of biological life and precious mineral materials [
17].
Mars, the neighboring planet of Earth, has been the focus of extensive research and exploration efforts due to its potential as a site for human settlement. In addition to its potential as a second home for humanity, Mars provides an intriguing opportunity for exobiology research and the investigation of the origins of life in our solar system [
18]. The scientific knowledge gained from interplanetary missions to Mars is significant and can benefit various fields, including astrobiology, geology, and engineering science. Furthermore, Mars missions offer economic opportunities, including the development of new technologies and the expansion of the space industry [
18].
Perseverance Rover's mission is to search for signs of ancient microbial life on Mars, collect rock and soil samples for future return to Earth, and demonstrate flight with its helicopter drone Ingenuity, which is the first aircraft to fly on another planet [
19]. It demonstrates the possibility of powered flight in Mars' thin atmosphere, which could impact future missions [
20]. China's Tianwen-1 Mission: Launched on July 23, 2020, it entered Mars orbit on February 10, 2021. The mission includes an orbiter, lander, and rover, and aims to study Mars' geology, environment, and atmosphere, and search for water and habitable environments [
21]. Hope Mission (Emirates Mars Mission), launched on July 19, 2020, aims to study Mars' atmosphere and climate throughout the Martian year [
22]. These recent missions to Mars have the potential to significantly advance our understanding of the planet and to pave the way for future exploration and potential habitation.
Advancements in propulsion systems, life support systems, and resource utilization technologies are required to make Mars missions viable and cost-effective. The development of these technologies can have a positive impact on multiple industries, including aerospace, manufacturing, and renewable energy [
23]. In summary, sending a satellite to Mars can provide us with valuable scientific data and knowledge, help us identify potential locations for human missions and settlements, and have economic benefits.
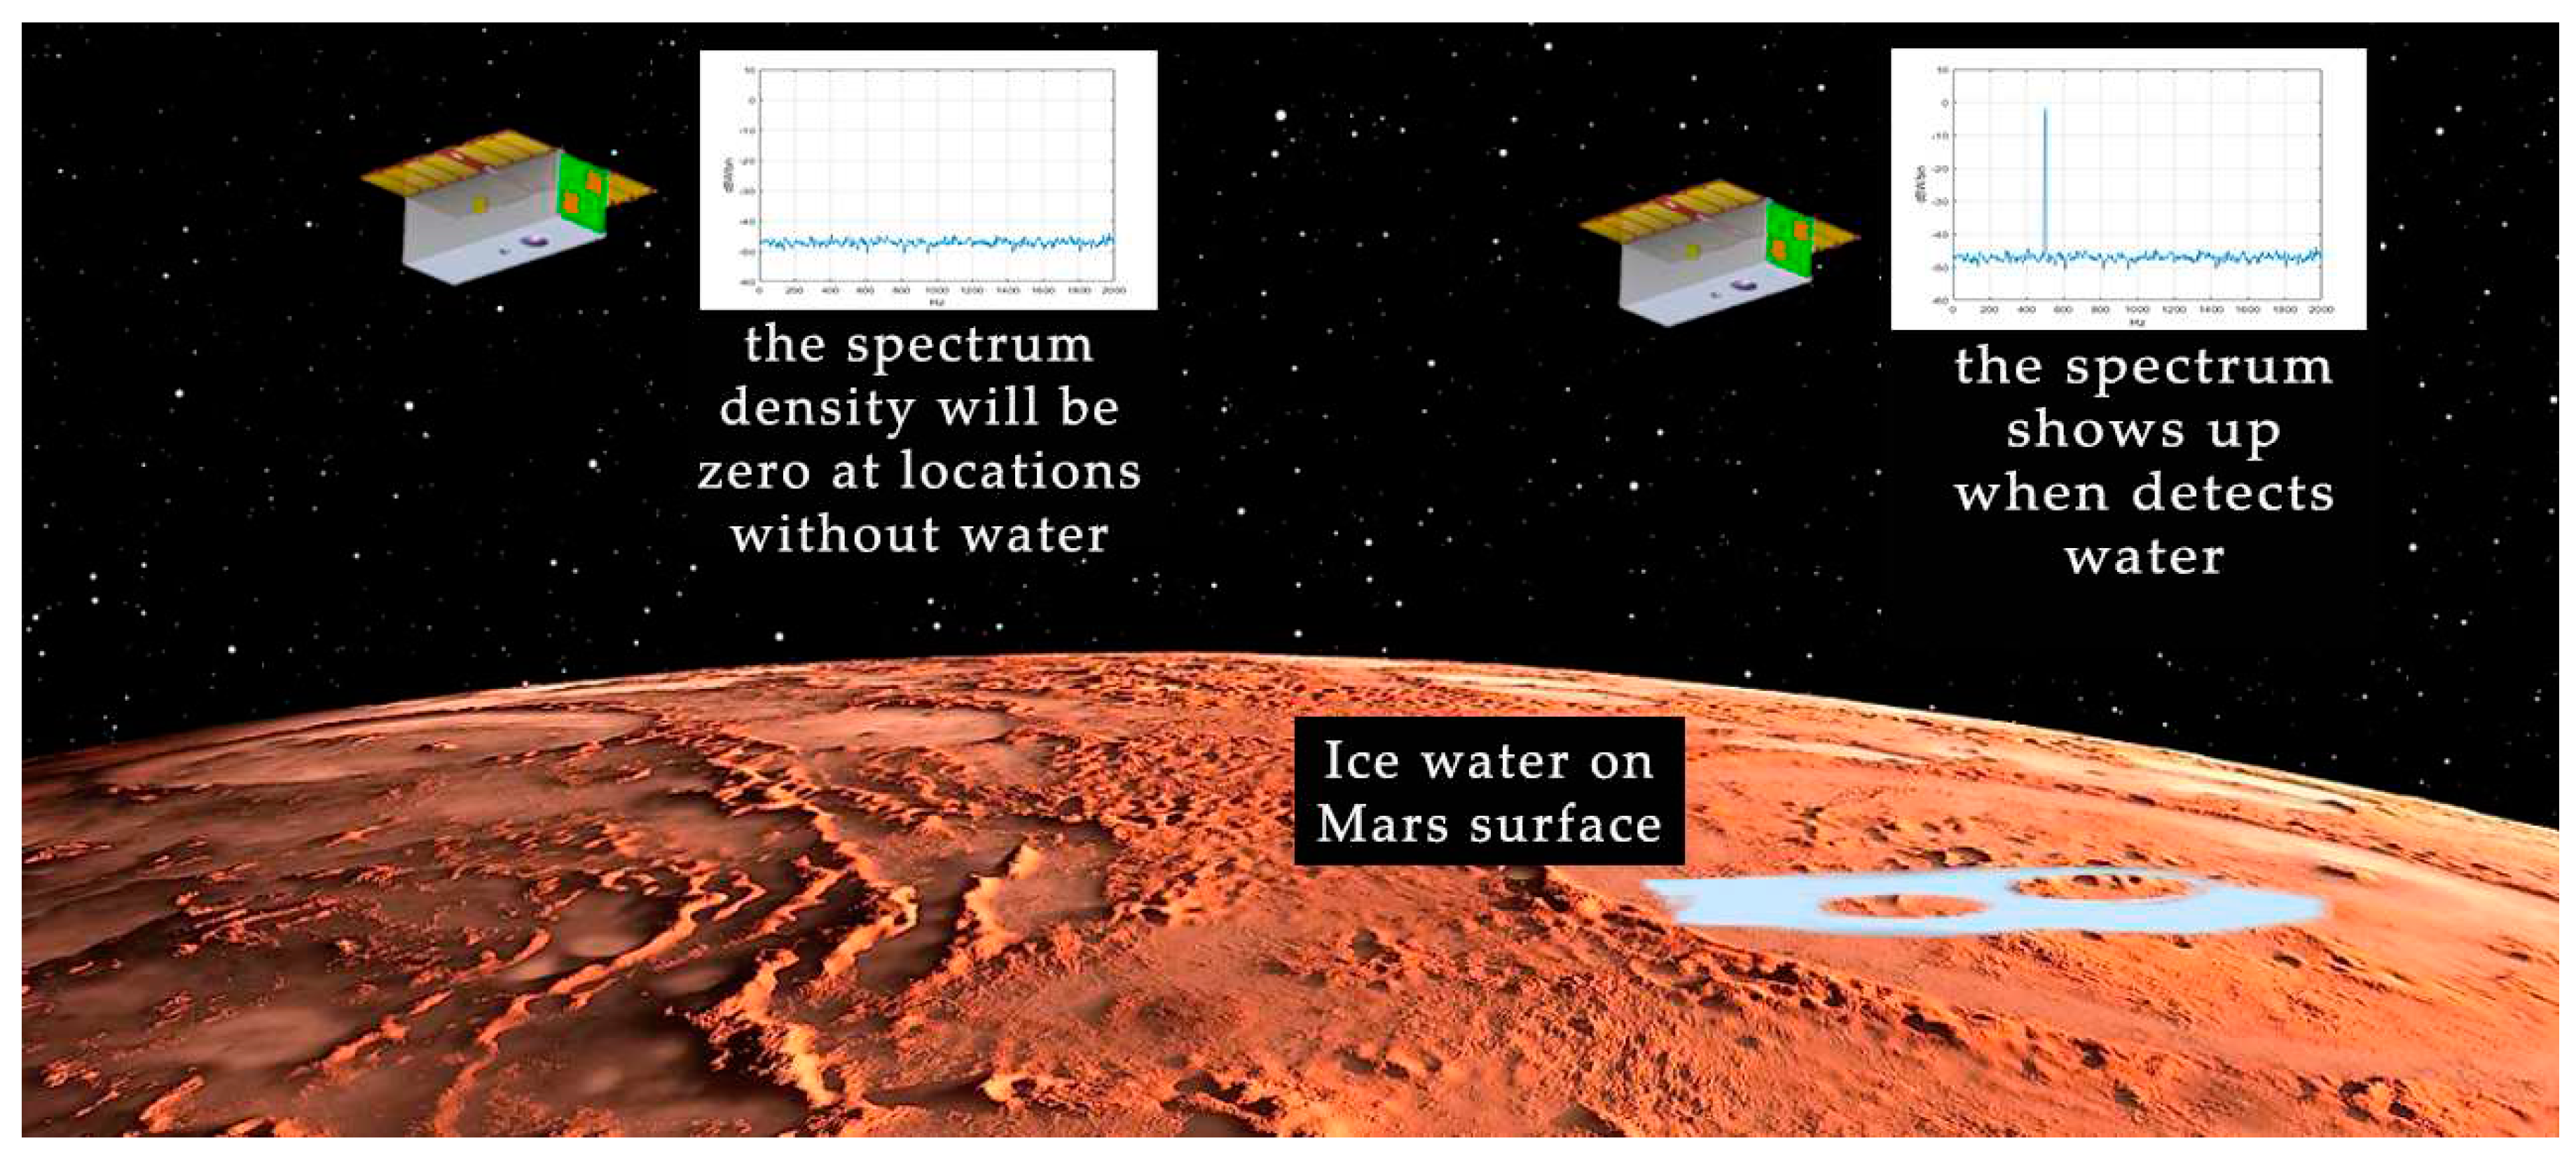
Based on the valuable scientific knowledge that can be gained from space exploration, we propose MeSat scenario as a Mars discovery mission. MeSat is a project to explore Mars in search of the future home of mankind. By conducting this mission, we can gain a better understanding of Mars, which can lead to advancements in fields such as astrobiology, geology, and aerospace engineering. In a nutshell, the project's aim is to look at the general conditions of Mars in order to identify resources.
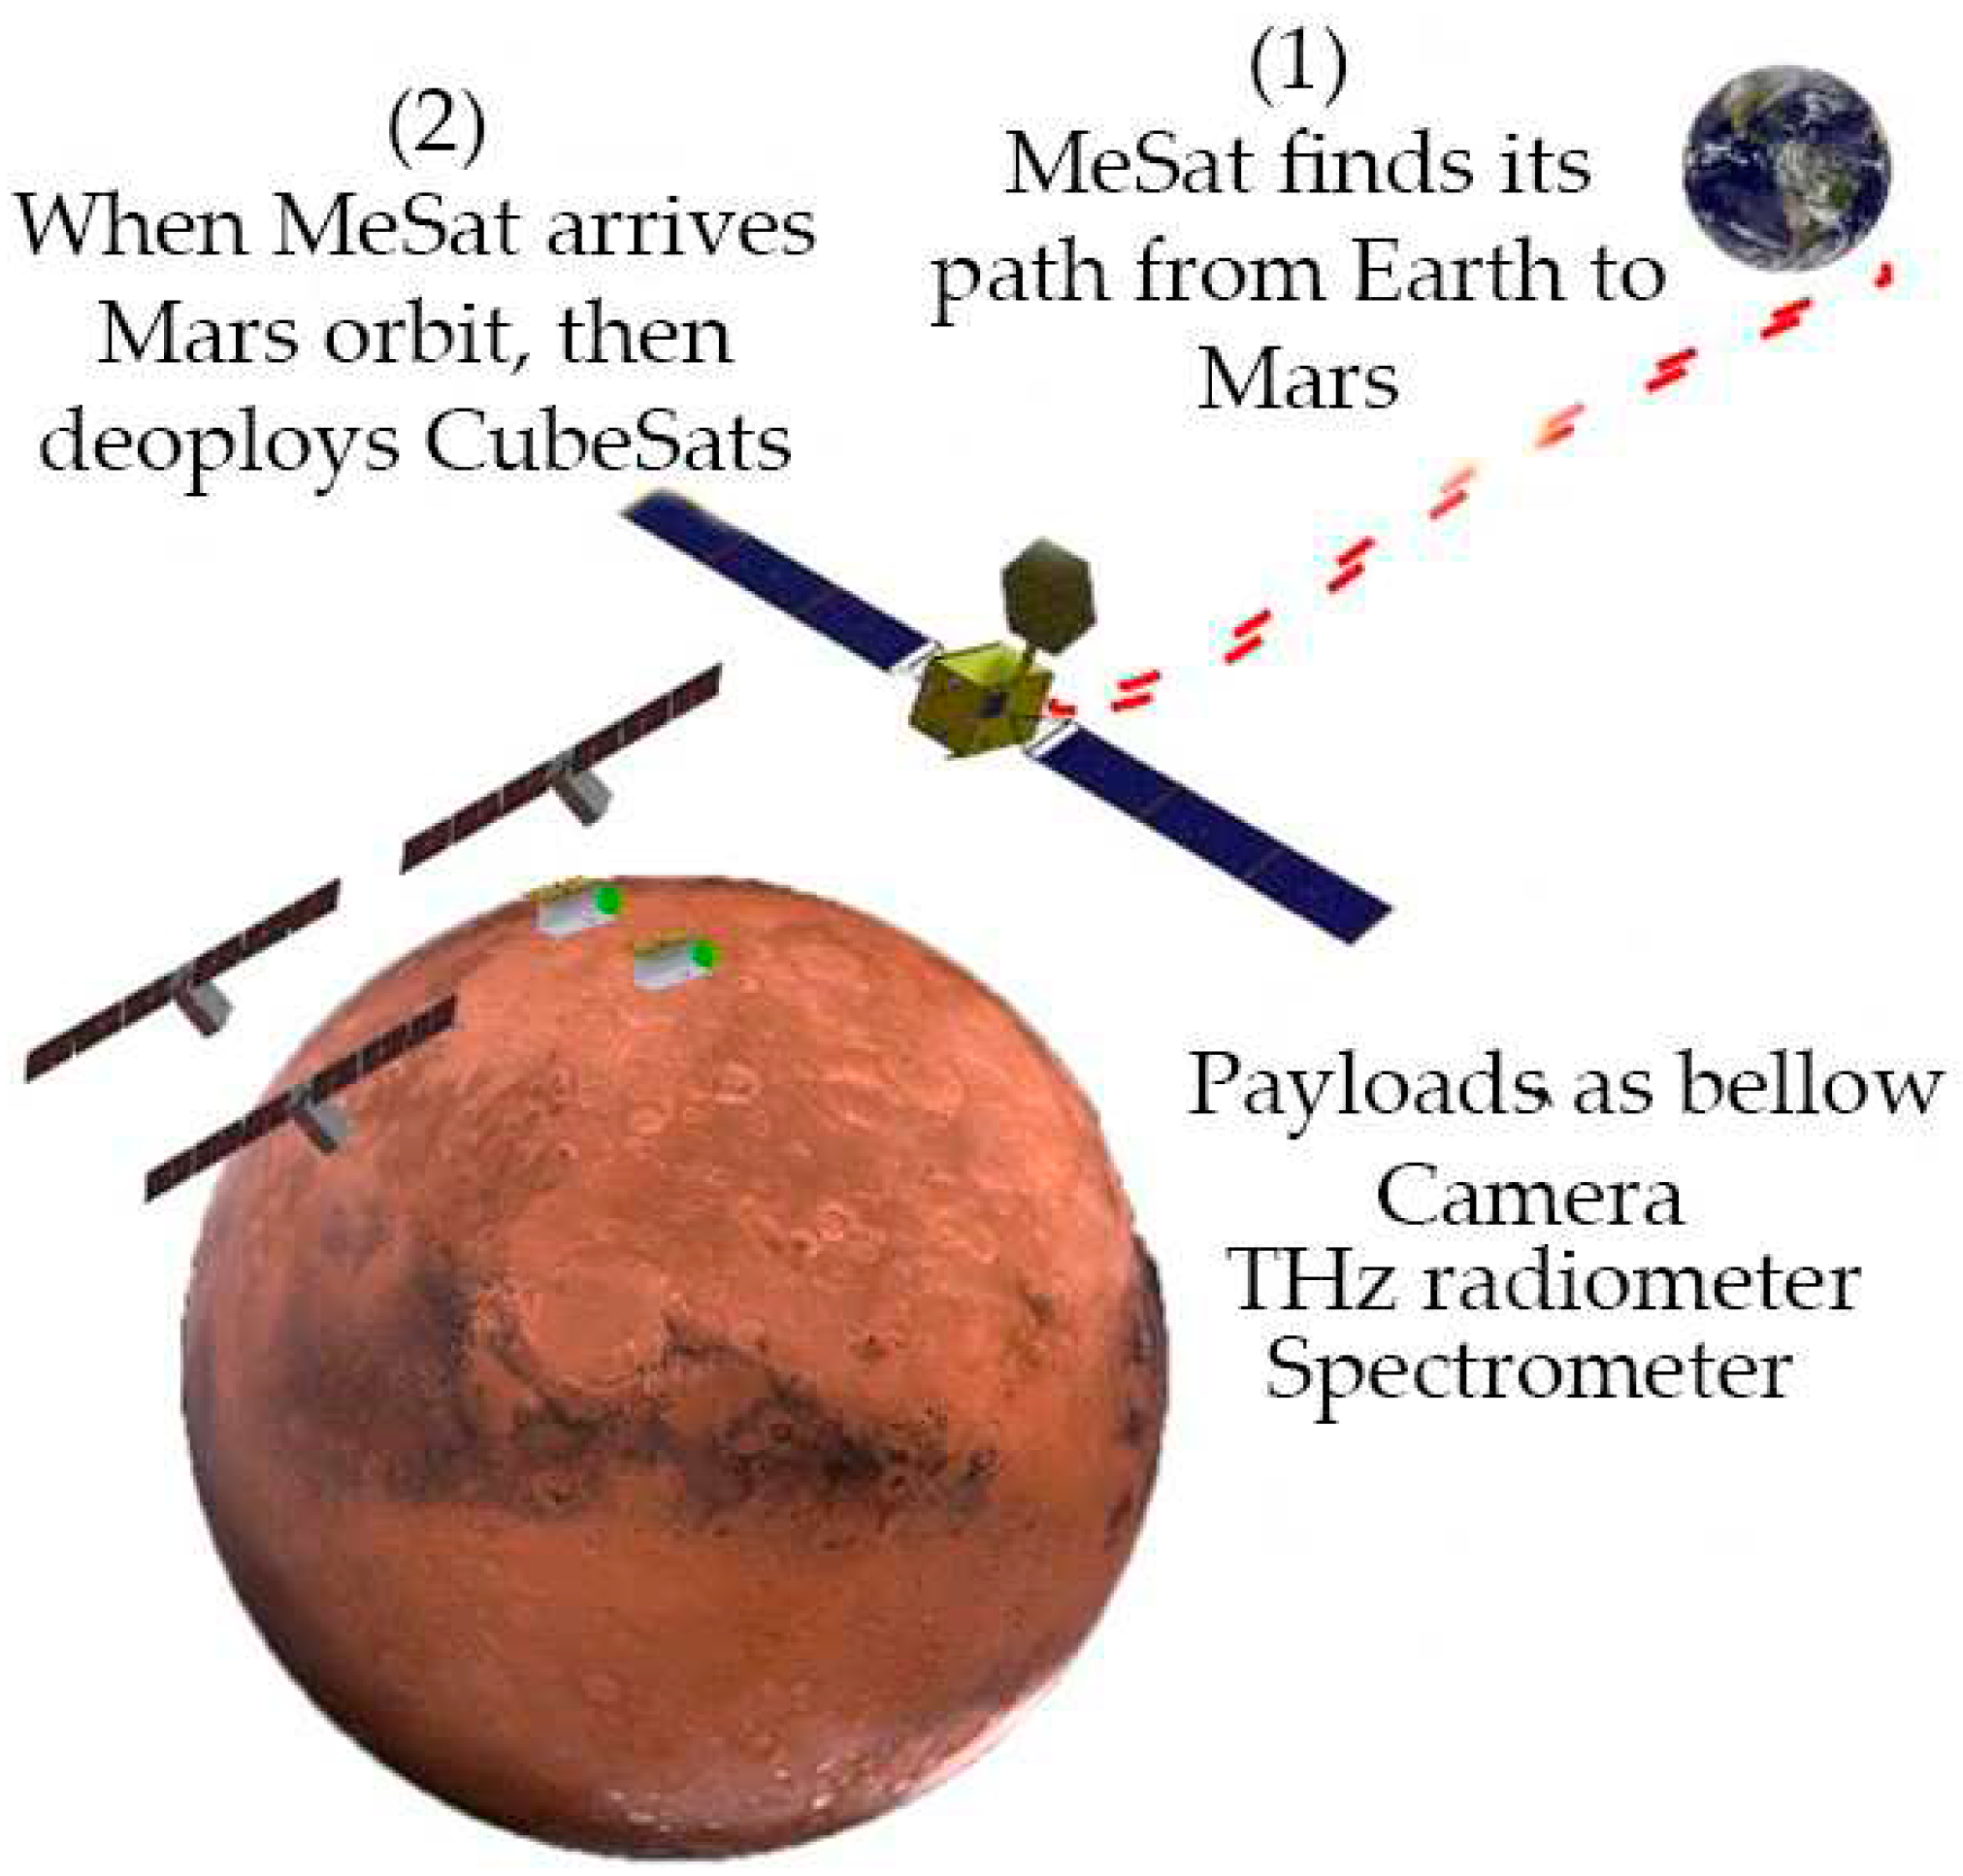
An operational solution for conducting a large-scale exploration on Mars could be the use of a nanosatellite constellation. MeSat involves launching a Cargo microsatellite from Earth to Mars. Four CubeSats will be transported by the Cargo on this voyage to Mars' orbit. Once the Cargo reaches Mars, it dislodges four CubeSats to form the constellation that enable it to explore the Martian environment. The CubeSats communicate with the Cargo and transmit data to the mother ship.
Figure 1 depicts the scenario.
Each satellite in the proposed Mars mission is equipped with a distinct payload designed to gather data on the Martian atmosphere. The advanced instruments on board include a state-of-the-art camera capable of capturing high-resolution images of the Martian surface. Additionally, a Hyperscape spectrometer with a range of 442-884 nm has been included to collect spectroscopy data, providing valuable insights into the composition of the Martian atmosphere. Furthermore, a Fourier Transform spectrometer (FTS) is included to enable precise measurement of Martian wind speed, a critical factor in understanding the planet's weather patterns. To locate water sources on Mars' surface, essential for future exploration and colonization efforts, a novel THz receiver will be deployed. Water may be extracted for use in agriculture, hydrogen refueling for starship propulsion systems, and splitting oxygen for respiration. Our proposed THz payload represents an innovative solution to locate ice water on Mars' surface. It is noteworthy that the photography and wind speed measurement payloads have been utilized in previous CubeSat missions and are commercially available. The main concepts of this paper can be divided into three main categories:
The first aspect of this study concerns the design of an optimal Earth-to-Mars mission, which involves identifying launch windows and minimizing fuel consumption while considering various factors and constraints [
24,
25,
26,
27,
28,
29]. A low-thrust trajectory mission from Earth to Mars is analyzed, taking into account gravitational perturbations due to all planets in the Solar System, solar radiation pressure, and non-spherical perturbations of all planets. A PSO-Homotopy dual-step hybrid optimization algorithm is employed to solve the resulting Multipoint Boundary Value Problems (MPBVP) accurately.
The second aspect of this study involves the proposed THz payload for water detection on Mars' surface, which involves utilizing a miniaturized 183 GHz radiometer as a CubeSat platform for interplanetary missions [
30,
31]. The payload utilizes subharmonic THz mixers, a cutting-edge technology, and a THz smooth-walled horn antenna to reduce the need for deployable mechanisms. An Arduino-based signal generator serves as a local oscillator for the subharmonic mixer, while an STM32 microprocessor analyzes the spectra of the received signals inside the CubeSat.
Finally, this study proposes an optimal power system for satellites, which will be discussed in subsequent sections along with spacecraft architecture, budget analyses, and payload design.
2. Stephan MeSat’s
Following Sections talks through the microsatellite expeditions from earth-to-mars trajectory expansion to set into mars orbit [
32].
Figure 2 explains the expedition. Primarily, MeSat comes to Mars’s orbit, and allocates orientation. Next phase, MeSat orbits Mars axis to disgorge CubeSats.
Figure 3 depicts CubeSat modes [
33]. Follows all single modes are reconnoitered.
Safe Mode: Safe mode, which is initiated after the CubeSats are deployed from the MeSat into Mars orbit. In this mode, the CubeSats power up their Electronic Power Subsystem (EPS) and On-Board Data Handling Subsystem (OBDH). They then detain for 15 minutes to ensure that their batteries are charged, and deployable mechanisms are spread properly. Once this is done, the CubeSats broadcast beacon signals to indicate their presence and undertake the next mode of operation. The Safe mode is critical for the CubeSats' successful deployment and operations in the Martian environment.
Recovery mode: The Recovery mode involves the CubeSat's Attitude Determination and Control Subsystem (ADCS) adjusting the orientation of the CubeSats to a nadir pointing attitude, which is necessary for the payloads on the CubeSats to operate effectively on the Martian surface. Once the CubeSats are oriented correctly, they broadcast a beacon signal to indicate their readiness and enter the Normal mode. This mode enables the CubeSats to perform their primary scientific objectives on the Martian surface.
Normal mode: The CubeSats are put in standby mode and await commands from the Ground Segment. The Ground Segment can direct the CubeSats to perform various functional modes such as ADCS, Communication, or Payload modes. The Microsatellite acts as a relay between the CubeSats and the Deep Space Network (DSN) in all modes.
Payload mode: In Payload mode, the CubeSat activates the scientific instruments onboard to collect data about Mars. This could include information about the planet's atmosphere, surface, or any other scientific measurements the CubeSat was designed to make. The data is then stored on a Secure Digital (SD) card. Once the SD card is full, the CubeSat automatically switches to Communication mode to transmit the data back to Earth. This is an important step in the mission, as the scientific data collected by the CubeSats can provide valuable information for research and exploration purposes.
Communication mode: In Communication mode, new commands received from Ground Segment Directives (GSD) are executed. These commands can either be directed to the Microsatellite to broadcast to the CubeSats, or to one of the CubeSats to transmit payload data back to the Microsatellite for relay to GSD. If any anomalies occur during operation, the CubeSats can jump to Safe mode, where all subsystems turn OFF and the batteries recharge to increase power levels. After executing each functional mode, the CubeSats return to Normal mode and wait for new GS commands.
To validate the power system and layouts of the solar cells on the satellite, we conducted an investigation into the satellite's power budget, as outlined in
Table 1.
Link Budget
In order to ensure reliable communication between the Cargo microsatellite and the Deep Space Network (DSN), a link budget analysis must be performed. This analysis takes into account various factors such as the transmit power of the microsatellite, the antenna gain, the distance between the microsatellite and the DSN, and the noise figure of the receiving system. By calculating the link budget, we can determine the expected signal strength at the DSN receiver and ensure that it is above the minimum threshold required for reliable communication [
34]. This is critical for the success of the mission, as the Cargo microsatellite serves as the primary means of relaying data between the mothership and CubeSats. Please refer to
Table 2 for the link budget calculations between the mothership and the Deep Space Network (DSN). As the mothership is responsible for directly relaying data to the ground-based DSN, it's crucial to evaluate the link budget between these two nodes [
35].
3. 183GHz subharmonic Schottky diode spectrometer design
We propose the integration of an Arduino-based ADF5355 signal generator as a local oscillator component within the subharmonic mixer of the designated payload. Furthermore, we leverage the capabilities of an Arduino-based microprocessor to efficiently store the payload spectra onto an SD card. Our objective is to present an innovative 183 GHz radiometer that enhances existing THz receivers, thereby advancing the field of THz spectrometry and expanding the utilization of THz payloads in interstellar missions, particularly for the detection of water on the Martian surface [
36]. Water can be effectively identified at central frequencies of 183 GHz, 557 GHz, and 600 GHz [
37]. However, considering the fabrication costs associated with higher frequencies, we have prioritized the central frequency of 183 GHz as the optimal choice for the terahertz payload. This selection ensures a more cost-effective approach while still providing favorable performance characteristics for water detection. By deploying CubeSats, our proposed radiometer represents a significant step towards realizing next-generation THz spectrometry, thus enabling advanced exploration missions in the interstellar realm [
38,
39,
40,
41].
The terahertz payload incorporates a patch antenna as the receiving element for terahertz signals, taking into account the challenges associated with heterodyne receivers at high frequencies, which often entail increased losses [
42,
43]. To address this, subharmonic mixers offer a compelling solution, particularly for direct conversion in millimeter-wavelength ranges. The implementation of a high-frequency local oscillator can be particularly challenging at these frequencies [
44]. Additionally, subharmonic mixers simplify the circuitry and improve the receiver's noise figure, enhancing the overall functionality of the system. One of the most prevalent types of subharmonic mixers is the anti-parallel diode pair (APDP) [
45,
46,
47]. In this study, we propose an optimized CubeSat THz subharmonic mixer specifically designed for water detection on Mars [
48]. The proposed miniaturized THz receiver, is engineered to operate within a 3U CubeSat form factor, with a total power consumption of 3.15W. This compact payload aims to facilitate remote sensing of Mars, with a primary focus on water characterization. In summary, the utilization of subharmonic-based mixers significantly enhances the performance and functionality of the overall system. By proposing a suitable CubeSat THz subharmonic mixer architecture, we enable the detection and analysis of water on Mars, contributing to our understanding of the planet's surface composition and potential habitability.
Basically, in a subharmonic Mixer (SHM) the Local Oscillator (LO) multiplied, therefor the Intermediate Frequency (IF) is generated from the RF frequency and an integer multiple of LO frequency. The LO and RF frequencies are input of the mixer to generate IF frequency [
49,
50].
The term "n" represents the order of the subharmonic mixer in the context of our discussion. For instance, if n=2, it signifies that the Local Oscillator (LO) frequency is half of the Radio Frequency (RF). Thus, n=2 corresponds to a 2× subharmonic mixer, and similarly, n=4 corresponds to a 4× subharmonic mixer. In accordance with this explanation,
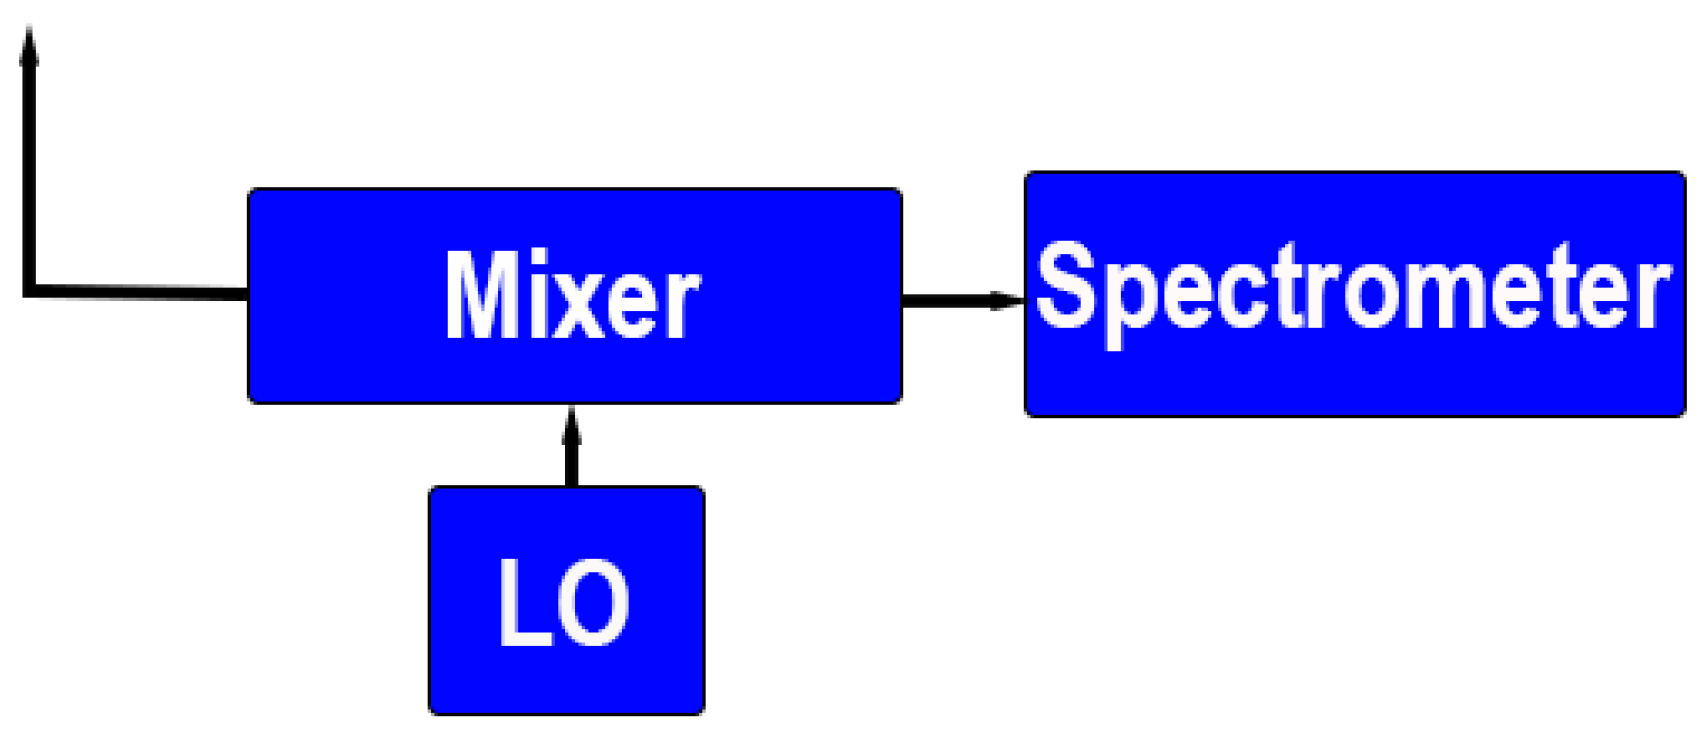
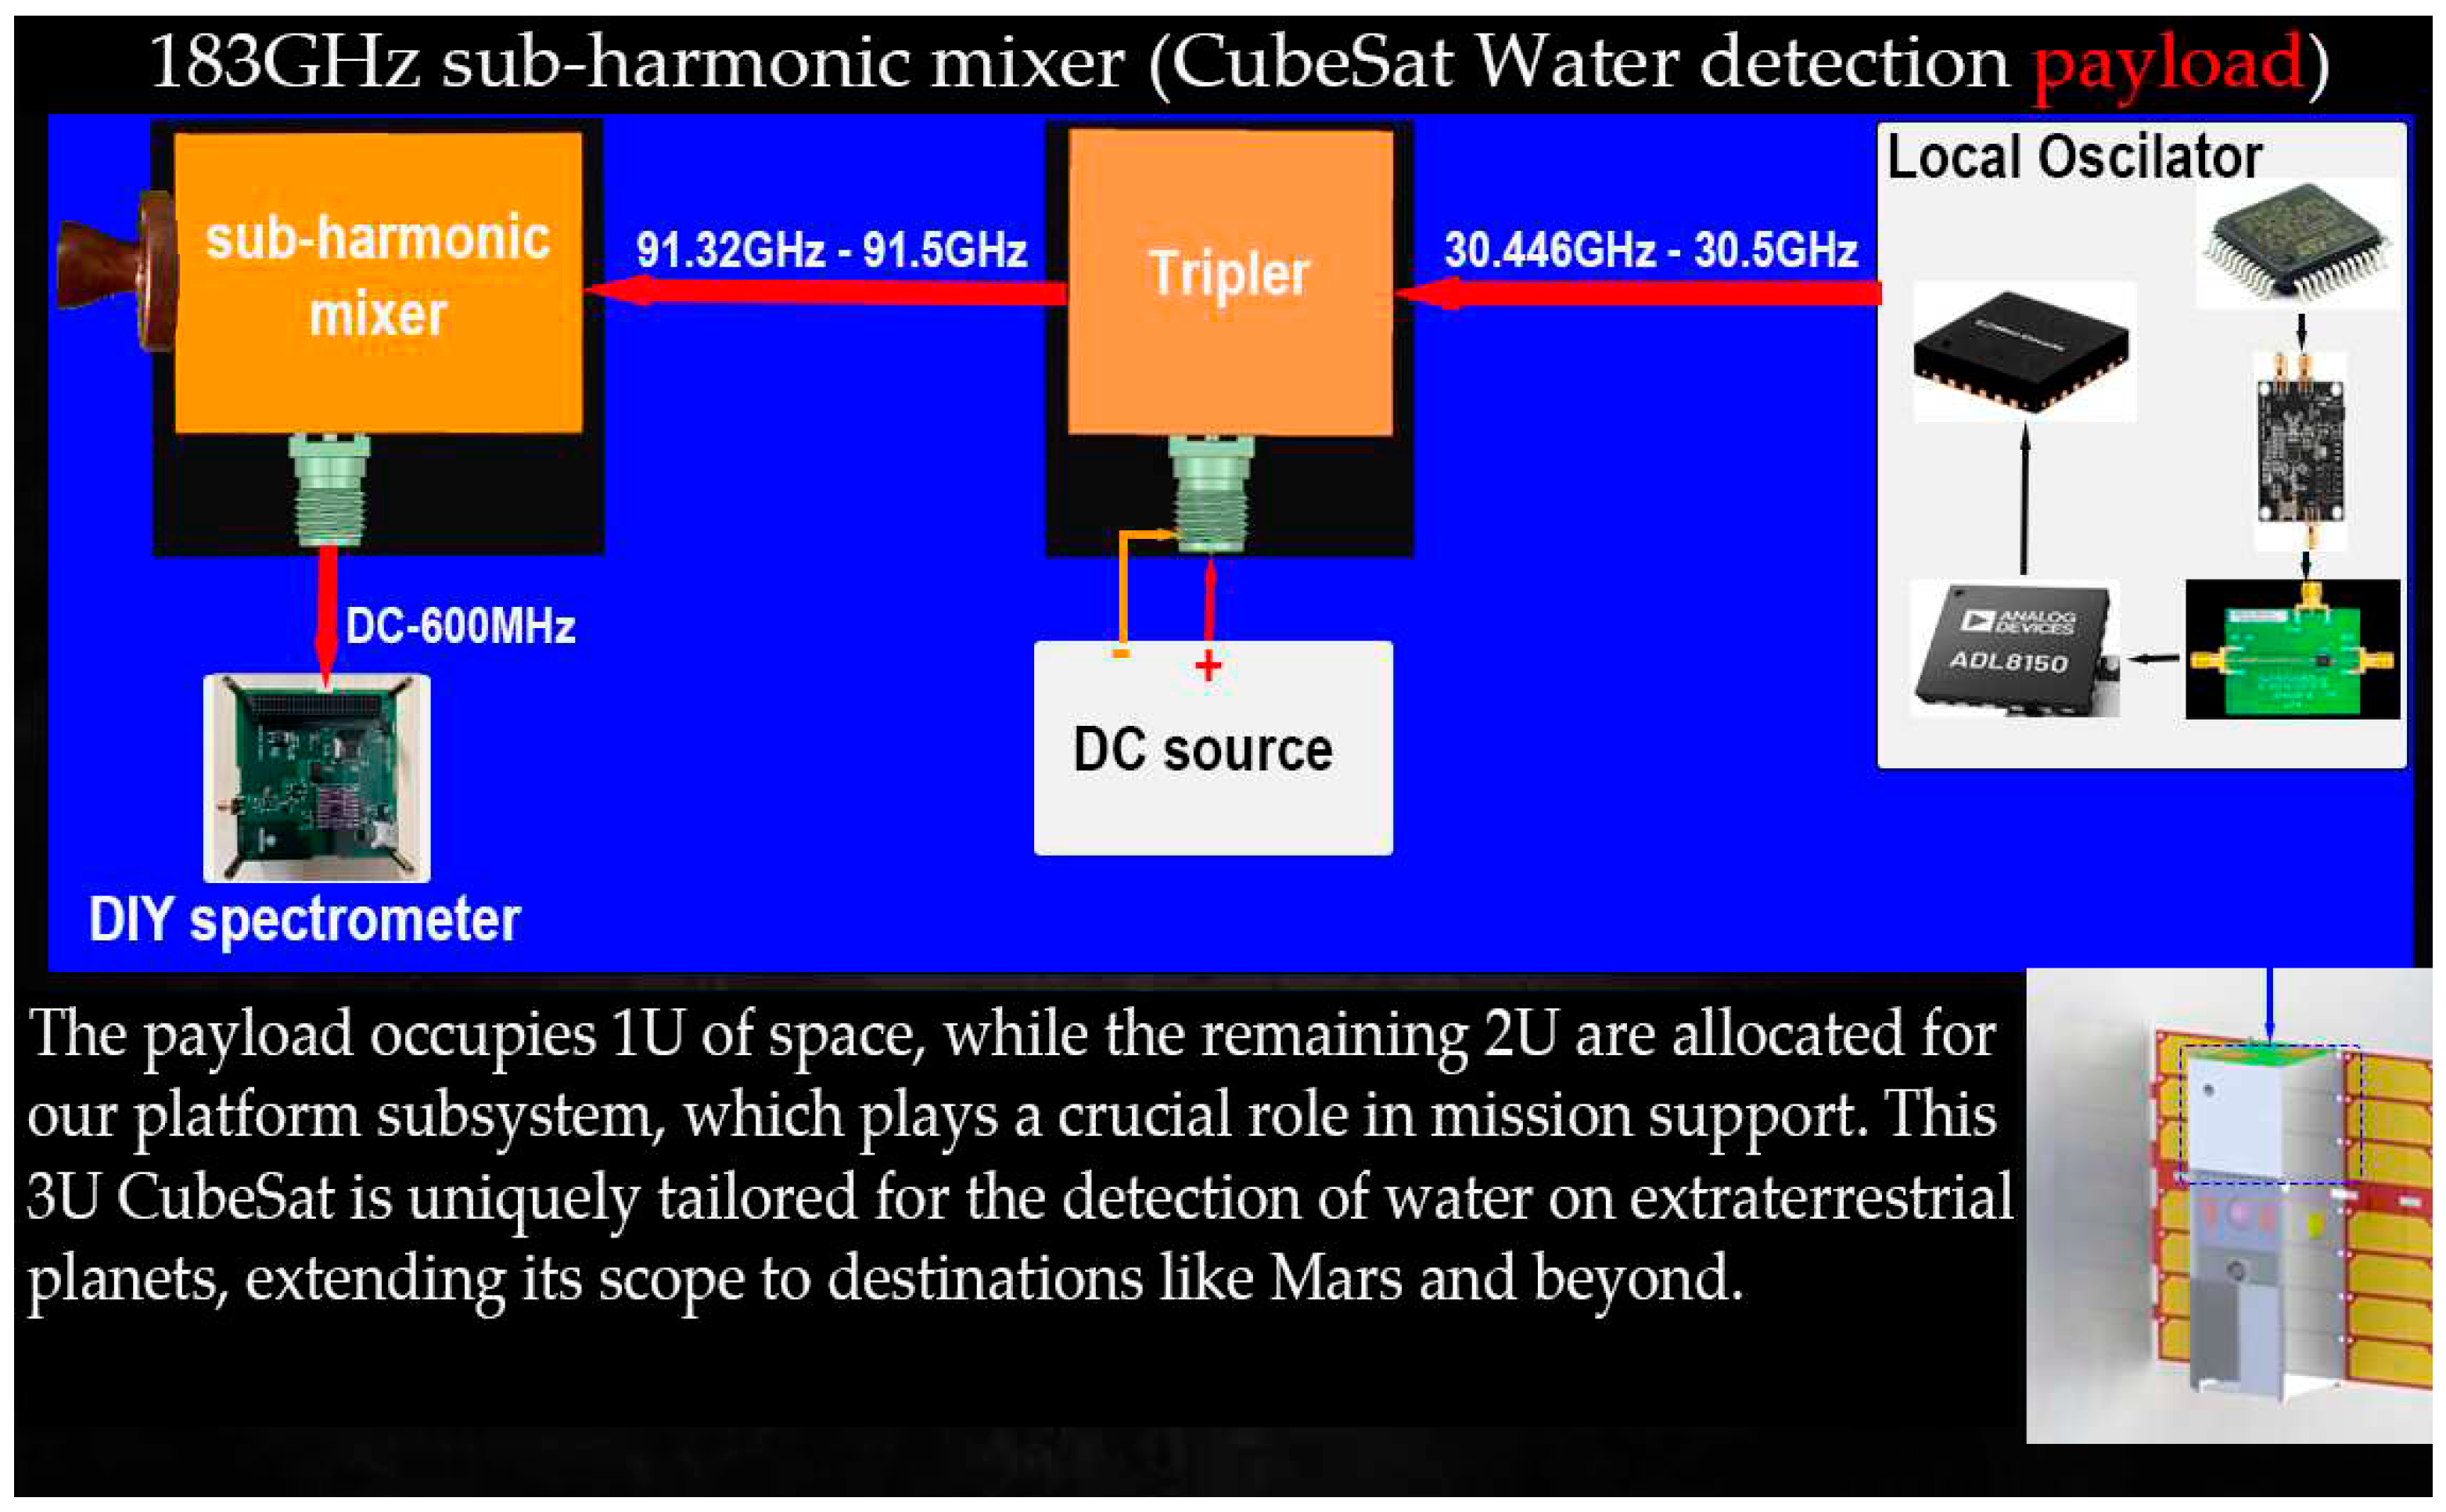
Figure 4 illustrates the fundamental block diagram of the THz payload.
Based on
Figure 4, the proposed payload consists of four main components. Firstly, we employ a smooth-walled horn antenna as the receiving element. Secondly, a subharmonic mixer is utilized to directly convert the 183 GHz frequency to an Intermediate Frequency (IF). The third component is a local oscillator (LO), and finally, a BDSEALY spectrum analyzer, which is an Arduino-based spectrometer, is integrated to display the spectrum density of water signatures.
The spectrum analyzer has a display range of 35 to 1000 MHz. Therefore, to ensure compatibility, the Radio Frequency (RF) signal, after being down-converted to the IF signal, must fall within the DIY spectrometer's frequency range. This means that the LO signals need to be in the range of ±. However, this requirement presents a challenge in generating the LO signal, as the lowest LO frequency should be 91.5 GHz (183 GHz/2). Finding a feasible and compact signal generator capable of producing such a high-frequency LO signal for a CubeSat is not straightforward.
To address this challenge, we have incorporated several frequency multipliers into the design. We will utilize a small and low-power-consumption ADF5355 signal generator, which will be connected to the frequency Multipliers. See
Figure 5.
In the following sections, we provide a detailed explanation of each block and present simulation results for our payload, specifically focusing on the antenna, sub-harmonic mixer, developed three diode anti-parallel Schottky diode. We conducted simulations using HFSS and CST software to ensure a comprehensive evaluation and verification of our 183 GHz radiometer. Subsequently, we imported SNP (S-parameter) files into the Advanced Design System (ADS) software for further calculations and impedance matching.
Beginning with the antenna section, we elaborate on its design and characteristics, including the utilization of specific antenna elements such as horn antenna or other suitable configurations. The simulation results, acquired through CST software, serve to assess the antenna's performance in terms of gain, radiation pattern, and impedance matching, thus validating its appropriateness for the intended application. Moving on to the sub-harmonic mixer, we expound on its functionality and its role in direct frequency conversion. Each crucial element within the anti-parallel Schottky diode mixer is meticulously simulated. Subsequently, SNP files are integrated into the ADS software for further simulations and impedance matching. The results yield confirmation of a 9dB mixer conversion loss, affirming the functionality of the mixer. Once the mixer system is assured, we integrate all other constituent parts to form the complete system. In parallel, a 30 GHz-40 GHz frequency Tripler CAD model is designed in HFSS software. Key elements are initially designed and simulated, and SNP files are then imported into the ADS system for subsequent simulations and system impedance matching. This systematic approach results in the achievement of a 2.5% power Tripler power conversion. Continuing with the simulation results of our proposed local oscillator, we substantiate its functionality in generating the requisite frequency range for mixer down-conversion. By means of analytical simulations, we validate the functionality of our 183 GHz subharmonic mixer spectrometer, demonstrating its capability to fulfill the mission of investigating the Martian surface to detect water.
3.1. Design and Simulation of smooth-walled horn antenna
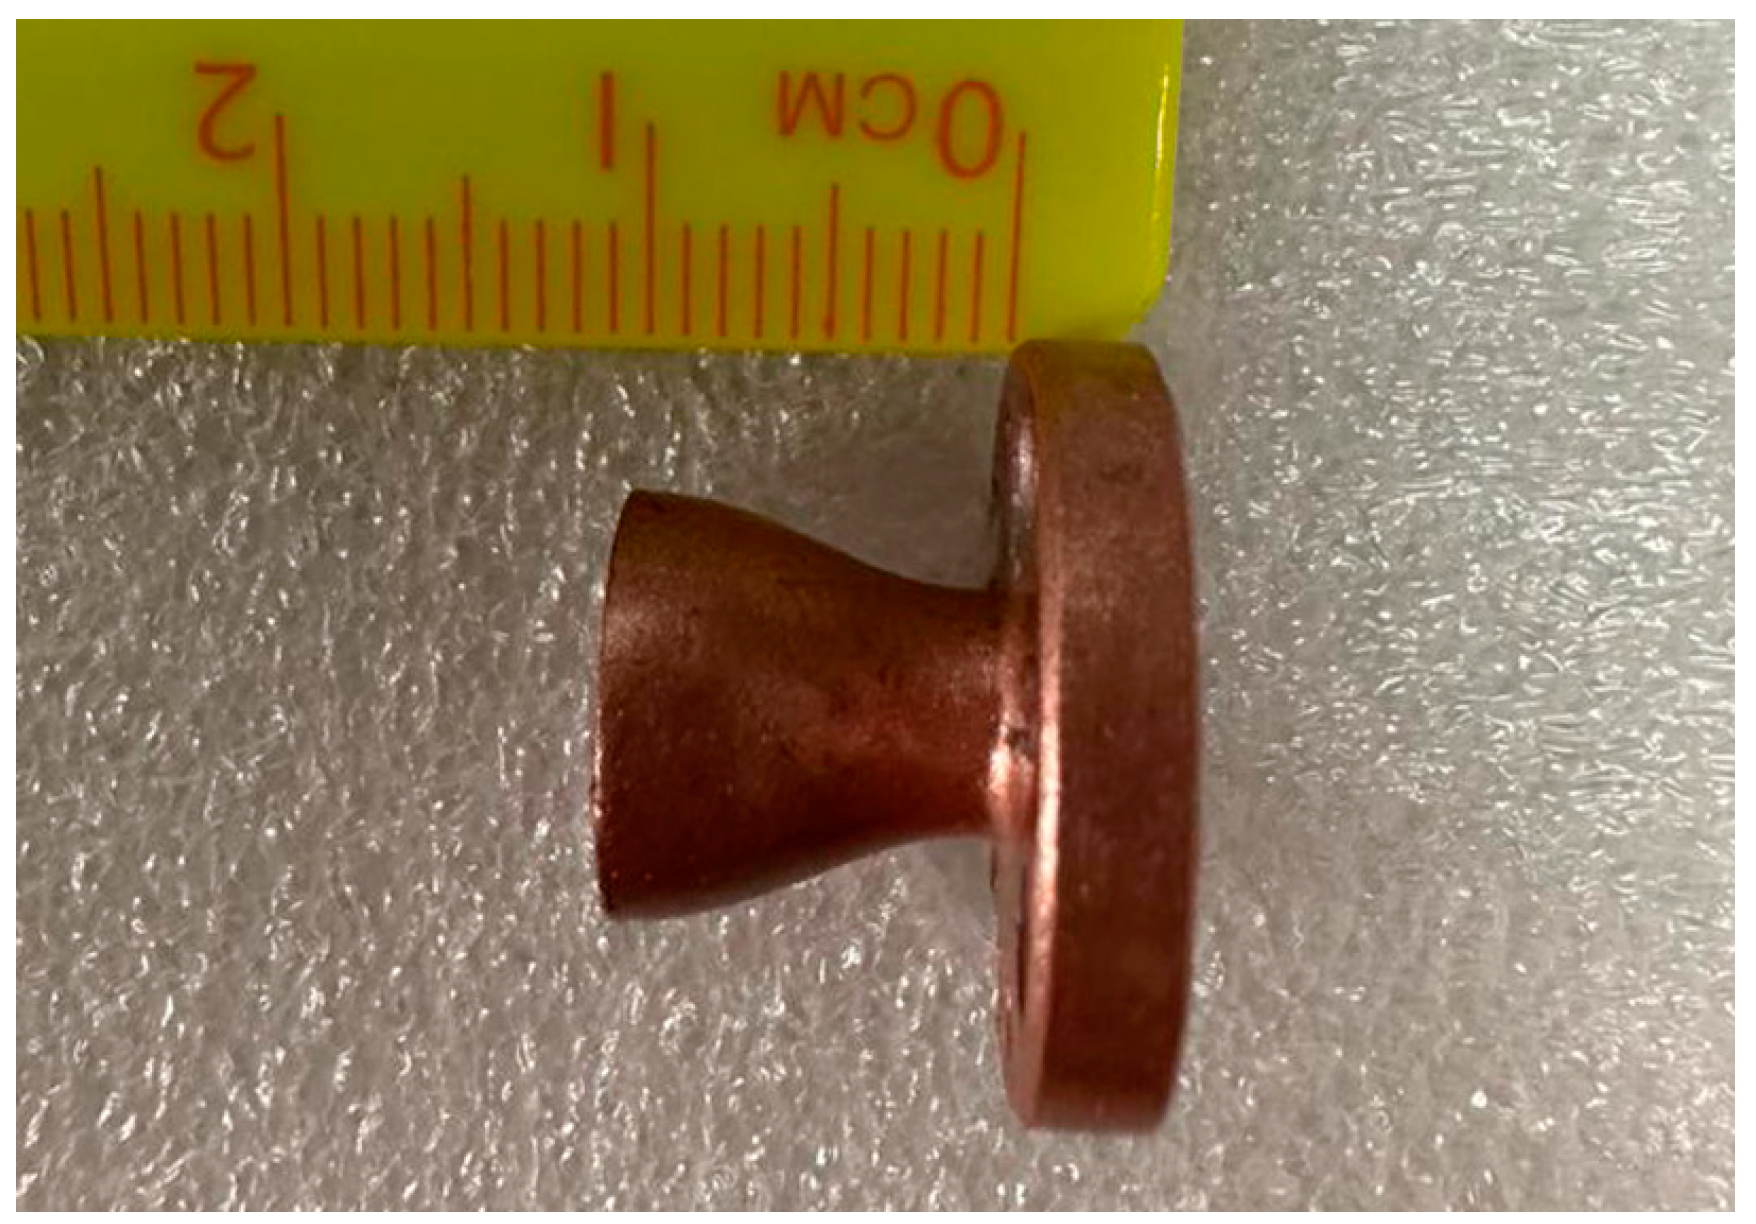
In this paper, we extend our prior research, which entailed the development of a THz payload tailored for the specific task of water detection on the lunar surface. In our current work, we employ a smooth-walled antenna, the specifics of which were comprehensively detailed in our previous publication as referenced in [
51].
Figure 6, we present the fabricated antenna and its associated dimensions. It is important to note that this antenna is well-suited for integration into our proposed THz spectrometer, enabling remote sensing of the lunar surface.
3.2. 183GHz Schotckky Diode subharmonic mixer detailed design
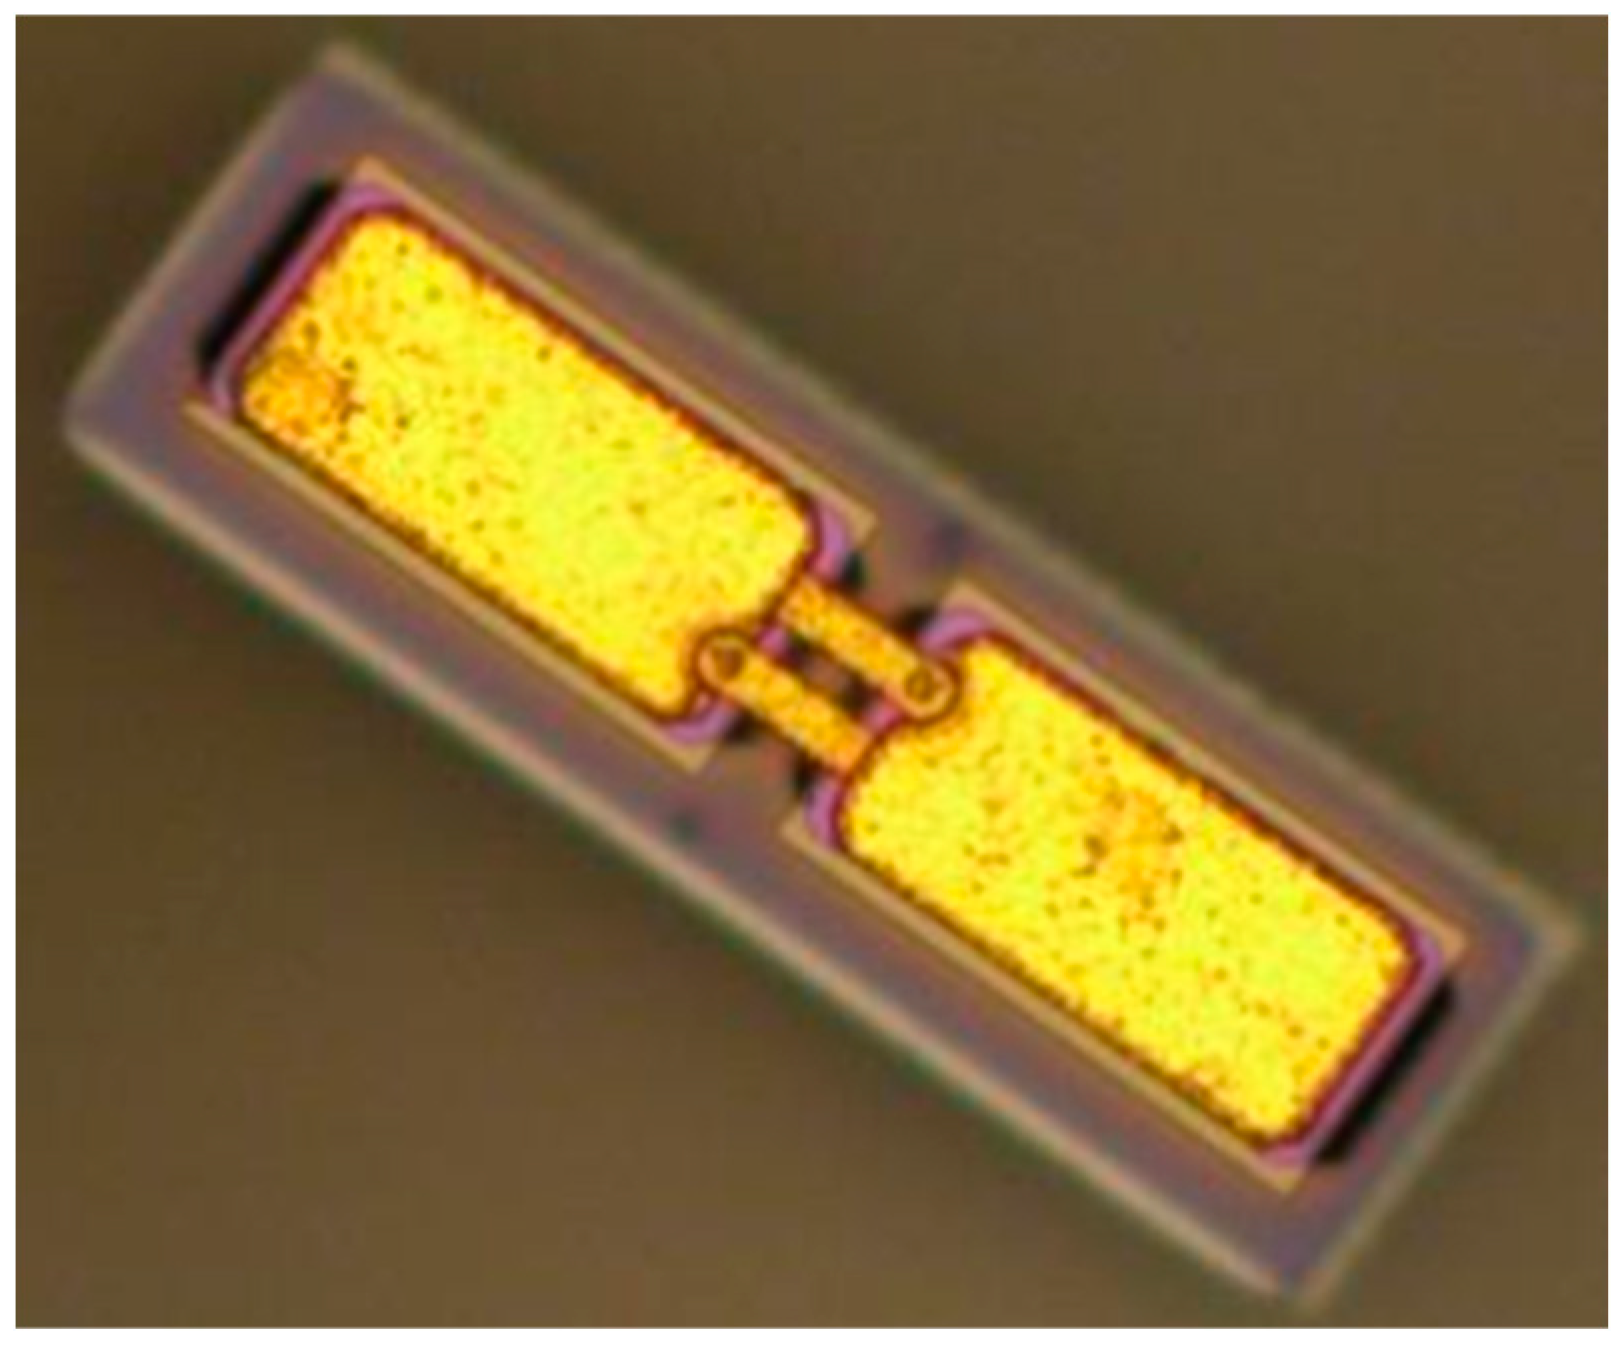
As highlighted in the introduction section, we have identified the significant advantages of employing a Schottky diode sub-harmonic mixer for down-converting water signals to the baseband. To fabricate our sub-harmonic Schottky diode, we utilize an anti-parallel Schottky diode configuration. It's worth noting that the Schottky diode we are using is specifically chosen for its capability to generate even harmonics. This diode's property allows us to leverage the second harmonic for efficient down-conversion of 183GHz input signals to the 1GHz to DC range. This process is particularly effective when we supply the mixer's local oscillator with a 91GHz radio frequency signal. See
Figure 7 to see chosen Schottky diode.
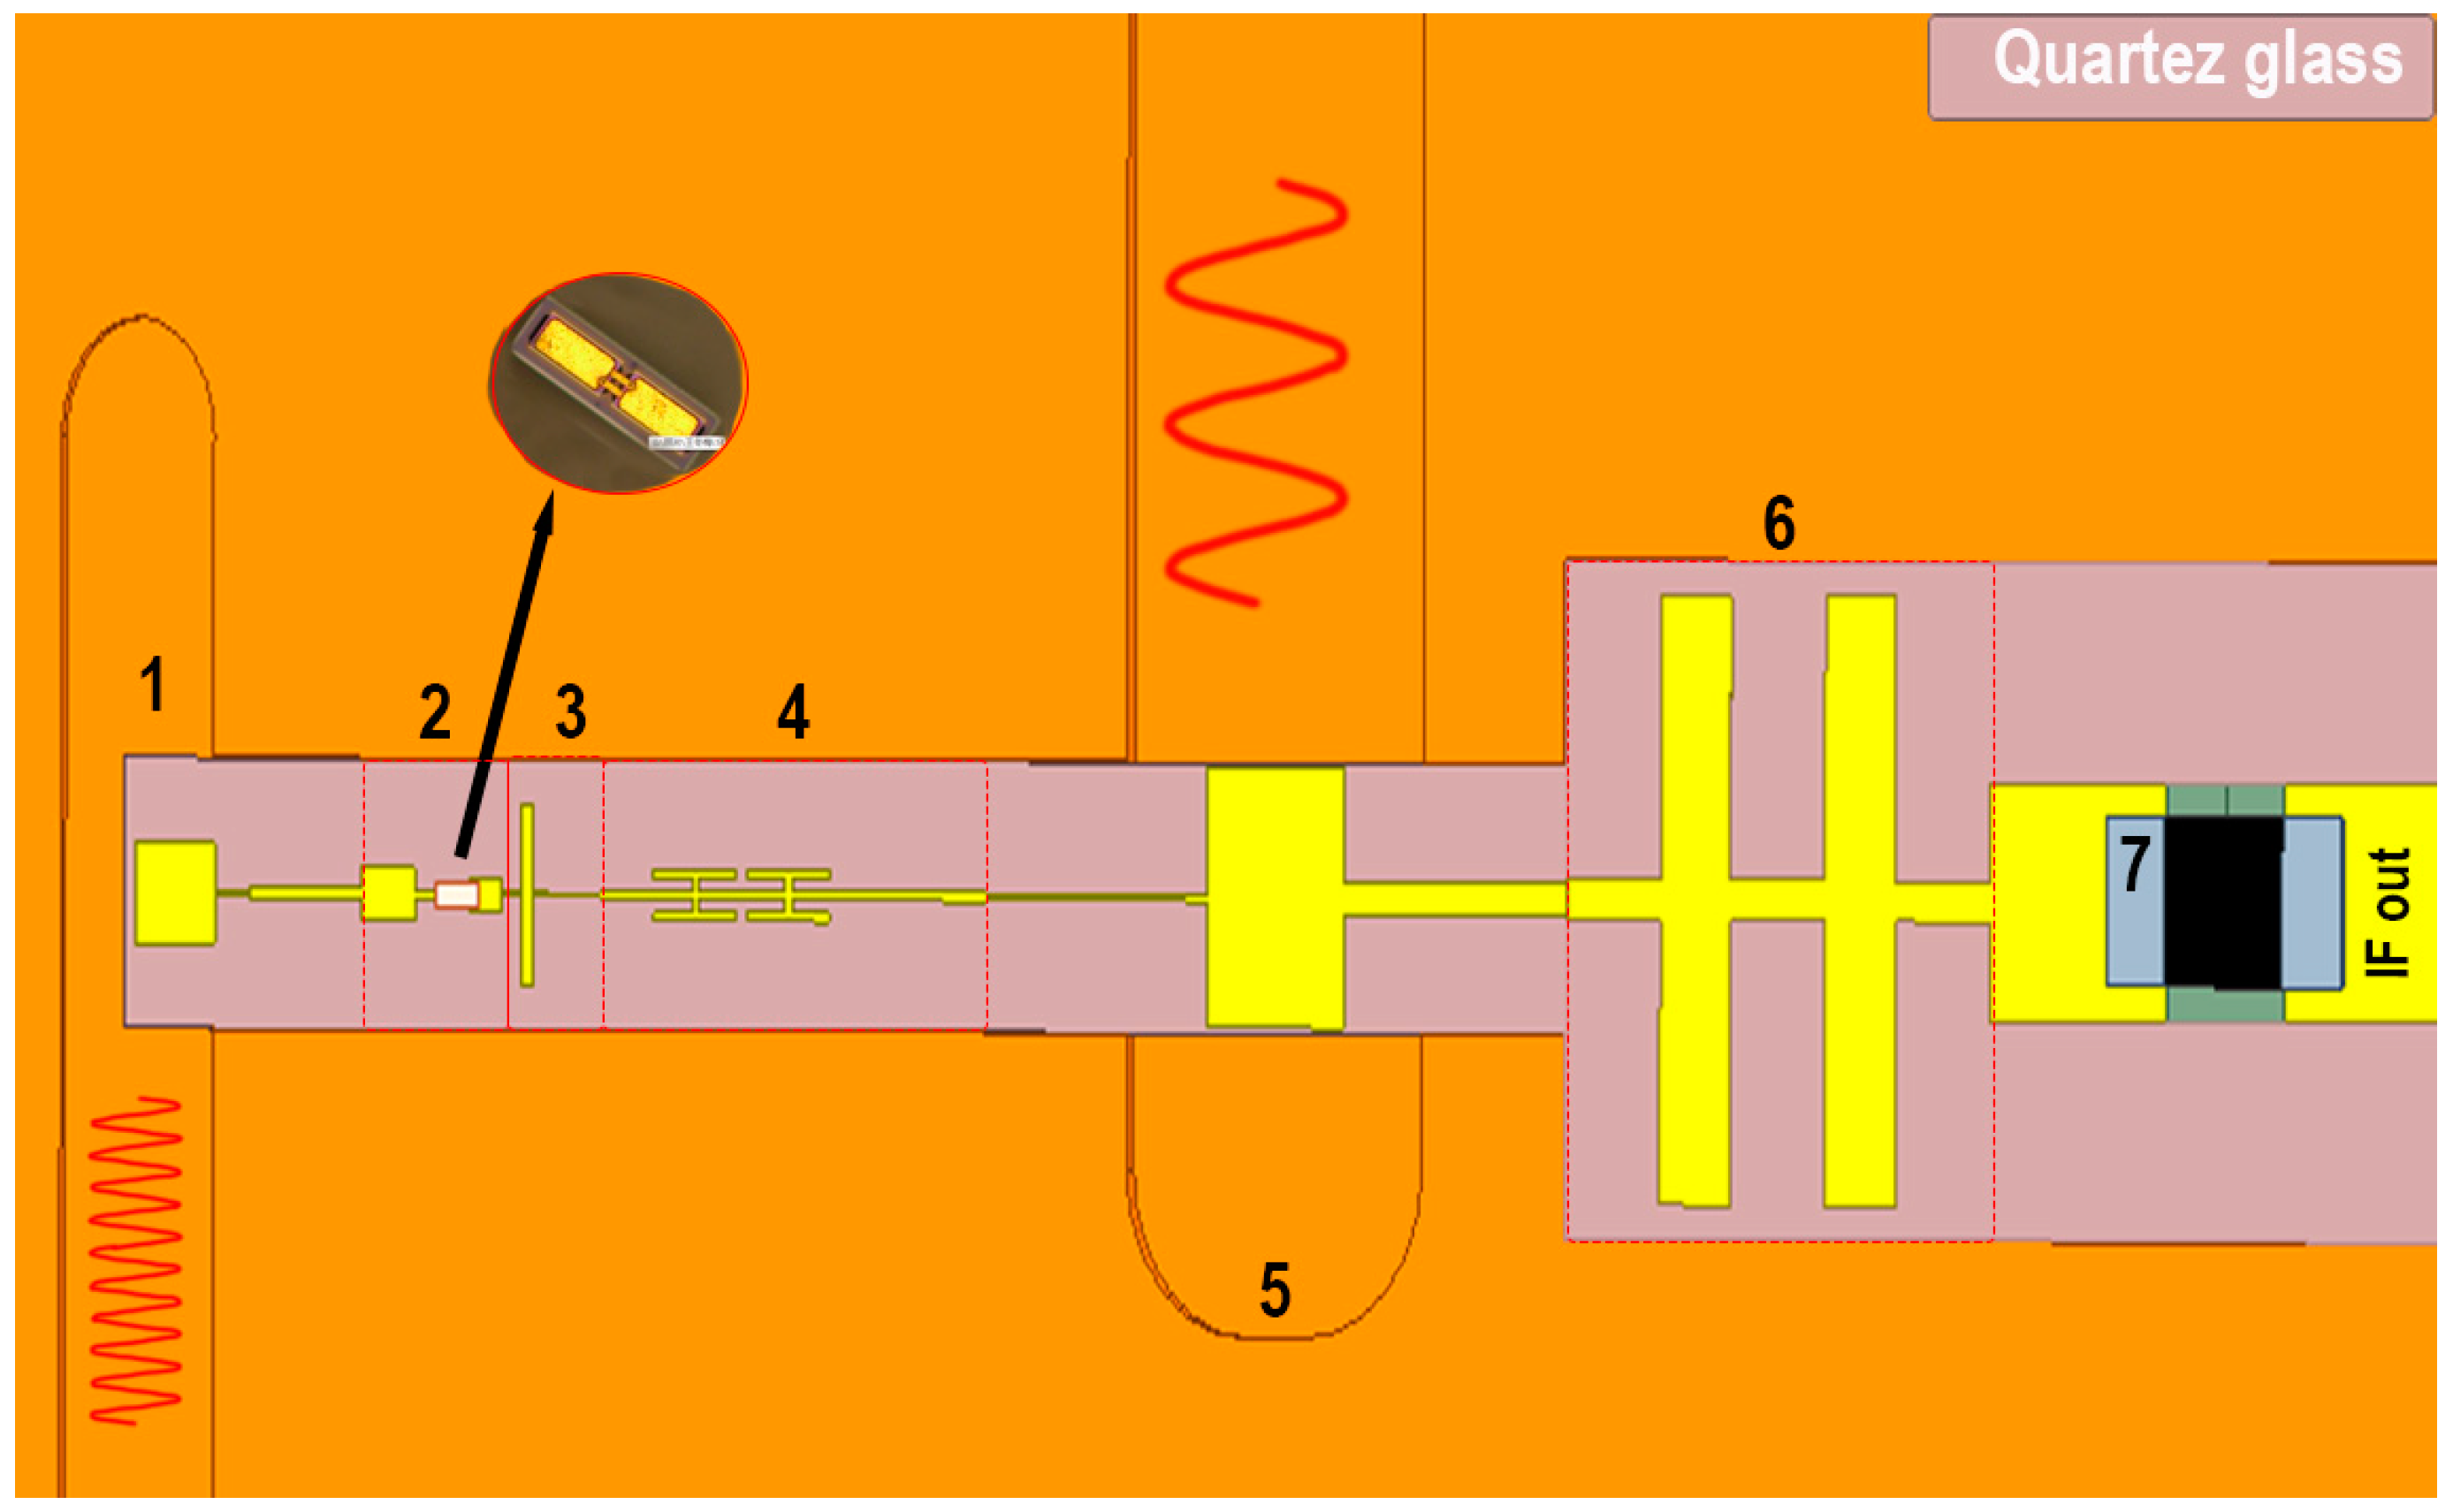
A sub-harmonic mixer comprises five pivotal elements: an RF entry waveguide, an RF Low Pass Filter (LPF) intended to impede the undesired signal leakage from RF to Local Oscillator (LO) components, an LO port, an Intermediate Frequency (IF) LPF, and Schottky diodes. It's important to acknowledge that the performance of each of these constituents can have a notable impact on the conversion losses within both the mixer and the overall system. we firstly design every critical components of mixer on HFSS software after that we enter SNP files of CAD models into Advance Design System to optimize circuit impedance matching. Following
Figure 8 Mixer system in ADS software.
To precisely model the Schottky diode, we employ the Double Lumper Ports Technique (DLPT) instead of the Micro-Coaxial Probe Technique (MCPT) at the junction model of the Schottky diode [
52]. This choice enhances the accuracy of our modeling approach. In contrast to the MCPT, the DLPT no longer necessitates the penetration of the anode into the epitaxial layer. Instead, it simply involves the insertion of two neighboring rectangular sheets into the gap, situated between the anode and the buffer layer. These sheets are designated as lumped ports, each aligned with the other, enhancing the design's efficiency [
53].
To accommodate LO and RF signal entries, we have opted not to employ a half-height waveguide structure. This decision stems from our ability to achieve favorable results, specifically conversion losses better than -10 dBm at the center frequency of 183 GHz. We consider several high and low impedance microstrip lines to match the impedance and in the end to match impedance of 50 Ohm SMA connector to rest of circuit we use a 0402 SMA 150 Ohm Resistor. It enhances the functionality of our mixer. See
Figure 9 for Mixer design details.
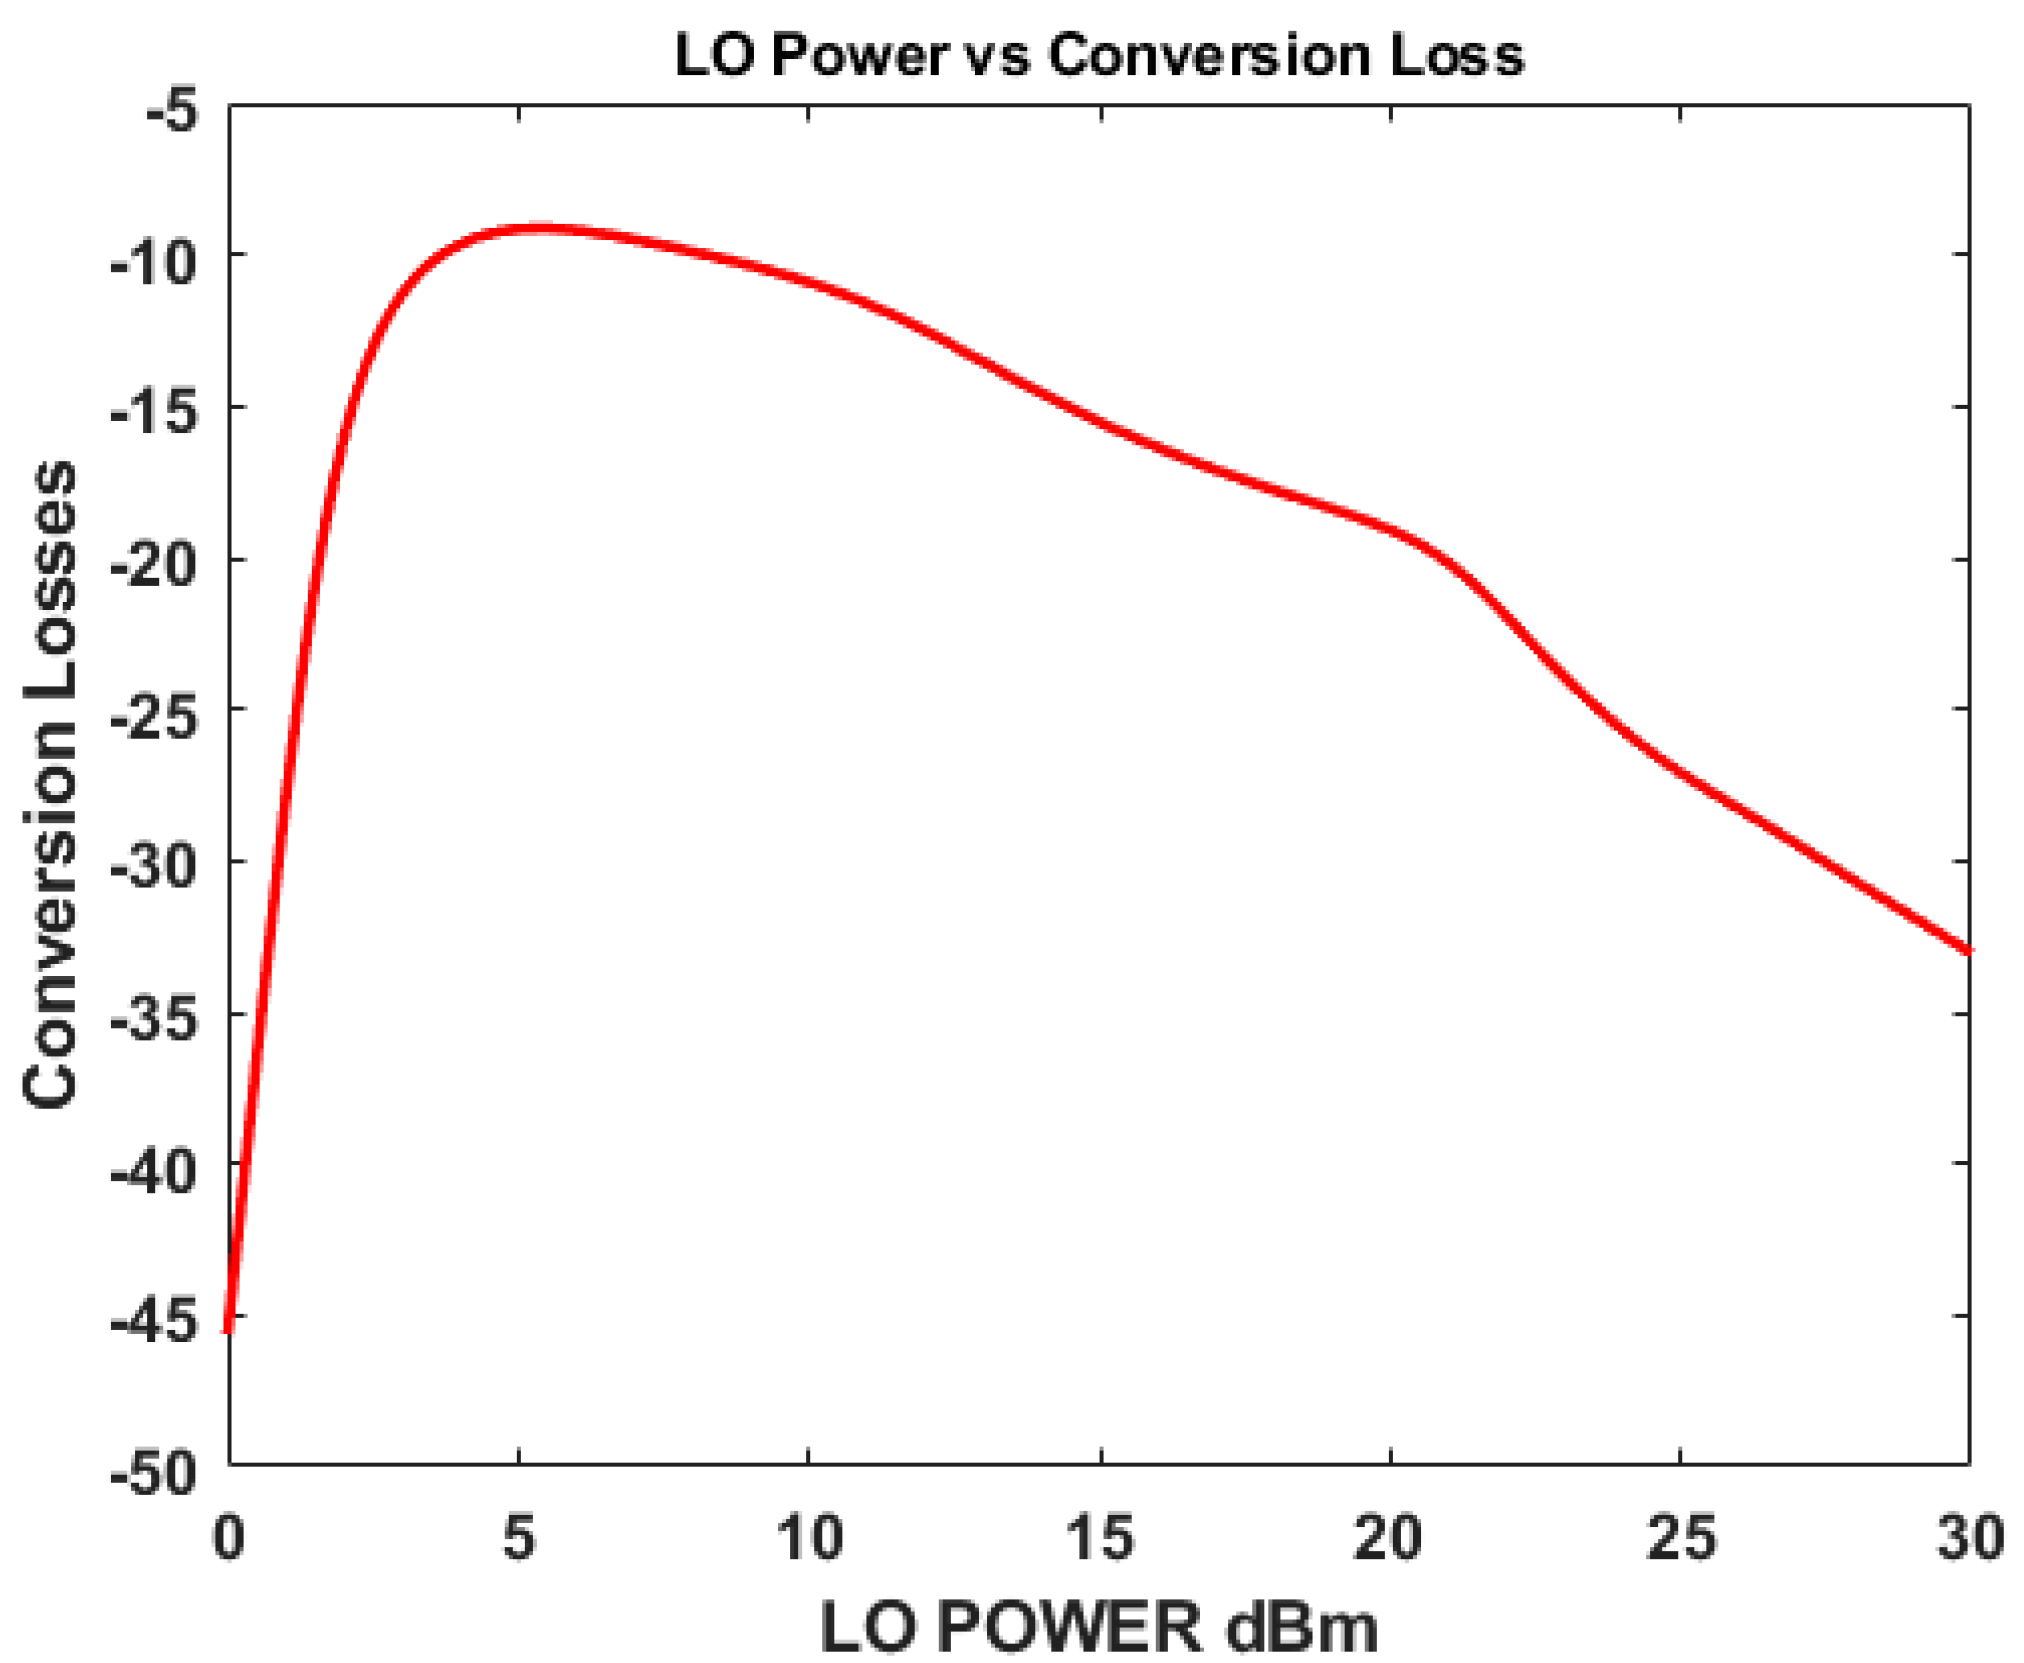
Figure 10 provides valuable insights into the conversion losses of the mixer when subjected to various LO signal power entry levels ranging from 0 dBm to 30 dBm. It's important to note that, throughout these simulations, the RF entry frequency was consistently maintained at 183 GHz, while the LO frequency remained fixed at 91 GHz. The results of the simulations clearly indicate that the optimal range for achieving conversion losses better than -10 dBm falls within the narrow band of LO power entry levels, specifically between 5 dBm and 5.5 dBm. This precise power range is instrumental in ensuring efficient mixer performance and signal conversion.
We contemplate an incoming signal power at -30 dB in the 183 GHz center frequency, accompanied by a Local Oscillator (LO) signal ranging from 91.32 GHz to 91.5 GHz, with a power level between 4 dBm and 10 dBm. This specific frequency range yields a conversion loss of -9 dBm within the 1 GHz to DC Intermediate Frequency (IF) band. The reception of signals in the baseband (IF) confirms the successful detection of water signals by our payload, necessitating further in-depth analysis. To accomplish this, we employ a Microcontroller Unit (MCU)-based spectrometer for the thorough examination of the received signals, and subsequently, data is meticulously processed and prepared for transmission to the CubeSat's primary onboard computer. This data is then poised for transmission back to Earth for comprehensive analysis and interpretation.
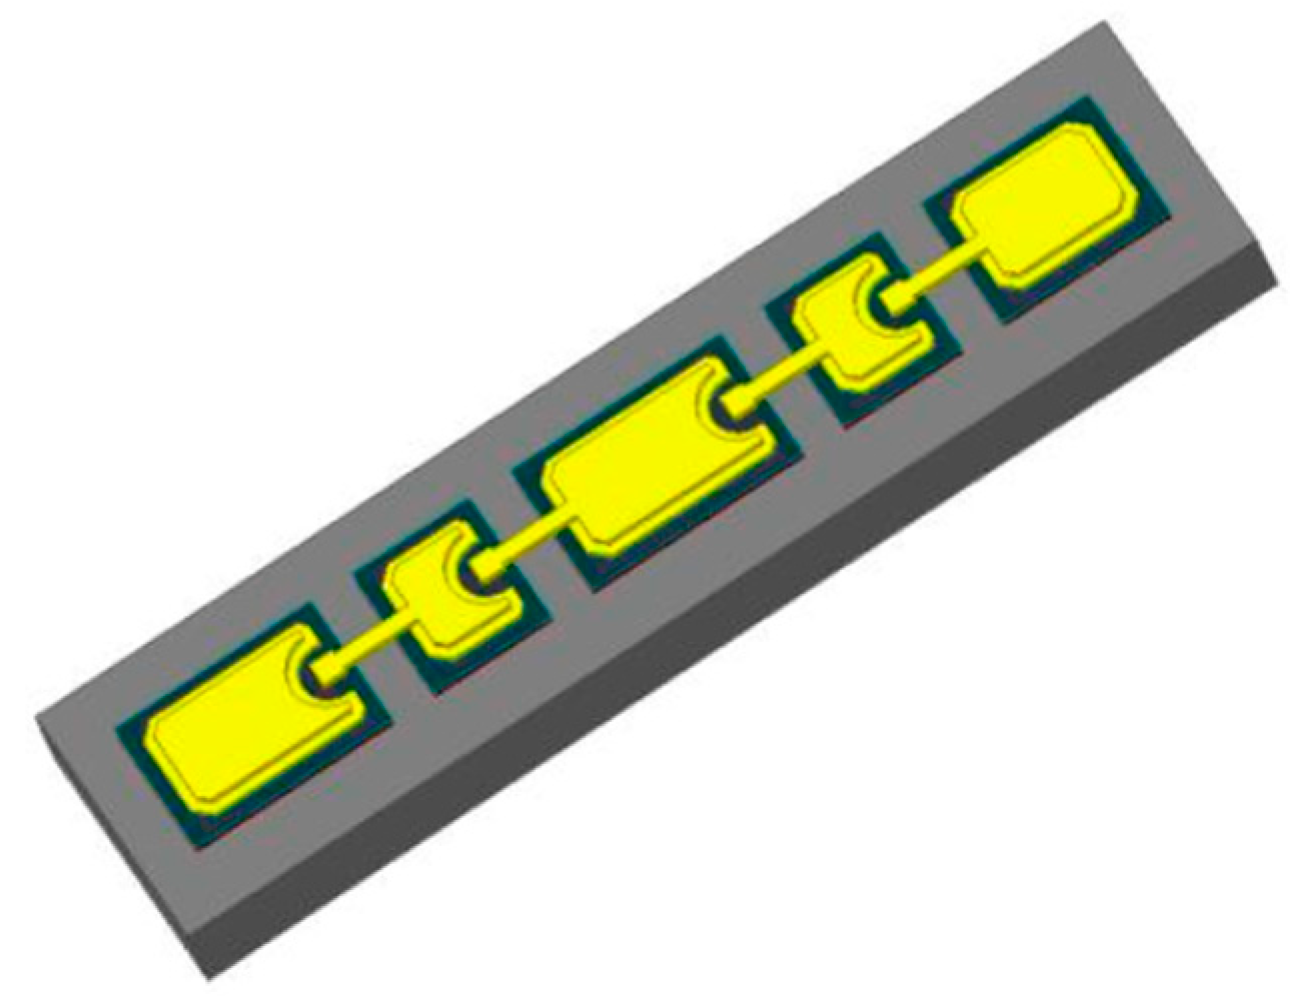
Furthermore, we've successfully developed a frequency Tripler, leveraging the capabilities of three anode Schottky diodes
Figure 9. This Tripler serves as the generator for the Local Oscillator (LO) signal within our THz payload. Logically, to achieve the desired LO frequency range of 91.32 GHz to 91.5 GHz, we must provide the Tripler with an input frequency falling within the range of 30.446 GHz to 30.5 GHz. To enable the seamless integration and operation of this Tripler within a CubeSat, we've implemented a remote-control system for managing its frequency ranges. This control mechanism is achieved through the utilization of a Microcontroller Unit (MCU) to precisely regulate the Tripler's frequency parameters. In order to ensure the efficacy of this solution, we have explored a variety of commercially available RF components to generate the minimum signal input required for the Tripler's operation.
Figure 11 Shows LO system block diagrams.
Figure 12 illustrates the comprehensive design of the Local Oscillator (LO) system. This system incorporates an STM32 microcontroller, which is responsible for receiving commands and fine-tuning the LO frequency range in increments of several megahertz. Given our objective of detecting water, a material with a spectral signature near 183 GHz, the MCU microcontroller plays a crucial role in ensuring precise LO frequency control. It communicates commands to the ADF4351 signal generator, which generates signals within the range of 1.2682 GHz to 1.3332 GHz. Subsequently, the generated signal is multiplied by a factor of 8 by the HMC444 and its power is augmented by 7 dBm. The next stage of the system involves the deployment of the ADL8150A chip, which amplifies the signals to a level of 19.5 dBm, thereby providing an ample entry power for the CY3-453+ commercial signal Tripler. This Tripler effectively multiplies the input signals and generates a signal range falling between 30.446 GHz and 30.5 GHz. +
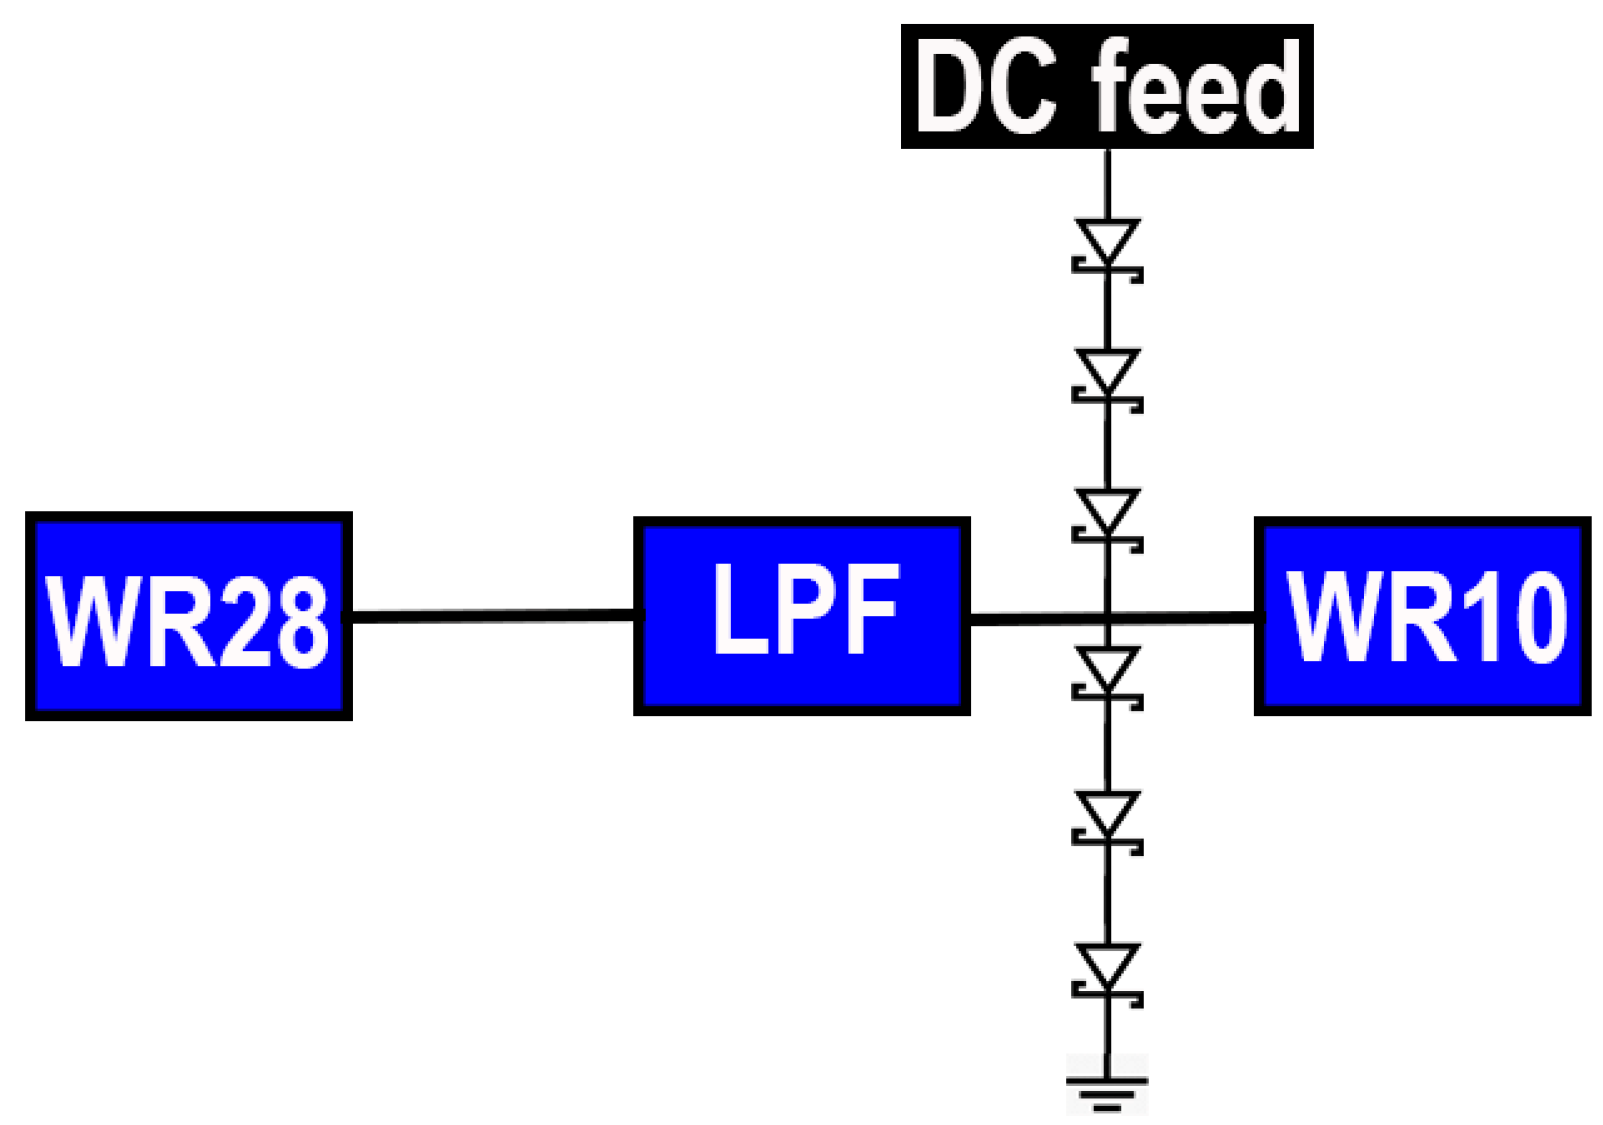
To further expand the LO frequency range, the generated signals are fed into our Schottky diode Tripler, which is constructed using three-anode Schottky diodes. This stage yields LO frequencies within the range of 91.32 GHz to 91.5 GHz. It's noteworthy that the conversion loss of our developed Tripler is approximately -15 dBm. In our methodology, we initiate the simulation of the Tripler's critical parameters using HFSS software. Subsequently, we import SNP files into ADS software to delve into further optimization and address impedance matching intricacies. In the Tripler's intricate design, we deploy DLPT, which enables a precise analysis of the Schottky diode. Moreover, we've incorporated a DC port dedicated to the Tripler's three anode Schottky diode, allowing us to administer bias voltage to their anodes. The bias voltage spans from -5V to 1V, affording a wide range of control over the diode operation. See
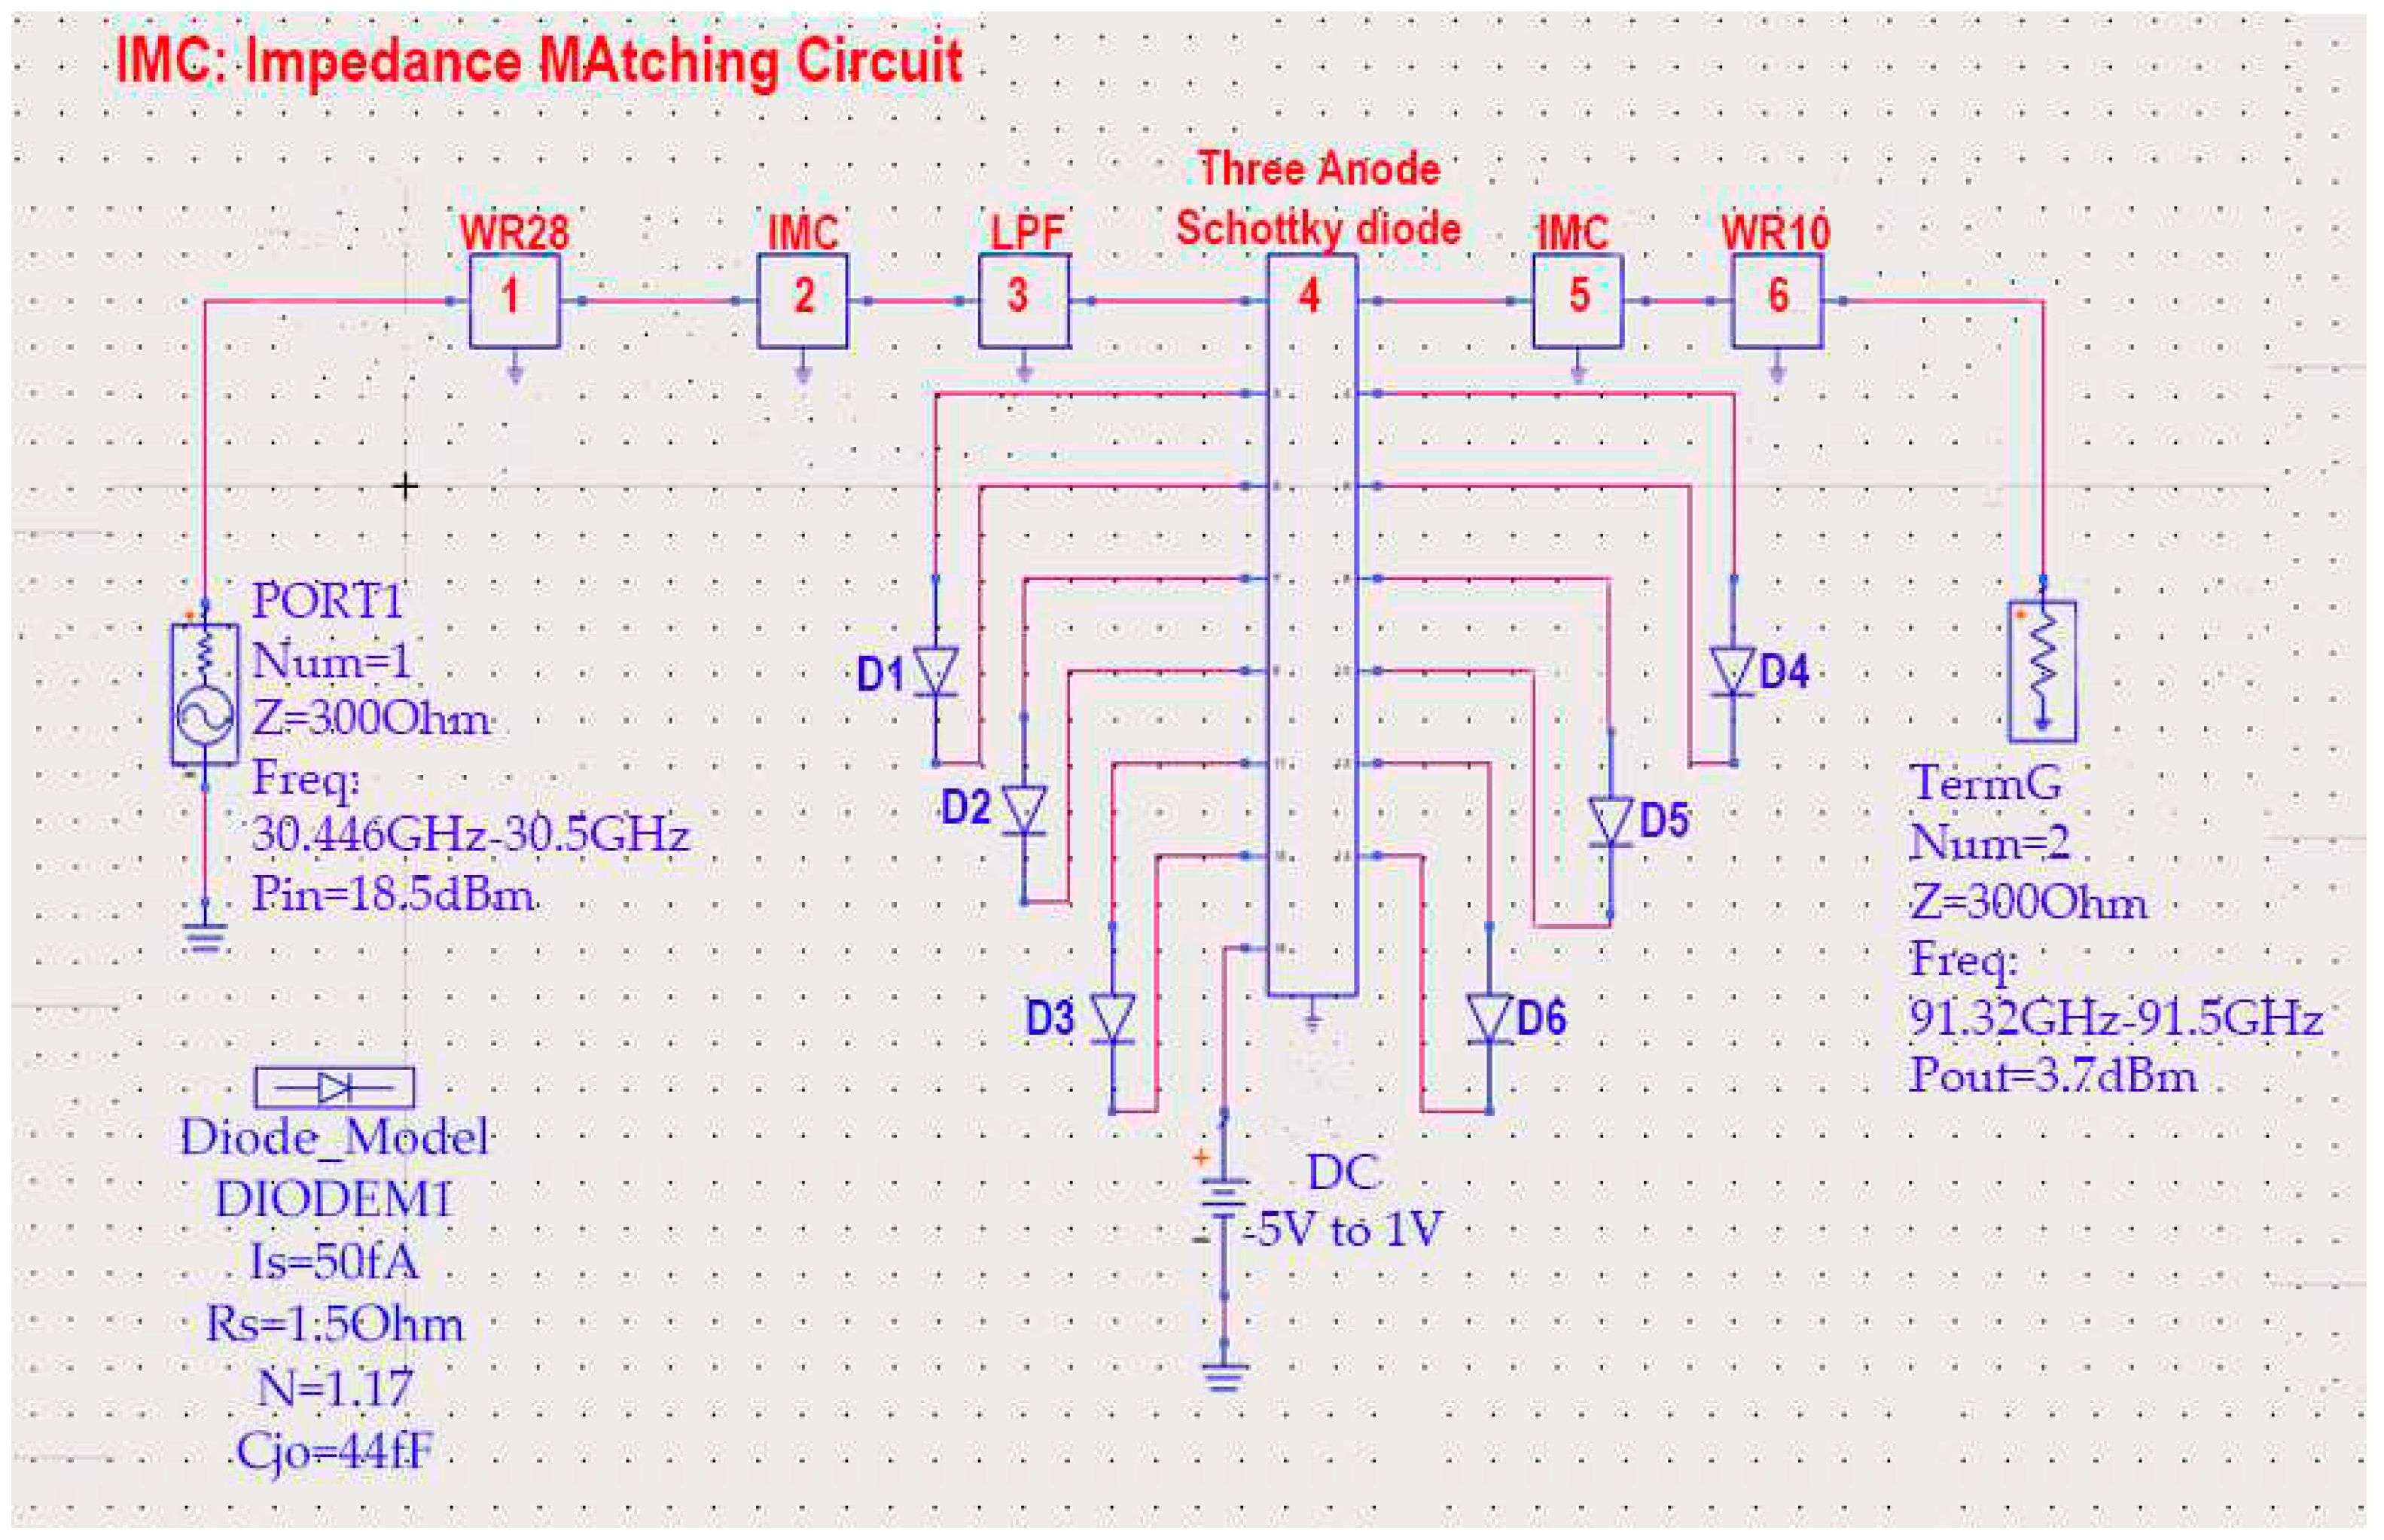
Figure 13 for Tripler general block diagram and
Figure 14 for Tripler ADS simulation.
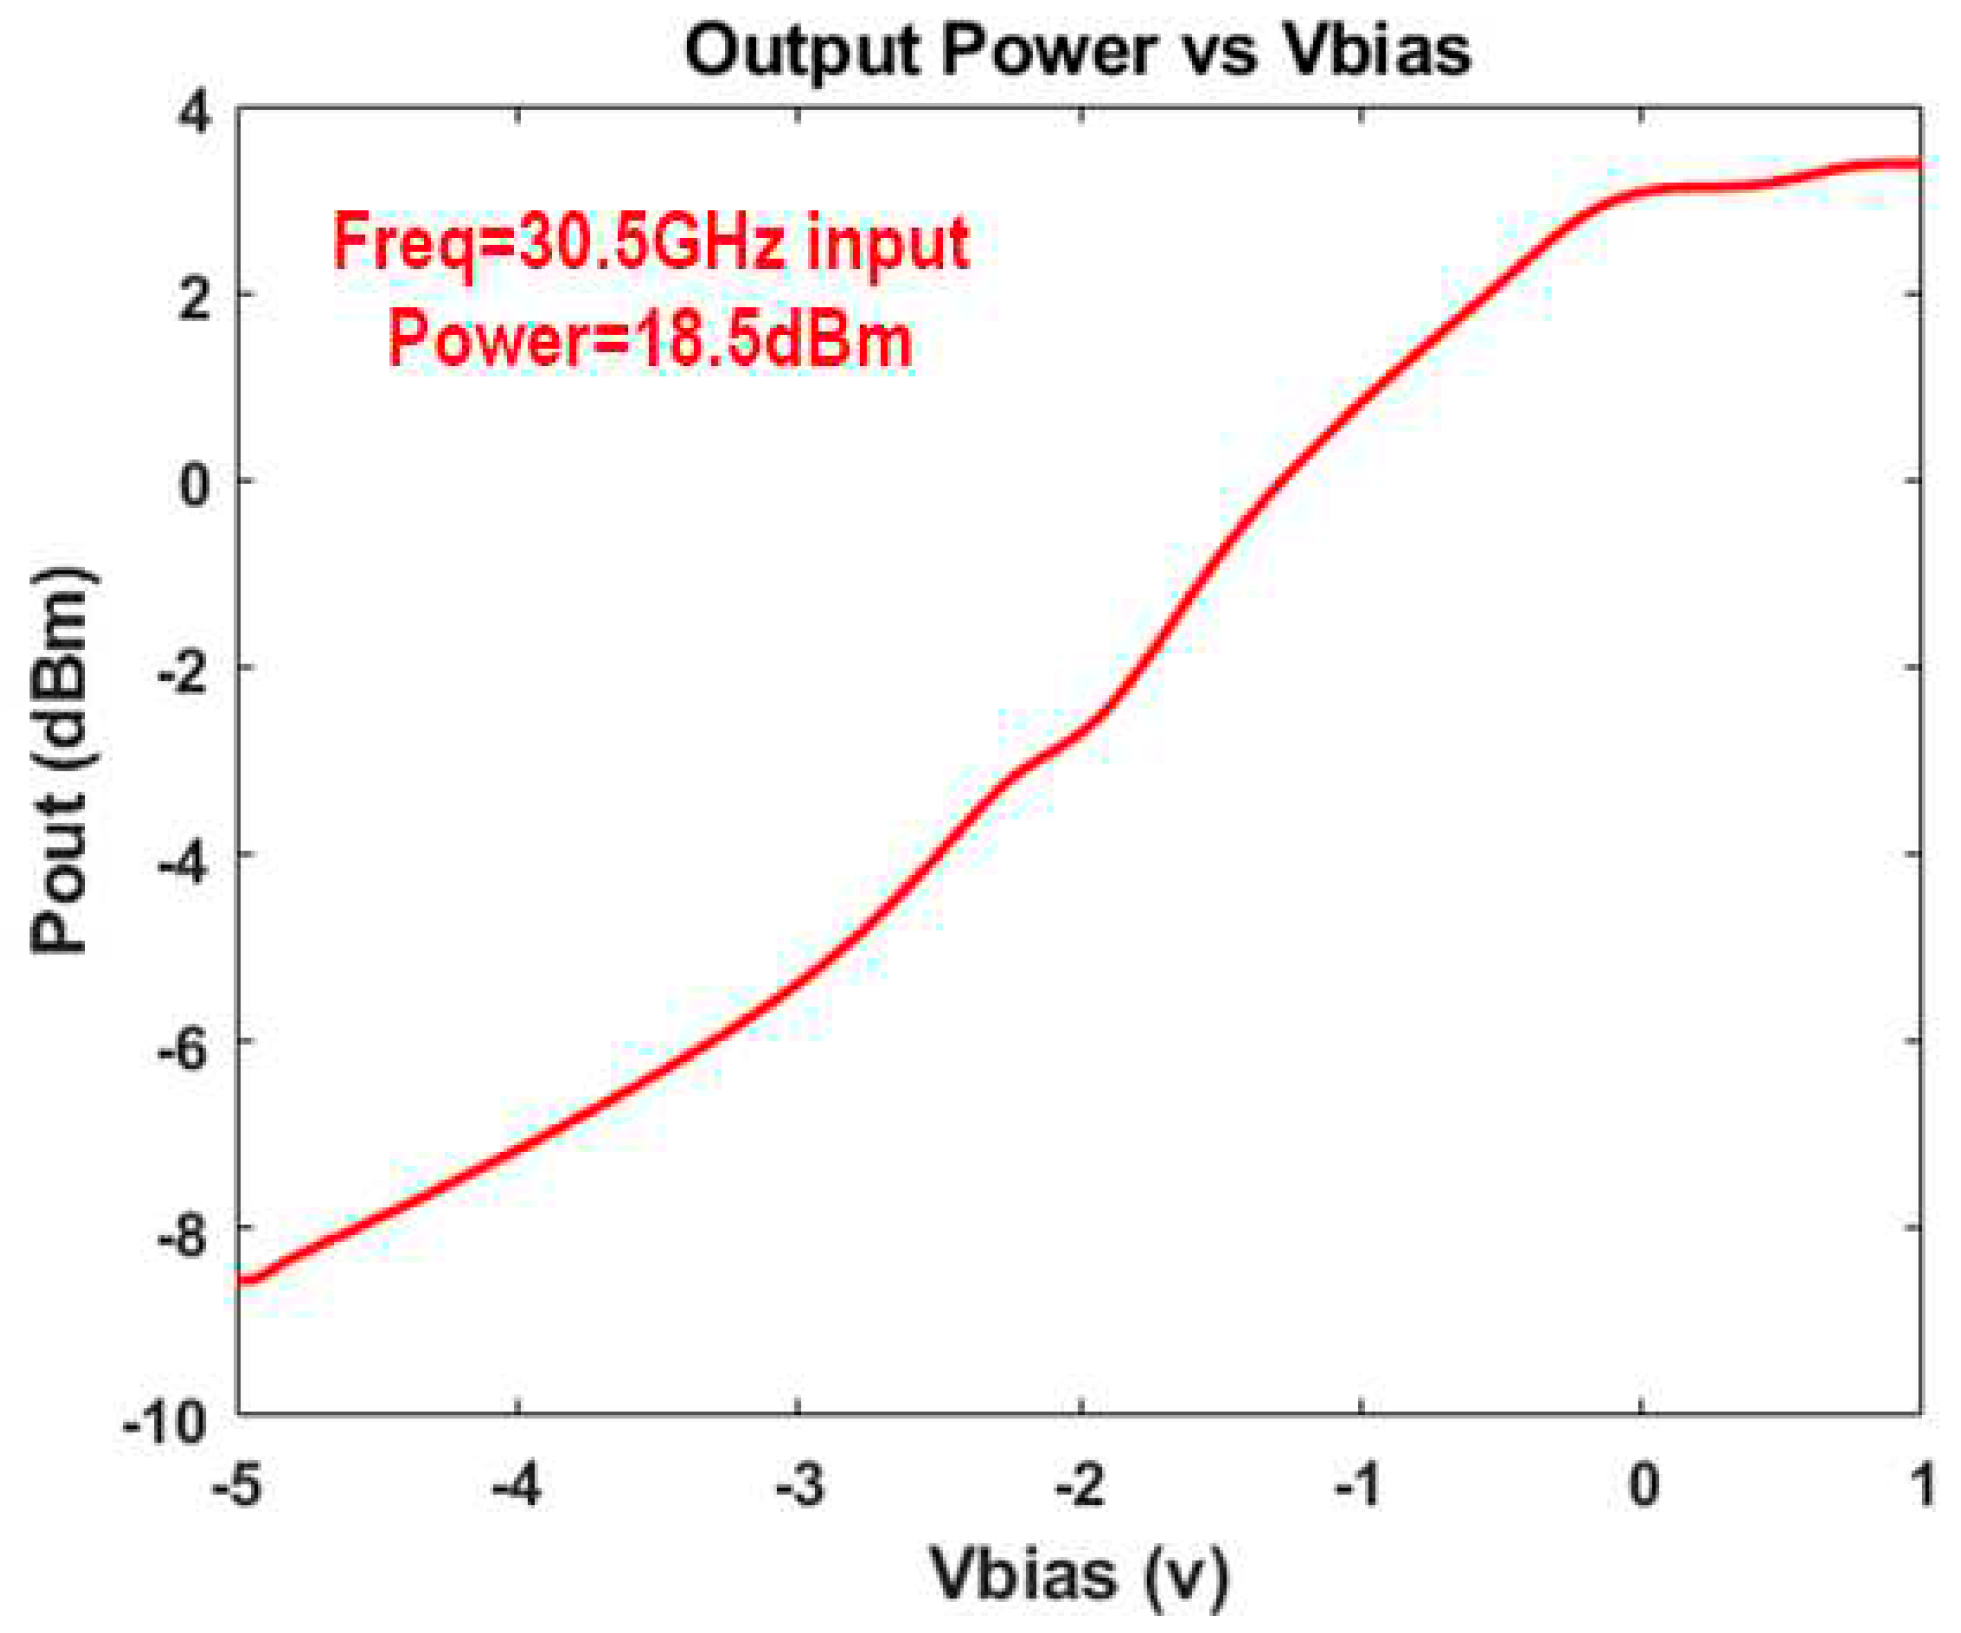
To attain the pinnacle of conversion efficiency within the Tripler, we conducted meticulous optimization of the DC bias voltage. In our experimental setup, we maintained a fixed entry frequency of 30.5GHz, accompanied by a power entry of 18.5dBm. The Tripler efficiently multiplied this input signal to produce an output at 91.5GHz, delivering an output power of 3.7dBm. This output power level aligns perfectly with the requirements of the mixer's LO port, which is essential for down-converting water signals into a low 1GHz-DC IF frequency range. The conversion losses, at approximately 10dB, were within the anticipated range.
Figure 15 provides a graphical representation of the relationship between Tripler power output and the DC bias voltage, with sweeping conducted within the range of -5V to 1V. This comprehensive analysis allowed us to fine-tune our system for optimal performance.
From
Figure 15, we notice that bias voltage of 0.7V-1V gives us better conversion efficiency. Ultimately, Tripler circuit is assembled on HFSS software and equivalent impedance matching circuit have been occupied in the circuit. To feed three diode Schottky diode via bias voltage we have used a SMA connector to feed DC voltages into the circuit.
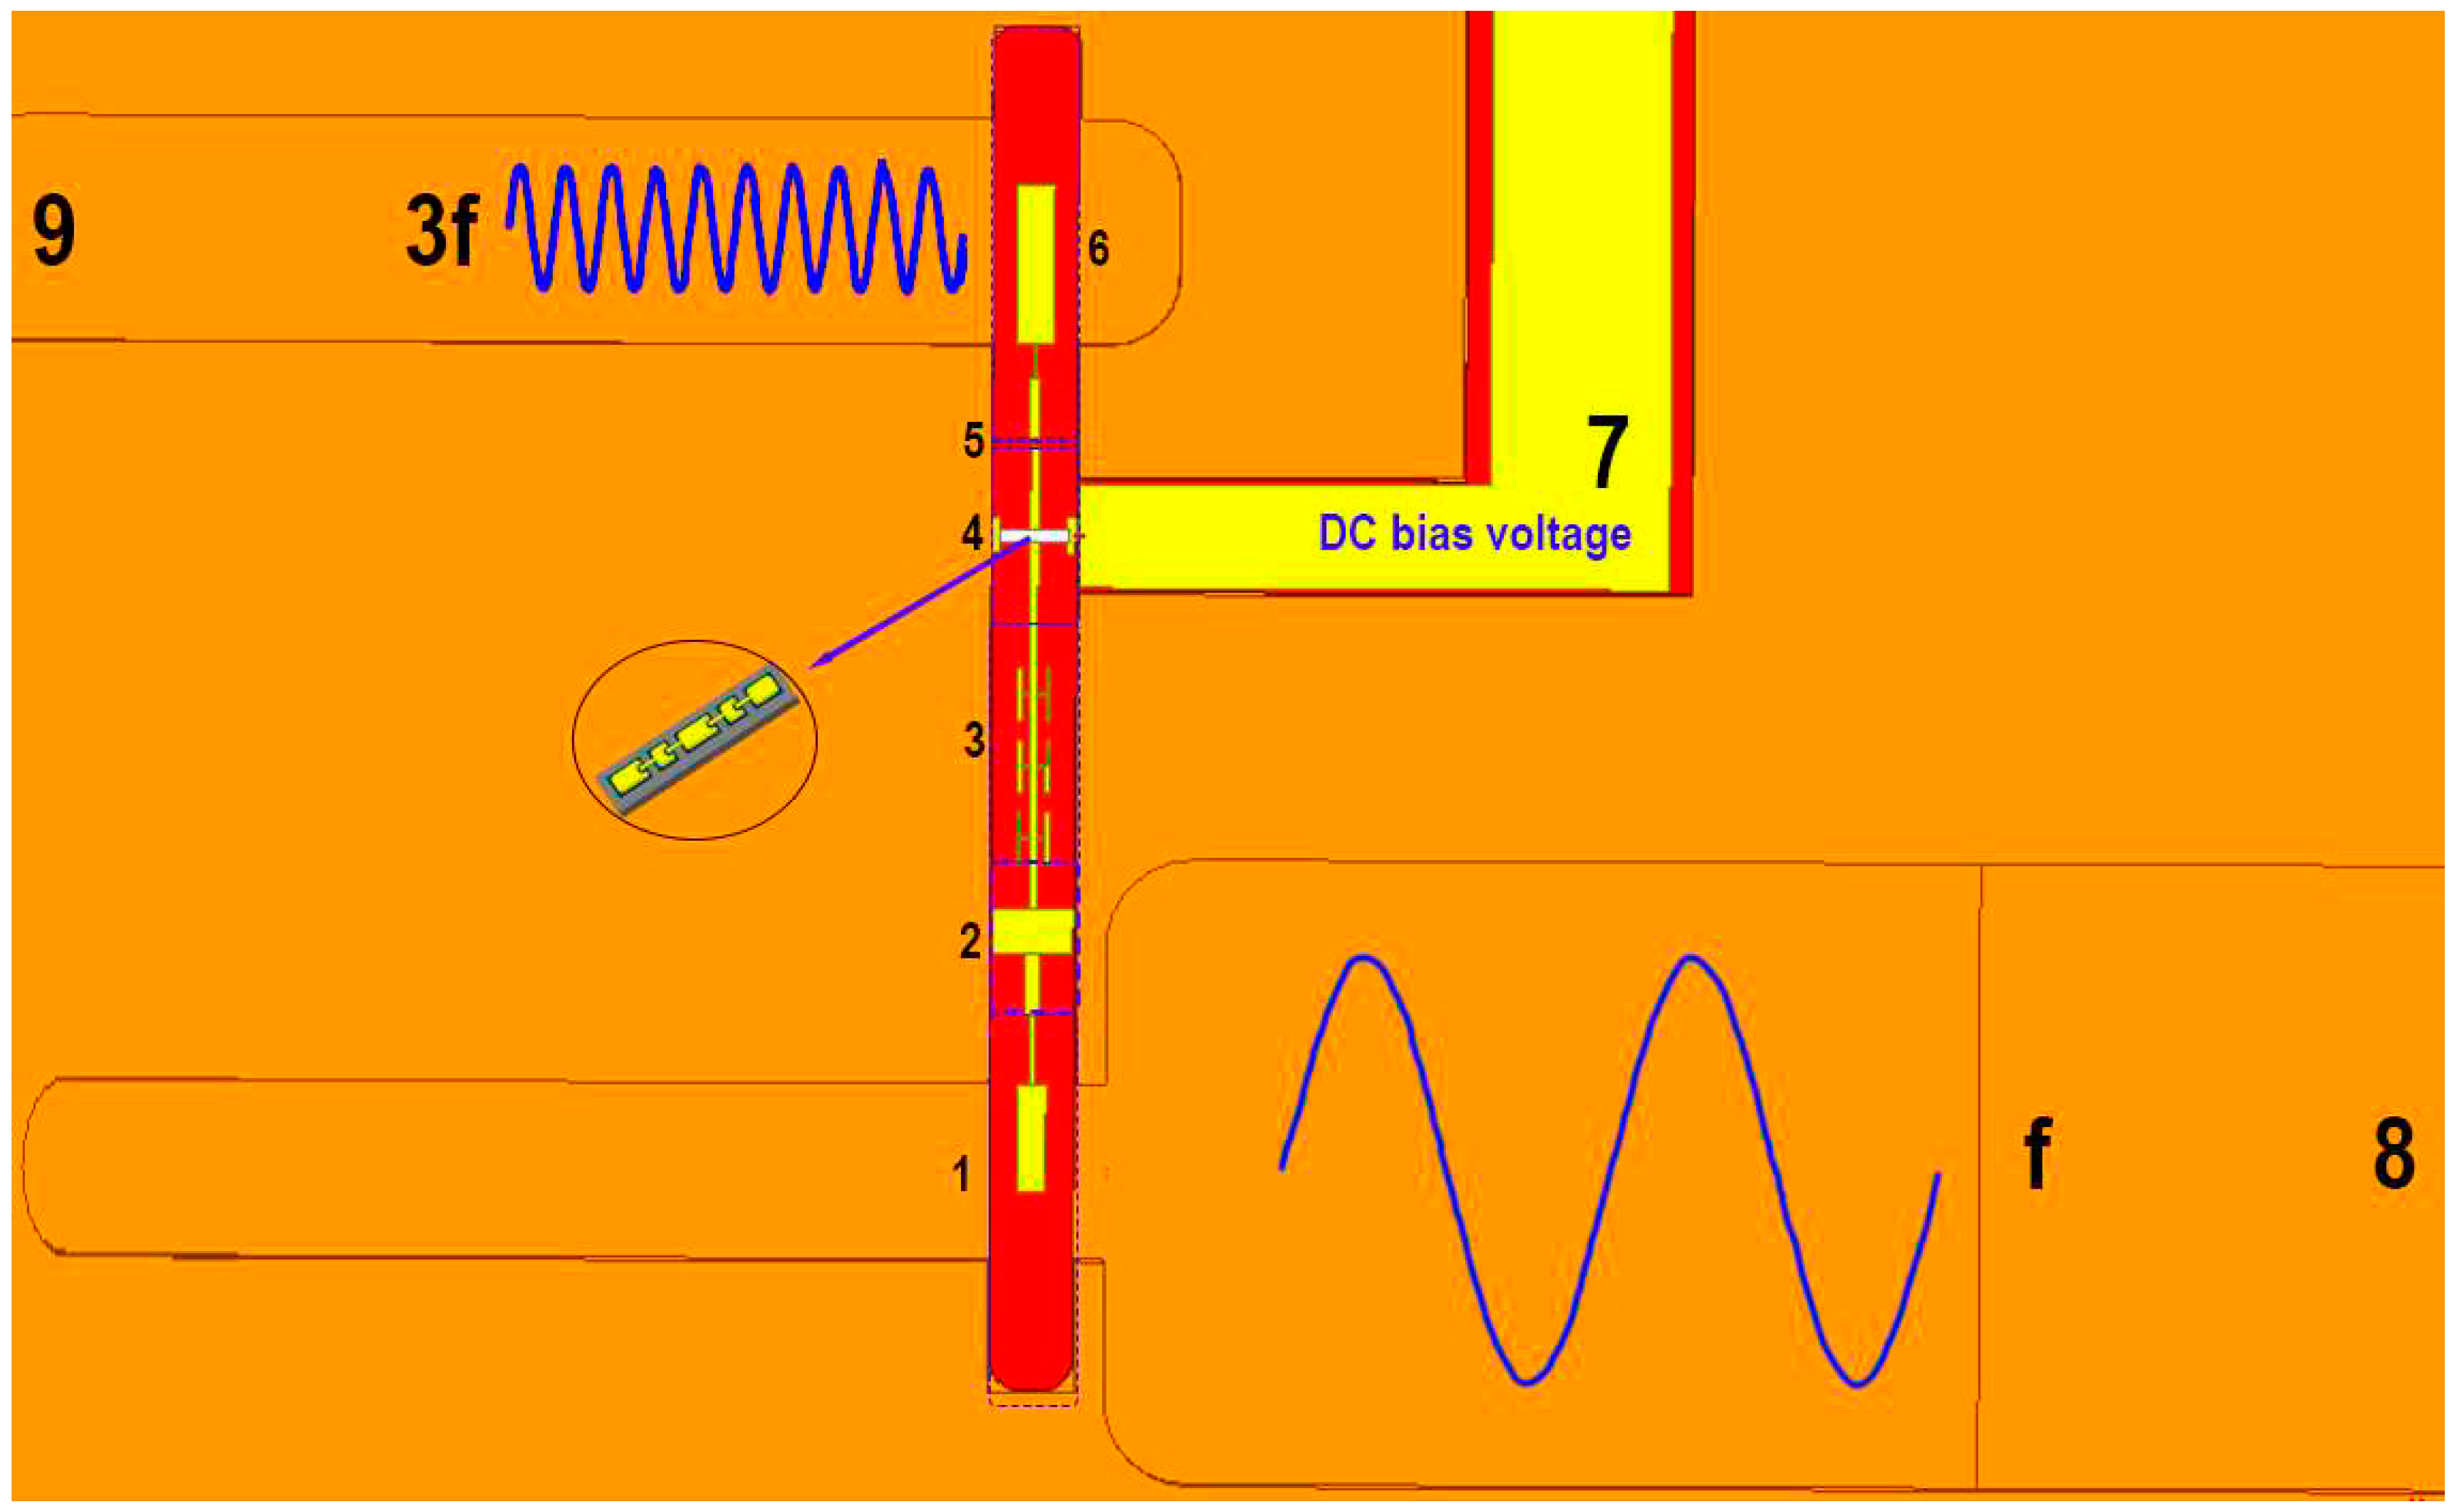
In
Figure 16, you can observe the DC bias voltage connected to the Schottky diode anodes, which significantly contributes to the enhancement of conversion efficiency and the biasing of the diodes. To prevent leakage frequencies in the output waveguide, we employ three step hammer head filters. Notably, we do not utilize filters on the higher frequency side as the output waveguide is inherently effective at blocking out-of-band signals. In this design, we employ a half-height waveguide structure for the WR28 entry waveguide but avoid using the half-height structure for the WR10 output waveguide. This configuration successfully fulfills our system objectives. Throughout the entire system development, our primary focus is on simplifying the design without compromising system functionality.
3.7. Do It Yourself (DIY) Radio signal frequency and amplitude detector
Schottky-based mixer facilities down conversion of 183GHz frequencies to Intermediate Frequency (IF) ranges of DC-1GHz accordance with signals from the Local Oscillator. The presence of signals within the nominated range verifies likelihood of water being under satellites’ field of view. Hence, we need analyses the received data and explore various signal channels within our payload. Additionally, we save received data using DIY microcontroller facilitating transmission data to the Earth ground station for farther data analysis.
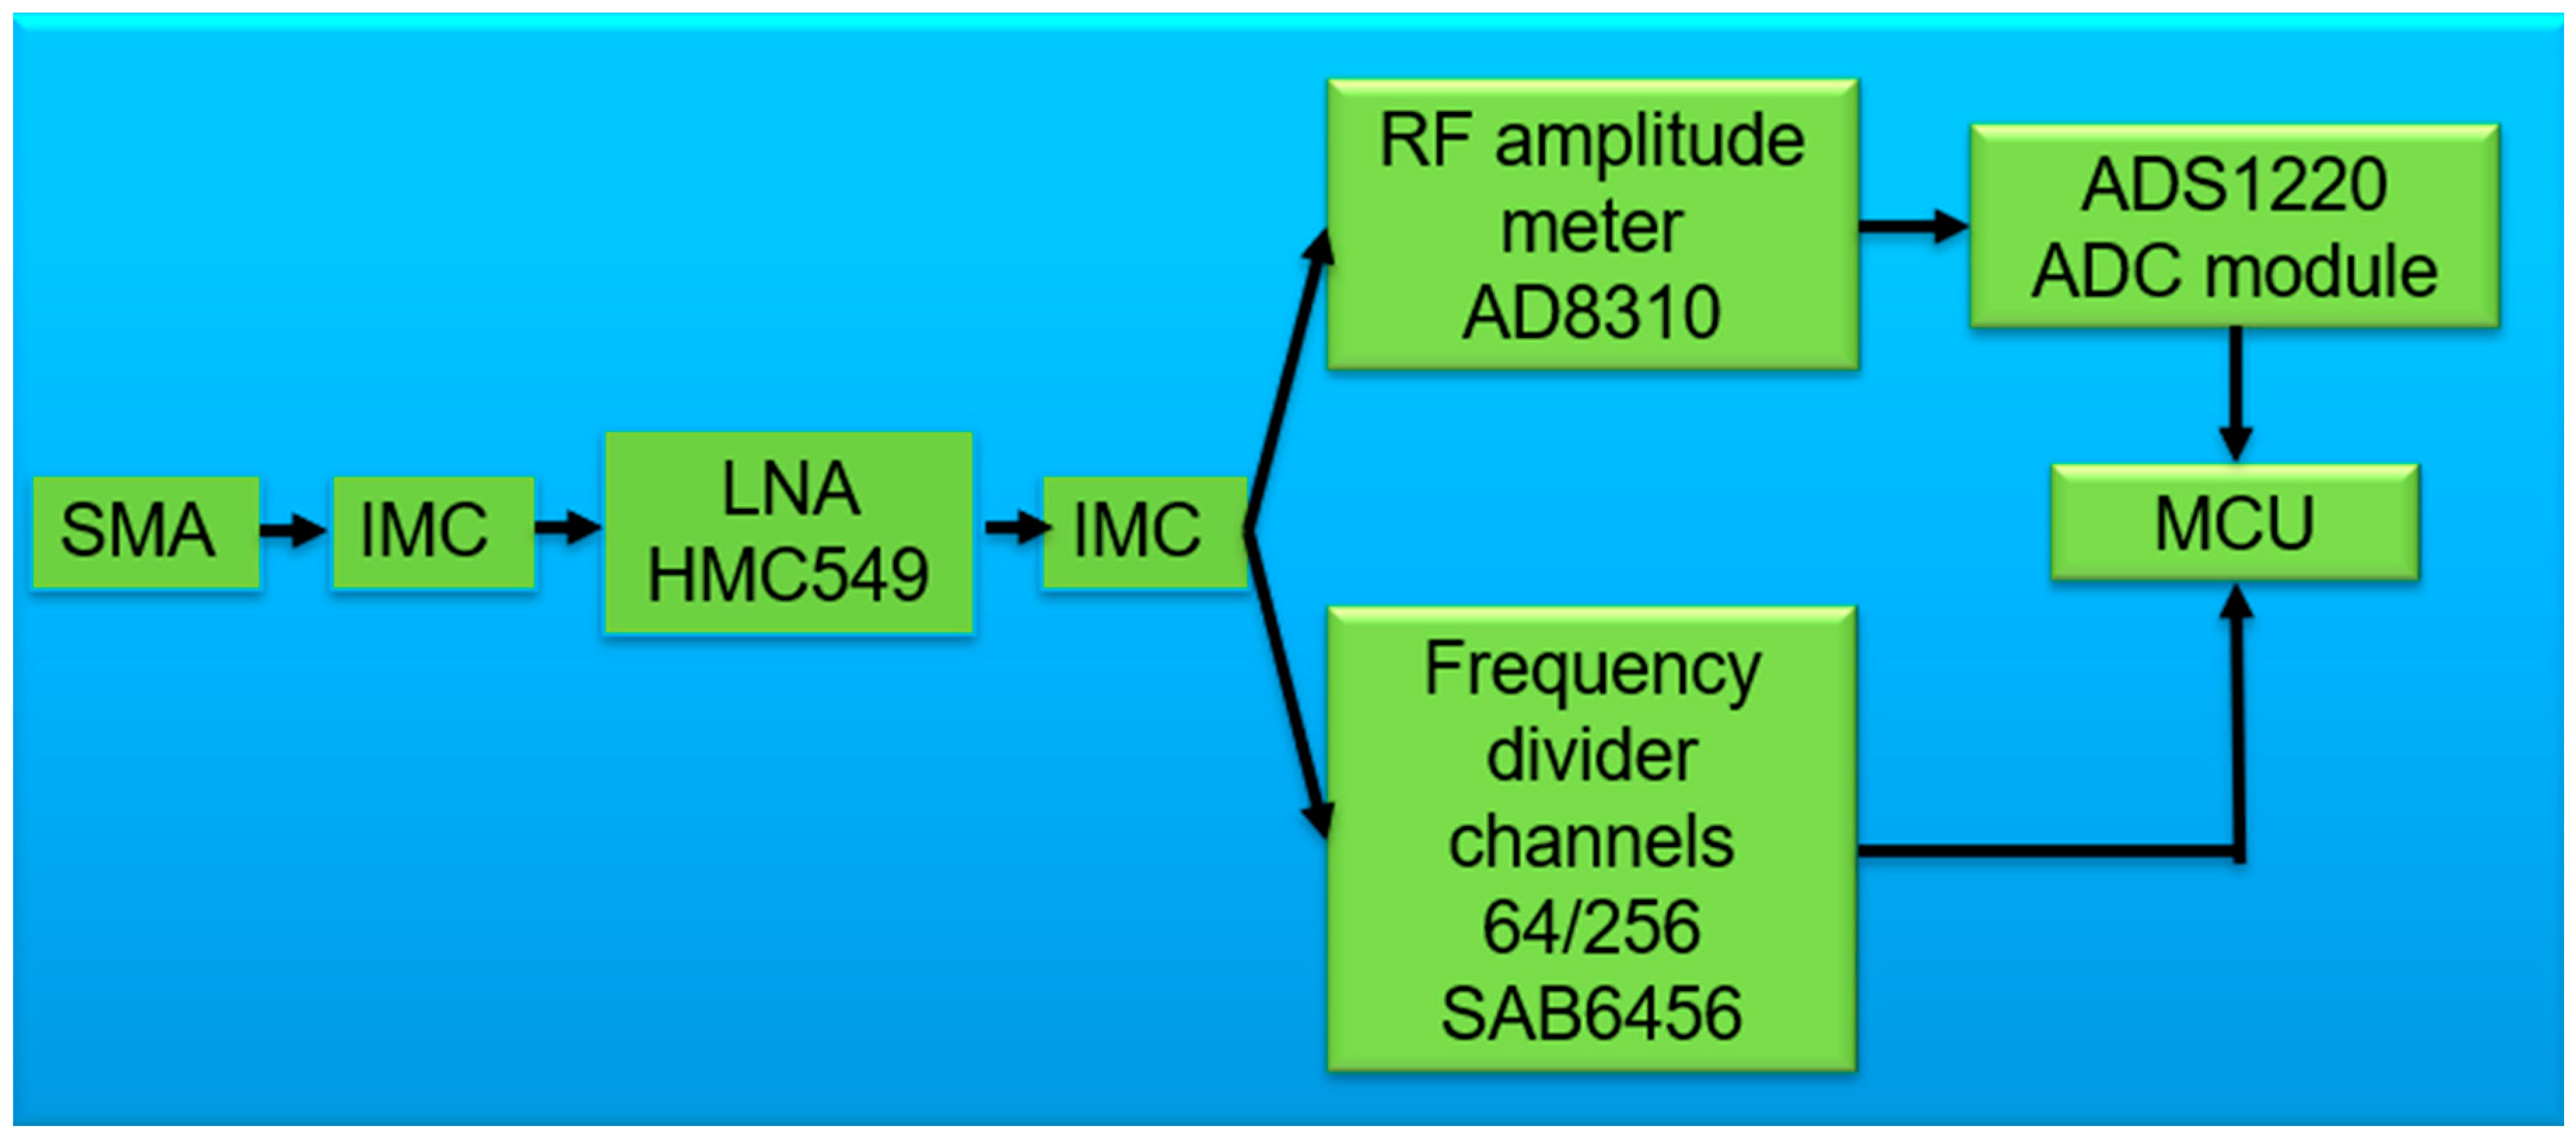
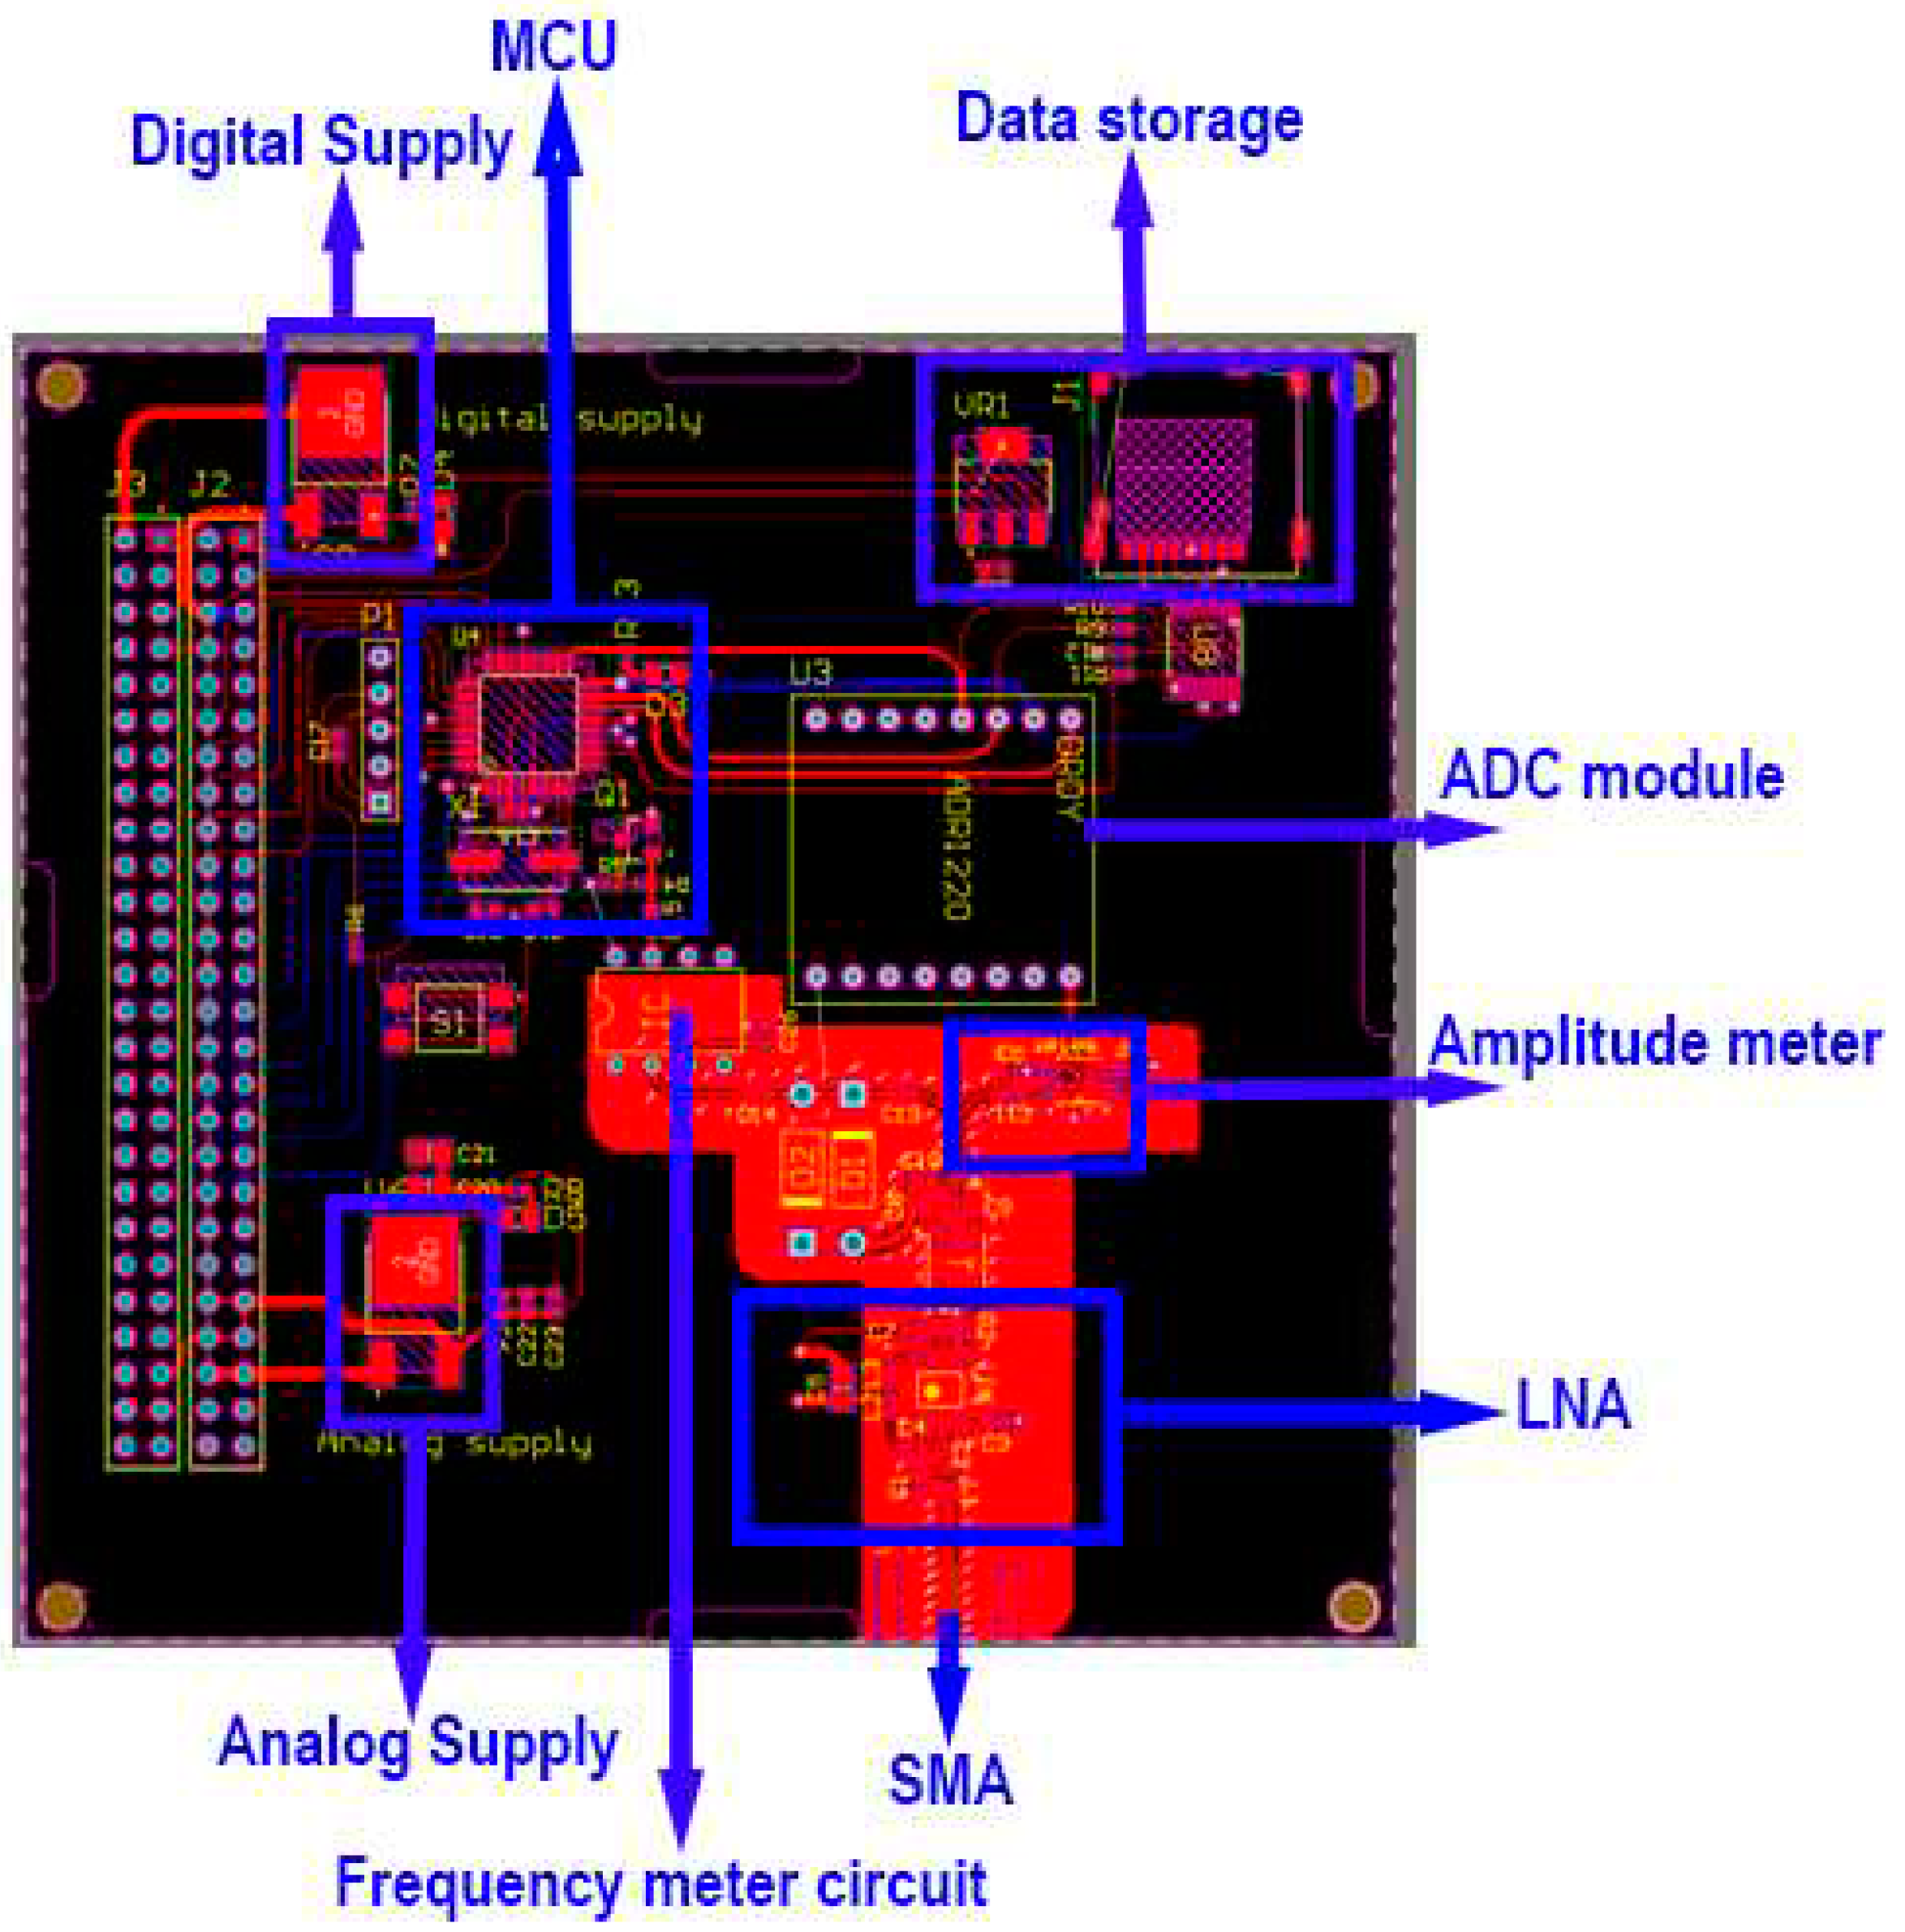
DIY spectrometer consists of two key components to explore the received water signals. The spectrometer needs to be able to explore the amplitude and frequency of received signals for a comprehensive investigation. Taking into account factors mentioned, we utilize components to facilitate our target within DIY spectrometer. Firstly, we propose general block diagram of our system on
Figure 17.
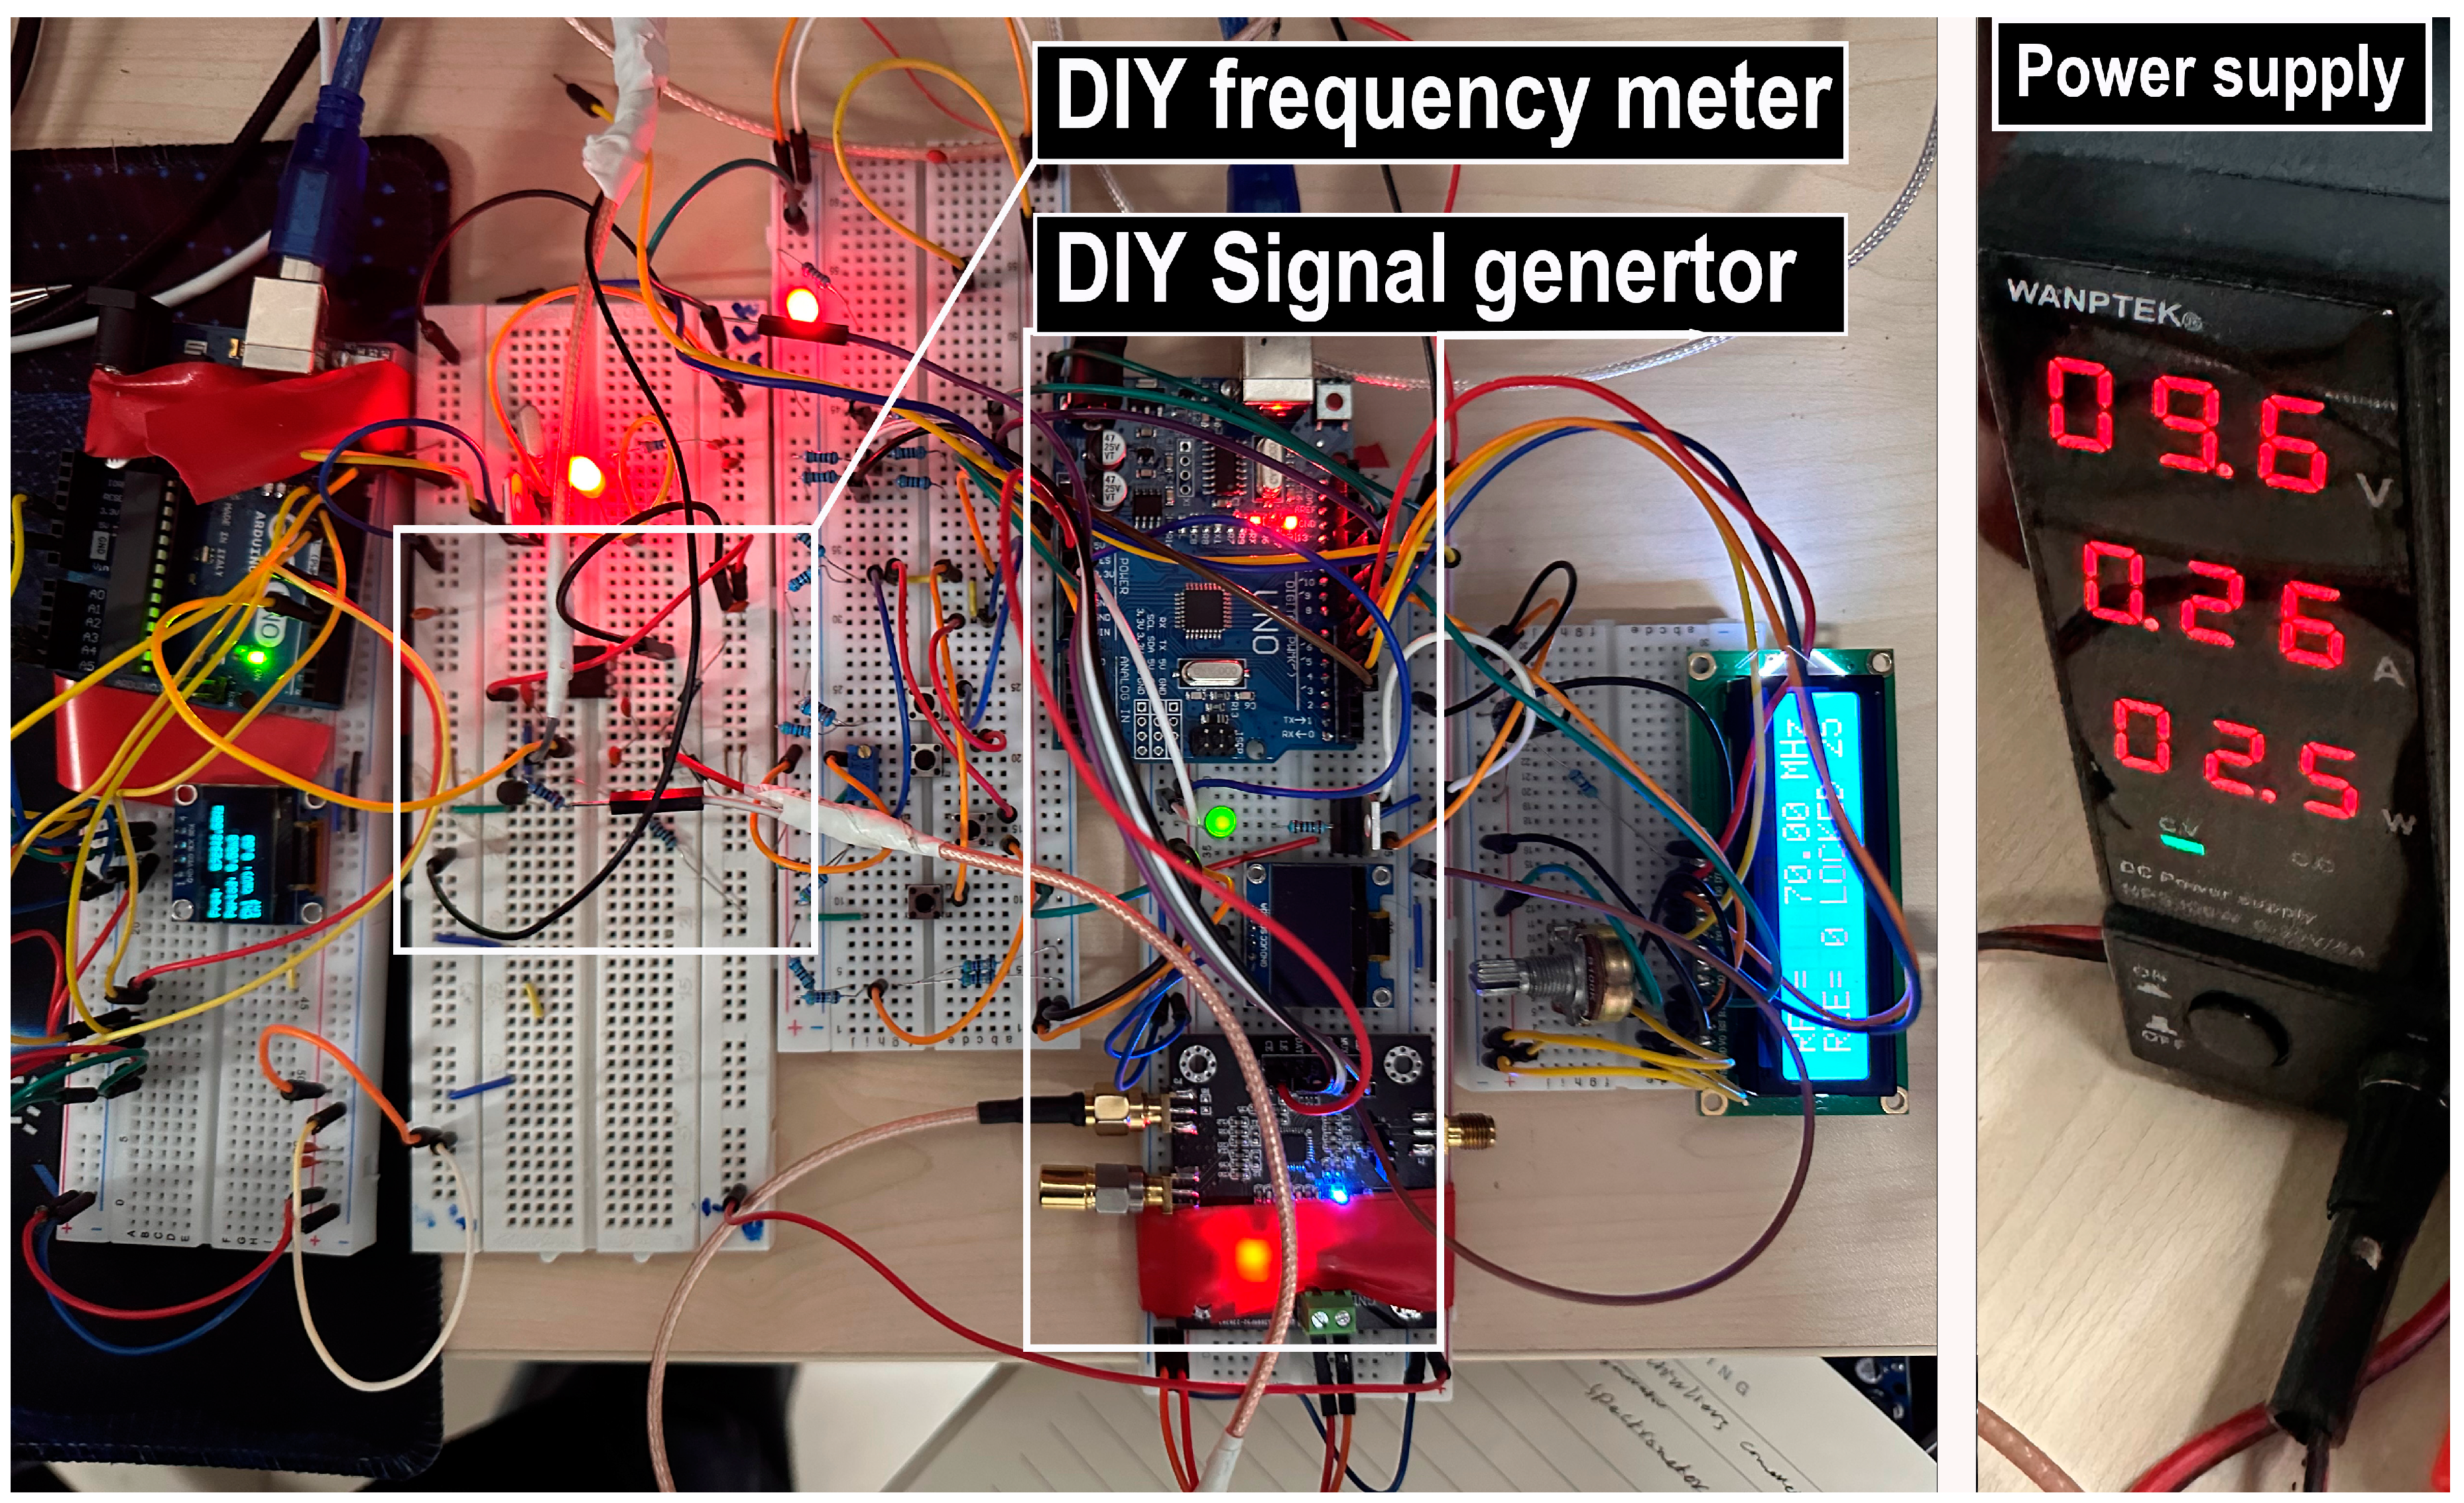
The DIY spectrometer, operating within the low-frequency range of DC-1GHz, provides the flexibility for circuit prototyping before the final manufacturing phase. This approach allows for the adjustment of elements or components as needed, promoting optimization for space missions. Breadboarding facilitates alterations and enables the measurement of the total power consumption of both the circuit and payload. In our proposed THz payload, the most power-intensive sections are the DIY spectrometer and the DIY signal generator on the low-frequency side, encompassing the MCU and ADF4351 signal generator. Breadboard testing of these components provides insights into their power consumption, contributing to the calculation of the power budget for the THz payload. The DIY spectrometer and signal generator collectively consume 2.5W, and when considering the remaining frequency multipliers (HMC444 frequency x8) and the ADL8150 amplifier, the total power consumption amounts to 1.2W. In summary, the THz payload exhibits a commendable total power consumption of 3.7W, aligning well with the requirements for a satellite payload. see breadboarding test on
Figure 18. (refer to
Figure 10 to see Local Oscillator systematic illustration).
The breadboarding test involves the incorporation of several LEDs and LCDs, contributing to an increased power consumption during this testing phase. It's important to note that these components are not utilized in the final PCB board design. This exclusion significantly enhances power consumption, reducing it to less than 2.5W in the finalized PCB configuration. This underscores the importance of the iterative testing process, allowing for the inclusion of such features during initial evaluations and subsequent refinement for optimal power efficiency in the final design.
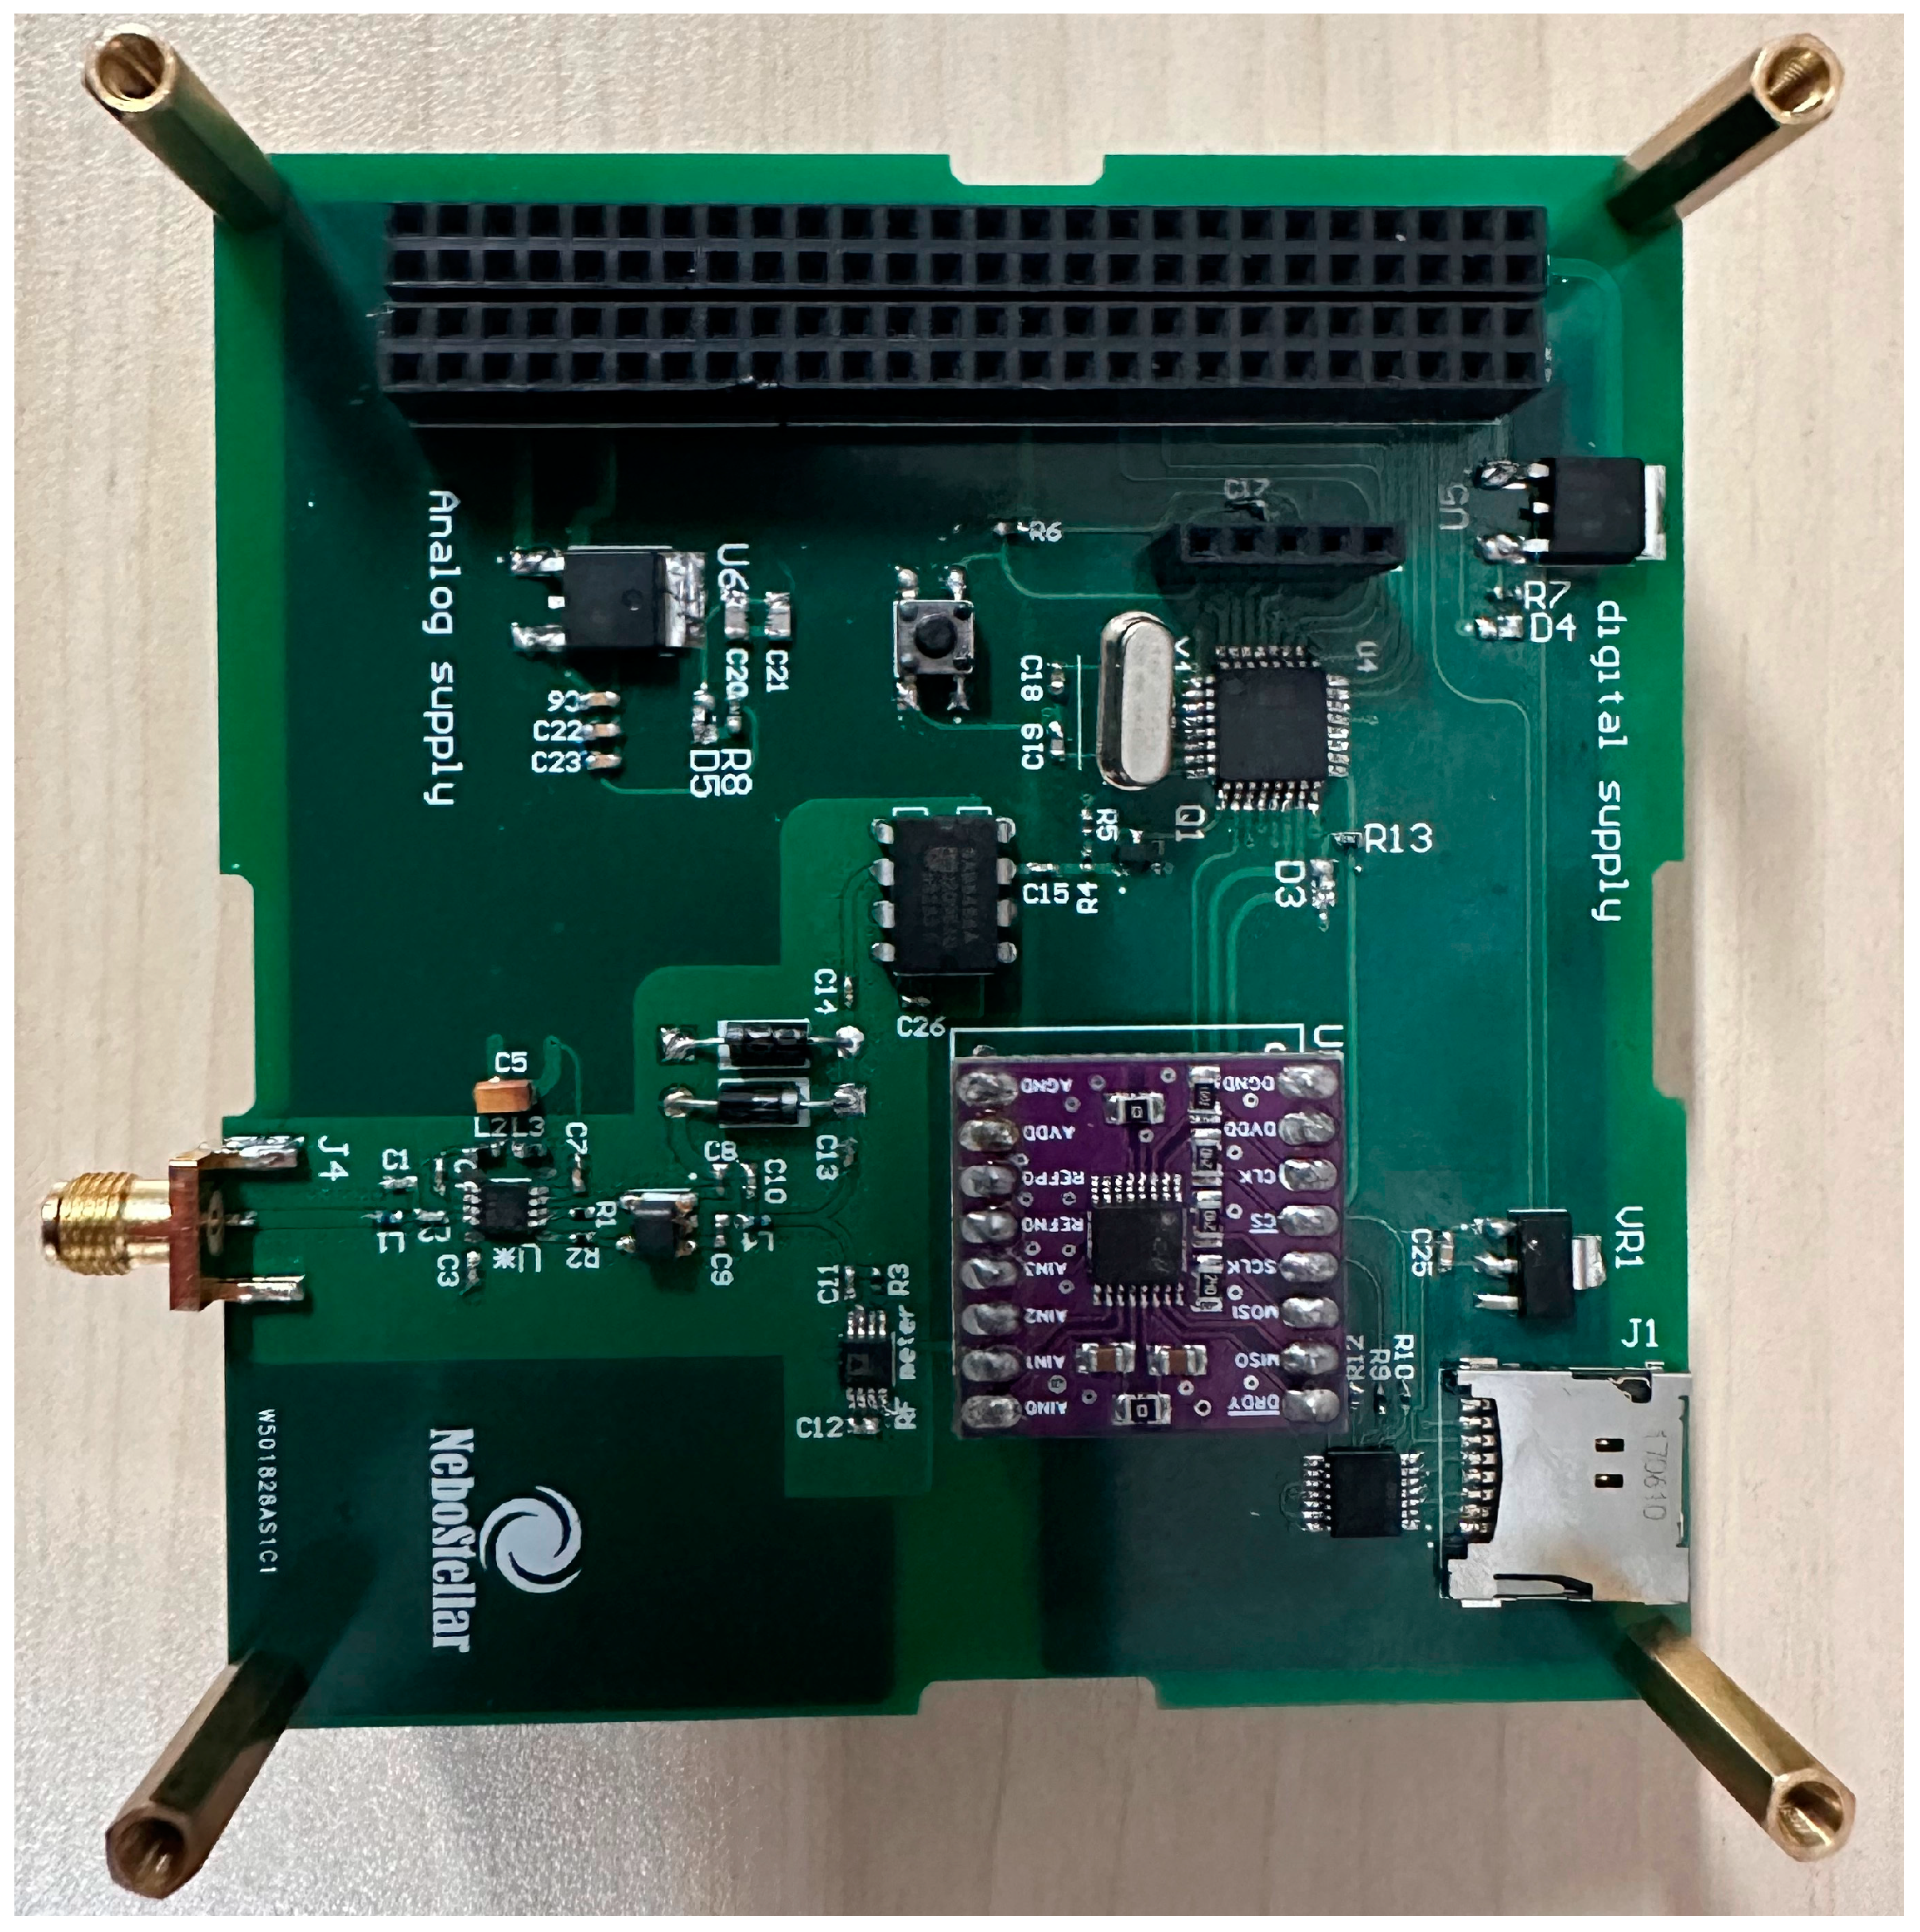
Figure 19 shows various electronic components with circuit operational in use. The Low Noise Amplifier (LNA) will be strategically positioned after the Impedance Matching Circuit (IMC) and just before the subsequent IMC circuit. This placement ensures the impedance is effectively matched to both the AD8310 RF amplitude meter and the SAB6456 frequency divider channels. We employ RF meter circuit and frequency divider channel to transform analog data to digital format, making it comprehensible for the Microcontroller Unit. The AD8310 analog data necessitates an Analog-Digital Circuit module for the conversion of analog data to digital format, facilitating integration with the MCU section. Moreover, the frequency divider circuit incorporates components for converting sinusoidal waves into rectangular waveforms. These rectangular signals are then directed to the MCU interrupt pins, providing the capability to measure signal frequency through the MCU's internal timer association. Following
Figure 20 shows DIY spectrometer engineering model.
3.8. Complete System Design for THz Spectrometers
Our Terahertz (THz) spectrometer operates using an advanced mechanism which involves multiple stages of signal transformation and filtering [
54]. To start, the Radio Frequency (RF) signals are introduced into the system through a WR5 inline waveguide-to-microstrip transition. The purpose of this transition is to effectively guide the RF signals from the waveguide to the microstrip while minimizing any potential losses or signal distortion. Following this, the RF signals encounter a Schottky diode, where they are combined with signals that originate from a Local Oscillator (LO). This combination gives rise to the generation of Intermediate Frequency (IF) signals. However, to prevent any potential interference between the RF and LO signals, a Low Pass hammerhead filter is incorporated into the design. This filter serves as a reliable and efficient means of signal separation, thereby ensuring the smooth and error-free operation of the entire system. The LO signals, on the other hand, are transmitted to the microstrip via WR10 waveguide transition. This transition is specifically designed to transfer the LO signals with minimal losses. From here, the signals are directed towards a mixer for the down-conversion of the RF signals. In addition, to prevent the RF and LO signals from entering the IF port, a low-pass step filter with a cut-off frequency of 3 GHz is utilized. This element enhances the signal clarity and integrity by restricting the passage of any undesired frequencies[
55,
56,
57,
58,
59]. These procedures are detailed in a block diagram which is represented in
Figure 21.
In
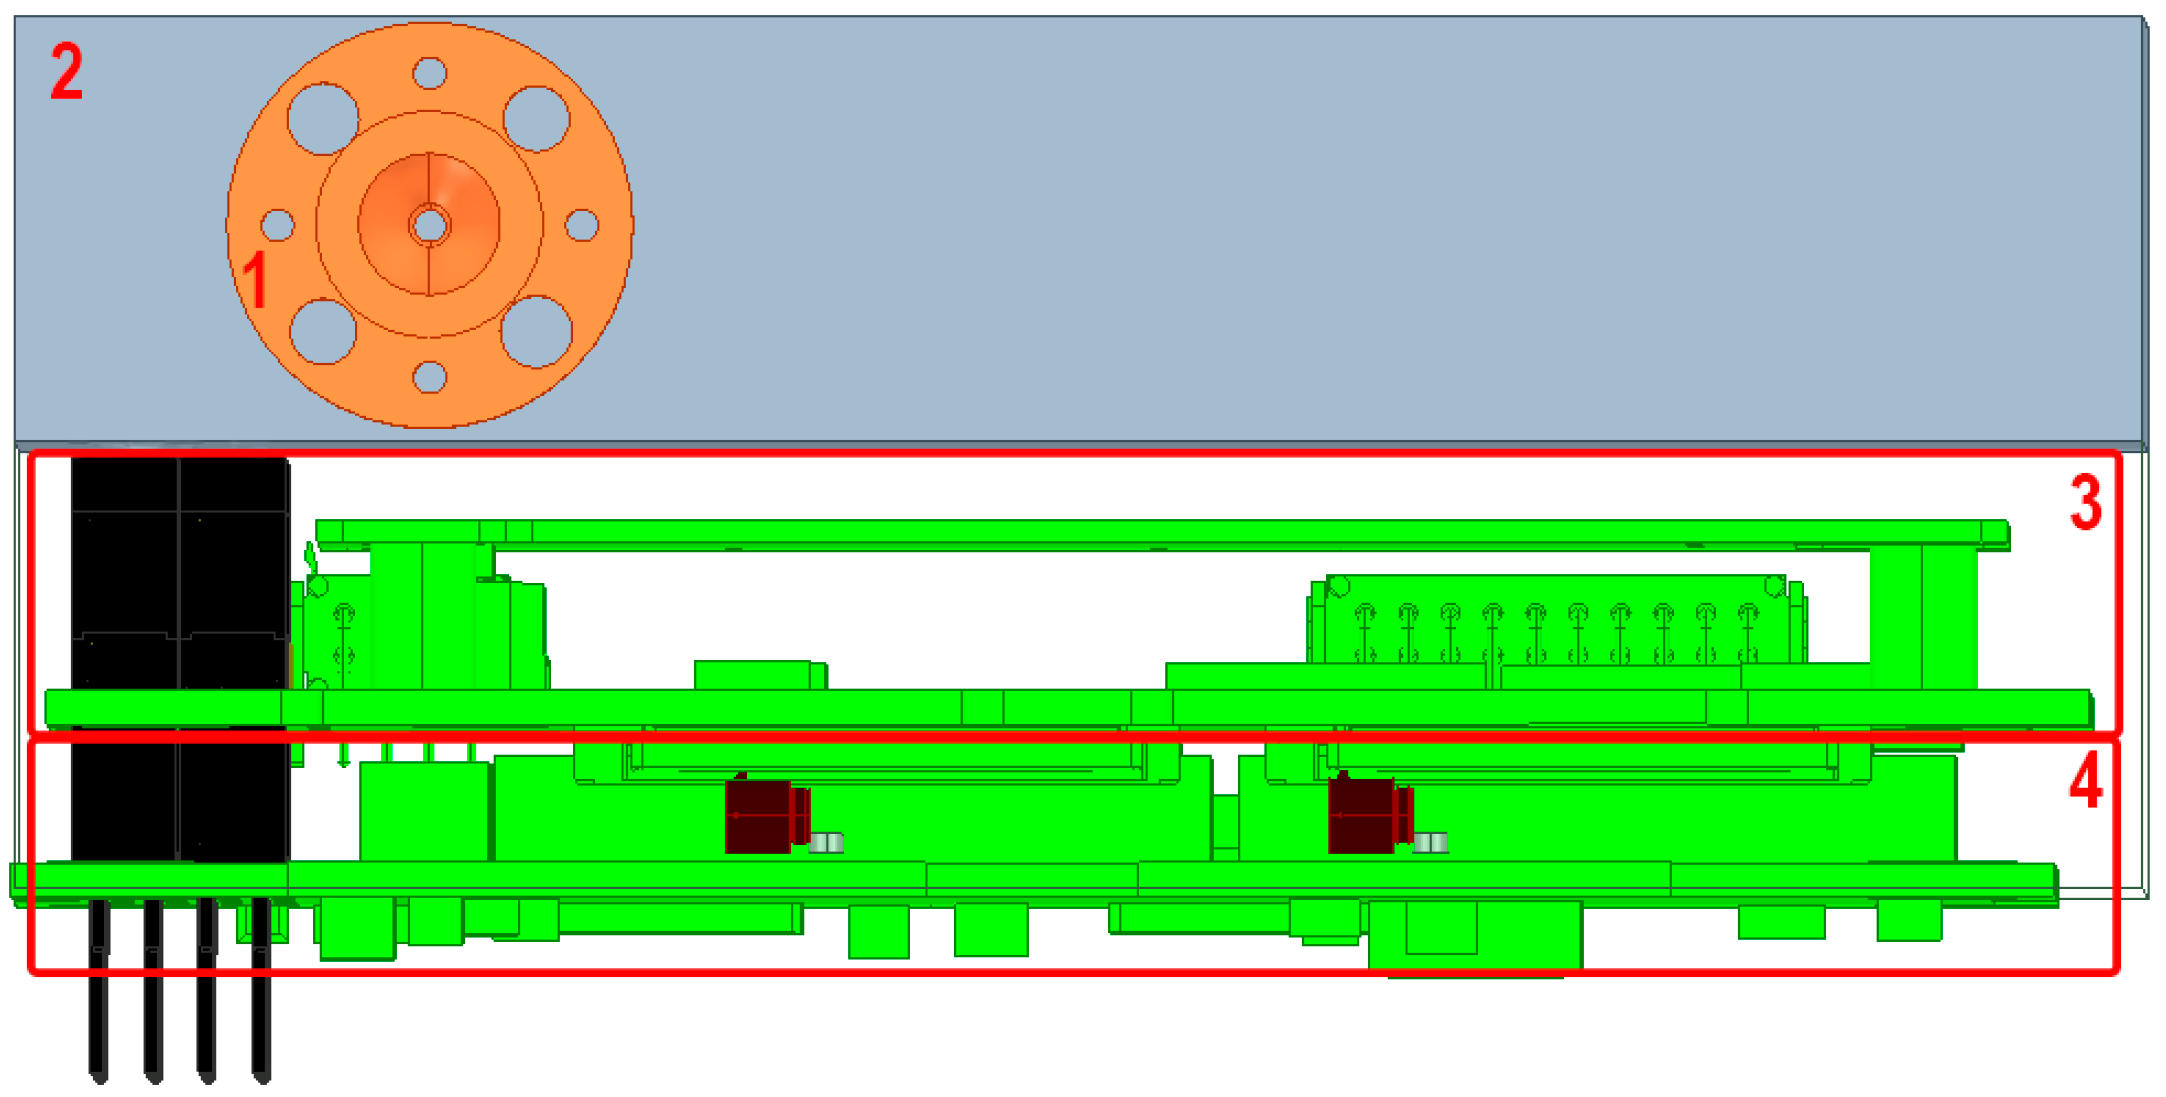
Figure 22, we have presented our proposed THz payload, comprising four distinct main sections. Each of these sections collaborates seamlessly to successfully achieve water spectrometry on extraterrestrial planets.
In
Figure 22, CAD model of our THz payload is depicted, providing an overview of its essential components. At the forefront, we have the smooth-walled horn antenna (1), meticulously designed to optimize the reception of THz signals. This antenna acts as the initial entry point for the incoming signals. Moving inward, within their dedicated aluminum enclosures, we find the intricate mixer and Tripler circuits (2). These components play a critical role in down-converting and amplifying the received signals, ensuring their suitability for further analysis. The local oscillator (LO) circuit (3) is a pivotal part of the system, responsible for generating the required frequencies to facilitate the signal mixing process. Lastly, DIY spectrometer (4) operates in tandem with the other components to analyze the spectral data, offering the capability to identify and characterize water signals on extraterrestrial planets such as Mars and beyond. Together, these components constitute a robust and specialized 3U CubeSat payload engineered for the precise detection of water on celestial bodies beyond Earth.
Finally, as displayed in
Figure 23, we present our Terahertz (THz) heterodyne spectrometer. We anticipate that this THz payload will be able to detect signs of water on the surface of Mars, utilizing our proposed THz heterodyne spectrometer architecture, which is based on anti-parallel Schottky diodes.
4. 6U CubeSat power subsystem performance and functions methodology
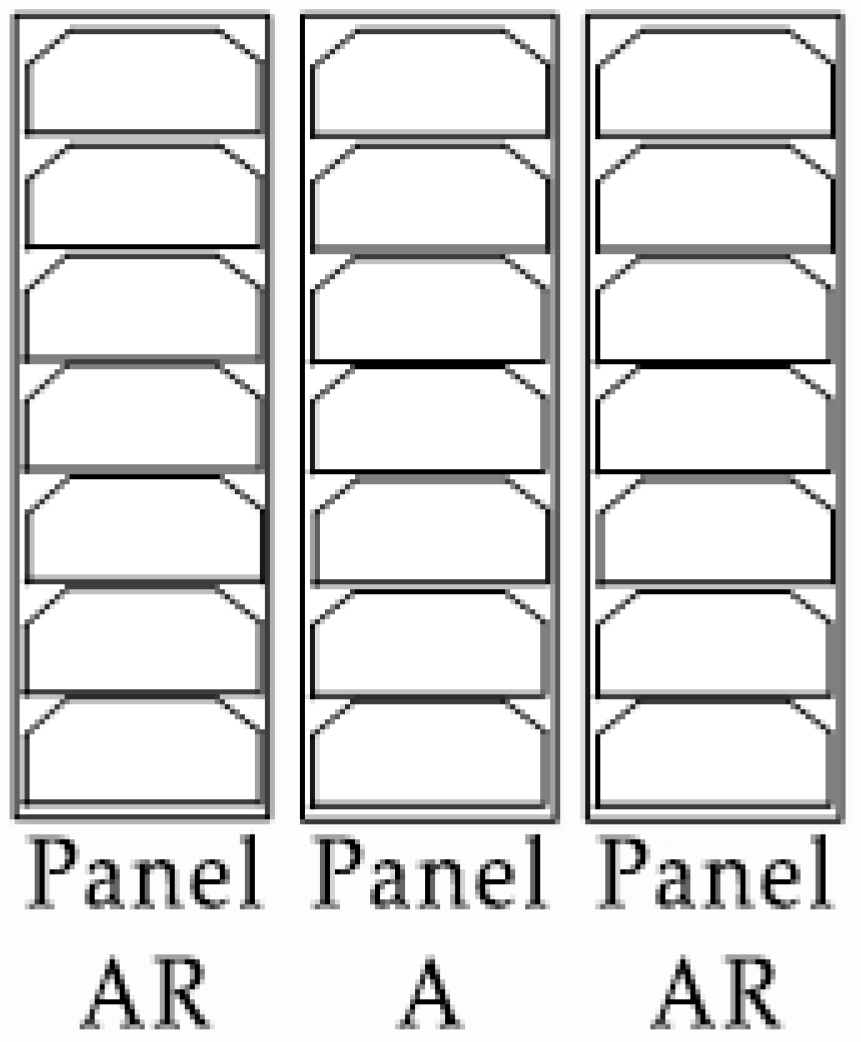
In this proposed 6U nanosatellite platform, each wing is composed of three solar panels, as shown in
Figure 24, where, each wind has a power of up to 45W (in STC conditions) and is made up of 5S+5S+5S solar cells on each panel.
The parameters of solar panel A with 7 cells are presented in
Table 3:
On Mars the solar irradiance is 586.2 W/m2, very lower compared to that obtained on earth orbits. Therefore, the solar panel powers estimation is shown in
Table 4:
4.1. 3U Nanosatellites Power System
In this proposed project, two 3U THz nanosatellites are used to perform the mission. In the primary source of the power system, as shown in
Figure 25, three panels are generating power and each panel is composed by 7Ssolar cells, each solar panel is producing a power up to 8,48 W (STC).
In comparison to the solar irradiance that attained on earth orbits, the solar irradiance on Mars is quite low achieving 586.2 W/m2.
Table 5 depict the estimated power of solar panels:
5. Mission Design Analysis for Low-Thrust Trajectory Optimization to Mars Considering Full Perturbation System
In practical mission design analysis, various factors play crucial roles and impose constraints on trajectory planning. Hyperbolic excess velocity, launch and rendezvous dates, thruster types, Time of Flight (TOF), and the optimization methodology are among the pivotal considerations. Additionally, technological limitations, such as spacecraft thruster specifications or subsystem constraints, introduce further constraints shaping mission parameters. This practical approach, considering diverse constraints, adds realism to mission design analysis in real-world scenarios.
These Ephemeris perturbations have the potential to significantly alter optimal spacecraft trajectories. This study specifically focuses on analyzing fuel-optimal low-thrust trajectories from Earth to Mars while incorporating the Ephemeris model. Handling the resulting Two-Point Boundary Value Problem (TPBVP) becomes notably more challenging compared to a simplified 2B dynamical model.
To address this complexity, the study demonstrates the application of a dual-step hybrid optimization algorithm (PSO-Homotopy). This algorithm facilitates the solution of the resulting Multi-point Boundary Value Problem (MPBVP) with remarkable accuracy, effectively meeting the specified constraints.
Furthermore, the research investigates the effects of hyperbolic excess velocity, diverse Earth launch and Mars rendezvous opportunities, as well as different propulsion systems like Hall thrusters and Ion engines. Notably, the findings reveal the feasibility of delivering a 102.8 kg payload to Mars while consuming a mere 17.2 kg of fuel, highlighting the efficiency and optimization achieved in the trajectory planning.
5.1. System Description
In an Ephemeris model, it is essential to take into account perturbing accelerations resulting from: 1)
: solar radiation pressure, 2)
oblateness impacts of celestial bodies, and 3)
other celestial bodies of the Solar System. The disturbing accelerations are conceptualized as[
28]
where
and
show the position vector and the gravitational constant of a planet,
,
represents the planet-centric latitude,
is a constant flight loading (
where
is the unit area),
is determined as 1.53 (gm
-2),
and
signify the solar radiation pressure and the spacecraft position vector, in the Heliocentric Equatorial Reference Frame (HERF). The dynamics system is modeled as follows[
28]:
Here, and represent the updated spacecraft mass and the spacecraft velocity vector, respectively. The spacecraft's propulsion vector is modeled as, where is the maximum thrust magnitude, represents the engine throttle magnitude, and the unit thrust steering vector. The constant denotes the effective exhaust velocity of the propulsion system. Here, denotes the Earth’s sea-level gravitational acceleration, denotes the Sun’s gravitational parameter, and denotes the thruster specific impulse.
5.2. Low-Thrust Trajectory Optimization Description
The performance index of a fuel-optimal trajectory is represented by
as an auxiliary homotopy performance index [
25]
Here,
denotes a constant auxiliary multiplier,
denotes a continuation parameter, where
and
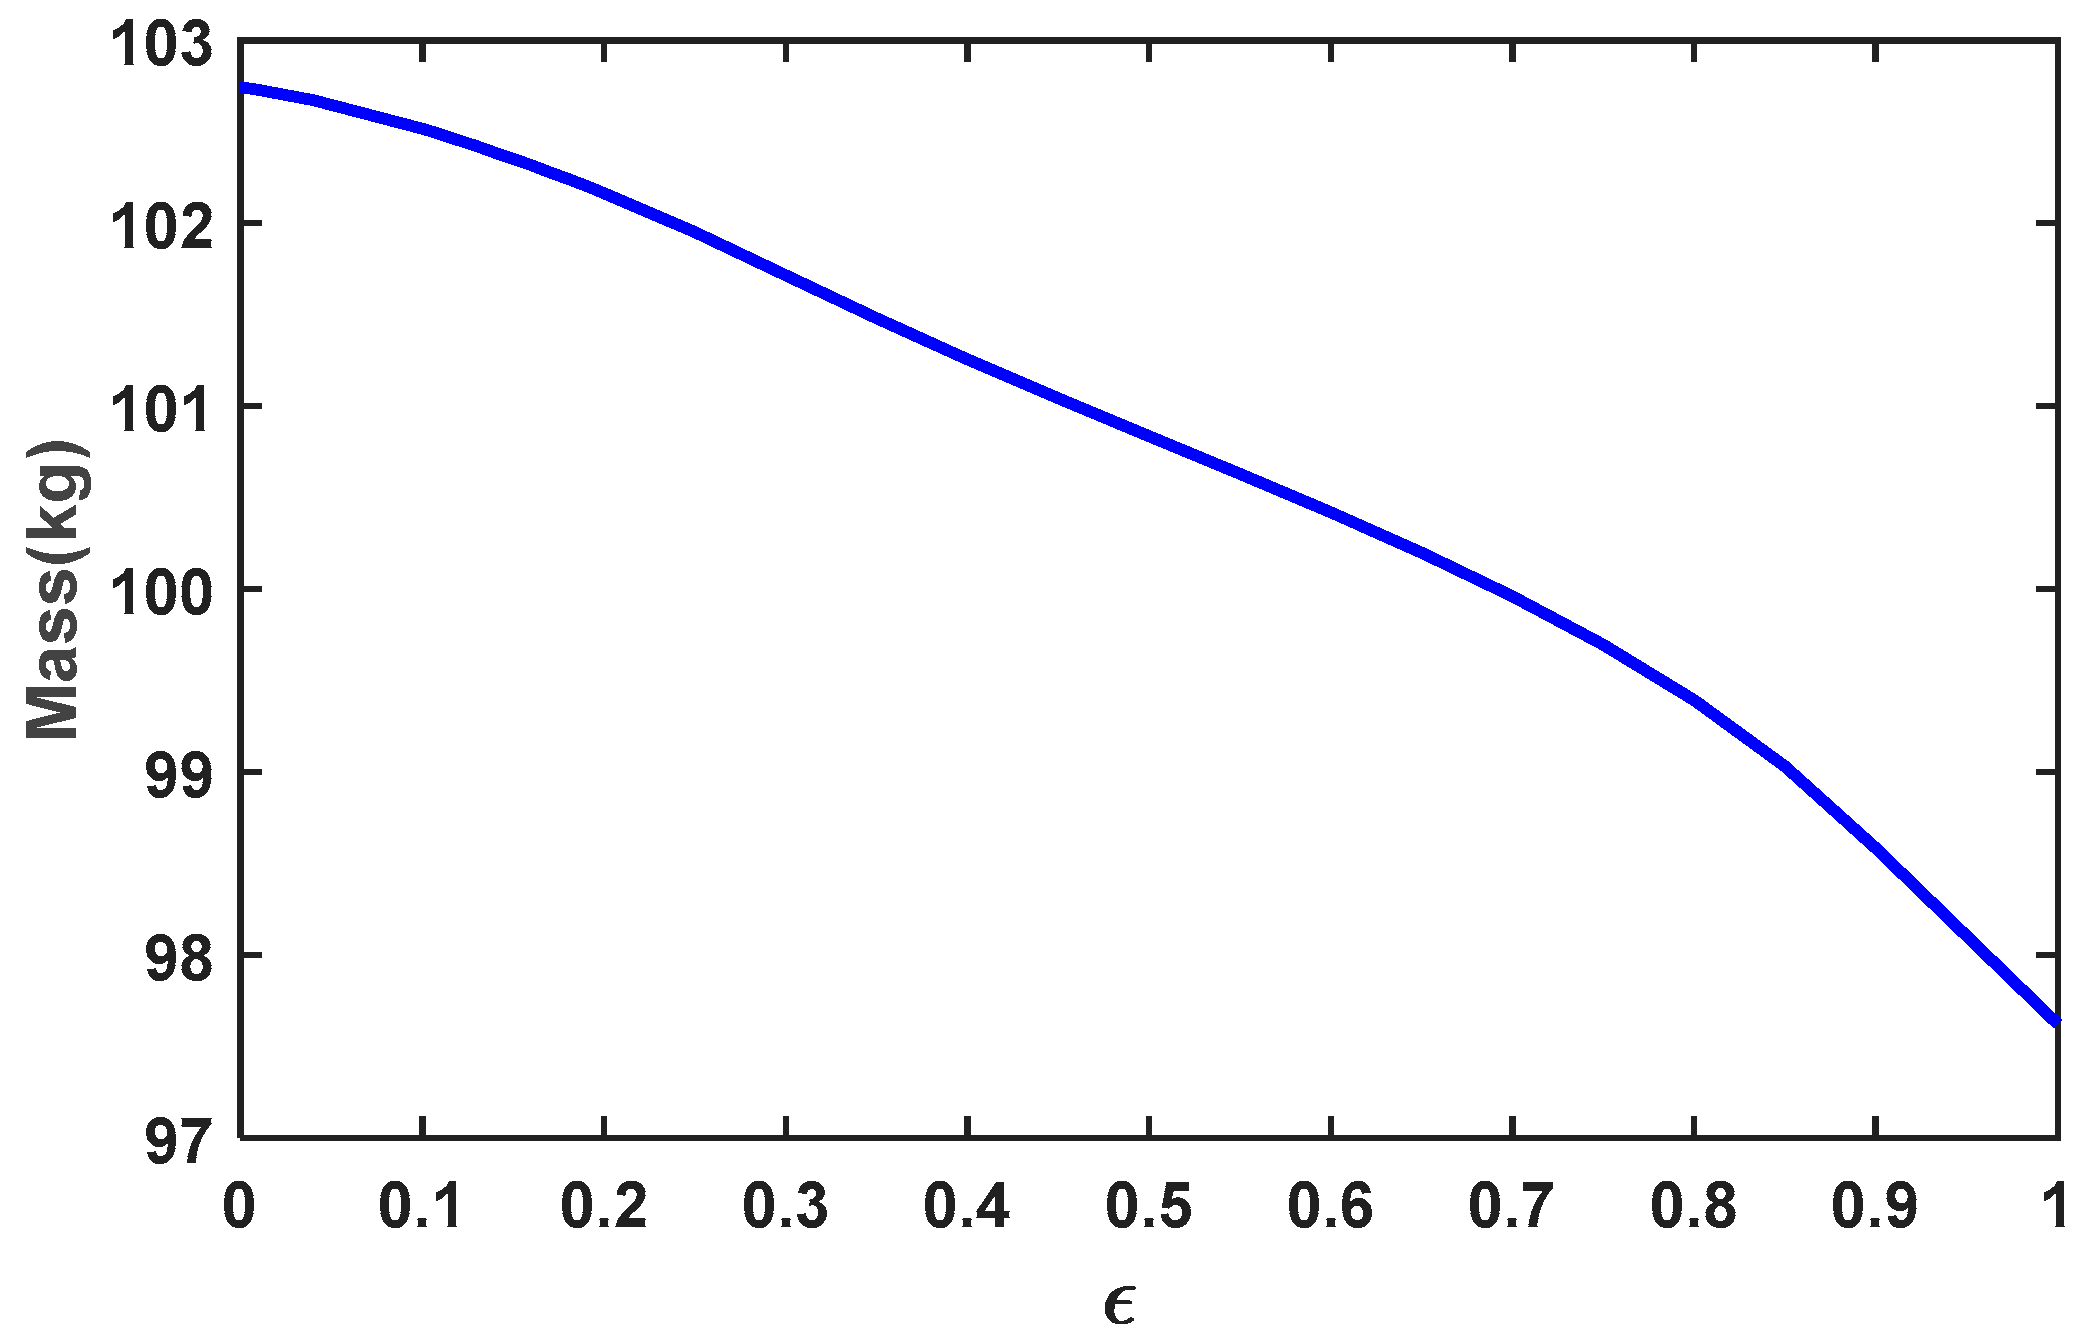
correspond to the energy-optimal and fuel-optimal problems. These developments are deployed with dual objectives: 1) mitigating the challenges linked to the inherent bang-bang control problem in fuel-optimal solutions using a homotopic method. 2) leveraging the homogeneity of the resulting equation set to effectively constrain the search space. Consider
as the vector of co-states. It's worth noting that
represents one of the unknown parameters, remaining constant throughout the homotopic algorithm. The application of Pontryagin’s minimum principle, in conjunction with Primer Vector theory, results in the following extremal controls [
25]
Here,
represents the switching function. The co-state dynamics, given by
, are derived through Euler-Lagrange conditions. Consequently, the set of state/co-state dynamics become:
5.3. Numerical simulations
This study focuses on analyzing fuel-optimal low-thrust trajectories for missions from Earth to Mars, considering Ephemeris perturbations. The research demonstrates the application of a dual-step hybrid optimization algorithm (PSO-Homotopy) to solve the resulting Multi-Point Boundary Value Problem (MPBVP) with high accuracy in satisfying the various constraints.
Moreover, the impact of different factors such as hyperbolic excess velocity, various Earth launch and Mars rendezvous opportunities, and various types of propulsion systems like Hall thrusters and Ion engines are investigated. The analysis aims to determine their effects on the mission's outcome.
The research explores scenarios where the hyperbolic excess velocity ranges between -2 (km/s) and 2 (km/s). Furthermore, the study considers variations in initial and final conditions, final date , initial date , and Time of Flight (TOF). The Earth launch and Mars rendezvous windows are set within the timeframe of [2024-Jan-01, 2026-Dec-31], where 2024-Jan-01 marks the start date of the search and 2026-Dec-31 serves as the final date.
TOF, calculated as the difference between , significantly influences the positioning and velocity of Mars at the end of the flight. The initial states of the Earth also rely on . The heliocentric position and velocity data for both Earth and Mars are sourced from the JPL/HORIZONS database, providing accurate planetary information for analysis and computations.
Delivering a payload of 102.8 (kg) to Mars while consuming only 17.2 (kg) of fuel represents a highly efficient and optimized mission. This impressive payload-to-fuel ratio underscores the effectiveness of the trajectory design and propulsion system employed in the mission. Achieving such a high payload mass while minimizing fuel consumption indicates a significant advancement in mission planning and spacecraft propulsion technologies. It showcases the optimization of trajectory maneuvers, propulsion efficiency, and mission design to maximize payload delivery while minimizing the fuel requirement, ultimately enhancing the mission's overall feasibility and cost-effectiveness.
The analysis conducts on thirty available thrusters, as detailed in
Table 6, aimed to identify the most effective thruster considering a new thrust modeling approach. The assessment leads to the determination that the RIT-22 Ion engine stands out as the most suitable thruster for this particular scenario. The RIT-22 Ion engine exhibits remarkable performance characteristics with a maximum thrust of
, specific impulse of
, and a mass of 7 kg.
Based on these findings, reflected in
Table 7, the optimization process resulted in an optimal spacecraft final mass of
(kg). Additionally, the optimization procedure determines the following key mission parameters:
Optimal hyperbolic excess velocity: (km/s)
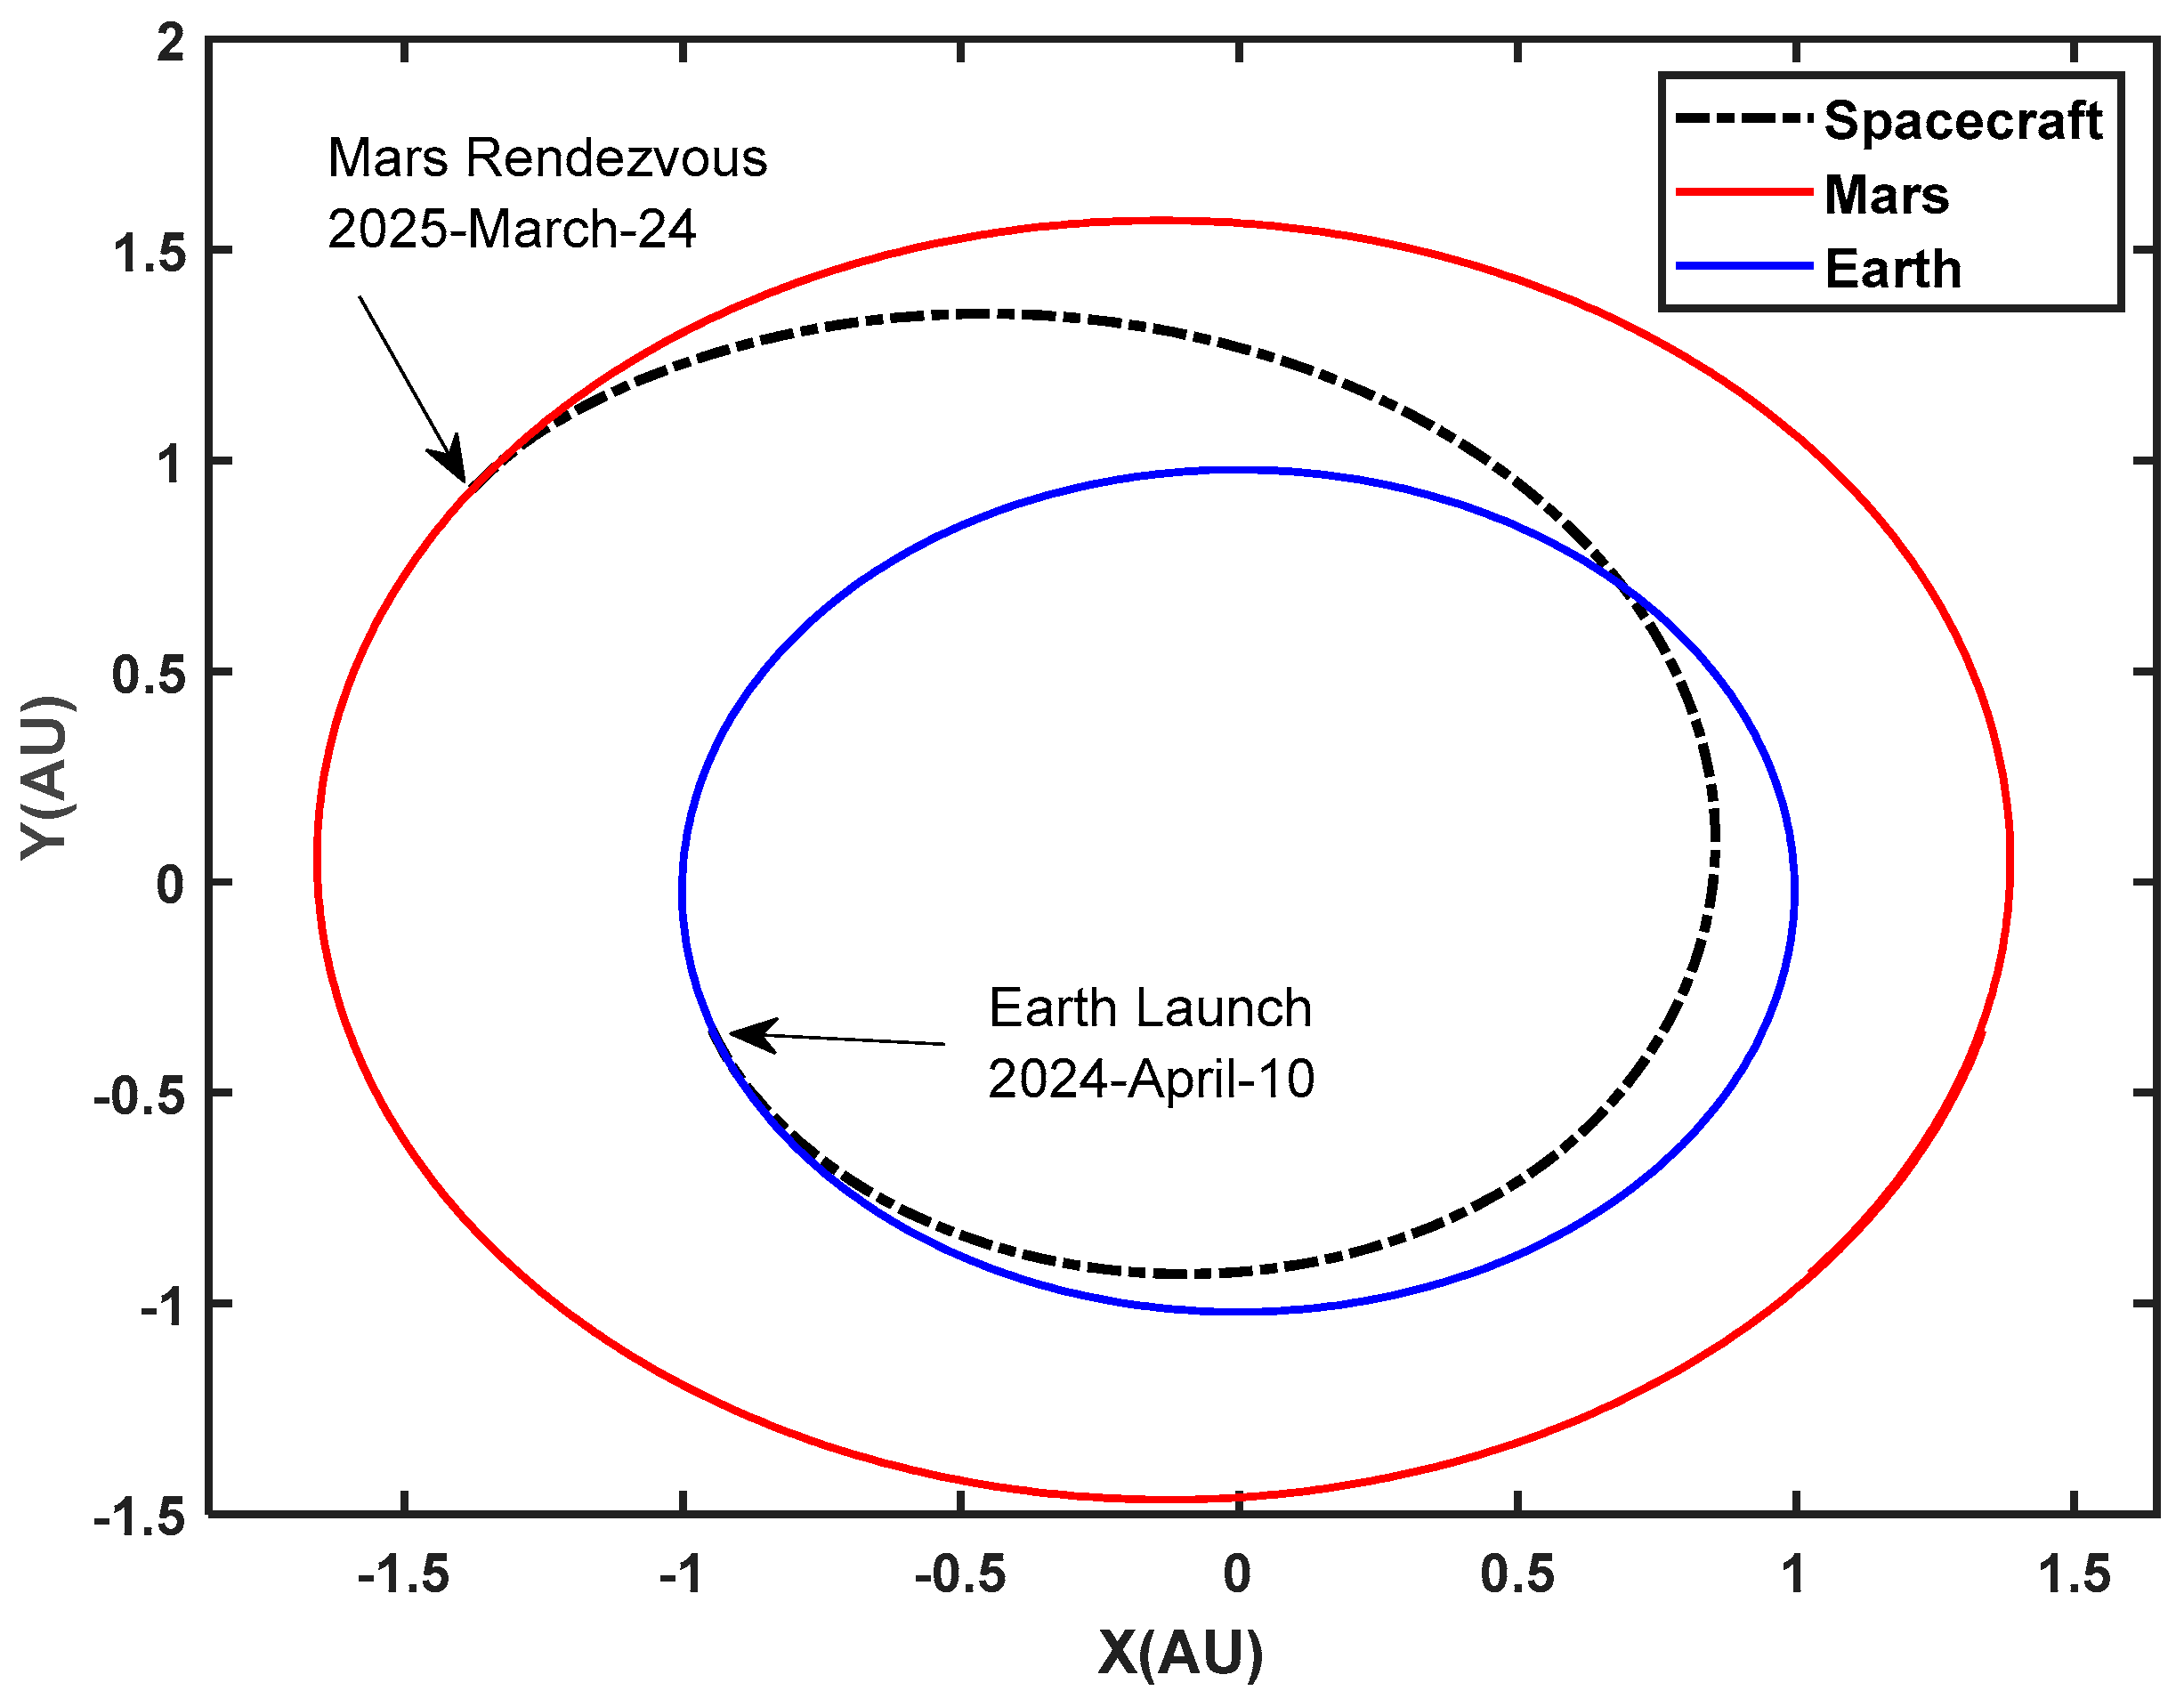
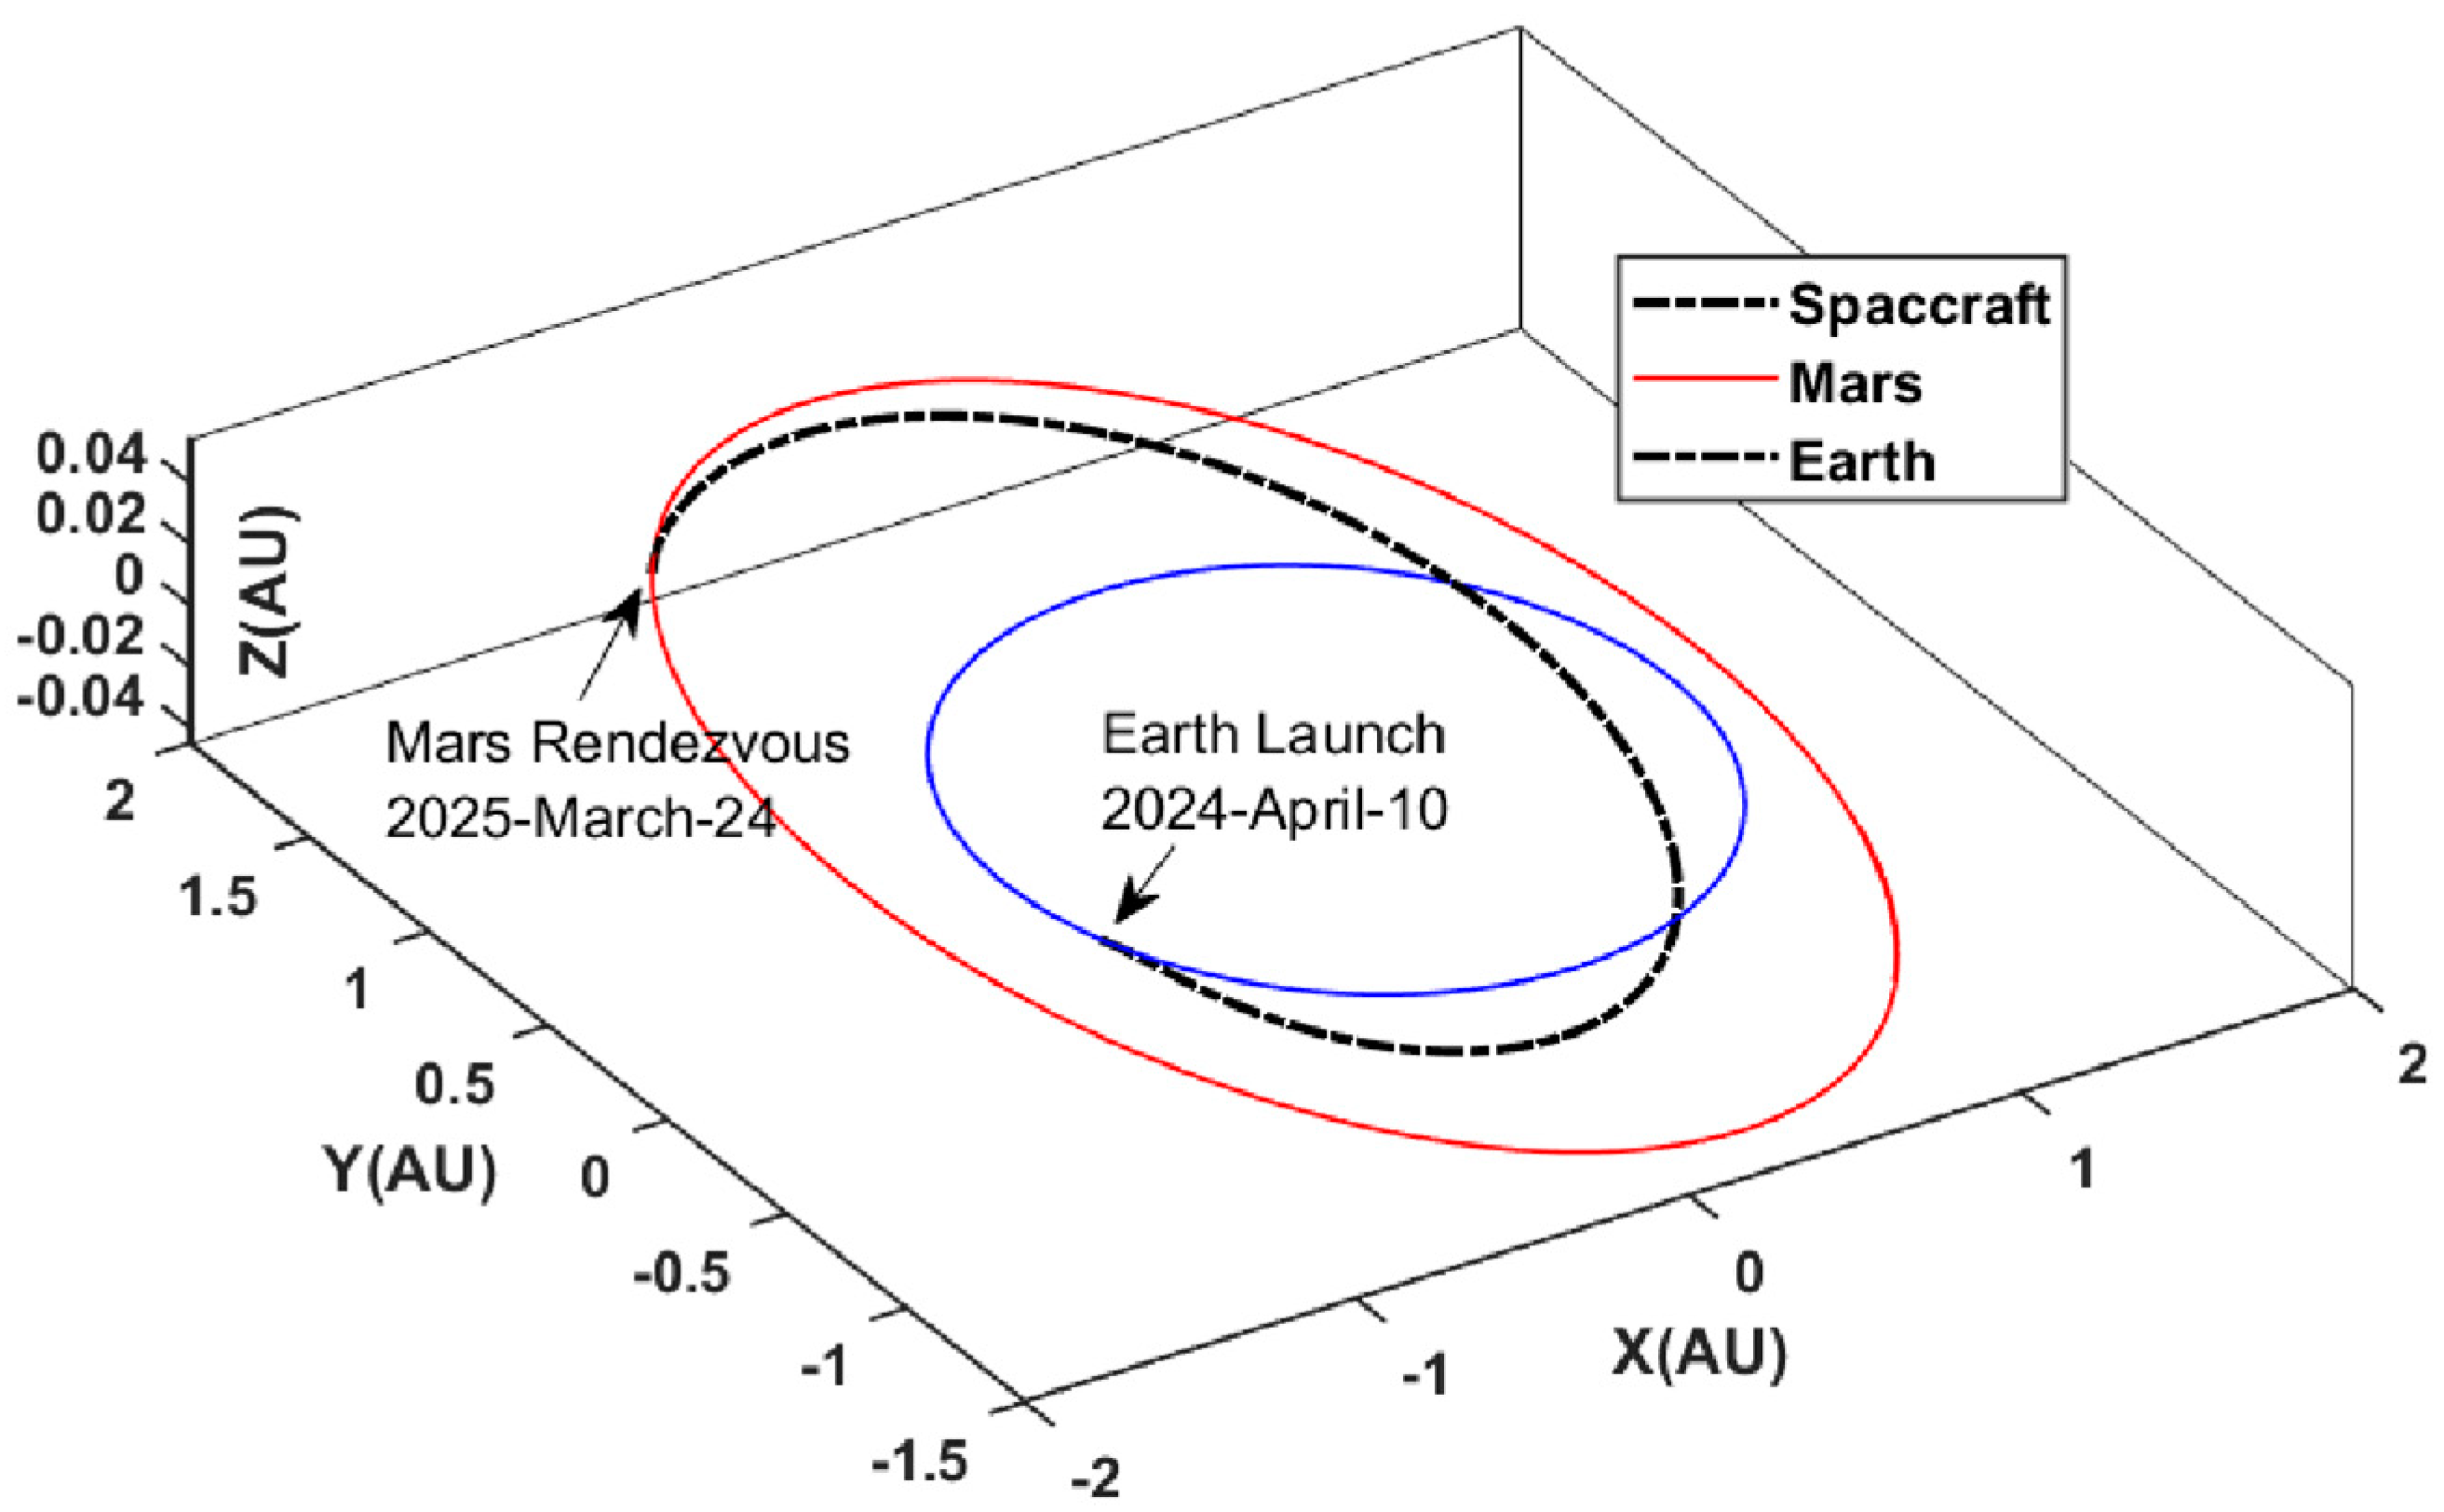
Launch date: 2024-Apr-10
Mars rendezvous date: 2025-Mar-24
Time of Flight (TOF): 348 days
Table 6.
Specifications of the thrusters considered in the solution.
Table 6.
Specifications of the thrusters considered in the solution.
|
Name, Ref. [27] |
Tmax(mN)
|
me (kg)
|
Isp(s)
|
Pmax(kW)
|
η(%)
|
| Ion Engines |
| NSTAR |
92.7 |
8.20 |
2,500 |
2.325 |
61.8 |
| DERA T6 |
150.0 |
6.20 |
3,470 |
3.900 |
65.0 |
| 25cm XIPS Hughes |
165.0 |
NA |
3,500 |
4.500 |
65.0 |
| NASA 30cm |
178.0 |
7.00 |
3,610 |
4.880 |
67.0 |
| RIT-XT |
210.0 |
NA |
4,448 |
6.850 |
75.5 |
| NEXT |
238.0 |
12.7 |
4,070 |
6.860 |
59.0 |
| RIT-22 |
250.0 |
7.00 |
6,400 |
5.0 |
NA |
| HiPER DS3G |
450.0 |
NA |
10,000 |
25.0 |
NA |
| NEXIS |
470.0 |
28.70 |
8,500 |
25.0 |
78.0 |
| Prior Thruster |
500.0 |
20.0 |
2,000 |
NA |
NA |
| HiPEP |
670.0 |
46.50 |
9,620 |
39.300 |
80.0 |
| Hall-Effect Thrusters |
| BHT-1500 |
102.0 |
NA |
1,820 |
1.7 |
54.6 |
| Thales HEMP |
152.0 |
6.0 |
3,500 |
3.0 |
58.0 |
| P5 |
246.0 |
NA |
2,326 |
5.0 |
NA |
| DS-HET |
300.0 |
12.0 |
3,000 |
5.0 |
50.0 |
| SPT-140 |
300.0 |
NA |
1,750 |
5.0 |
55.0 |
| T-140 |
300.0 |
NA |
2,000 |
4.5 |
NA |
| PPSX000 |
340.0 |
NA |
2,480 |
6.0 |
NA |
| NASA-137Mv2 |
342.0 |
NA |
3,000 |
7.872 |
59.6 |
| SPT-160 |
400.0 |
NA |
2,500 |
4.5 |
60.0 |
| SPT-200 |
498.0 |
NA |
2,250 |
11.0 |
63.0 |
| BHT-8000 |
512.0 |
20.0 |
1,900 |
8.0 |
60.0 |
| T-220 |
1,000.0 |
NA |
1,950 |
20.0 |
62.0 |
| PPS-20k ML |
1,050.0 |
25.0 |
2,500 |
22.4 |
60.0 |
| SPT-290 |
1,500.0 |
23.0 |
3,300 |
30.0 |
70.0 |
Table 7.
Parameters and optimal boundary values for Earth-Marth Mission.
Table 7.
Parameters and optimal boundary values for Earth-Marth Mission.
| Parameter |
Optimal solution |
|
(TDB; JD) |
20024-April-10; 2460410.5 |
| Time of Flight (Day) |
348 |
|
(TDB; JD) |
20025-Mar-24; 52460758.5 |
|
(km) |
[-1.41697171828695E+08, -5.24872600577300E+07, 3.41954334262199E+04] |
|
(km/s) |
[9.858836758211465E+00, -2.807567589144283E+01, 2.475556862844286E-04] |
|
(km) |
[-2.062255095916851E+08 1.393403861898105E+08 7.999954257281169E+06] |
|
(km/s) |
[-1.27286229760030E+01, -1.795386400481246E+01, -6.391620818469512E-02] |
|
(kg) |
120 |
|
(s) |
6,400 |
|
(mN) |
250 |
This optimized configuration represents the most efficient combination of spacecraft characteristics and mission timing to achieve the delivery of a 102.8 kg payload to Mars using the RIT-22 Ion engine while adhering to the specified hyperbolic excess velocity and mission timelines
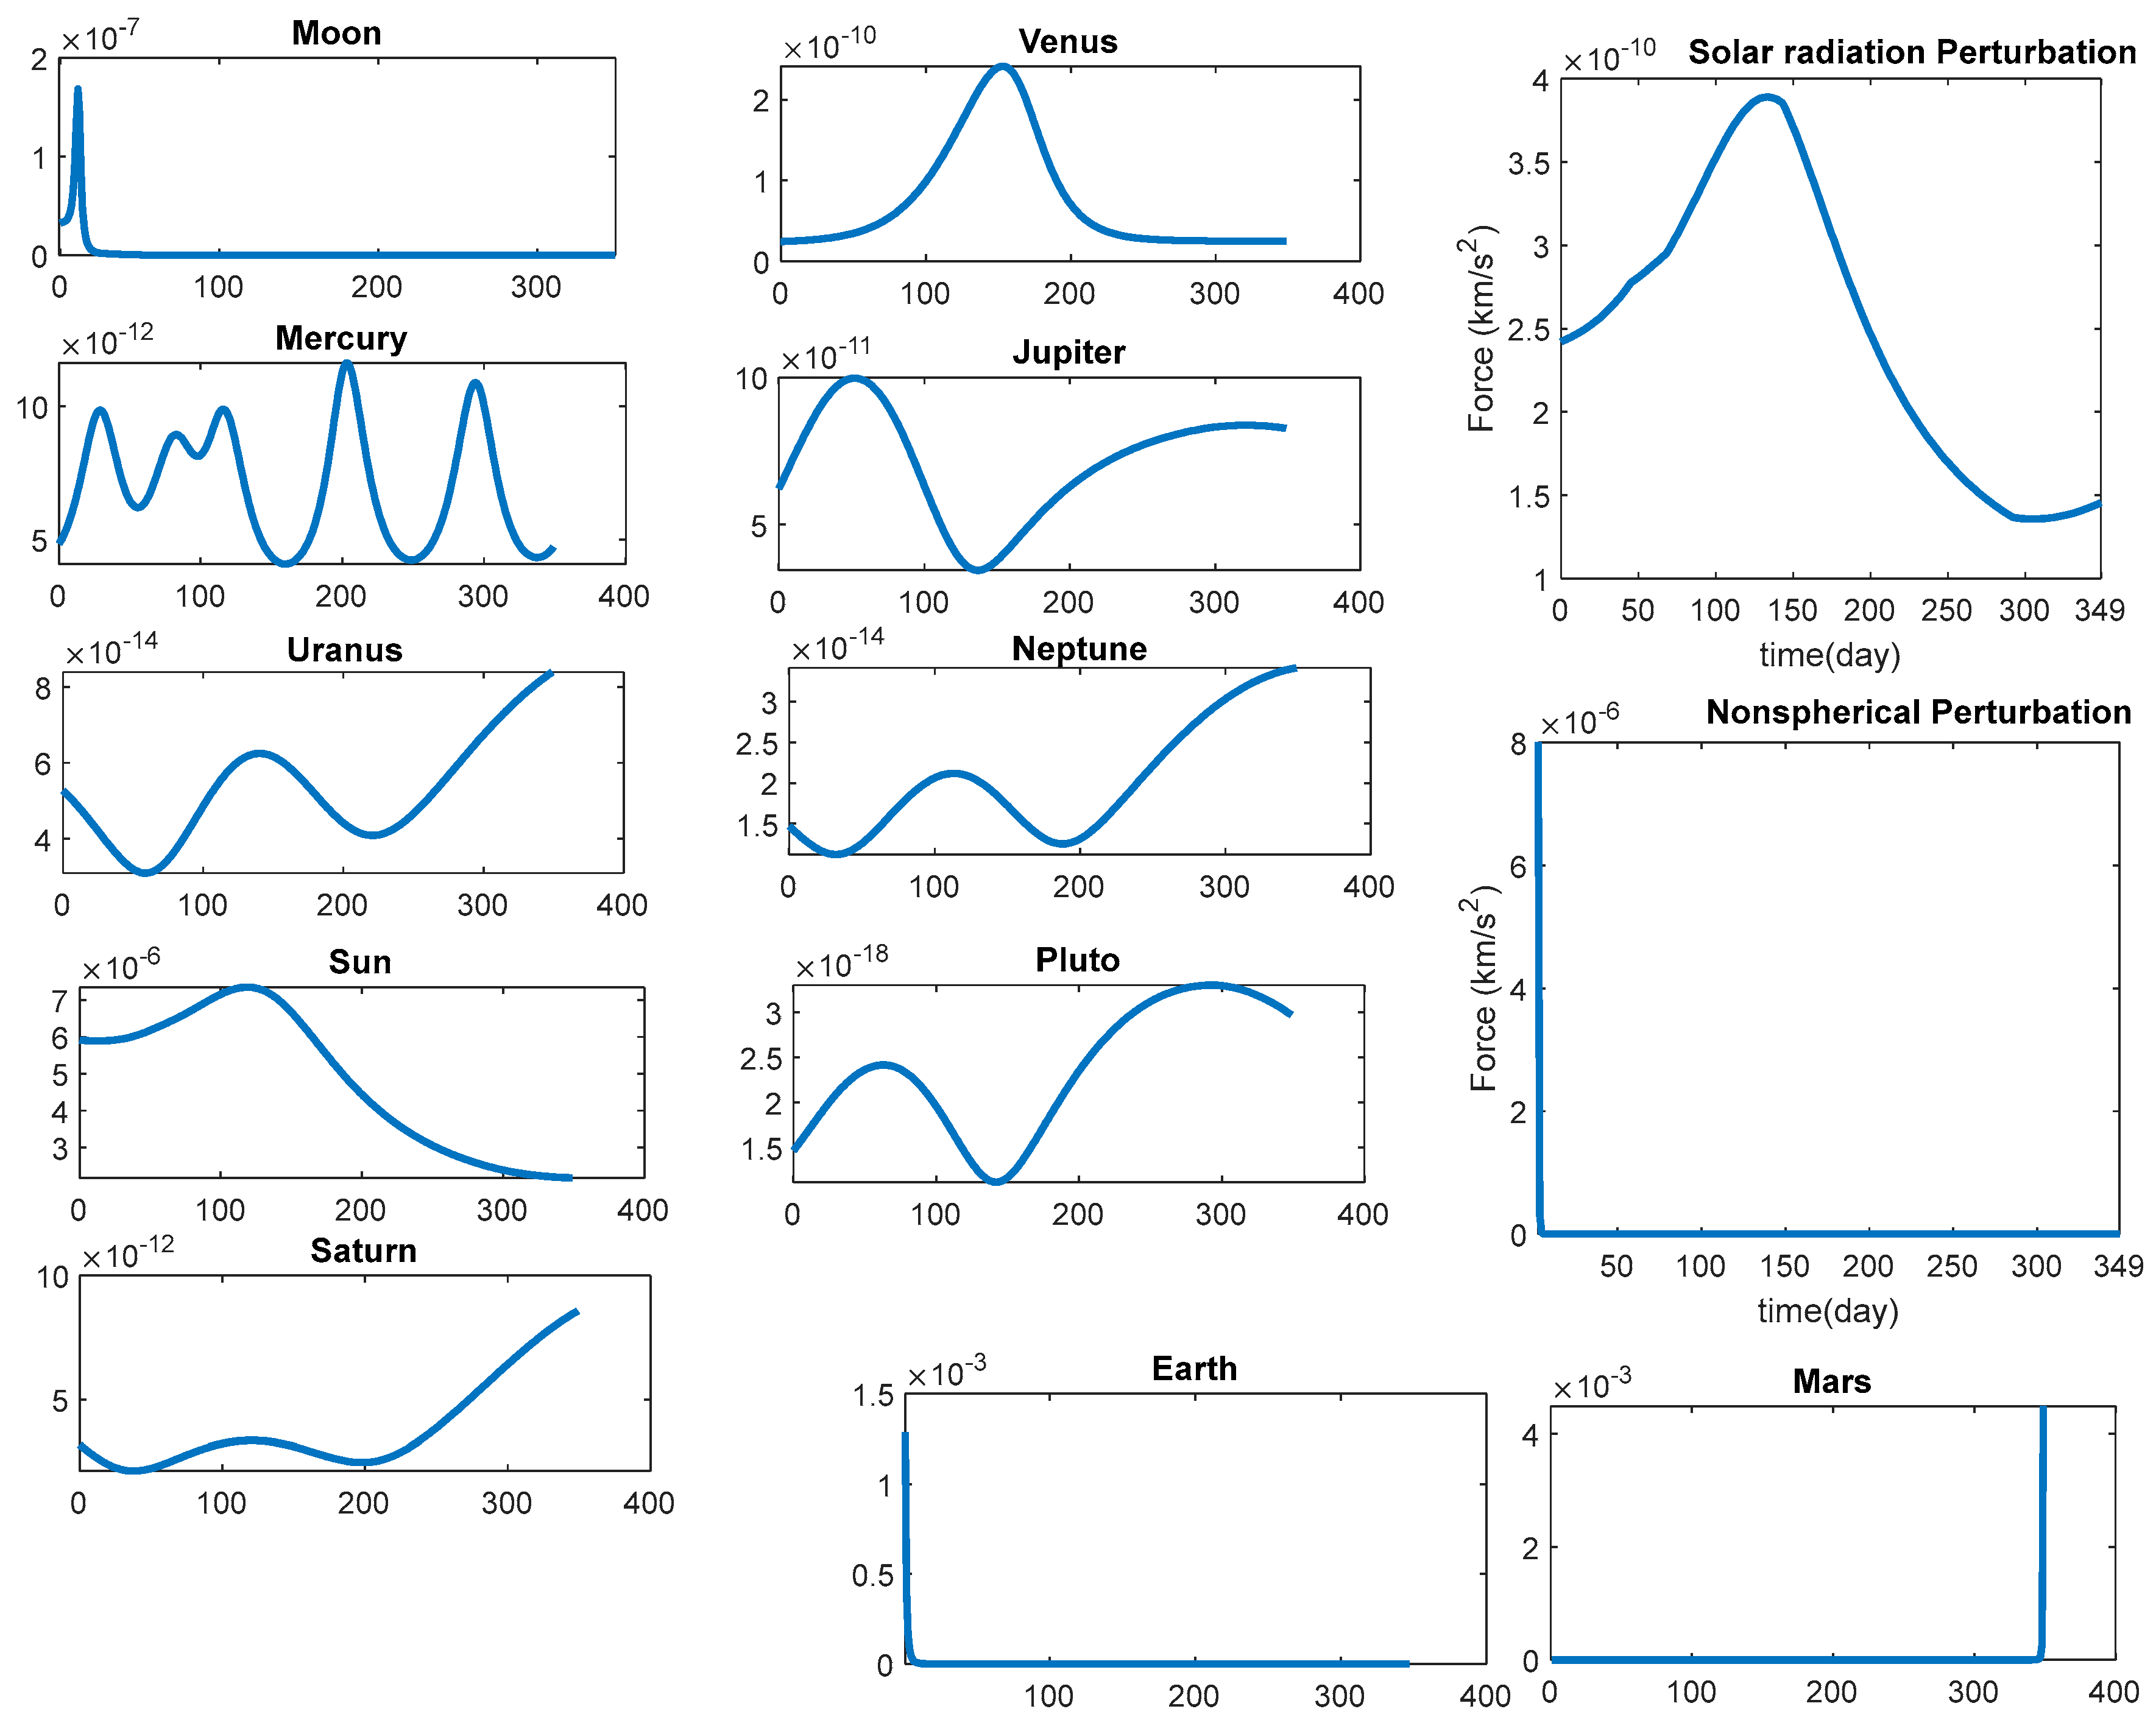
Figure 26 displays the time evolution of planetary gravity perturbations along the trajectory with a hyperbolic excess velocity of
(km/s). This figure illustrates how the influence of Mars' gravity potential gradually increases over time, becoming significant as the spacecraft enters Mars' Sphere of Influence (SOI). Additionally, it showcases the impact of solar radiation pressure perturbations on the spacecraft's trajectory, considering the instantaneous spacecraft mass. Furthermore,
Figure 26 depicts the perturbing acceleration due to the second zonal harmonic (
) for Earth, with noticeable effects observed within Earth's SOI, especially when the spacecraft approaches Earth.
The attractiveness of this analytical tool lies in its capability to provide high-resolution and accurate solutions. This is achieved through the utilization of a hybrid optimization method in formulating and solving the resulting Optimal Control Problems (OCPs).
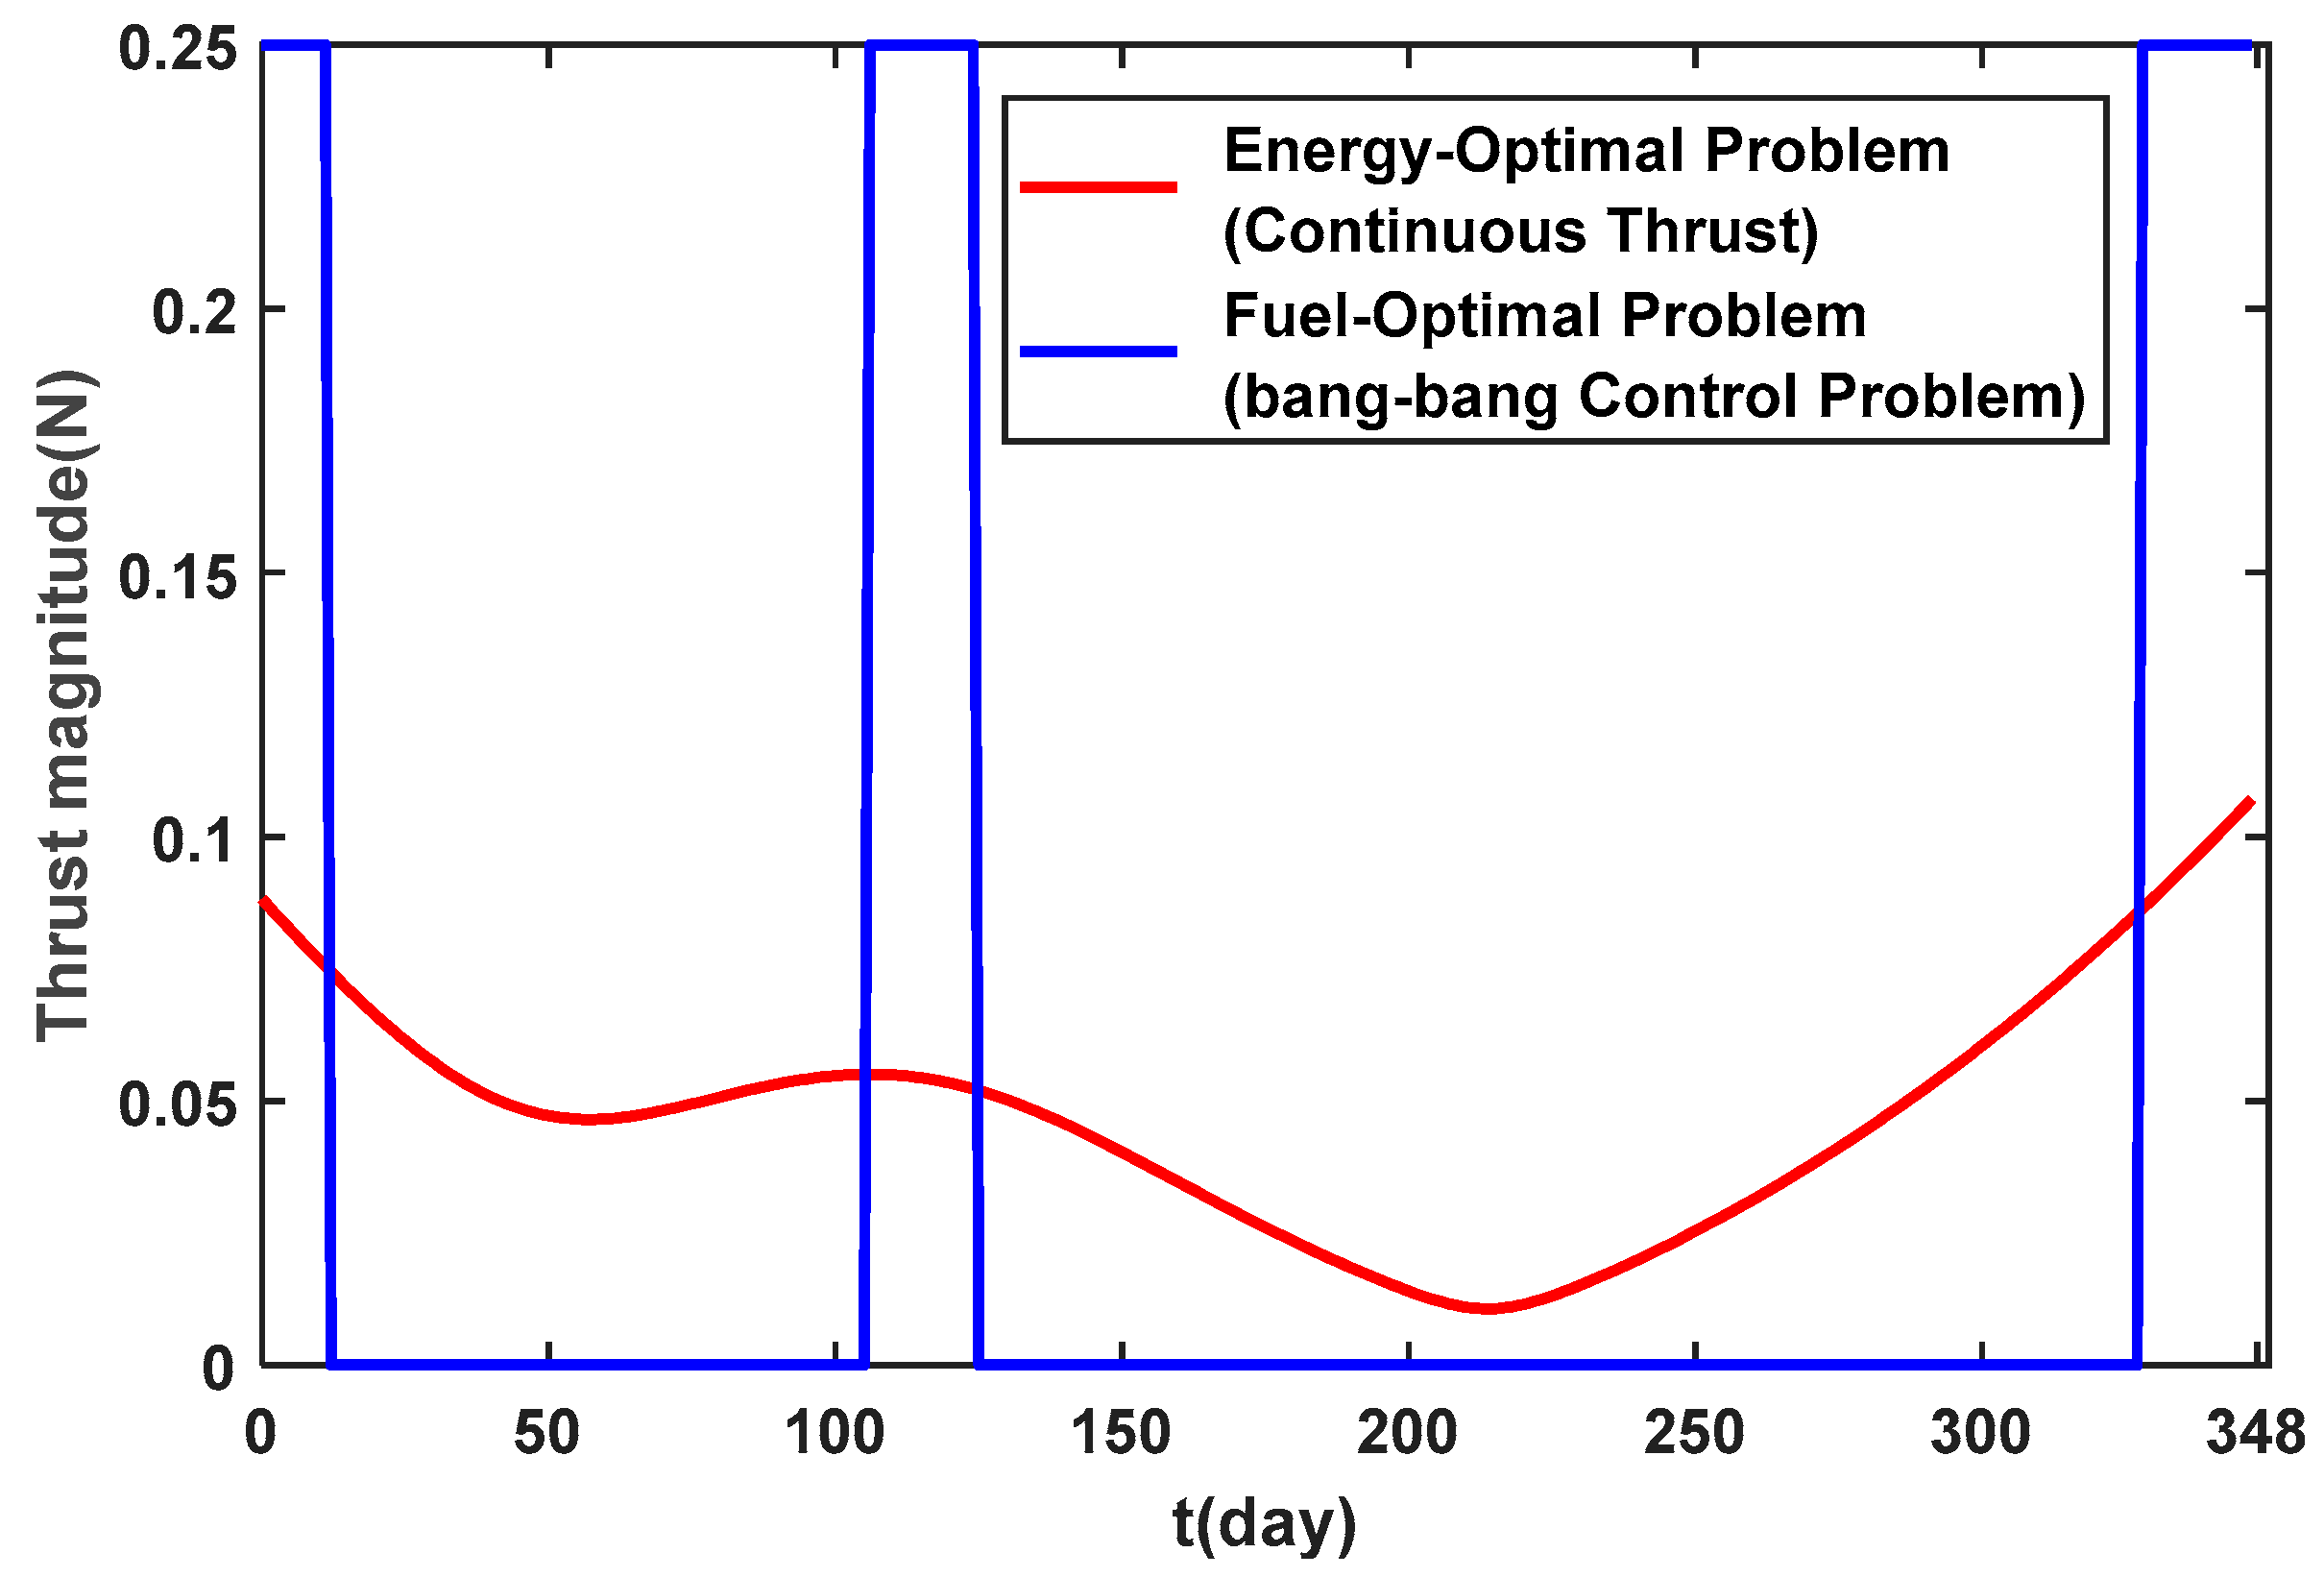
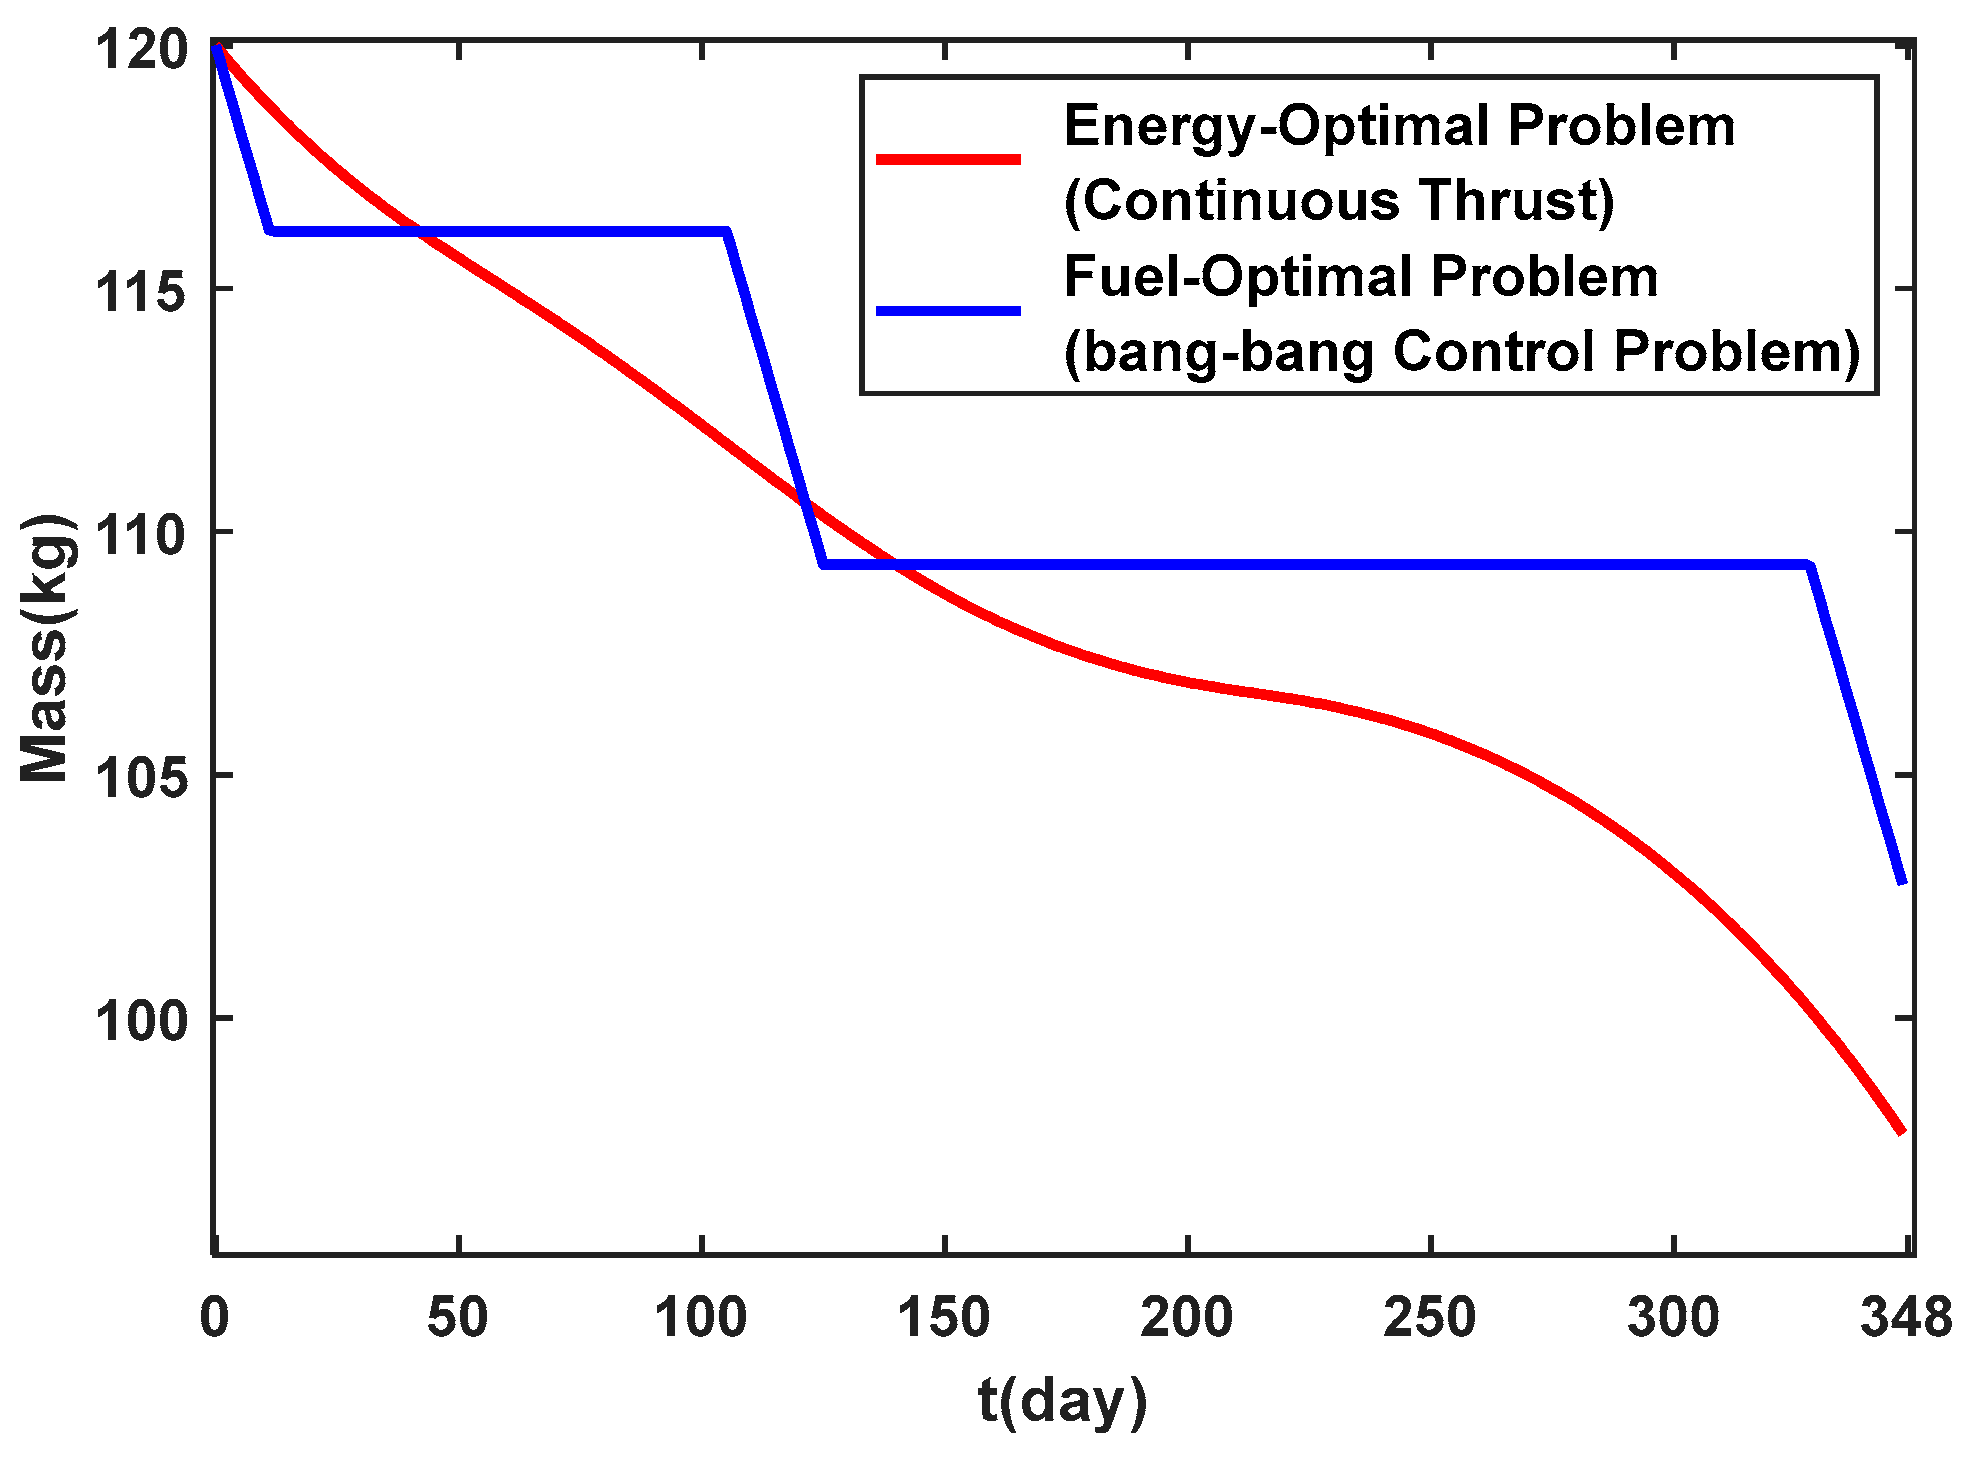
Figure 27 presents the energy-optimal and fuel-optimal thrust profiles specifically tailored for the RIT-22 Ion engine. Moreover,
Figure 28 and
Figure 29 showcase the fuel-optimal bang-bang control trajectory based on the Ephemeris dynamical model with a comprehensive perturbation system. The differences in mass between energy-optimal and fuel-optimal solutions for this dynamical model are visually depicted in
Figure 30 and
Figure 31.
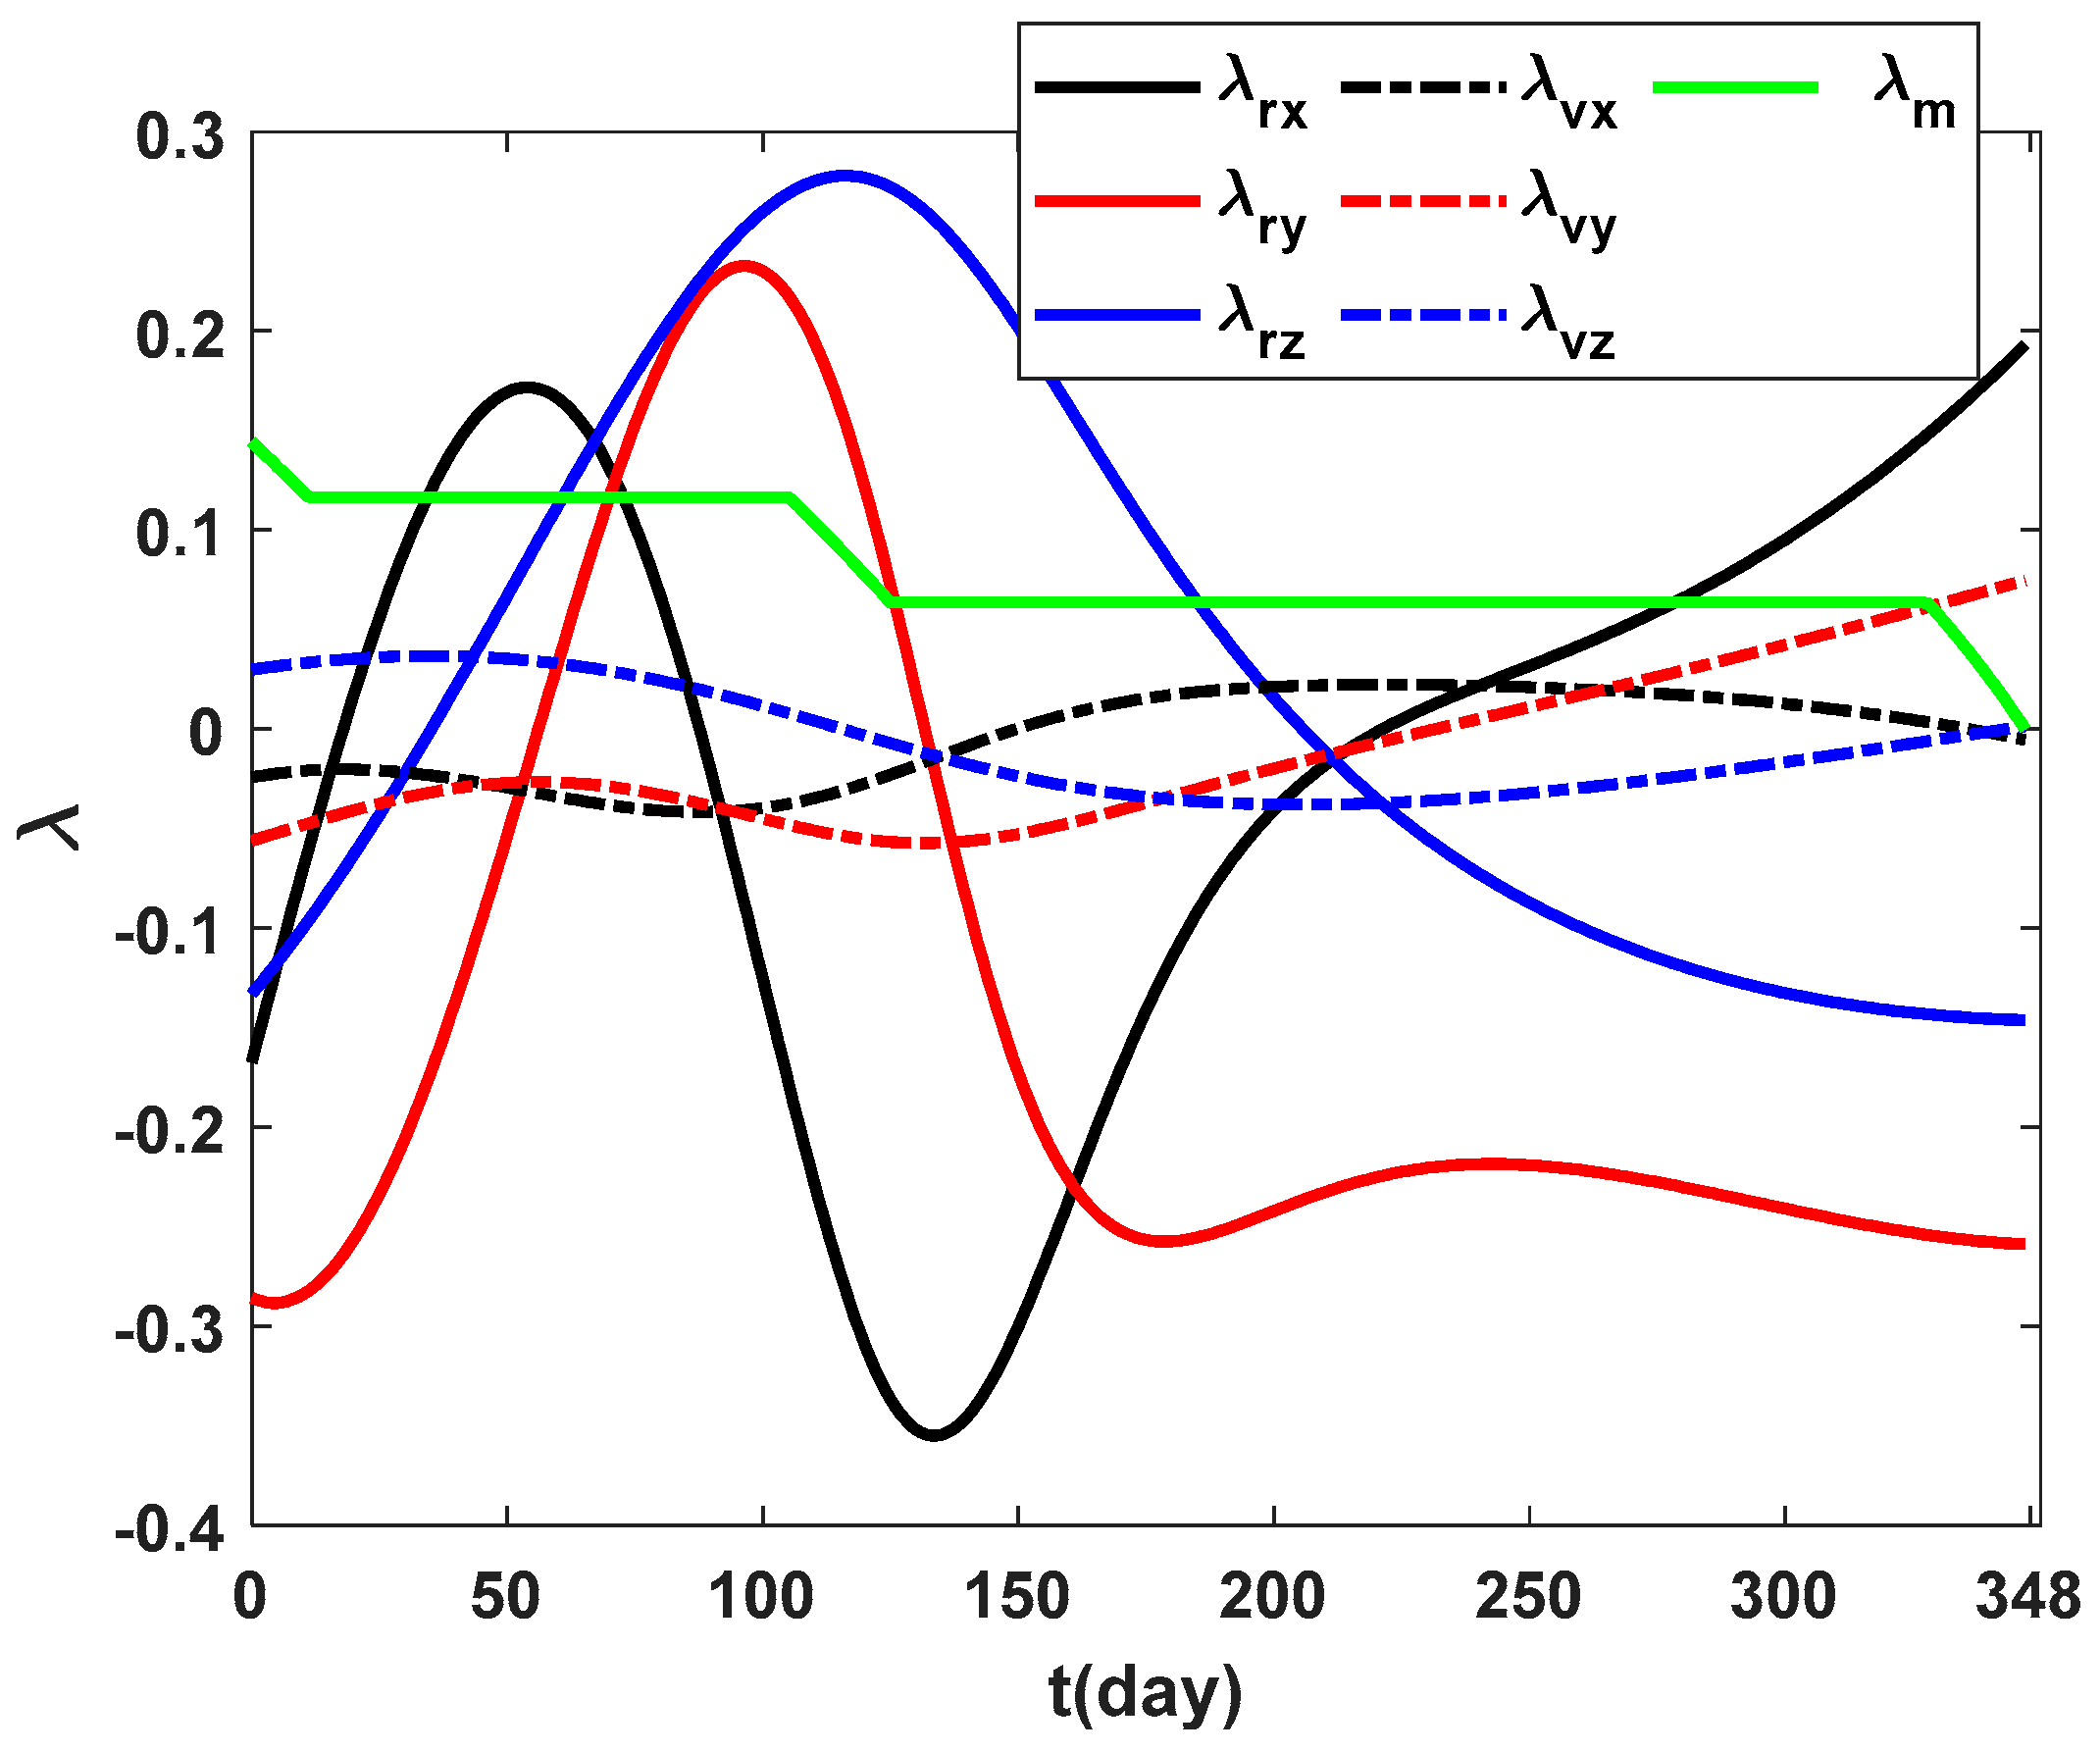
Furthermore,
Figure 32 illustrates the influence of the dynamical model on the time evolution of elements within the co-state vector, with the co-states are restricted within the domain of [-1,1]. Remarkably, the shooting function accuracy errors of the fuel-optimal solution demonstrate small values, with final condition errors reported as
and
.
Despite achieving a high level of accuracy in the optimal solution, the terminal mass of the proposed solution has been increased to 102.8 kg. This augmentation is a result of employing various efficient optimization techniques, such as adjusting the hyperbolic excess velocity, exploring different Earth launch and Mars rendezvous opportunities, evaluating different types of thrusters, optimizing the Time of Flight (TOF), and leveraging the hybrid optimization method. These strategies collectively contribute to refining the solution towards the specified objectives.
6. Satellite system design
6.1. Cargo microsatellite
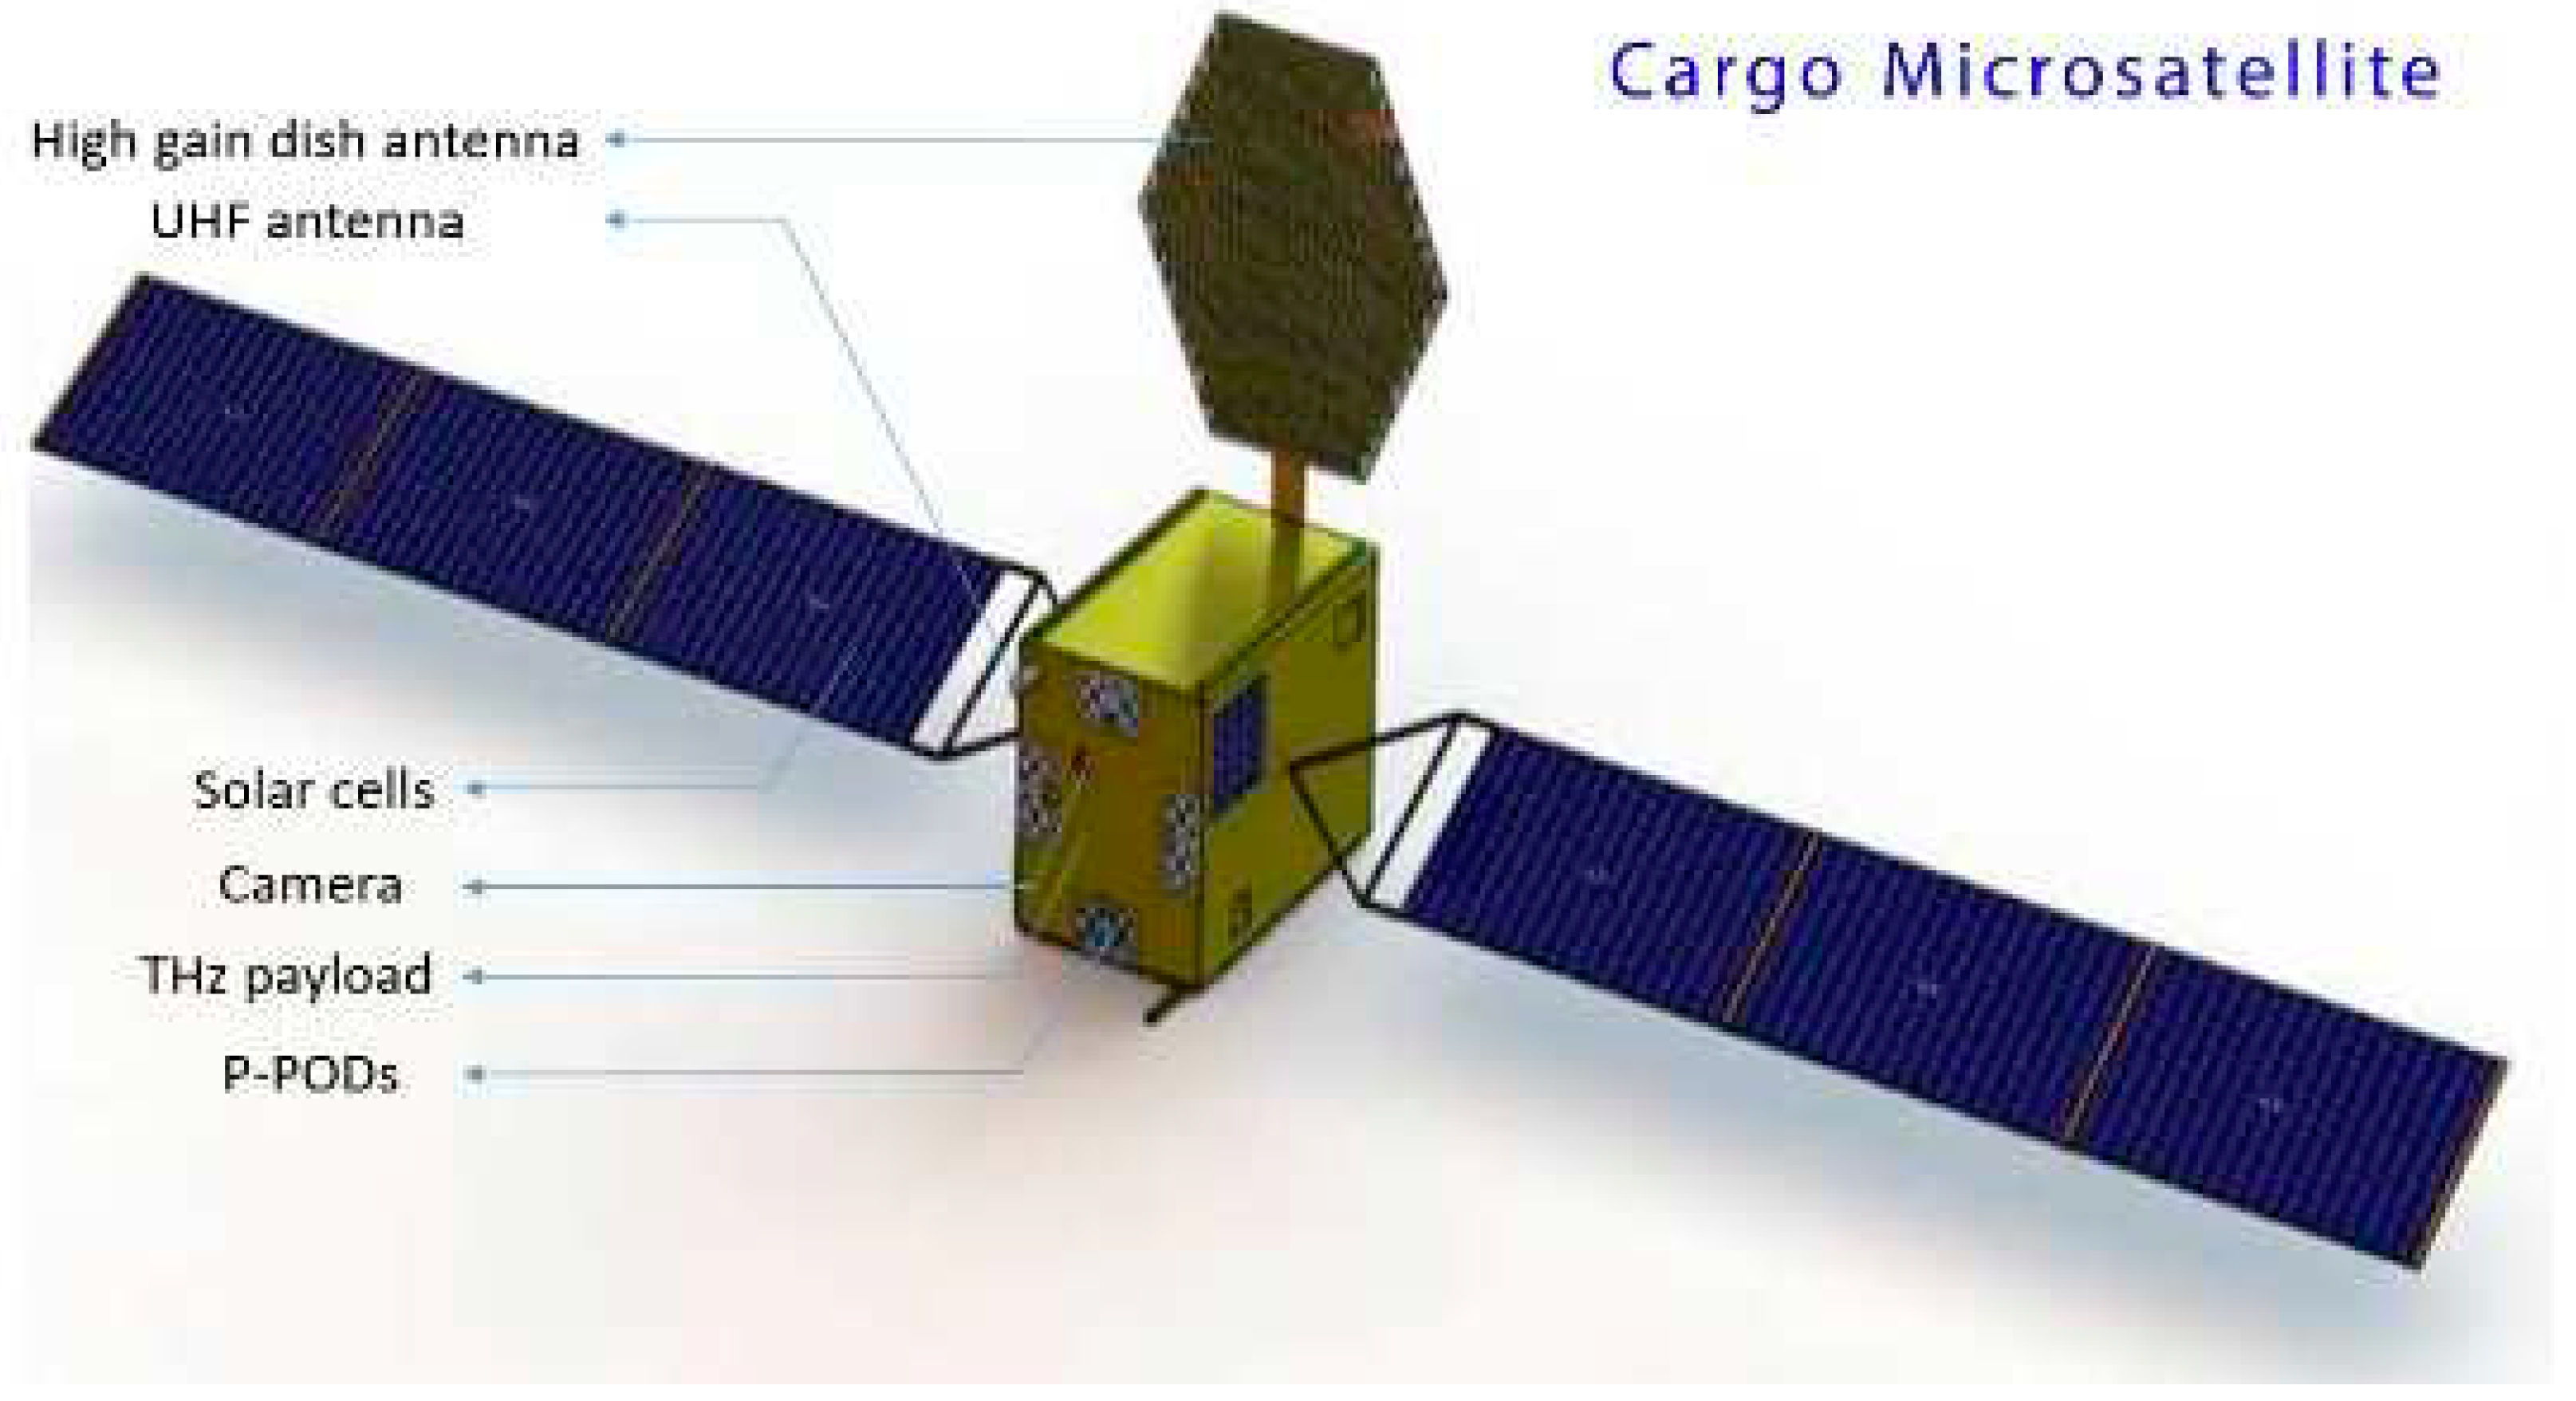
The Cargo Microsatellite serves as a pivotal component in the MeSat initiative. Its primary function is to carry the CubeSats from Earth to Mars, facilitating their exploratory endeavors on the Martian terrain. The specifications of the Microsatellite are depicted in
Figure 33, which reveal that it has a total mass of 120kg and occupies dimensions of 60x60x100 cm, see
Table 8 shows mass budget for Cargo Microsatellite. The Cargo's capabilities are integral to the overall success of the mission, and its efficient operation is imperative in ensuring the smooth execution of the Martian investigation.
Telemetry Tracking & Command system: For direct communication with the Deep Space Network (DSN), the Cargo Microsatellite utilizes a high gain reflect array X-band antenna. The downlink data is transmitted via an X-band transmitter with a selectable bitrate, capable of achieving a maximum data rate of 100Mbps with QPSK/OQPSK modulation. This transmitter enables the transmission of data directly to Earth. In addition, a UHF transceiver is utilized for data communication between the mothership and the CubeSats.
On Board Data Handing: Two microcontrollers are employed in the Cargo Microsatellite for command and data handling purposes. The Aeroflex GR712 computer board is responsible for managing the trajectory and attitude control algorithm. On the other hand, an STM32-based microcontroller is utilized to supervise the rest of the subsystems such as Telemetry, Tracking and Command (TTC), Electrical Power System (EPS), Payload, and Ultra High Frequency (UHF) communication. The utilization of two microcontrollers in the Cargo Microsatellite provides enhanced control over the spacecraft's various subsystems, ensuring smooth and efficient operations.
Payload: The Cargo is equipped with several essential instruments such as a high-resolution camera, a THz receiver, and Poly Picosatellite Orbiter Deployers (P-PODs). The camera captures images during the ejection of CubeSats, and these images are transmitted to the DSN for verification of the CubeSats' deployment. The THz receiver is an important tool that will be used to determine the location of water on the Martian surface. Additionally, the P-PODs are utilized to release the CubeSats into space. The successful deployment of these CubeSats will be a critical step towards achieving the mission objectives.
Electrical Power System (EPS): The EPS system of the Cargo is equipped with 8 sets of 6U solar cells that provide power to the electrical subsystems. In addition, a 100Wh battery power generator is included to support the system during periods of low solar energy, such as when the spacecraft is in shadow or during periods of high-power consumption.
Attitude Determination and Control System: the cargo Microsatellite uses DARE T6 Ion thruster to transport the CubeSats from Earth to Mars. Reaction wheels and Star tracker for attitude control and determination on Mars subsequently.
6.2. CubeSats system design
MeSat facilitates the enhanced differentiation of Martian features through the deployment of five distinct missions. Each mission within the MeSat project is dedicated to the precise identification of specific environmental characteristics on Mars. The following elucidates the unique features and objectives of each CubeSat system within the project.
FTS CubeSat: The Fourier Transform Spectrometer (FTS) is an important payload for measuring wind observations from space with high accuracy. This payload can be easily integrated into a 6U CubeSat, making it highly adaptable for various applications. In this case, it is specifically designed for observing the wind spectrum on Mars. The payload specifications are listed in
Table 9. The FTS payload consists of an interferometer with a spectral resolution of 0.05
and a spectral range of 1-12 microns. It is equipped with a linear array detector with a pixel size of 17 x 17 microns and a readout noise of less than 300 electrons. The interferometer is temperature-controlled to ensure stable performance, and the entire payload has a mass of approximately 5 kg. With its high spectral resolution and wide spectral range, the FTS payload will be able to provide valuable data on the Martian atmosphere, including wind speed and direction measurements. This information can aid in our understanding of the Martian climate and potential habitability.
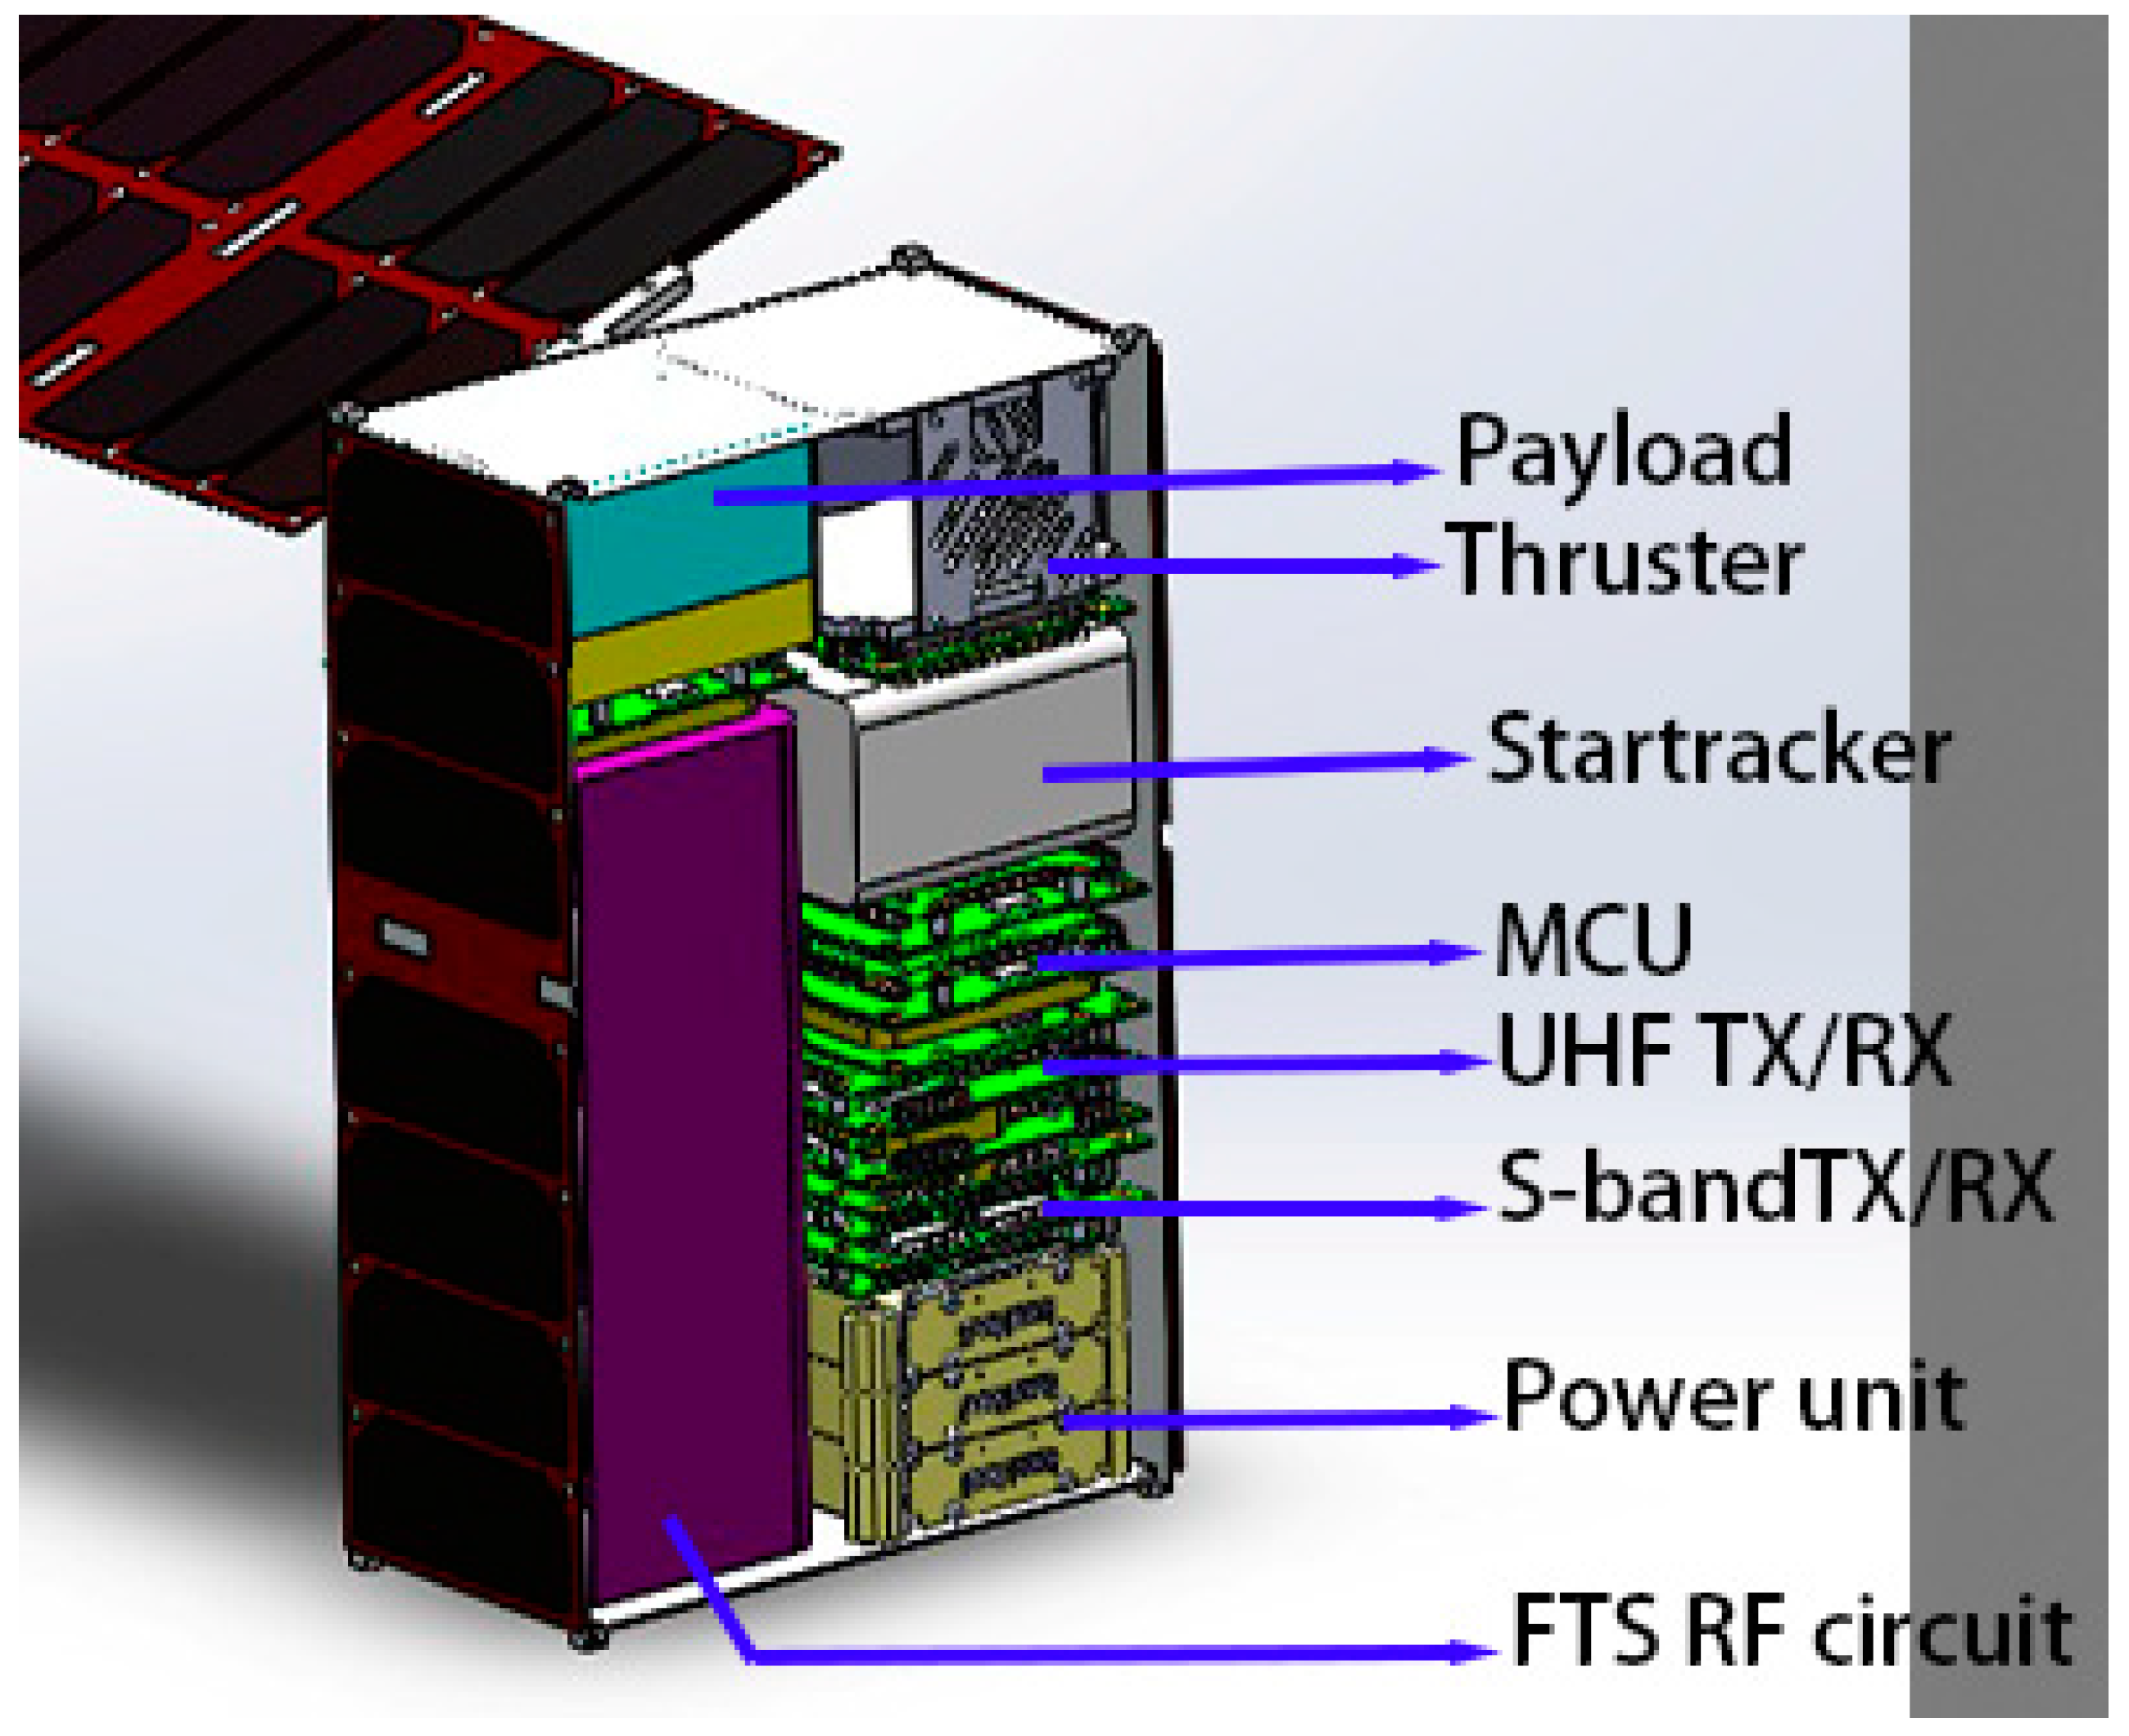
FTS CubeSat’s mass budget substantiates 6U CubeSat platform is suitable for FTS mission. FTS uses single STM32 based MCU for OBDH subsystem. UHF transceiver for intersatellite link communication, star tracker for attitude determination, reaction wheels and cold gas thruster for attitude control systems, 6x6U pluses 2x3U solar cells approximately generates 50Wh power on Mars orbit, which is sufficient for mission accomplishment.
Table 10 shows FTS CubeSat mass budget.
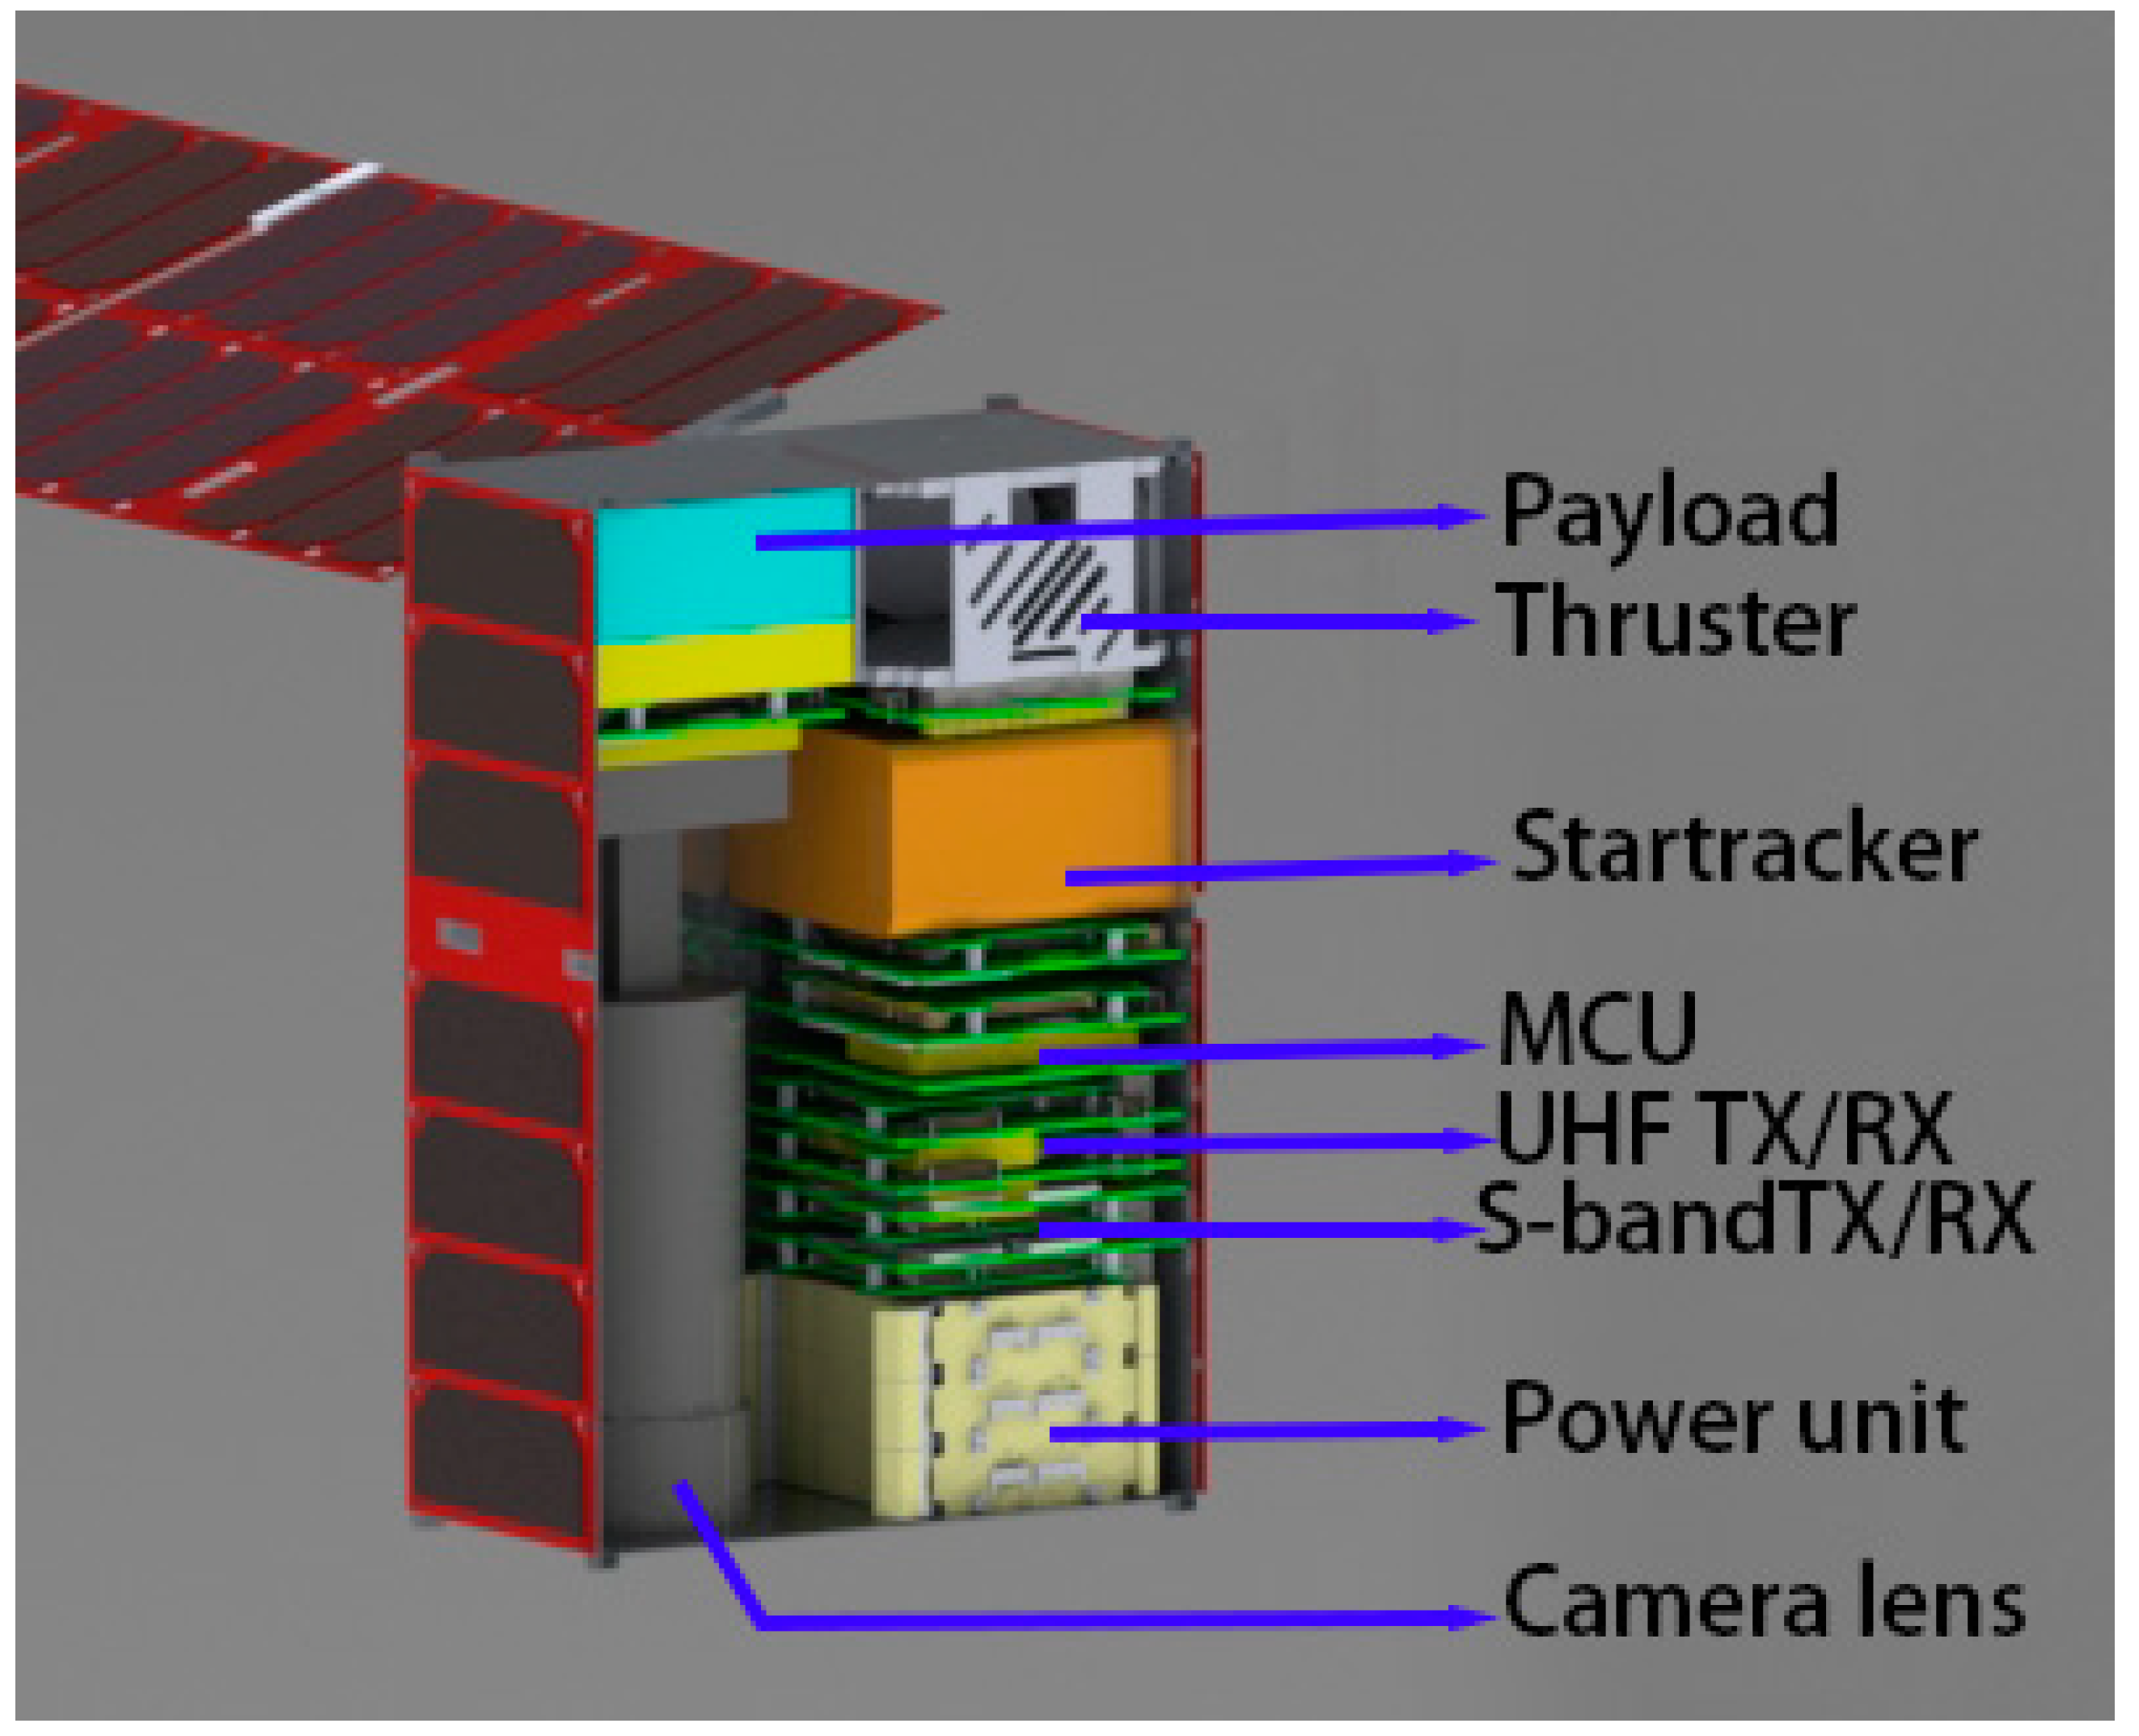
Figure 34 depicts the Computer-Aided Design (CAD) model and subsystems layout of the Fourier Transform Spectrometer (FTS) CubeSat. As evident from the figure, the FTS payload occupies a significant portion of the CubeSat structure, highlighting the importance of the payload in the mission.
High-quality camera 6U payload: The Chameleon imager is a state-of-the-art hyperspectral instrument designed to deliver advanced imaging capabilities to CubeSats. Its compact design integrates space-qualified control electronics, specialized optics, and a large high-speed data storage system.
Table 11 presents the Chameleon imager's technical specifications and
Table 12 shows high quality CubeSat mass budget. With its innovative technology, the Chameleon imager is poised to enable new scientific discoveries and enhance our understanding of Mars and other planets.
Figure 35 shows high-quality CubeSat structures and subsystem configuration.
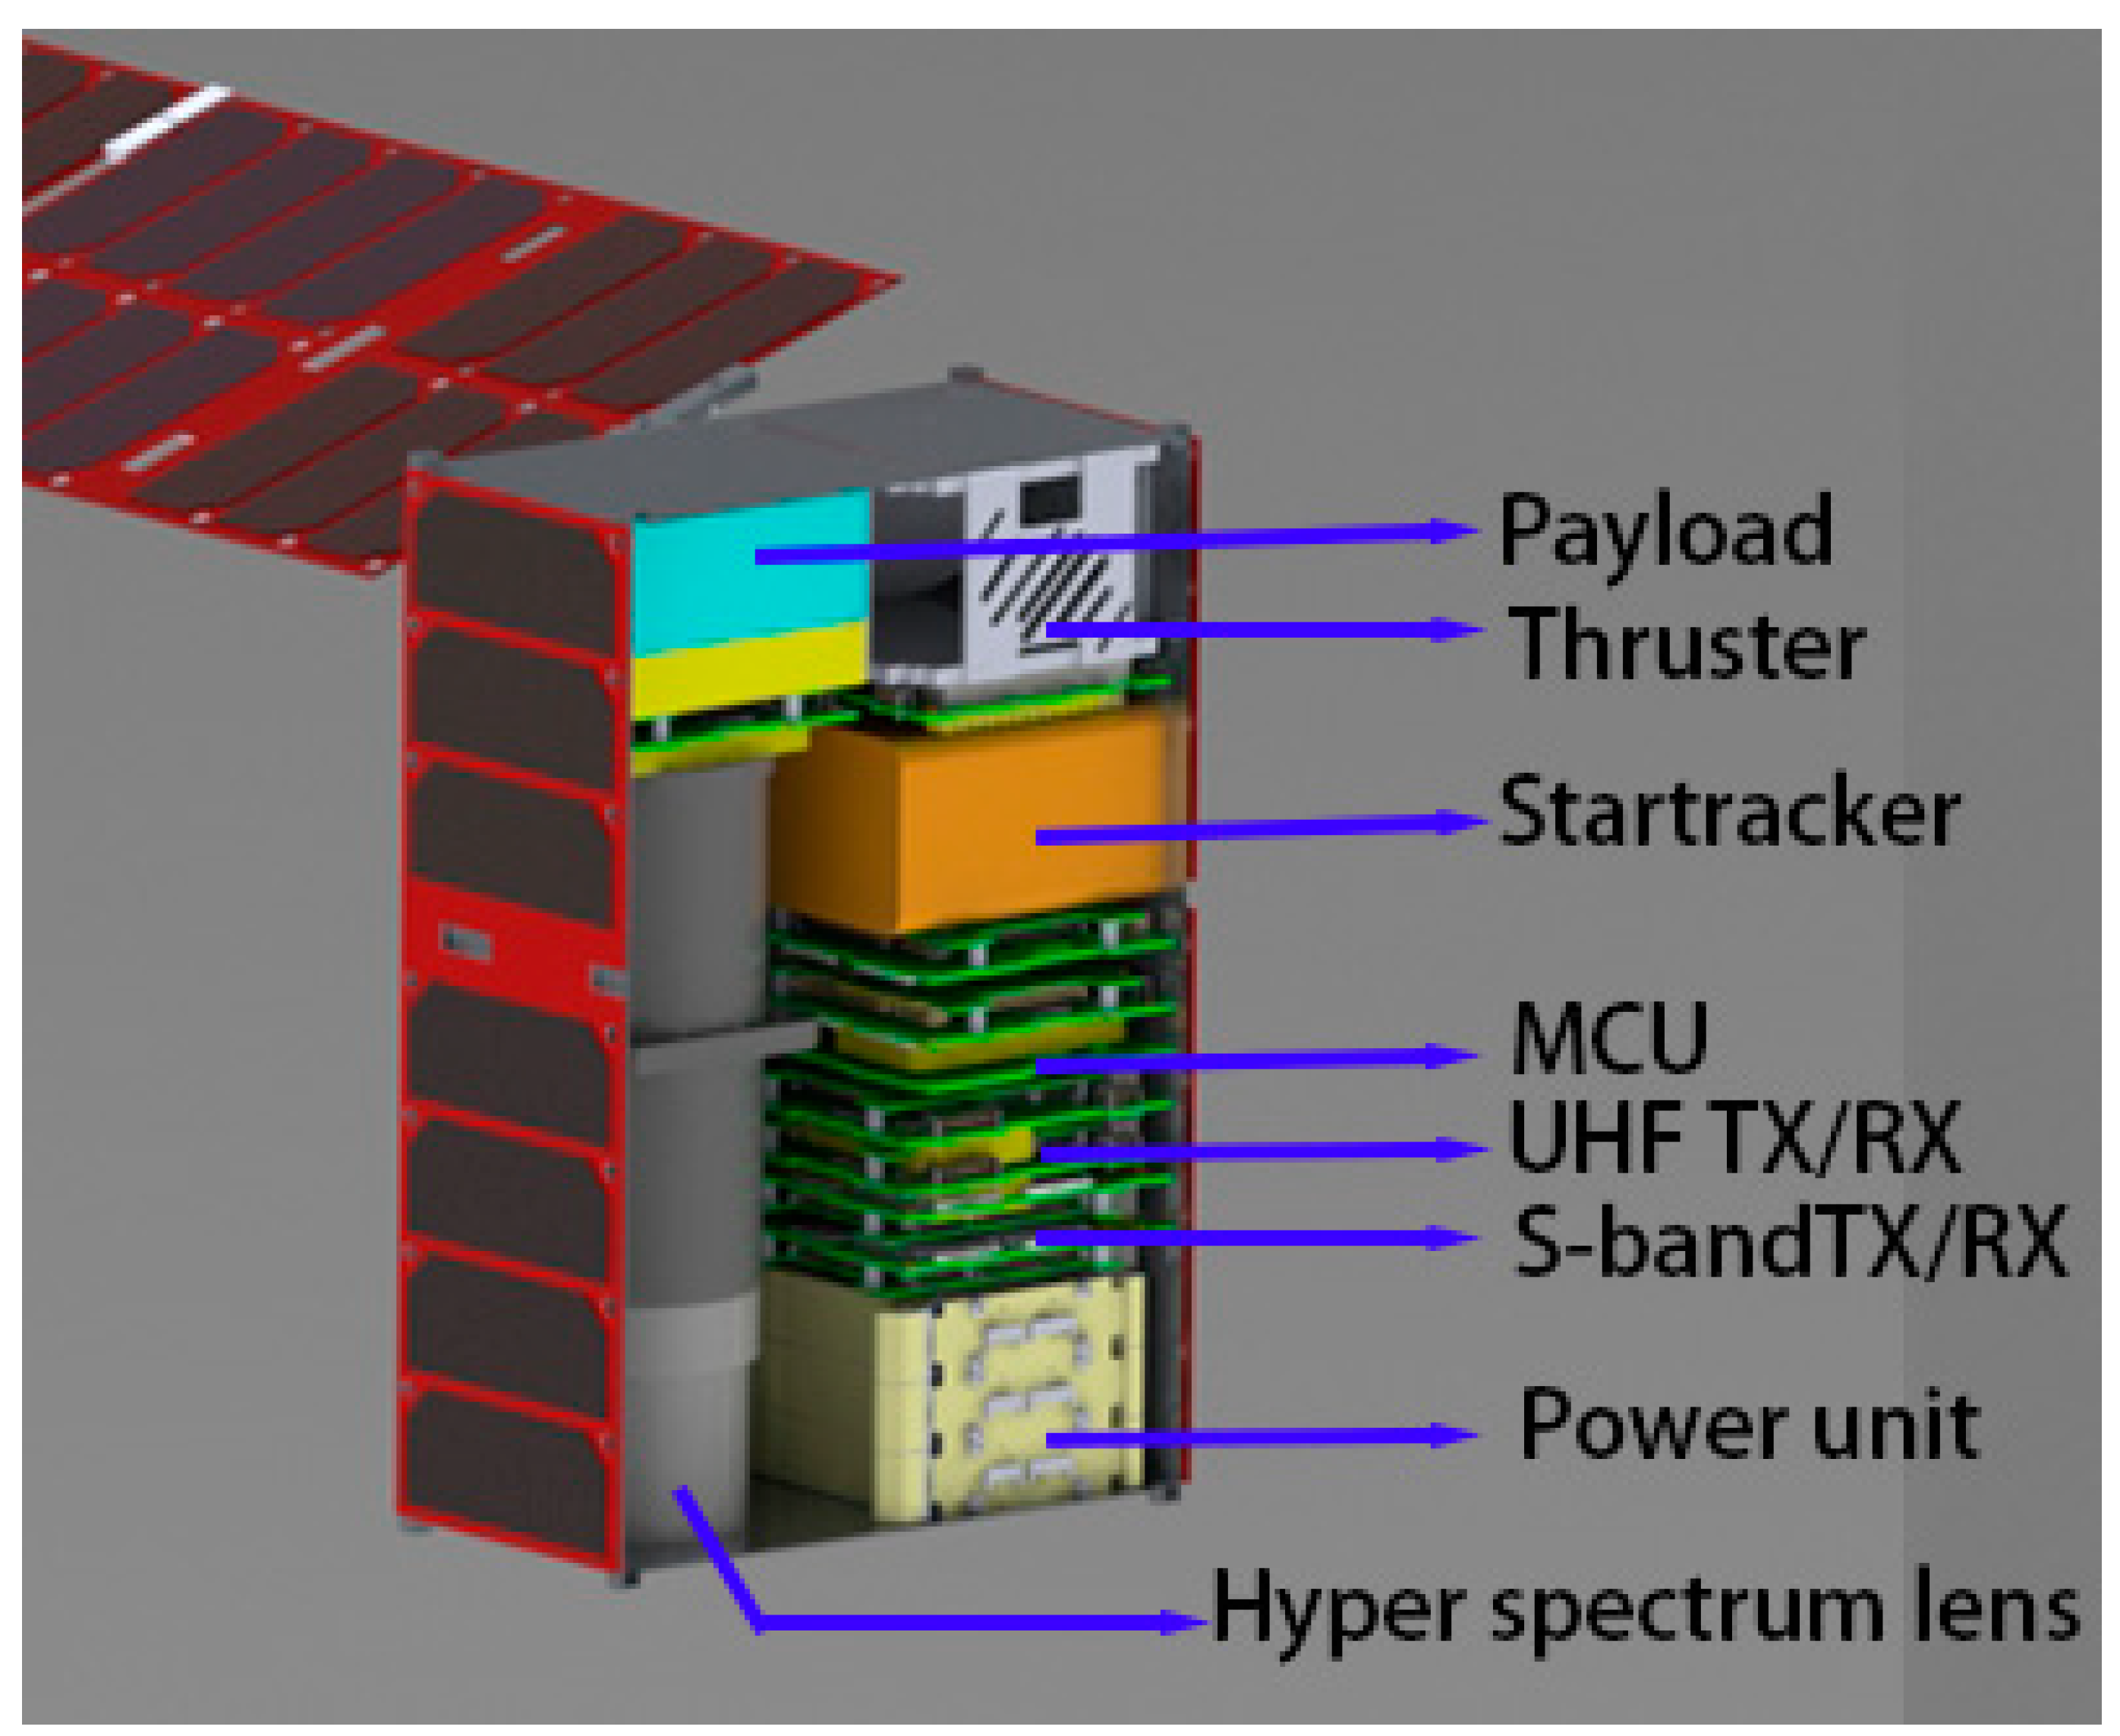
Hyperscape 100 spectrometer: HyperScape100 spectrometer is a cutting-edge technology in optical payload, offering a remarkable advancement in space-based remote sensing. This product allows for the selection of up to 32 bands within the visible to near-infrared (VNIR) range, with a bandwidth of approximately 3% of the central wavelength, and a ground sampling distance (GSD) of 4.75m at a 500km orbital height.
Table 13 provides a detailed overview of the specifications of the HyperScape100 payload.
Figure 36 shows Hyperscape 100 spectrometer 6U CubeSat platform.
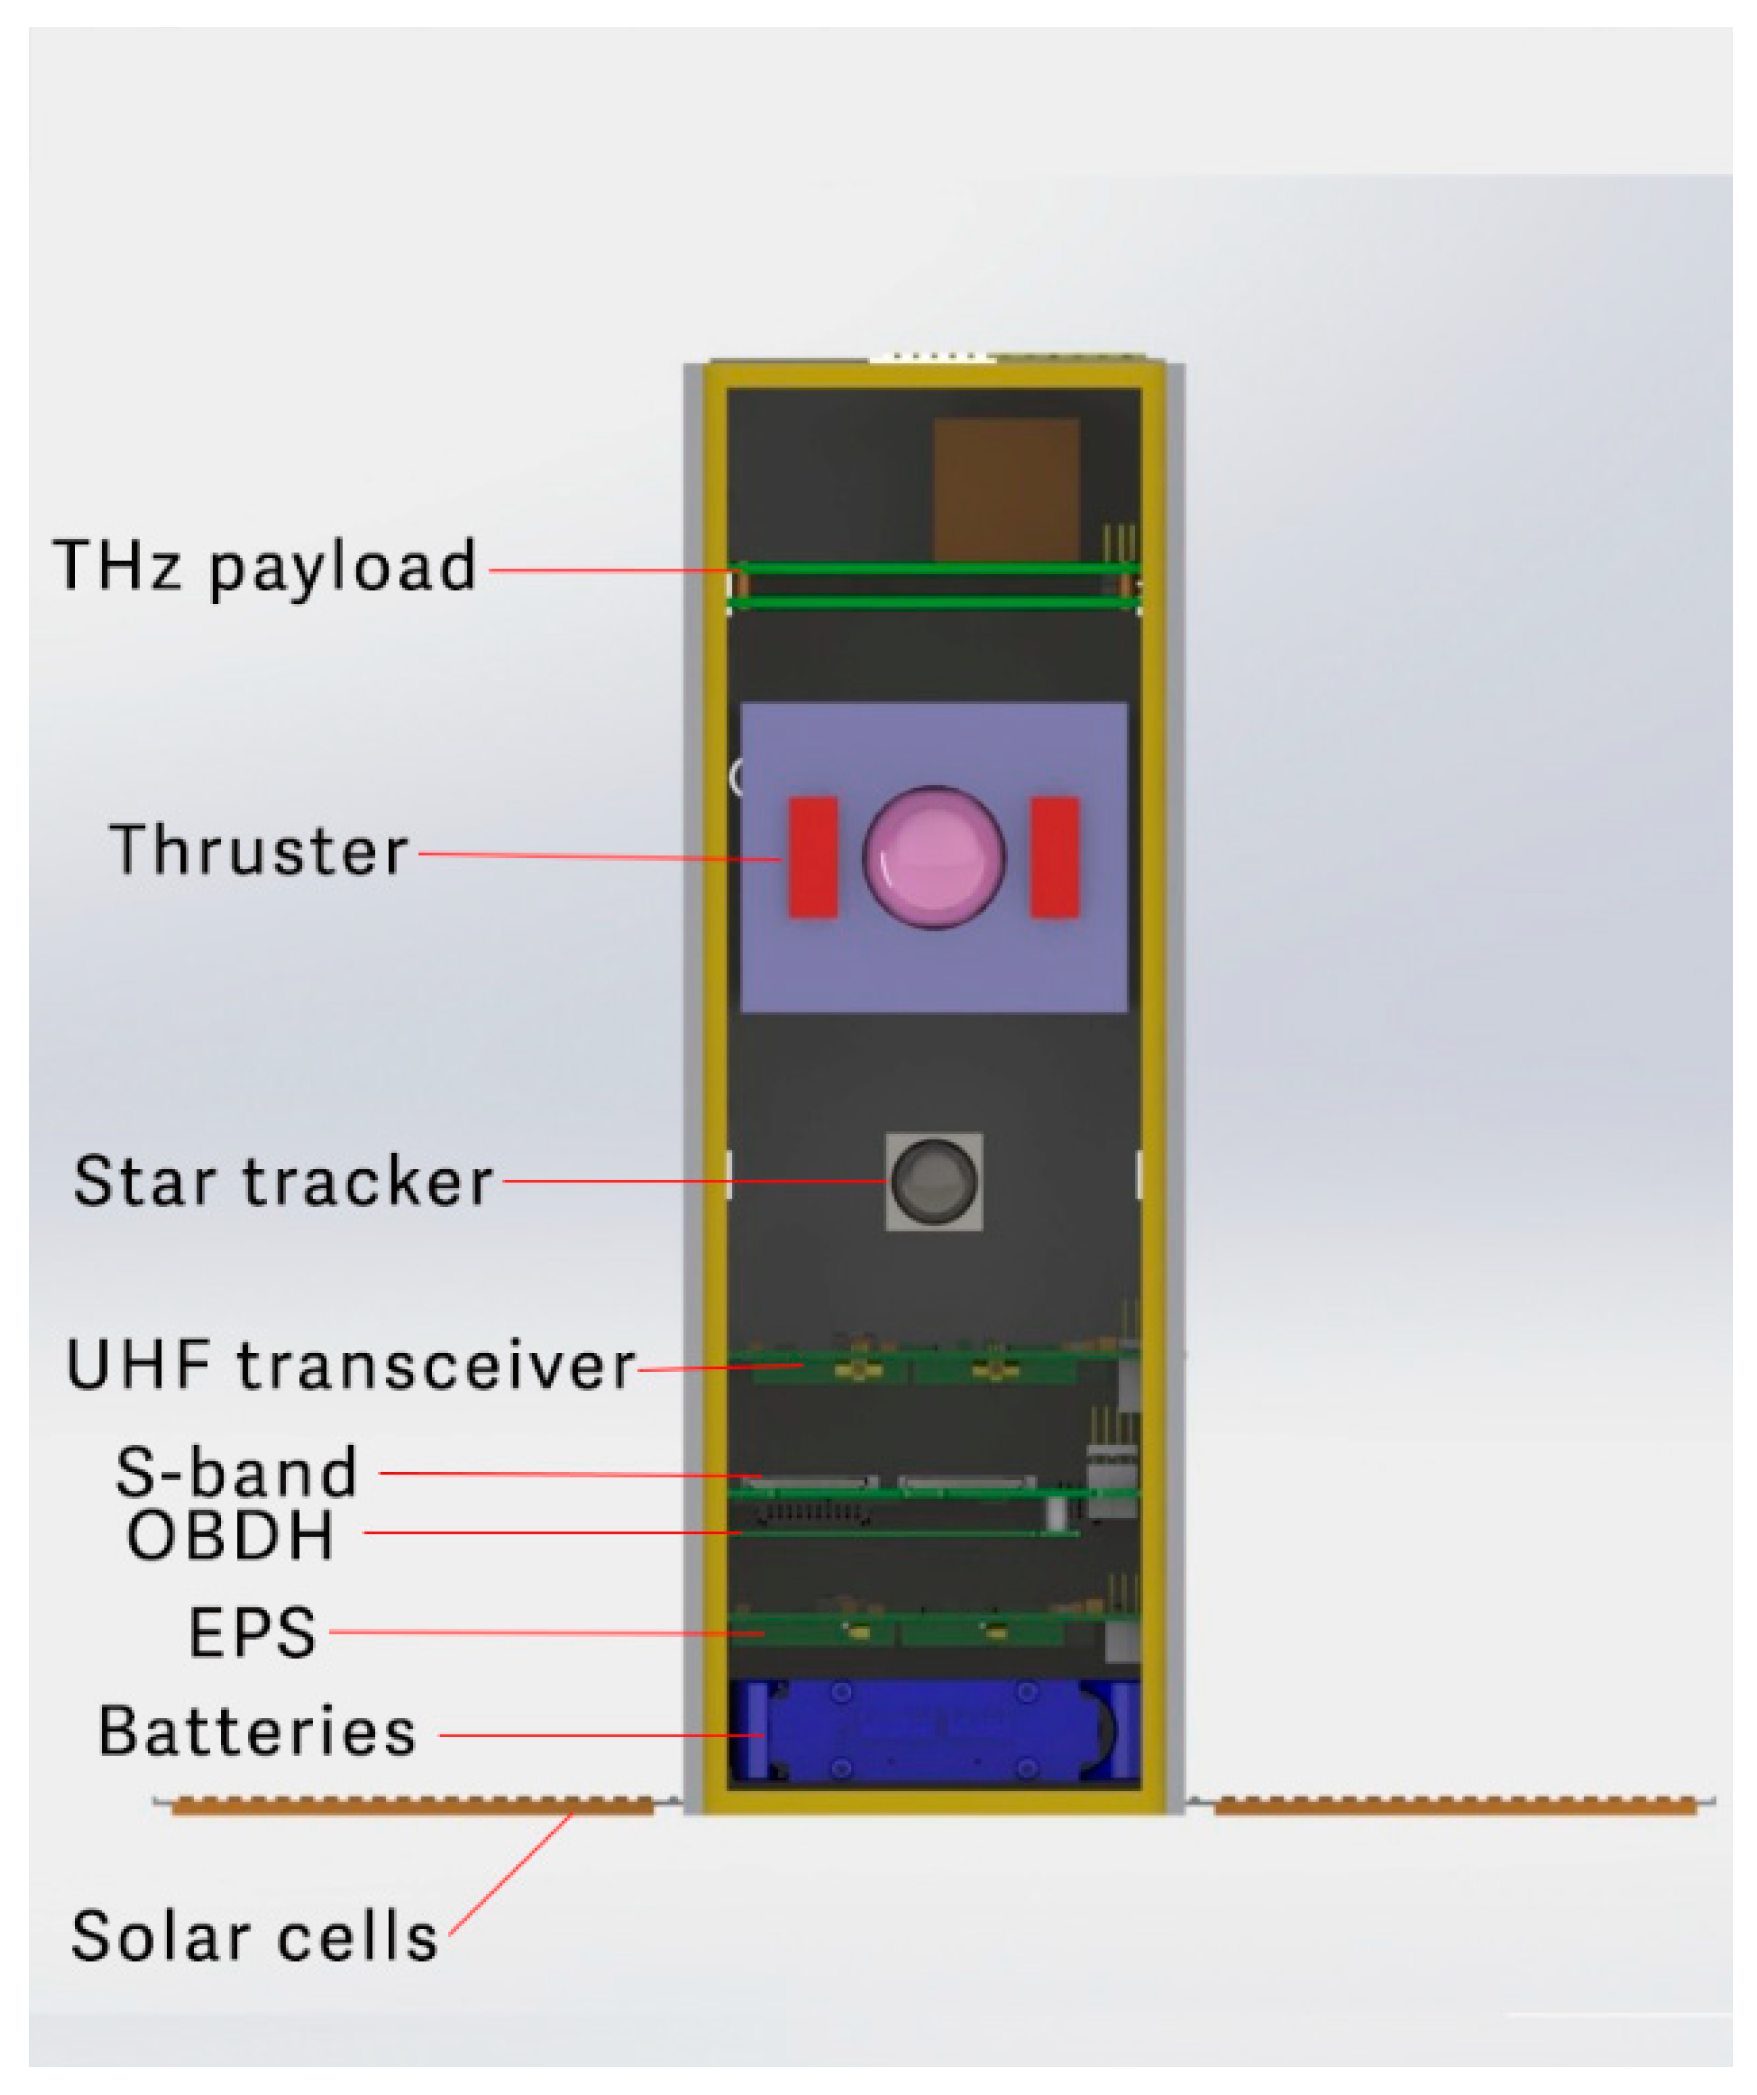
THz payload: We introduce a compact THz spectrometer comprised of three electronic boards, each measuring 10x10 cm. The system boasts a total power consumption of 3.7 W and a total mass of 1 kg. The payload is designed to be compatible with the standard CubeSat platform, enabling its operation on a CubeSat for the purpose of detecting water footprints on the surface of Mars. Within the 3U CubeSat configuration, the THz payload is housed. To maintain mass equilibrium of the Cargo Microsatellite, two 3U CubeSats equipped with THz payloads are employed.
Table 14 provides the mass budget details for the THz 3U CubeSat.
Figure 37 shows THz 3U CubeSat subsystem layouts and CAD model.
7. Conclusions
This paper offers a comprehensive analysis of five proposed satellite systems, meticulously addressing power budgets, mass budgets, and telecommunications considerations. The mission's diverse payload selection, comprising a 120 Kg Cargo satellite, specialized CubeSats for photography, imaging spectroscopy, wind speed measurement, and water detection, aims to provide a holistic investigation of Mars. While commercial solutions for imaging and wind measurement payloads exist, this study prioritizes the development of a water exploration payload. The corresponding simulations and expectations for the THz payload are discussed in detail. The overarching goal of the MeSat project revolves around conducting a comprehensive examination of Mars using a diverse array of payloads. Photography missions intend to enrich our visual comprehension of Mars, whereas the FTS and THz payloads aim to pinpoint potential habitable zones by scrutinizing environmental cues. Wind speed measurements will offer insights into storm-prone regions or areas suitable for wind-powered electricity generation. Furthermore, the water detection payload emphasizes the pivotal role of water as a life-sustaining resource. This mission stands poised to significantly expand our understanding of Mars, potentially identifying habitable zones as humanity eyes Mars as a secondary habitat. Each payload contributes unique data crucial to understanding the Martian environment. A demonstration showcases the effectiveness of a dual-step hybrid optimization algorithm, the PSO-Homotopy. This algorithm efficiently analyzes a fuel-optimized, low-thrust trajectory from Earth to Mars while considering the Ephemeris dynamics model, successfully solving the resulting multi-point boundary value problem (MPBVP) with impressive constraint satisfaction. This study also investigates the impact of hyperbolic excess velocity, various Earth launch and Mars rendezvous opportunities, and different types of Hall thrusters and Ion engines. Delivering a payload of 102.8 (kg) to Mars while consuming only 17.2 (kg) of fuel represents a highly efficient and optimized mission. This impressive payload-to-fuel ratio underscores the effectiveness of the trajectory design and propulsion system employed in the mission. Achieving such a high payload mass while minimizing fuel consumption indicates a significant advancement in mission planning and spacecraft propulsion technologies. It showcases the optimization of trajectory maneuvers, propulsion efficiency, and mission design to maximize payload delivery while minimizing the fuel requirement, ultimately enhancing the mission's overall feasibility and cost-effectiveness.
References
- The Guardian. Available on: https://www.theguardian.com/books/2018/oct/19/brief-answers-to-the-big-questions-stephen-hawking-review (19 oct 2018).
- NASA. Available on: https://www.nasa.gov/wp-content/uploads/2015/01/benefits-stemming-from-space-exploration-2013-tagged.pdf (September 2013).
- 3. Francesca, F.; Marta, V.P; Claudia, P. Advantages and Limitations of Current Microgravity Platforms for Space Biology Research. Applied science 2020, Volume 11. DOI: https://doi.org/10.3390/app11010068. [CrossRef]
- The Space Review. Available on: https://www.thespacereview.com/article/3193/1 (13 March 2017).
- Seth, D.B.; Jacob,D.H.; Shawn, D.D. Would contact with extraterrestrials benefit or harm humanity? A scenario analysis. Acta Astronautica 2011, Volume 68, pp. 2114-2129. https://doi.org/10.1016/j.actaastro.2010.10.012. [CrossRef]
- Sergey, K.; Vladimir, L. Human Life and Evolution in Biospheres on Earth and Outer Space: Problems and Prospects. Future Human Image 2021, Volume 15, pp.39-58.
- NASA. Available on: https://www.nasa.gov/image-article/nasas-journey-mars/#:~:text=NASA%20is%20developing%20the%20capabilities,Policy%2C%20also%20issued%20in%202010 (01 Dec 2014).
- Alred, J.W.; Siegfried, W.H. Maximization of benefits from the space exploration initiative. Acta Astronautica 1992, Volume 28, pp. 357-363. https://doi.org/10.1016/0094-5765(92)90039-L. [CrossRef]
- Bette, S.; Andy, S.; James, B.; Sarah,L.C.; Kevin, S.; Erin, M.; Julie, R. Development of a NASA roadmap for planetary protection to prepare for the first human missions to Mars. Life Sciences in Space Research 2023, Volume 38, pp. 1-7. https://doi.org/10.1016/j.lssr.2023.03.009. [CrossRef]
- Ritu, S.L. Public-private linkages and the case of asteroid mining. Technology Analysis & Strategic Management 2022. https://doi.org/10.1080/09537325.2022.2163887. [CrossRef]
- Matthew, J.H.; Kelly, S.F.; Emily, A.H.; Paul, G.B.; Tim, G.; Cassandra, M.Ch. Protecting the Planet or Destroying the Universe? Understanding Reactions to Space Mining. Sustainability 2022, Volume 14. https://doi.org/10.3390/su14074119. [CrossRef]
- Anna, C.S. Challenges and Opportunities for Bioactive Compound and Antibiotic Discovery in Deep Space. Journal of the Indian Institute of Science 2023, Volume 103, pp. 819-832.
- Harvard International Review. Available on: https://hir.harvard.edu/economics-of-the-stars/ (08 Apr 2022).
- Pavel, S. Asteroid Mining Tax as a Tool to Keep Peace in Outer Space. Space Policy 2023, Volume 65. https://doi.org/10.1016/j.spacepol.2023.101555. [CrossRef]
- Science In The News (SITN). Available on: https://sitn.hms.harvard.edu/flash/2019/water-beyond-earth-the-search-for-the-life-sustaining-liquid/ (26 Sep 2019).
- Astrobiology at NASA. Available on: https://astrobiology.nasa.gov/education/alp/water-so-important-for-life/#:~:text=It%20is%20abundant%20on%20Earth,the%20planet%20could%20support%20life ( 01 Dec 2023).
- Althaf, H.B.; Danish, K. Utilisation of Space Robotics in Making Plans in the Works to Overcome Huge Challenges and Send Humans to Mars By NASA. TECHNOARETE TRANSACTIONS ON INDUSTRIAL ROBOTICS AND AUTOMATION SYSTEMS (TTIRAS) 2022, Volume 2.
- Xiao, Sh.Y.; Rakhyun, E.K. Twards earth-space governance in a multi-planetary era. Earth System Governance 2023, Volume 16. https://doi.org/10.1016/j.esg.2023.100173. [CrossRef]
- NASA Mars Science. Available on: https://mars.nasa.gov/technology/helicopter/ (30 July 2020).
- Favaloro, N.; Saccone, G.; Piscitelli, F.; olponi, R.; Leoncini, P.; Catalano, P.; Visingardi, A.; Noviello, M.C. Enabling Technologies for Space Exploration Missions: The CIRA-TEDS Program Roadmap Perspectives. Aerotecnica Missili & Spazio 2023, Volume 102.
- Xianfeng, L.; Weiming, X.; Hai, Q.; Xin, R.; Jianjun,L.; Luning, L.; Zhixin, Y.; Chonfei, L.; Jun, Ch.; Zhenqiang, Zh.; Chunlai, L.; Rong, Sh. Development and Testing of the MarSCoDe LIBS Calibration Target in China’s Tianwen-1 Mars Mission. Space Science Reviews 2023, Volume 219.
- Richard, B. Emirates Mars Mission takes first high-resolution images of Martian moon Deimos. Physics World 2023, Volume 36. 10.1088/2058-7058/36/06/14.
- NASA. Available on: https://www.nasa.gov/directorates/stmd/6-technologies-nasa-is-advancing-to-send-humans-to-mars/ (17 Jul 2020).
- Saghamanesh, M.; Novinzadeh, A. Optimal guidance of spacecraft rendezvous via free initial velocity vector. Proceedings of the Institution of Mechanical Engineers. Journal of Aerospace Engineering 2014, Volume 228.
- Saghamanesh, M.; Baoyin, H. A robust homotopic approach for continuous variable low-thrust trajectory optimization. Advances in Space Research 2018, Volume 62, pp. 3095-3113.
- Saghamanesh, M.; Baoyin, H. Practical Mission Design for Mars Trajectory Optimization Based on the Ephemeris Model and Full Perturbation System. Advances in the Astronautical Sciences 2018, Volume 165, pp.2393-1313.
- Saghamanesh, M.; Taheri, E.; Baoyin, H. Systematic Low-Thrust Trajectory Design to Mars Based on a Full Ephemeris Modelling. Advances in Space Research 2019, Volume 64, pp.2356-2378.
- Saghamanesh, M.; Taheri, E.; Baoyin, H. Interplanetary Gravity-Assist Fuel-Optimal Trajectory Optimization with Planetary and Solar Radiation Pressure Perturbations. Celestial Mechanics and Dynamical Astronomy 2019, Volume 132, pp.1-21.
- Saghamanesh, M.; Baoyin, H. Optimal Gravity-Assist Low-Thrust Trajectory Using a Robust Homotopic Approach. IEEE/CSAA Guidance, Navigation and Control 2018.
- George, R.; Srivastava, A. K.; Naidu, P.; Reddy, K. R.; Rao, K. M. M. THz radiometry and imaging - A review. Infrared Phys. Technol 2018, Volume 87, pp.46-64.
- Sutar, S. S.; Mane, S. R.; Kasar, S. S. Design and Simulation of 557 GHz THz Radiometer for Space Applications. Procedia Computer Science 2015, Volume 70, pp.34-39.
- Knight, S.; Rabideau, G.; Chien, S.; Engelhardt, B.; Sherwood, R. Casper: Space exploration through continuous planning. IEEE Intell. Syst 2001, Volume 16.
- Stefano,C.A Single-Launch Deployment Strategy for Lunar Constellations. Applied science 2023, Volume 13.
- Stefano, S.; Angelo, C.; Alessandra, M.; Erdem, T.; Eric, B.; Bastiaan, B.; Francesco, T. Designing the Radio Link for a Lunar CubeSat: the LUMIO Case. 72th International Astronautical Congress (IAC), Dubai, United Arab Emirates, 25-29 October 2021.
- Terzoli, S.; Abreu, R.; Costa, J.; Rodrigues, H. CubeSat Deep-Space Communication: Link Budget and Modulation Analysis. Sensors 2021, Volume 21. 10.3390/s21144759.
- Vahid, R.; Weidong, H.; Mohammad, K.T,. Water Recognition on the Moon by Using THz Heterodyne-Spectrometer for Identifying the Appropriate Locations to Extract Water for Providing Oxygen for Breathing and Fuel for Spaceships’ Propulsion on the Moon with CubeSat. Aerospace 2021, Volume 8. https://doi.org/10.3390/aerospace8070186. [CrossRef]
- Nicolas, B.; Alain, L.; Therese, E.; Emmanuel, L.; Urban, F.; Ake, H.; Michel, Olberg, Michael, O.; Aage, S. Wide-band observations of the 557 GHz water line in Mars with Odin. Astronomy and Astrophysics - A&A 2005, Volume 435, pp.765-772. ff10.1051/0004-6361:20042247ff.
- Eliza, S.; Glenn, Z. The Coming the Moon rush: Technology, billionaires, and Geopolitics will all help get us back to the Moon, but they will not be enough to let us live there indefinitely. IEEE Spectrum 2019, Volume 56, pp. 22-25.
- Yanghyo, K.; Senior, M.; Yan, Z.; Theodore, J.R.; Senior, M.; Deacon, J.N.; Goutam, C. A 183-GHz InP/CMOS-Hybrid Heterodyne-Spectrometer for Spaceborne Atmospheric Remote Sensing. IEEE Transactions on Terahertz Science and Technology 2019, Volume 9, pp.313-334.
- De Graauw, T., Helmich, F.P.; Phillips, T.G.; Stutzki, J.; Caux, E.; Whyborn, N.D.; Dieleman, P.; Roelfsema, P.R.; Aarts, H.; Assendorp, R.; et al. The Herschel-heterodyne instrument for the far-infrared. Astronomy & Astrophysics 2010, Volume 518.
- Mark, B. Mission Design for the Lunar Reconnaissance Orbiter. In Proceedings of the 29th Annual Aas Guidance and Control Conference, Breckenridge, CO,USA, 4–8 February 2006.
- Weng, C.; Liu, L.; Gao, T.; Hu, S.; Li, S.; Dou, F.; Shang, J. Multi-Channel Regression Inversion Method for Passive Remote Sensing of Ice Water Path in the Terahertz Band. Atmosphere 2019, Volume 10.
- Bradley, R.J.Subharmonic Mixer in CMOS Microwave Integrated Circuit. Ph.D. thesis, March 2009.
- Kim, Y.; Reck, T. J.; Nemchick, D. J.; Chattopadhyay, G.; Drouin, B. A 183-GHz Inp/CMOS-Hybrid Heterodyne-Spectrometer for Spaceborne Atmospheric Remote Sensing. IEEE Transactions on Terahertz Science and Technology 2019, Volume 9.
- Zhang, B.; Lv, X.; He, J.; Xing, D.; Fan, Y.; Xiaodong. 1.1 THz tenth harmonic mixer based on planar GaAs Schottky diode. Workshop on Millimeter-Waves and Terahertz Technologies, 2019.
- Yang, Y.; Zhang, B.; Zhao, X.; Fan, Y.; Xiaodong. 220GHz wideband integrated receiver front end based on planar Schottky diodes. Microwave and Optical Technology Letters 2019, Volume 62.
- Zhang, B.; Zhang, Y.; Pan, L.; Li, Y.; Cui, J.; Xu, R.; Yan, B. A 560 GHz Sub-harmonic Mixer Using Half-Global Design Method. Electronic 2021, Volume 10.
- Anderberg, M.; Sobis, P.; Drakinskiy, V.; Schleeh, J.; Dejanovic, S.; Emrich, A.; Stake, J. A 183-GHz Schottky Diode Receiver With 4dB Noise Figure. IEEE MTT-S International Microwave Symposium Digest 2019.
- Anderberg, M. Design of a 183-GHz Subharmonic Mixer using Membrane Integrated GaAs Schottky Diode Technology. Ph.D. thesis, 2018.
- Maestrini, A.; Tripon-Canseliet, C. A 540-640-GHz High-Efficiency Four-Anode Frequency Tripler. IEEE Transactions on Microwave Theory and Techniques 2019, Volume 53.
- Vahid, R.N.; Weidong, H.; Waseem, Sh., Muzahir, A. CubeSat-Based Observations of Lunar Ice Water Using a 183 GHz Horn Antenna: Design and Optimization. Applied Science 2023, Volume 13. https://doi.org/10.3390/app13169364. [CrossRef]
- Chengkai, W.; Yong, Zhang.; Yuehang, Xu.; Yan, B.; Ruimin, X. Dual Lumped Ports Technique and Its Applications in Modeling of Planar Schottky Diode in THz Band. IEEE Access 2020, Volume 9.
- Yang, Y.; Zhang, B.; Zhao, X.; Fan, Y.X.220GHz wideband integrated receiver front end based on planar Schottky diodes. Microwave and Optical Technology Letters 2019, Volume 62.
- Jian, G.; Haifeng, Ch.; Jie, X.; Cheng, Q. Design of a full W-band detector based on Schottky diode with quartez substrate. IET Microwave & propagation 2019, Volume 13, pp.936-941.
- Lin, P.; Fang, X.; Zhang, L. Design and Optimization of Half-Waveguide Transitions for Millimeter-Wave Applications. IEEE Transactions on Components, Packaging and Manufacturing Technology 2019,Volume 9, pp.2209-2216. 10.1109/TCPMT.2019.2933151.
- Guangyu, J.; Dehai, Zh.; Jin, M.; Siyu, L.; Changfei, Y. Design and Measurement of a 0.67 THz Biased Sub-Harmonic Mixer. Electronic 2020, Volume 9.
- Yang, L.; Bo, Zh.; Yinian, F.; Xiaolin, L.; Dongfeng, J.; Zhongqian, N.; Yilin, Y.; Xiangyang, Zh.; Yong, F, Development of 340-GHz Transceiver Front end based on GaAs Monolithic Integration Technology for THz Active Imaging Array. Applied Science 2020,Volume 10.
- Bertrand, T.; Alain, M.; John, W.; Erich, S.; Goutam, Ch.; John, G.; Choonsup, L.; Robert, L.; Imran, M. Terahertz cooled sub-harmonic schottky mixer for planetary atmospheres. 5th ESA Workshop on Millimeter Wave Technology and Application & 31st ESA antenna Workshop, September 2019.
- Jose, M.; Perez, E.; Carlos, Q.; Ramon, G.; Inigo, E. Design of 300 GHz combined doubler/subharmonic mixer based on schottky diodes with integrated MMIC based local oscillator. Electronic 2020, Volume 9.
Figure 1.
MeSat’s scenario (1) The Microsatellite finds path from Earth ‘s orbit to Mars (2) When the Microsatellite reaches Mars orbit, it will deploy three 6U and two 3U CubeSats.
Figure 1.
MeSat’s scenario (1) The Microsatellite finds path from Earth ‘s orbit to Mars (2) When the Microsatellite reaches Mars orbit, it will deploy three 6U and two 3U CubeSats.
Figure 2.
MeSat operational outlook in orbit of Mars.
Figure 2.
MeSat operational outlook in orbit of Mars.
Figure 3.
CubeSat modes descript.
Figure 3.
CubeSat modes descript.
Figure 4.
183GHz spectrometer payload block diagram.
Figure 4.
183GHz spectrometer payload block diagram.
Figure 5.
Local Oscillator block diagram.
Figure 5.
Local Oscillator block diagram.
Figure 6.
Smooth-walled horn antenna [
51].
Figure 6.
Smooth-walled horn antenna [
51].
Figure 7.
Anti-parallel Schottky diode to down-convert Water signals.
Figure 7.
Anti-parallel Schottky diode to down-convert Water signals.
Figure 8.
illustrates the intricacies of the ADS design for the Sub-harmonic Schottky Diode Mixer. It comprises several key elements, including the RF waveguide signal entry (1), an impedance matching circuit (2), the anti-parallel Schottky diode mixer (3), another impedance matching module (4), hammer head Low Pass Filter (LPF) (5) that serves to prevent any leakage of RF signals, LPF, and waveguide impedance matching (6), the entry of LO signals through a WR10 waveguide (7), the transition from WR10 TE10 mode to microstrip Quasi-TEM mode for LO signal input (8), an Intermediate Frequency (IF) step line LPF circuit (9), impedance matching facilitated by a 150 Ohm resistor (10), and the integration of an SMA connector (11) .
Figure 9.
Mixer Circuit Design Components: 1) WR5 RF Waveguide 2) Anti-parallel Schottky Diode 3) Impedance Matching Circuit 4) Hammer Head LPF 5) WR10 LO Waveguide 6) Step Line LPF 7) 150 Ohm Impedance Matching.
Figure 9.
Mixer Circuit Design Components: 1) WR5 RF Waveguide 2) Anti-parallel Schottky Diode 3) Impedance Matching Circuit 4) Hammer Head LPF 5) WR10 LO Waveguide 6) Step Line LPF 7) 150 Ohm Impedance Matching.
Figure 10.
Optimizing Mixer Performance: Conversion Losses Across Varying LO Signal Power Levels.
Figure 10.
Optimizing Mixer Performance: Conversion Losses Across Varying LO Signal Power Levels.
Figure 11.
Three anodes Schottky diode to operate at Tripler.
Figure 11.
Three anodes Schottky diode to operate at Tripler.
Figure 12.
Local Oscillator systematic block diagram.
Figure 12.
Local Oscillator systematic block diagram.
Figure 13.
Tripler general block diagram.
Figure 13.
Tripler general block diagram.
Figure 14.
Tripler ADS circuit design 1) WR18 waveguide entry frequencies range of 30.446GHz to 30.5GHz 2) Impedance matching circuit 3) hammer head LPF 4) Three Anode Schottky diode 5) Impedance matching circuit 6) WR10 waveguide output frequencies range of 91.32GHz-91.5GHz.
Figure 14.
Tripler ADS circuit design 1) WR18 waveguide entry frequencies range of 30.446GHz to 30.5GHz 2) Impedance matching circuit 3) hammer head LPF 4) Three Anode Schottky diode 5) Impedance matching circuit 6) WR10 waveguide output frequencies range of 91.32GHz-91.5GHz.
Figure 15.
Tripler output power vs Vbias voltage with fixed entry frequency of 30.5 GHz and 18.5dBm input power.
Figure 15.
Tripler output power vs Vbias voltage with fixed entry frequency of 30.5 GHz and 18.5dBm input power.
Figure 16.
Tripler CAD model on HFSS 1) WR28 entry waveguide 2) Impedance matching Circuit 3) hammer head LPF 4) Three anode Schottky diode 5) impedance matching circuit 6) WR10 Tripler frequency output 7) DC bias voltage connector 8) WR28 entry half-height waveguide 9) WR10 output frequency waveguide.
Figure 17.
DIY spectrometer total block diagram.
Figure 17.
DIY spectrometer total block diagram.
Figure 18.
DIY spectrometer and DIY signal generator (ADF4351 and MCU) breadboarding test and their total power consumption.
Figure 18.
DIY spectrometer and DIY signal generator (ADF4351 and MCU) breadboarding test and their total power consumption.
Figure 19.
DIY spectrum meter detailed explanation.
Figure 19.
DIY spectrum meter detailed explanation.
Figure 20.
DIY spectrum meter primary engineering model.
Figure 20.
DIY spectrum meter primary engineering model.
Figure 21.
Block Diagram of the Terahertz (THz) Spectrometer (should be replaced later).
Figure 21.
Block Diagram of the Terahertz (THz) Spectrometer (should be replaced later).
Figure 22.
Terahertz Payload Schematic: 1) Smooth-Walled Horn Antenna 2) Mixer and Tripler Circuits Encased in Systematic Aluminum Housings 3) Local Oscillator Circuit 4) Spectrometer Controlled by STM.
Figure 22.
Terahertz Payload Schematic: 1) Smooth-Walled Horn Antenna 2) Mixer and Tripler Circuits Encased in Systematic Aluminum Housings 3) Local Oscillator Circuit 4) Spectrometer Controlled by STM.
Figure 23.
This is a figure. Schemes follow the same formatting.
Figure 23.
This is a figure. Schemes follow the same formatting.
Figure 24.
Configuration of Solar panels.
Figure 24.
Configuration of Solar panels.
Figure 25.
Configuration of Solar panels.
Figure 25.
Configuration of Solar panels.
Figure 26.
Time history of magnitude of perturbations.
Figure 26.
Time history of magnitude of perturbations.
Figure 27.
Comparison of energy- and fuel-optimal thrust profiles.
Figure 27.
Comparison of energy- and fuel-optimal thrust profiles.
Figure 28.
2D fuel-optimal trajectory.
Figure 28.
2D fuel-optimal trajectory.
Figure 29.
3D fuel-optimal trajectory.
Figure 29.
3D fuel-optimal trajectory.
Figure 30.
Comparison of Fuel-Optimal Co-state Vectors.
Figure 30.
Comparison of Fuel-Optimal Co-state Vectors.
Figure 31.
Comparison of optimal masses for energy- and fuel-optimal profiles.
Figure 31.
Comparison of optimal masses for energy- and fuel-optimal profiles.
Figure 32.
Comparison of energy-optimal trajectory to fuel-optimal trajectory.
Figure 32.
Comparison of energy-optimal trajectory to fuel-optimal trajectory.
Figure 33.
The Cargo Microsatellite specifications.
Figure 33.
The Cargo Microsatellite specifications.
Figure 34.
FTS CubeSat subsystem description.
Figure 34.
FTS CubeSat subsystem description.
Figure 35.
High quality camera subsystems layout.
Figure 35.
High quality camera subsystems layout.
Figure 36.
Hyperscape 100 spectrometer 6U CubeSat layouts.
Figure 36.
Hyperscape 100 spectrometer 6U CubeSat layouts.
Figure 37.
THz 3U CubeSat subsystems layout.
Figure 37.
THz 3U CubeSat subsystems layout.
Table 1.
CubeSat power budget estimation in orbit of Mars.
Table 1.
CubeSat power budget estimation in orbit of Mars.
| Mode |
Active subsystems |
Power usage
(W) |
| |
FTS 6U CubeSat |
|
| Recovery |
MCU, EPS, Star tracker, thruster |
21.6 |
| Normal |
MCU, EPS, TTC RX |
1.140 |
| ADCS |
MCU, Thruster, Star tracker, EPS, Reaction wheels |
29.6 |
| Payload |
FTS, MCU, EPS, Reaction wheels, star tracker |
29 |
| Com |
MCU, EPS, TX |
6 |
| Critical |
MCU(LOW power),EPS |
0.5 |
| safe |
MCU, EPS |
0.9 |
| Peak power usage |
|
29.6 |
| Margin |
|
18.4 |
| |
High quality camera 6U CubeSat |
|
| Recovery |
MCU, EPS, Star tracker, thruster |
21.6 |
| Normal |
MCU, EPS, TTC RX |
1.140 |
| ADCS |
MCU, Thruster, Star tracker, EPS, Reaction wheels |
29.6 |
| Payload |
Camera, MCU, EPS, Reaction wheels, star tracker |
18.5 |
| Com |
MCU, EPS, TX |
6 |
| Critical |
MCU(LOW power),EPS |
0.5 |
| safe |
MCU, EPS |
0.9 |
| Peak power usage |
|
29.6 |
| Margin |
|
18.4 |
| |
Hyperscape 100 spectrometer 6U CubeSat |
|
| Recovery |
MCU, EPS, Star tracker, thruster |
21.6 |
| Normal |
MCU, EPS,TTC RX |
1.140 |
| ADCS |
MCU, Thruster, Star tracker, EPS, Reaction wheels |
29.6 |
| Payload |
Spectrumeter, MCU, EPS, Reaction wheels, star tracker |
14.8 |
| Com |
MCU, EPS, TX |
6 |
| Critical |
MCU(LOW power),EPS |
0.5 |
| safe |
MCU, EPS |
0.9 |
| Peak power usage |
|
29.6 |
| Margin |
|
18.4 |
| |
3U THz CubeSat |
|
| safe |
OBDH, ADCS, MCU, ADCS sensors |
1.616 |
| Recovery |
OBDH, ADCS, MCU, ADCS sensors, Thruster |
2 |
| Normal |
OBDH, ADCS, MCU, ADCS sensors, UHF RX/TX |
2.16 |
| Communication |
OBDH, ADCS, MCU, ADCS sensors, S-band, Thruster |
2.276 |
| Payload |
OBDH, ADCS, MCU, ADCS sensors, THz |
5 |
| Peak power usage |
|
5 |
| Margin |
|
3 |
Table 2.
Mothership to DSN link budget calculation.
Table 2.
Mothership to DSN link budget calculation.
| Future |
Quantity |
| Total transmitter power |
38.45dBm |
| Transmitter circuit losses |
-0.25 dB |
| MarVen antenna Gain |
29.2 dBi |
| Antenna pointing loss |
-0.1dB |
| EIRP |
67.3 dBm |
| Path loss (Mars to Earth) |
-279.33dB |
| Atmospheric attenuation |
-0.14dB |
| DSN Parameter |
|
| Polarization losses |
-0.3dB |
| Antenna pointing loss |
-0.3dB |
| DSN (DSS 14) antenna gain |
74.28dB |
| DSN circuit loss |
-1.79 |
| SNT (System Noise Temperature) |
18.39 K |
| SNT due to elevation |
5.023K |
| SNT due to atmospheric |
8.6K |
| SNT due to sun |
0.00K |
| SNT due to hot body |
0.00K |
| Total system noise temperature |
32.01K |
| Noise Spectral density |
-183.55 dBm/Hz |
|
43.19 dB-Hz |
|
38.3 dB-Hz |
| Margin |
4.89 |
Table 3.
Solar Panel “A” Electrical Parameters BOL and EOL at 28 deg C.
Table 3.
Solar Panel “A” Electrical Parameters BOL and EOL at 28 deg C.
| Parameter |
BOL |
EOL |
|
|
| Fluence @ 1MeV [e/sq cm] |
0 |
2,50E+14 |
5,00E+14 |
1,00E+15 |
| Estimated Pmp |
1,00 |
0,97 |
0,94 |
0,90 |
| Voc [V] |
18,83 |
18,24 |
17,88 |
17,58 |
| Isc [A] |
0,52 |
0,52 |
0,51 |
0,50 |
| Vmp [V] |
16,86 |
16,40 |
16,02 |
15,71 |
| Imp [A] |
0,5 |
0,502 |
0,499 |
0,485 |
| Pmp [W] |
8,48 |
8,23 |
7,99 |
7,62 |
Table 4.
Solar panel power estimation.
Table 4.
Solar panel power estimation.
| Solar panel type |
Estimation of power (W) |
| Solar panel A |
3.6 |
| Solar panel BR |
7.4 |
| Total solar panels |
48 |
Table 5.
Solar panel power estimation.
Table 5.
Solar panel power estimation.
| Solar panel type |
Estimation of power (W) |
| Solar panel A |
3.6 |
| Solar panel AR/AL |
3.6 |
| Total solar panels |
10.8 |
Table 8.
Cargo Microsatellite mass budget.
Table 8.
Cargo Microsatellite mass budget.
| Subsystem |
Quantity |
Mass (gr) |
| |
TTC |
|
| X-band |
1 |
3000 |
| UHF-band |
1 |
75 |
| |
OBDH |
|
| MCU 1Aeroflex GR712 ADCS |
1 |
94 |
| MCU 2 |
1 |
196 |
| |
Payload |
|
| THz heterodyne-spectrometer |
1 |
1000 |
| Camera |
1 |
250 |
| 6U CubeSat |
3 |
FTS=6064
Spectrometer=6664
Camera=6664 |
| 3U CubeSat |
2 |
THz=2x2761 |
| P-PODs |
3x6U
2x3U |
3x12000 |
| |
EPS |
|
| 6U solar cells |
8 |
8x300 |
| Batteries and Hardware |
1 |
722 |
| |
ADCS |
|
| Reaction wheels, IMU sensors |
1 |
6000 |
| DARE T6 Ion Thruster |
1 |
7000 |
| Fuel back capacity |
|
17000 |
| Reserved fuel for pioneering missions |
|
7000 |
| |
STR & TCS |
|
| Structure |
|
10000 |
| Thermal control |
|
4350 |
| total |
|
120000 |
Table 9.
FTS payload specification.
Table 9.
FTS payload specification.
| Characteristics |
Value |
| mass |
5Kg |
| Power |
20W(peak) |
| Volume |
22.6x10x17cm |
| Scanning |
±26º Uni-directional cross track |
| Pointing |
Nadir |
| Thermal |
Deployable Earth Shield |
Table 10.
FTS mass budget and subsystem power consumption .
Table 10.
FTS mass budget and subsystem power consumption .
| subsystems |
Mass (gr) |
Size |
Power usage (mW) |
| MCU (ARM based) |
94 |
9.8x9.8x1 |
400 |
| UHF TX/RX |
100 |
9.8x9.8x1 |
TX>>5100
RX>>240 |
| Antenna |
150 |
|
|
| Star Tracker |
50 |
3x3x5 |
100 |
| Battery and hardware |
250 |
8.9x9.5x7 |
500 |
| Solar cells |
6x300
2x150 |
6U
3U |
|
| Thruster |
500 |
6.4x9x9 |
21000 |
| FTS |
1000 |
22.6x10x17 |
20000 |
| Reaction Wheels |
520 |
1U |
8000 |
| Structure |
1100 |
6U |
0 |
| MLI |
200 |
6U |
0 |
| total |
6064 |
|
|
Table 11.
High-quality camera specification.
Table 11.
High-quality camera specification.
| Parameters |
Value |
| Spatial resolution (GSD) at 500 km |
PAN 10 m; MS 20 m |
| Swath at 500 km |
40 km |
| Mass (Including electronics) |
1.6 kg |
| Spectral bands |
7 × MS |
| Satellite Bus Size |
Compatible with 3U or 6U |
| Physical Size |
2U (10 cm × 10 cm × 20 cm excl. electronics)
(10 cm × 10 cm × 21.5 cm with rear-mounted CU) |
| Data interface |
LVDS, SPI, I2C, CAN, RS422 |
| Power Usage |
imaging mode: < 10 W; readout mode: < 5 W |
Table 12.
Shows the high-quality camera CubeSat mass budget.
Table 12.
Shows the high-quality camera CubeSat mass budget.
| subsystems |
Mass (gr) |
Size |
Power usage (mW) |
| MCU |
94 |
9.8x9.8x1 |
400 |
| UHF TX/RX |
100 |
9.8x9.8x1 |
TX>>5100
RX>>240 |
| Antenna |
150 |
|
|
| Star Tracker |
50 |
3x3x5 |
100 |
| Battery and hardware |
250 |
1U |
500 |
| Solar cells |
6x300
2x150 |
6U
3U |
|
| Thruster |
500 |
6.4x9x9 |
21000 |
| Camera |
1600 |
2U |
10000 |
| Reaction Wheels |
520 |
1U |
8000 |
| Structure |
1100 |
6U |
0 |
| MLI |
200 |
6U |
0 |
| total |
6664 |
|
|
Table 13.
The HyperScape 100 payload.
Table 13.
The HyperScape 100 payload.
| parameter |
value |
| Focal Length |
580 mm ±1 mm |
| Aperture |
95 mm |
| Full Field of View |
2.22° (across-track) |
| Sensor Technology |
CMOS Global Shutter |
| Resolution |
4096 pixels |
| Pixel Size |
5.5 µm |
| Pixel Depth |
10-bit |
| Spectral Bands |
Up to 32 bands user selectable |
| Spectral Range |
442 nm to 884 nm |
| Control Interface Options |
I2C |
| Power Concumption |
2.5W |
| Mass |
1.1±5% |
| Dimensions |
98 x 98 x 176 mm |
Table 14.
THz CubeSat mass budget.
Table 14.
THz CubeSat mass budget.
| Item |
Mass(gr) |
Quantity |
| Thruster |
500 |
1 |
| 3U solar cells |
150 |
3 |
| 20Whr battery & Hardware |
350 |
1 |
| Main MCU |
100 |
1 |
| UHF transceiver |
75 |
1 |
| UHF ant |
50 |
1 |
| S-band transceiver |
132 |
1 |
| S-band ant |
75 |
2 |
| Star tracker |
250 |
1 |
| Star tracker |
250 |
1 |
| Structure |
304 |
1 |
| THz payload |
400 |
1 |
| Total mass |
2761 |
|
| Margin |
239 |
|
|
Disclaimer/Publisher’s Note: The statements, opinions and data contained in all publications are solely those of the individual author(s) and contributor(s) and not of MDPI and/or the editor(s). MDPI and/or the editor(s) disclaim responsibility for any injury to people or property resulting from any ideas, methods, instructions or products referred to in the content. |
© 2023 by the authors. Licensee MDPI, Basel, Switzerland. This article is an open access article distributed under the terms and conditions of the Creative Commons Attribution (CC BY) license (http://creativecommons.org/licenses/by/4.0/).
