Preprint
Article

The Effectiveness of Co-inoculation by Consortia of Microorganisms Depends on the Type of Plant and the Soil Microbiome

Altmetrics

Downloads

66

Views

35

Comments

0

A peer-reviewed article of this preprint also exists.

Submitted:

19 December 2023

Posted:

20 December 2023

You are already at the latest version

Alerts
Abstract
The amalgamation of mineral and targeted bacterial preparations represents a new generation of agricultural technology. Inoculation with combined preparations of microorganisms is more effective than inoculation with a single microorganism in stimulating plant growth by providing a more balanced diet for various crops. In this work, the effect of inoculation of 20 consortium variants on the yield indicators of three crops (wheat, buckwheat, corn) and the soil microbiome in the open field was investigated. The soil microbiome was defined by 16S rRNA sequences through NGS. Species richness of the soil microbial community (alpha diversity) was similar for all studied samples. Beta-diversity analysis revealed that the microbial diversity of three soil samples (C.bw, F.bw and Soil.bw) differed significantly from all others. At the phylum level, the number of Acidobacteriota and Firmicutes in these samples was increased. For the combination “Consortium C (Rothia endophytic GMG9 and Azotobacter chroococcum GMG39) - buckwheat”, a systemic positive improvement in all growth and yield indicators was observed. The soil of the site where buckwheat grew, inoculated by Consortium C, contained significantly more available phosphorus than all other soil samples. Such results can be explained both by the direct action of a consortium of phosphate-immobilizing and nitrogen-fixing bacteria and to acidification of the medium due to an increase in phylum Acidobacteriota bacteria in the soil.
Keywords: 
Subject: Biology and Life Sciences  -   Plant Sciences

1. Introduction

The yield of plants is directly dependent on the productivity of the interaction between soil, plants, and microorganisms. Through microorganisms, plants not only fulfill their nutrient requirements (nitrogen, phosphorus, potassium, etc.) but also gain protection from phytopathogens. This effect is achieved through various mechanisms, including: (a) increased mobilization of insoluble nutrients, subsequently enhancing assimilation by plants [1], (b) production of plant growth hormones like auxins [2], cytokinins [3], gibberellins [4], and (c) antagonism against phytopathogenic microorganisms by producing siderophores [5]. Consequently, microbial preparations can significantly reduce the need for mineral fertilizers, thereby enhancing their efficiency of use. The amalgamation of mineral and targeted bacterial preparations represents a new generation of agricultural technology.
It has been reported that inoculation with combined preparations of microorganisms is more effective than inoculation with a single microorganism in stimulating plant growth by providing a more balanced diet for various crops [6,7]. Zhang Yi et al. demonstrated that the co-inoculation of phosphate-solubilizing bacteria (PSB) and phosphate-accumulating bacteria led to higher levels of microbial biomass phosphorus and polyphosphate [8]. The synergistic effect of Bradyrhizobium japonicum USDA110 and Pseudomonas putida NUU8 for soybeans in arid field conditions exhibited a significant increase in root length by 56%, shoot length by 33%, dry root mass by 47%, dry shoot mass by 48%, and the number of nodules by 17% compared to the control [9]. The synergistic effect of microorganisms is observed even if each of them individually exhibits different properties. For example, Wang showed the effect of combined treatment of PSB (Bacillus megaterium and Pseudomonas fluorescens) and N2-fixing bacteria (Azotobacter chroococcum and Azospirillum brasilence) on the availability of nitrogen and phosphorus within the first 60 days after the addition of bacteria [10]. In addition, the beneficial effect of PSB on the survival of Azotobacter in the rhizosphere was observed [11]. Belimov et al., using the 15N isotope dilution method, showed that combined inoculation significantly increased the accumulation of nitrogen fertilizers in plants. Consequently, N2 fixation is not the main mechanism affecting plant growth reactions, and the effect of joint inoculation on their nitrogen nutrition can be explained by an increase in the extraction of nitrogen fertilizers. It is possible that the effect of bacterial mixtures on the mineral nutrition of plants is due to growth-stimulating substances secreted by bacteria [12]. Thus, microorganisms play an important role in agriculture, promoting the circulation of nutrients in plants and reducing the need for chemical fertilizers, although many questions still remain unanswered.
Do the same bacteria have the same effect on different plants? Do microorganisms exhibit properties predicted by laboratory tests in an open field? To address these questions, an experiment was conducted with 20 consortia composed of phosphate-immobilizing and nitrogen-fixing bacteria. The experiment involved three plants belonging to the main agricultural areas of plant cultivation in Western Siberia: cereals – wheat, cereals – buckwheat, and green biomass – corn.

2. Results

2.1. Yield of buckwheat, wheat, and corn

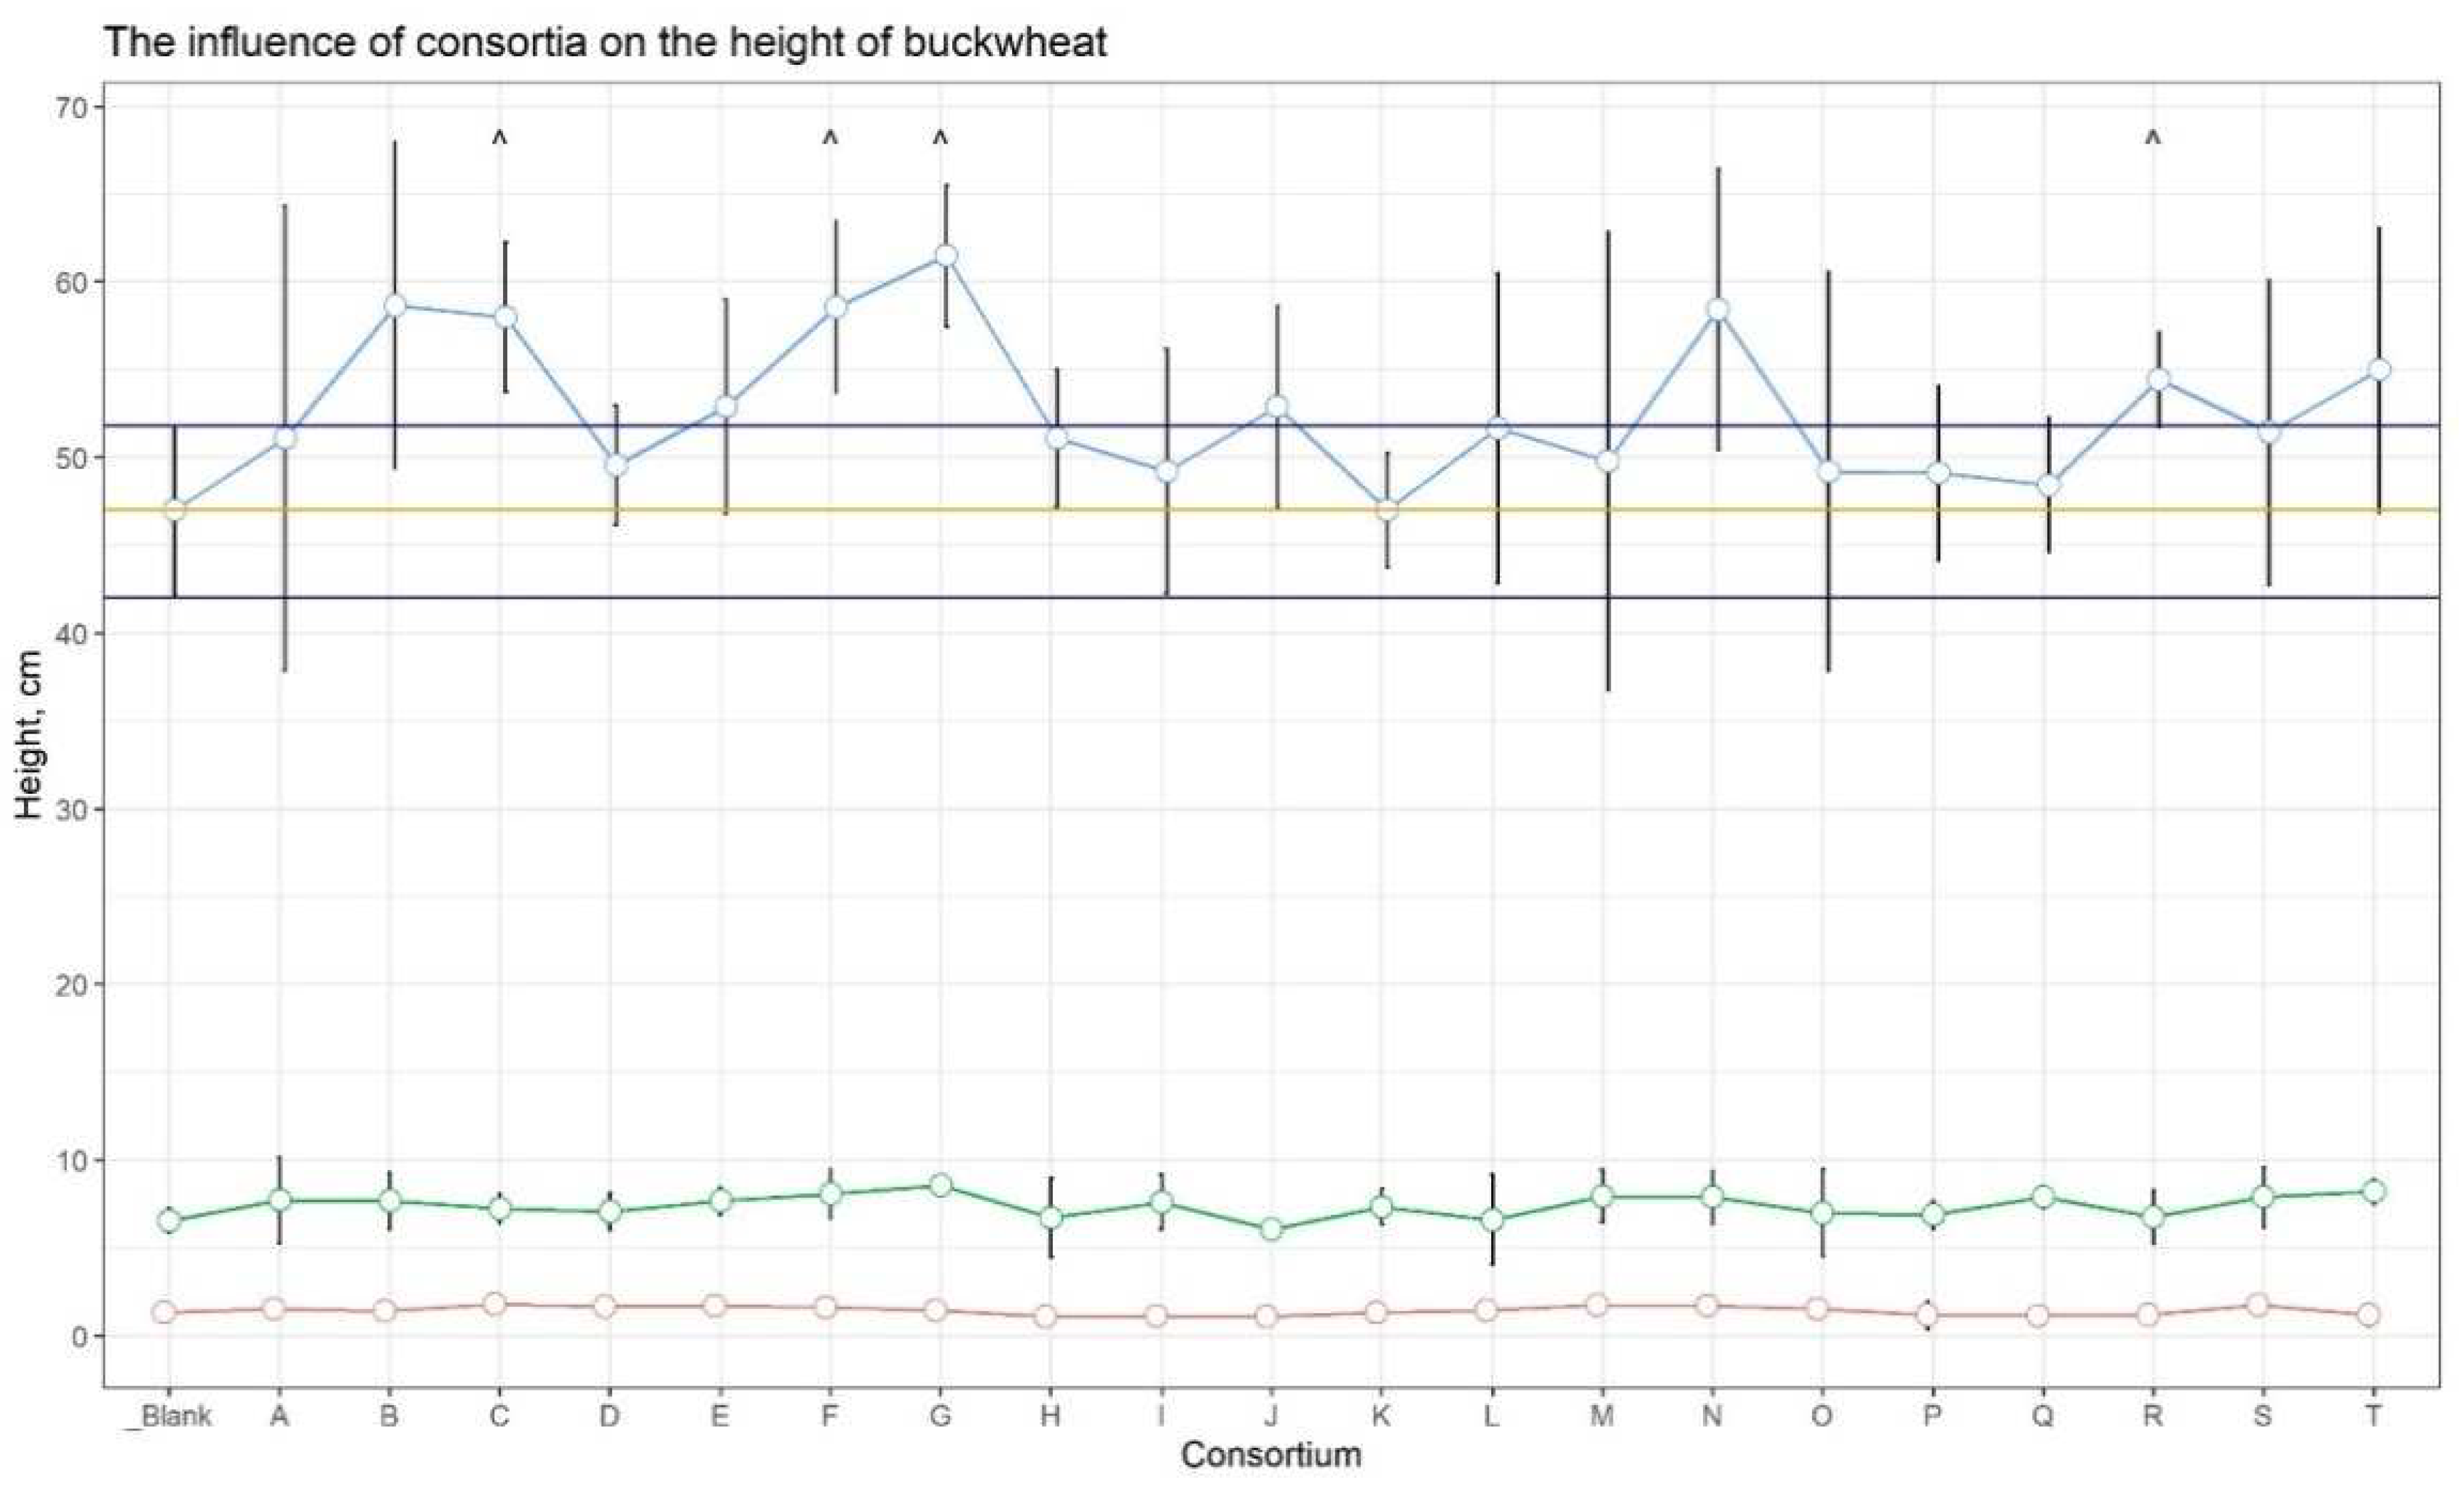
In the initial weeks of growth, buckwheat plants were approximately the same height in all plots, but after 6 weeks, plants from plots C (23.4%), F (24.6%), G (30.9%), and R (15.8%) showed a noticeable increase in height versus the control (Figure 1, Suppl. Table 1).
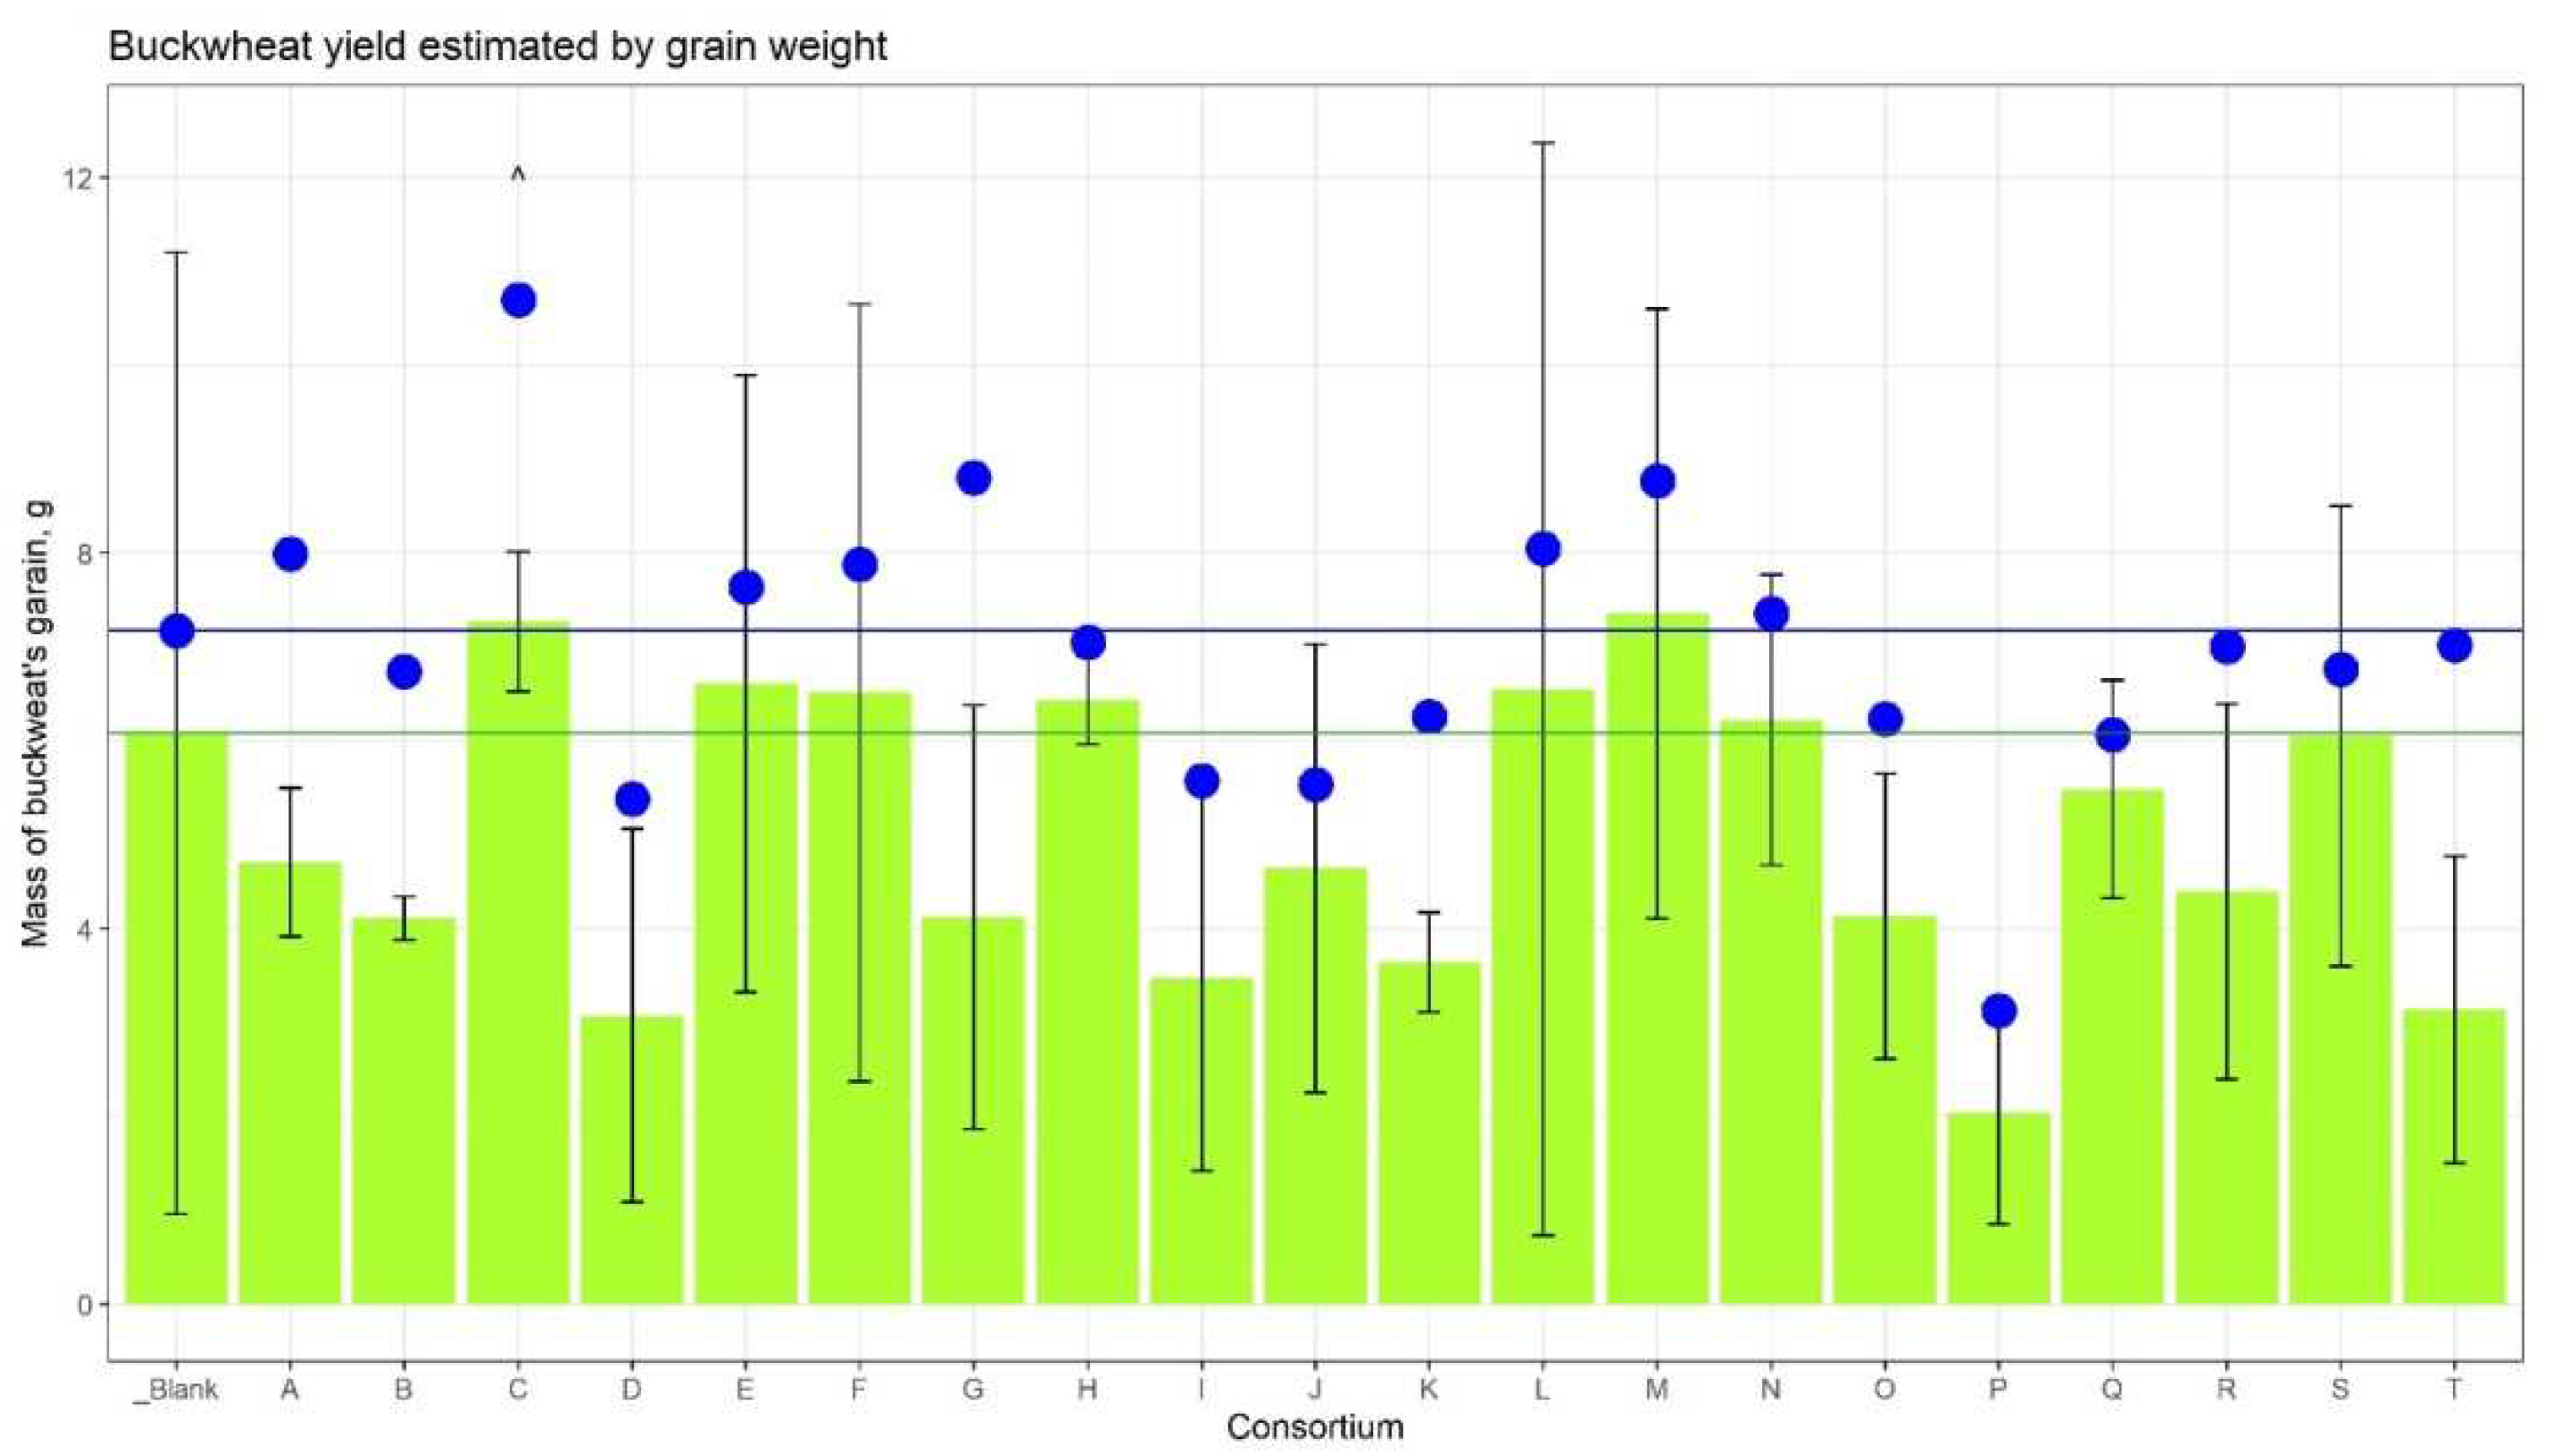
The amount of ripened grain compared to the control plot was greater in the plots corresponding to Consortia C, E, F, H, L, M, and N (Figure 2). In comparison, only grain harvested from ears showed the maximum yield for Consortia C and M (+19.6% and +20.9%, respectively). Taking into account the fallen grain, the increase in yield for Consortium C was 49.2% (Suppl. Table 2).
Figure 2. Buckwheat’s grain yield. The height of the green columns corresponds to the mean weight of grain from three plots, the whiskers are SD. The green horizontal line shows the mean weight from the control plot. The blue dots represent the average weight of the grain from the plot, taking into account the grain fallen to the ground. The blue horizontal line corresponds to the dot of the control plot.
Preprints 93783 g002
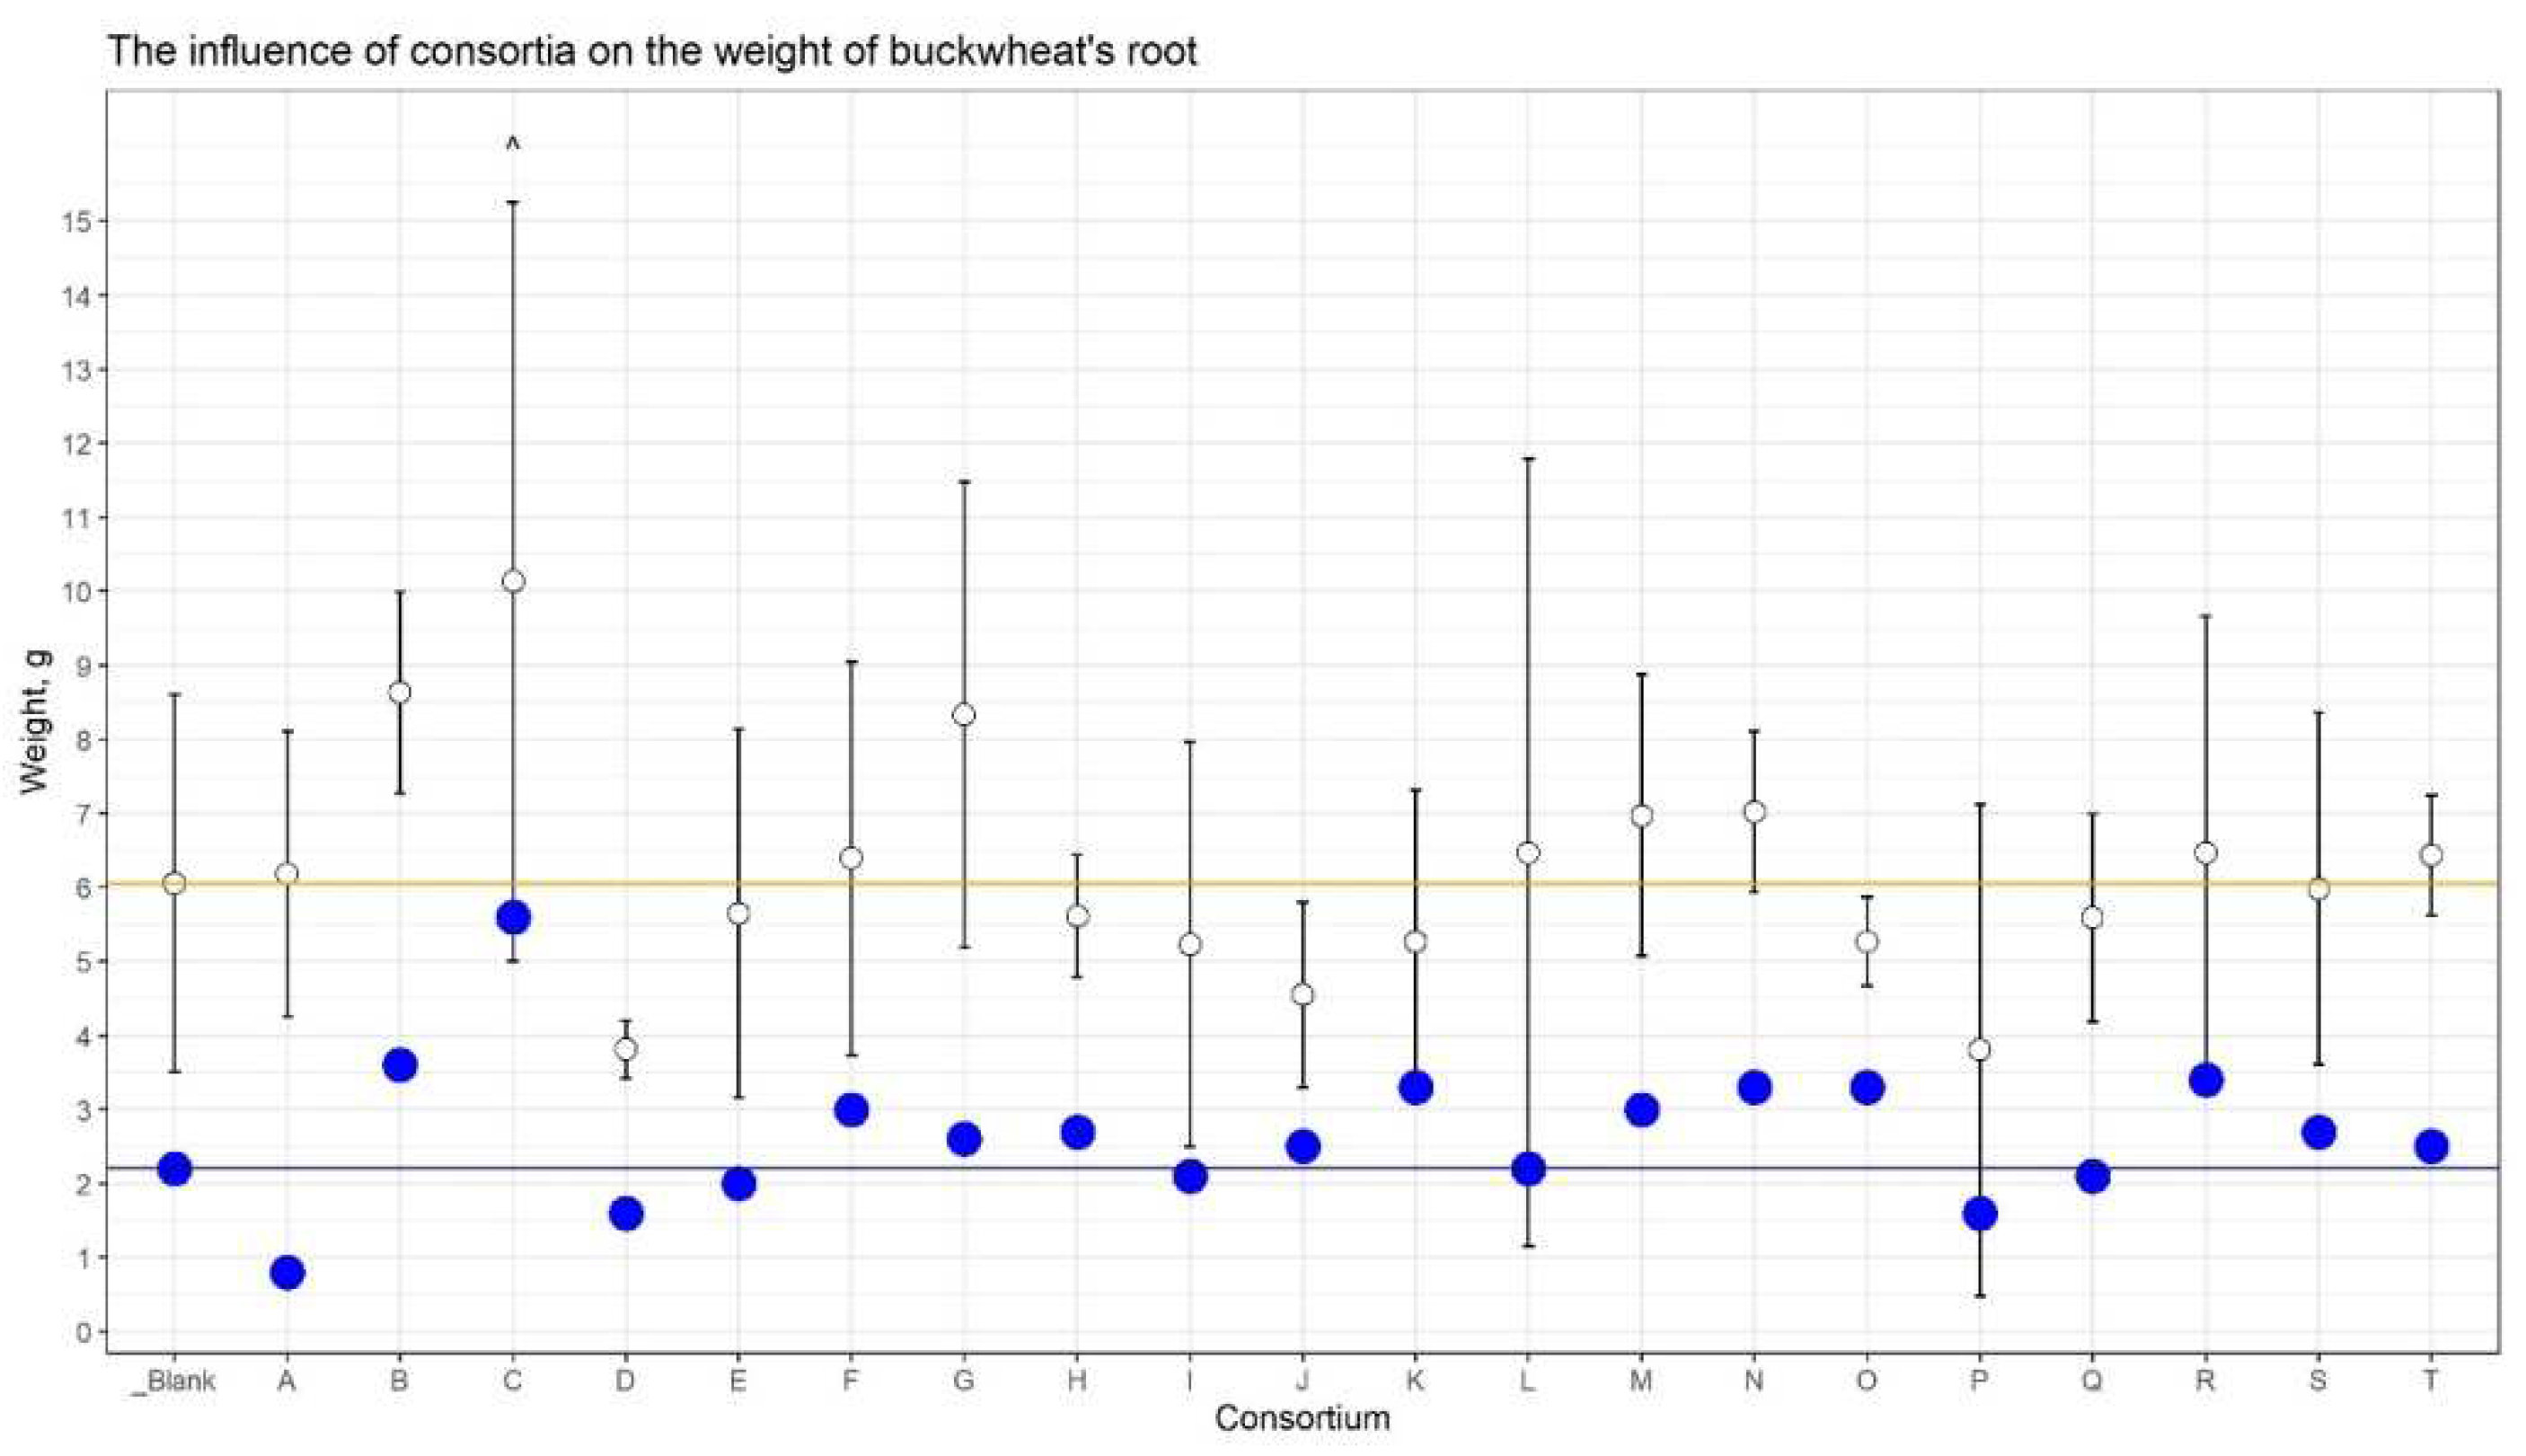
The consortium’s influence on the weight of straw and dry roots was also revealed (Figure 3). The increase in straw weight was detected for Consortia B, C, and G. The weight of dry roots was dramatically strong for consortium C (+152%) versus control plants.
Thus, based on agronomic measurements, it was found that buckwheat plants grown from seeds inoculated with Consortium C consistently outperformed control plants in their indicators: the growth rate, the mass of the vegetative part, and the mass of the grain.
There was no difference between the height of wheat plants in different consortia compared to the control after either 4 weeks or 6 weeks (Suppl. Table 3, Suppl. Figure 1). Despite the fact that the stems of plants from the consortium at the site were statistically significantly longer than in the control, after 3 months (Suppl. Figure 2), the influence of consortia on the length of the wheat ear, as well as on the ratio of the length of the stem to the length of the ear, was not evident (Suppl. Table 4). Also, no effect was found on such yield characteristics as the weight of the ear and the weight of grain without a floor (Suppl. Figure 3).
To assess the effect of inoculation of corn seeds in bacterial consortia, plant height was measured after 4 and 6 weeks, also the weight of wet and dry ears and the weight of dry roots were measured after 3 months. However, none of these indicators were statistically significantly different compared to the control plot (Suppl. Table 4, Suppl. Figure 4 and Figure 5).

2.2. Soil nutrient status

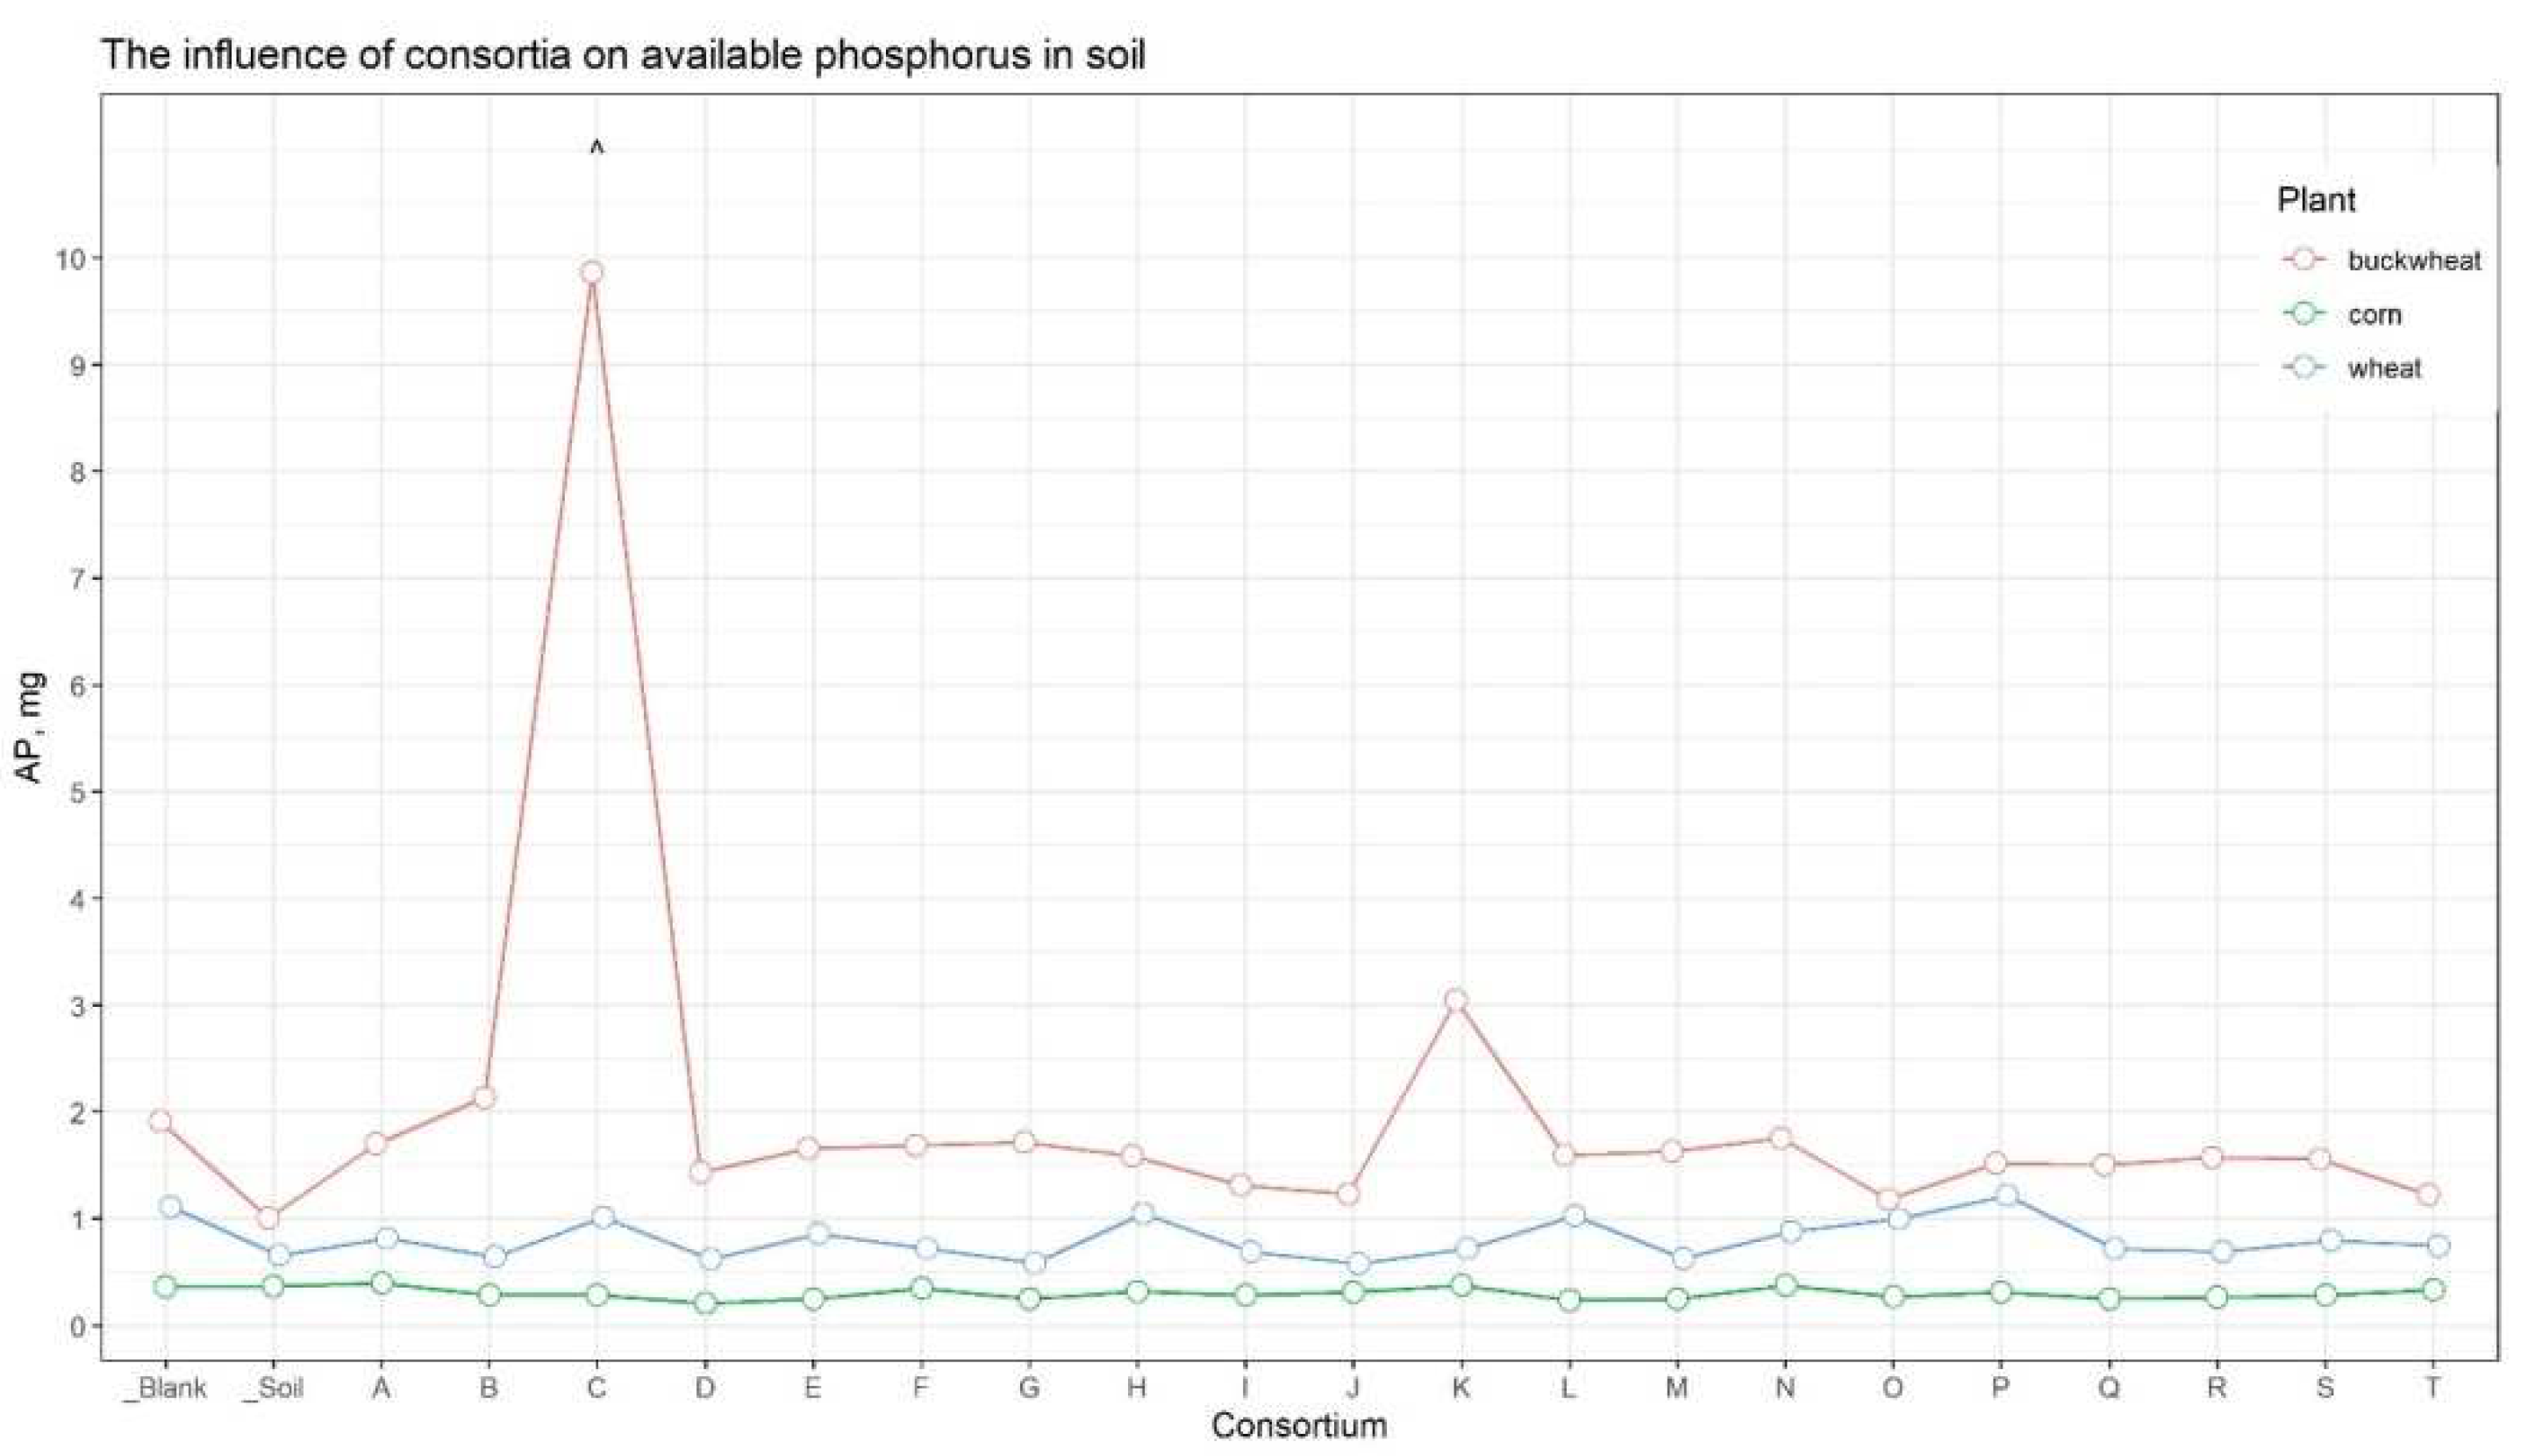
The analysis of soil nutrients indicated that the content of available forms of nitrogen, potassium, and carbon (organic, inorganic, and total) was approximately consistent across all samples (Suppl. Table 5). At the same time, for the soil sample from the plot with buckwheat inoculated in Consortium C, the amount of available phosphorus was significantly compared to the other samples (Figure 4).
Figure 4. The amount of soluble phosphorus in soils. The red line corresponding on soil samples under buckwheat, the green one – under corn, and the blue one – under wheat. Dots are the mean equal. ^ - marked plot of consortia, which has shown maximal additional growing versus control.
Preprints 93783 g004

2.3. Effect of Different Consortium on Soil Microbial Community and Diversity

The dependence of the number of identified taxa on the number of sequences was estimated by constructing rarefaction curves (Suppl. Figure 6). The analysis showed a complete determination of the taxonomic composition even with 700 sequences in all soil samples, as the curves reached a plateau. The sequencing depth proved adequate to assess alpha diversity.
Estimates of the alpha diversity (Observed, Chao1, ACE, Shannon) of microbial communities of soil samples were calculated depending on the type of consortium that seeds were inoculated with before planting (Suppl. Table 6). Box and whisker diagrams were constructed for comparison (Suppl. Figure 7).
A pairwise comparison of alpha-diversity indices (observed and Shannon) by the Wilcoxon test did not show a significant difference between soil samples from seeds inoculated with different consortia.
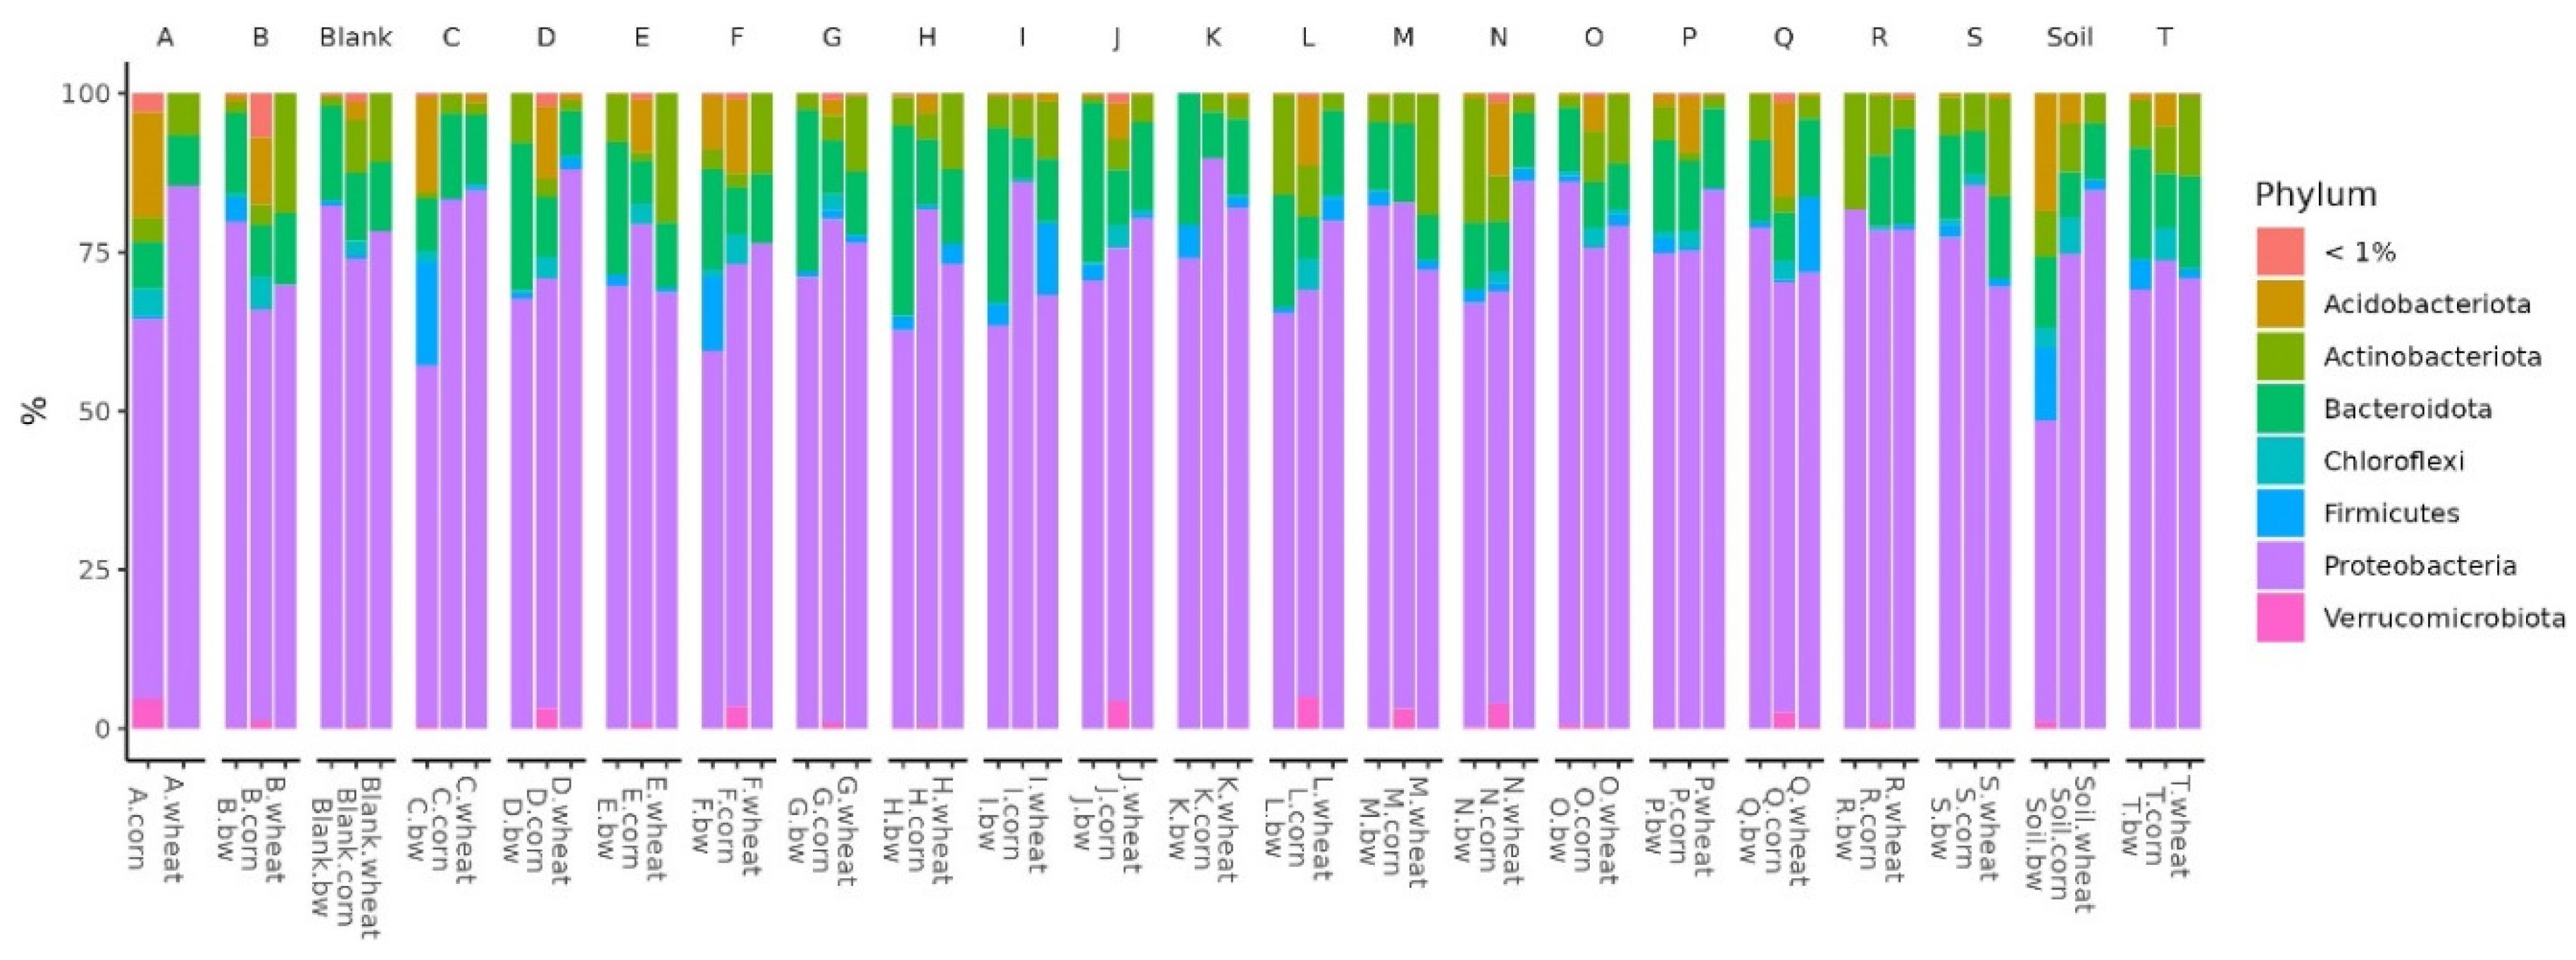
In all the studied soil samples, the dominant bacterial filaments were Proteobacteria, Firmicutes, Bacteroidota, Actinobacteroidota, and Acidobactoroidota. It is noteworthy that the proportion of Firmicutes increased in the three soil samples. All these samples belonged to plots with buckwheat, two had plants whose seeds were inoculated by Consortia C and F, and the third was a control plot of soil on which plants were not grown.
Figure 5. Relative abundance histograms of dominant bacteria phyla in each soil sample.
Preprints 93783 g005
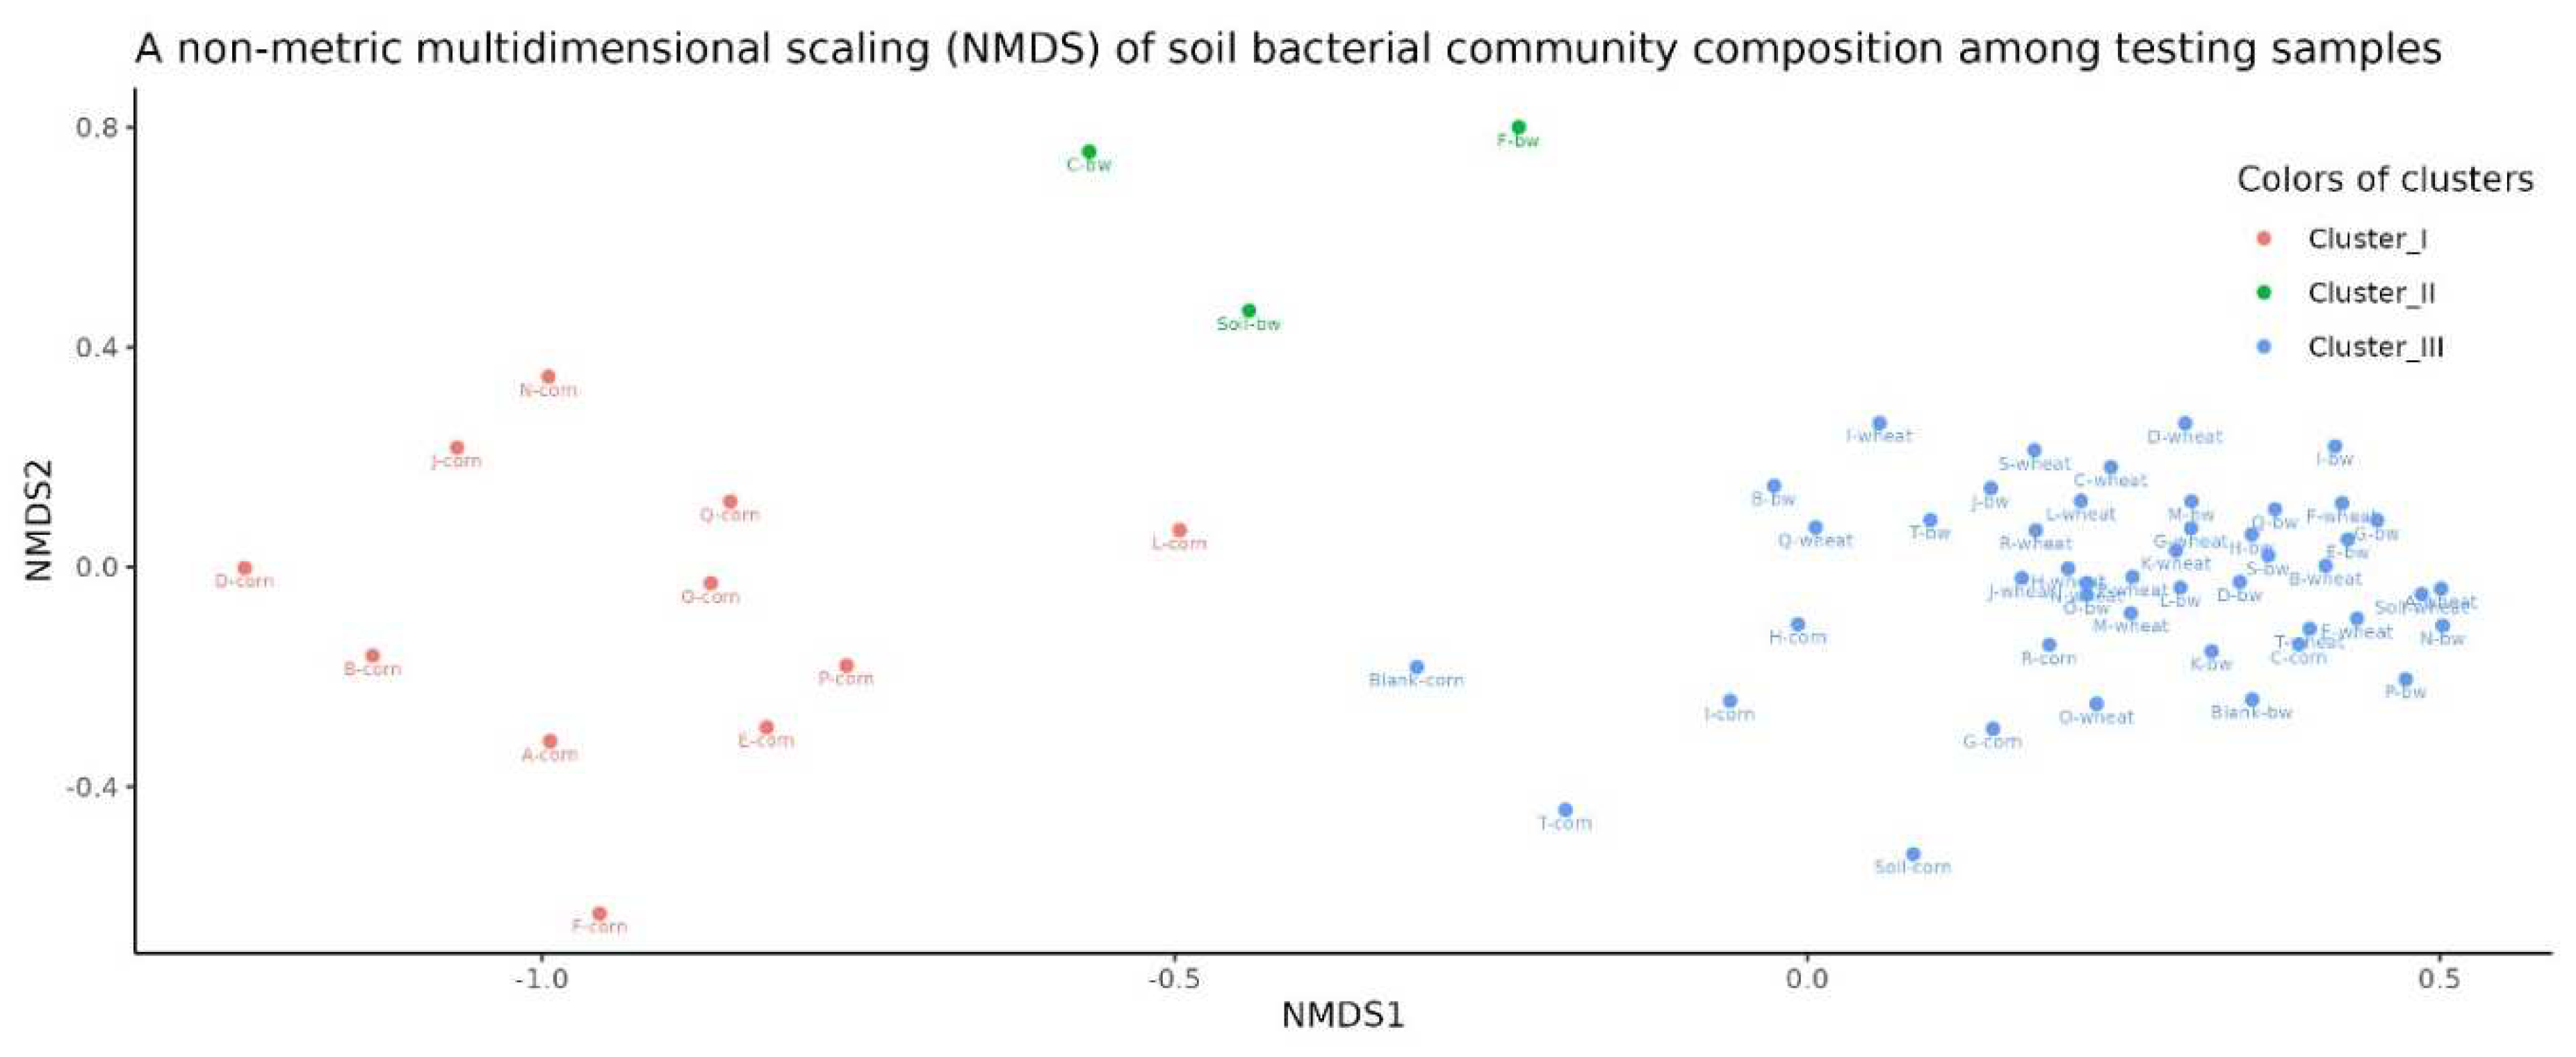
Beta diversity analysis using non-metric multidimensional scaling (NMDS) showed that the samples were clearly divided into three clusters. The first cluster predominantly included samples from corn plots, the second from the C, F and Soil from buckwheat plots, and the third included the remaining samples.
Figure 6. A non-metric multidimensional scaling (NMDS) of soil bacterial community composition among testing samples.
Preprints 93783 g006
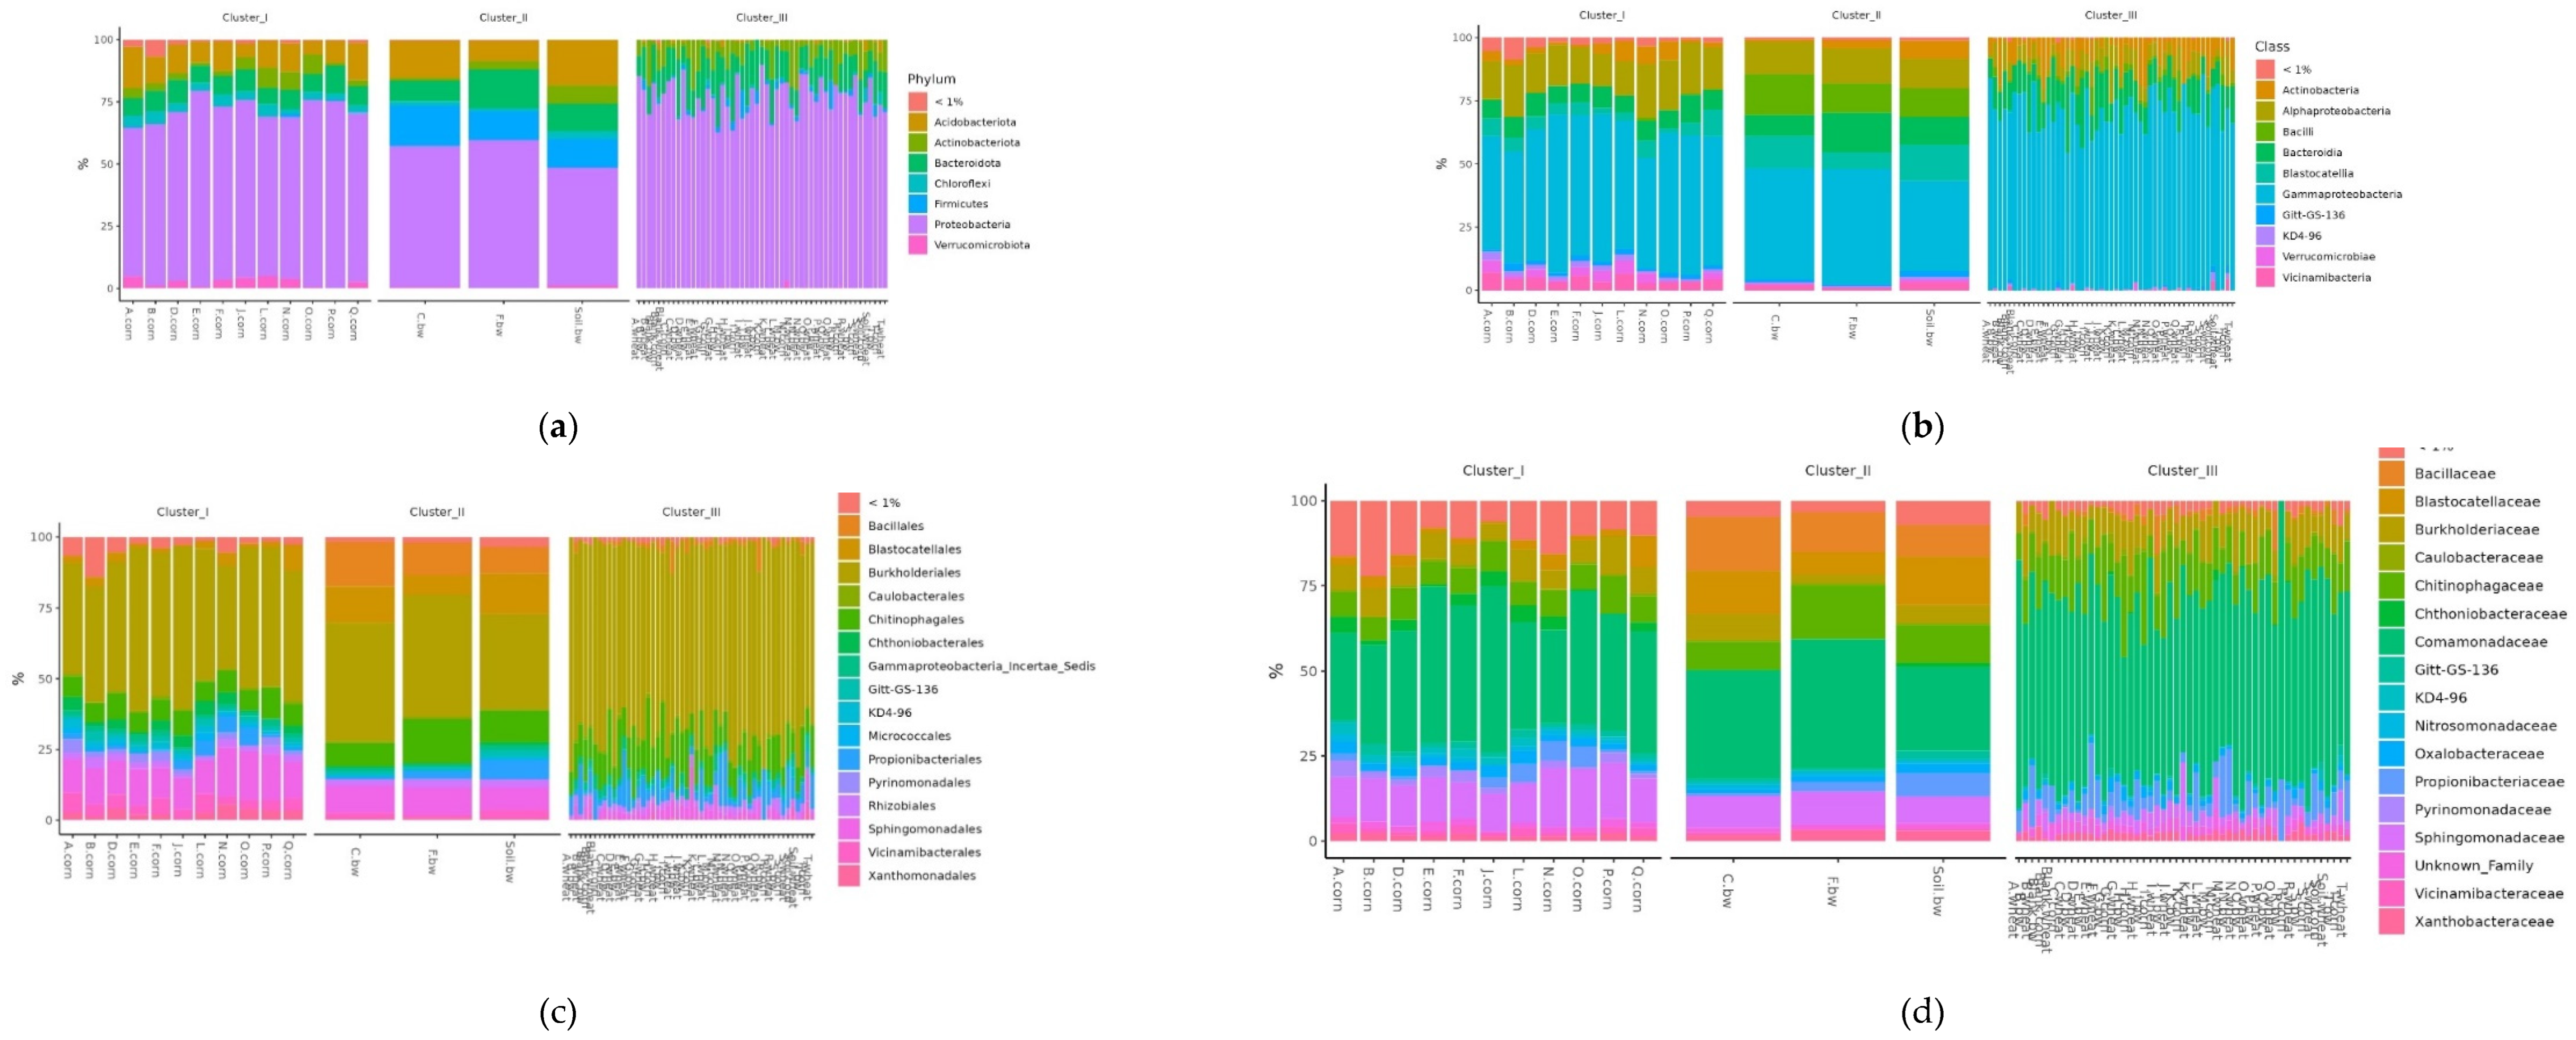
To assess the differences in the representation of different bacteria between the clusters defined by the analysis, several additional relative abundance histograms were built (Figure 7 A-D).
Figure 7. Relative abundance histograms of dominant bacteria Phyla (a), Class (b), Order (c), Family (d) in each soil sample grouped by clusters from NMDS.
Preprints 93783 g007
Histograms show the difference in the representation of bacteria between clusters at different levels of classification: phylum, class, order, and family. At the phylum level in the samples of Cluster 2, the amount of Proteobacteria was significantly reduced, while Firmicutes and Acidobacteriota were increased. At the class level in Cluster 2, the content of Bacilli was increased, and Gammaproteobacteria was reduced. At the level of orders in class 2, Bacillales was elevated, and at the level of the family – Bacillaceae was increased.
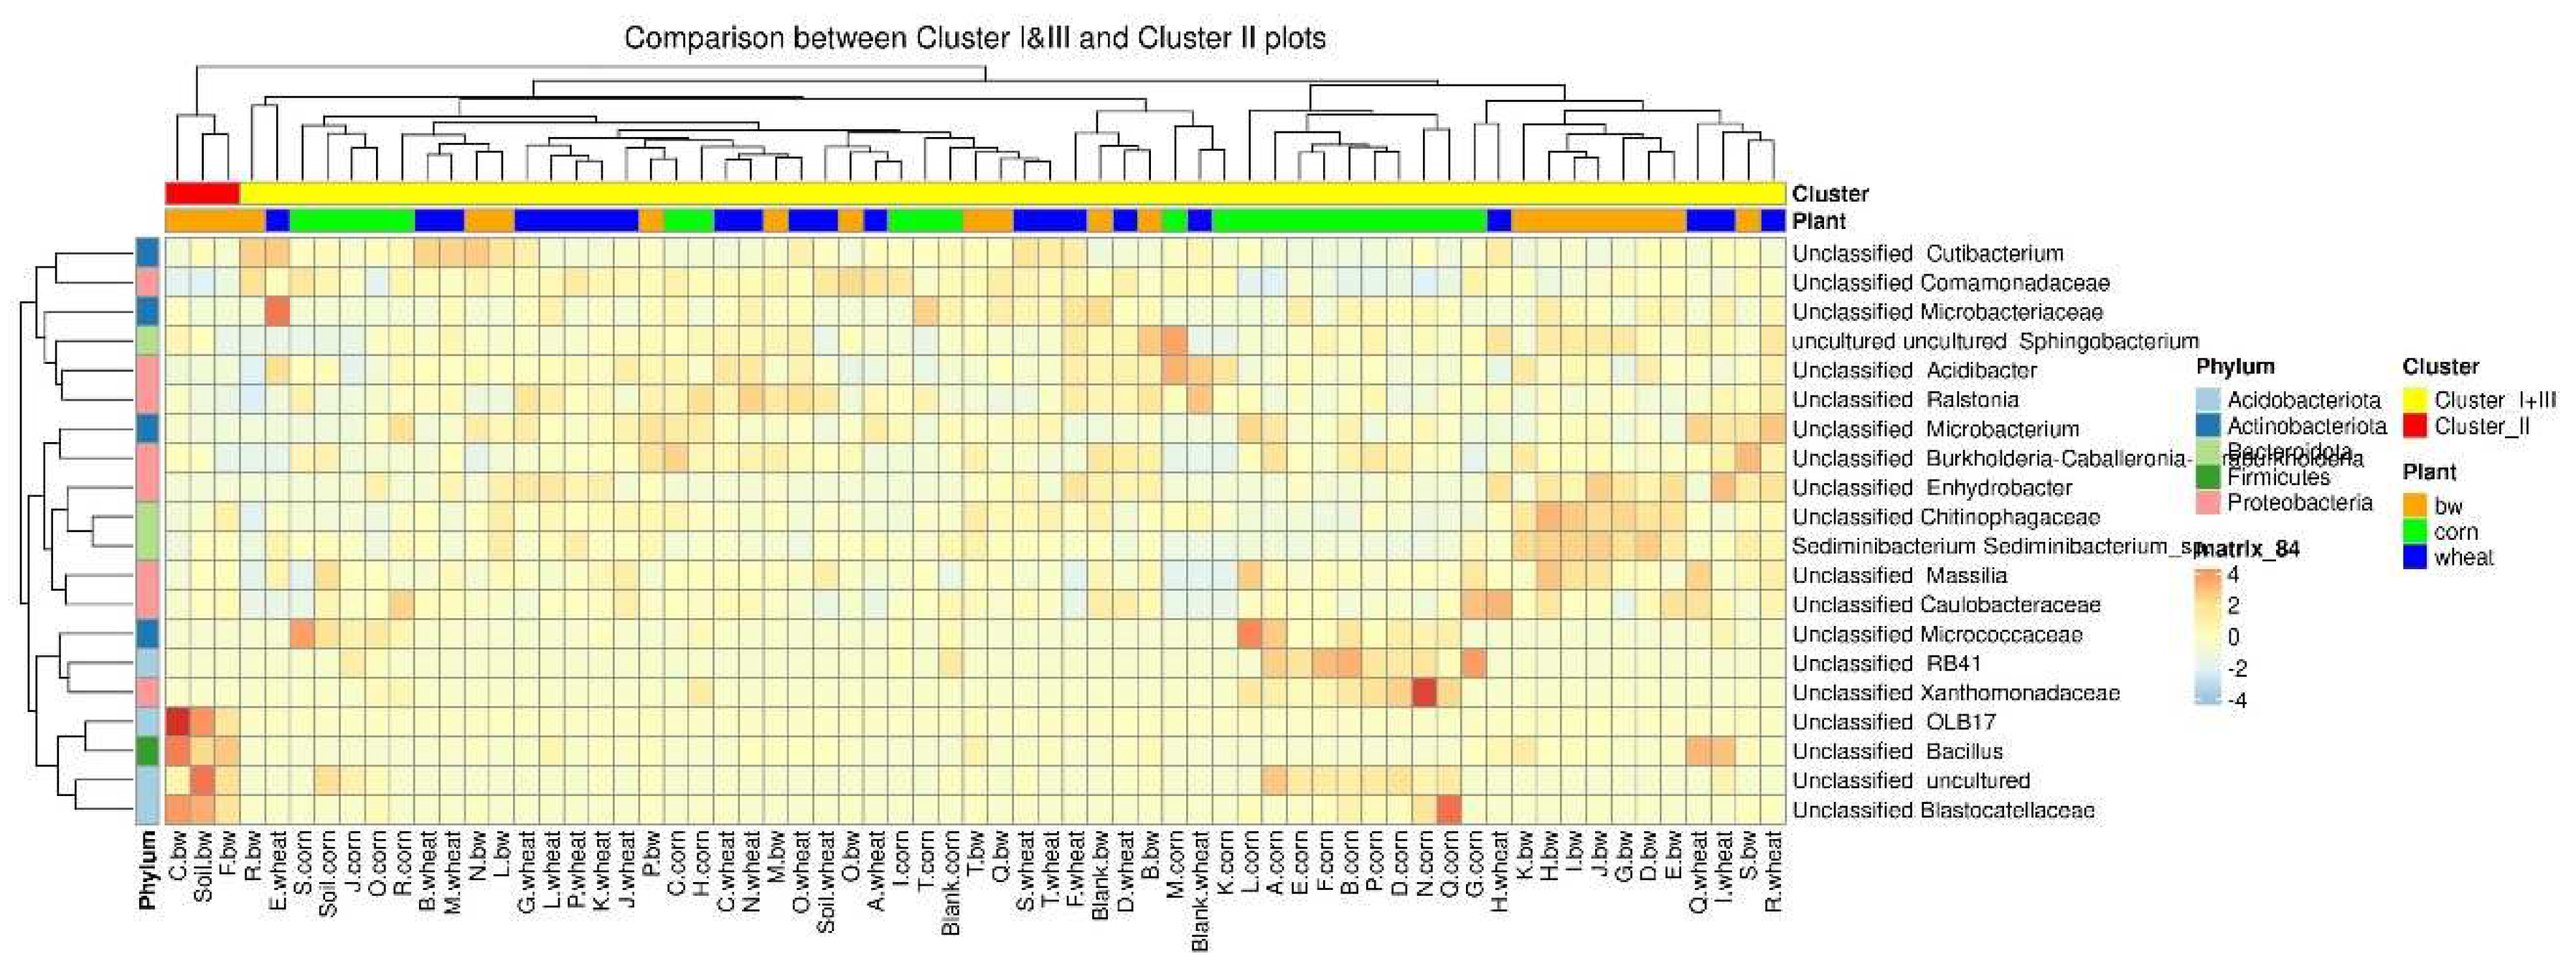
To estimate the differential abundance of taxa between the groups, a differential abundance analysis was carried out. Cluster 2, containing a sample of C.bw, and the union of Clusters 1 and 3 were initially taken as comparison groups (Figure 8). In the heat map, the red square marks OTUs, the representation of which is significantly higher in this group compared to the rest. The samples of Cluster II 4 OTUs are more abundant: Unclassified OBL17, Unclassified Bacillus, Unclassified Blastocatellaceae, and Unclassified uncultured.
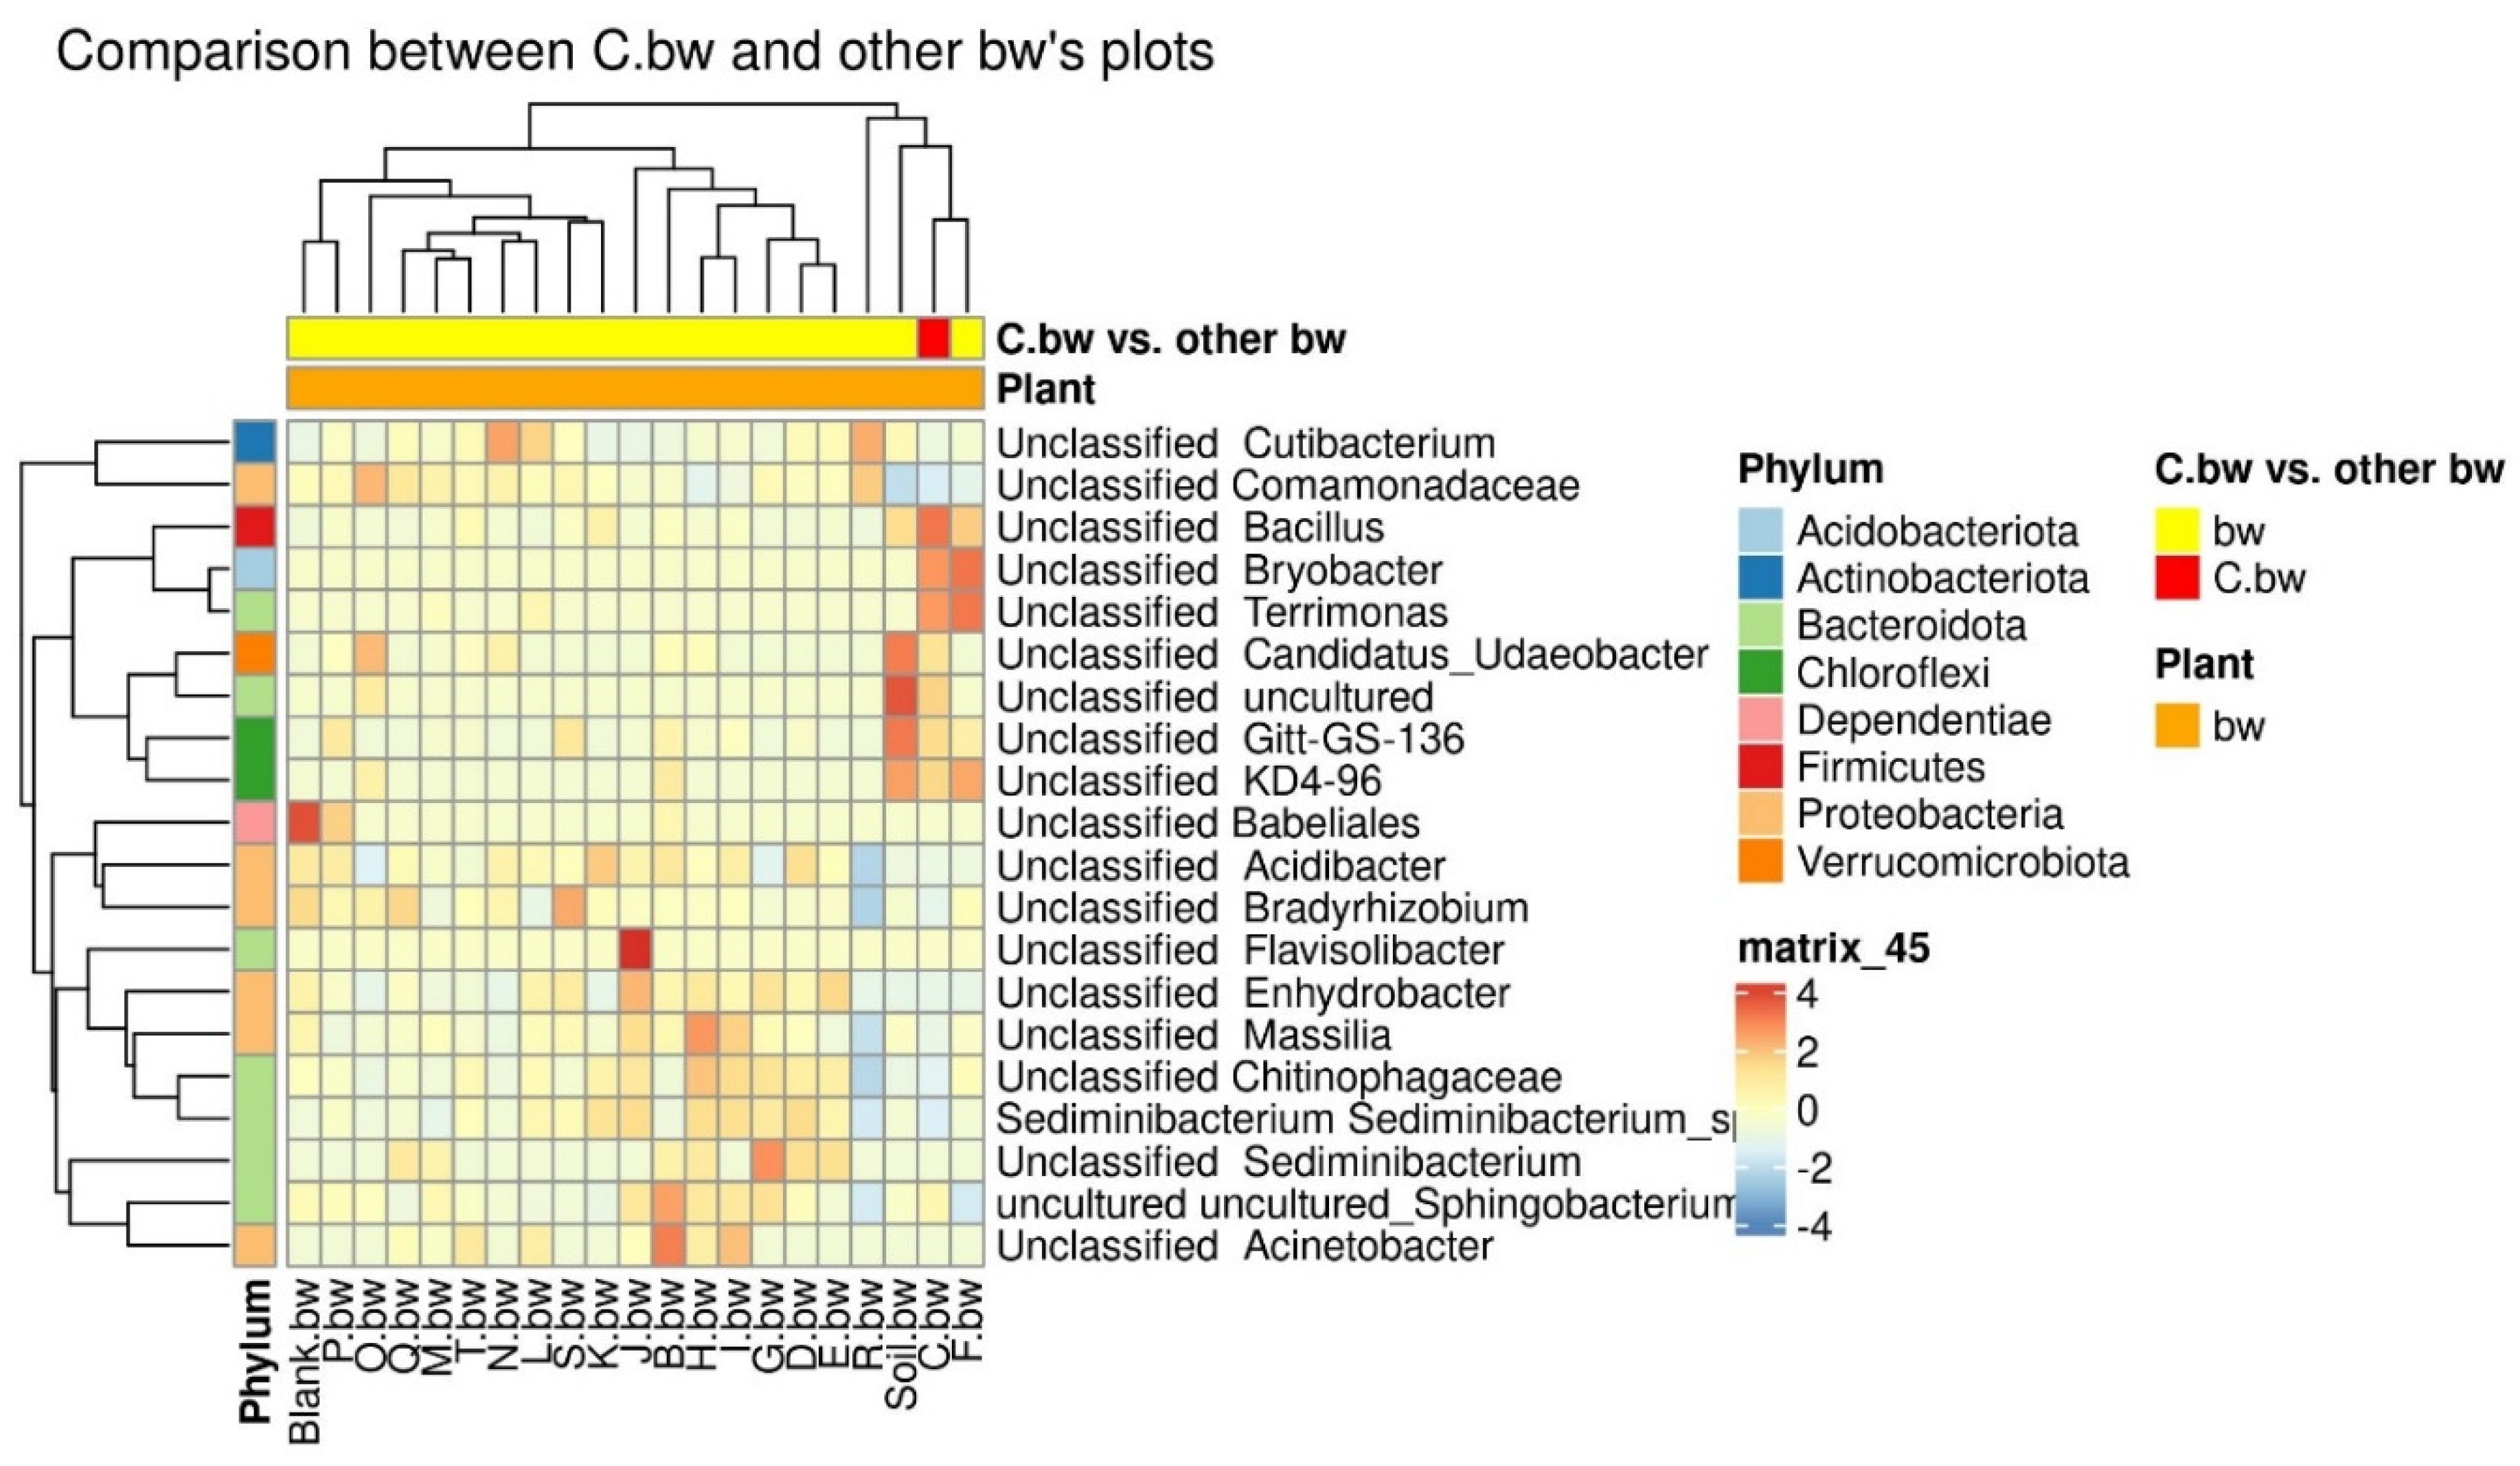
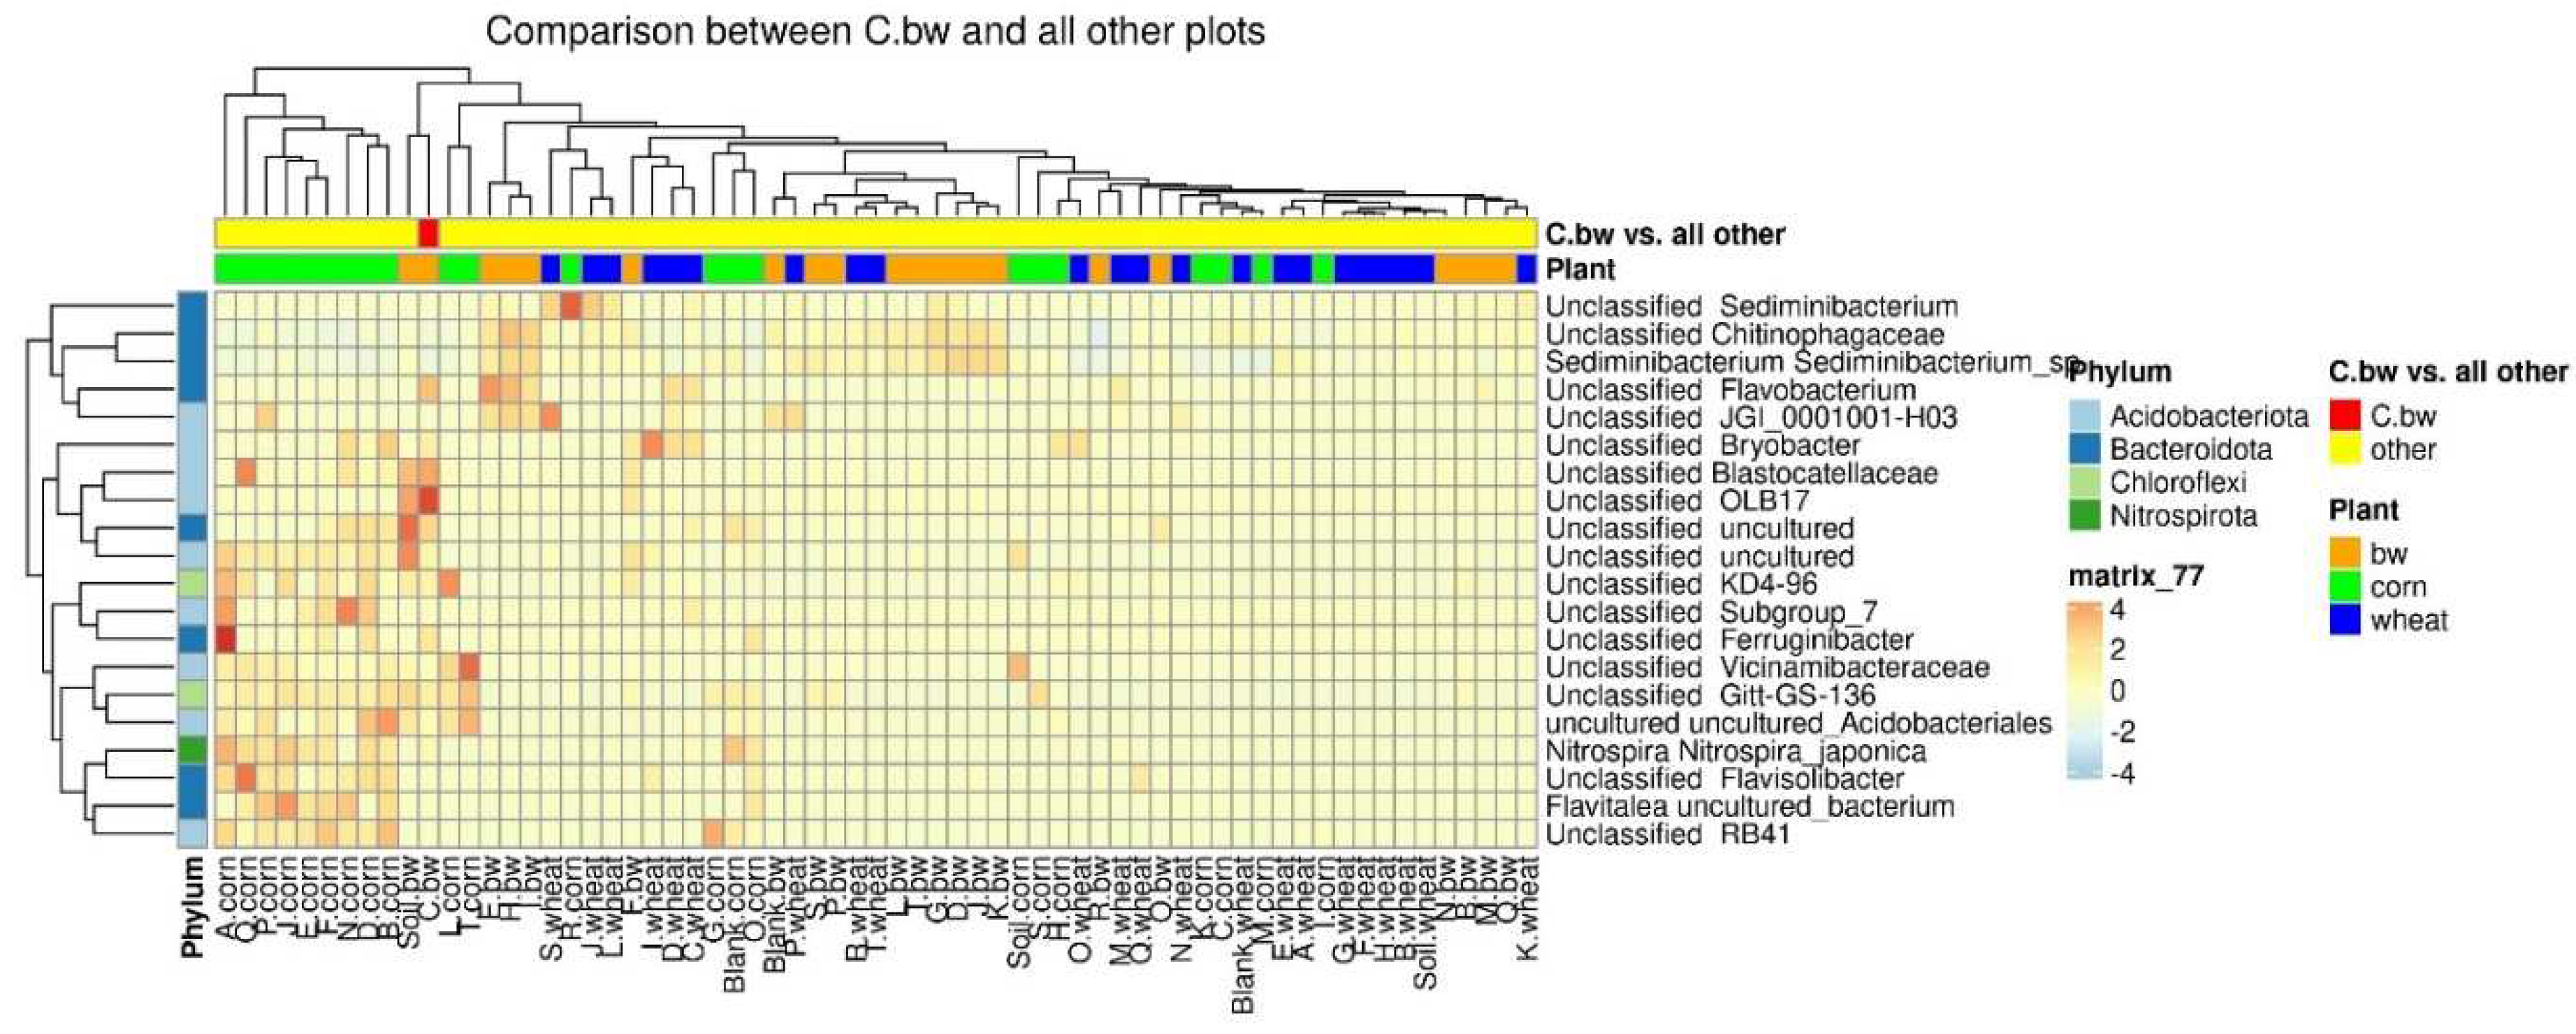
Due to the fact that the plants and the composition of the soil from the C.bw plot showed the highest agrotechnical indicators in this experiment, two comparisons were carried out: C.bw against all other samples (Figure 9) and C.bw against all samples from plots with buckwheat (Figure 10).
The results of the comparison confirmed the previously identified Unclassified OBL17 and Unclassified Bacillus.
Figure 10. The heatmap of differentially abundant taxa between the C.bw sample and all other samples.
Preprints 93783 g010
The plot C.bw was distinguished from all other plots (except for F.bw) with buckwheat by Unclassified Bacillus (Firmicutes), Unclassified Bryobacter (Acidobacteriota), Unclassified Terrimonas (Bacteroidota). Also, the content of Unclassified Candidatus_Udaeobacter, Unclassified Gitt-GS-136, Unclassified KD4-96, and Unclassified uncultured was increased. It is noteworthy that an increased content of KD4-96 was detected for all three samples included in Cluster II (C.bw, F.bw, and Soil.bw).
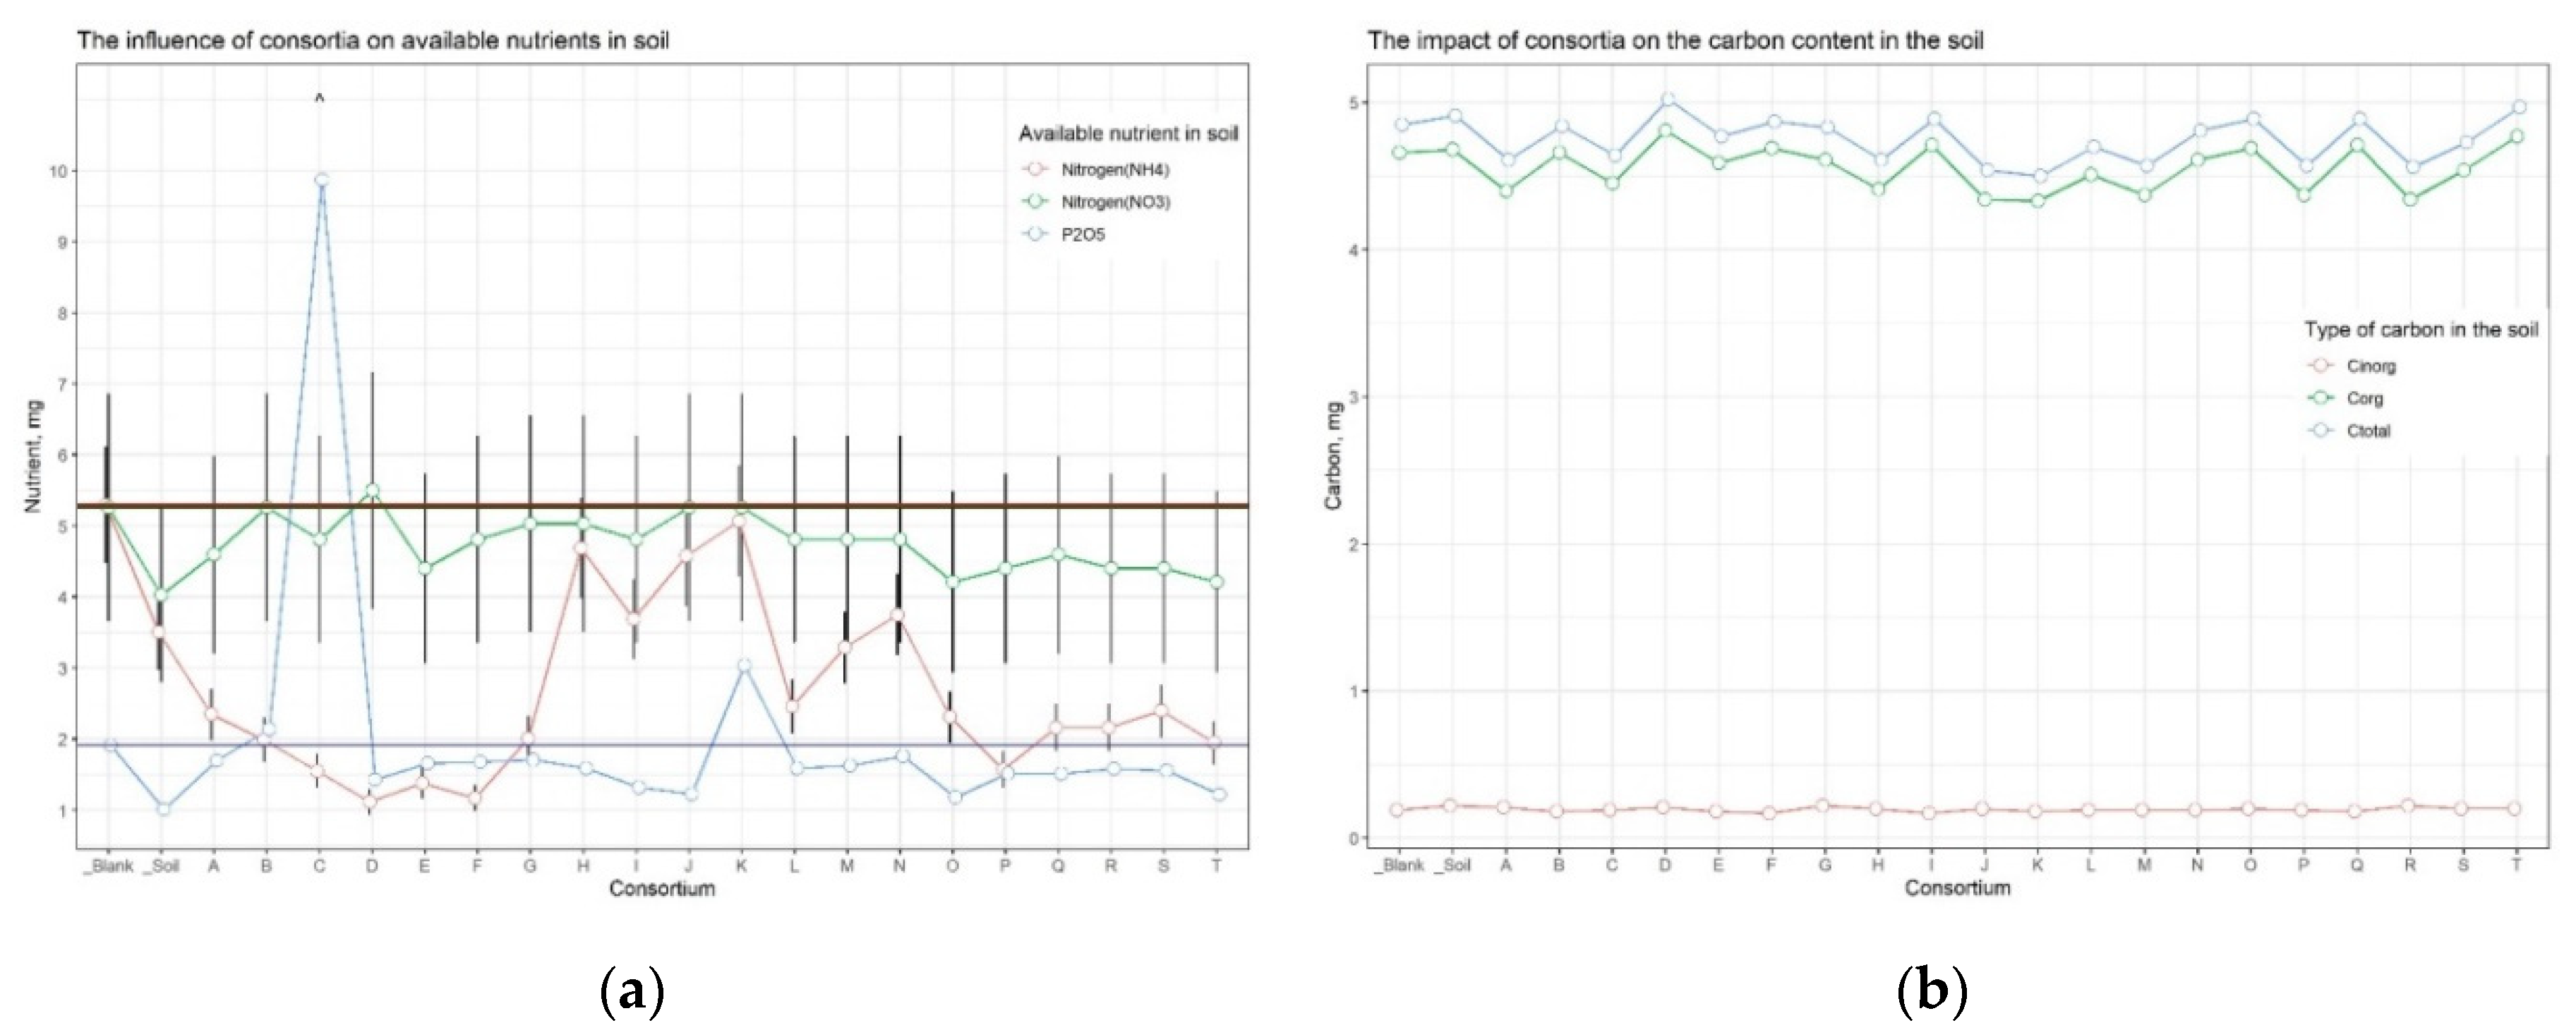
Since Cluster 2 contained only samples from plots allocated for buckwheat, the available soil nutrients and carbon content were separately compared between only buckwheat plots, in order to neutralize the influence of different crops on soil nutrients (Figure 11).
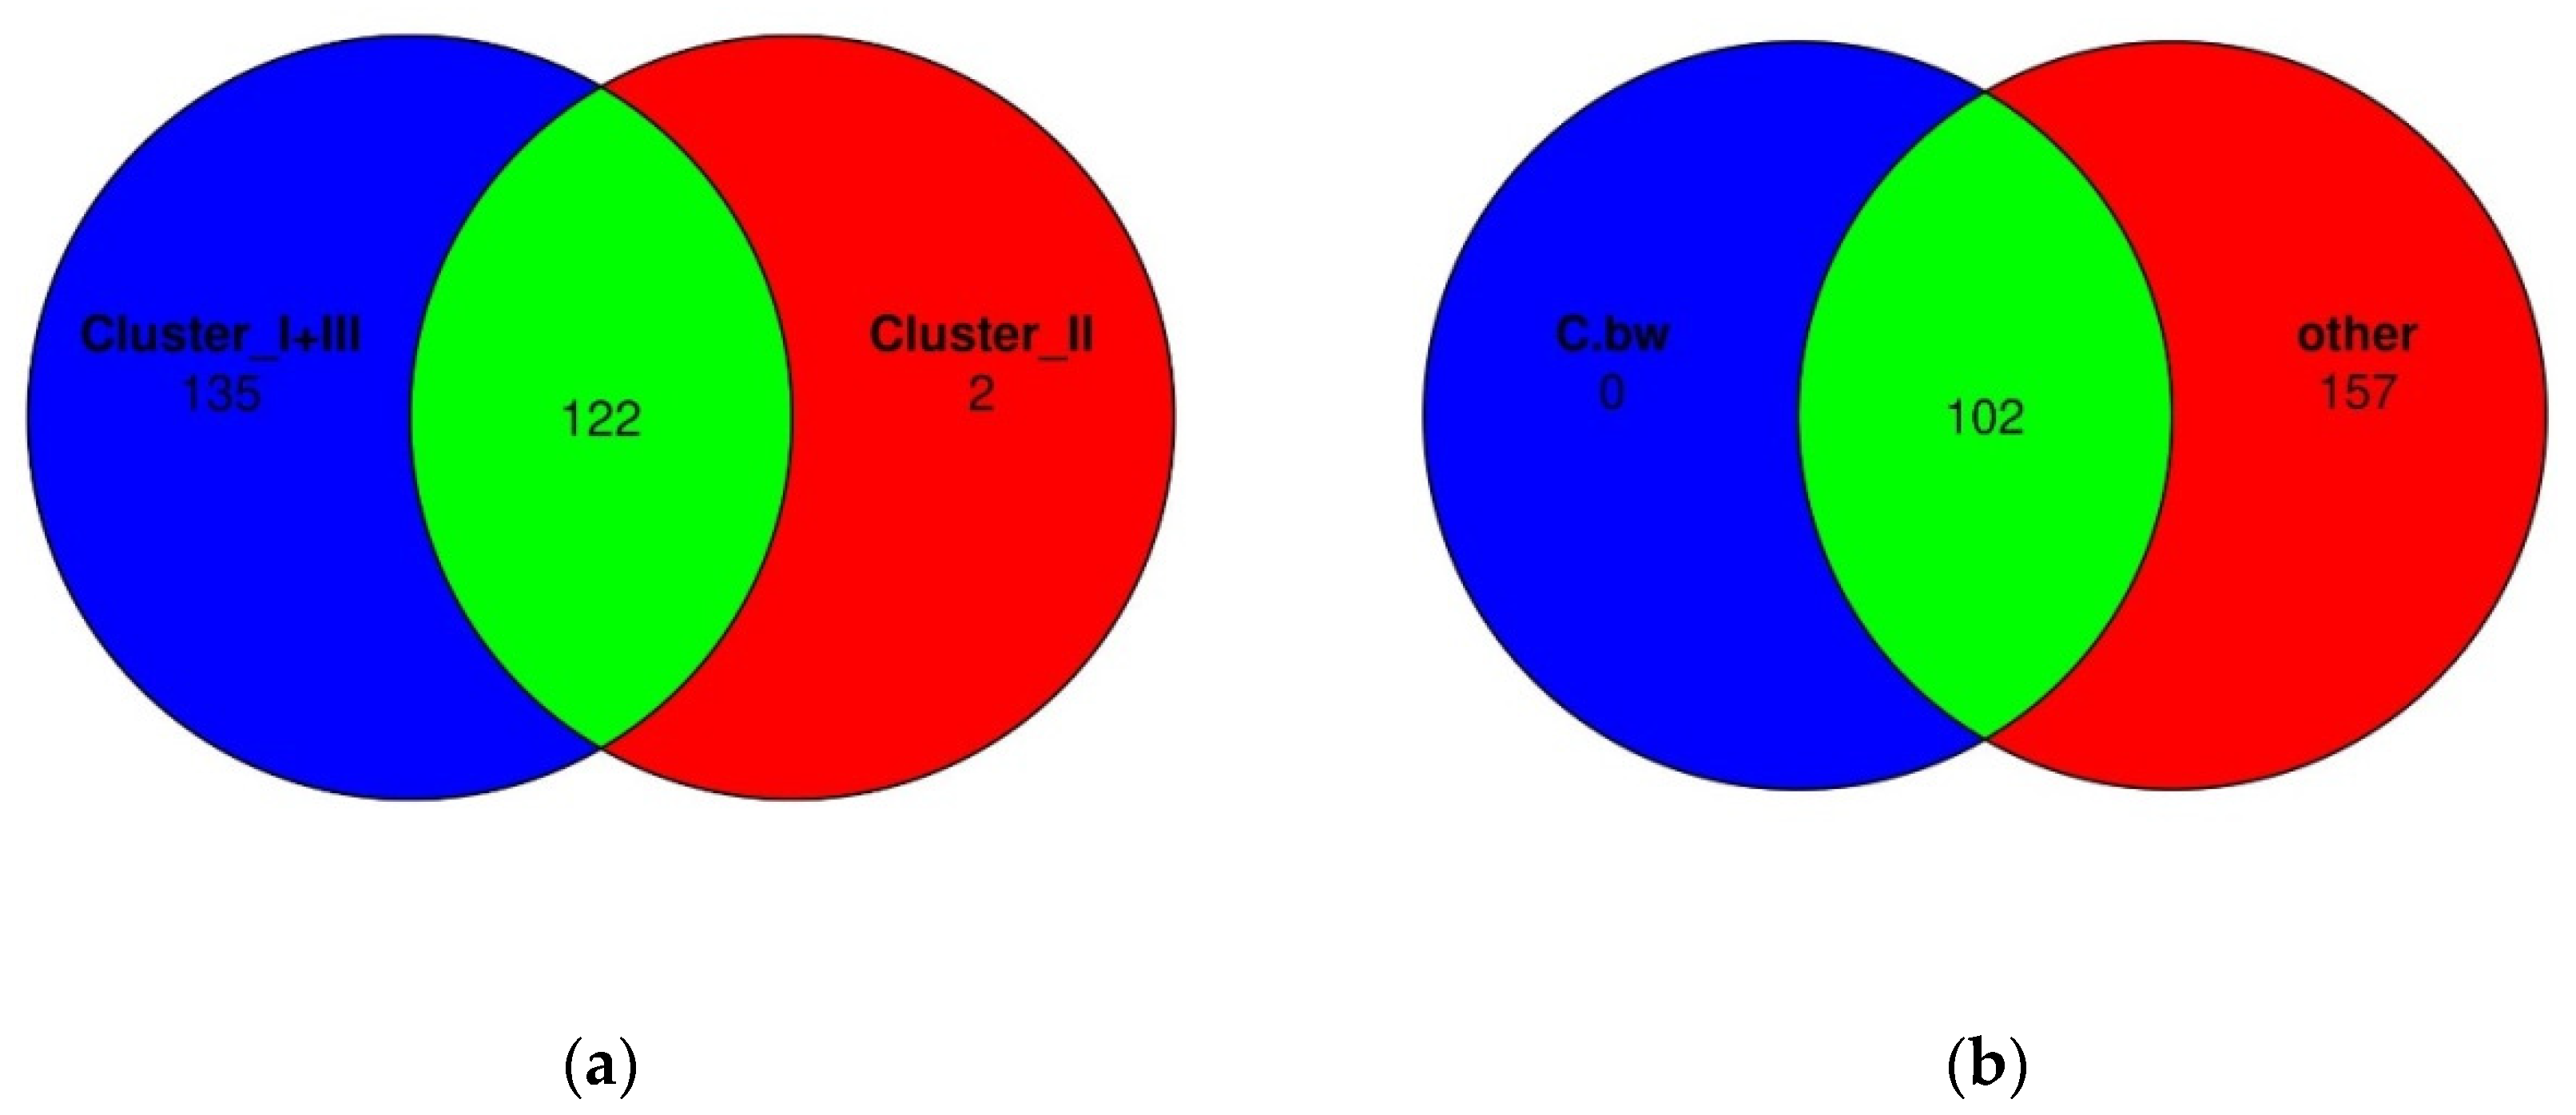
Finally, Venn diagrams were constructed in order to assess whether there were unique bacterial taxa in Cluster II or in the soil of the plot from C.bw (Figure 12).
According to Venn diagrams, Cluster 2 had two unique OTUs. Both OTUs are defined to the family level, moreover, both belong to the same family: domain Bacteria, phylum Acidobacteriota, class Blastocatellia, order Blastocatellales, family Blastocatellaceae. Both OTUs are not unique to C.bw; they were identified in two samples C.bw and Soil.bw. Since the Soil.bw sample represents the soil microbiome before the experiment, it can be argued that these OTUs were likely present initially, and were preserved only in plot C.bw. Other taxa, which exhibited increased content in the soil sample of the C.bw plot, were likely present in the soil before planting. However, under the influence of external factors, these taxa gained a selective advantage in reproduction.

3. Discussion

Inoculation of seeds from important agricultural crops (wheat, buckwheat, corn) with bacterial consortia followed by cultivation in the open field, improved the agrotechnical indicators for buckwheat treated by Consortium C. While for other variants of the culture-consortium interaction, the agrotechnical indicators either did not differ from the control or exhibited variations in just one indicator, for the combination “Consortium C – buckwheat” there was a systemic positive improvement in all growth and yield indicators. The height of plants after six weeks (+23.4%), a large amount of grain from the plot (+19.6%, taking into account the fallen +49.2%), a more developed root system (weight of dry roots +152%) exceeded those of the control plants, the seeds of which were not inoculated with any bacterial consortia. The soil of the plot where the buckwheat inoculated by Consortium C grew contained significantly more (up to 10 times) available phosphorus than all other soil samples (Figure 4).
Consortium C was based on the Rothia endophytica GMG9 strain, which demonstrated in a laboratory experiment a high phosphate-immobilizing ability (248.3 µg/ml). An active nitrogen fixator, the strain Azotobacter chroococcum GMG39, was also added to Consortium C. Interestingly, another Consortium H, created on the basis of the Rothia endophytica GMG9 strain, but with the addition of a strain with high siderophore production and antifungicidal activity (Enterobacter amnigenus GMG288), did not demonstrate an increase in available phosphates in the soil. Also, Consortia B, D, and E, which contained Azotobacter chroococcum GMG39 in combination with other phosphate-immobilizing bacteria, did not show any effect on the availability of phosphates in the soil and buckwheat yield. Thus, it can be assumed that in Consortium C, one can observe a synergistic effect of the strains Rothia endophytica GMG9 and Azotobacter chroococcum GMG39. Previously, the synergistic effects of the use of nitrogen-fixing and phosphate-immobilizing bacteria strains have already been demonstrated, both on the content of macronutrients in plants and on their availability in the soil [6,7]. In most cases, it is discussed that phosphate mobilizers improve nitrogen fixation by increasing the availability of phosphates for the operation of nitrogenases or the development of the root system [13]. At the same time, it is worth noting that this synergistic effect was present only when growing buckwheat and did not manifest itself in any way either when growing wheat or when growing corn. Initially, the species Rothia endophytica was described as isolated from superficially sterilized roots of Dysophylla stellata (Lour.) – a plant of the family of Lamiaceae, used as medicinal in China [14]. Perhaps this bacterium can interact with the roots of only some plant species and one can see the effect of a successful symbiosis of bacteria and plants. Unfortunately, plant root samples were not preserved in the work, and this issue requires further research.
Analyzing microbial diversity in the soils of experimental samples three months after inoculation, no strains that formed consortia were found. This suggests that when seeds are inoculated, the main effect is 1) the initial effect of bacteria embedded in the seed peel on the seedling, 2) modification of the habitat and subsequent changes in the composition of the soil microbiome. Hypothesis 1 does not explain a serious change in soil composition 3 months after sowing seeds treated by the consortium, so it was assumed that hypothesis 2 was the most likely.
Species richness of the soil microbial community (alpha diversity) was similar for all studied samples. Beta-diversity analysis revealed that the microbial diversity of three soil samples (C.bw, F.bw and Soil.bw) differed significantly from all others and were allocated to a separate cluster by NMDS in Cluster II.
At the phylum level, the number of Acidobacteriota and Firmicutes in samples from Cluster II was increased. This is consistent with the visualization of the results of comparing the union of Clusters I and III against Cluster II on the heatmap. Cluster II samples contain an increased amount of OTUs: Unclassified OBL17 (Acidobacteriota), Unclassified Blastocatellaceae (Acidobacteriota) and Unclassified uncultured (Acidobacteriota) and Unclassified Bacillus (Firmicutes). Moreover, according to the Venn diagram, Cluster II has two unique OTUs, both of which belong to the phylum Acidobacteriota, class Blastocatellia, order Blastocatellales, and family Blastocatellaceae.
Due to the difficulties of cultivation and laboratory maintenance, many classes of Acidobacteriota contain a limited number of well-characterized representatives. Due to approaches to the identification of bacteria that exclude cultivation, new classes of Acidobacteriota, called subdivisions (SDs), have been identified. Unclassified OBL17 (Acidobacteriota) [15] and Unclassified Blastocatellaceae (Acidobacteriota) [16] that distinguish Cluster II from the union of Clusters I and III in this study belong to the SD4 subtype. Lauber et al. revealed a clear correlation of the representation of Acidobacteria depending on the pH of the soil. Hartman et al. observed a strong increase in the abundance of Acidobacteria with lower pH. Their results reveal shifts in the composition of whole bacterial communities and the abundance of specific taxonomic groups with environmental gradients that may reflect changes in biogeochemical cycling [17]. Despite there are no published data on soil acidity directly for Unclassified OLB17 (Acidobacteriota) and Unclassified Blastocatellaceae (Acidobacteriota), the fact that a very high value of available phosphorus was recorded for a soil sample C.bw indirectly indicates that the pH of this sample was acidic.
It is noteworthy that the sample F.bw also fell into Cluster II, but the plants from this plot did not show such high agrotechnical indicators, and the soil did not have a high content of available phosphorus. C.bw and Soil.bw, as opposed to F.bw, included unique OTUs belonging to the Blastocatellaceae family. These bacteria are known as oligotrophic [18], demonstrate a wide range of tolerance to pH and temperature [19], and can participate in soil bioremediation [20].
It is possible that this genus of bacteria present in the original soil is suppressed when planting cultivated plants, since they were not found in any other samples. At the same time, the introduction of consortium C into buckwheat preserved the conditions for the favorable existence of the family Blastocatellaceae. Perhaps this factor is the acidic pH of the soil, since in laboratory studies, the Rothia endophytica GMG9 strain has demonstrated a high ability to immobilize phosphates, which in turn is often due to acid production. Unfortunately, the family Blastocatellaceae is mainly represented by uncultivated bacteria, and it is difficult to delineate their functions in the soil. Based on available data, it can be assumed that representatives of this family can participate in the elimination of some substances from the soil that inhibit plant growth or the accompanying beneficial microflora. Considering this scenario, the bacteria introduced through inoculation might have a more enduring effect in such an environment.
It is interesting to note that the soil microbiome following the introduction of consortium C aligned with a soil sample taken from a plot where no crop was grown. This suggests that the addition of Consortium C potentially conserved the original microbial community of the soil. At the same time, the buckwheat harvest was higher than in all other plots. It can be assumed that the planted plant secretes some substances into the soil that modify the microbial community, adjusting it to the needs of the plant, but at the same time suppressing the growth of some important bacteria that help enrich the soil with nutrients. In the case of consortium C, the introduced bacteria either neutralized this action or "protected" the family Blastocatellaceae bacteria from it, which allowed them (or some other bacteria) to survive and further have a beneficial effect on the plant. This may also explain the specific manifestation of the consortium C effect only on buckwheat, since different plants most likely possess their own array of such metabolites.
Therefore, this study showed that under the conditions of natural gray forest soils, the introduction of consortia of bacteria beneficial to plants did not have a significant effect on the growth and yield of wheat, corn, and buckwheat. The only successful result (consortium C for buckwheat) showed that when selecting microorganisms for the creation of microbial fertilizers, it is important to take into account not only the characteristics of the soil but also the characteristics of the plant, which can affect the survival of beneficial bacteria in the rhizosphere. It was also shown that such a favorable result was associated with a significant increase in the availability of phosphates in the soil, which can be attributed both to the direct action of a consortium of phosphate-immobilizing and nitrogen-fixing bacteria and to acidification of the medium due to an increase in phylum Acidobacteriota bacteria in the soil. Analysis of the soil microbiota after the introduction of consortia showed that the addition of consortium C during buckwheat cultivation led to the preservation of the original soil microbiome. This preservation might be the cause behind the high yield in this plot, suggesting it could be another mechanism by which beneficial bacteria contribute to plant growth.
4. Materials and Methods

4.1. Designing bacterial consortia

Twenty consortia of 2-3 bacteria were used for the study (Table 1). For ease of citation, these twenty consortia are coded with letters of the Latin alphabet from A to T. All consortia included microorganisms from the collection (Center of Applied Microbiology of the Institute of Chemical Biology and Fundamental Medicine (ICBFM), Novosibirsk, Russia) that showed the best results in tests of phosphate solubilization or the ability to grow in a nitrogen-free environment and ammonia production. Seven consortia were based on Pseudomonas koreensis GMG11 strain with high phosphate-immobilizing capacity (294.8 µg/ml), in six of them also included various strains with a high ability to grow on a nitrogen-free medium (A, D, M, P, S, T), and in one the strain with a high production of auxin (Q). Another 6 consortia (K, B, I, L, O, R) were based on the Rahnella aceris GMG294 strain with a high phosphate-immobilizing ability (214.0 µg/ml), to which different strains with a high ability to grow on a nitrogen-free medium were also added. Also, four consortia were based on Pseudomonas strains that demonstrated high siderophore production values (F, G, E, N) with the addition of either phosphate-immobilizing (F, G) or nitrogen-fixing (E, N) bacteria. All the consortia described above are composed of bacteria belonging to the Pseudomonadota phylum, three more consortia were composed based on strains from another phylum – Actinomycetota (C,H,J). Consortia C and H based on Rothia endophytica GMG9 with high phosphate-immobilizing ability (248.3 µg/ml), with the addition of nitrogen-fixing bacterium Azotobacter chroococcum GMG39 (C) or a strain with high antifungicidal activity Enterobacter amnigenus GMG288 (H). Consortium J based on the nitrogen-fixing strain of Rhodococcus erythropolis GMG21 with the addition of the phosphate-immobilizing strain Pseudomonas koreensis GMG11. When composing combinations, preliminary experiments were carried out on the antagonistic activity of strains so that growth suppression did not occur.
Table 1. Bacterial strains included in the formed consortia.
Consortium Code A strain with a high ability to grow in a nitrogen-free environment Strains with a high ability to solubilize phosphates Strain with a high production of auxin Strain with a high production of siderophore or antifungal activity
based on Pseudomonas koreensis GMG11
А Pseudomonas koreensis GMG11
D Azotobacter chroococcum GMG39 Pseudomonas koreensis GMG11
M Enterobacter cloacae GMG24 Pseudomonas koreensis GMG11
P Rahnella aquatilis GMG287 Pseudomonas koreensis GMG11
S Hylemonella gracilis GMG31 Pseudomonas koreensis GMG11
T Agrobacterium arsenijevicii GMG33 Pseudomonas koreensis GMG11
Q Pseudomonas koreensis GMG11 Enterobacter ludwigii GMG278
based on the Rahnella aceris GMG294
K Rahnella aceris GMG294
В Azotobacter chroococcum GMG39 Rahnella aceris GMG294
I Variovorax paradoxus Rahnella aceris GMG294
L Enterobacter cloacae GMG24 Rahnella aceris GMG294
O Hylemonella gracilis GMG31 Rahnella aceris GMG294
R Pantoea agglomerans GMG20 Rahnella aceris GMG294
based on strains with "antibiotic" qualities
E Azotobacter chroococcum GMG39 Pseudomonas kitaguniensis GMG234
N Enterobacter cloacae GMG24 Pseudomonas kitaguniensis GMG234
F Pseudomonas kitaguniensis GMG14 Pseudomonas silesiensis GMG271
G Pseudomonas kitaguniensis GMG14 Pseudomonas kitaguniensis GMG219
based on strains Pseudomonadota and Actinomycetota
C Azotobacter chroococcum GMG39 Rothia endophytica GMG9
H Rothia endophytica GMG9 Enterobacter amnigenus GMG288
J Rhodococcus erythropolis GMG21 Pseudomonas koreensis GMG11

4.2. Description of the field experiment

The effect of bacterial inoculation on plant growth was studied on three significant crops: corn, buckwheat, wheat. All the selected seeds were surface sterilized by 1% NaOCl for 90 seconds and two consecutive rinses in sterile distilled water, followed by air drying under laminar air flow. Bacterial cultures were grown in 50 mL falcon tubes filled with 10 mL LB broth and were kept on shaker at 200 rpm for 48 h and was diluted to adjust 108 cfu/ml bacterial solutions with sterile distilled water. Seeds were coated with culture by immersion in a suspension of bacteria for 120 mins. This experiment was carried out in three replications and the results were compared with control seeds treated with water instead of a bacterial isolate. 5 seeds were placed in each plot to a depth of 2-3 cm. The experiment lasted 90 days, until the grain matured. The experiment was set up in randomized design was used, with three biological replications.
The soils on which small-scale field experiments were carried out belong to the type of gray forest soils. Within the Novosibirsk region, gray forest soils are found in the forest-steppe zone, the taiga subzone and much less often in the southern taiga subzone. In the right-bank part of the Siberian district (the Salair drained plain, the foothills of the Salair ridge), gray forest soils occupy about 1,250 thousand hectares in such administrative districts as Novosibirsk, Maslyaninsky and Iskitimsky, which is more than 50% of all land. In the left-bank part, gray forest soils are much less common and occupy about 50 thousand hectares, mainly in the northern part of the Priobsky plateau and in places in the north of the Barabinsk and south of the Privasyugan lowland plains (Kolyvan, Mikhailovsky, Severny, Kyshtovsky administrative districts). The total area of gray forest soils in the region is about 1.3 million hectares (7.8% of all land). Gray forest soils are formed on elevated landforms with well-provided surface runoff and relatively deep groundwater levels. Natural vegetation is mainly represented by small-leaved birch and birch-aspen forests and meadow steppes.

4.3. Determination of chemical parameters of the soil

Soil samples were analyzed for the content of available phosphorus (AP), exchangeable potassium (Ex-K), available nitrogen (AN-NO3, AN-NH4), soil organic (SOC) and soil inorganic carbon (SIC) with different protocols [21]:
(1)
soil organic carbon – 0.1–0.2 g soil, reaction with 0.4 N K2Cr2O7 in mixture with H2SO4;
(2)
available phosphorus – 20 g soil extracted by 0.03 N K2SO4, 5 min reaction time;
(3)
exchangeable potassium – 5 g soil < 1.0 mm, extracted by 50 ml of CH3COONH4, pH=7, 1 h reaction time.
The labile forms of macronutrients (AN-NO3, AN-NH4) were determined by conservative methods described by Maynard and coauthors [22]. Briefly, the quantity of nitrate was determined potentiometrically after extraction of 2 g of the dry cadaver material by 20 mL of 0.03M K2SO4. Ammonium content was determined colorimetrically after extraction of 2.5 g of the cadaver material by 50 mL of the 2N KCl. Each treatment was replicated three times.
The content of soil organic (SOC) and soil inorganic carbon (SIC) were determined by stepwise loss on ignition method using 2-4 g soil aliquots [23].

4.4. Determination of the yield of buckwheat, wheat and corn

To assess the yield of crops grown as part of the experiment, the following parameters were recorded: plant height, mass of dry straw, mass of grain from the plot, mass of dry roots. The height of the plants was measured after 2, 4 and 6 weeks. The mass of dry roots, the mass of straw and the mass of grain were measured after the harvest in three months. For grain, the average weight from three plots was estimated (mean and SD), as well as the average amount of grain per plot, taking into account fallen grain, calculated as the sum of the weight of grain from three plots and fallen grain divided by three.

4.5. Soil DNA extraction and NGS-sequencing

4.5.1. DNA extraction

Total DNA from 0.5g soil was extracted using MagBeads FastDNATM Kit for Soil (MP Biomedicals, USA) as recommended by the manufacturer. DNA quantity was estimated by Qubit 4.0 (Invitrogen/Life Technologies USA).

4.5.2. Sequencing of 16S rRNA gene libraries

The purified DNA isolates were amplified with primers previously developed by us Artik-FF (5'- GTGACTGGAGTTCAGACGTGTGCTCTTCCGATCTCTACGGGAGGCAGCAG-3') and (Artik-FR 5'-ACTCTTTCCCTACACGACGCTCTTCCGATCTGGACTACCGGGGTATCT-3') targeting variable regions V3–V4 of bacterial and archaeal 16S rRNA genes. PCR was carried out in a 25 μl reaction mixture containing 1 units Q5 Hot Start High-Fidelity DNA Polymerase and Q5 Reaction Buffer (New England Biolabs, USA), 10 pM of each primer, 2 ng of DNA matrix and 2 nM of each dNTP and fluorescent dye SYBR Green. Amplification was performed in an CFX96 (Bio-Rad, USA) under the following conditions: initial denaturation for 3 min at 96°C then 40 cycles consisting of denaturation at 95°C for 10 s, then annealing of primers at 55°C for 30 s and subsequent elongation at 72°C for 30 s The final elongation was carried out at 72°C for 5 min. Visualization of PCR products was carried out by gel electrophoresis in agarose gels in the presence of ethidium bromide. PCR products were purified according to the recommended Illumina technique using AM Pure XP (Beckman Coulter Life Sciences, USA). DNA concentration in solutions was determined using a desktop fluorimeter Qubit 4.0 (Invitrogen/Life Technologies USA). To do this, we used the Qubit dsDNA HS Assay Kit according to the protocol. Enrichment was carried out using PCR. A set of oligonucleotides Multiplex Oligos for Illumina Dual Index Primer Set 1 (New England Biolabs, USA) was used as primers. PCR was carried out in a 25 μl reaction mixture containing 1 units Q5 Hot Start High-Fidelity DNA Polymerase and Q5 Reaction Buffer (New England Biolabs, USA), 10 pM of each primer, DNA matrix and 2 nM of each dNTP and fluorescent dye SYBR Green. Amplification was performed in an CFX96 (Bio-Rad, USA) under the following conditions: initial denaturation for 30 s at 98°C then 12 cycles consisting of denaturation at 98 °C for 10 s, then annealing of primers and elongation at 65°C for 75 s. The final elongation was carried out at 65°C for 5 min. Then PCR products were purified according to the recommended Illumina technique using AM Pure XP (Beckman Coulter Life Sciences, USA). To create a single pool of all libraries, we calculated how much of each library should be taken to get the same amount of DNA in nanograms. Calculations were made based on the concentrations of DNA in the enriched libraries measured using the Qubit 4.0 desktop fluorimeter. To quantify amplicon libraries, the Real-Time PCR method was used with the addition of a TaqMan probe with a ROX dye label (Syntol, Russia) and oligonucleotides complementary to the end sequences of libraries. As a quantitative standard, PhiX-control was used, diluted 10, 100, 1000 and 10000 times. The concentration of the library pool was determined by the location of the fluorescence signal accumulation curve relative to the control samples. The 16S rRNA gene amplicons was sequenced in paired-end mode (2 × 301) with the Illumina MiSeq v3 (600 cycles) kit (Illumina, USA) on a MiSeq at the Sirius University of Science and Technology (Sirius, Russia).

4.6. Statistical analysis

The yield of plants is expressed in terms of the mean and SD. Visualization is done using function ggplot () in R.
Analysis of 16S ribosomal RNA gene sequences was performed using QIIME 2 v.2023.7 (https://qiime2.org) [24]. Sequences quality control, merging of paired-end reads and chimera filtering was done with Deblur plugin [25]. Operational Taxonomic Units (OTUs) were clustered applying VSEARCH plugin [26] with cluster-features-closed-reference using dbSilva 138 SSURef NR99 [27] with 97% identity. The taxonomy assignment was performed using global search alignment (feature-classifier classify-sklearn). Since, according to the recommendations, the accuracy of the taxonomic classification of 16S rRNA gene sequences increases when the naive Bayesian classifier is trained only in that area of the target sequences, which was sequenced, then as a classifier we used our own trained naive Bayesian classifier obtained using the SILVA database reference sequences limited to the sequences of primers used for sequencing as describe (https://docs.qiime2.org/2023.9/tutorials/feature-classifier/). To generate a rooted phylogenetic tree was used align-to-tree-mafft-fasttree pipeline from the q2-phylogeny plugin. The resolution curves were constructed using the diversity alpha-rarefaction plugin
The description and visualization of alpha and beta diversity was performed using following packages in R: phyloseq [28], DESeq2 [29], ComplexHeatmap [30].

Supplementary Materials

The following supporting information can be downloaded at the website of this paper posted on Preprints.org.

Author Contributions

Conceptualization, Elena Voronina, Ekaterina Sokolova and Natalia Smirnova; statistical data analysis and visualisation, Ekaterina Sokolova; work with microorganisms Irina Tromenschleger; preparation of 16S rRNA gene libraries Olga Mishukova, Inna Hlistun, Artem Tikunov; NGS-sequencing, Andrey Manakhov; work with plants, Oleg Savenkov; soil analysis, Maria Buyanova and Ilya Ivanov. All authors have read and agreed to the published version of the manuscript.

Funding

This research was funded by the Ministry of Science and Higher Education of the Russian Federation, agreement No. 075-15-2021-1085.

Data Availability Statement

Data are contained within the article and supplementary materials.

Conflicts of Interest

The authors declare no conflict of interest.

References

  1. Richardson AE, Barea J-M, McNeill AM, Prigent-Combaret C. Acquisition of phosphorus and nitrogen in the rhizosphere and plant growth promotion by microorganisms. Plant Soil. 2009;321: 305–339. [CrossRef]
  2. Jeon JS, Lee SS, Kim HY, Ahn TS SH. Plant Growth Promotion in Soil by Some Inoculated Microorganisms. J Microbiol. 2003;41: 271–276.
  3. Timmusk, S. , Nicander, B., Granhall, U., Tillberg E. Cytokinin produc-tion by Paenibacillus polymyxa. Soil Biol Biochem. 1999;31: 1847–1852. [CrossRef]
  4. Gutie´rrez-Man˜ero, F.J. , Ramos-Solano, B., Probanza, A., Mehouachi, J., Tadeo, F.R., Talon M. The plant-growth-promoting rhizobacteria Bacilluspumilus and Bacillus licheniformis produce high amounts of physiologi-cally active gibberellins. Physiol Plant. 111AD; 206–211. [CrossRef]
  5. Kloepper JW, Leong J, Teintze M, Schroth MN. Enhanced plant growth by siderophores produced by plant growth-promoting rhizobacteria. Nature. 1980;286: 885–886. [CrossRef]
  6. Yu X, Liu X, Zhu T-H, Liu G-H, Mao C. Co-inoculation with phosphate-solubilzing and nitrogen-fixing bacteria on solubilization of rock phosphate and their effect on growth promotion and nutrient uptake by walnut. Eur J Soil Biol. 2012;50: 112–117. [CrossRef]
  7. Wani PA, Khan MS, Zaidi A. Synergistic effects of the inoculation with nitrogen-fixing and phosphate-solubilizing rhizobacteria on the performance of field-grown chickpea. J Plant Nutr Soil Sci. 2007;170: 283–287. [CrossRef]
  8. Zhan Y, Xu S, Hou Z, Gao X, Su J, Peng B, et al. Co-inoculation of phosphate-solubilizing bacteria and phosphate accumulating bacteria in phosphorus-enriched composting regulates phosphorus transformation by facilitating polyphosphate formation. Bioresour Technol. 2023;390: 129870. [CrossRef]
  9. Jabborova D, Kannepalli A, Davranov K, Narimanov A, Enakiev Y, Syed A, et al. Co-inoculation of rhizobacteria promotes growth, yield, and nutrient contents in soybean and improves soil enzymes and nutrients under drought conditions. Sci Rep. 2021;11: 22081. [CrossRef]
  10. Wang Z, Chen Z, Fu X. Integrated Effects of Co-Inoculation with Phosphate-Solubilizing Bacteria and N2-Fixing Bacteria on Microbial Population and Soil Amendment Under C Deficiency. Int J Environ Res Public Health. 2019;16: 2442. [CrossRef]
  11. Kundu, B.S. and Gaur AC. Establishment of nitrogen-fixing and phosphate-solubilising bacteria in rhizosphere and their effect on yield and nutrient uptake of wheat crop. Plant Soil. 1980; 223–230. [CrossRef]
  12. A.A. Belimov APK and CVC. Interaction between barley and mixed cultures of nitrogen fixing and phosphate-solubilizing bacteria. Plant Soil. 1995;173: 29–37. [CrossRef]
  13. V. SA. Agrokhimicheskiye metody issledovaniya pochv. Moscow: Agrochemical. Methods of Soil Studies],. Nauka.; 1975.
  14. Maynard, D.G. , Kalra Y.P. CJA. Nitrate and exchangeable ammonium nitrogen. Soil Sampl. Methods Anal. Second Ed. CRC Press; 2007.
  15. Wang, Q. , Li Y. WY. Optimizing the weight loss-on-ignition methodology to quantify organic and carbonate carbon of sediments from diverse sources. Environ Monit Assess Env Monit Assess. 2011;174: 241–257. [CrossRef]
  16. Caporaso JG, Kuczynski J, Stombaugh J, Bittinger K, Bushman FD, Costello EK, et al. QIIME allows analysis of high-throughput community sequencing data. Nat Methods. 2010;7: 335–336. [CrossRef]
  17. Amir A, McDonald D, Navas-Molina JA, Kopylova E, Morton JT, Zech Xu Z, et al. Deblur Rapidly Resolves Single-Nucleotide Community Sequence Patterns. Gilbert JA, editor. mSystems. 2017;2. [CrossRef]
  18. Rognes T, Flouri T, Nichols B, Quince C, Mahé F. VSEARCH: a versatile open source tool for metagenomics. PeerJ. 2016;4: e2584. [CrossRef]
  19. Quast C, Pruesse E, Yilmaz P, Gerken J, Schweer T, Yarza P, et al. The SILVA ribosomal RNA gene database project: improved data processing and web-based tools. Nucleic Acids Res. 2012;41: D590–D596. [CrossRef]
  20. McMurdie PJ, Holmes S. phyloseq: An R Package for Reproducible Interactive Analysis and Graphics of Microbiome Census Data. Watson M, editor. PLoS One. 2013;8: e61217. [CrossRef]
  21. A, V.K. K, P.M.M. R, K.S. R, J. R. Multiple sclerosis: The disease and its manifestations. Indian J Pharmacol. 2002;34: 3–15. [CrossRef]
  22. Gu Z, Eils R, Schlesner M. Complex heatmaps reveal patterns and correlations in multidimensional genomic data. Bioinformatics. 2016;32: 2847–2849. [CrossRef]
  23. Janati W, Benmrid B, Elhaissoufi W, Zeroual Y, Nasielski J, Bargaz A. Will Phosphate Bio-Solubilization Stimulate Biological Nitrogen Fixation in Grain Legumes? Front Agron. 2021;3. [CrossRef]
  24. Xiong Z-J, Zhang J-L, Zhang D-F, Zhou Z-L, Liu M-J, Zhu W-Y, et al. Rothia endophytica sp. nov., an actinobacterium isolated from Dysophylla stellata (Lour.) Benth. Int J Syst Evol Microbiol. 2013;63: 3964–3969. [CrossRef]
  25. Sinninghe Damsté JS, Rijpstra WIC, Foesel BU, Huber KJ, Overmann J, Nakagawa S, et al. An overview of the occurrence of ether- and ester-linked iso-diabolic acid membrane lipids in microbial cultures of the Acidobacteria: Implications for brGDGT paleoproxies for temperature and pH. Org Geochem. 2018;124: 63–76. [CrossRef]
  26. Dedysh SN, Sinninghe Damsté JS. Acidobacteria. eLS. Wiley; 2018. pp. 1–10. [CrossRef]
  27. Hartman WH, Richardson CJ, Vilgalys R, Bruland GL. Environmental and anthropogenic controls over bacterial communities in wetland soils. Proc Natl Acad Sci. 2008;105: 17842–17847. [CrossRef]
  28. Ivanova AA, Zhelezova AD, Chernov TI, Dedysh SN. Linking ecology and systematics of acidobacteria: Distinct habitat preferences of the Acidobacteriia and Blastocatellia in tundra soils. Ma Y, editor. PLoS One. 2020;15: e0230157. [CrossRef]
  29. J. Pascual, P.K. J. Pascual, P.K. Wust, A. Geppert, B.U. Foesel, K.J. Huber, Overmann J. Novel isolates double the number of chemotrophic species and allow the first description of higher taxa in Acidobacteria subdivision 4. Syst Appl Microbiol. 2015. [CrossRef]
  30. Huber, K.J. , Geppert A.M., Groß U., Luckner M., Wanner G., Cooper P., Abakah J., Janssen I. OJ. Aridibacter nitratireducens sp. nov., a member of the family Blastocatellaceae, class Blastocatellia, isolated from an African soil. Int J Syst Evol Microbiol. 2017;67. [CrossRef]
Figure 1. Buckwheat’s height on 2, 4 and 6 weeks. The red line corresponding on 2 weeks of growing, the green one - 4 weeks, and the blue one - 6 weeks of growing. Dots are the mean equal, whiskers are the SD. Orange line corresponds the mean height of control plants after 6 weeks, the blue ones -SD. ^ - marked plot of consortia, which has shown maximal additional growing versus control.
Preprints 93783 g001
Figure 3. The influence of consortia on weight of buckwheat straw and roots. The white dots are the mean weight of straw, whiskers are the SD. The blue dots are the mean of dry roots. The blue line corresponds the mean weight of dry roots.
Preprints 93783 g003
Figure 8. The heatmap of differentially abundant taxa between the samples of cluster II and union of clusters I and III.
Preprints 93783 g008
Figure 9. The heatmap of differentially abundant taxa between the C.bw sample and all other samples.
Preprints 93783 g009
Figure 11. The available soil nutrients and carbon content on the buckwheat’s plots (a) nutrients, (b) carbon content.
Preprints 93783 g011
Figure 12. Comparison of bacterial OTU between clusters using Venn diagrams. (a) Cluster II vs. Cluster I and III, (b) C.bw vs. other samples.
Preprints 93783 g012
Disclaimer/Publisher’s Note: The statements, opinions and data contained in all publications are solely those of the individual author(s) and contributor(s) and not of MDPI and/or the editor(s). MDPI and/or the editor(s) disclaim responsibility for any injury to people or property resulting from any ideas, methods, instructions or products referred to in the content.
Copyright: This open access article is published under a Creative Commons CC BY 4.0 license, which permit the free download, distribution, and reuse, provided that the author and preprint are cited in any reuse.
Prerpints.org logo

Preprints.org is a free preprint server supported by MDPI in Basel, Switzerland.

Subscribe

© 2024 MDPI (Basel, Switzerland) unless otherwise stated