Submitted:
20 December 2023
Posted:
21 December 2023
You are already at the latest version
Abstract
Keywords:
1. Introduction
2. Materials and Methods
2.1. Plant Material
2.2. Growth Condition and Experiment Design
2.3. Leaf Relative Water Content
2.4. Gas Exchange Measurements
2.5. Content of Photosynthetic Pigments
2.6. Vegetative Growth Measurements
2.7. Metabolite Analysis
2.8. Statistical Analysis
3. Results
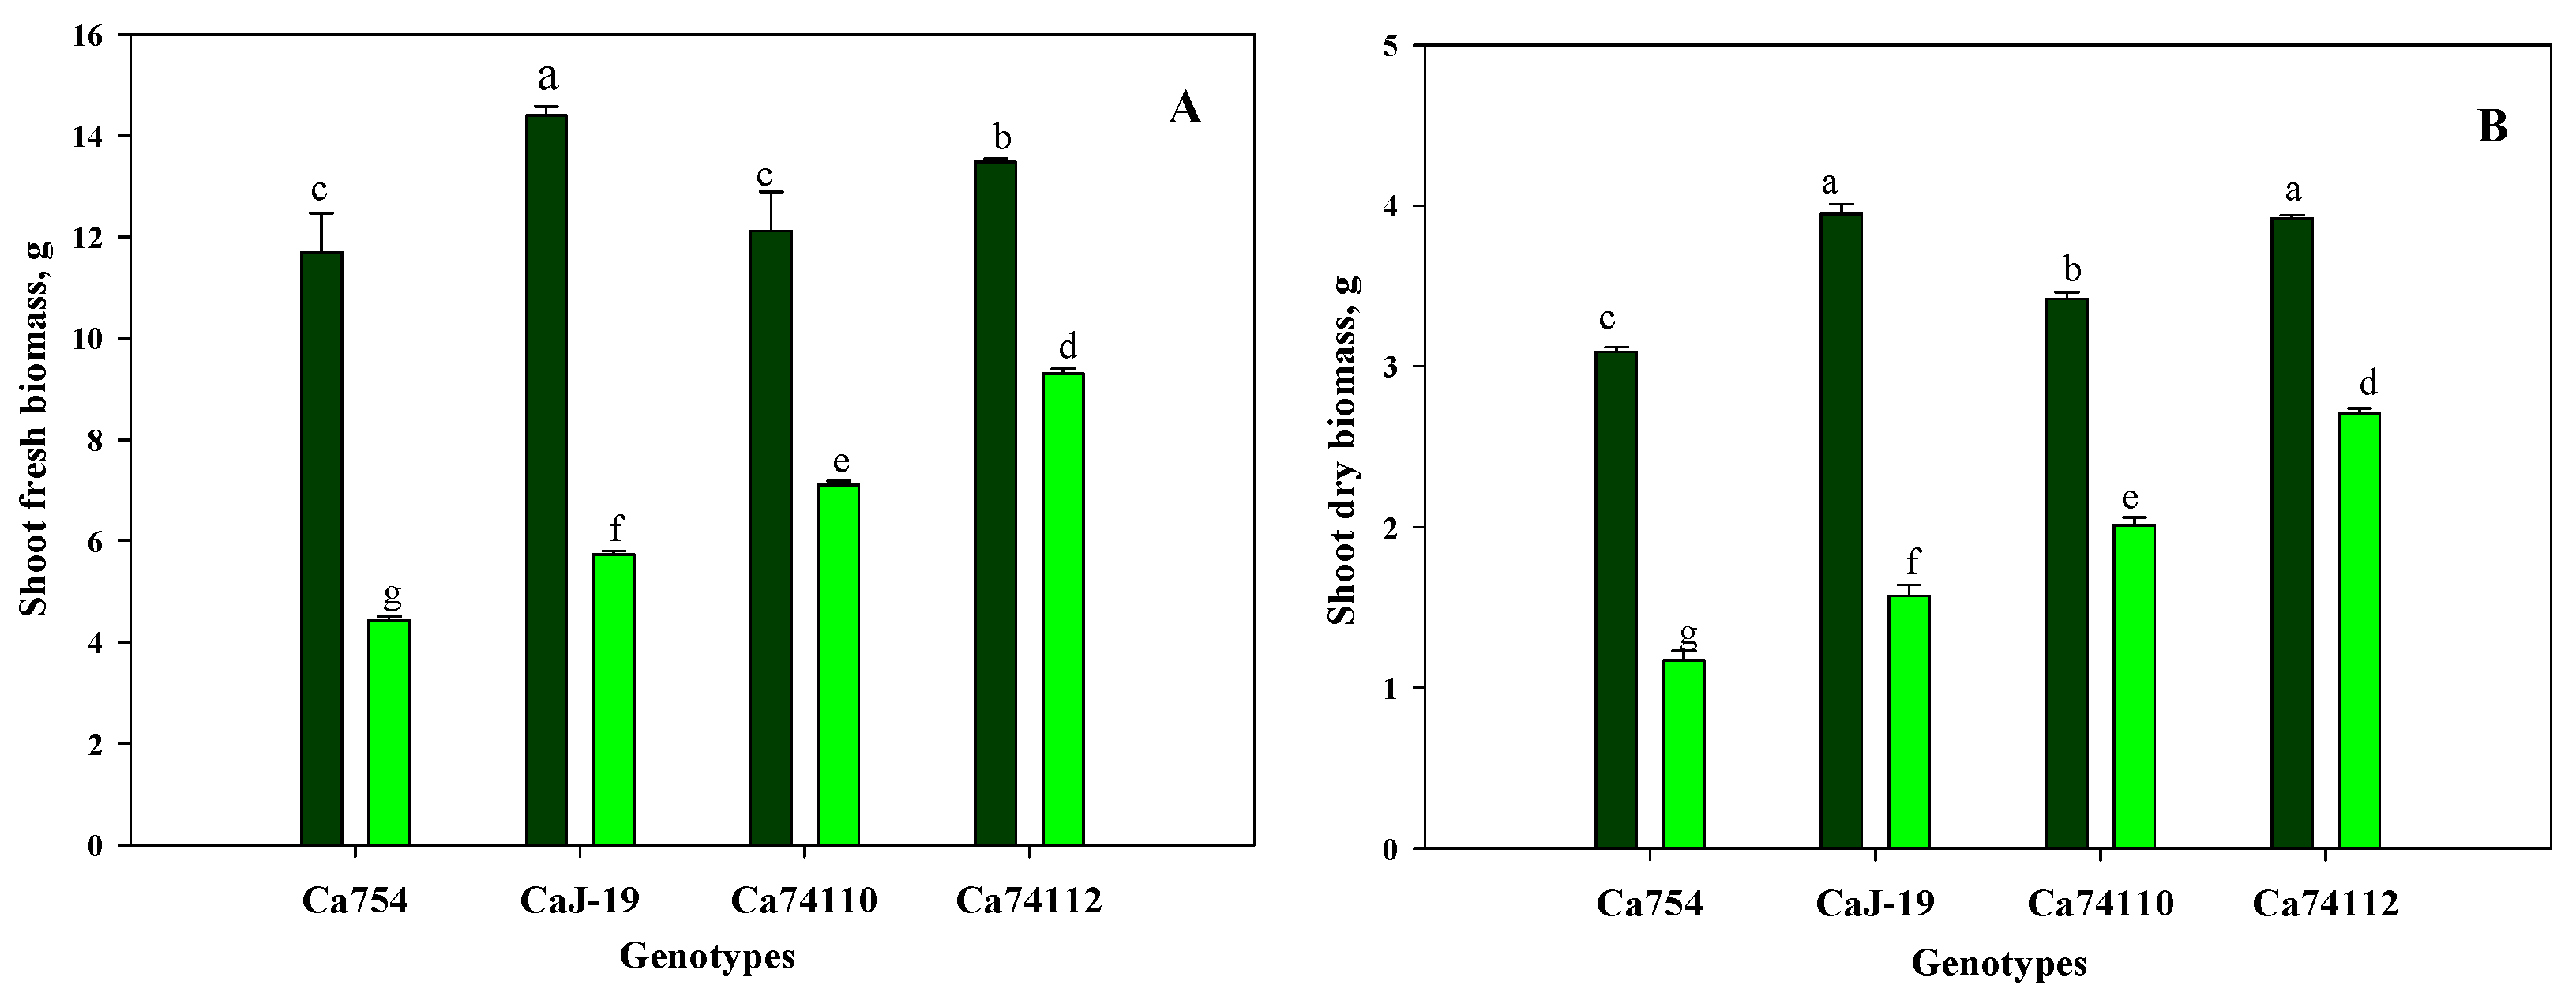
3.1. Shoot Growth and Biomass Were Affected by Drought Stress Treatments
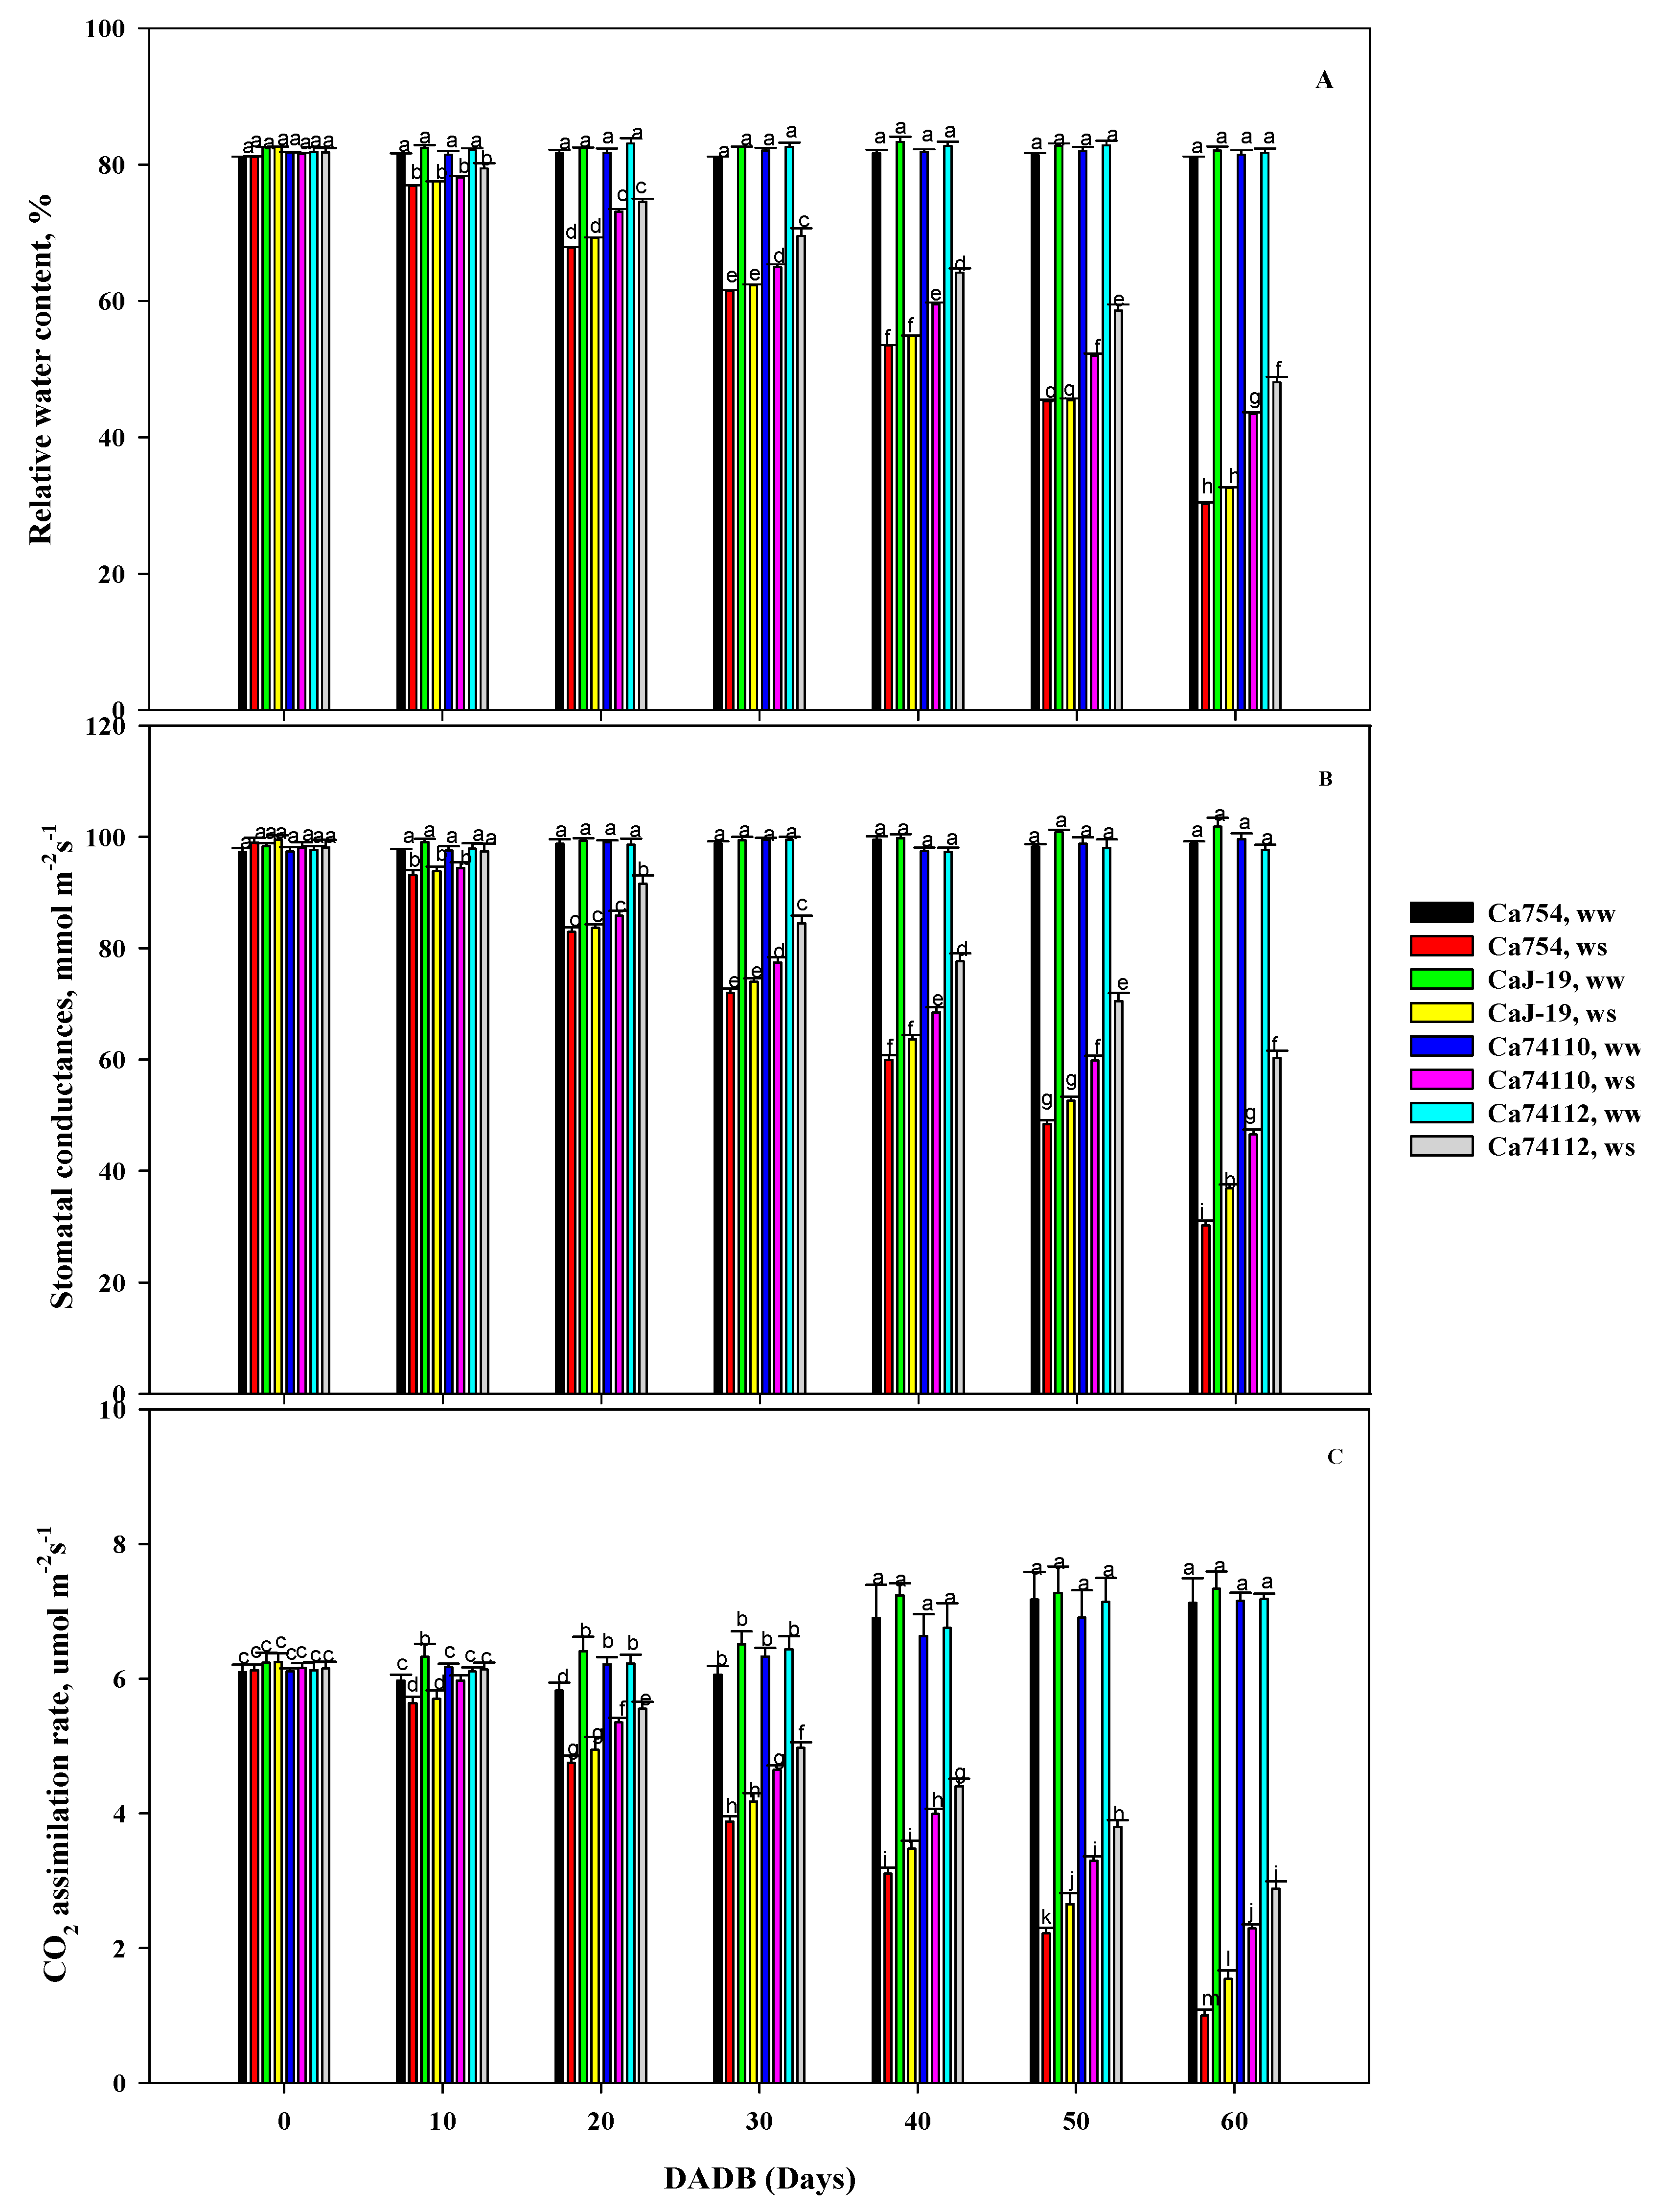
3.2. Difference of Relative Water Content among Coffee Genotypes under Drought Stress
3.3. Influence of Drought Stress in Stomatal Conductance among the Coffee Genotypes
3.4. Drought Stress Associated Variation in Carbon Assimilation among Coffee Genotypes
3.5. Variations of Photosynthetic Pigments under Drought Stress among Coffee Genotypes
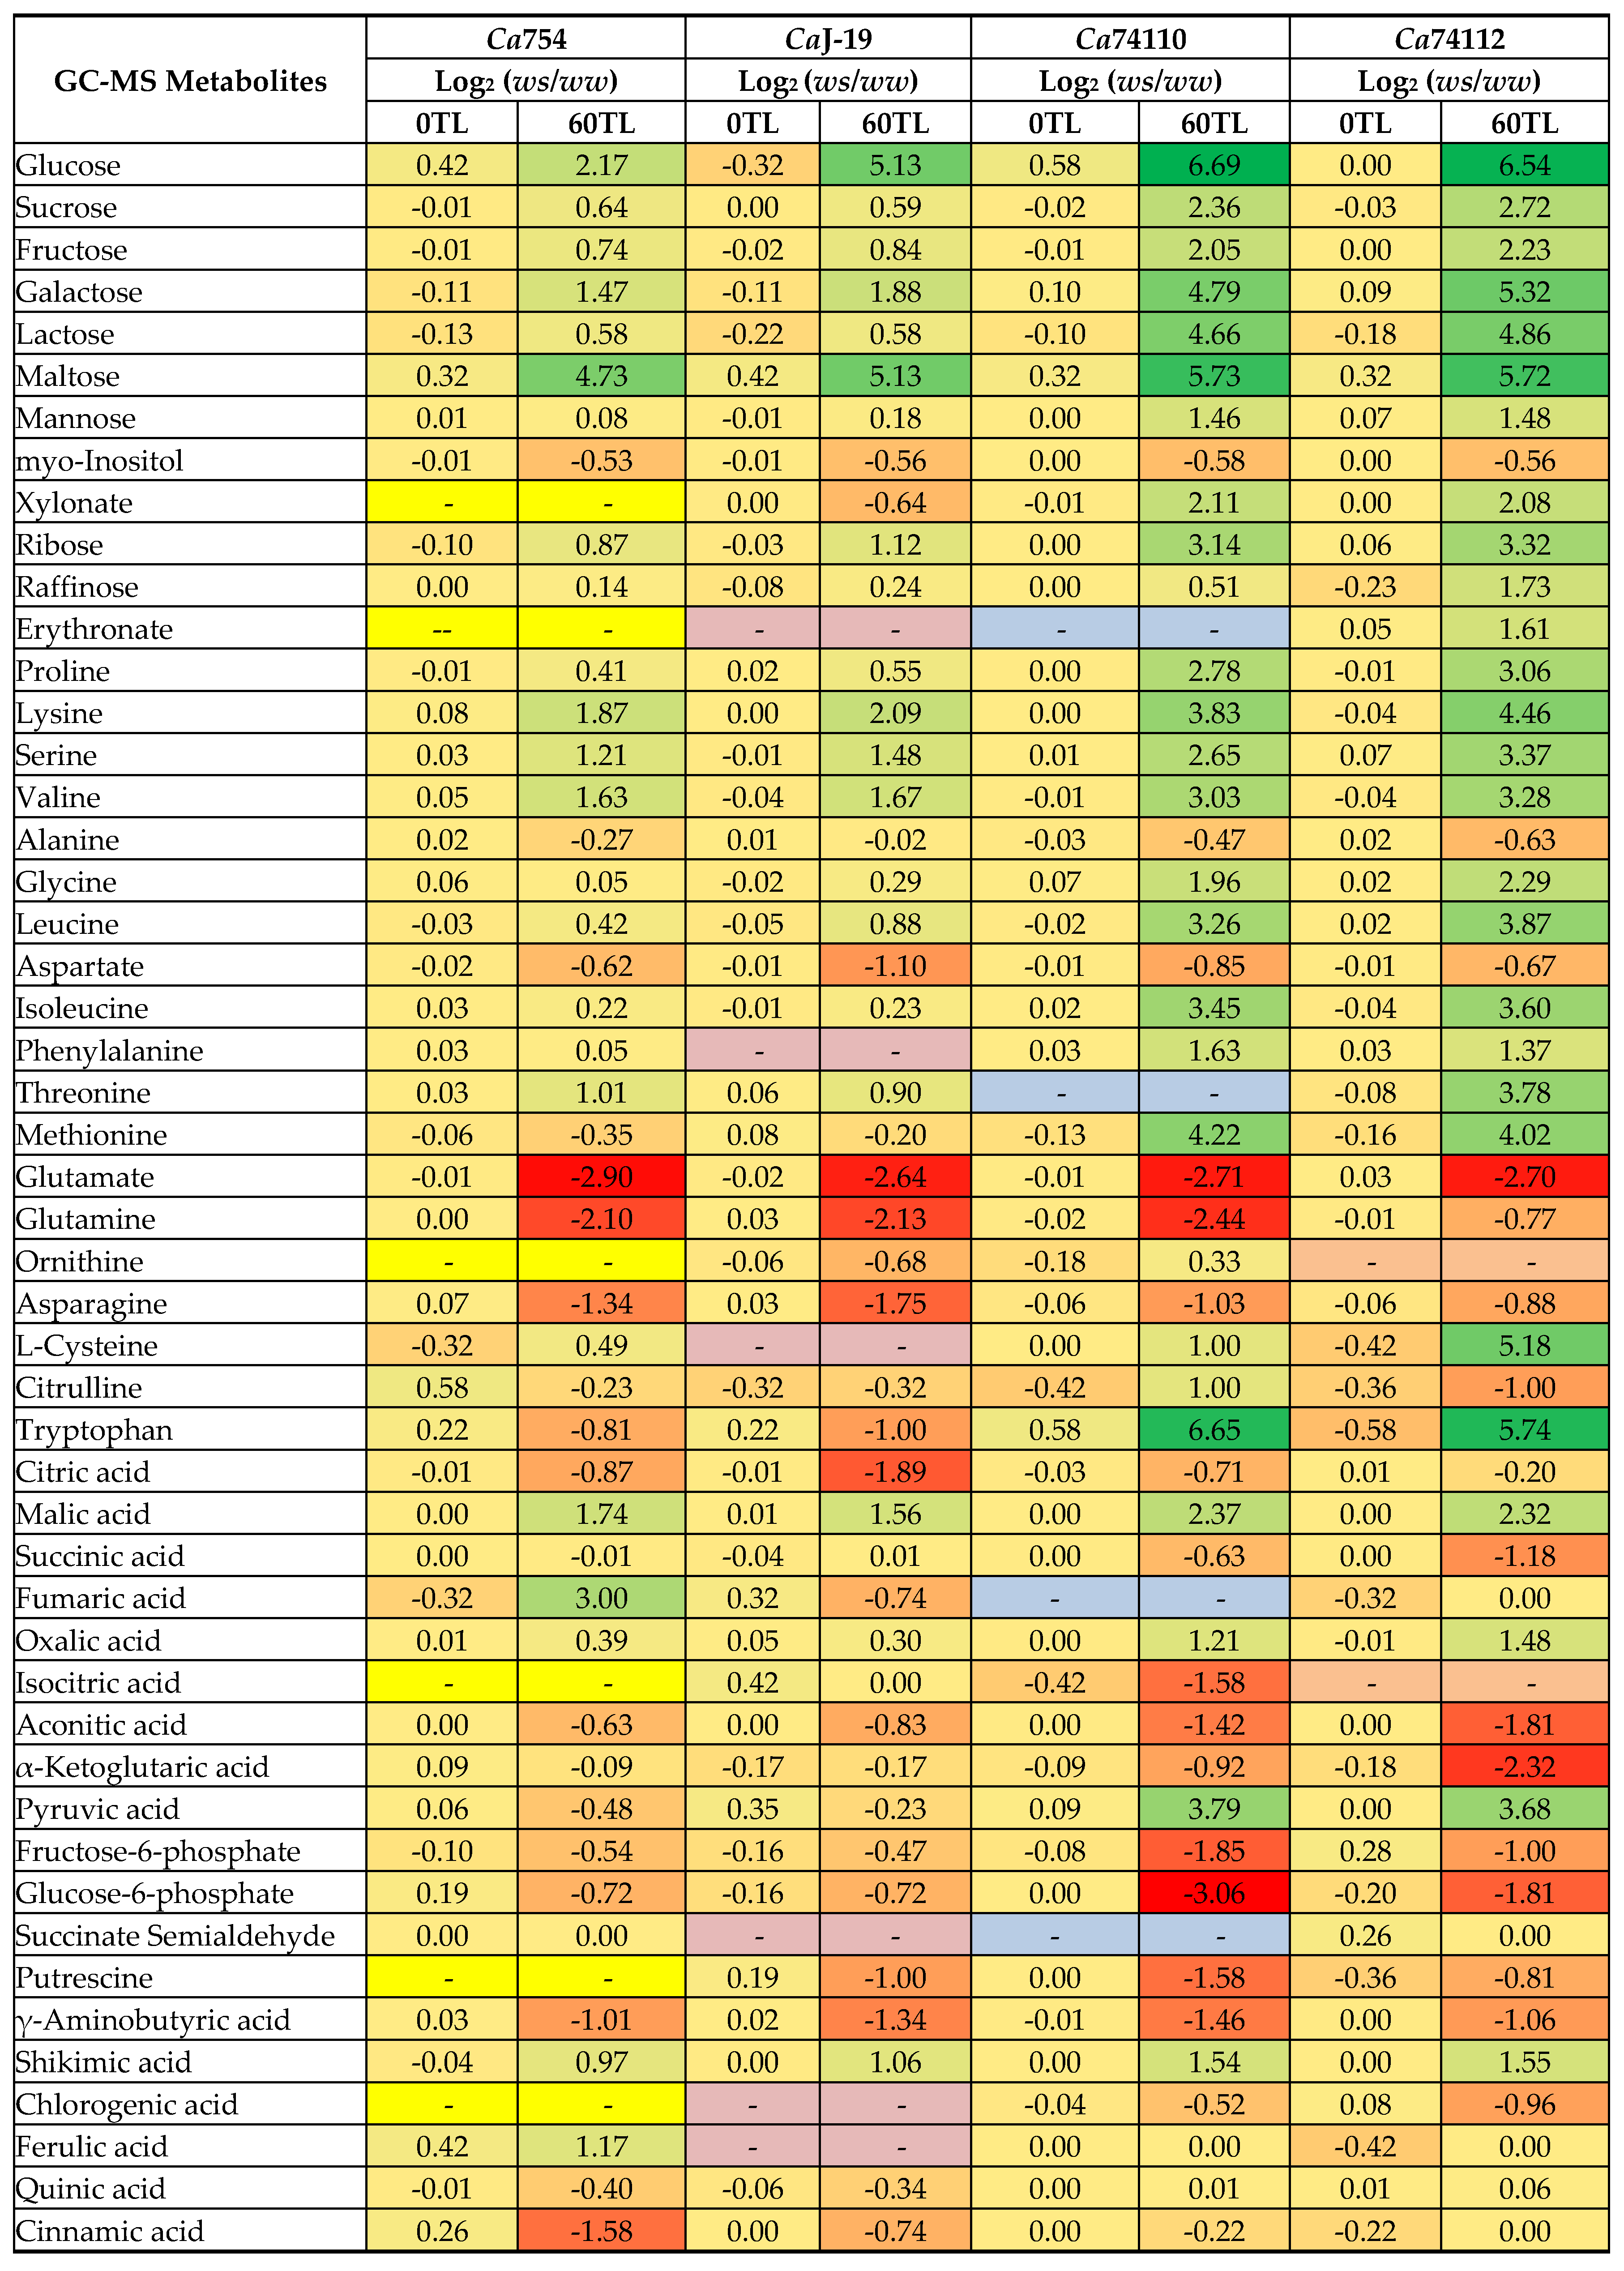
3.6. Alteration of Metabolites under Drought Stress Conditions
3.7. Correlation of Specific Metabolites with Growth And Physiology
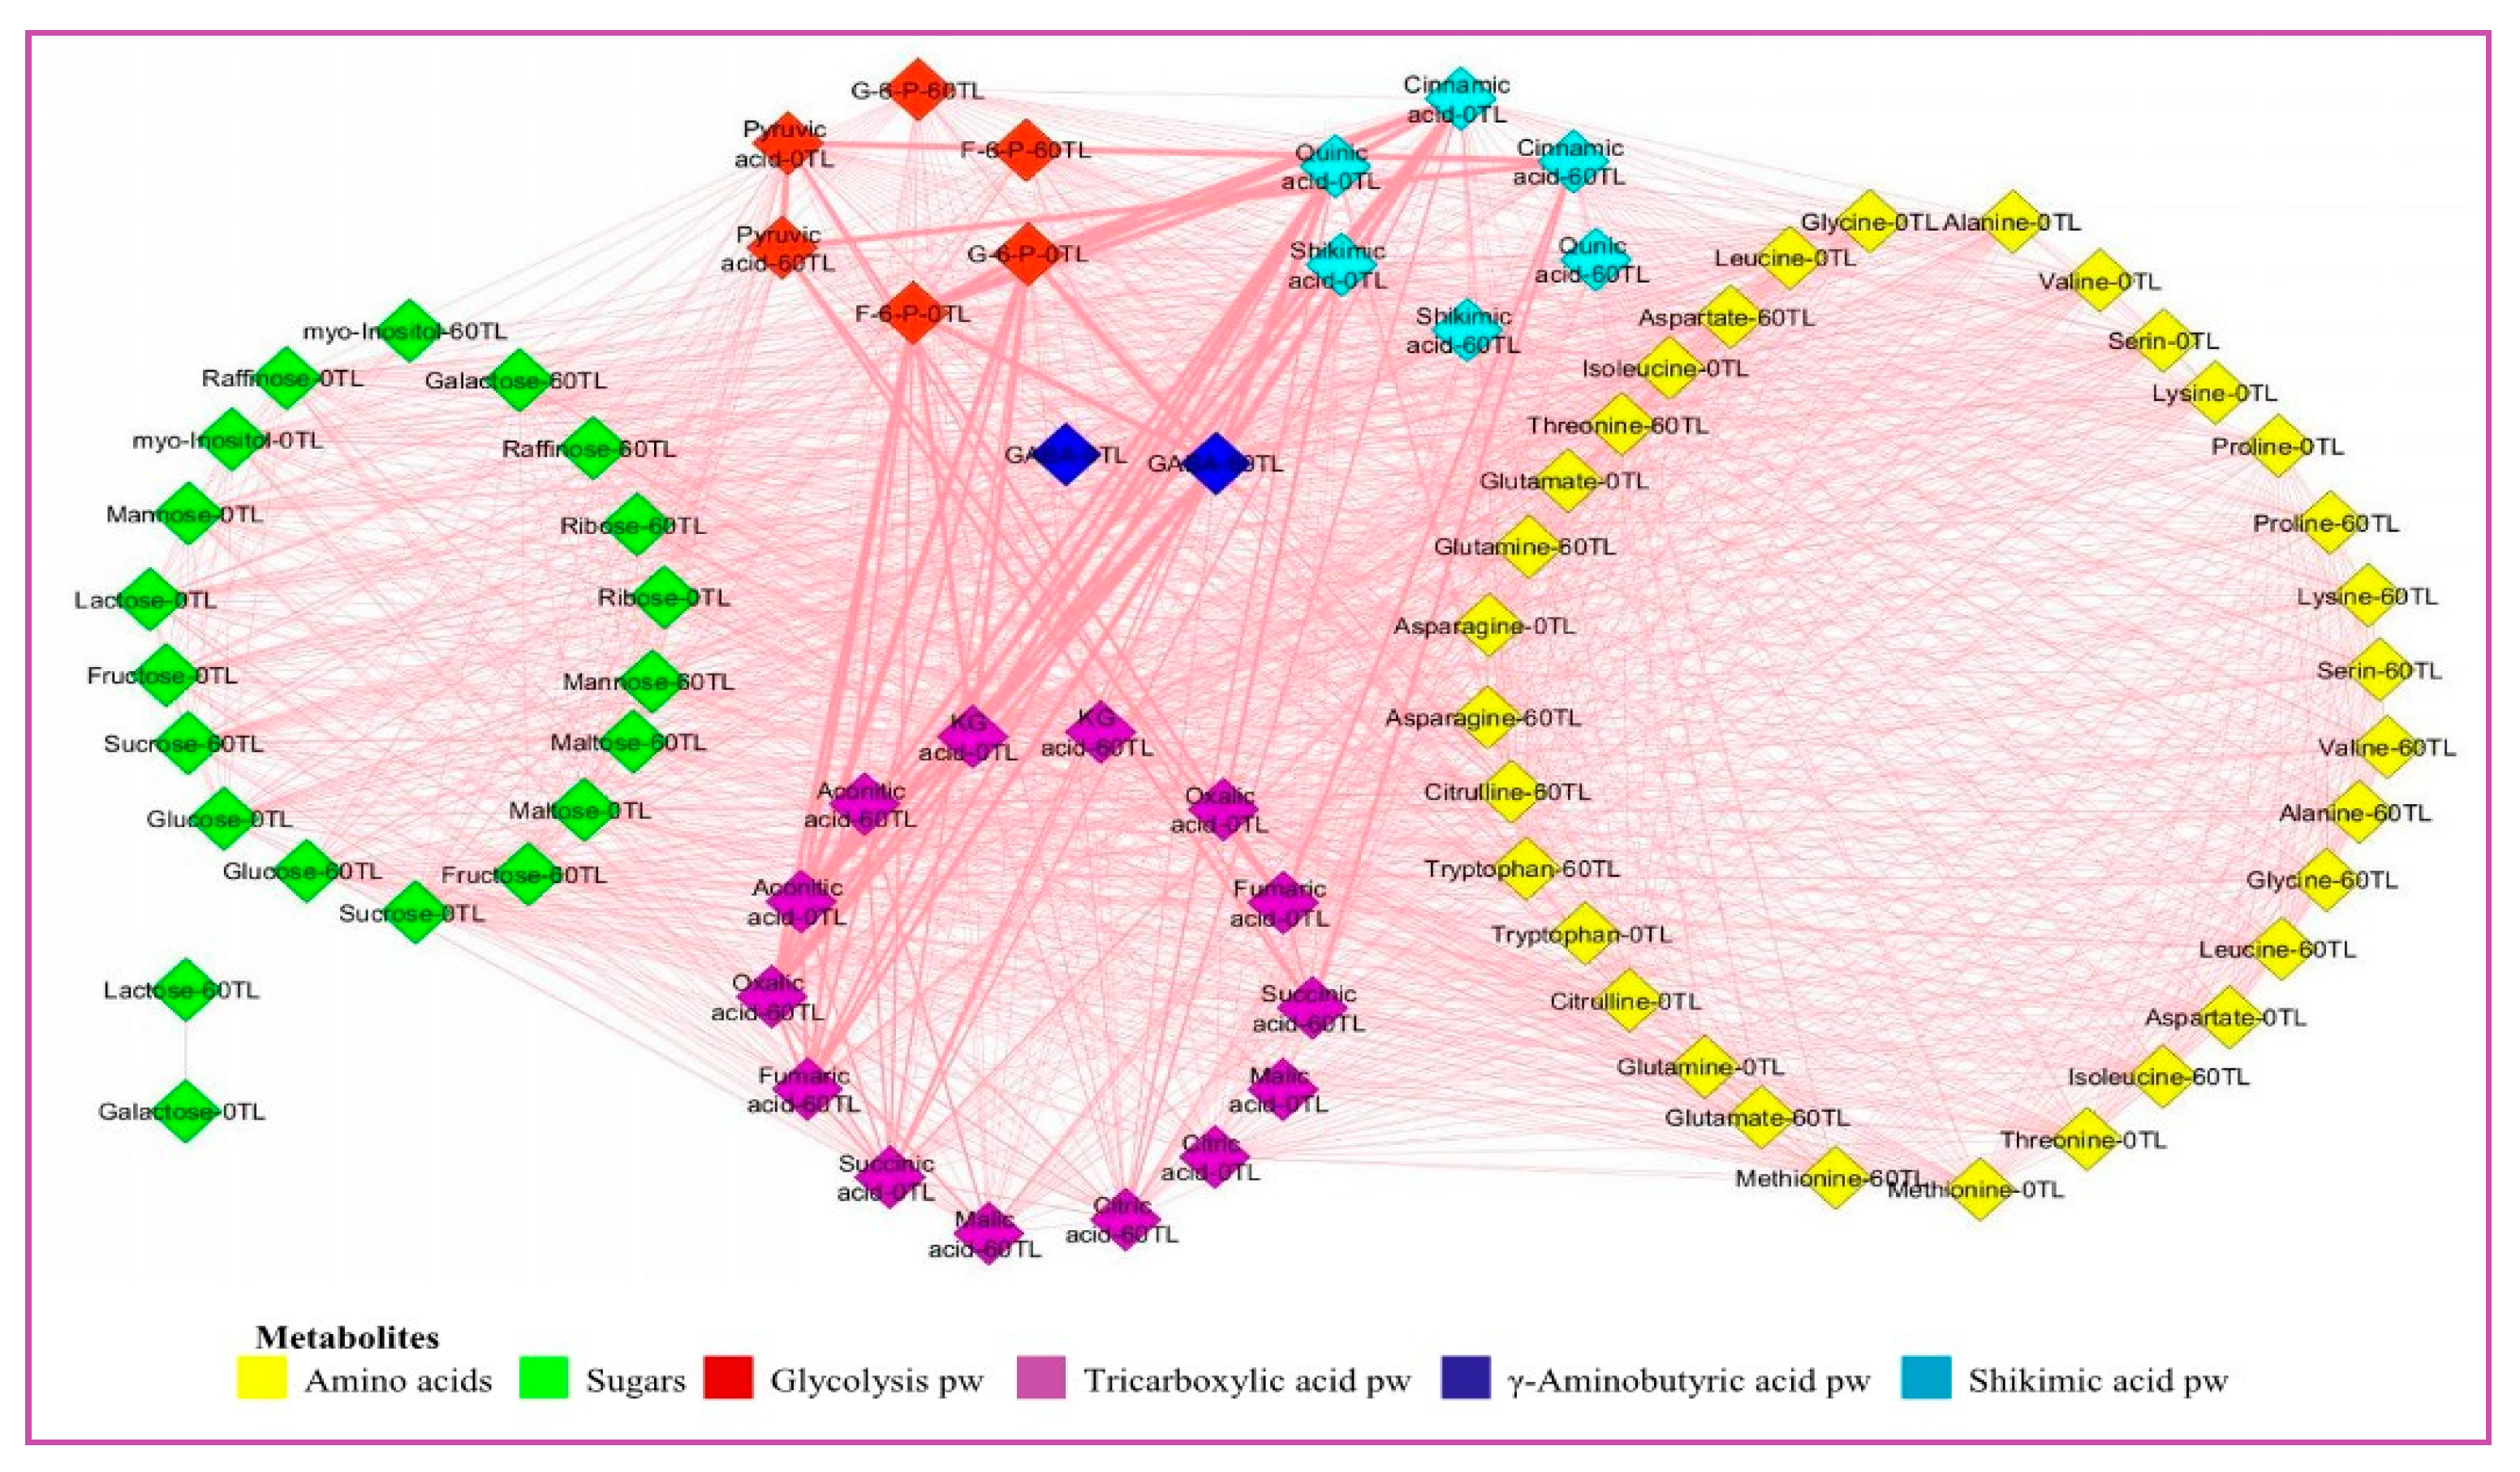
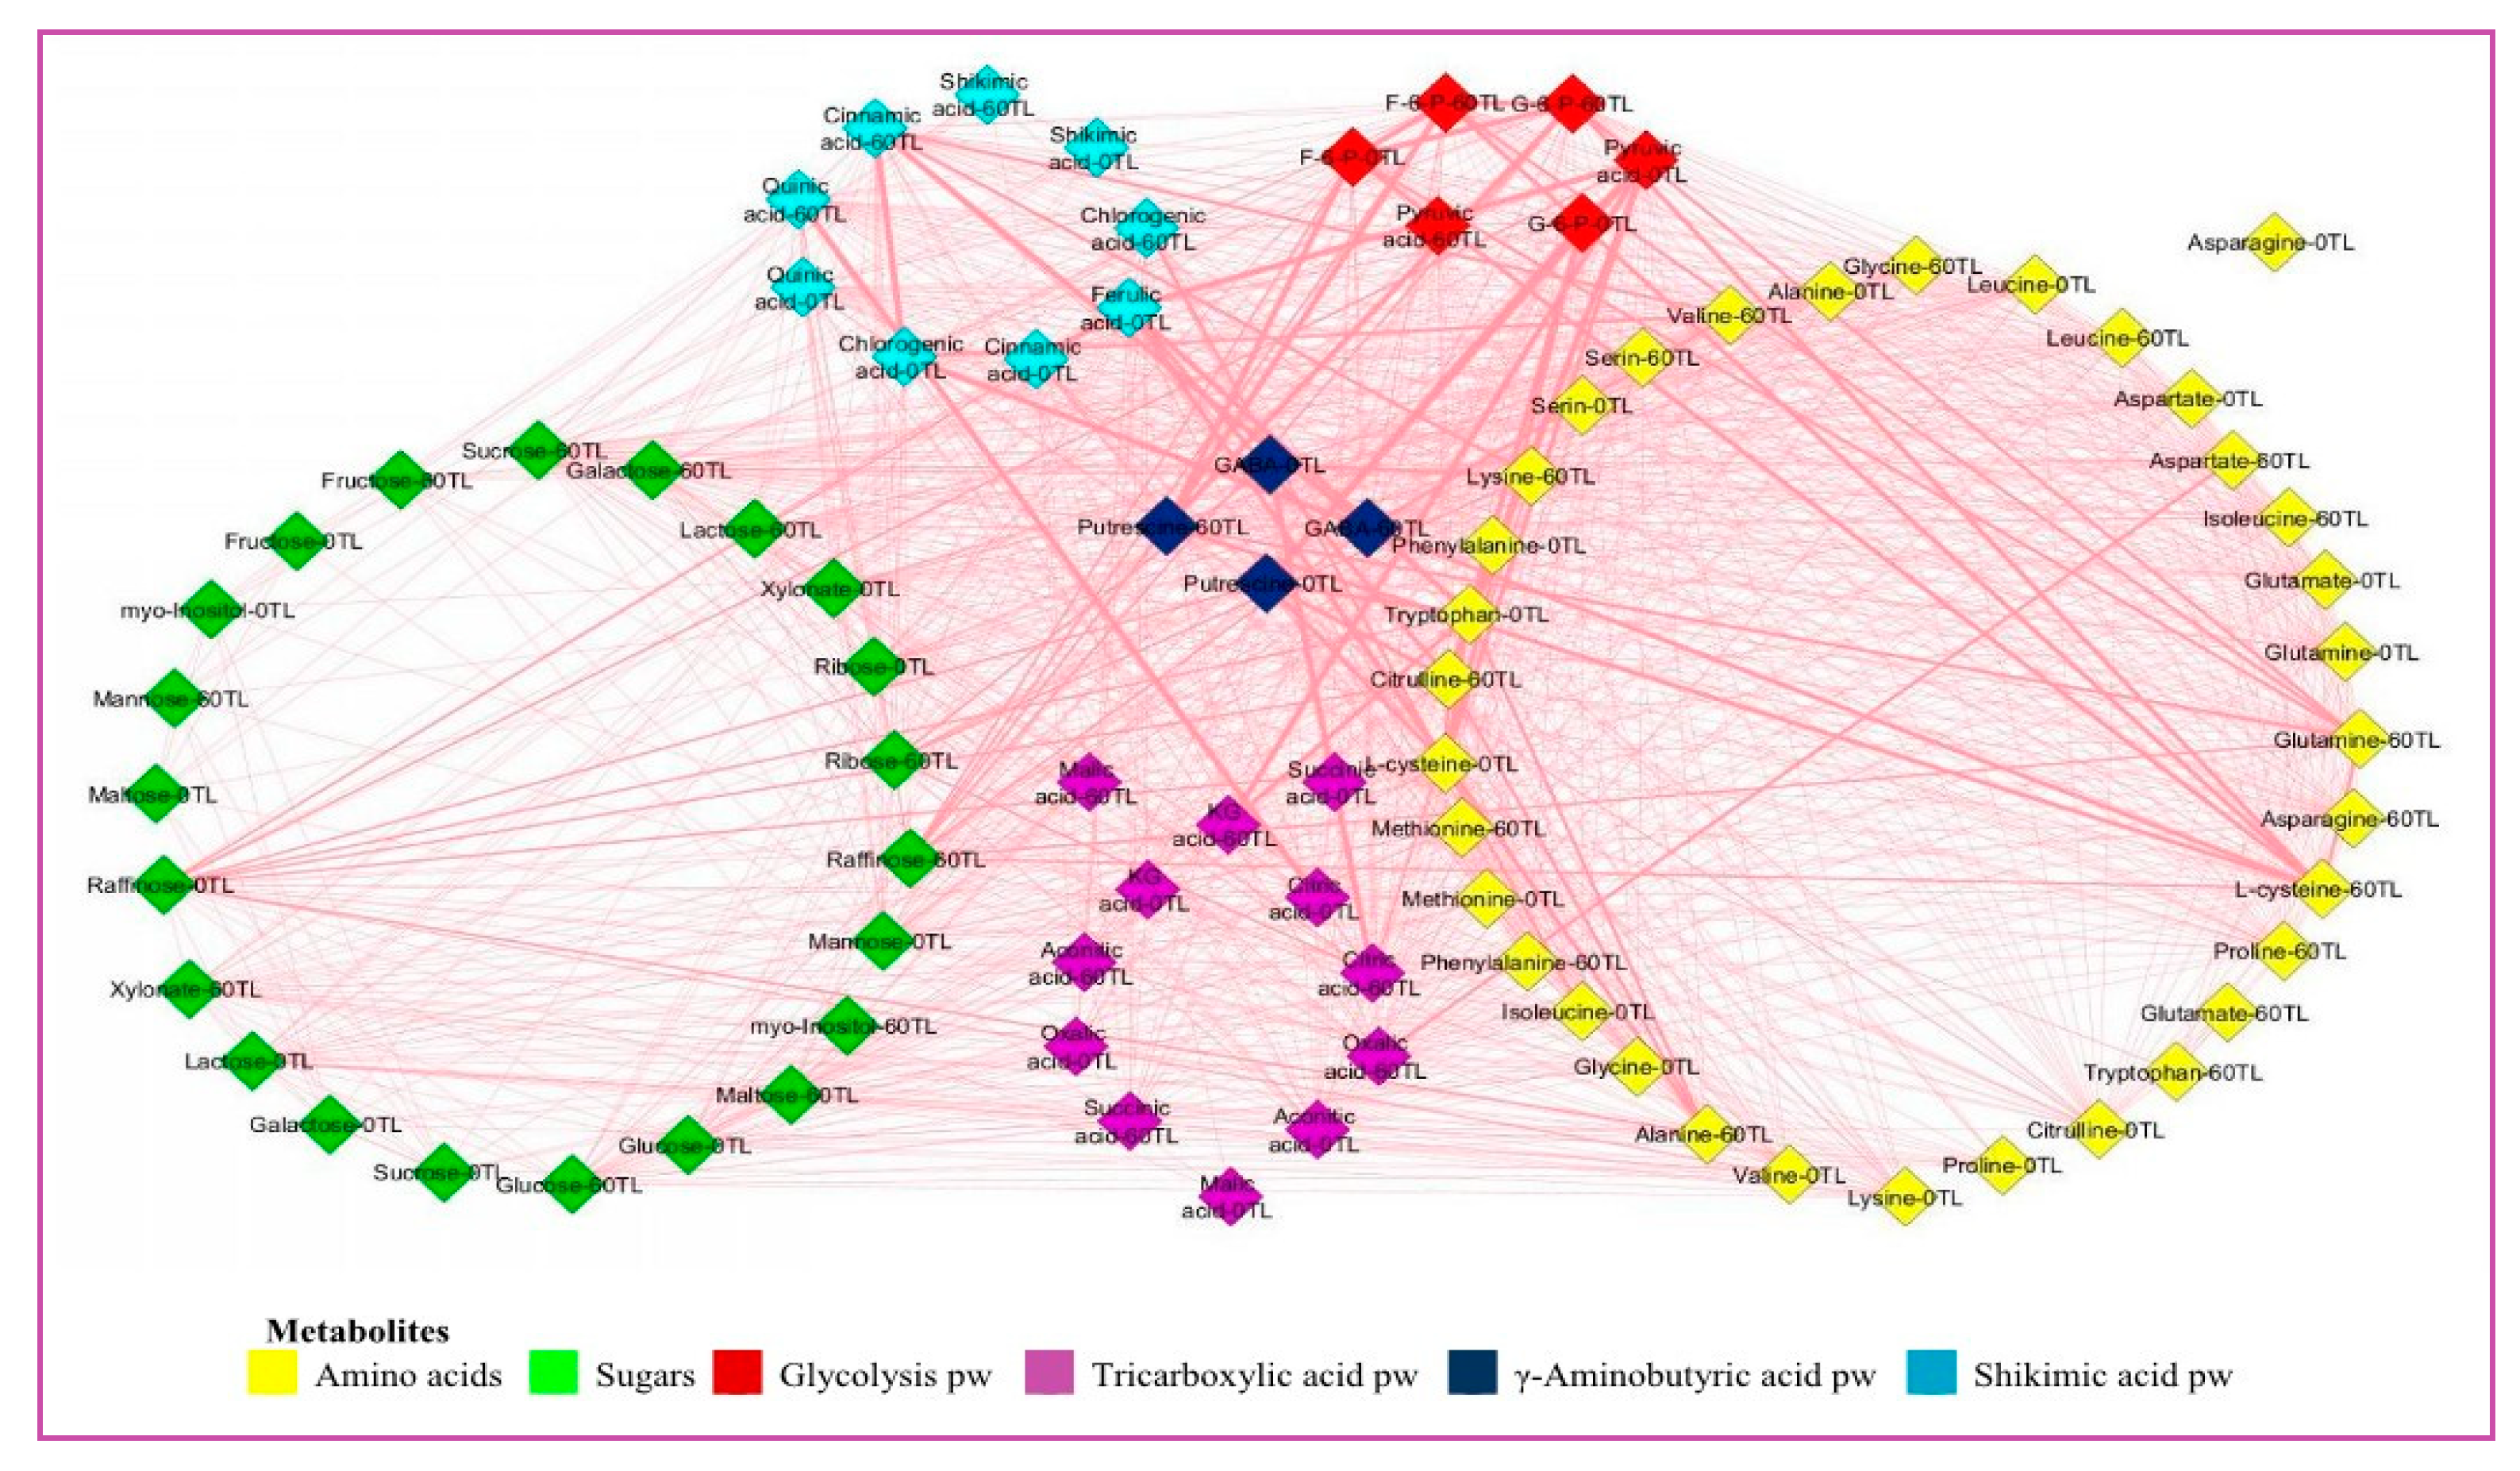
3.8. Correlation-Based Network Analysis to Identify Coordinated Stress Induced Metabolic Perturbation
3.9. PCA Analysis

4. Discussion
4.1. Genotypic Variability and Physiological Responses
4.2. Relative Water Contents, Gas Exchange and Pigments Variations Among Coffee Genotypes Towards Drought Stress
4.3. Drought Stress Causes Variability in Metabolite Alteration among Coffee Genotypes
5. Conclusions
Supplementary Materials
Author Contributions
Funding
Institutional Review Board Statement
Data Availability Statement
Acknowledgments
Conflicts of Interest
References
- Kufa, T. Biomass production and distribution in seedlings of Coffea arabica genotypes under contrasting nursery environments in south-western Ethiopia. Agri. Sci. 2012, 3, 835–843. [Google Scholar] [CrossRef]
- Rodrigues, A.M.; Jorge, T.; Osorio, S.; Pott, D.M.; Lidon, F.C.; DaMatta, F.M.; Marques, I.; Ribeiro- Barros, A.I.; Ramalho, J.C.; Antonio, C. Primary metabolite profile changes in coffea spp. promoted by single and combined exposure to drought and elevated CO2 concentration. Metabolites 2021, 11, 427. [Google Scholar] [CrossRef] [PubMed]
- Elmar, R.; Jean-François, M. The major evolutionary lineages of the coffee family (Rubiaceae, Angiosperms). Combined analysis (nDNA and cpDNA) to infer the position of Coptosapelta and Luculia, and Supertree construction based on rbcL, rps16, trnL-trnF and atpB-rbcL Data. A new classification in two subfamilies, Cinchonoideae and Rubioideae. Sys. Geog. Plants 2006, 76, 85–145. [Google Scholar]
- FAOSTAT. The United Nations Food and Agriculture Organisation of the United Nations (FAO). Crop Statistics: New York, USA, 2021; pp 1-1357.
- CSA (Central Statistical Agency). Agricultural Sample Survey: Area and Production of Crops; Central Statistical Agency of Ethiopia: Addis Ababa, Ethiopia, 2019; pp. 1–450. [Google Scholar]
- ECX (Ethiopian Commodity Exchange). The Ethiopian Annual Export Products, Annual Reports; ECX publishing: Addis Ababa, Ethiopia, 2019; pp. 1–130. [Google Scholar]
- Chekol, H.; Bezuayehu, Y.; Warkineh, B.; Shimber, T.; Mierek-Adamska, A.; Dąbrowska, G.B.; Degu, A. Unraveling Drought Tolerance and Sensitivity in Coffee Genotypes: Insights from Seed Traits, Germination, and Growth-Physiological Responses. Agriculture 2023, 13, 1754. [Google Scholar] [CrossRef]
- Leon-Burgos, A.F.; Unigarro, C.; Balaguera-Lopez, H.E. Can prolonged conditions of water deficit alter photosynthetic performance and water relations of coffee plants in central-west Colombian? S. Afr. J. Bot. 2022, 149, 366–375. [Google Scholar] [CrossRef]
- da Silva, P.C.; Junior, W.Q.R.; Ramos, M.L.G.; Rocha, O.C.; Veiga, A.D.; Silva, N.H.; Brasileiro, L.d.O.; Santana, C.C.; Soares, G.F.; Malaquias, J.V.; et al. Physiological Changes of Arabica Coffee under Different Intensities and Durations of Water Stress in the Brazilian Cerrado. Plants 2022, 11, 2198. [Google Scholar] [CrossRef] [PubMed]
- Arbona, V.; Manzi, M.; De Ollas, C.; Gómez-Cadenas, A. Metabolomics as a Tool to Investigate Abiotic Stress Tolerance in Plants. Int. J. Mol. Sci. 2013, 14, 4885–4911. [Google Scholar] [CrossRef] [PubMed]
- Kumar, M.; Patel, M.K.; Kumar, N.; Bajpai, A.B.; Siddique, K.H.M. Metabolomics and Molecular Approaches Reveal Drought Stress Tolerance in Plants. Int. J. Mol. Sci. 2021, 22, 9108. [Google Scholar] [CrossRef] [PubMed]
- Witt, S.; Luis, G.; Jan, L.; Jill, C.; Axel, T.; Jose, L.; Natalia, P.; Alisdair, R. Metabolic and phenotypic responses of greenhouse-grown maize hybrids to experimentally controlled drought stress. Mol. Plant 2012, 5, 401–417. [Google Scholar] [CrossRef]
- Hochberg, U.; Degu, A.; Toubiana, D.; Gendler, T.; Nikoloski, Z.; Rachmilevitch, S.; Fait, A. Metabolite profiling and network analysis reveal coordinated changes in grapevine water stress response. BMC Plant Biol. 2013, 13, 184. [Google Scholar] [CrossRef]
- Fiehn, O.; Kopka, J.; Dörmann, P.; Altmann, T.; Trethewey, R.N.; Willmitzer, L. Metabolite profiling for plant functional genomics. Nat. Biotechnol. 2000, 18, 1157–1161. [Google Scholar] [CrossRef] [PubMed]
- Guo, R.; Shi, L.; Jiao, Y.; Li, M.; Zhong, X.; Gu, F.; Liu, Q.; Xia, X.; Li, H. Metabolic responses to drought stress in the tissues of drought-tolerant and drought-sensitive wheat genotype seedlings. AoB Plants 2018, 10, ply016. [Google Scholar] [CrossRef] [PubMed]
- Lozano-Elena, F.; Fàbregas, N.; Coleto-Alcudia, V.; Caño-Delgado, A.I. Analysis of metabolic dynamics during drought stress in Arabidopsis plants. Sci. Data 2022, 9, 90. [Google Scholar] [CrossRef] [PubMed]
- Rabara, R.C.; Tripathi, P.; Rushton, P.J. Comparative Metabolome Profile between Tobacco and Soybean Grown under Water-Stressed Conditions. BioMed Res. Int. 2017, 2017, 3065251. [Google Scholar] [CrossRef] [PubMed]
- Drapal, M.; Amah, D.; Schöny, H.; Brown, A.; Swennen, R.; Fraser, P.D. Assessment of metabolic variability and diversity present in leaf, peel and pulp tissue of diploid and triploid Musa spp. Phytochemistry 2020, 176, 112388. [Google Scholar] [CrossRef] [PubMed]
- Obata, T.; Witt, S.; Jan, L.; Natalia, P.R.; Igor, F.; Salima, Y.; Jose, L.; Jill, E.C.; Alisdair, R. Metabolite profiles of maize leaves in drought, heat, and combined stress field trials reveal the relationship between metabolism and grain yield. Plant Physio. 2015, 169, 2665–2683. [Google Scholar] [CrossRef]
- Fàbregas, N.; Fernie, A.R. The metabolic response to drought. J. Exp. Bot. 2019, 70, 1077–1085. [Google Scholar] [CrossRef]
- Impa, S.M.; John, S.; Inga, K.; Raju, B.; Toshihiro, O.; Krishna, J. Carbon balance and source-sink metabolic changes in winter wheat exposed to high night-time temperature. Plant Cell Env. 2019, 42, 1233–1246. [Google Scholar] [CrossRef] [PubMed]
- Roessner, U.; Beckles, D.M. Metabolite Measurements; Springer: New York, NY, USA, 2009; pp. 39–69. [Google Scholar]
- Schwender, J. Plant Metabolic Networks; Junker, B.H., Ed.; Springer: Dordrecht, The Netherlands, 2009. [Google Scholar]
- Lu, Y.; Stegemann, S.; Agrawal, S.; Karcher, D.; Ruf, S.; Bock, R. Horizontal Transfer of a Synthetic Metabolic Pathway between Plant Species. Curr. Biol. 2017, 27, 3034–3041. [Google Scholar] [CrossRef]
- Caine, R.S.; Yin, X.; Sloan, J.; Harrison, E.L.; Mohammed, U.; Fulton, T.; Biswal, A.K.; Dionora, J.; Chater, C.C.; Coe, R.A.; et al. Rice with reduced stomatal density conserves water and has improved drought tolerance under future climate conditions. New Phytol. 2019, 221, 371–384. [Google Scholar] [CrossRef]
- Tesfaye, S. Variations among coffee (Coffea arabica L.) genotypes for sensitivity to drought induced by soil drying at early stages of growth in Ethiopia. J. Plant Breed. Crop Sci. 2018, 5, 453–462. [Google Scholar]
- WCR (World Coffee Research). Good Practice Guide Coffee Nursery Management; WCR publishing: Portland, OR, USA, 2019; pp. 1–80. [Google Scholar]
- Barrs, H.D.; Weatherley, P.E. A Re-Examination of the Relative Turgidity Technique for Estimating Water Deficits in Leaves. Aust. J. Biol. Sci. 1962, 15, 413–428. [Google Scholar] [CrossRef]
- Lichtenthaler, H.K. Chlorophylls and carotenoids, the pigments of photosynthetic biomembranes. Methods Enzy. 1987, 148, 350–382. [Google Scholar] [CrossRef]
- Lisec, J.; Schauer, N.; Kopka, J.; Willmitzer, L.; Fernie, A.R. Gas chromatography mass spectrometry–based metabolite profiling in plants. Nat. Protoc. 2006, 1, 387–396. [Google Scholar] [CrossRef] [PubMed]
- Kopka, J.; Schauer, N.; Krueger, S.; Birkemeyer, C.; Usadel, B.; Bergmuller, E.; Dormann, P.; Weckwerth, W.; Gibon, Y.; Stitt, M.; et al. GMD@CSB.DB: the Golm Metabolome Database. Bioinformatics 2005, 21, 1635–1638. [Google Scholar] [CrossRef]
- Hammer, Ø.; David, A.; Harper, T.; Paul, D.R. PAST: paleontological statistics software package for education and data analysis. Palaeo. Electro. 2001, 4, 9. [Google Scholar]
- Shannon, P.; Markiel, A.; Ozier, O.; Baliga, N.S.; Wang, J.T.; Ramage, D.; Amin, N.; Schwikowski, B.; Ideker, T. Cytoscape: A software environment for integrated models of Biomolecular Interaction Networks. Genome Res. 2003, 13, 2498–2504. [Google Scholar] [CrossRef]
- Konieczna, W.; Warchoł, M.; Mierek-Adamska, A.; Skrzypek, E.; Waligórski, P.; Piernik, A.; Dąbrowska, G.B. Changes in physio-biochemical parameters and expression of metallothioneins in Avena sativa L. in response to drought. Sci. Rep. 2023, 13, 1–16. [Google Scholar] [CrossRef]
- Gugliuzza, G.; Talluto, G.; Martinelli, F.; Farina, V.; Bianco, R.L. Water Deficit Affects the Growth and Leaf Metabolite Composition of Young Loquat Plants. Plants 2020, 9, 274. [Google Scholar] [CrossRef]
- DaMatta, F.M.; Ronchi, C.P.; Maestri, M.; Barros, R.S. Ecophysiology of coffee growth and production. Braz. J. Plant Physiol. 2007, 19, 485–510. [Google Scholar] [CrossRef]
- Wei, Y.; Xu, X.; Tao, H.; Wang, P. Growth performance and physiological response in the halophyte Lyciumbarbarum grown at salt-affected soil. An. Applied Biol. 2006, 149, 263–269. [Google Scholar] [CrossRef]
- Dias, P.C.; Araujo, W.L.; Moraes, G.A.; Barros, R.S.; DaMatta, F.M. Morphological and physiological responses of two coffee progenies to soil water availability. J. Plant Physiol. 2007, 164, 1639–1647. [Google Scholar] [CrossRef]
- Xiong, S.; Wang, Y.; Chen, Y.; Gao, M.; Zhao, Y.; Wu, L. Effects of Drought Stress and Rehydration on Physiological and Biochemical Properties of Four Oak Species in China. Plants 2022, 11, 679. [Google Scholar] [CrossRef] [PubMed]
- Cai, C.T.; Cai, Z.Q.; Yao, T.Q.; Qi, X. Vegetative growth and photosynthesis in coffee plants under different watering and fertilization managements in Yunnan, SW China. Photosynthetica 2007, 45, 455–461. [Google Scholar] [CrossRef]
- Eira, M.T.S.; da Silva, E.A.A.; De Castro, R.D.; Dussert, S.; Walters, C.; Bewley, J.D.; Hilhorst, H.W.M. Coffee seed physiology. Braz. J. Plant Physiol. 2006, 18, 149–163. [Google Scholar] [CrossRef]
- Hayatu, M.; Muhammad, S.Y.; Habibu, U.A. Effect of water stress on the leaf relative water content and yield of some cowpea (Vigna unguiculata (L) Walp.) genotype. Int. J. Sci. Technol. Res. 2014, 3, 148–152. [Google Scholar]
- Pirzad, A.; Shakiba, M.R.; Zehtab-Salmasi, S.; Mohammadi, S.A. Effect of water stress on leaf relative water content, chlorophyll, proline and soluble carbohydrates in Matricaria chamomilla L. J. Medic. Plants Res. 2011, 5, 2483–2488. [Google Scholar]
- Soltys-Kalina, D.; Plich, J.; Strzelczyk-Żyta, D.; Śliwka, J.; Marczewski, W. The effect of drought stress on the leaf relative water content and tuber yield of a half-sib family of ‘Katahdin’-derived potato cultivars. Breed. Sci. 2016, 66, 328–331. [Google Scholar] [CrossRef]
- Wang, Z.; Li, G.; Sun, H.; Ma, L.; Guo, Y.; Zhao, Z.; Gao, H.; Mei, L. Effects of drought stress on photosynthesis and photosynthetic electron transport chain in young apple tree leaves. Biol. Open 2018, 7, bio035279. [Google Scholar] [CrossRef]
- Zhang, A.; Liu, M.; Gu, W. Effect of drought on photosynthesis, total antioxidant capacity, bioactive component accumulation, and the transcriptome of Atractylodeslancea. BMC Plant Biol. 2021, 21, 293. [Google Scholar] [CrossRef]
- Taiz, L.; Zeiger, E. Plant Physiology; Sinauer Associates: Sunderland, MA, USA, 2010; pp. 1–782. [Google Scholar]
- Mafakheri, A.; Siosemardeh, A.F.; Bahramnejad, B.; Struik, P.C.; Sohrabi, Y. Effect of drought stress on yield, proline and chlorophyll contents in three chickpea cultivars. Aus. J. Crop Sci. 2010, 4, 580–585. [Google Scholar] [CrossRef]
- Nikolaeva, M.K.; Maevskaya, S.N.; Shugaev, A.G.; Bukhov, N.G. Effect of drought on chlorophyll content and antioxidant enzyme activities in leaves of three wheat cultivars varying in productivity. Russ. J. Plant Physiol. 2010, 57, 87–95. [Google Scholar] [CrossRef]
- Isah, T. Stress and defense responses in plant secondary metabolites production. Biol. Res. 2019, 52, 39. [Google Scholar] [CrossRef] [PubMed]
- Kapoor, D.; Bhardwaj, S.; Landi, M.; Sharma, A.; Ramakrishnan, M.; Sharma, A. The Impact of Drought in Plant Metabolism: How to Exploit Tolerance Mechanisms to Increase Crop Production. Appl. Sci. 2020, 10, 5692. [Google Scholar] [CrossRef]
- Urano, K.; Maruyama, K.; Ogata, Y.; Morishita, Y.; Takeda, M.; Sakurai, N.; Suzuki, H.; Saito, K.; Shibata, D.; Kobayashi, M.; et al. Characterization of the ABA-regulated global responses to dehydration in Arabidopsis by metabolomics. Plant J. 2009, 57, 1065–1078. [Google Scholar] [CrossRef] [PubMed]
- Krasensky, J.; Jonak, C. Drought, salt, and temperature stress-induced metabolic rearrangements and regulatory networks. J. Exp. Bot. 2012, 63, 1593–1608. [Google Scholar] [CrossRef] [PubMed]
- Fabregas, N.; Lozano-Elena, F.; Blasco-Escamez, D. Over-expression of the vascular brassinosteroid receptor BRL3 confers drought resistance without penalizing plant growth. Nat. Com. 2018, 9, 4680. [Google Scholar] [CrossRef] [PubMed]
- Ogbaga, C.C.; Stepien, P.; Dyson, B.C.; Rattray, N.J.W.; Ellis, D.I.; Goodacre, R.; Johnson, G.N. Biochemical Analyses of Sorghum Varieties Reveal Differential Responses to Drought. PLoS ONE 2016, 11, e0154423. [Google Scholar] [CrossRef] [PubMed]
- Pires, M.V.; Pereira Júnior, A.A.; Medeiros, D.B.; Daloso, D.M.; Pham, P.A.; Barros, K.A.; Engqvist, M.K.; Florian, A.; Krahnert, I.; Maurino, V.G.; et al. The influence of alternative pathways of respiration that utilize branched-chain amino acids following water shortage in Arabidopsis. Plant Cell Environ. 2016, 39, 1304–1319. [Google Scholar] [CrossRef]
- Ahanger, M.A.; Ashraf, M.; Bajguz, A.; Ahmad, P. Brassinosteroids Regulate Growth in Plants Under Stressful Environments and Crosstalk with Other Potential Phytohormones. J. Plant Growth Regul. 2018, 37, 1007–1024. [Google Scholar] [CrossRef]
- Singh, T.N.; Aspinall, D.; Paleg, L.G. Proline Accumulation and Varietal Adaptability to Drought in Barley: a Potential Metabolic Measure of Drought Resistance. Nat. New Biol. 1972, 236, 188–190. [Google Scholar] [CrossRef] [PubMed]
- Szabados, L.; Savouré, A. Proline: a multifunctional amino acid. Trends Plant Sci. 2010, 15, 89–97. [Google Scholar] [CrossRef] [PubMed]
- Zhang, J.; Zhang, Y.; Du, Y.; Chen, S.; Tang, H. Dynamic metabolomic responses of tobacco (Nicotiana tabacum) plants to salt stress. J. Proteome Res. 2011, 10, 1904–1914. [Google Scholar] [CrossRef] [PubMed]
- Joshi, V.; Joung, J.-G.; Fei, Z.; Jander, G. Interdependence of threonine, methionine and isoleucine metabolism in plants: accumulation and transcriptional regulation under abiotic stress. Amino Acids 2010, 39, 933–947. [Google Scholar] [CrossRef] [PubMed]
- Lehmann, S.; Funck, D.; Szabados, L.; Rentsch, D. Proline metabolism and transport in plant development. Amino Acids 2010, 39, 949–962. [Google Scholar] [CrossRef] [PubMed]
- Zhang, Z.; Mao, C.; Shi, Z.; Kou, X. The Amino Acid Metabolic and Carbohydrate Metabolic Pathway Play Important Roles during Salt-Stress Response in Tomato. Front. Plant Sci. 2017, 8, 1231. [Google Scholar] [CrossRef] [PubMed]
- Sanchez, D.H.; Pieckenstain, F.L.; Szymanski, J.; Erban, A.; Bromke, M.; Hannah, M.A.; Kraemer, U.; Kopka, J.; Udvardi, M.K. Comparative Functional Genomics of Salt Stress in Related Model and Cultivated Plants Identifies and Overcomes Limitations to Translational Genomics. PLoS ONE 2011, 6, e17094. [Google Scholar] [CrossRef] [PubMed]
- Araujo, W.L.; Nunes-Nesi, A.; Nikoloski, Z.; Sweetlove, L.J.; Fernie, A.R. Metabolic control and regulation of the tricarboxylic acid cycle in pho- tosynthetic and heterotrophic plant tissues. Plant Cell and Envi. 2012, 35, 1–21. [Google Scholar] [CrossRef] [PubMed]
- Rzepka, A.; Rut, G.; Krupa, J. Effect of abiotic stress factors on fluctuations in contents of malate and citrate and on malic enzyme activity in moss gametophores. Photosynthetica 2009, 47, 141–145. [Google Scholar] [CrossRef]
- Yang, L.; Fountain, J.C.; Ji, P.; Ni, X.; Chen, S.; Lee, R.D.; Kemerait, R.C.; Guo, B. Deciphering drought-induced metabolic responses and regulation in developing maize kernels. Plant Biotechnol. J. 2018, 16, 1616–1628. [Google Scholar] [CrossRef]
- Kinnersley, A.M. Gamma aminobutyric acid (GABA) and plant responses to stress. Crit. Revi. Plant Sci. 2000, 19, 479–509. [Google Scholar] [CrossRef]


Disclaimer/Publisher’s Note: The statements, opinions and data contained in all publications are solely those of the individual author(s) and contributor(s) and not of MDPI and/or the editor(s). MDPI and/or the editor(s) disclaim responsibility for any injury to people or property resulting from any ideas, methods, instructions or products referred to in the content. |
© 2023 by the authors. Licensee MDPI, Basel, Switzerland. This article is an open access article distributed under the terms and conditions of the Creative Commons Attribution (CC BY) license (http://creativecommons.org/licenses/by/4.0/).


