1. Introduction
The application of nitrogen fertilizer has greatly increased the yield of crops, however, ecological environmental pollution caused by nitrogen application are common problems world widely in recent years (Du 2019; Liu et al. 2019b; Ji et al. 2020). Excessive application of nitrogen fertilizer is the main reason for the low nitrogen use efficiency and ecological environment pollution, which has become a hidden danger threatening the sustainable development of agriculture (Sihvonen et al. 2021).
The amount of nitrogen fertilizer application in agriculture per unit area in China is 1.4 times of the world average level, while the agronomic efficiency and nitrogen use efficiency of nitrogen fertilizer are only 62% and 67% of the world average level (Zhang et al. 2013; Liu et al. 2019a; Yin et al. 2019). The nitrogen saving potential of winter wheat in China is more than 15%, and the nitrogen use efficiency can be increased by more than 23% (Zhang et al. 2013; Yin et al. 2019). Improving the tolerance of wheat to nitrogen deficit is an effective method to reduce nitrogen application and ensure crop yield has become an urgent problem.
Previous studies considered that nitrogen deficiency can lead to the change of metabolic process (Ouyang et al. 2016; Lan et al. 2020; Lv et al. 2020;Liu et al. 2020b). The plant soluble sugar content and net photosynthesis rate were decreased under nitrogen deficit (Honoki et al. 2018; Gao et al. 2018; Liu et al. 2020b). As per a study on transcriptome, the nitrogen deficit of wheat affects on the pathways of photosynthesis, nitrogen metabolism and extracellular region, which leaded to the adaptive changes of roots and photosynthesis rate (Liu et al. 2020a). To find the limiting factors in the photosynthesis and carbon metabolism pathways through transcriptome and proteome will be of helpful for improving wheat growth under nitrogen deficit by molecular regulation in the future.
The combined analysis of transcriptome and proteome provide detailed information of transcriptional regulation and post transcriptional regulation (Catusse et al. 2008; Dustin N et al. 2009; Wu et al. 2014). We therefore conducted experiments on transcriptome and proteome under nitrogen deficit of wheat, which aimed to: (1) explore the difference of transcriptome and proteome in wheat under nitrogen deficit; (2) provide candidate genes related to photosynthesis and carbon metabolism pathways for improving the nitrogen availability through molecular breeding.
2. Materials and Methods
2.1. Experimental design
A nitrogen sensitive variety Shannong 29 was used in our experiment. Wheat seeds were disinfected with 75% alcohol for 30 seconds, then washed with distilled water for 3 times. After the seeds of winter wheat were sterilized, the seedlings were cultured to one leaf and one heart stage in vermiculite. Then the seedlings were fixed on sponge and transplanted to two nutrient solutions with different nitrogen concentrations, which were 5mmol-1 NH4NO3 (N1) and 0mmol-1 NH4NO3 (N0). Each nitrogen concentration treatment has 90 seedlings and repeated 3 times. The seedlings were cultured in artificial incubator, and the environmental parameters were set to dark period 8 hours, photoperiod 16 hours and relative humidity 70%.
The nutrient solution of N0 contained 2 mmol L-1 CaCl2, 1.8 mmol L-1 KCl, 0.2 mmol L-1 KH2PO4, 0.5 mmol L-1 MgSO4, 0.1 mmol L-1 FeEDTA, 0.5 μmol L-1 KI, 1 μmol L-1 H3BO3, 1 μmol L-1 MnSO4, 1 μmol L-1 ZnSO4, 1 μmol L-1 Na2MoO4, 0.1 μmol L-1 CuSO4, 0.1 μmol L-1 CoCl2. The nutrient solution of N1 added 5mmol-1 NH4NO3 as compared to N0. The pH value was maintained at 6.8 ± 0.3.
2.2. Experimental measurements
2.2.1. Phenotypic index
1, 3, 5, 7, 9 days after transplanting, fresh weight of shoot and root of 10 plants were measured. In addition, 10 plants were sampled to measure the N content of root and shoot at 9 days after transplanting. The N content were measured using Kjeldahl determination (William 1971). The leaf photosynthesis rates were measured in 5, 7, 9 days after transplanting using LI-6400 portable photosynthesizer (LI-COR, USA) with a red-blue light source and a light quantum density of 1400 μmol m2 s-l.
2.2.2. Transcriptome and proteome sequencing
20 seedlings were sampled and separated into shoot and root in each experimental repetition at 1 day after transplanting, which were using for transcriptome and proteome sequencing.
The main processes of transcriptome determination were as follows, after the total RNA of the sample was extracted and digested with DNase, the eukaryotic mRNA was enriched with magnetic beads with oligo (DT) ; the interruption reagent was added to break the mRNA into short fragments, and the interrupted mRNA was used as the template, 6 base random primers were used to synthesize one strand cDNA, and then two strand reaction system was prepared to synthesize two strand cDNA, and the double strand cDNA was purified by kit; the purified double strand cDNA was repaired at the end, added a-tail and connected to the sequencing connector, then the fragment size was selected, and finally PCR amplification was carried out; the constructed library was qualified. After passing the quality inspection, Illumina sequencer was used for sequencing. Then, transcriptome sequencing were conducted followed by Liu et al. (2020a).
The main processes of proteome determination were as follows, a part of the sample was taken for protein concentration determination and SDS-PAGE detection. The other part was enzymolysis and labeling with trypsin. Then the same amount of labeled samples were mixed and separated by chromatography. Finally, the samples were analyzed by LC-MS / MS and data analysis (Jiao and Gu 2019; Yuan et al. 2019; Lyu et al. 2019).
2.3. Data analysis
The differentially expressed genes (DEGs) and differentially expressed proteins (DEPs) were functionally categorized using Gene Ontology (
http://geneontology.org/) (Thomas 2017) and KEGG database (
http://www.genome.jp/kegg/) (Kanehisa et al. 2016; Kanehisa et al. 2017). The protein database used was Triticum_aestivum.IWGSC.pep.all.fasta. The genome and mRNA database used was Triticum_aestivum.IWGSC.dna.toplevel.fa.gz. The DEGs and DEPs were marked in pathways from background lists including all protein-coding genes/transcripts.
The experimental data were represented by the average of three replicates. SPSS version 19.0 (SPSS Inc., Chicago, USA) was used for statistical calculation. One way ANOVA and Duncan multiple range test (DMRT) were used to compare the experimental treatments. P < 0.05 was considered statistical significance.
3. Results
3.1. Phenotype of wheat under nitrogen deficit
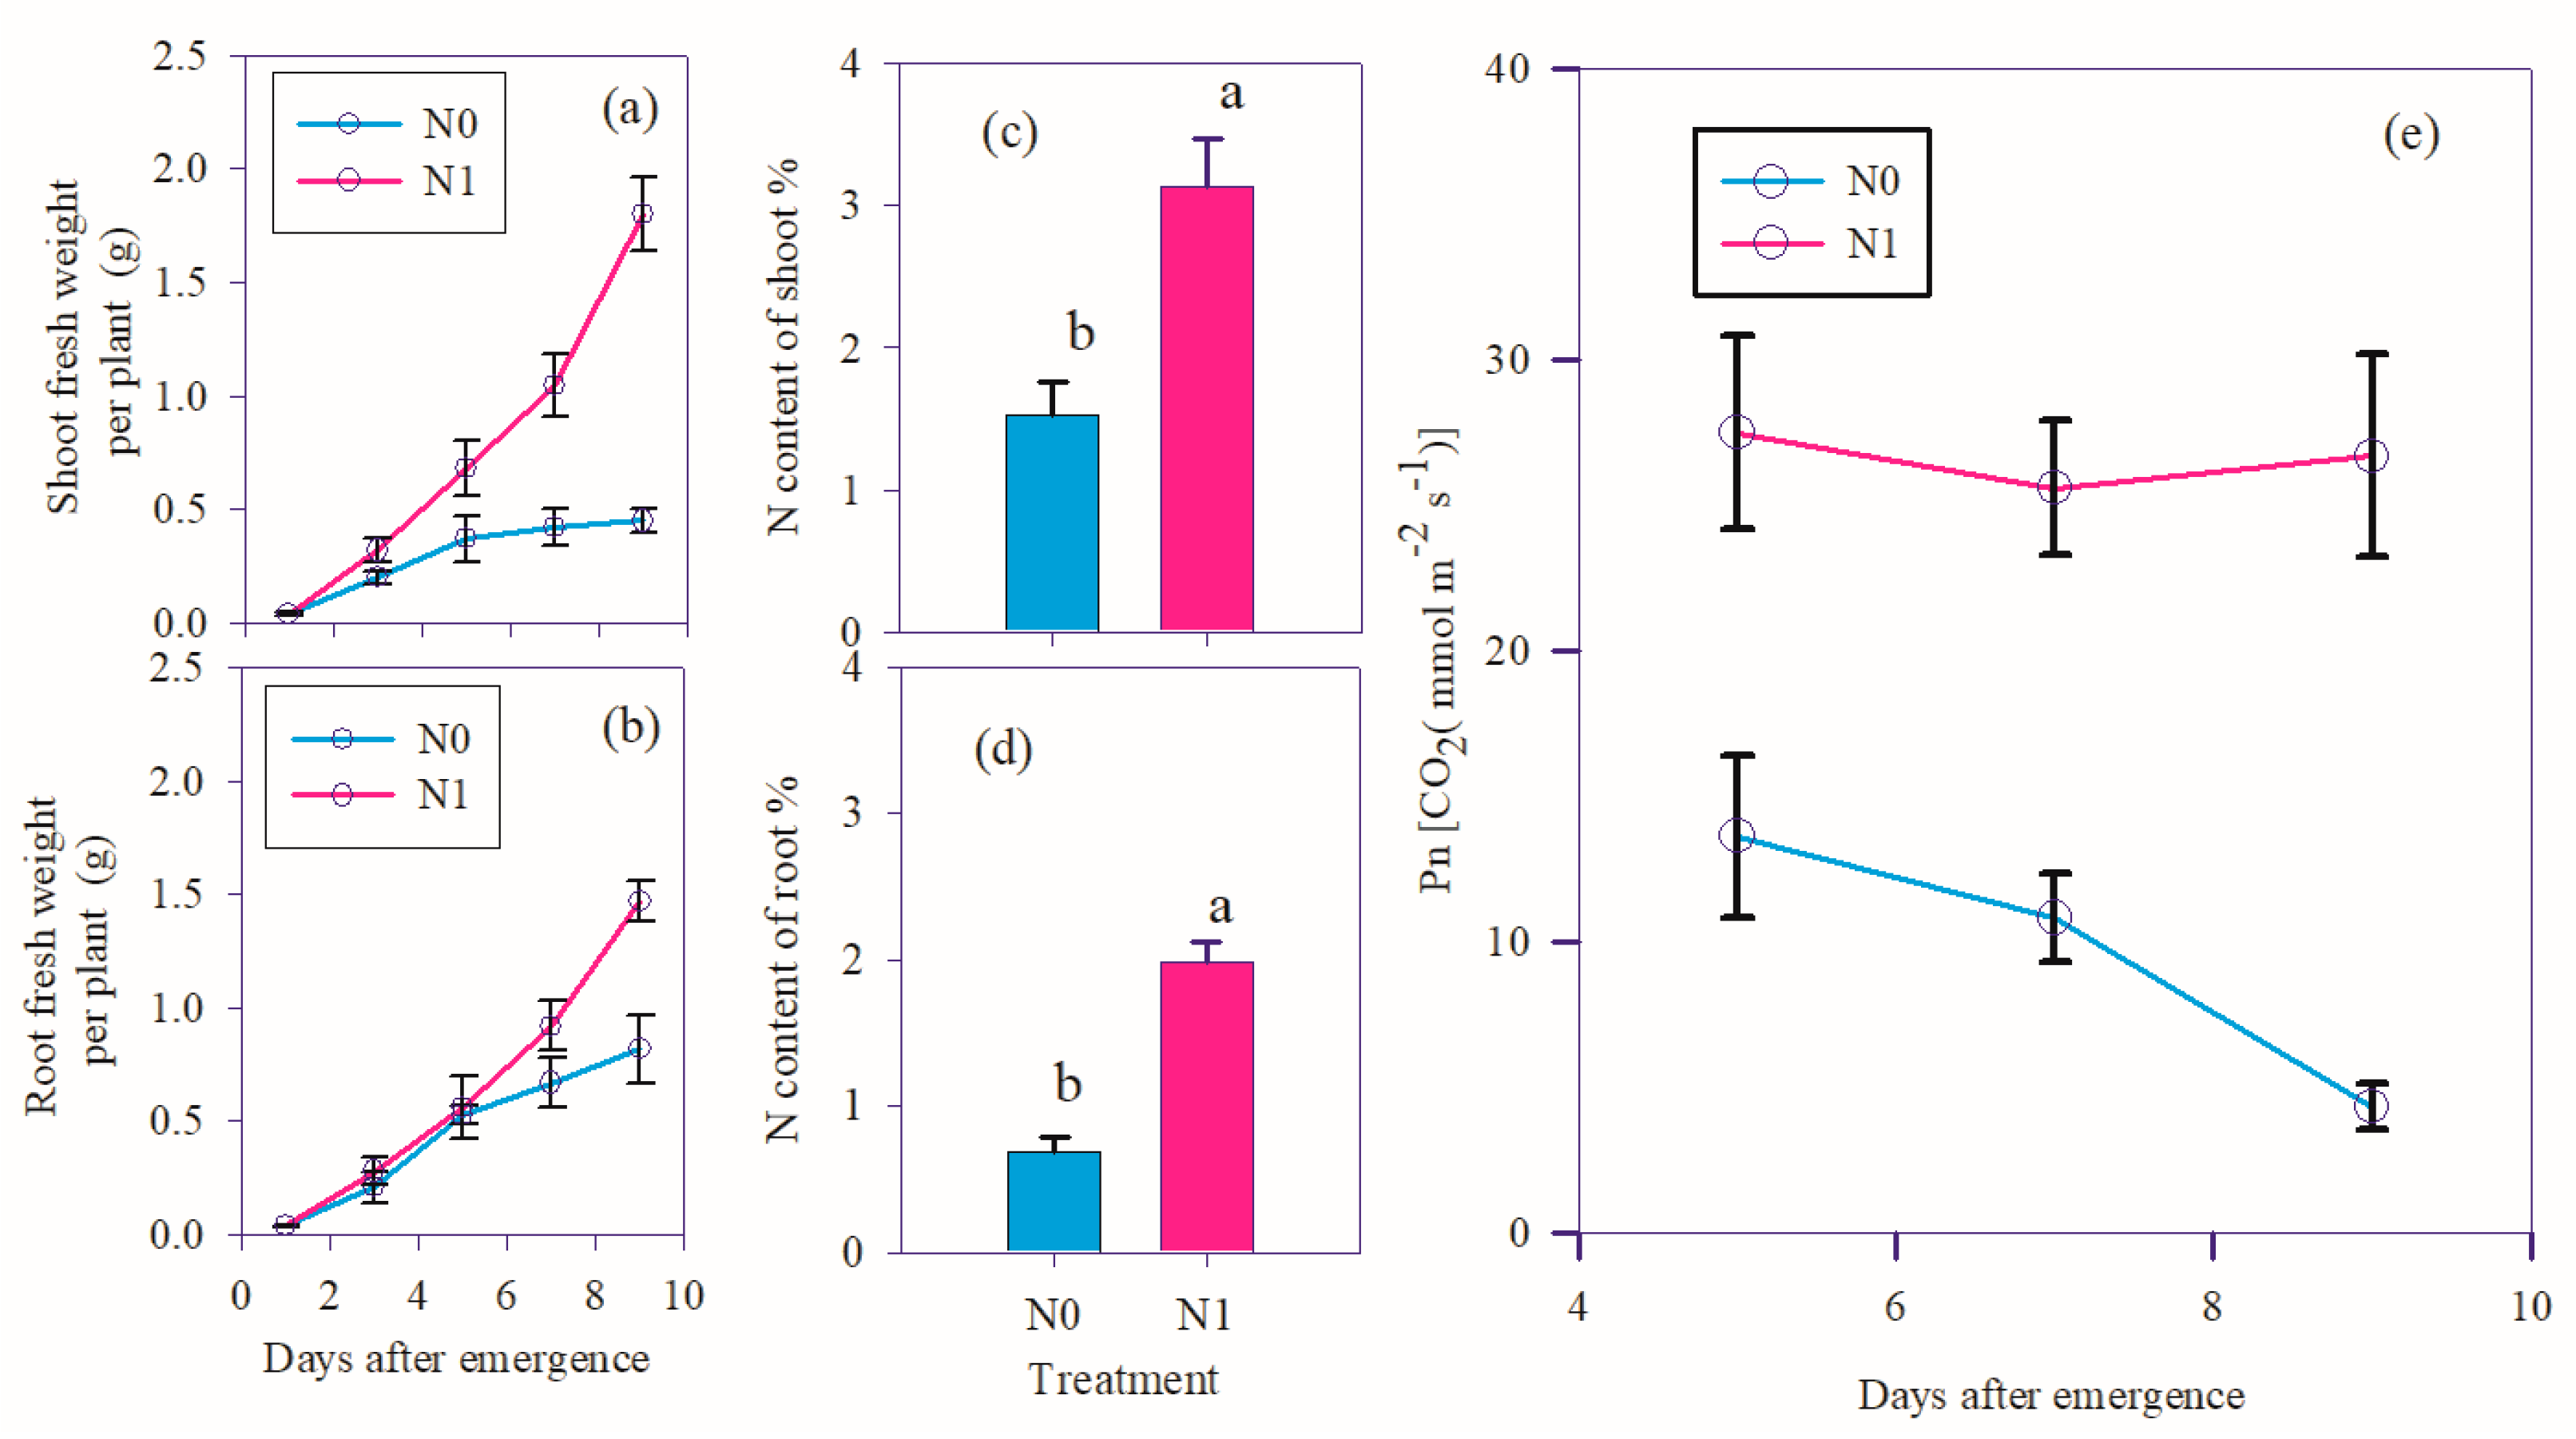
Under the condition of nitrogen deficit (N0), the shoot fresh weight of wheat almost stopped growing on the fifth day after emergence (
Figure 1a); the fresh weight of root was still growing, but the growth was obviously slow compared with the normal nitrogen condition (
Figure 1b). 9 days after emergence, the shoot fresh weight of N0 was only 25% of N1, and the root of N0 was 56% of N1. At 9 days after emergence, the N content of shoot of N0 was 49% of N1 (
Figure 1c), and that of N0 was 35% of N1 (
Figure 1d). The net photosynthetic rate (Pn) of N0 was about half of that of N1 at 5 days after emergence. The Pn of N1 was almost unchanged at 5, 7, 9 days after emergence, while the Pn of N0 was continuing declined. The net photosynthetic rate (Pn) of N0 was less than 20% of that of N1 at 9 days after emergence (
Figure 1e).
3.2. DEGs and DEPs of wheat under nitrogen deficit
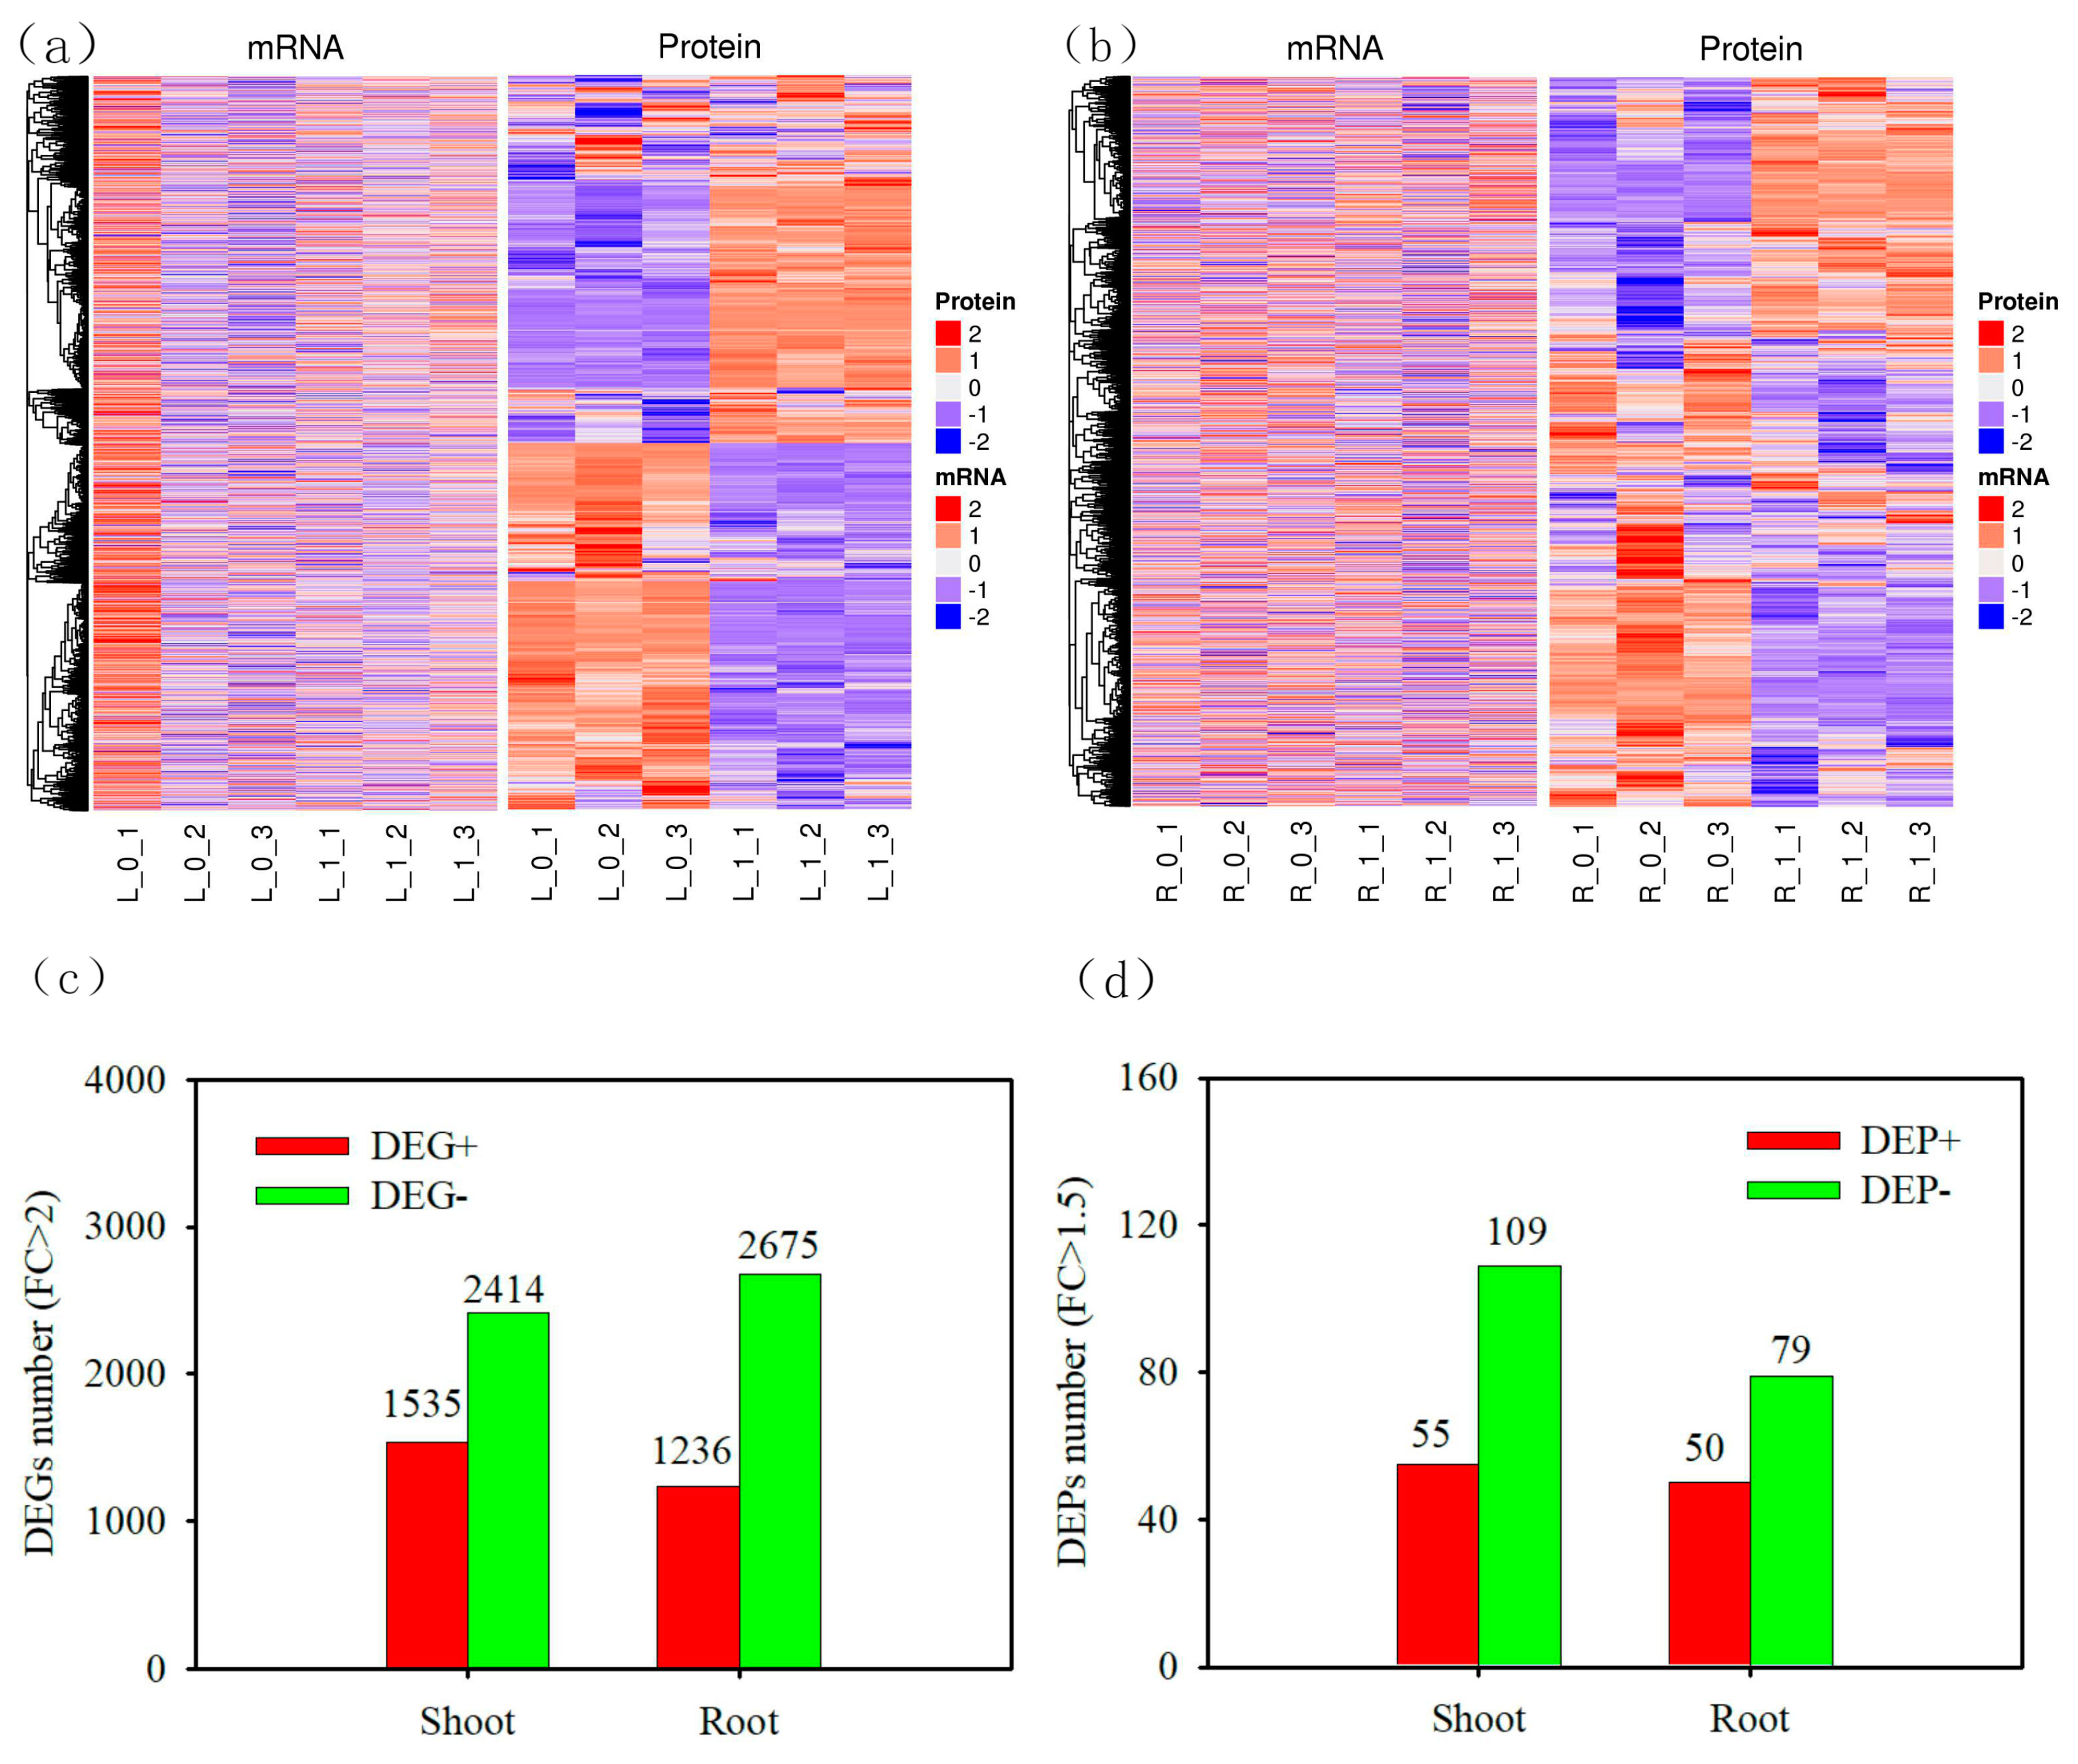
Under the condition of nitrogen deficit (N0), the number of up regulated DEGs in wheat shoot was 1535, while the number of down regulated DEGs in wheat shoot was 2414 (
Figure 2c). In wheat root, the number of up regulated DEGs and down regulated DEGs were 1236 and 2675 respectively. The number of up regulated DEPs in wheat shoot was 55, while down regulated DEPs of wheat shoot was 109 (
Figure 2d). The number of up regulated DEPs in wheat root was 50, while down regulated DEPs of wheat root was 79.
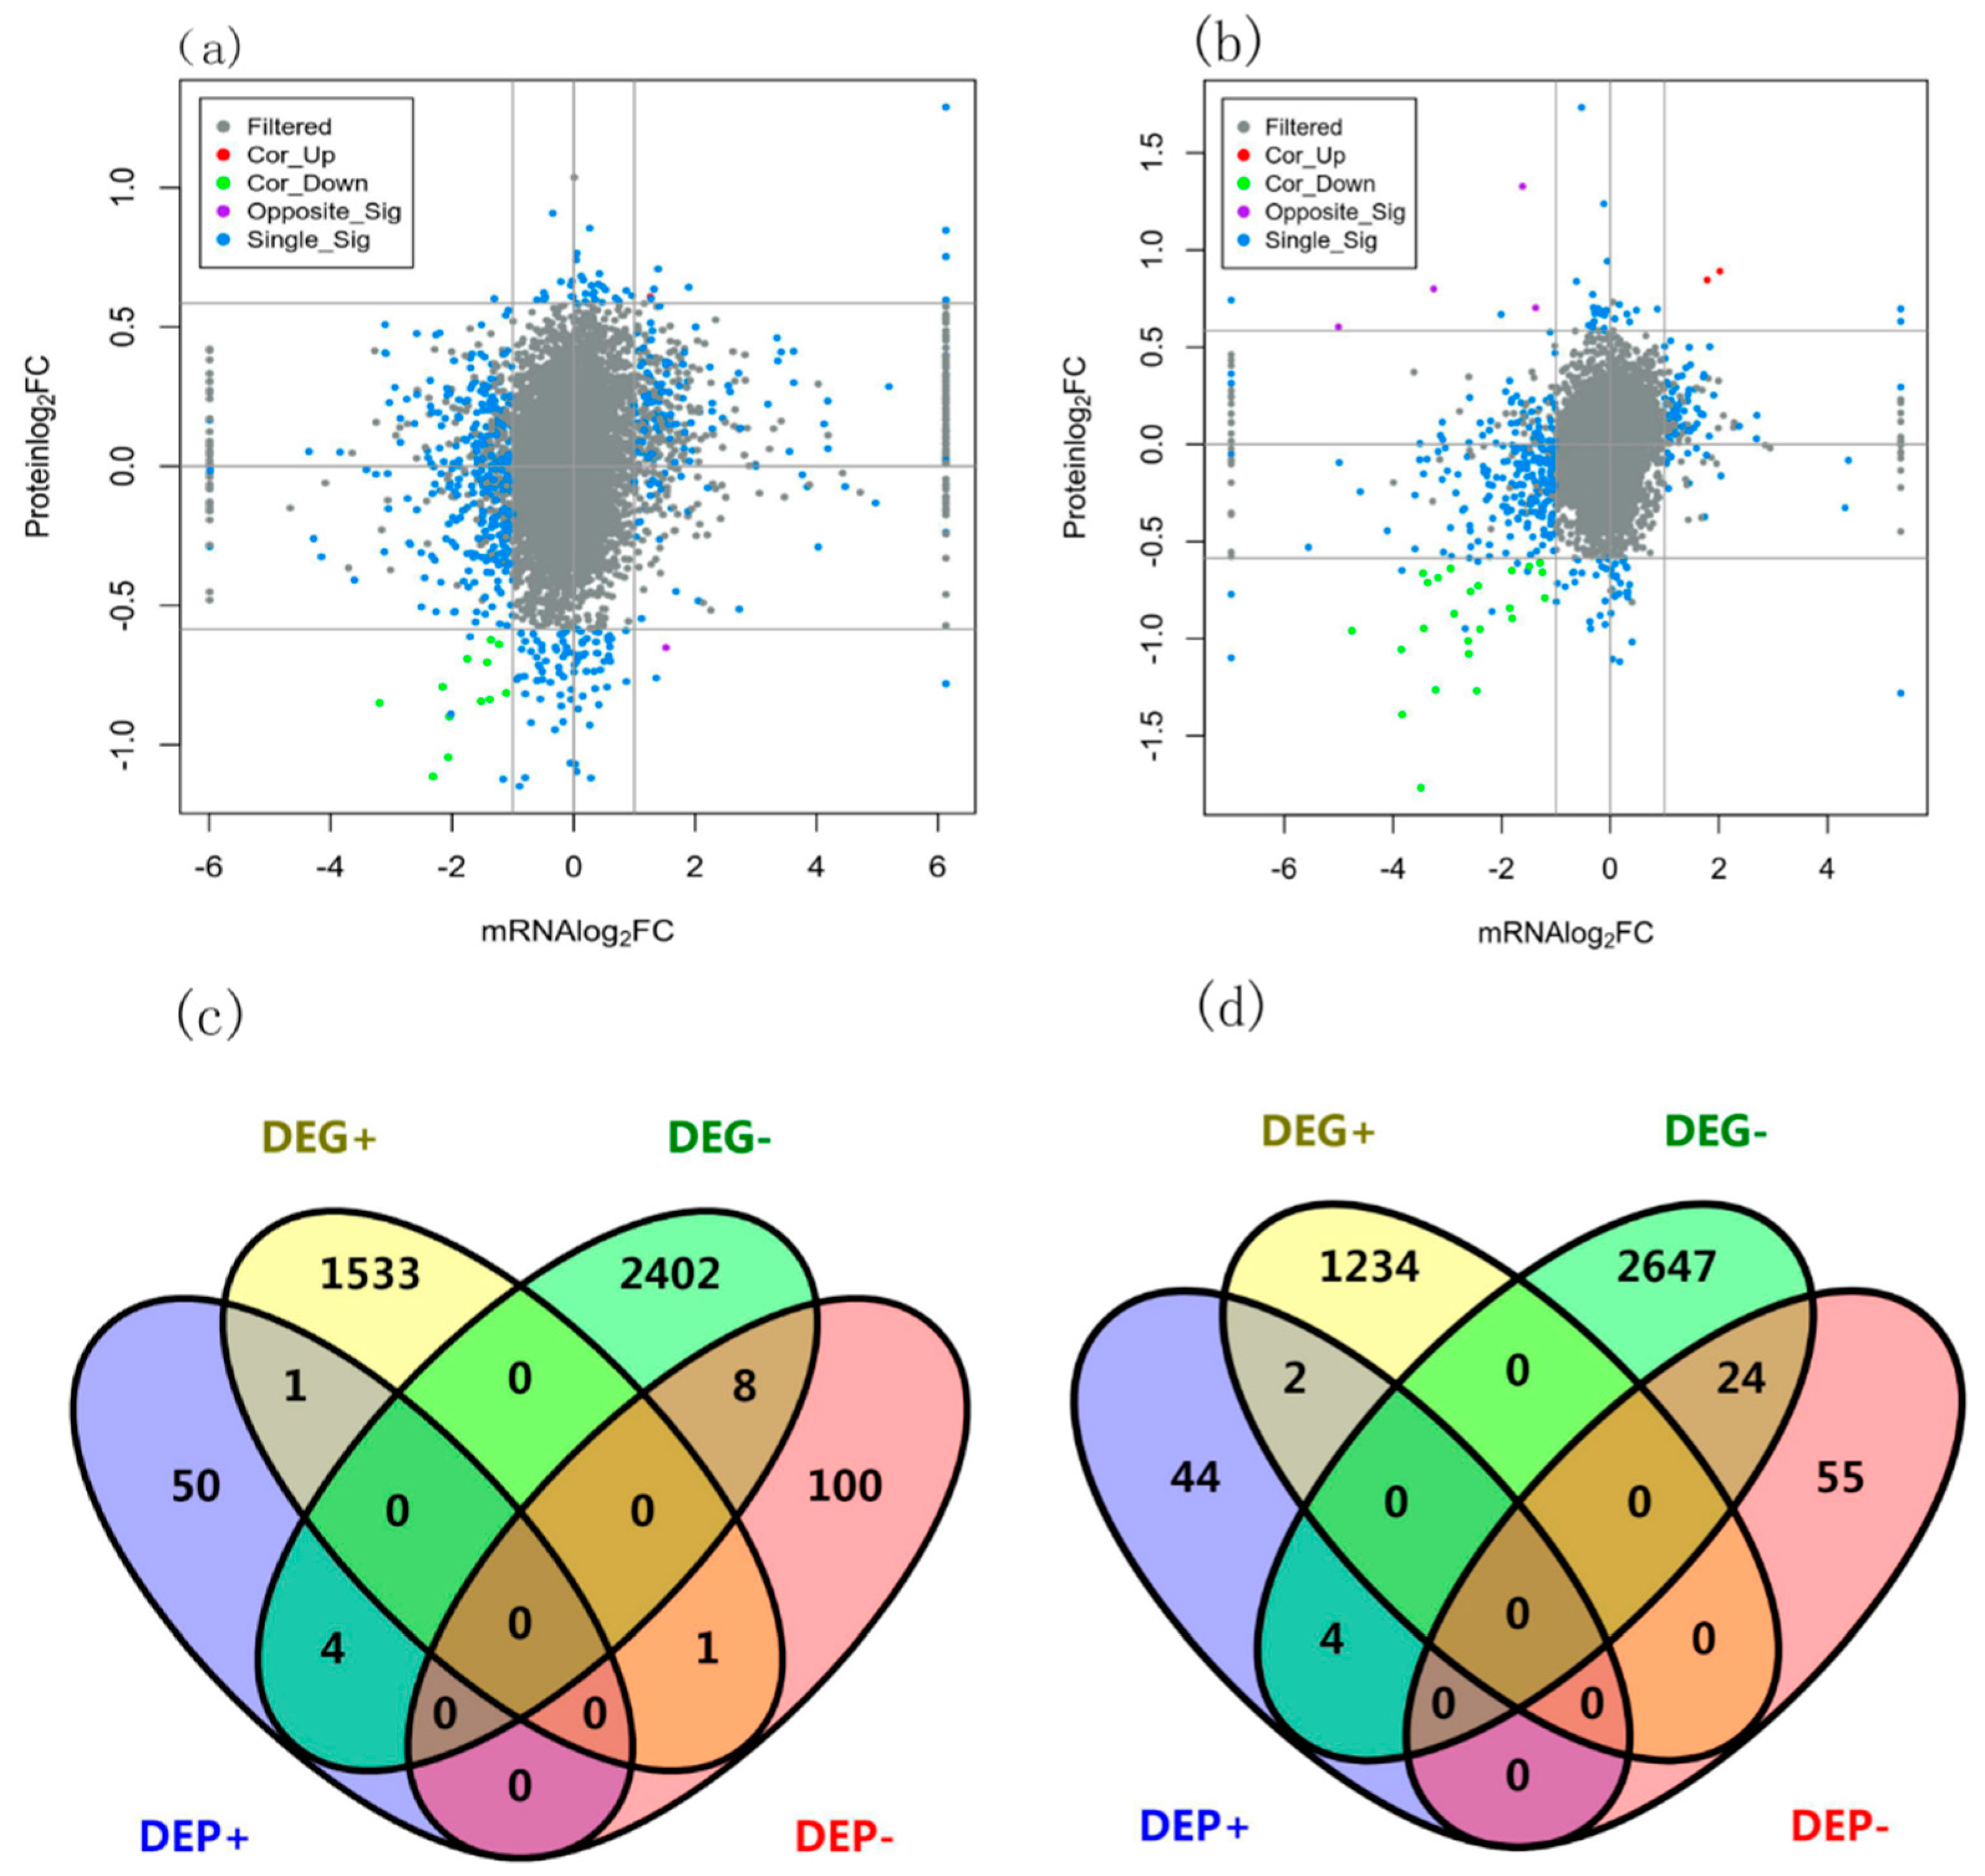
The scatter plots of DEGs and DEPs of wheat shoot and root were dispersed (
Figure 3a, b), indicating that post transcriptional regulation played an important role in protein content. In wheat shoot, the trends of RNA and protein of 9 genes were the same, but 5 genes were opposite; in wheat root, the trends of RNA and protein of 26 genes were the same, but 4 genes were opposite (
Figure 3). Among the 1535 up regulated DEGs of wheat shoot, 1 DEP was up regulated and 1 DEP was down regulated (
Figure 3c). Among the 2414 down regulated DEGs of wheat shoot, 4 DEPs were up regulated and 8 DEP was down regulated. Among there were 1236 up regulated DEGs of wheat root, 2 DEPs were up regulated and 0 DEP was down regulated (
Figure 3d). Among the 2675 down regulated DEGs of wheat shoot, 4 DEPs were up regulated and 24 DEPs were down regulated.
3.3. Pathway enrichment of wheat shoot and root under nitrogen deficit
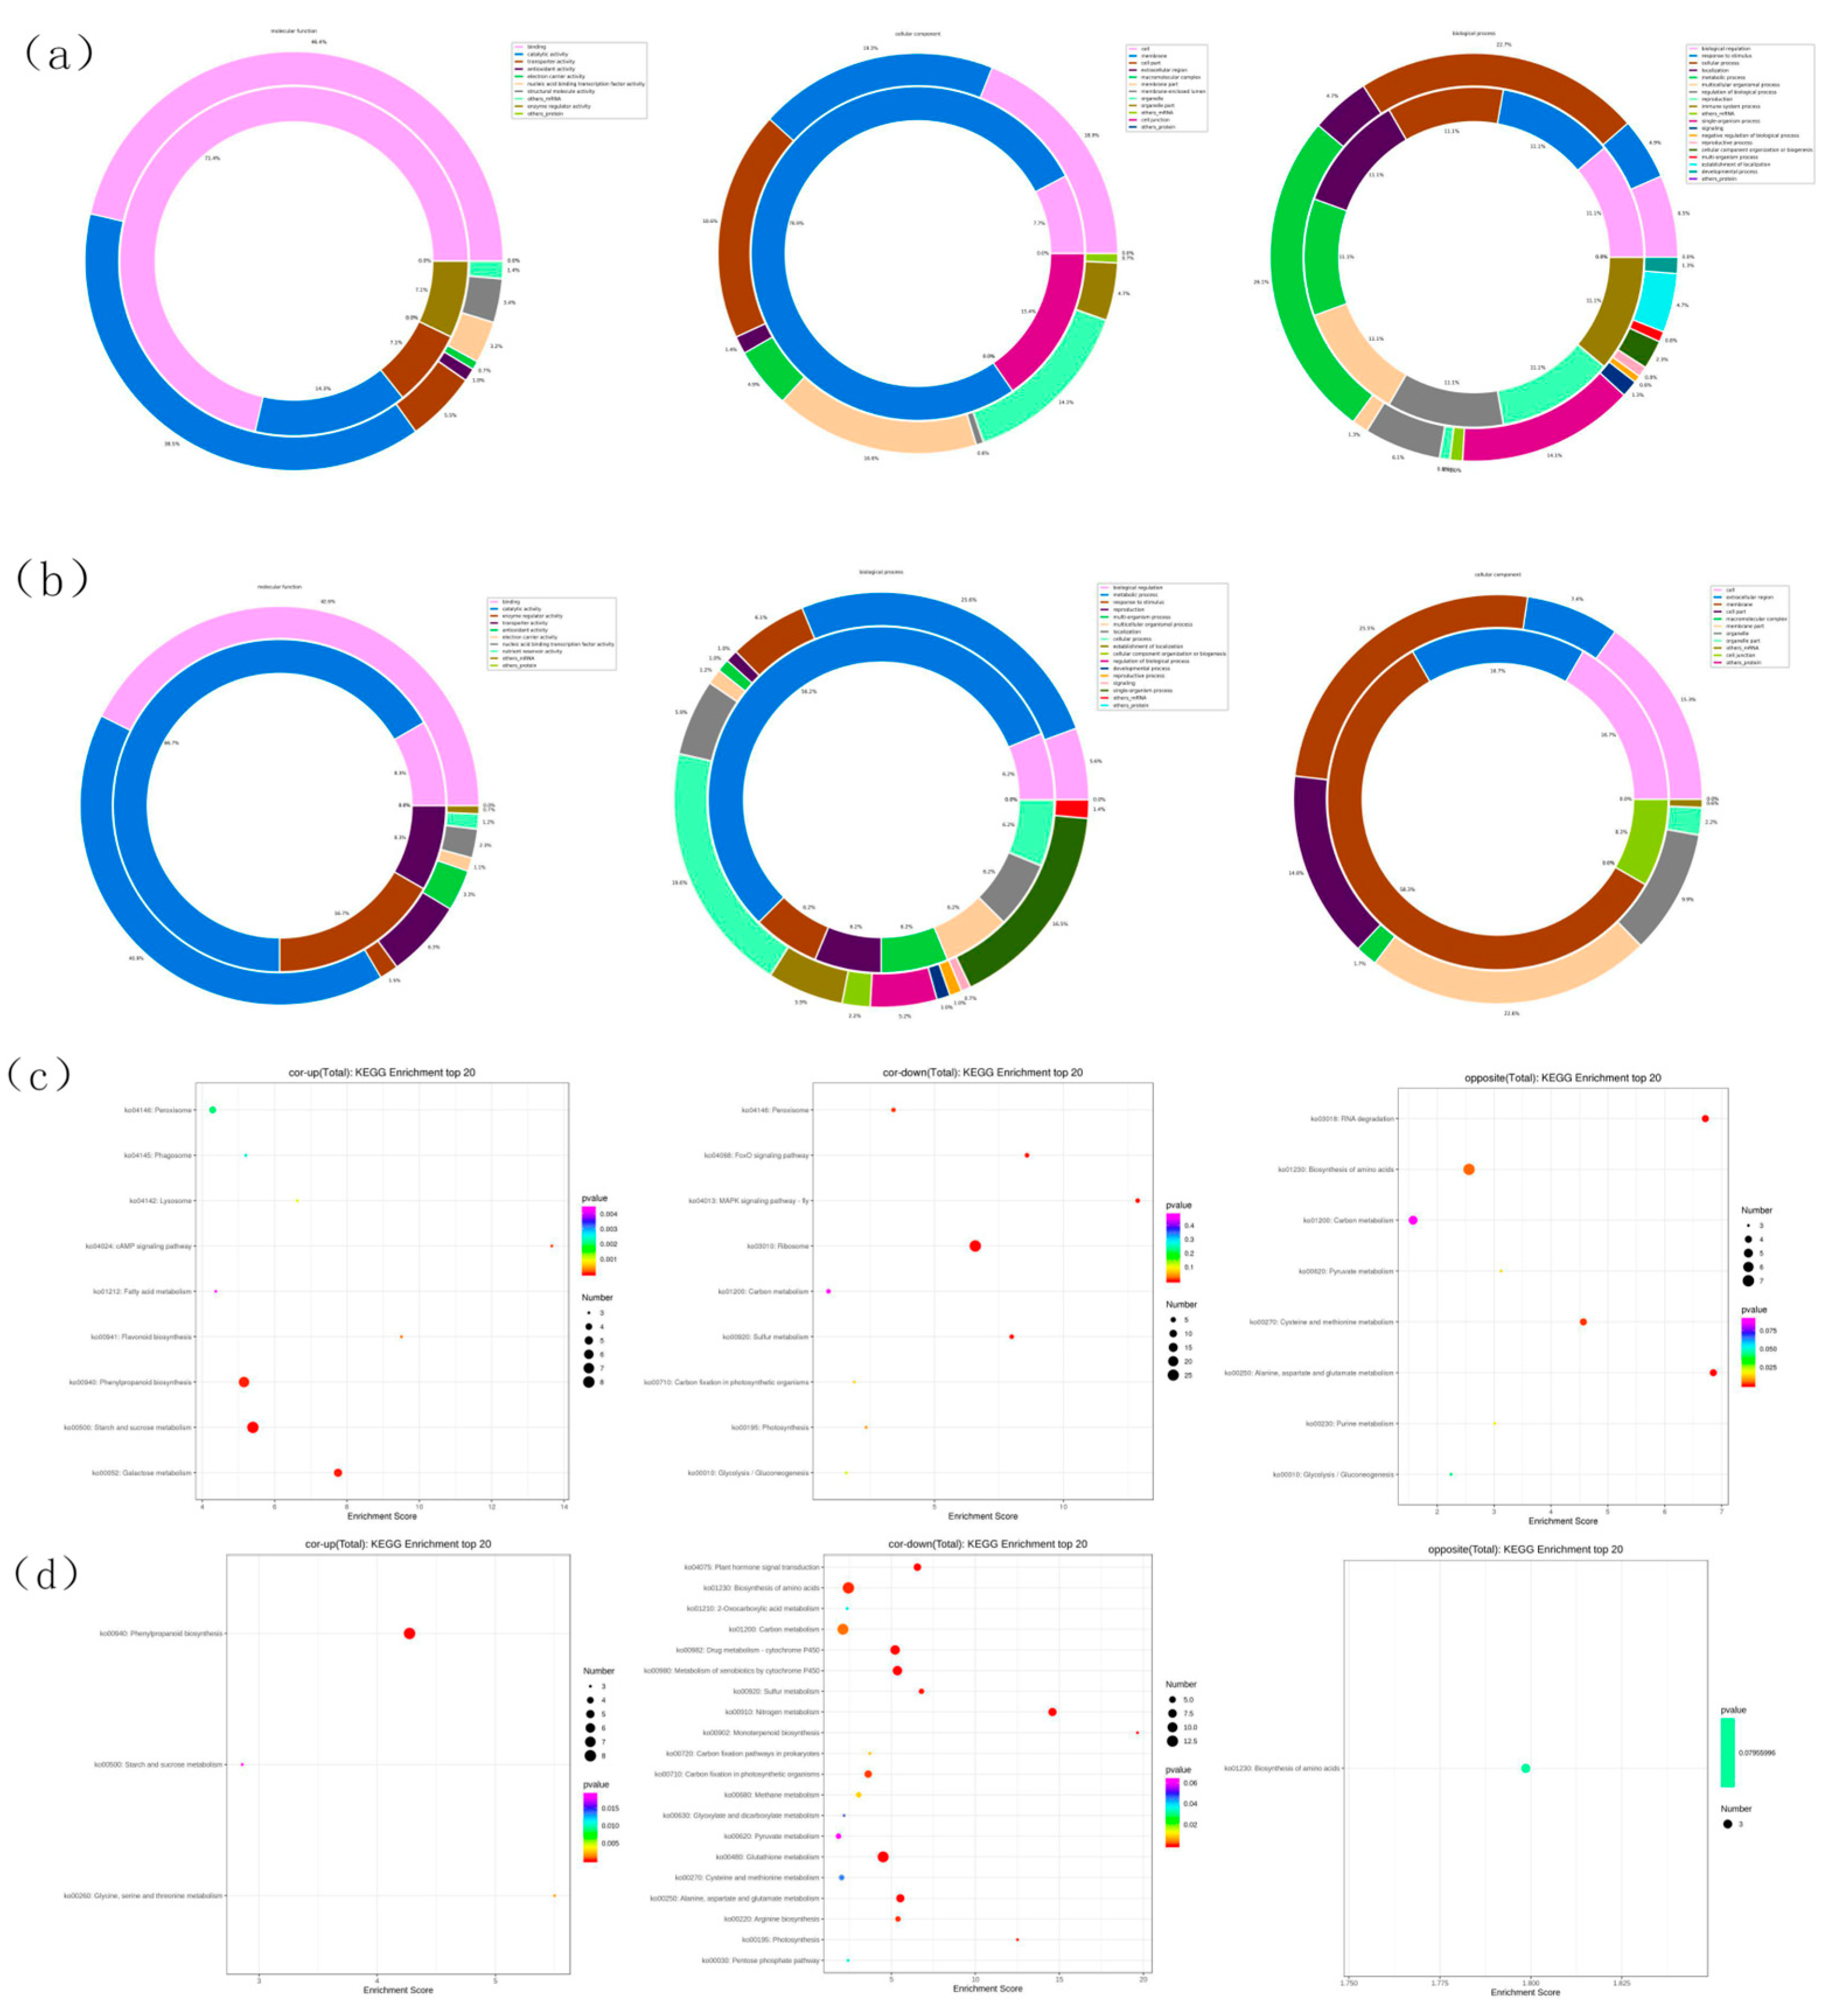
GO pathway enrichment in transcriptome and proteome showed that DEGs with binding function were the most in shoot’s molecular function, accounting for 46.4% of total DEGs, while 71.4% of total DEPs (
Figure 4a); DEGs with membrane function were the most in cellular component, accounting for 19.3% of total DEGs, while 76.9% in total DEPs; among the biological programs, cellular programs had the most DEGs, accounting for 22.7% of the total DEGs, while 11.1% of the total DEPs.
The DEGs of binding function were the most in root’s molecular function, accounting for 42.6% of the total DEGs, while 8.3% of the total DEPs (
Figure 4b); the DEGs of membrane function were the most in cellular component, accounting for 25.5% of the total DEGs, while 58.3% of the total DEPs; the DEGs of metabolic progress were the most in biological progress, accounting for 25.6% of the total DEGs, while 56.2% of the total DEPs.
The enrichment of KEGG pathways in shoot’s transcriptome and proteome showed that, among the cor-up enrichment pathways, cAMP signaling pathway achieved the highest enrichment score (
Figure 4c); among the cor-down enrichment pathways, MAPK signaling pathway achieved the highest enrichment score; among the opposite enrichment pathways, Alanine, aspartate and glutamate metabolism achieved the highest enrichment score.
The enrichment of KEGG pathways in root’s transcriptome and proteome showed that, among the cor-up enrichment pathways, Glycine, serine and threonine metabolism achieved the highest enrichment score (
Figure 4d); among the cor-down enrichment pathways, Monoterpenoid biosynthesis achieved the highest enrichment score; among the opposite enrichment pathways, Biosynthesis of amino acids achieved the highest enrichment score.
3.4. Differential genes in photosynthesis and carbon metabolism
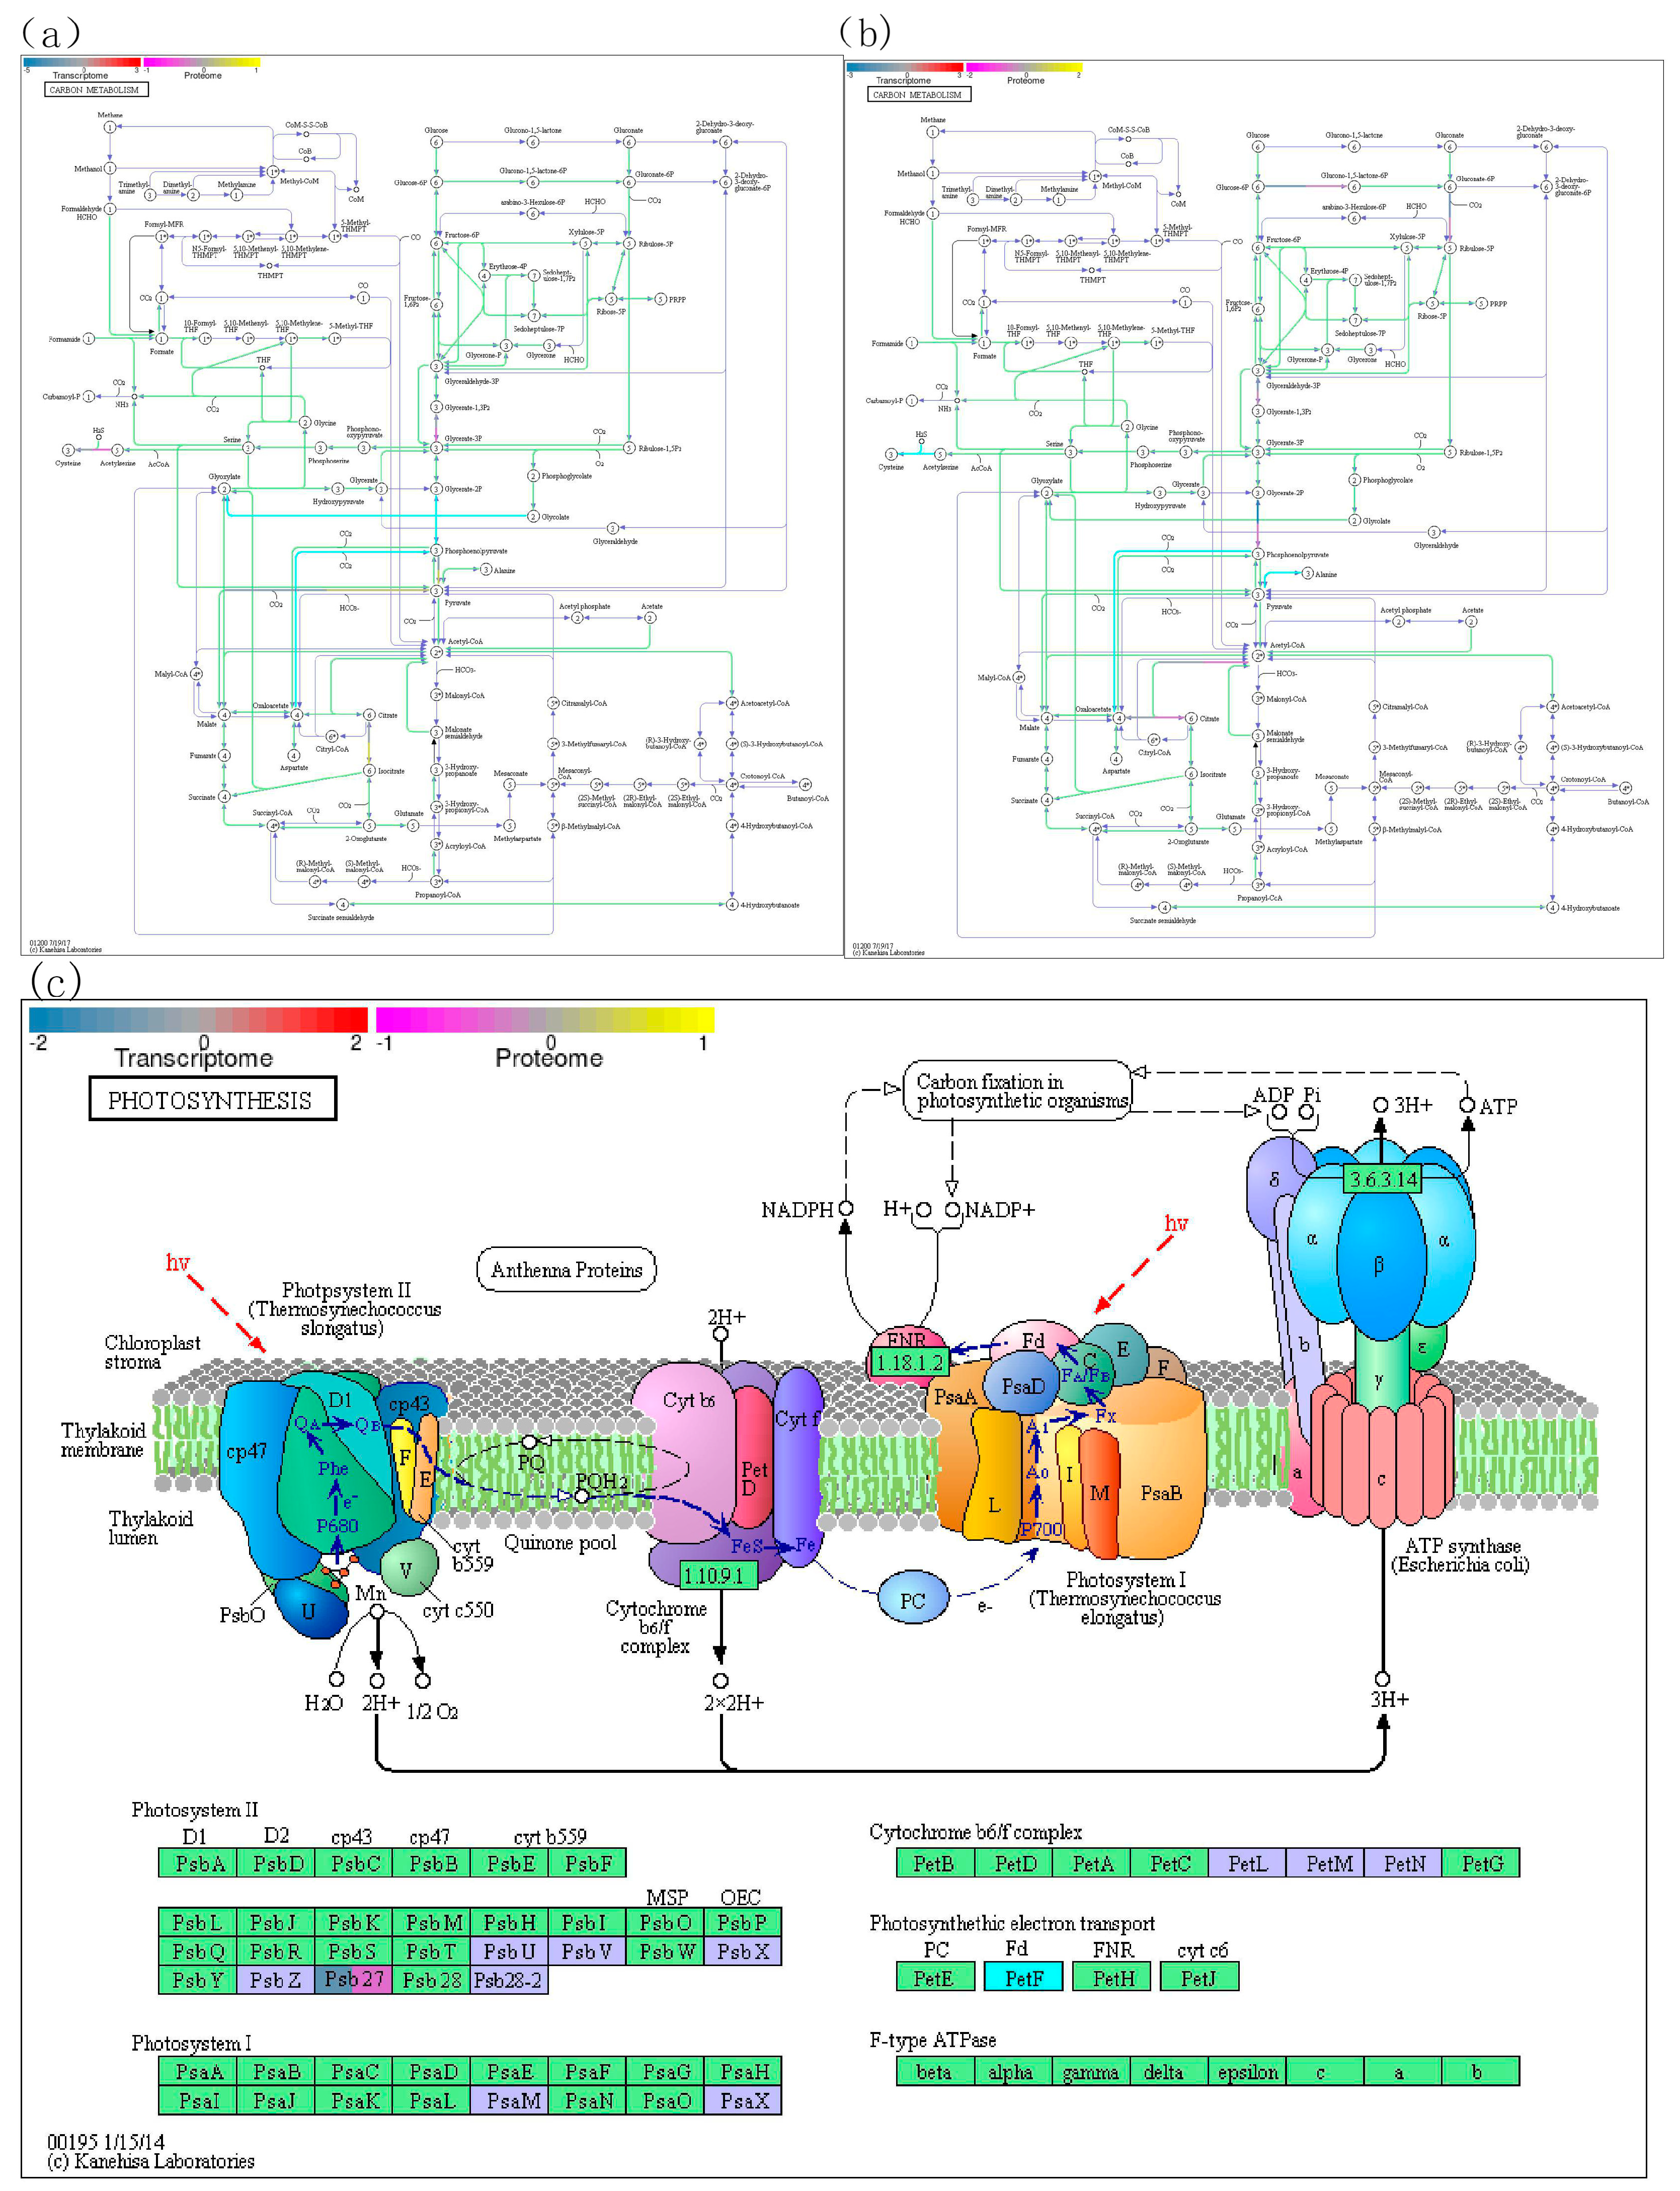
Under nitrogen deficit, the cor-down enrichment score enriched in shoot carbon metabolism and photosynthesis pathway of wheat ranked 6th and 9th in all pathways, and the cor-down enrichment score enriched in root carbon metabolism of wheat ranked 16th in all pathways (
Figure 4b, d).
The candidate genes of the above four pathways were queried in NCBI and UNIPROT databases. TraesCS4A02G134100 and TraesCS4A02G28670 involved in shoot photosynthesis pathway (
Figure 5,
Table 1); TraesCS5D02G027600, TraesCS1D02G313800, TraesCS4B02G220200 and TraesCS4A02G083900 involved in shoot carbon metabolism; 12 genes, such as TraesCS1A02G357200, TraesCS7A02G075600 and TraesCS5D02G422000, were involved in carbon metabolism of wheat root.
4. Discussion
Photosystem I (PS I) and photosystem II (PS II) absorbed photons with wavelengths of 700nm and 680nm as energy, respectively, and electrons are continuously transferred from the photolysis process of water molecules, finally, it was transferred to NADP+ (Milo 2009; Efrati et al. 2013).
In PS I, the primary receptor of P700 is chloroplast A molecule and the secondary receptor is two leaf quinone molecules, then, the electron is transferred to a 4Fe-4S center ferrithionein (FeSx). Finally, the electron is supplied to the Ferredoxin containing 2Fe-2S center, and NADP + was reduced to NADPH by NADP reductase (FNR). Ferredoxin is an iron- and sulphur-containing protein found in plants and microorganisms and involved in photosynthesis and nitrogen fixation [28-32] (Li et al. 1991; QA et al. 1994; Sonoike 1996; Sonoike et al. 1997; Krzysztof et al. 2001).
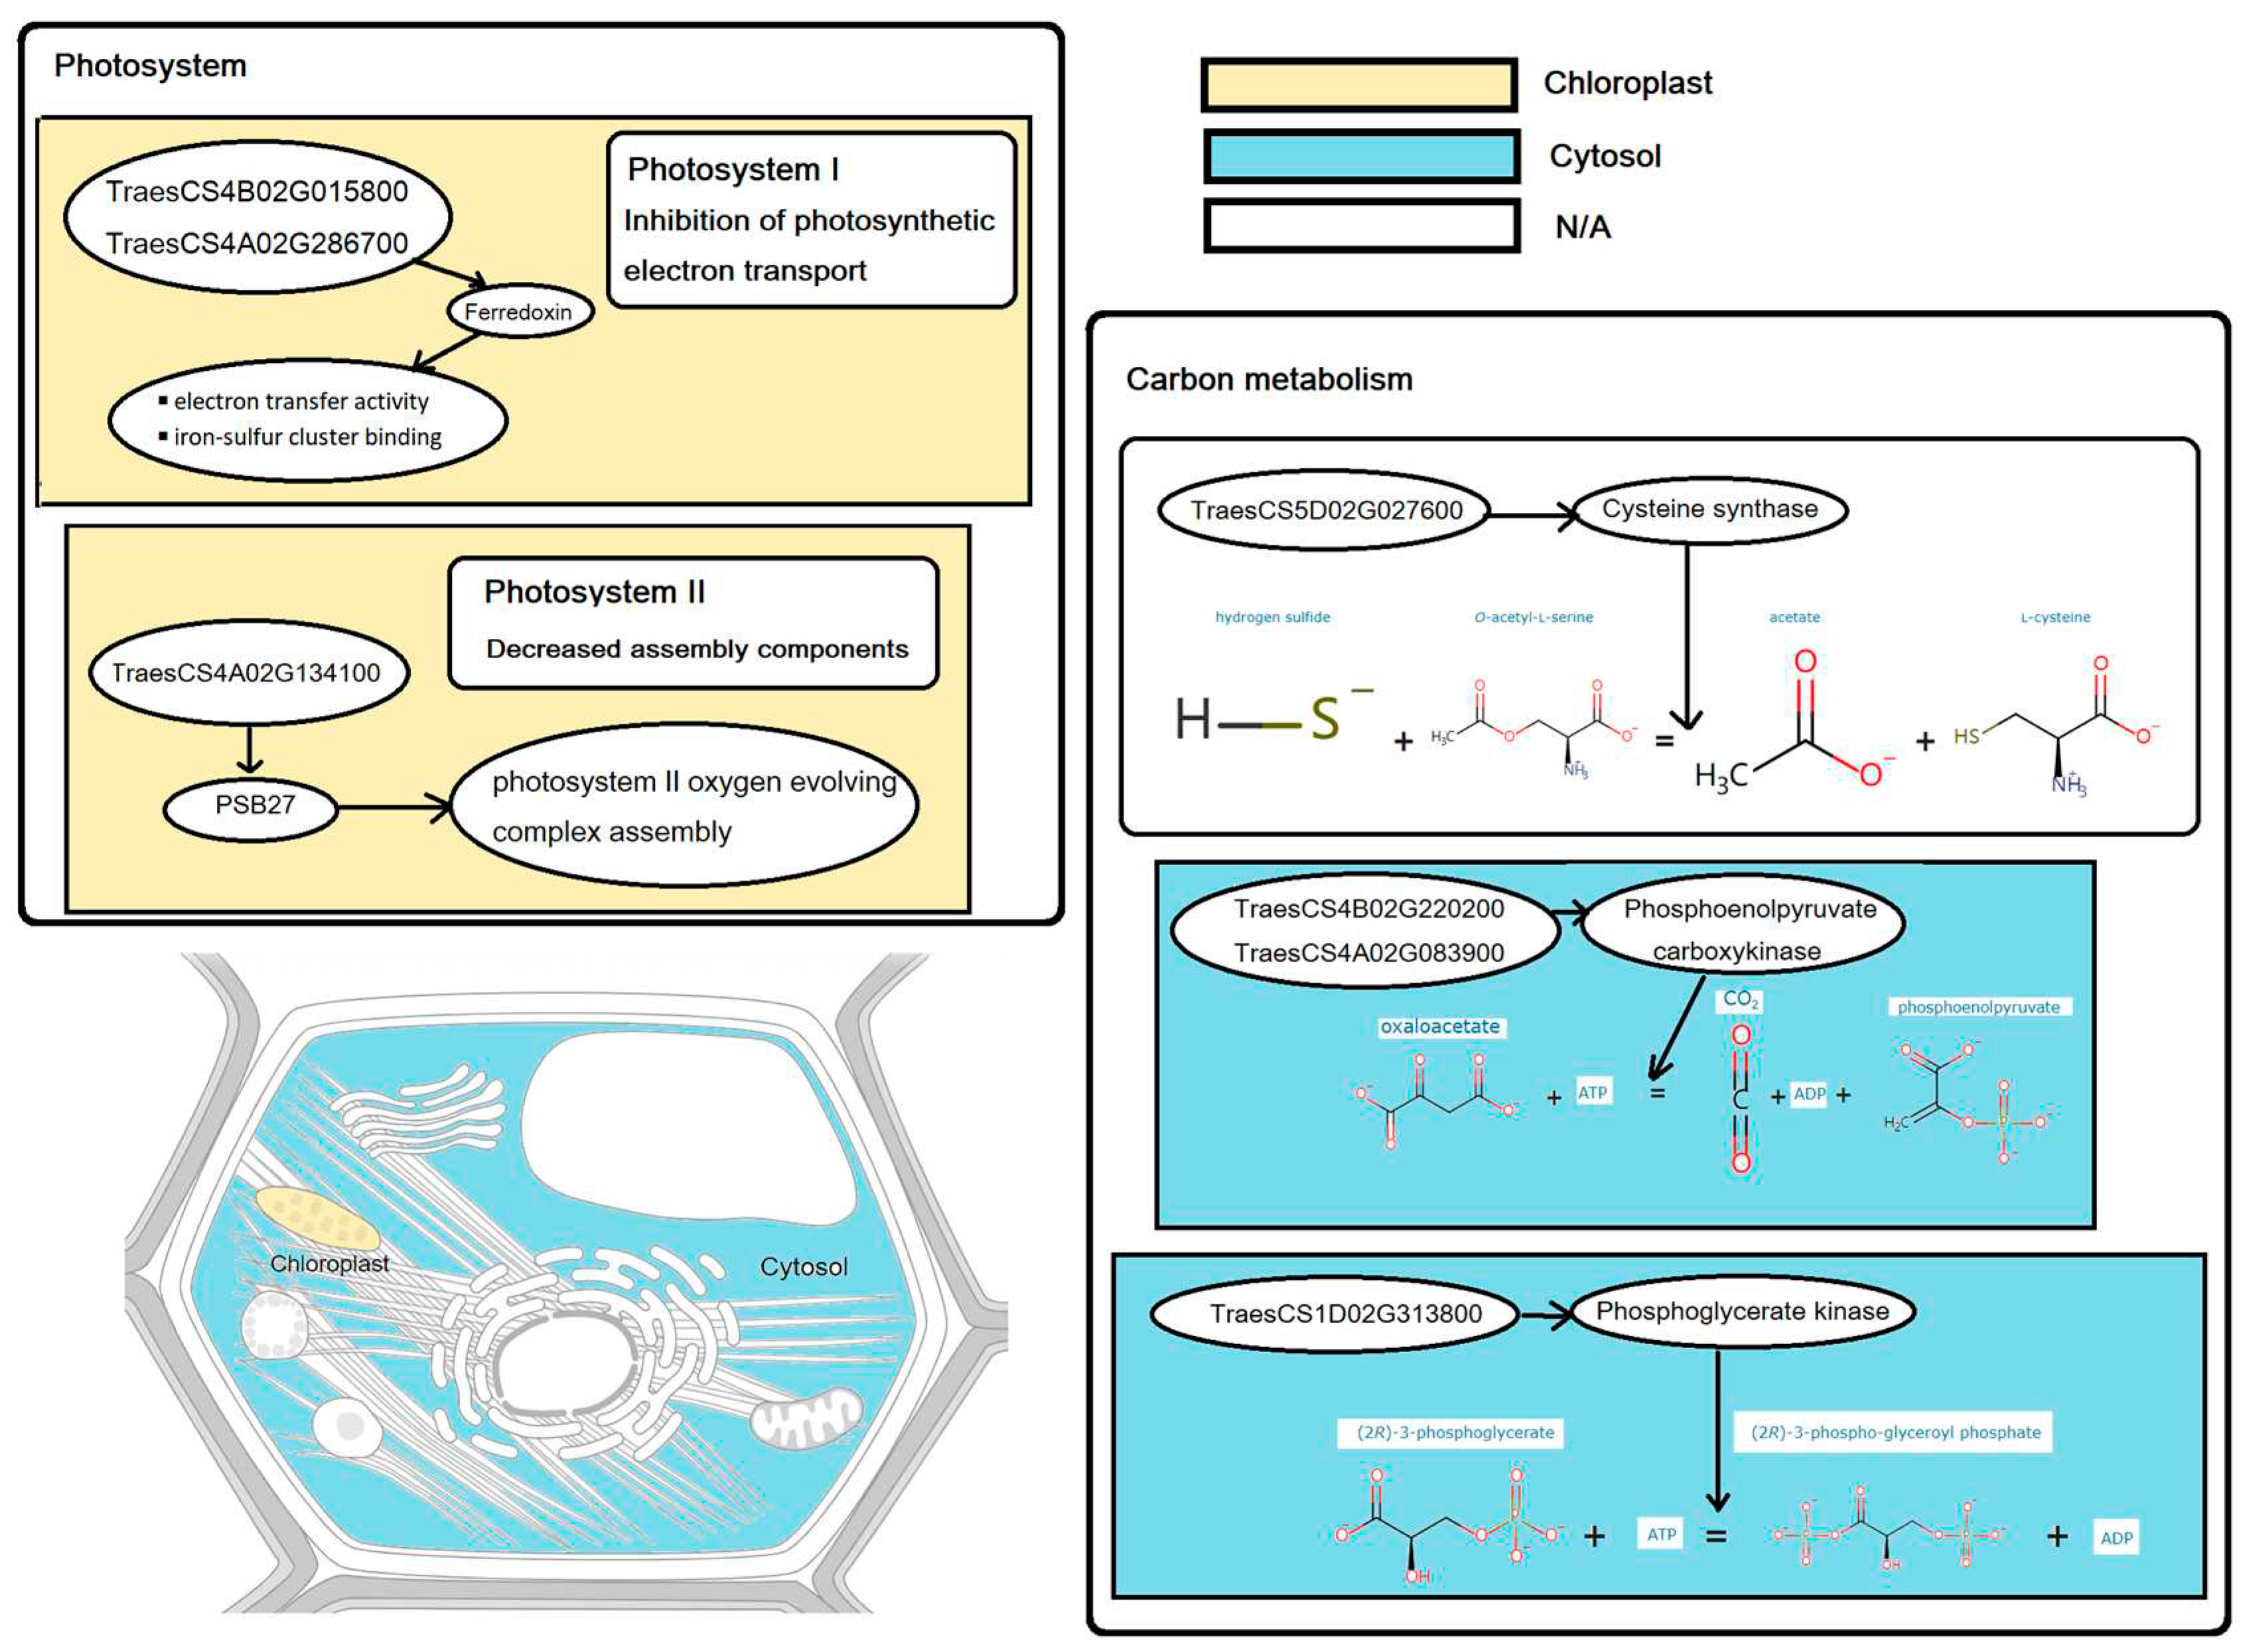
Under nitrogen deficit, two genes (TraesCS4B02G015800 and TraesCS4A02G286700), which related to Ferredoxin, were down regulated in both RNA and protein levels (
Figure 6, yellow part). The decrease of Ferredoxin (named PetF in photosystem I) may result in the obstruction of photoelectron reception and the reduction reaction of NADP+ in PS I.
PS II complex is a photosynthetic unit in thylakoid membrane, which is to use the energy absorbed from light to cleave water and transfer the electron to plastid quinone, meanwhile, H+ proton gradient is established on both sides of thylakoid membrane (Gerken et al. 1988; Post et al. 2010; Lukáš et al. 2016). Because P700 in PS I becomes excited and loses one electron when exposed to light, it needs to be supplemented by electrons transferred from PS II. The two photosystems jointly transfer the electrons released from water splitting interpretation to NADP+.
PSB protein family members are important subassemblies of Photosystem II complex (Thornton et al. 2004; Dobakova et al. 2009; Torabi et al. 2014; Fristedt et al. 2017). Photosystem II complex is a photosynthetic unit in thylakoid membrane, which is to use the energy absorbed from light to cleave water and transfer the electron to plastid quinone. Under nitrogen deficit, previous study provided 8 down-regulated DEGs belonged to the Psb family. This study proposed PSB27 protein (TraesCS4A02G134100) was both down-regulated in RNA and protein levels, and may weaken the function of photosystem II (
Figure 6, yellow part).
In the carbon metabolism pathway of wheat shoot, both RNA and protein of Cysteine synthase (Wang et al. 2020), Phosphoenolpyruvate carboxykinase (Walker et al. 2015), Phosphoglycerate kinase (Rosa-Tellez et al. 2018) were decreased under nitrogen deficit. The decrease of the above enzymes may lead to the decline of acetate, L-cysteine, phosphoenolpyruvate, (2R)-3-phospho-glyceroyl phosphate, and it is not conducive to the conversion of ATP to ADP (
Figure 6, blue part).
In the carbon metabolism pathway of wheat root, both RNA and protein of Glucose-6-phosphate 1-dehydrogenase (Sharkey and Weise 2017), 6-phosphogluconate dehydrogenase (Christian et al. 2016), decarboxylating (Greenway and Sims 1974), Glyceraldehyde-3-phosphate dehydrogenase (Tsuchiya et al. 2015), Cysteine synthase (Wang et al. 2020), Phosphopyruvate hydratase (Sun et al. 2016), Phosphoenolpyruvate carboxylase (Walker et al. 2015) were decreased under nitrogen deficit. The decrease of the above enzymes may lead to the decline of corresponding biochemical reactions.
Meanwhile, we discovered that the RNA and protein of Cysteine synthase, Phosphoenolpyruvate carboxykinase were both declined in wheat root and shoot under nitrogen deficit. The decreased Cysteine synthase might lead to the decrease of L-Cysteine (Li et al. 2016), and decline the function of resistance and elimination of crop pathogens.
Through our research on transcriptome and proteome of wheat root and shoot under nitrogen deficit, pathway enrichment of photosynthesis and carbon metabolism illustrated candidate genes, which could be used in improving nitrogen availability of wheat by molecular breeding in the future.
5. Conclusions
Under nitrogen deficit condition, the fresh weight, N content and net photosynthetic rate of winter wheat shoot and root were reduced as compared to control. 3949 and 2675 differentially expressed genes (DEGs) were identified in the shoot and root, respectively, while 164 and 129 differentially expressed proteins (DEPs) were identified in the shoot and root respectively.
The scatter plots of DEGs and DEPs of wheat shoot and root were discrete. 9 genes in shoot and 26 genes in root showed the same trends in RNA and protein levels. 5 genes in shoot and 4 genes in root showed the opposite trends in RNA and protein levels.
Pathway enrichment of wheat transcriptome and proteome under nitrogen deficit proposed 3 candidate genes related to photosynthesis in shoot, 4 candidate genes related to carbon metabolism in shoot, and 12 candidate genes related to carbon metabolism in root.
Author Contributions
Conceptualization, Xin Liu, Chengmiao Yin, Changan Zhou, Xinyu Wang; methodology, Xin Liu; software, Xin Liu, Xinyu Wang; validation, Xin Liu, Changan Zhou; formal analysis, Xin Liu, Xinyu Wang; investigation, Xin Liu, Xinyu Wang; resources, Xin Liu, Chengmiao Yin, Changan Zhou; data curation, Xin Liu, Chengmiao Yin, Changan Zhou; writing—original draft preparation, Xin Liu, Chengmiao Yin, Changan Zhou; writing—review and editing, Xin Liu, Chengmiao Yin, Changan Zhou; visualization, Xin Liu, Chengmiao Yin, Changan Zhou; supervision, Xin Liu; project administration, Xin Liu; funding acquisition, Xin Liu.
Funding
This work was funded by the National Natural Science Foundation of China (Grant No. 31901457), China Postdoctoral Science Foundation (Grant No. 2019M652454)
Institutional Review Board Statement
The study did not require ethical approval.
Informed Consent Statement
Not applicable
Acknowledgments
We thank Xingju Zhang in ShanDong Shofine Seed Technology Co., Ltd. for providing the wheat seeds.
Conflicts of Interest
The authors declare no conflict of interest.
References
- Catusse, J.; Job, C.; Job, D. Transcriptome- and proteome-wide analyses of seed germination. C R Biol. 2008, 331, 815–822. [Google Scholar] [CrossRef]
- Christian, H.; Lutterbey, M.C.; Lansing, H.; Meyer, T.; Schaewen, A.V. Defects in peroxisomal 6-phosphogluconate dehydrogenase isoform PGD2 prevent gametophytic interaction in Arabidopsis thaliana. Plant Physiol. 2016, 171. [Google Scholar]
- Dobakova, M.; Sobotka, R.; Tichy, M.; Komenda, J. Psb28 Protein Is Involved in the Biogenesis of the Photosystem II Inner Antenna CP47 (PsbB) in the Cyanobacterium Synechocystis sp. PCC 6803. Plant Physiol. 2009, 149, 1076–1086. [Google Scholar]
- Du, J.L. Effects of Nitrogen Fertilizer Application on Groundwater Pollution and Analysis of Control Strategies. J Environ Sci Manag. 2019, 44, 22–27. [Google Scholar]
- Dustin, N.L.; Steven, G.R.; Michael, P.; Rick, W.; Derek, S.; Darryl, H.; Jonathan, G.; Kermit, R.; Christoph, H.B.; Jörg, B. Quantitative iTRAQ proteome and comparative transcriptome analysis of elicitor-induced Norway spruce (Picea abies) cells reveals elements of calcium signaling in the early conifer defense response. Proteomics. 2009, 9, 350–367. [Google Scholar]
- Efrati, A.; Tel-Vered, R.; Michaeli, D.; Nechushtai, R.; Willner, I. Cytochrome c-coupled photosystem I and photosystem II (PSI/PSII) photo-bioelectrochemical cells. Energ Environ Sci. 2013, 6, 2950–2956. [Google Scholar] [CrossRef]
- Fristedt, R.; Trotta, A.; Suorsa, M.; Nilsson, A.K.; Croce, R.; Aro, E.M.; Lundin, B.R. PSB33 sustains photosystem II D1 protein under fluctuating light conditions. J Exp Bot. 2017, 4281–4293. [Google Scholar] [CrossRef]
- Gao, J.; Wang, F.; Hu, H.; Jiang, S.; Muhammad, A.; Shao, Y.; Sun, C.; Tian, Z.; Jiang, D.; Dai, T. Improved leaf nitrogen reutilisation and Rubisco activation under short-term nitrogen-deficient conditions promotes photosynthesis in winter wheat (Triticum aestivum L.) at the seedling stage. Funct Plant Biol. 2018, 45. [Google Scholar] [CrossRef]
- Gerken, S.; Brettel, K.; Schlodder, E.; Witt, H.T. Optical characterization of the immediate electron donor to chlorophyll a+II in O 2-evolving photosystem II complexes Tyrosine as possible electron carrier between chlorophyll aII and the water-oxidizing manganese complex. Febs Lett. 1988, 237, 69–75. [Google Scholar] [CrossRef]
- Greenway, H.; Sims, A.P. Effects of High Concentrations of KC1 and NaCl on Responses of Malate Dehydrogenase (Decarboxylating) to Malate and Various Inhibitors. Funct Plant Biol. 1974, 1, 15–29. [Google Scholar] [CrossRef]
- Honoki, R.; Ono, S.; Oikawa, A.; Saito, K.; Masuda, S. Significance of accumulation of the alarmone (p)ppGpp in chloroplasts for controlling photosynthesis and metabolite balance during nitrogen starvation in Arabidopsis. Photosynth Res. 2018, 135, 299–308. [Google Scholar] [CrossRef] [PubMed]
- Ji, W.; Xiao, J.; Toor, G.S.; Li, Z. Nitrate-nitrogen transport in streamwater and groundwater in a loess covered region: Sources, drivers, and spatiotemporal variation. Sci Total Environ. 2020. [Google Scholar] [CrossRef] [PubMed]
- Jiao, C.; Gu, Z. iTRAQ-based proteomic analysis reveals changes in response to UV-B treatment in soybean sprouts. Food Chem. 2019, 275, 467–473. [Google Scholar] [CrossRef]
- Kanehisa, M.; Furumichi, M.; Tanabe, M.; Sato, y.; Morishima, K. KEGG: new perspectives on genomes, pathways, diseases and drugs. Nucleic Acids Res. 2017, 45, 353–361. [Google Scholar] [CrossRef] [PubMed]
- Kanehisa, M.; Sato, Y.; Kawashima, M.; Furumichi, M.; Tanabe, M. KEGG as a reference resource for gene and protein annotation. Nucleic Acids Res. 2016, 44, D457–D462. [Google Scholar] [CrossRef] [PubMed]
- Krzysztof, G.V.M.; Ramesh, A.N.; Melkozernov; Su, L. Excitation Dynamics in the Core Antenna of PS I from Chlamydomonas reinhardtii CC 2696 at Room Temperature. J Phys Chem B. 2001, 105, 11498–11506.
- Lan, G.; Jiao, C.; Wang, G.; Sun, Y.; Sun, Y. Effects of dopamine on growth, carbon metabolism, and nitrogen metabolism in cucumber under nitrate stress. Sci Hortic-amsterdam. 2020, 260, 108790. [Google Scholar] [CrossRef]
- Li, C.; Wu, G.; Fang, R.; Huang, X.; Ren, W. L-Cysteine metabolism and its nutritional implications. Mol Nutr Food Res. 2016, 60, 134–146. [Google Scholar]
- Li, N.; Zhao, J.; Warren, P.V.; Warden, J.T.; Bryant, D.A.; Golbeck, J.H. PsaD is required for the stable binding of PsaC to the photosystem I core protein of Synechococcus sp. PCC 6301. Biochemistry 1991, 30, 7863–7872. [Google Scholar]
- Liu, F.; Qian, H.; Shi, Z.; Wang, H. Long-term monitoring of hydrochemical characteristics and nitrogen pollution in the groundwater of Yinchuan area, Yinchuan basin of northwest China. Enviro Earth Sci. 2019, 78, 1–15. [Google Scholar] [CrossRef]
- Liu, S.; Xie, Z.; Zeng, Y.; Liu, B.; Li, R.; Wang, Y.; Wang, L.; Qin, P.; Jia, B.; Xie, J. Effects of anthropogenic nitrogen discharge on dissolved inorganic nitrogen transport in global rivers. Global Change Biol. 2019, 25, 1493–1513. [Google Scholar] [CrossRef] [PubMed]
- Liu, X.; Yin, C.; Xiang, L.; Jiang, W.; Xu, S.; Mao, Z. Transcription strategies related to photosynthesis and nitrogen metabolism of wheat in response to nitrogen deficiency. BMC Plant Biol. 2020, 20, 448. [Google Scholar] [CrossRef] [PubMed]
- Liu, X.; Yuan, Y.; Martinez, C.; Babu, R.; Antonio, E. Identification of QTL for early vigor and leaf senescence across two tropical maize doubled haploid populations under nitrogen deficiency conditions. Euphytica. 2020, 216, 1–14. [Google Scholar] [CrossRef]
- Lukáš, N.; Dmitry, S.; Egbert, J.B.; Petr, I.; Roman, K. Structural variability of plant photosystem II megacomplexes in thylakoid membranes. Global Change Biol. 2016, 89, 104–111. [Google Scholar]
- Lv, X.; Zhang, Y.; Hu, L.; Zhang, Y.; Zhang, B.; Xia, H.; Du, W.; Fan, S.; Kong, L. Low-Nitrogen Stress Stimulates Lateral Root Initiation and Nitrogen Assimilation in Wheat: Roles of Phytohormone Signaling. J Plant Growth Regul 2020. [Google Scholar] [CrossRef]
- Lyu, L.; Bi, Y.; Li, S.; Xue, H.; Li, Y.; Pruskyab, D.B. Sodium silicate prime defense responses in harvested muskmelon by regulating mitochondrial energy metabolism and reactive oxygen species production. Food Chem. 2019, 289, 369–376. [Google Scholar] [CrossRef] [PubMed]
- Milo, R. What governs the reaction center excitation wavelength of photosystems I and II Photosynth Res. 2009, 101, 59–67. 101.
- Ouyang, L.; Pei, H.; Xu, Z. Low nitrogen stress stimulating the indole-3-acetic acid biosynthesis of Serratia sp. ZM is vital for the survival of the bacterium and its plant growth-promoting characteristic. Arch Microbrol. 2016, 199, 425–432. [Google Scholar] [CrossRef] [PubMed]
- Post, A.F.; Arnold, V.; Mur, L.R. Regulation of cyanobacterial photosynthesis determined from variable fluorescence yields of photosystem II. Fems Microbiol Lett. 2010, 35, 129–133. [Google Scholar] [CrossRef]
- Qa, X.U.; La, Y.; Chitnis, V.P.; Chitnis, P.R. Function and organization of photosystem I in a cyanobacterial mutant strain that lacks PsaF and PsaJ subunits. J Biol Chem. 1994, 269, 3205–3211. [Google Scholar]
- Rosa-Tellez, S.; Djoro Anoman, A.; Flores-Tornero, M.; Toujani, W.; Alseek, S.; Fernie, A.R.; Nebauer, S.G.; Munoz-Bertomeu, J.; Segura, J.; Ros, R. Phosphoglycerate kinases are co-regulated to adjust metabolism and to optimize growth. Photosynth Res. 2018, 176, 1182. [Google Scholar] [CrossRef]
- Sharkey, T.D.; Weise, S.E. The glucose 6-phosphate shunt around the Calvin-Benson cycle. J Exp Bot. 2017, 68, 4731. [Google Scholar] [CrossRef] [PubMed]
- Sihvonen, M.; Pihlainen, S.; Lai, T.Y.; Salo, T.; Hyytiinen, K. Crop production, water pollution, or climate change mitigation—Which drives socially optimal fertilization management most. Agr Syst. 2021, 186. [Google Scholar] [CrossRef]
- Sonoike, K. Degradation of psaB gene product, the reaction center subunit of photosystem I, is caused during photoinhibition of photosystem I: Possible involvement of active oxygen species. Plant Sci. 1996, 115, 157–164. [Google Scholar] [CrossRef]
- Sonoike, K.; Kamo, M.; Hihara, Y.; Hiyama, T.; Enami, I. The mechanism of the degradation of psaB gene product, one of the photosynthetic reaction center subunits of Photosystem I, upon photoinhibition. Photosynth Res. 1997, 53, 55–63. [Google Scholar] [CrossRef]
- Sun, B.; Zhi, W.; Fei, Z. Molecular cloning of kuruma shrimp Marsupenaeus japonicus phosphopyruvate hydratase and its role in infection by white spot syndrome virus and Vibrio alginolyticus. Aquaculture. 2016, 455, 87–96. [Google Scholar] [CrossRef]
- Thomas, P.D. The Gene Ontology and the Meaning of Biological Function. Methods Mol Biol. 2017, 1446, 15. [Google Scholar]
- Thornton, L.E.; Ohkawa, H.; Roose, J.L.; Kashino, Y.; Keren, N.; Pakrasia, H.B. Homologs of Plant PsbP and PsbQ Proteins Are Necessary for Regulation of Photosystem II Activity in the Cyanobacterium Synechocystis 6803. Plant Cell. 2004, 16, 2164–2175. [Google Scholar] [CrossRef]
- Torabi, S.; Umate, P.; Manavski, N.; Plöchinger, M.; Kleinknecht, L.; Bogireddi, H.; Herrmann, R.G.; Wanner, G.; Schröder, W.P.; Meurer, J. PsbN Is Required for Assembly of the Photosystem II Reaction Center inNicotiana tabacum. Plant Cell. 2014, 26, 1183–1199. [Google Scholar] [CrossRef]
- Tsuchiya, K.; Tajima, H.; Kuwae, T.; Takeshima, T.; Ryoichi, I. Pro-apoptotic protein glyceraldehyde-3-phosphate dehydrogenase promotes the formation of Lewy body-like inclusions. Eur J Neurosci. 2015, 21, 317–326. [Google Scholar] [CrossRef]
- Walker, R.P.; Battistelli, A.; Moscatello, S.; Chen, Z.H.; Leegood, R.C.; Famiani, F. Phosphoenolpyruvate carboxykinase in cherry (L.) fruit during development. Ecol Eng. 2015, 52, 96–103. [Google Scholar]
- Wang, C.; Zheng, L.; Tang, Z.; Sun, S.; Ma, J.F.; Huang, X.Y.; Zhao, F.J. OASTL-A1 functions as a cytosolic cysteine synthase and affects arsenic tolerance in rice. J Exp Bot. 2020, 71, 3678–3689. [Google Scholar] [CrossRef] [PubMed]
- William, C.U. Modification of the Kjeldahl nitrogen determination method. Anal Chem. 1971, 43, 800–801. [Google Scholar]
- Wu, J.; Xu, Z.; Zhang, Y.; Chai, L.; Yi, H.; Deng, X. An integrative analysis of the transcriptome and proteome of the pulp of a spontaneous late-ripening sweet orange mutant and its wild type improves our understanding of fruit ripening in citrus. J Exp Bot. 2014, 65, 1651–1671. [Google Scholar] [CrossRef] [PubMed]
- Yin, Y.; Ying, H.; Xue, Y.; Zheng, H.; Zhang, Q.; Cui, Z. Calculating socially optimal nitrogen (N) fertilization rates for sustainable N management in China. Sci Total Environ. 2019, 688, 1162–1171. [Google Scholar] [CrossRef] [PubMed]
- Yuan, L.; Wang, J.; Xie, S.; Zhao, M.; Nie, L.; Zheng, Y.; Zhu, S.; Hou, J.; Chen, G.; Wang, C. Comparative Proteomics Indicates That Redox Homeostasis Is Involved in High- and Low-Temperature Stress Tolerance in a Novel Wucai (Brassica campestris L.) Genotype. Int J Mol Sci. 2019, 20, 3760. [Google Scholar] [CrossRef]
- Zhang, F.; Chen, X.; Vitousek, P. Chinese agriculture: An experiment for the world. Nature 2013, 497, 33–35. [Google Scholar] [CrossRef]
|
Disclaimer/Publisher’s Note: The statements, opinions and data contained in all publications are solely those of the individual author(s) and contributor(s) and not of MDPI and/or the editor(s). MDPI and/or the editor(s) disclaim responsibility for any injury to people or property resulting from any ideas, methods, instructions or products referred to in the content. |
© 2023 by the authors. Licensee MDPI, Basel, Switzerland. This article is an open access article distributed under the terms and conditions of the Creative Commons Attribution (CC BY) license (http://creativecommons.org/licenses/by/4.0/).
