Submitted:
20 December 2023
Posted:
20 December 2023
You are already at the latest version
Abstract
Keywords:
1. Introduction
2. Results
3. Discussion
4. Materials and Methods
4.1. Animals
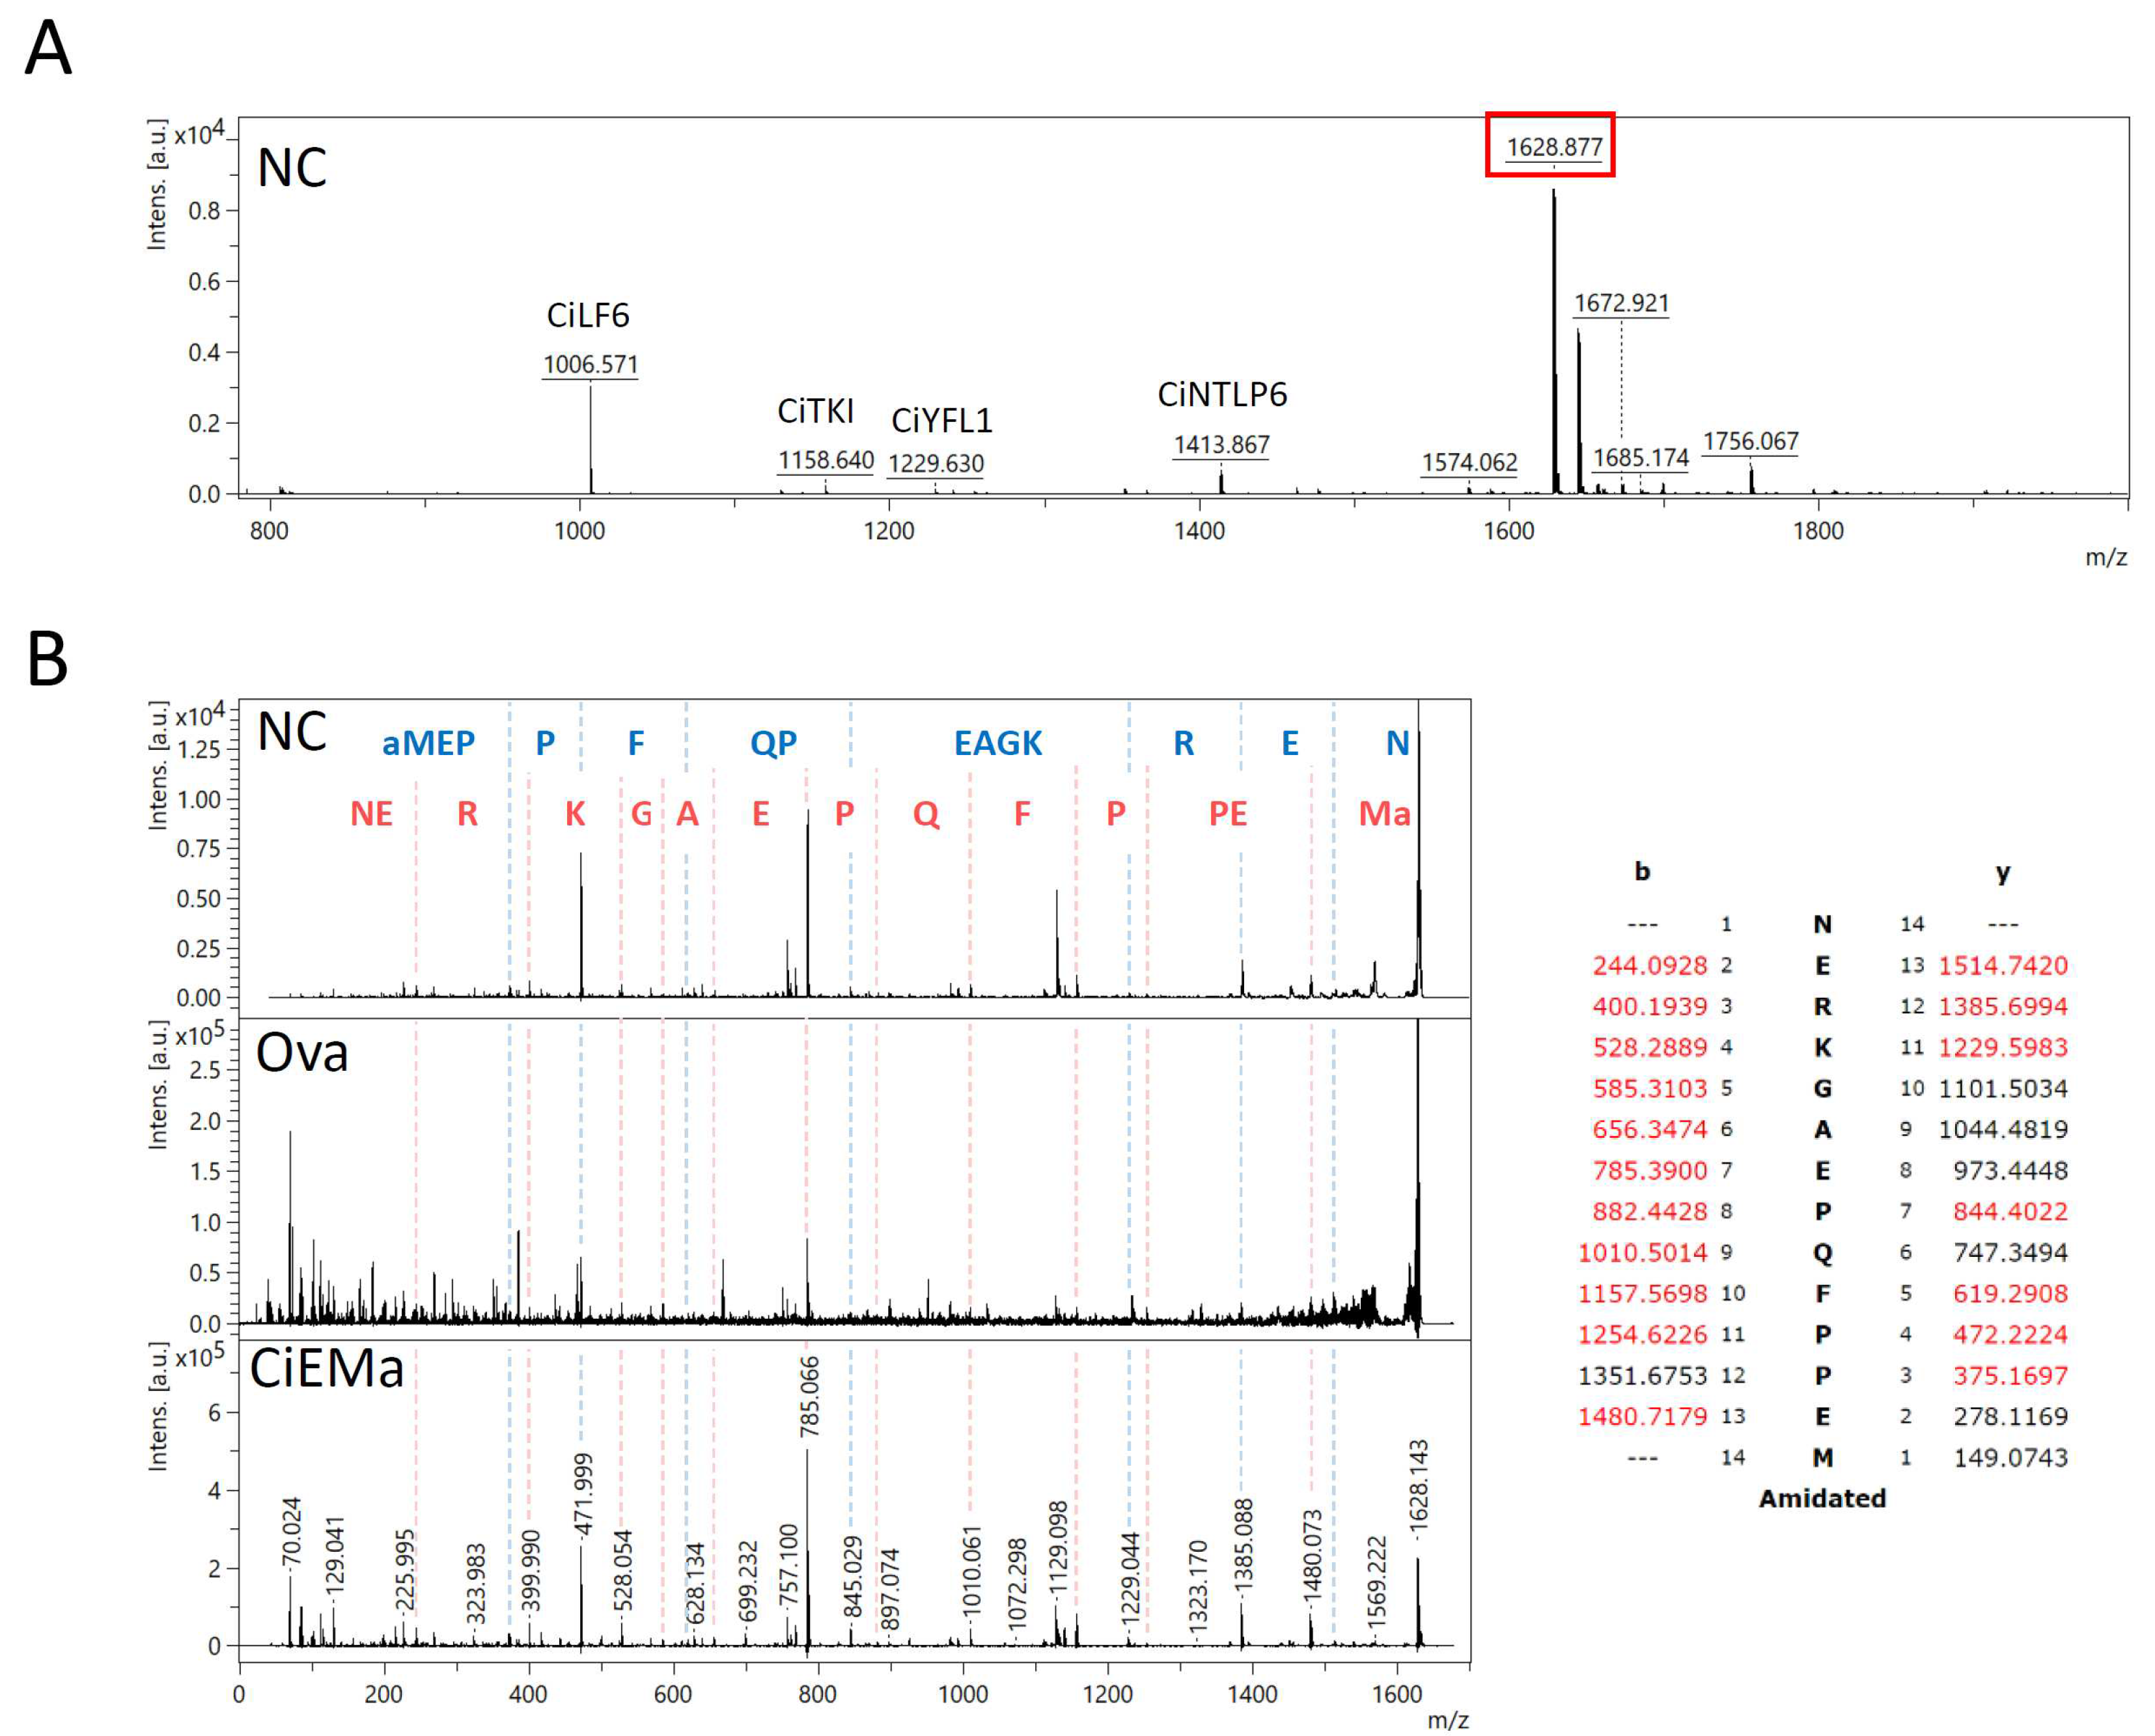
4.2. Peptide extraction and detection by mass spectrometry
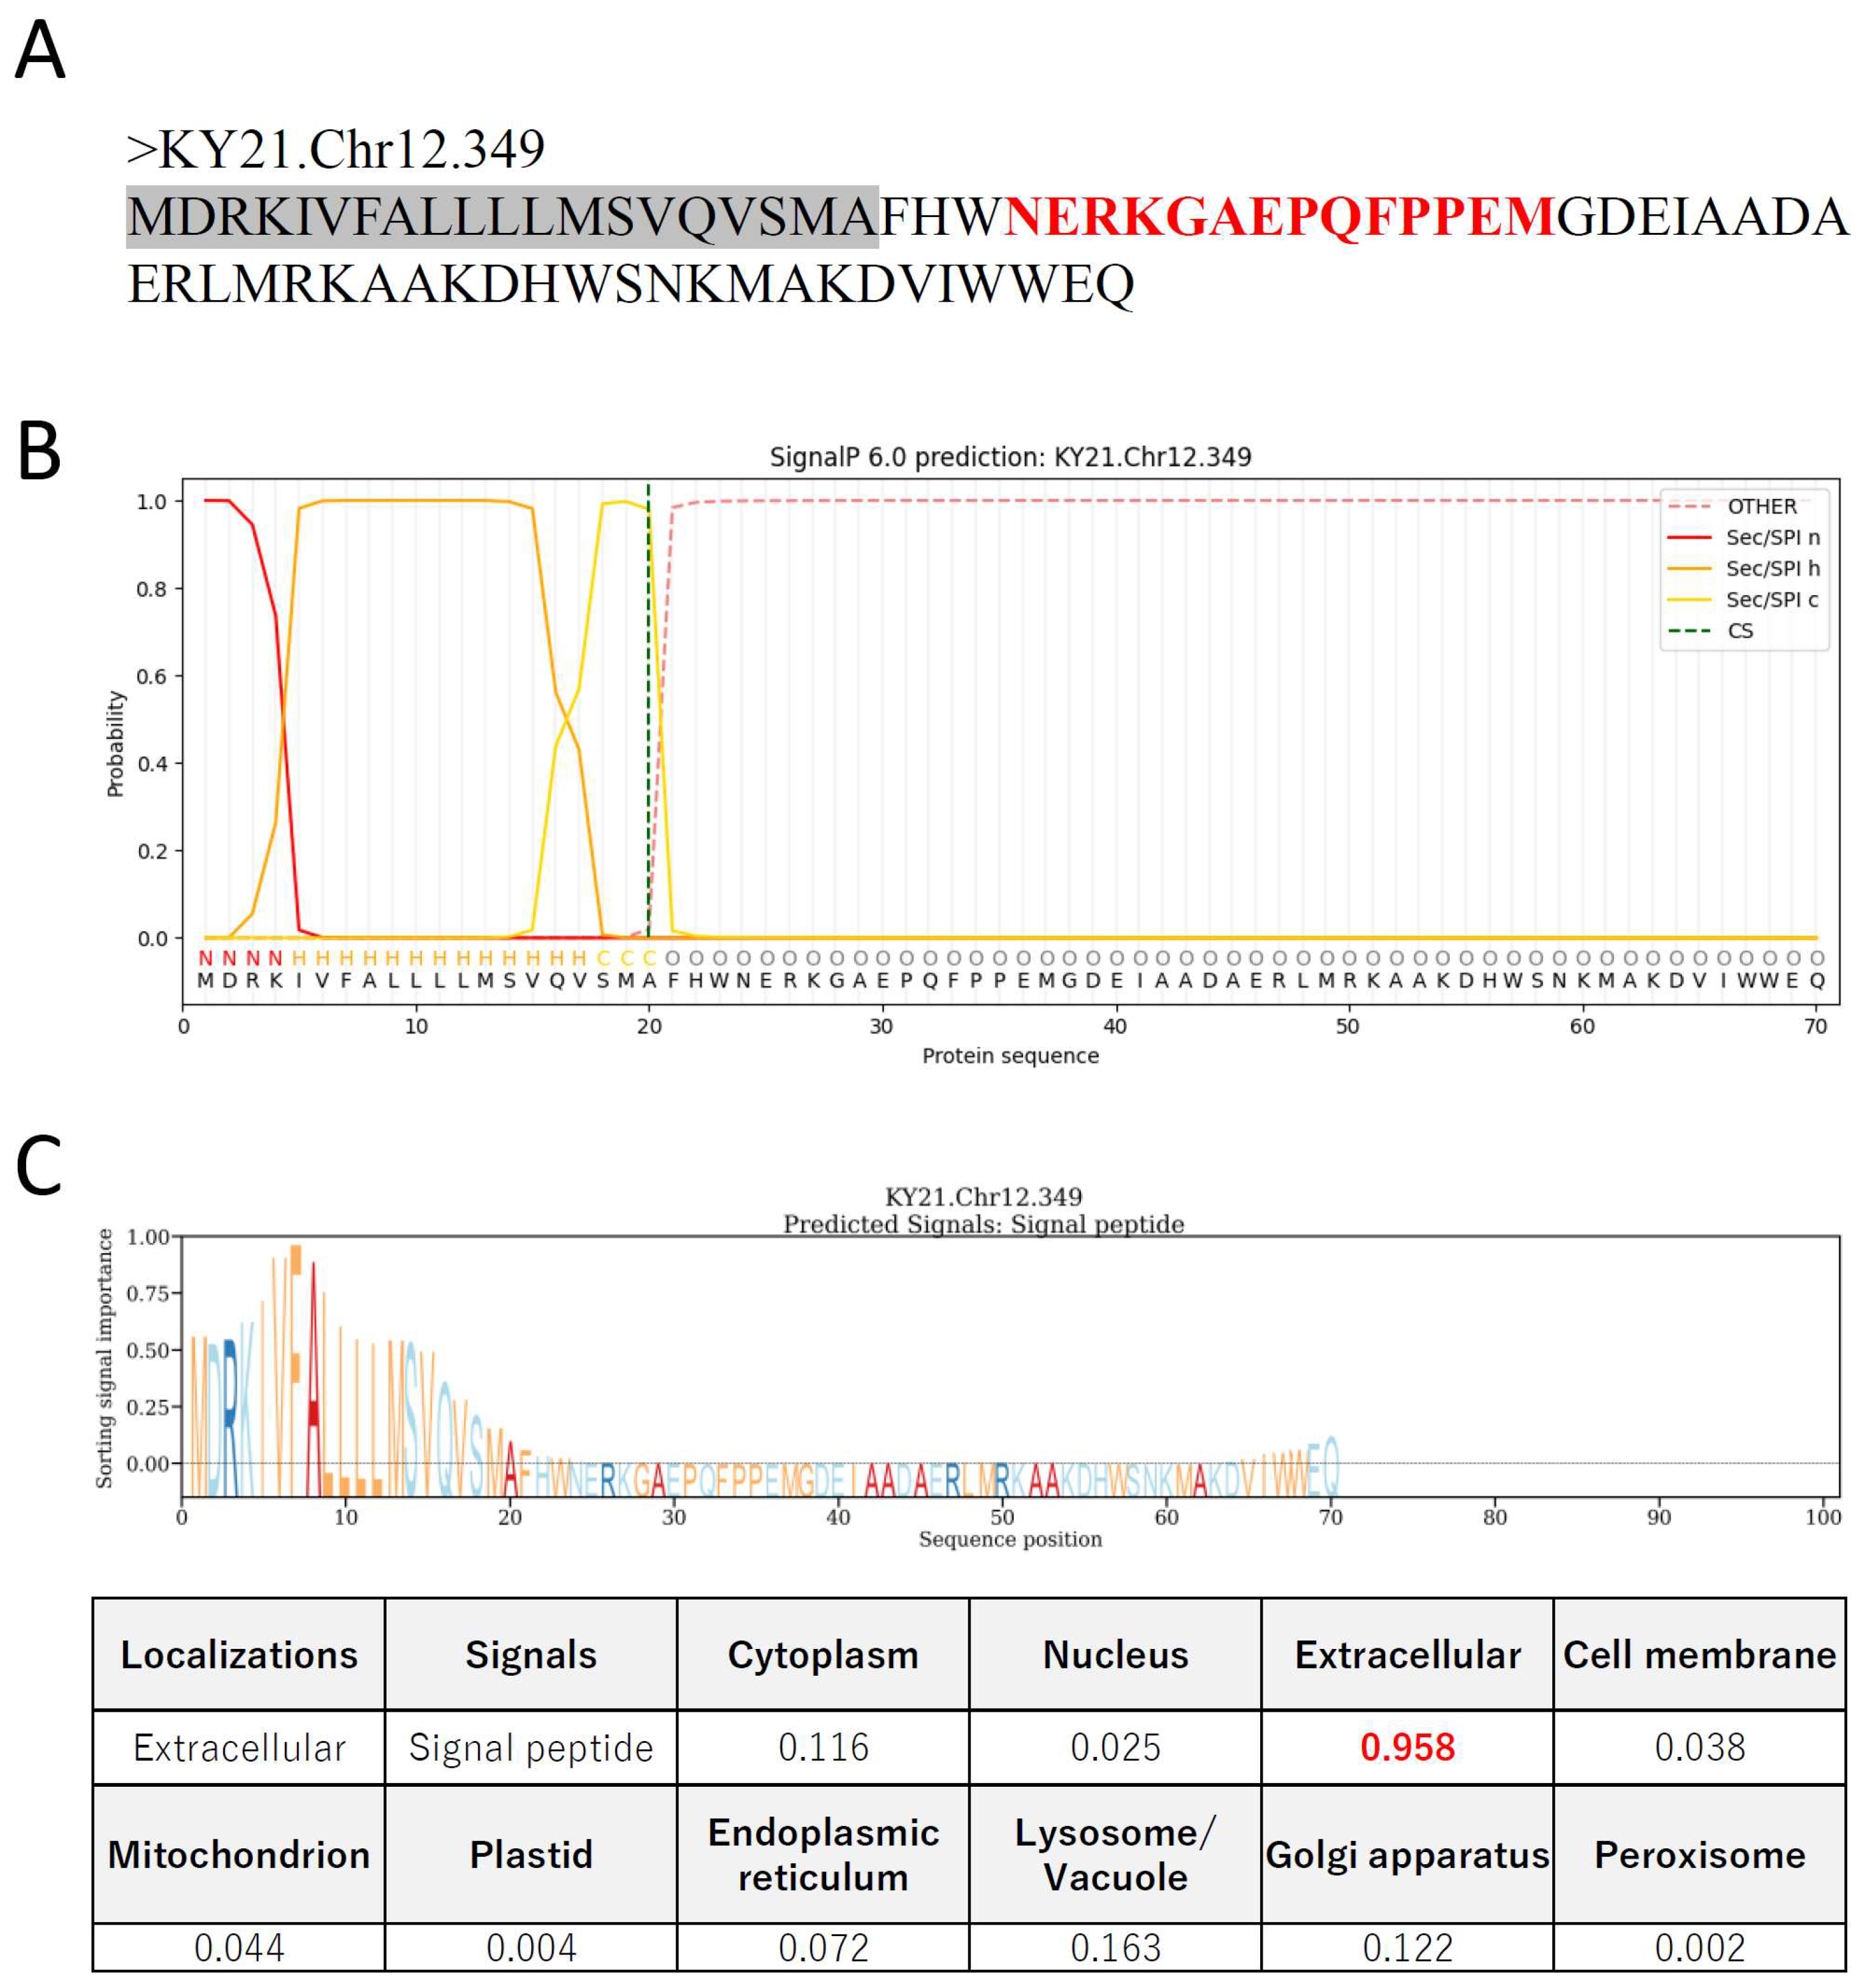
4.3. In silico analyses of CiEMa
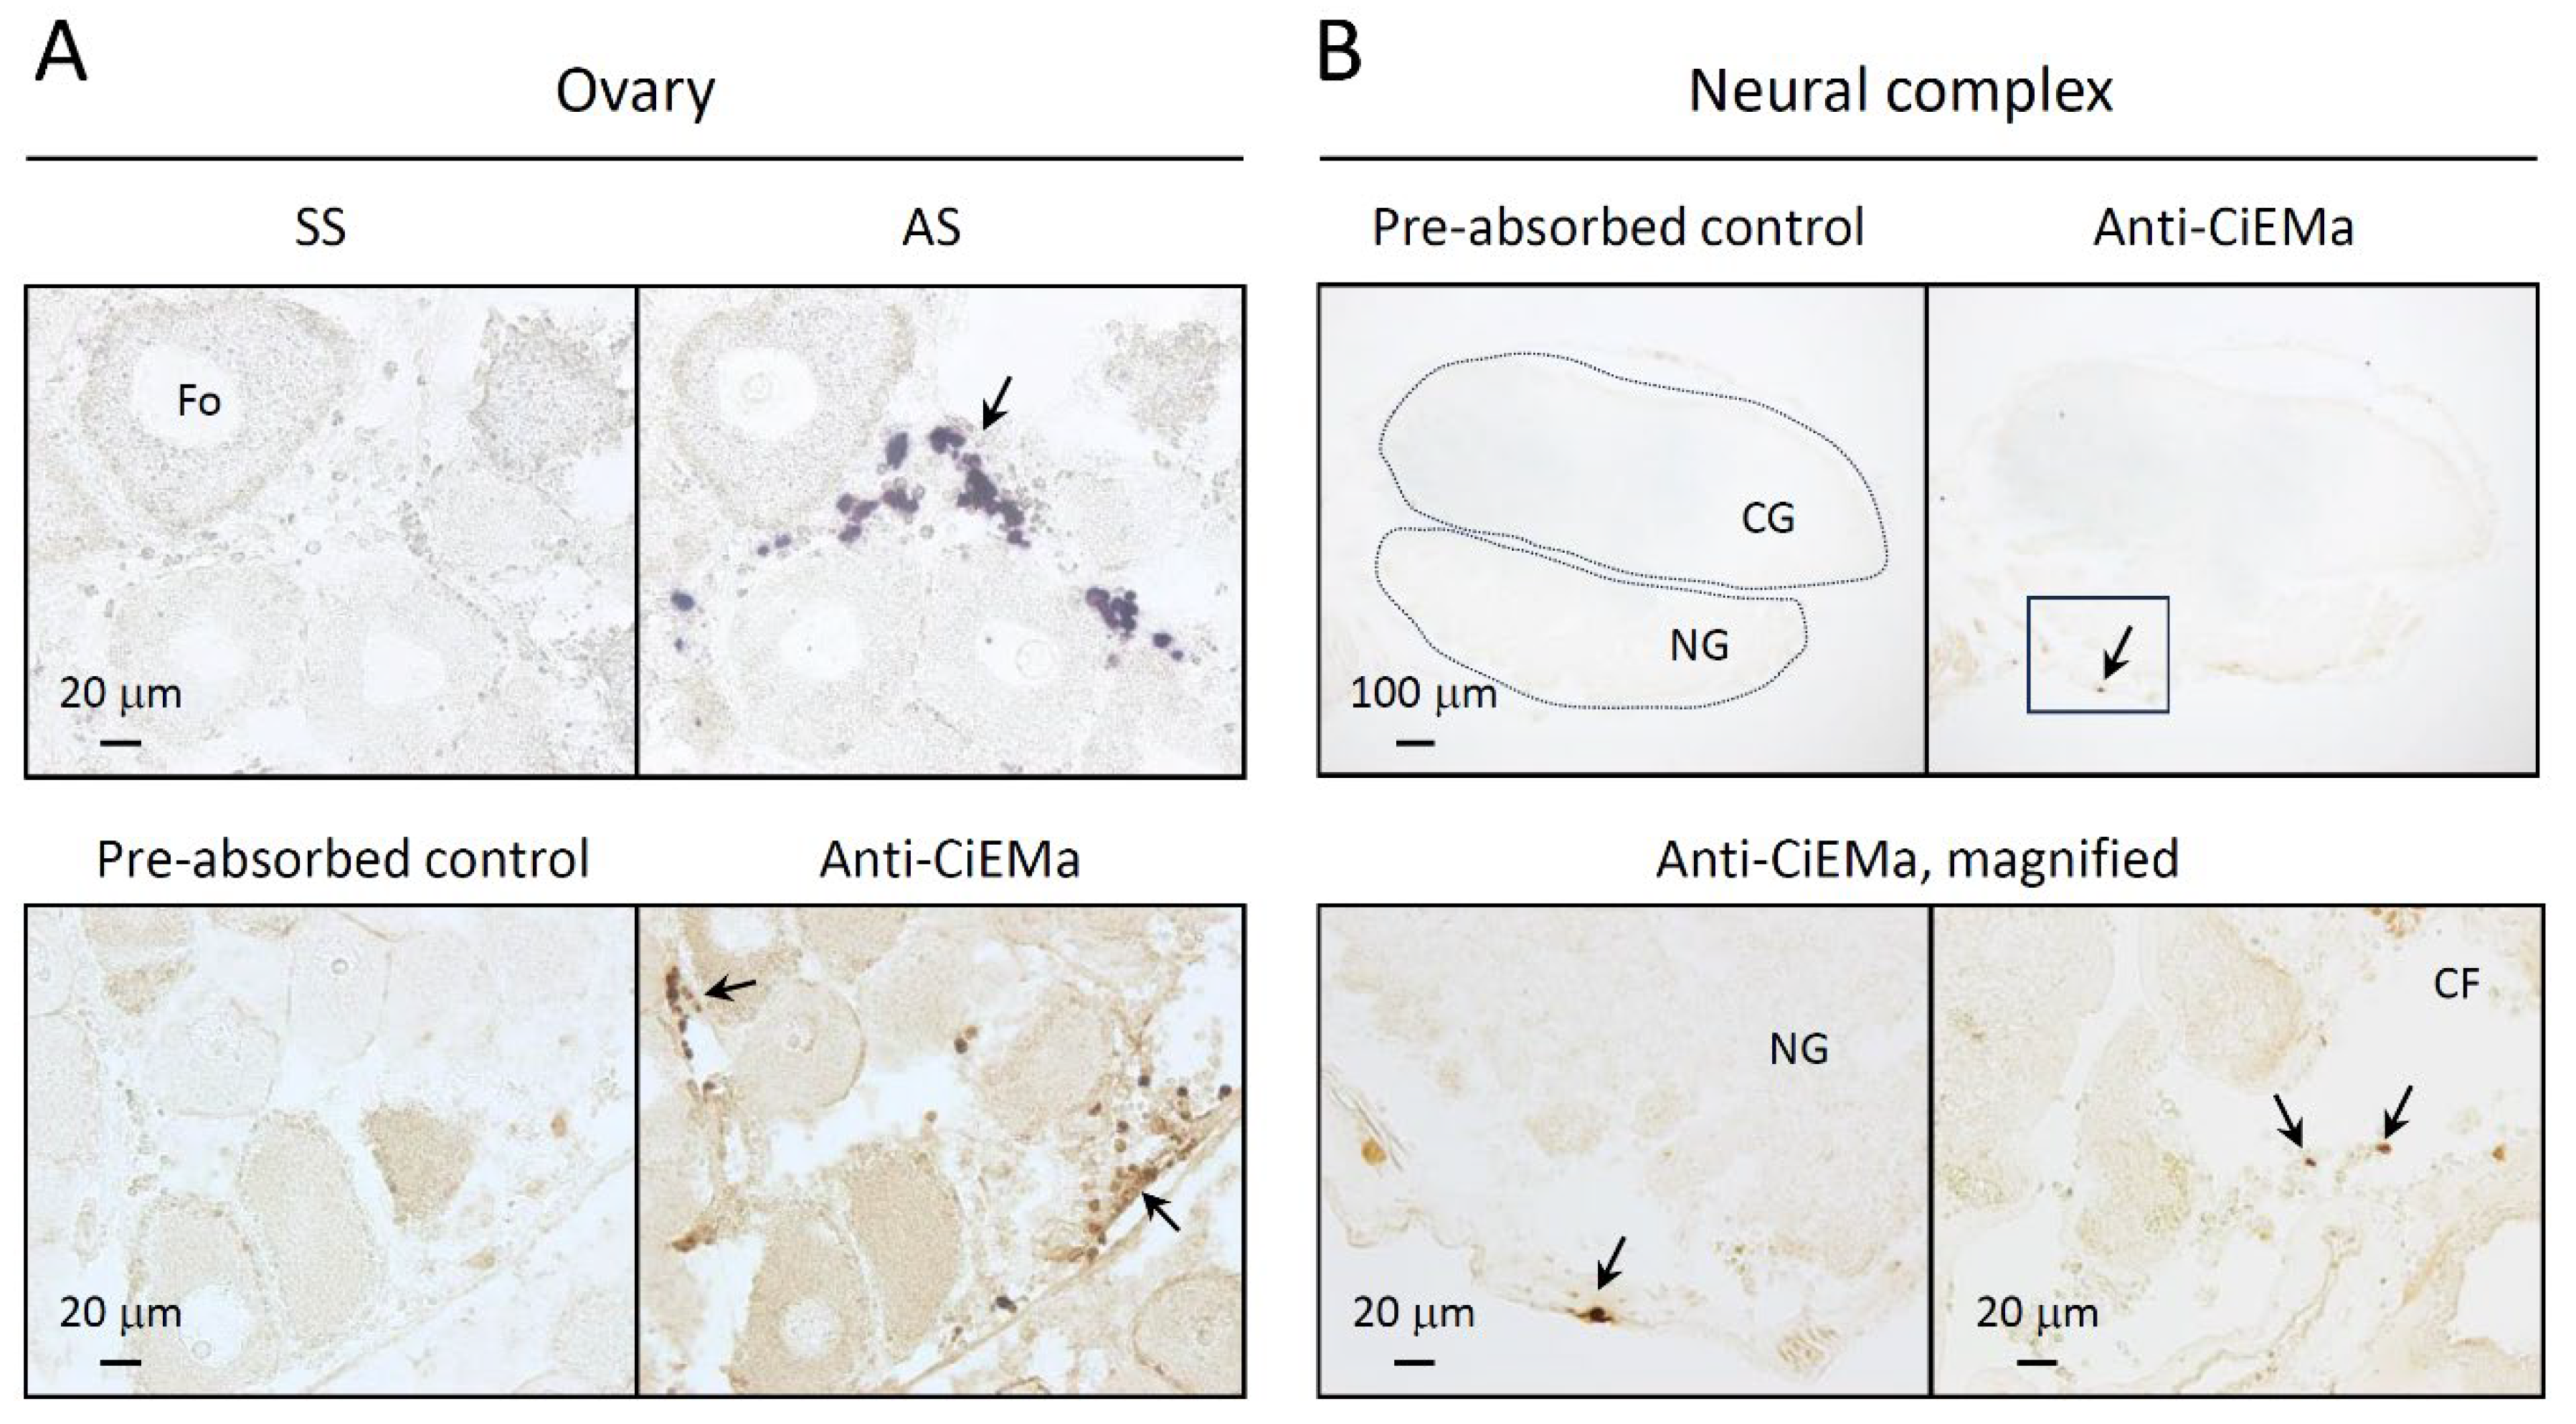
4.4. In situ hybridization (ISH)
4.5. Antibody generation and purification
4.6. Immunohistochemistry (IHC)
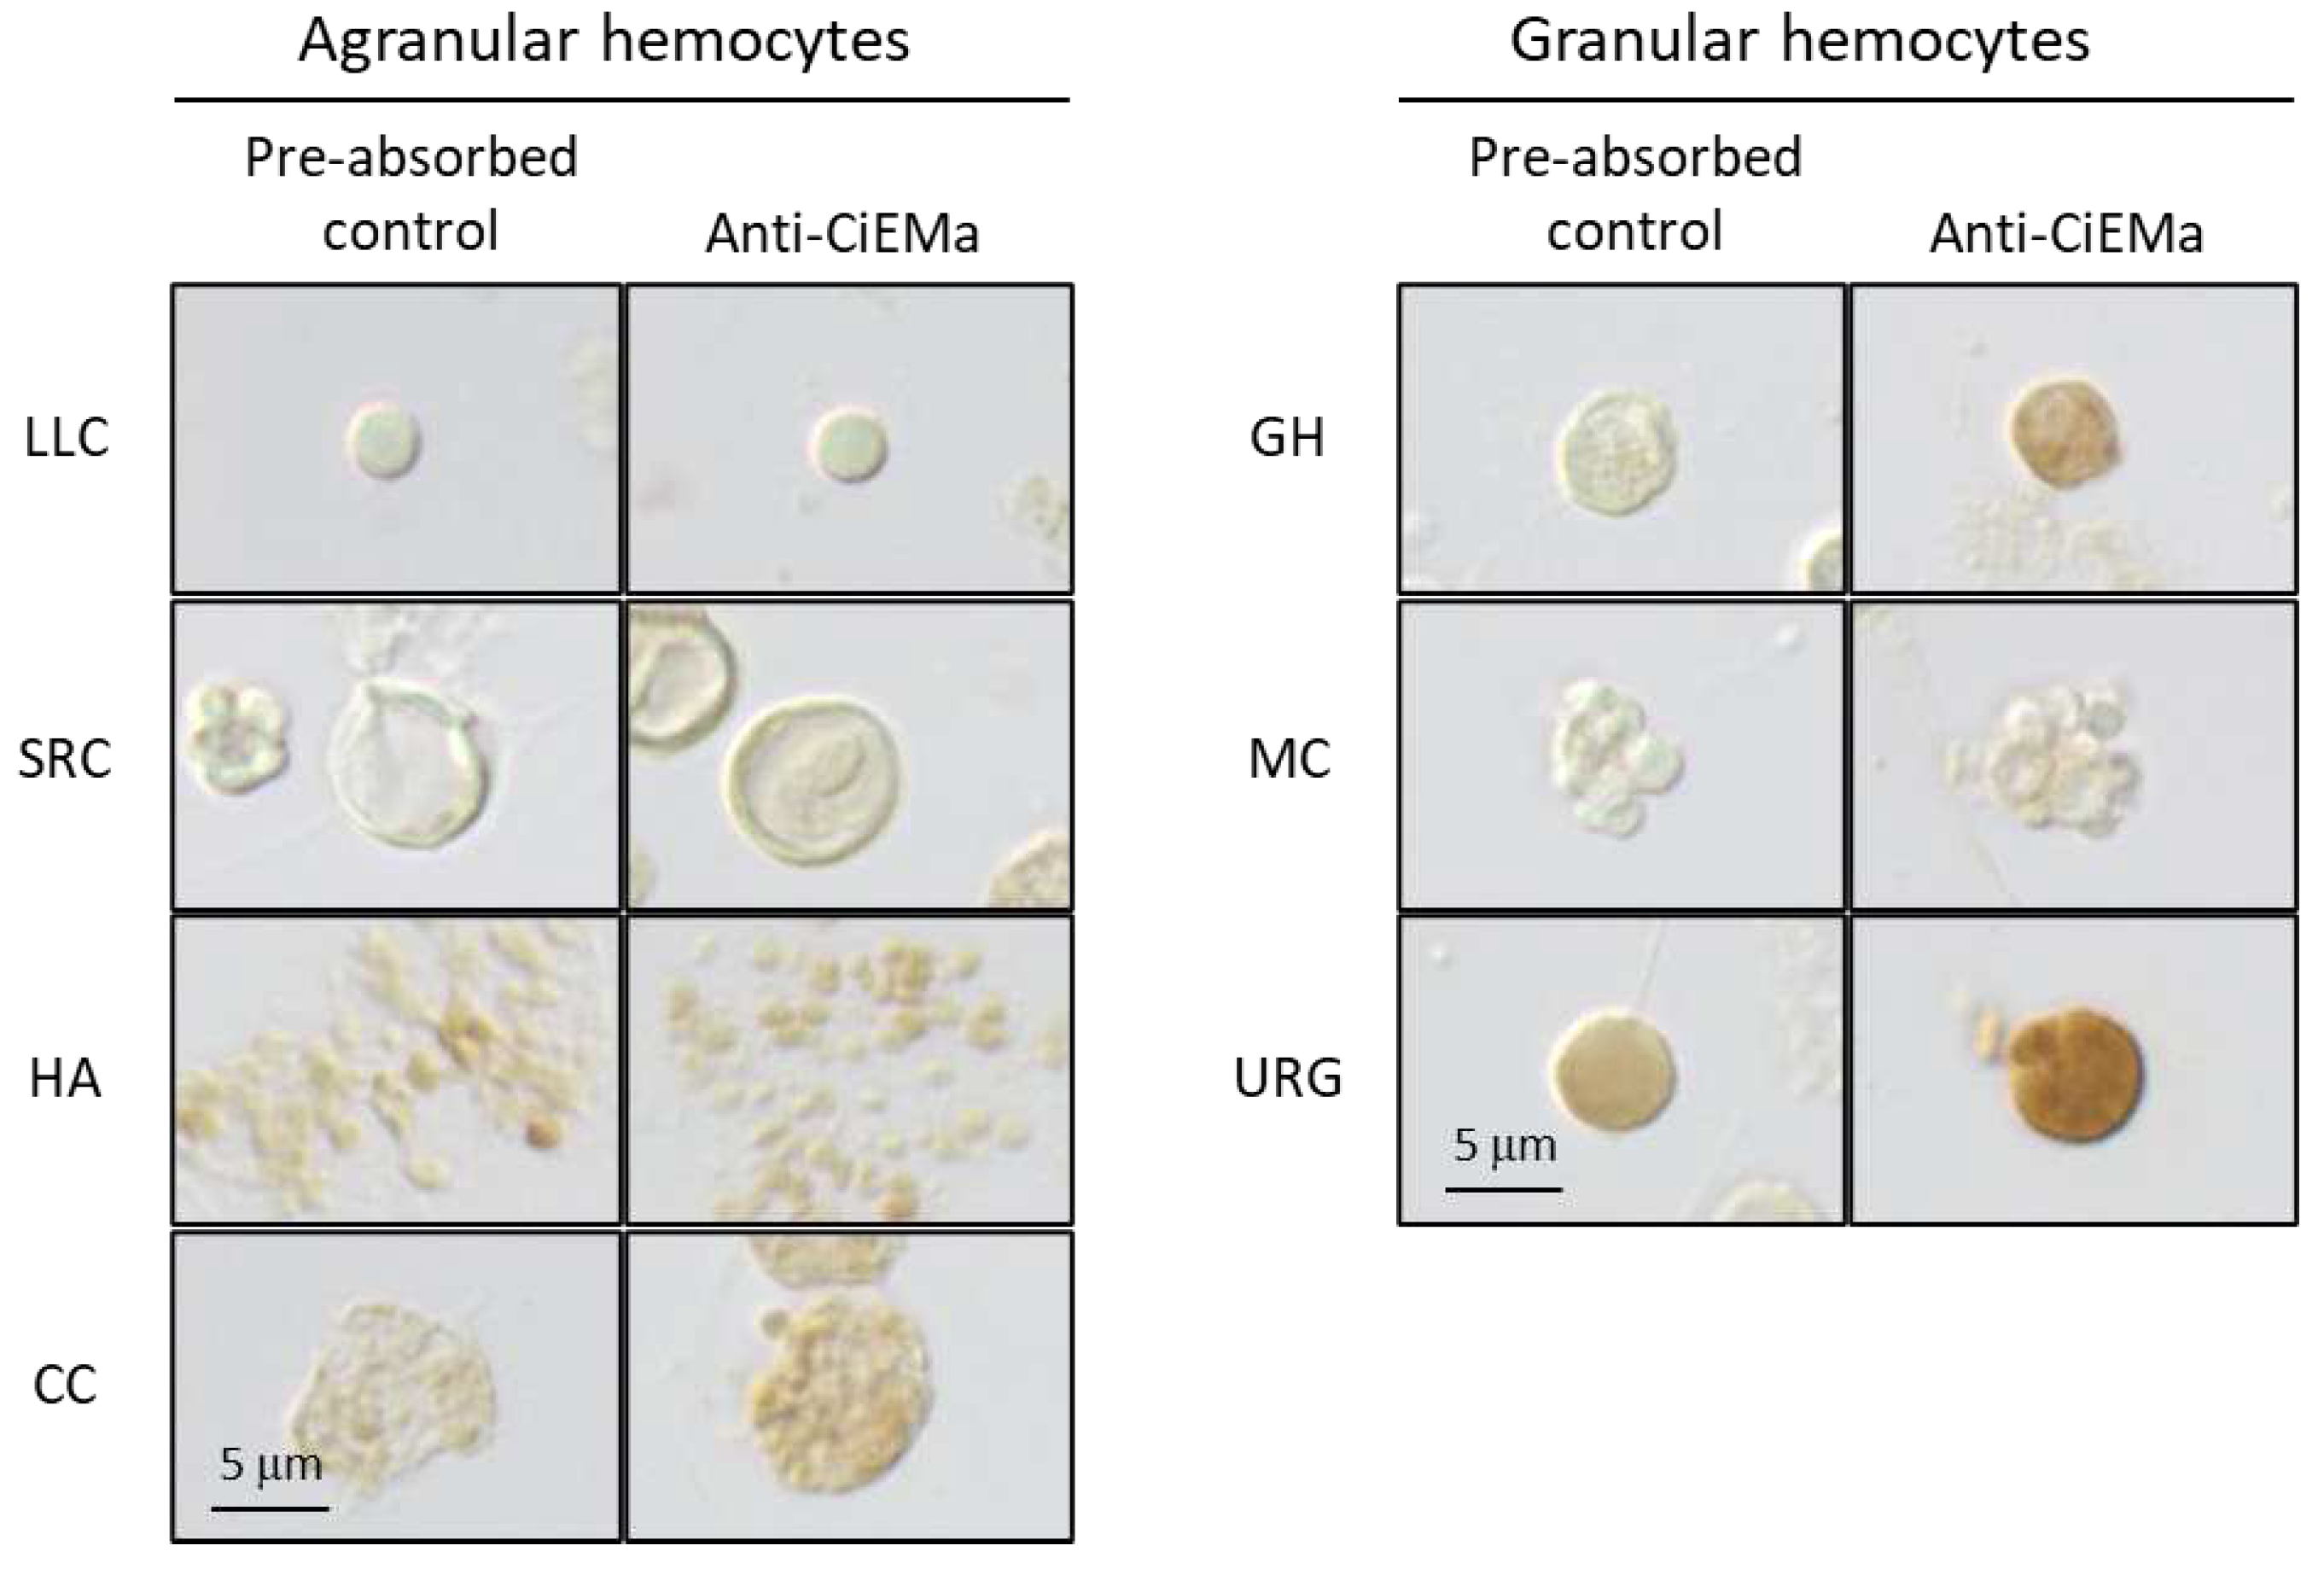
4.7. Hemocyte collection and immunocytochemistry (ICC)
4.8. RNA-seq data analysis
4.9. RNA purification and qRT-PCR
4.10. LPS stimulation
4.11. Dot blot analyses
4.12. CiEMa stimulation and RNA-sequencing
4.13. Statistical analysis
Supplementary Materials
Author Contributions
Data Availability Statement
Acknowledgments
Conflicts of Interest
References
- Buchmann, K. Evolution of Innate Immunity: Clues from Invertebrates via Fish to Mammals. Front. Immunol. 2014, 5, 459. [Google Scholar] [CrossRef] [PubMed]
- Yao, S.; Chan, J.; Xu, Y.; Wu, S.; Zhang, L. Divergences of the RLR Gene Families across Lophotrochozoans: Domain Grafting, Exon-Intron Structure, Expression, and Positive Selection. Int. J. Mol. Sci. 2022, 23, 3415. [Google Scholar] [CrossRef]
- Rast, J. P.; Smith, L. C.; Loza-Coll, M.; Hibino, T.; Litman, G. W. Genomic insights into the immune system of the sea urchin. Science 2006, 314, 952–956. [Google Scholar] [CrossRef] [PubMed]
- Huang, S.; Yuan, S.; Guo, L.; Yu, Y.; Li, J.; Wu, T.; Liu, T.; Yang, M.; Wu, K.; Liu, H.; et al. Genomic analysis of the immune gene repertoire of amphioxus reveals extraordinary innate complexity and diversity. Genome Res. 2008, 18, 1112–1126. [Google Scholar] [CrossRef]
- Zhang, L.; Li, L.; Guo, X.; Litman, G. W.; Dishaw, L. J.; Zhang, G. Massive expansion and functional divergence of innate immune genes in a protostome. Sci. Rep. 2015, 5, 8693. [Google Scholar] [CrossRef]
- Delsuc, F.; Brinkmann, H.; Chourrout, D.; Philippe, H. Tunicates and not cephalochordates are the closest living relatives of vertebrates. Nature 2006, 439, 965–968. [Google Scholar] [CrossRef] [PubMed]
- Satoh, N.; Rokhsar, D.; Nishikawa, T. Chordate evolution and the three-phylum system. Proc. Biol. Sci. 2014, 281, 20141729. [Google Scholar] [CrossRef] [PubMed]
- Lemaire, P. Evolutionary crossroads in developmental biology: the tunicates. Development 2011, 138, 2143–2152. [Google Scholar] [CrossRef]
- Satoh, N. The ascidian tadpole larva: comparative molecular development and genomics. Nat. Rev. Genet. 2003, 4, 285–295. [Google Scholar] [CrossRef]
- Matsubara, S.; Osugi, T.; Shiraishi, A.; Wada, A.; Satake, H. Comparative analysis of transcriptomic profiles among ascidians, zebrafish, and mice: Insights from tissue-specific gene expression. PLoS ONE 2021, 16, e0254308. [Google Scholar] [CrossRef]
- Satake, H.; Matsubara, S.; Shiraishi, A.; Yamamoto, T.; Osugi, T.; Sakai, T.; Kawada, T. Peptide receptors and immune-related proteins expressed in the digestive system of a urochordate, Ciona intestinalis. Cell Tissue Res. 2019, 377, 293–308. [Google Scholar] [CrossRef]
- Liberti, A.; Natarajan, O.; Atkinson, C. G. F.; Sordino, P.; Dishaw, L. J. Reflections on the Use of an Invertebrate Chordate Model System for Studies of Gut Microbial Immune Interactions. Front. Immunol. 2021, 12, 642687. [Google Scholar] [CrossRef]
- Longo, V.; Parrinello, D.; Longo, A.; Parisi, M. G.; Parrinello, N.; Colombo, P.; Cammarata, M. The conservation and diversity of ascidian cells and molecules involved in the inflammatory reaction: The Ciona robusta model. Fish Shellfish Immunol. 2021, 119, 384–396. [Google Scholar] [CrossRef] [PubMed]
- Franchi, N.; Ballarin, L. Immunity in Protochordates: The Tunicate Perspective. Front. Immunol. 2017, 8, 674. [Google Scholar] [CrossRef] [PubMed]
- Parrinello, N.; Cammarata, M.; Parrinello, D. The Inflammatory Response of Urochordata: The Basic Process of the Ascidians’ Innate Immunity. In Advances in Comparative Immunology; Cooper, E., Ed.; Springer: Cham, Switzerland, 2018; pp. 521–590. [Google Scholar]
- Satou, Y.; Nakamura, R.; Yu, D.; Yoshida, R.; Hamada, M.; Fujie, M.; Hisata, K.; Takeda, H.; Satoh, N. A Nearly Complete Genome of Ciona intestinalis Type A (C. robusta) Reveals the Contribution of Inversion to Chromosomal Evolution in the Genus Ciona. Genome Biol. Evol. 2019, 11, 3144–3157. [Google Scholar] [CrossRef]
- Dehal, P.; Satou, Y.; Campbell, R. K.; Chapman, J.; Degnan, B.; De Tomaso, A.; Davidson, B.; Di Gregorio, A.; Gelpke, M.; Goodstein, D. M.; et al. The draft genome of Ciona intestinalis: insights into chordate and vertebrate origins. Science 2002, 298, 2157–2167. [Google Scholar] [CrossRef]
- Vizzini, A.; Bonura, A.; La Paglia, L.; Fiannaca, A.; La Rosa, M.; Urso, A.; Arizza, V. ceRNA Network Regulation of TGF-beta, WNT, FOXO, Hedgehog Pathways in the Pharynx of Ciona robusta. Int. J. Mol. Sci. 2021, 22, 3497. [Google Scholar] [CrossRef] [PubMed]
- Zhang, W.; Jiang, A.; Yu, H.; Dong, B. Comparative Transcriptomic Analysis Reveals the Functionally Segmented Intestine in Tunicate Ascidian. Int. J. Mol. Sci. 2023, 24, 6270. [Google Scholar] [CrossRef]
- Ogasawara, M.; Nakazawa, N.; Azumi, K.; Yamabe, E.; Satoh, N.; Satake, M. Identification of thirty-four transcripts expressed specifically in hemocytes of Ciona intestinalis and their expression profiles throughout the life cycle. DNA Res. 2006, 13, 25–35. [Google Scholar] [CrossRef]
- Ohtsuka, Y.; Inagaki, H. In silico identification and functional validation of linear cationic alpha-helical antimicrobial peptides in the ascidian Ciona intestinalis. Sci. Rep. 2020, 10, 12619. [Google Scholar] [CrossRef]
- Udit, S.; Blake, K.; Chiu, I. M. Somatosensory and autonomic neuronal regulation of the immune response. Nat. Rev. Neurosci. 2022, 23, 157–171. [Google Scholar] [CrossRef] [PubMed]
- Yang, D.; Biragyn, A.; Hoover, D. M.; Lubkowski, J.; Oppenheim, J. J. Multiple roles of antimicrobial defensins, cathelicidins, and eosinophil-derived neurotoxin in host defense. Annu. Rev. Immunol. 2004, 22, 181–215. [Google Scholar] [CrossRef] [PubMed]
- Kawada, T.; Ogasawara, M.; Sekiguchi, T.; Aoyama, M.; Hotta, K.; Oka, K.; Satake, H. Peptidomic analysis of the central nervous system of the protochordate, Ciona intestinalis: homologs and prototypes of vertebrate peptides and novel peptides. Endocrinology 2011, 152, 2416–2427. [Google Scholar] [CrossRef] [PubMed]
- Aoyama, M.; Kawada, T.; Fujie, M.; Hotta, K.; Sakai, T.; Sekiguchi, T.; Oka, K.; Satoh, N.; Satake, H. A novel biological role of tachykinins as an up-regulator of oocyte growth: identification of an evolutionary origin of tachykininergic functions in the ovary of the ascidian, Ciona intestinalis. Endocrinology 2008, 149, 4346–4356. [Google Scholar] [CrossRef] [PubMed]
- Aoyama, M.; Kawada, T.; Satake, H. Localization and enzymatic activity profiles of the proteases responsible for tachykinin-directed oocyte growth in the protochordate, Ciona intestinalis. Peptides 2012, 34, 186–192. [Google Scholar] [CrossRef] [PubMed]
- Matsubara, S.; Shiraishi, A.; Osugi, T.; Kawada, T.; Satake, H. The regulation of oocyte maturation and ovulation in the closest sister group of vertebrates. eLife 2019, 8, e49062. [Google Scholar] [CrossRef]
- Matsubara, S.; Shiraishi, A.; Osugi, T.; Kawada, T.; Satake, H. Fractionation of Ovarian Follicles and in vitro Oocyte Maturation and Ovulation Assay of Ciona intestinalis Type A. Bio. Protoc. 2020, 10, e3577. [Google Scholar] [CrossRef] [PubMed]
- Osugi, T.; Miyasaka, N.; Shiraishi, A.; Matsubara, S.; Satake, H. Cionin, a vertebrate cholecystokinin/gastrin homolog, induces ovulation in the ascidian Ciona intestinalis type A. Sci. Rep. 2021, 11, 10911. [Google Scholar] [CrossRef]
- Sakai, T.; Yamamoto, T.; Watanabe, T.; Hozumi, A.; Shiraishi, A.; Osugi, T.; Matsubara, S.; Kawada, T.; Sasakura, Y.; Takahashi, T.; et al. Characterization of a novel species-specific 51-amino acid peptide, PEP51, as a caspase-3/7 activator in ovarian follicles of the ascidian, Ciona intestinalis Type A. Front. Endocrinol. (Lausanne) 2023, 14, 1260600. [Google Scholar] [CrossRef]
- Fedders, H.; Michalek, M.; Grotzinger, J.; Leippe, M. An exceptional salt-tolerant antimicrobial peptide derived from a novel gene family of haemocytes of the marine invertebrate Ciona intestinalis. Biochem. J. 2008, 416, 65–75. [Google Scholar] [CrossRef]
- Fedders, H.; Leippe, M. A reverse search for antimicrobial peptides in Ciona intestinalis: identification of a gene family expressed in hemocytes and evaluation of activity. Dev. Comp. Immunol. 2008, 32, 286–298. [Google Scholar] [CrossRef] [PubMed]
- Vizzini, A.; Bonura, A.; Parrinello, D.; Sanfratello, M. A.; Longo, V.; Colombo, P. LPS challenge regulates gene expression and tissue localization of a Ciona intestinalis gene through an alternative polyadenylation mechanism. PLoS ONE 2013, 8, e63235. [Google Scholar] [CrossRef] [PubMed]
- Longo, V.; Longo, A.; Martorana, A.; Lauria, A.; Augello, G.; Azzolina, A.; Cervello, M.; Colombo, P. Identification of an LPS-Induced Chemo-Attractive Peptide from Ciona robusta. Mar. Drugs 2020, 18, 209. [Google Scholar] [CrossRef] [PubMed]
- Brozovic, M.; Dantec, C.; Dardaillon, J.; Dauga, D.; Faure, E.; Gineste, M.; Louis, A.; Naville, M.; Nitta, K. R.; Piette, J.; et al. ANISEED 2017: extending the integrated ascidian database to the exploration and evolutionary comparison of genome-scale datasets. Nucleic Acids Res. 2018, 46, D718–D725. [Google Scholar] [CrossRef] [PubMed]
- Osugi, T.; Sasakura, Y.; Satake, H. The ventral peptidergic system of the adult ascidian Ciona robusta (Ciona intestinalis Type A) insights from a transgenic animal model. Sci. Rep. 2020, 10, 1892. [Google Scholar] [CrossRef]
- Shida, K.; Terajima, D.; Uchino, R.; Ikawa, S.; Ikeda, M.; Asano, K.; Watanabe, T.; Azumi, K.; Nonaka, M.; Satou, Y.; et al. Hemocytes of Ciona intestinalis express multiple genes involved in innate immune host defense. Biochem. Biophys. Res. Commun. 2003, 302, 207–218. [Google Scholar] [CrossRef]
- Terajima, D.; Yamada, S.; Uchino, R.; Ikawa, S.; Ikeda, M.; Shida, K.; Arai, Y.; Wang, H. G.; Satoh, N.; Satake, M. Identification and sequence of seventy-nine new transcripts expressed in hemocytes of Ciona intestinalis, three of which may be involved in characteristic cell-cell communication. DNA Res. 2003, 10, 203–212. [Google Scholar] [CrossRef] [PubMed]
- Sasaki, N.; Ogasawara, M.; Sekiguchi, T.; Kusumoto, S.; Satake, H. Toll-like receptors of the ascidian Ciona intestinalis: prototypes with hybrid functionalities of vertebrate Toll-like receptors. J. Biol. Chem. 2009, 284, 27336–27343. [Google Scholar] [CrossRef] [PubMed]
- Chiba, S.; Sasaki, A.; Nakayama, A.; Takamura, K.; Satoh, N. Development of Ciona intestinalis juveniles (through 2nd ascidian stage). Zoolog. Sci. 2004, 21, 285–298. [Google Scholar] [CrossRef]
- Iguchi, R.; Nakayama, S.; Sasakura, Y.; Sekiguchi, T.; Ogasawara, M. Repetitive and zonal expression profiles of absorption-related genes in the gastrointestinal tract of ascidian Ciona intestinalis type A. Cell Tissue Res. 2023, 394, 343–360. [Google Scholar] [CrossRef]
- Liberti, A.; Melillo, D.; Zucchetti, I.; Natale, L.; Dishaw, L. J.; Litman, G. W.; De Santis, R.; Pinto, M. R. Expression of Ciona intestinalis variable region-containing chitin-binding proteins during development of the gastrointestinal tract and their role in host-microbe interactions. PLoS ONE 2014, 9, e94984. [Google Scholar] [CrossRef] [PubMed]
- Nakayama, S.; Ogasawara, M. Compartmentalized expression patterns of pancreatic- and gastric-related genes in the alimentary canal of the ascidian Ciona intestinalis: evolutionary insights into the functional regionality of the gastrointestinal tract in Olfactores. Cell Tissue Res. 2017, 370, 113–128. [Google Scholar] [CrossRef] [PubMed]
- Parrinello, N.; Vizzini, A.; Salerno, G.; Sanfratello, M. A.; Cammarata, M.; Arizza, V.; Vazzana, M.; Parrinello, D. Inflamed adult pharynx tissues and swimming larva of Ciona intestinalis share CiTNFalpha-producing cells. Cell Tissue Res. 2010, 341, 299–311. [Google Scholar] [CrossRef]
- Vizzini, A.; Di Falco, F.; Parrinello, D.; Sanfratello, M. A.; Mazzarella, C.; Parrinello, N.; Cammarata, M. Ciona intestinalis interleukin 17-like genes expression is upregulated by LPS challenge. Dev. Comp. Immunol. 2015, 48, 129–137. [Google Scholar] [CrossRef] [PubMed]
- Vizzini, A.; Di Falco, F.; Parrinello, D.; Sanfratello, M. A.; Cammarata, M. Transforming growth factor beta (CiTGF-beta) gene expression is induced in the inflammatory reaction of Ciona intestinalis. Dev. Comp. Immunol. 2016, 55, 102–110. [Google Scholar] [CrossRef] [PubMed]
- Shi, W.; Peyrot, S. M.; Munro, E.; Levine, M. FGF3 in the floor plate directs notochord convergent extension in the Ciona tadpole. Development 2009, 136, 23–28. [Google Scholar] [CrossRef]
- Ikuta, T.; Satoh, N.; Saiga, H. Limited functions of Hox genes in the larval development of the ascidian Ciona intestinalis. Development 2010, 137, 1505–1513. [Google Scholar] [CrossRef] [PubMed]
- Trivedi, S.; Ueki, T.; Yamaguchi, N.; Michibata, H. Novel vanadium-binding proteins (vanabins) identified in cDNA libraries and the genome of the ascidian Ciona intestinalis. Biochim. Biophys. Acta 2003, 1630, 64–70. [Google Scholar] [CrossRef] [PubMed]
- Yamaguchi, N.; Kamino, K.; Ueki, T.; Michibata, H. Expressed sequence tag analysis of vanadocytes in a vanadium-rich ascidian, Ascidia sydneiensis samea. Mar. Biotechnol. (NY) 2004, 6, 165–74. [Google Scholar] [CrossRef]
- Yamaguchi, N.; Amakawa, Y.; Yamada, H.; Ueki, T.; Michibata, H. Localization of vanabins, vanadium-binding proteins, in the blood cells of the vanadium-rich ascidian, Ascidia sydneiensis samea. Zoolog. Sci. 2006, 23, 909–15. [Google Scholar] [CrossRef]
- Di Bella, M. A.; Fedders, H.; De Leo, G.; Leippe, M. Localization of antimicrobial peptides in the tunic of Ciona intestinalis (Ascidiacea, Tunicata) and their involvement in local inflammatory-like reactions. Results. Immunol. 2011, 1, 70–75. [Google Scholar] [CrossRef] [PubMed]
- Vizzini, A.; Parrinello, D.; Sanfratello, M. A.; Salerno, G.; Cammarata, M.; Parrinello, N. Inducible galectins are expressed in the inflamed pharynx of the ascidian Ciona intestinalis. Fish Shellfish Immunol. 2012, 32, 101–109. [Google Scholar] [CrossRef]
- Hatakeyama, T.; Unno, H. Functional Diversity of Novel Lectins with Unique Structural Features in Marine Animals. Cells 2023, 12, 1814. [Google Scholar] [CrossRef]
- Otero-Gonzalez, A. J.; Magalhaes, B. S.; Garcia-Villarino, M.; Lopez-Abarrategui, C.; Sousa, D. A.; Dias, S. C.; Franco, O. L. Antimicrobial peptides from marine invertebrates as a new frontier for microbial infection control. FASEB J 2010, 24, 1320–1334. [Google Scholar] [CrossRef] [PubMed]
- Canesi, L.; Auguste, M.; Balbi, T.; Prochazkova, P. Soluble mediators of innate immunity in annelids and bivalve mollusks: A mini-review. Front. Immunol. 2022, 13, 1051155. [Google Scholar] [CrossRef]
- Darmer, D.; Schmutzler, C.; Diekhoff, D.; Grimmelikhuijzen, C. J. , Primary structure of the precursor for the sea anemone neuropeptide Antho-RFamide (less than Glu-Gly-Arg-Phe-NH2). Proc. Natl. Acad. Sci. USA. 1991, 88, 2555–2559. [Google Scholar] [CrossRef]
- Schmutzler, C.; Diekhoff, D.; Grimmelikhuijzen, C. J. The primary structure of the Pol-RFamide neuropeptide precursor protein from the hydromedusa Polyorchis penicillatus indicates a novel processing proteinase activity. Biochem. J. 1994, 299, 431–436. [Google Scholar] [CrossRef]
- Schmutzler, C.; Darmer, D.; Diekhoff, D.; Grimmelikhuijzen, C. J. Identification of a novel type of processing sites in the precursor for the sea anemone neuropeptide Antho-RFamide (<Glu-Gly-Arg-Phe-NH2) from Anthopleura elegantissima. J. Biol. Chem. 1992, 267, 22534–22541. [Google Scholar] [PubMed]
- Takahashi, T. Neuropeptides and epitheliopeptides: structural and functional diversity in an ancestral metazoan Hydra. Protein Pept. Lett. 2013, 20, 671–680. [Google Scholar] [CrossRef]
- Satou, Y.; Kawashima, T.; Shoguchi, E.; Nakayama, A.; Satoh, N. An integrated database of the ascidian, Ciona intestinalis: towards functional genomics. Zoolog. Sci. 2005, 22, 837–843. [Google Scholar] [CrossRef]
- Parrinello, D.; Parisi, M.; Parrinello, N.; Cammarata, M. Ciona robusta hemocyte populational dynamics and PO-dependent cytotoxic activity. Dev. Comp. Immunol. 2020, 103, 103519. [Google Scholar] [CrossRef] [PubMed]
- Satou, Y.; Tokuoka, M.; Oda-Ishii, I.; Tokuhiro, S.; Ishida, T.; Liu, B.; Iwamura, Y. A Manually Curated Gene Model Set for an Ascidian, Ciona robusta (Ciona intestinalis Type A). Zoolog. Sci. 2022, 39, 253–260. [Google Scholar] [CrossRef] [PubMed]
- Kim, D.; Paggi, J. M.; Park, C.; Bennett, C.; Salzberg, S. L. Graph-based genome alignment and genotyping with HISAT2 and HISAT-genotype. Nat. Biotechnol. 2019, 37, 907–915. [Google Scholar] [CrossRef] [PubMed]
- Li, B.; Dewey, C. N. RSEM: accurate transcript quantification from RNA-Seq data with or without a reference genome. BMC Bioinformatics 2011, 12, 323. [Google Scholar] [CrossRef]
- Schindelin, J.; Arganda-Carreras, I.; Frise, E.; Kaynig, V.; Longair, M.; Pietzsch, T.; Preibisch, S.; Rueden, C.; Saalfeld, S.; Schmid, B.; et al. Fiji: an open-source platform for biological-image analysis. Nat. Methods 2012, 9, 676–682. [Google Scholar] [CrossRef]
| Sample | Total reads | % mapped | Accession |
|---|---|---|---|
| Pha_CiEMa_0h | 70,659,570 | 84.93 | SRR26963725 |
| Pha_CiEMa_1h | 80,794,444 | 85.50 | SRR26963724 |
| Pha_CiEMa_2h | 84,126,938 | 85.08 | SRR26963723 |
| Pha_CiEMa_4h | 84,462,016 | 84.30 | SRR26963722 |
| Pha_CiEMa_8h | 109,996,394 | 87.07 | SRR26963721 |
Disclaimer/Publisher’s Note: The statements, opinions and data contained in all publications are solely those of the individual author(s) and contributor(s) and not of MDPI and/or the editor(s). MDPI and/or the editor(s) disclaim responsibility for any injury to people or property resulting from any ideas, methods, instructions or products referred to in the content. |
© 2023 by the authors. Licensee MDPI, Basel, Switzerland. This article is an open access article distributed under the terms and conditions of the Creative Commons Attribution (CC BY) license (http://creativecommons.org/licenses/by/4.0/).


