Submitted:
20 December 2023
Posted:
21 December 2023
You are already at the latest version
Abstract
Keywords:
1. Introduction
2. Impact of the Uncertainties
2.1. Uncertainties Affecting the Generation
2.2. Uncertainties Affecting the Network Assets
2.3. Uncertainties Affecting the Communication Link
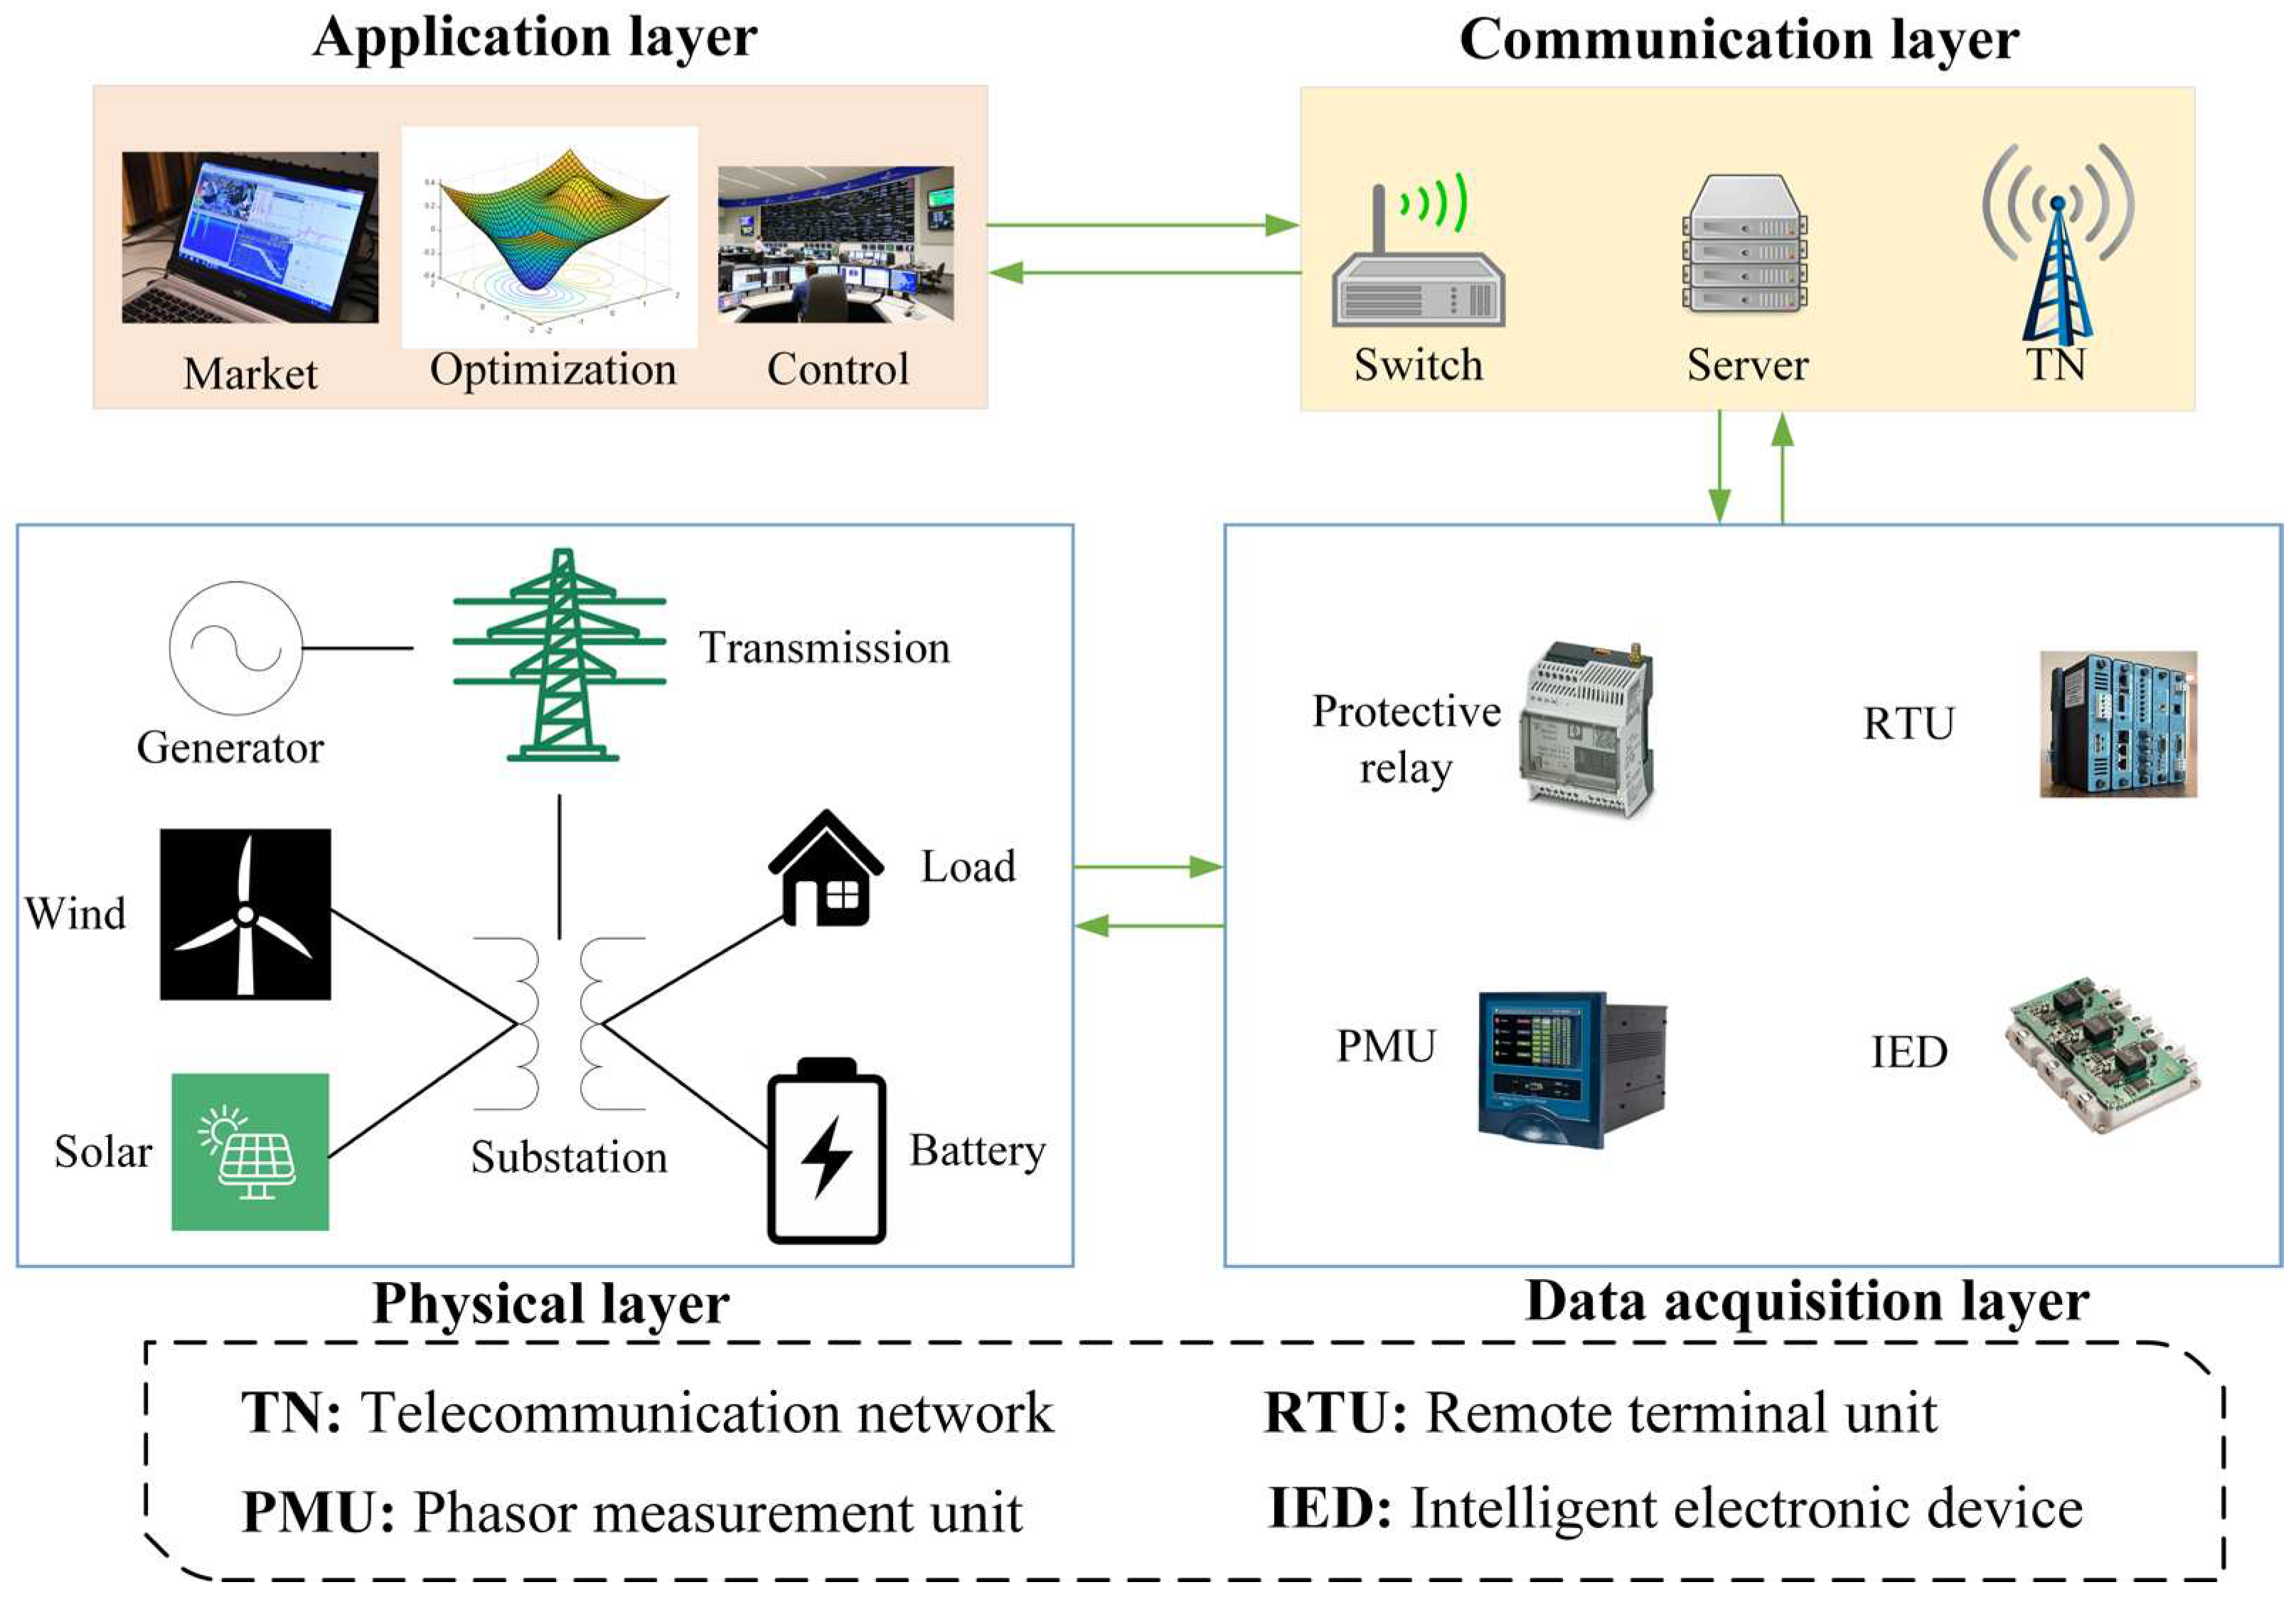
3. Uncertainty Modelling
3.1. Uncertainties Affecting the Generation
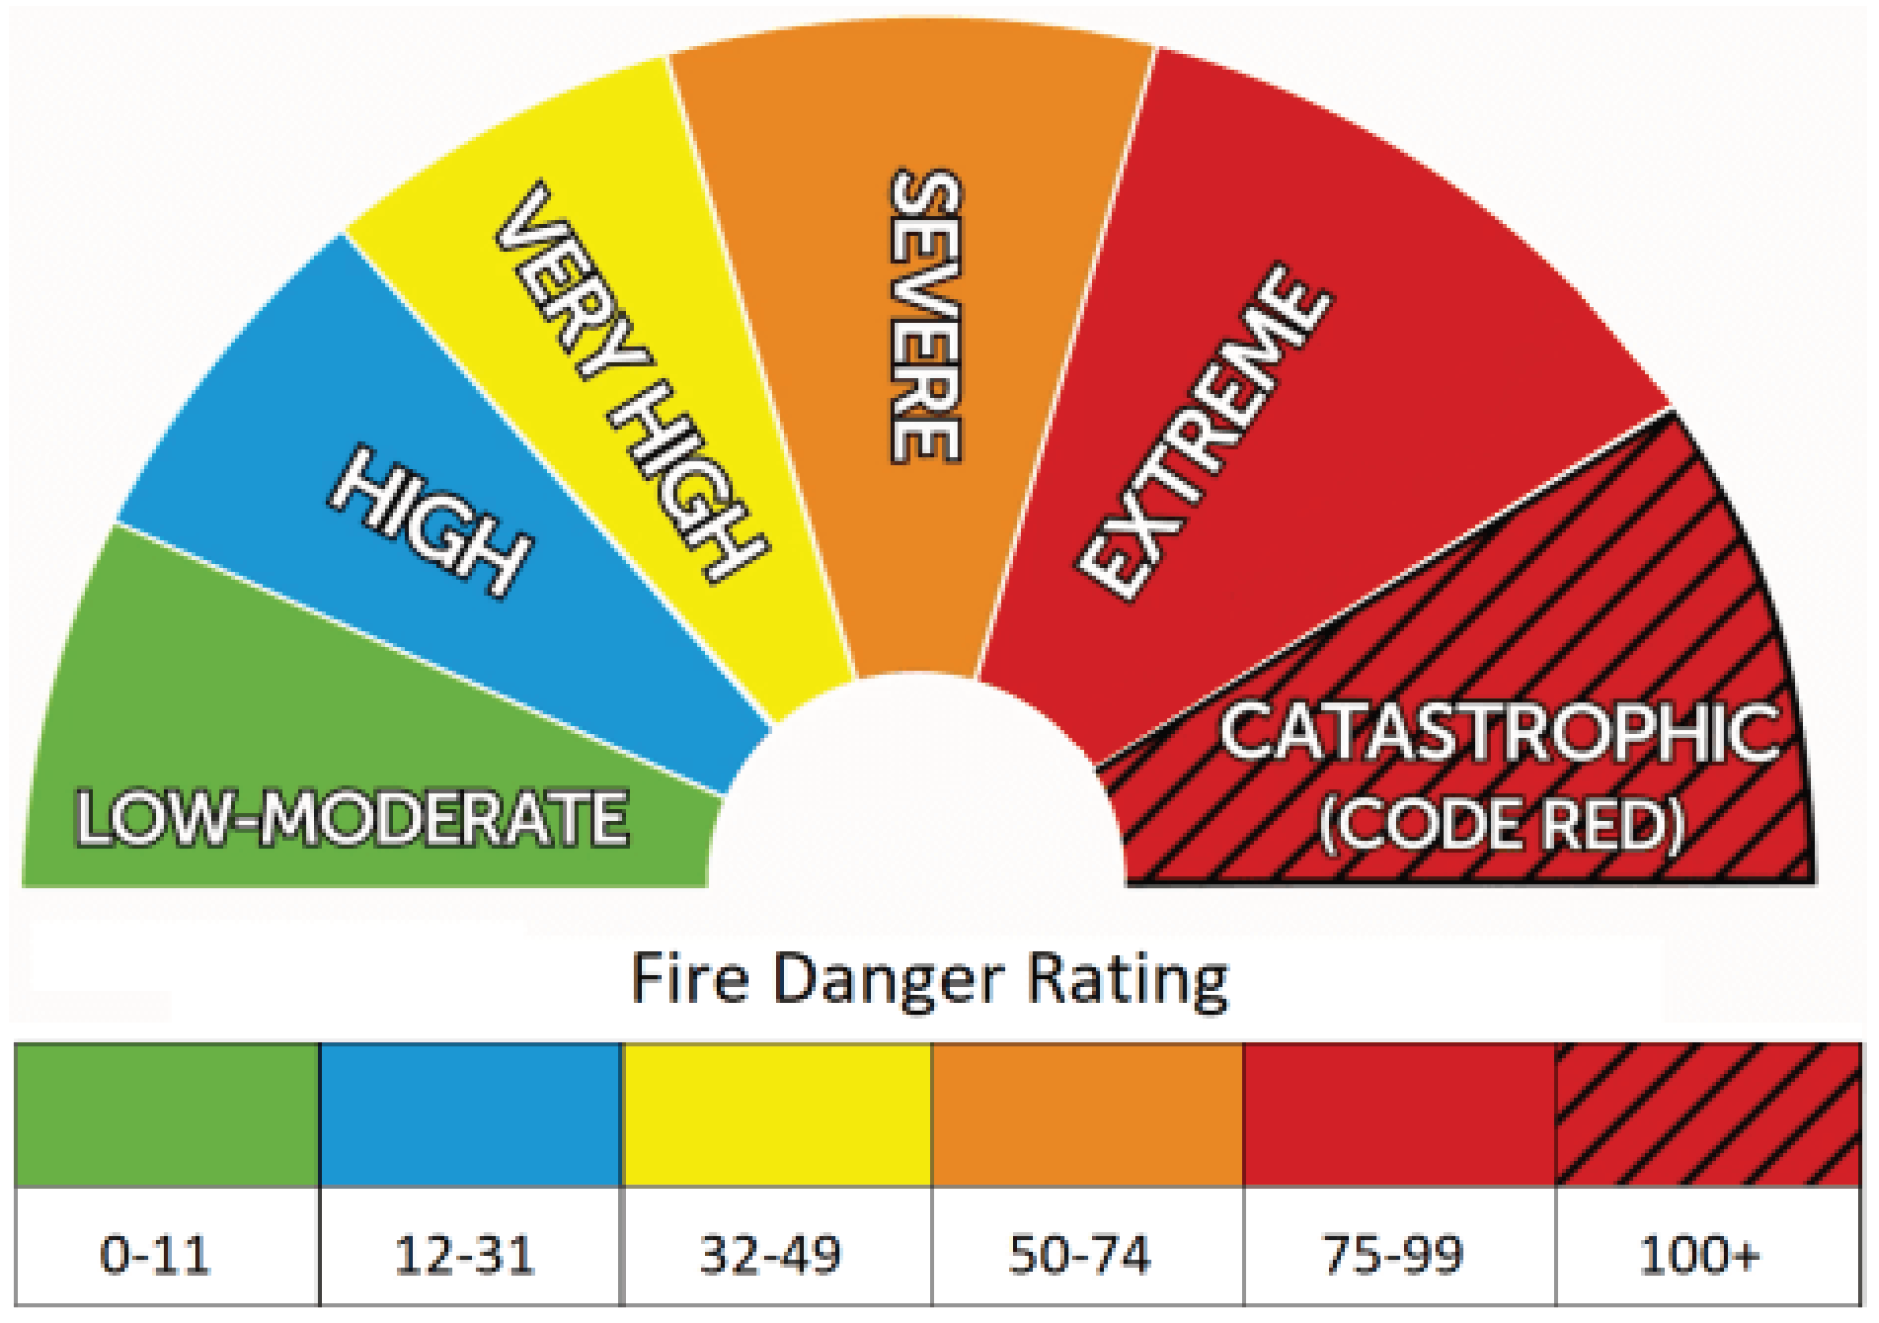
3.2. Wildfires and Rainfall
3.4. Cyber Attacks Detection
4. Mitigation Approaches
4.1. Uncertainties Affecting the Generation
4.2. Uncertainties Affecting the Network Assets
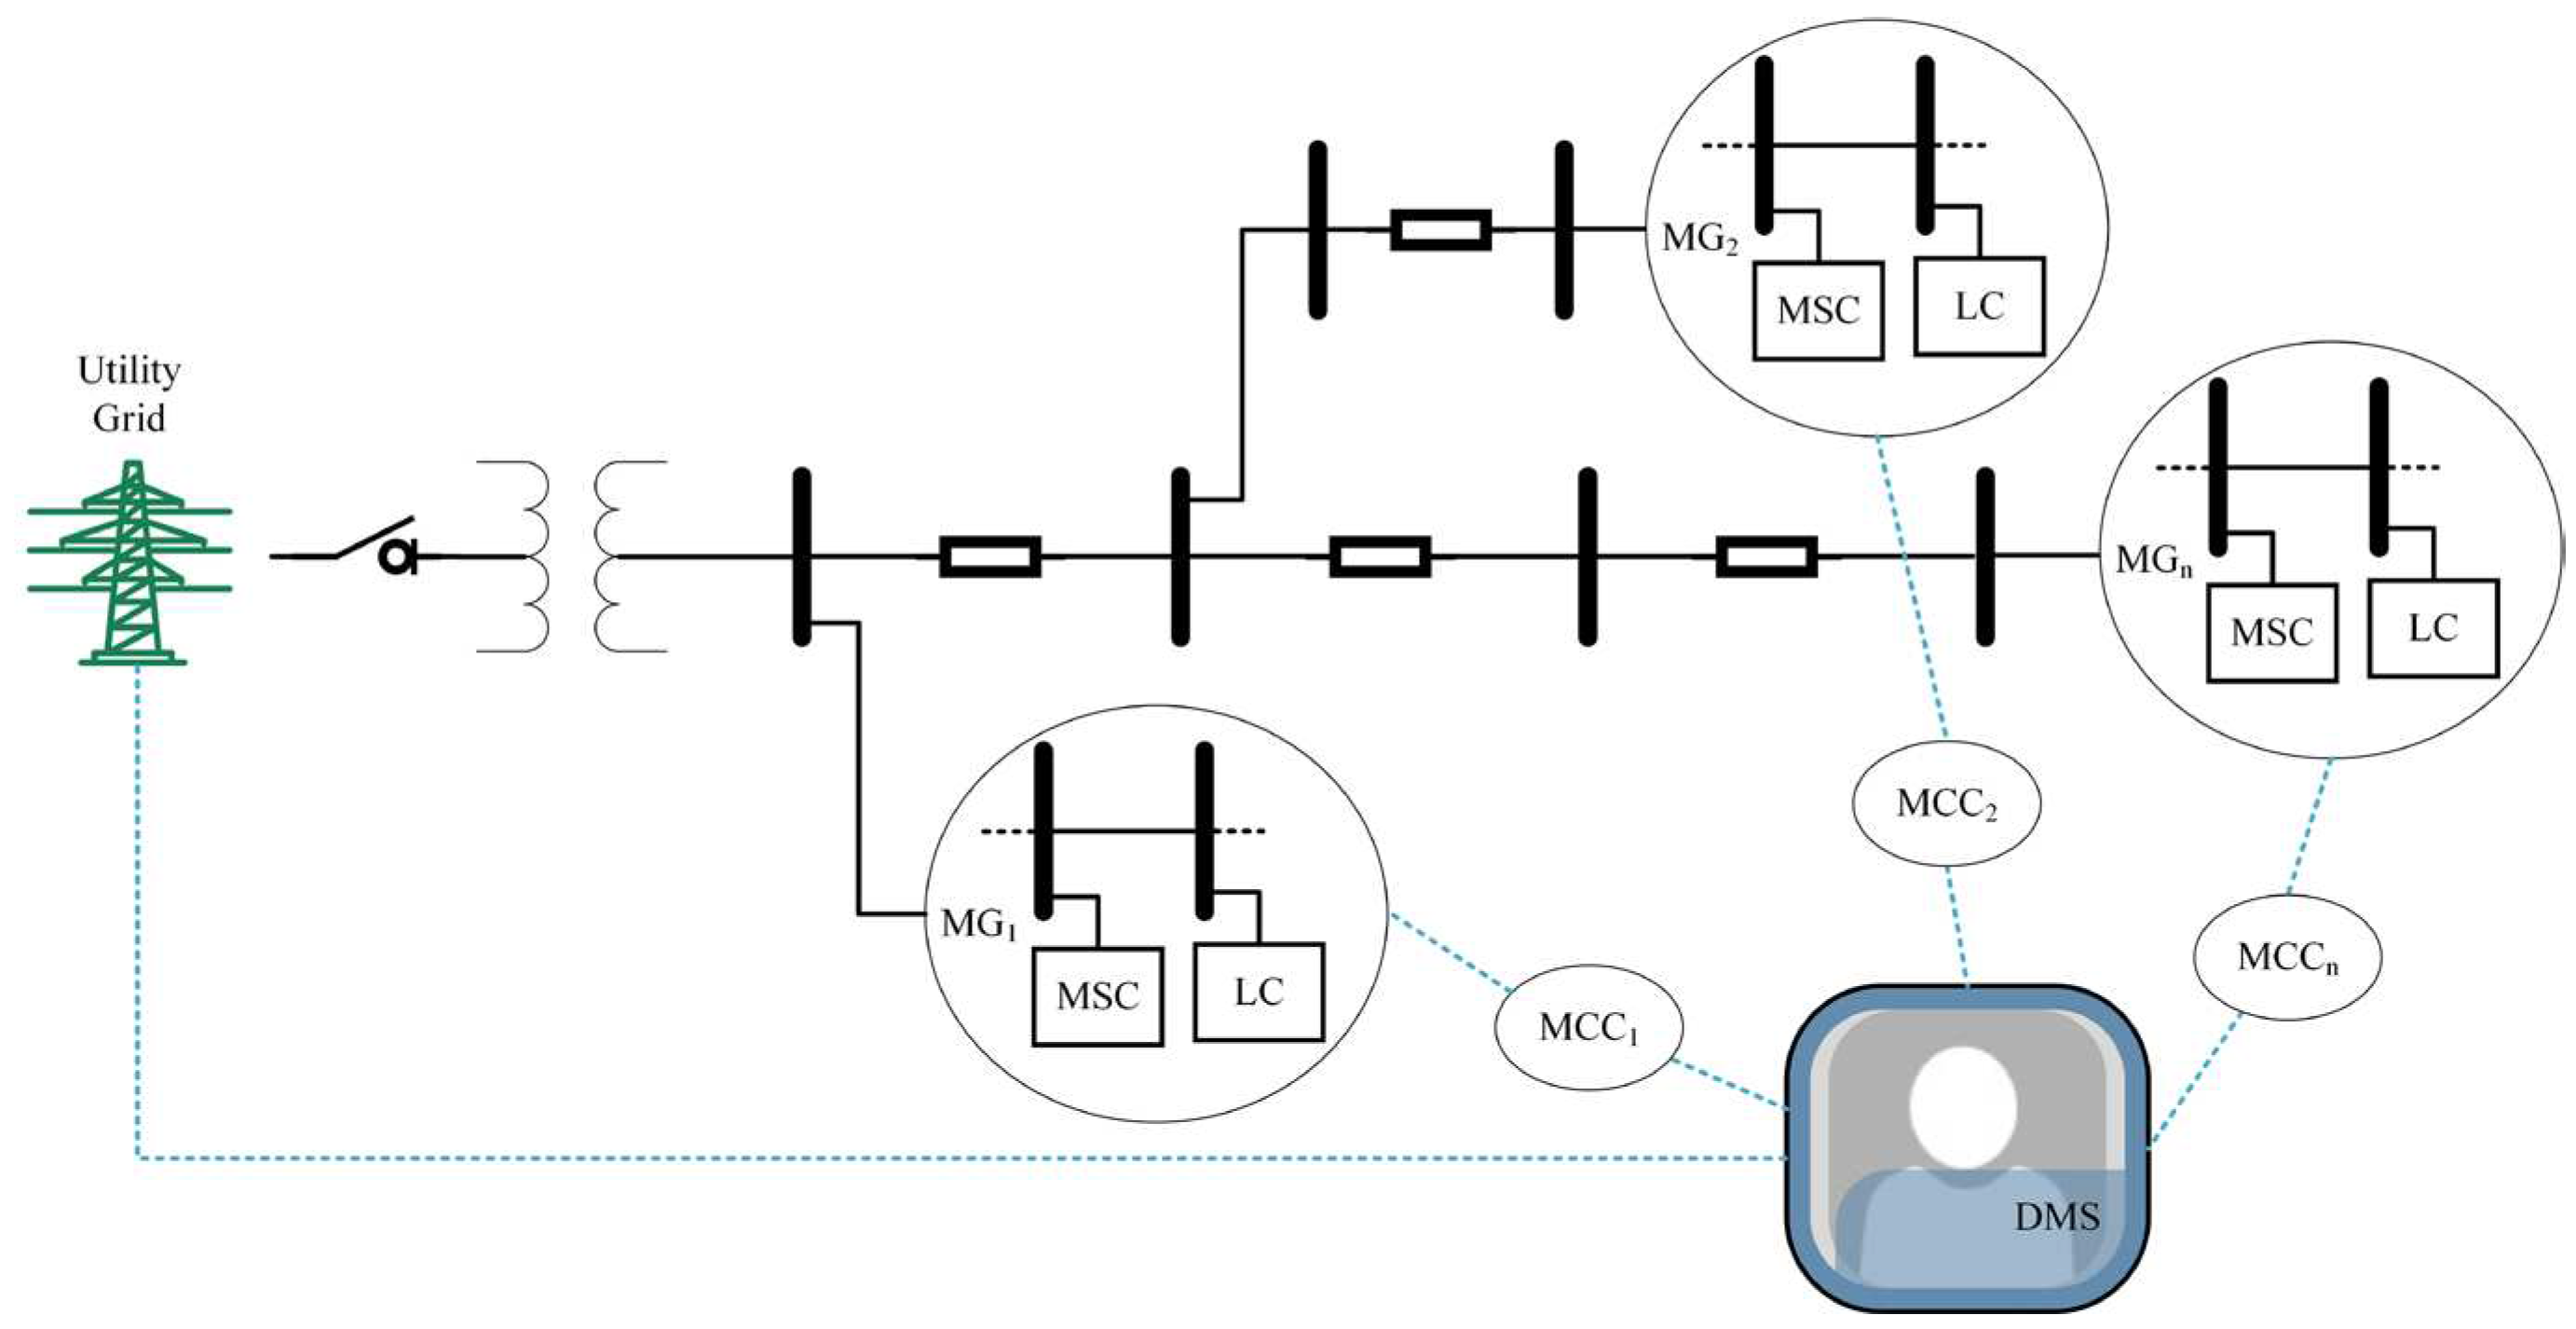
4.3. Uncertainties Affecting the Communication Link
4.4. Emerging Technologies
5. Limitations and Possible Future Directions
5.1. Limitation for MCMC
5.2. Limitations for defining the weather regions
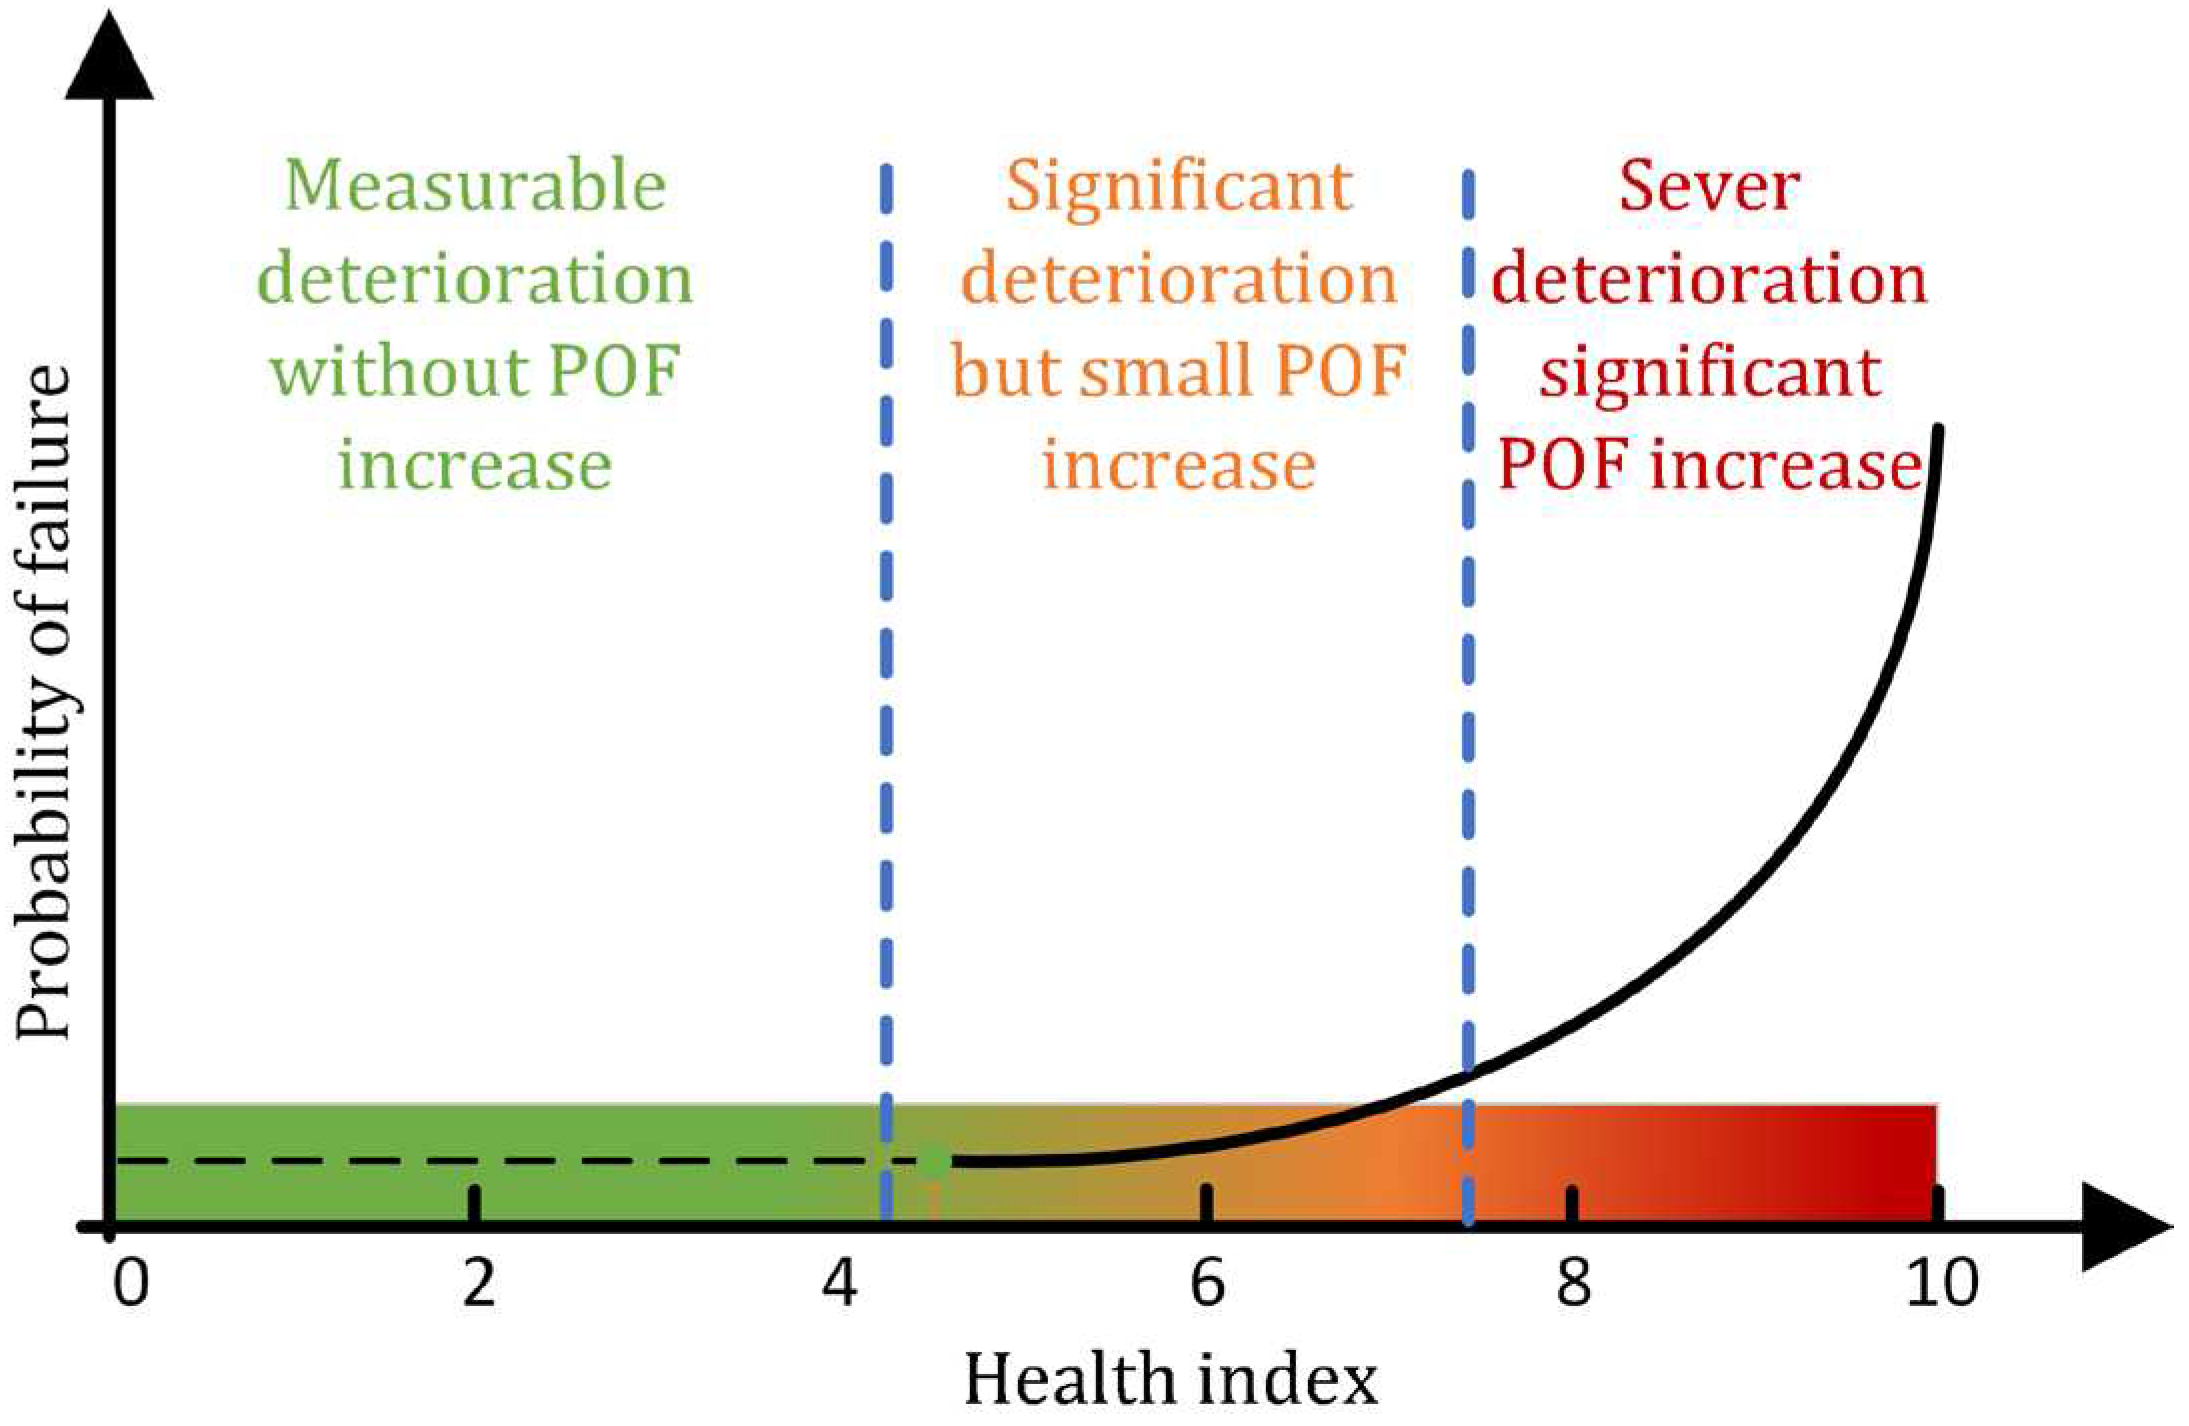
5.3. Limitations for Asset management
6. Conclusions
References
- Schroeder, P.W. The nineteenth century system: balance of power or political equilibrium? Review of International Studies 1989, 15, 2. [Google Scholar] [CrossRef]
- Liu, Z., Global energy interconnection. Academic Press, 2015.
- Carrasco, J.M.; Franquelo, L.G.; Bialasiewicz, J.T.; Galván, E.; Portillo, R.; Prats, M.M.; León, J.I. Moreno-Alfonso, N. Power-electronic systems for the grid integration of renewable energy sources:: A survey. (in English),Ieee T Ind Electron Aug 2006, 53, 4.
- Bublitz, A.; Keles, D.; Zimmermann, F.; Fraunholz, C.Fichtner, W. A survey on electricity market design: Insights from theory and real-world implementations of capacity remuneration mechanisms. (in English),Energ Econ May 2019, 80.
- Rice, E.B.AlMajali, A. Mitigating The Risk Of Cyber Attack On Smart Grid Systems. (in English),Procedia Comput Sci 2014, 28.
- Inquiry into the National Electricity Market. Available online: https://www.accc.gov.au/system/files/Inquiry%20into%20the%20National%20Electricity%20Market%20-%20May%202022%20report%2813880615.1%29.pdf (accessed on 11 November 2023).
- AlMajali, A.; Rice, E.; Viswanathan, A.; Tan, K.Neuman, C. A Systems Approach to Analysing Cyber-Physical Threats in the Smart Grid. (in English),Int Conf Smart Grid 2013.
- Zhang, Y.; Wang, J.X.Wang, X.F. Review on probabilistic forecasting of wind power generation. (in English),Renew Sust Energ Rev Apr 2014, 32.
- Roald, L.A.; Pozo, D.; Papavasiliou, A.; Molzahn, D.K.; Kazempour, J. Conejo, A. Power systems optimization under uncertainty: A review of methods and applications. (in English),Electr Pow Syst Res Jan 1 2023, 214.
- Borunda, M.; Rodríguez-Vázquez, K.; Garduno-Ramirez, R.; de la Cruz-Soto, J.; Antunez-Estrada, J. Jaramillo, O.A. Long-Term Estimation of Wind Power by Probabilistic Forecast Using Genetic Programming. (in English),Energies Apr 2020, 13, 8.
- Chandramowli, S.N. Felder, F.A. Impact of climate change on electricity systems and markets - A review of models and forecasts. (in English),Sustain Energy Techn Mar 2014, 5.
- Sathaye, J.; Shukla, P.R. Ravindranath, N.H. Climate change, sustainable development and India: Global and national concerns. (in English),Curr Sci India Feb 10 2006, 90, 3.
- Climate change impacts on power systems. Available online: https://www.preventionweb.net/news/climate-change-impacts-power-systems (accessed on 13 October 2023).
- How Does Weather Affect the Electrical Grid. Available online: https://marketscale.com/industries/building-management/how-does-weather-affect-the-electrical-grid/ (accessed on 13 October 2023).
- Handayani, K.; Filatova, T. Krozer, Y. The Vulnerability of the Power Sector to Climate Variability and Change: Evidence from Indonesia. (in English),Energies Oct 2019, 12, 19.
- Anadon, L.D.; Baker, E. Bosetti, V. Integrating uncertainty into public energy research and development decisions. Nature Energy 2017, 2, 5.
- Bhusal, N.; Gautam, M.; Abdelmalak, M. Benidris, M. Modeling of Natural Disasters and Extreme Events for Power System Resilience Enhancement and Evaluation Methods. (in English),Int Conf Pr Me a P S 2020.
- Stock, S.; Babazadeh, D. Becker, C. Applications of Artificial Intelligence in Distribution Power System Operation. (in English),Ieee Access 2021, 9.
- Brusentsev, V. Vroman, W., Disasters in the United States: frequency, costs, and compensation. WE Upjohn Institute, 2017.
- Increasing frequency and intensity of extreme weather events. Available online: https://www.epa.nsw.gov.au/your-environment/climate-change/trends/extreme-weather-events (accessed on 13 December 2023).
- Hart, D. Birson, K. Deployment of solar photovoltaic generation capacity in the United States. Office of Energy Policy and Systems AnalysisU. S. Department of Energy 2016.
- Nazma Yeasmin, S. erformance of a low cost circular arc horizontal axis wind turbine. 2009.
- Renewable Energy. Available online: https://ourworldindata.org/renewable-energy#citation (accessed on 23 October 2023).
- 2022 Integrated System Plan (ISP). Available online: https://aemo.com.au/energy-systems/major-publications/integrated-system-plan-isp/2022-integrated-system-plan-isp (accessed on 23 October 2023).
- Holttinen, H.; Meibom, P.; Orths, A.; Hulle, F.v.; Ensslin, C.; Hofmann, L.; McCann, J.; Pierik, J.; Tande, J.O. Estanqueiro, A., "Design and Operation of Power Systems with Large Amounts of Wind Power, first results of IEA collaboration," in EWEC’2006-European Wind Energy Conference & Exhibition, 2006, pp. 1-15.
- Pieper, C.Rubel, H. Electricity storage: Making large-scale adoption of wind and solar energies a reality. (in English),Manage Prof 2012.
- Beier, J.; Thiede, S. Herrmann, C. Energy flexibility of manufacturing systems for variable renewable energy supply integration: Real-time control method and simulation. (in English),J Clean Prod Jan 10 2017, 141.
- Anvari, M.; Lohmann, G.; Wächter, M.; Milan, P.; Lorenz, E.; Heinemann, D.; Tabar, M.R.R. Peinke, J. Short term fluctuations of wind and solar power systems. (in English),New J Phys Jun 24 2016, 18.
- Kahwash, F.; Maheri, A. Mahkamov, K. Integration and optimisation of high-penetration Hybrid Renewable Energy Systems for fulfilling electrical and thermal demand for off-grid communities. (in English),Energ Convers Manage May 15 2021, 236.
- Smith, J.C.; Milligan, M.R.; DeMeo, E.A. Parsons, B. Utility wind integration and operating impact state of the art. (in English),Ieee T Power Syst Aug 2007, 22, 3.
- Albadi, M.H. El-Saadany, E.F. Overview of wind power intermittency impacts on power systems. (in English),Electr Pow Syst Res Jun 2010, 80, 6.
- Mladenov, V.; Chobanov, V. Georgiev, A. Impact of Renewable Energy Sources on Power System Flexibility Requirements. (in English),Energies May 2021, 14, 10.
- Zipf, M. Möst, D., "Impacts of volatile and uncertain renewable energy sources on the German electricity system," in 2013 10th International Conference on the European Energy Market (EEM), 2013: IEEE, pp. 1-8.
- Towoju, O.A. Oladele, O.A. Electricity Generation from Hydro, Wind, Solar and the Environment. Engineering and Technology Journal 2021, 39, 9.
- Rikos, E.; Tselepis, S.; Hoyer-Klick, C. Schroedter-Homscheidt, M. Stability and Power Quality Issues in Microgrids Under Weather Disturbances. (in English),Ieee J-Stars Sep 2008, 1, 3.
- Steen, D.; Goop, J.; Göransson, L.; Nursbo, S.; Brolin, M.; Sarasini, S. Kåberger, T. Challenges of integrating solar and wind into the electricity grid. Systems Perspectives on Renewable Power 2014.
- Cost pass through application 2019-20 Bushfire disaster event. Available online: https://www.aer.gov.au/system/files/Endeavour%20Energy%20-%202019-20%20bushfire%20disaster%20event%20cost%20pass%20through%20-%20Application%20-%20August%202020.pdf (accessed on 01 December 2023).
- Serrano, R.; Carvalho, M.R.; Araneda, J.C.; Alamos, O.; Barroso, L.; Bayma, D.; Ferreira, R. Moreno, R. Fighting Against Wildfires in Power Systems: Lessons and Resilient Practices From the Chilean and Brazilian Experiences. (in English),Ieee Power Energy M Jan 2022, 20, 1.
- Clements, D. Mancarella, P. Systemic modelling and integrated assessment of asset management strategies and staff constraints on distribution network reliability. (in English),Electr Pow Syst Res Feb 2018, 155.
- Moseidjord, A. The California electricity crisis. (in English),Energy J 2003, 24, 2.
- Cleveland, K. "SIGNIFICANT BREAKING WORSE" The Fukushima Nuclear Crisis as a Moral Panic. (in English),Crit Asian Stud Sep 2014, 46, 3.
- Avizienis, A.; Laprie, J.C.; Randell, B. Landwehr, C. Basic concepts and taxonomy of dependable and secure computing. (in English),Ieee T Depend Secure Jan-Mar 2004, 1, 1.
- Lessons from the Massive United Kingdom Power Outage. Available online: https://www.govtech.com/blogs/lohrmann-on-cybersecurity/lessons-from-the-massive-uk-power-outage.html#:~:text=According%20to%20another%20source%20(Euronews,Great%20Britain%20said%20on%20Saturday (accessed on 15 December 2023).
- Shair, J.; Xie, X.R.; Wang, L.P.; Liu, W.; He, J.B. Liu, H. Overview of emerging subsynchronous oscillations in practical wind power systems. (in English),Renew Sust Energ Rev Jan 2019, 99.
- Ghafouri, M.; Karaagac, U.; Ameli, A.; Yan, J. Assi, C. A Cyber Attack Mitigation Scheme for Series Compensated DFIG-Based Wind Parks. (in English),Ieee T Smart Grid Nov 2021, 12, 6.
- Haque, N.I.; Shahriar, M.H.; Dastgir, M.G.; Debnath, A.; Parvez, I.; Sarwat, A. Rahman, M.A. Machine learning in generation, detection, and mitigation of cyberattacks in smart grid: A survey. arXiv preprint arXiv:2010.00661 2020.
- Ten, C.W.; Liu, C.C. Manimaran, G. Vulnerability Assessment of Cybersecurity for SCADA Systems. (in English),Ieee T Power Syst Nov 2008, 23, 4.
- Amin, M.; El-Sousy, F.F.M.; Aziz, G.A.A.; Gaber, K. Mohammed, O.A. CPS Attacks Mitigation Approaches on Power Electronic Systems With Security Challenges for Smart Grid Applications: A Review. (in English),Ieee Access 2021, 9.
- Meenal, R.; Binu, D.; Ramya, K.C.; Michael, P.A.; Kumar, K.V.; Rajasekaran, E. Sangeetha, B. Weather Forecasting for Renewable Energy System: A Review. (in English),Arch Comput Method E Aug 2022, 29, 5.
- Torres, J.F.; Hadjout, D.; Sebaa, A.; Martínez-alvarez, F. Troncoso, A. Deep Learning for Time Series Forecasting: A Survey. (in English),Big Data Feb 1 2021, 9, 1.
- Chang, W.-Y. A literature review of wind forecasting methods. Journal of Power and Energy Engineering 2014, 2, 04.
- Voyant, C.; Notton, G.; Kalogirou, S.; Nivet, M.-L.; Paoli, C.; Motte, F. Fouilloy, A. Machine learning methods for solar radiation forecasting: A review. Renewable energy 2017, 105.
- Project 7: Microgrid Impact Study. Available online: https://c4net.com.au/wp-content/uploads/2022/08/49.07-Final_report_P7_v3.pdf (accessed on 25 October 2023).
- Chau, T.K.; Yu, S.S.; Fernando, T. Iu, H.H.C. Demand-Side Regulation Provision From Industrial Loads Integrated With Solar PV Panels and Energy Storage System for Ancillary Services. (in English),Ieee T Ind Inform Nov 2018, 14, 11.
- Dubey, A.K.; Kumar, A.; Garcia-Diaz, V.; Sharma, A.K. Kanhaiya, K. Study and analysis of SARIMA and LSTM in forecasting time series data. (in English),Sustain Energy Techn Oct 2021, 47.
- Meenal, R. Selvakumar, A.I. Assessment of SVM, empirical and ANN based solar radiation prediction models with most influencing input parameters. Renewable Energy 2018, 121.
- Livieris, I.E.; Pintelas, E. Pintelas, P. A CNN-LSTM model for gold price time-series forecasting. (in English),Neural Comput Appl Dec 2020, 32, 23.
- Shamshirband, S.; Rabczuk, T. Chau, K.W. A Survey of Deep Learning Techniques: Application in Wind and Solar Energy Resources. (in English),Ieee Access 2019, 7.
- Carneiro, T.C.; Rocha, P.A.C.; Carvalho, P.C.M. Fernandez-Ramirez, L.M. Ridge regression ensemble of machine learning models applied to solar and wind forecasting in Brazil and Spain. (in English),Appl Energ May 15 2022, 314.
- Díaz-Vico, D.; Torres-Barrán, A.; Omari, A. Dorronsoro, J.R. Deep Neural Networks for Wind and Solar Energy Prediction. (in English),Neural Process Lett Dec 2017, 46, 3.
- Golder, A.; Jneid, J.; Zhao, J.Y. Bouffard, F. Machine Learning-Based Demand and PV Power Forecasts. (in English),Ieee Electr Pow Ener 2019.
- Liu, J.Q.; Yu, S.M.S.; Hu, H.J.; Zhao, J.B. Trinh, H.M. Demand-Side Regulation Provision of Virtual Power Plants Consisting of Interconnected Microgrids Through Double-Stage Double-Layer Optimization. (in English),Ieee T Smart Grid May 2023, 14, 3.
- Akash, R.; Rangaraj, A.G.; Meenal, R. Lydia, M. Machine Learning Based Univariate Models For Long Term Wind Speed Forecasting. (in English),Proceedings of the 5th International Conference on Inventive Computation Technologies (Icict-2020) 2020.
- Alzahrani, A.; Shamsi, P.; Ferdowsi, M. Dagli, C. Solar Irradiance Forecasting Using Deep Recurrent Neural Networks. (in English),Int Conf Renew Energ 2017.
- Hacioğlu, R. Prediction of solar radiation based on machine learning methods. The journal of cognitive systems 2017, 2, 1.
- Wang, Y.; Zou, R.M.; Liu, F.; Zhang, L.J. Liu, Q.Y. A review of wind speed and wind power forecasting with deep neural networks. (in English),Appl Energ Dec 15 2021, 304.
- Guo, Z.H.; Dong, Y.; Wang, J.Z. Lu, H.Y. The Forecasting Procedure for Long-Term Wind Speed in the Zhangye Area. (in English),Math Probl Eng 2010, 2010.
- Ferreira, M.; Santos, A. Lucio, P. Short-term forecast of wind speed through mathematical models. (in English),Energy Rep Nov 2019, 5.
- Santamaría-Bonfil, G.; Reyes-Ballesteros, A. Gershenson, C. Wind speed forecasting for wind farms: A method based on support vector regression. Renewable Energy 2016, 85.
- Bludszuweit, H.; Dominguez-Navarro, J.A. Llombart, A. Statistical analysis of wind power forecast error. (in English),Ieee T Power Syst Aug 2008, 23, 3.
- Yuan, Z.P.; Xia, J. Li, P. Two-Time-Scale Energy Management for Microgrids With Data-Based Day-Ahead Distributionally Robust Chance-Constrained Scheduling. (in English),Ieee T Smart Grid Nov 2021, 12, 6.
- Riaz, M.; Ahmad, S.; Hussain, I.; Naeem, M. Mihet-Popa, L. Probabilistic Optimization Techniques in Smart Power System. (in English),Energies Feb 2022, 15, 3.
- Ben-Tal, A. Nemirovski, A. Robust solutions of uncertain linear programs. (in English),Oper Res Lett Aug 1999, 25, 1.
- Campi, M.C.; Garatti, S. Prandini, M. The scenario approach for systems and control design. Annual Reviews in Control 2009, 33, 2.
- Hongji Hu, M.V. Farhad Farokhi, "Co-optimization of Frequency Regulation Capacity and Performance Offered by Microgrid under Uncertainty," University of Melbourne, MPHIL THESIS, 2023.
- Das, L.; Munikoti, S.; Natarajan, B. Srinivasan, B. Measuring smart grid resilience: Methods, challenges and opportunities. (in English),Renew Sust Energ Rev Sep 2020, 130.
- Jufri, F.H.; Oh, S.; Jung, J. Choi, M.-H., "A method to forecast storm-caused distribution grid damages using cost-sensitive regression algorithm," in 2019 IEEE Innovative Smart Grid Technologies-Asia (ISGT Asia), 2019: IEEE, pp. 3986-3990.
- Panteli, M. Mancarella, P. Modeling and Evaluating the Resilience of Critical Electrical Power Infrastructure to Extreme Weather Events. (in English),Ieee Syst J Sep 2017, 11, 3.
- Yang, W.J.; Sparrow, S.N.; Ashtine, M.; Wallom, D.C.H. Morstyn, T. Resilient by design: Preventing wildfires and blackouts with microgrids. (in English),Appl Energ May 1 2022, 313.
- Panteli, M. Mancarella, P. Influence of extreme weather and climate change on the resilience of power systems: Impacts and possible mitigation strategies. (in English),Electr Pow Syst Res Oct 2015, 127.
- Forest Fire Danger Index. Available online: https://research.csiro.au/bushfire/assessing-bushfire-hazards/hazard-identification/fire-danger-index/ (accessed on 16 October 2023).
- Blackmore, P. Leeprechanon, N. Improving Network Reliability Through Effective Asset Management. (in English),2015 Ieee Innovative Smart Grid Technologies - Asia (Isgt Asia) 2015.
- Fickler, R.; Cheim, L. Lam, B. Application of Probabilistic Techniques in Asset Management. (in English),2009 Ieee/Pes Power Systems Conference and Exposition, Vols 1-3 2009.
- Chatterjee, K.; Padmini, V. Khaparde, S.A. Review of Cyber Attacks on Power System Operations. (in English),Ieee Region 10 Symp 2017.
- Esmalifalak, M.; Liu, L.C.; Nguyen, N.; Zheng, R. Han, Z. Detecting Stealthy False Data Injection Using Machine Learning in Smart Grid. (in English),Ieee Syst J Sep 2017, 11, 3.
- He, Y.B.; Mendis, G.J. Wei, J. Real-Time Detection of False Data Injection Attacks in Smart Grid: A Deep Learning-Based Intelligent Mechanism. (in English),Ieee T Smart Grid Sep 2017, 8, 5.
- Karimipour, H.; Dehghantanha, A.; Parizi, R.M.; Choo, K.K.R. Leung, H. A Deep and Scalable Unsupervised Machine Learning System for Cyber-Attack Detection in Large-Scale Smart Grids. (in English),Ieee Access 2019, 7.
- Zhang, J.N.; Guo, L.L. Ye, J. Cyber-Attack Detection for Photovoltaic Farms Based on Power-Electronics-Enabled Harmonic State Space Modeling. (in English),Ieee T Smart Grid Sep 2022, 13, 5.
- Dileep, G. A survey on smart grid technologies and applications. (in English),Renewable Energy Feb 2020, 146.
- Hannan, M.A.; Faisal, M.; Ker, P.J.; Begum, R.A.; Dong, Z.Y. Zhang, C. Review of optimal methods and algorithms for sizing energy storage systems to achieve decarbonization in microgrid applications. (in English),Renew Sust Energ Rev Oct 2020, 131.
- Sharafi, D.; Dowdy, A.; Landsberg, J.; Bryant, P.; Ward, D.; Eggleston, J. Liu, G.C. Wildfires Down Under: Impacts and Mitigation Strategies for Australian Electricity Grids. (in English),Ieee Power Energy M Jan 2022, 20, 1.
- Dehghani, N.L.; Darestani, Y.M. Shafieezadeh, A. Optimal Life-Cycle Resilience Enhancement of Aging Power Distribution Systems: A MINLP-Based Preventive Maintenance Planning. (in English),Ieee Access 2020, 8.
- Gunantara, N. A review of multi-objective optimization: Methods and its applications. (in English),Cogent Eng Aug 29 2018, 5, 1.
- Dehghanian, P.; Fotuhi-Firuzabad, M.; Bagheri-Shouraki, S. Kazemi, A.A.R. Critical Component Identification in Reliability Centered Asset Management of Power Distribution Systems Via Fuzzy AHP. (in English),Ieee Syst J Dec 2012, 6, 4.
- Alvarez-Alvarado, M.S.; Donaldson, D.L.; Recalde, A.A.; Noriega, H.H.; Khan, Z.A.; Velasquez, W. Rodríguez-Gallegos, C.D. Power System Reliability and Maintenance Evolution: A Critical Review and Future Perspectives. (in English),Ieee Access 2022, 10.
- Awadallah, S.K.E.; Milanovic, J.V.; Jarman, P.N. Wang, Z.D. Probabilistic Indicators for Assessing Age- and Loading-Based Criticality of Transformers to Cascading Failure Events. (in English),Ieee T Power Syst Sep 2014, 29, 5.
- Rajkumar, V.S.; Tealane, M.; Stefanov, A.; Presekal, A. Palensky, P. Cyber Attacks on Power System Automation and Protection and Impact Analysis. (in English),Ieee Pes Innov Smart 2020.
- Barreto, C.; Eghtesad, T.; Eisele, S.; Laszka, A.; Dubey, A. Koutsoukos, X., "Cyber-attacks and mitigation in blockchain based transactive energy systems," in 2020 IEEE Conference on Industrial Cyberphysical Systems (ICPS), 2020, vol. 1: IEEE, pp. 129-136.
- Sridhar, S.; Hahn, A. Govindarasu, M. Cyber-Physical System Security for the Electric Power Grid. (in English),P Ieee Jan 2012, 100, 1.
- Ten, C.W.; Manimaran, G. Liu, C.C. Cybersecurity for Critical Infrastructures: Attack and Defense Modeling. (in English),Ieee T Syst Man Cy A Jul 2010, 40, 4.
- Zografopoulos, I.; Hatziargyriou, N.D. Konstantinou, C. Distributed Energy Resources Cybersecurity Outlook: Vulnerabilities, Attacks, Impacts, and Mitigations. (in English),Ieee Syst J Sep 1 2023.
- Hernández-Mayoral, E.; Madrigal-Martínez, M.; Mina-Antonio, J.D.; Iracheta-Cortez, R.; Enríquez-Santiago, J.A.; Rodríguez-Rivera, O.; Martínez-Reyes, G. Mendoza-Santos, E. A Comprehensive Review on Power-Quality Issues, Optimization Techniques, and Control Strategies of Microgrid Based on Renewable Energy Sources. (in English),Sustainability-Basel Jun 2023, 15, 12.
- Nair, R.P. Kanakasabapathy, P. PR controller-based droop control strategy for AC microgrid using Ant Lion Optimization technique. (in English),Energy Rep Dec 2023, 9.
- Borazjani, P.; Wahab, N.I.A.; Hizam, H.B. Soh, A.B.C. A review on microgrid control techniques. 2014 IEEE Innovative Smart Grid Technologies-Asia (ISGT ASIA) 2014.
- Blanco, H. Faaij, A. A review at the role of storage in energy systems with a focus on Power to Gas and long-term storage. Renewable and Sustainable Energy Reviews 2018, 81.
- Amini, M. Almassalkhi, M. Optimal Corrective Dispatch of Uncertain Virtual Energy Storage Systems. (in English),Ieee T Smart Grid Sept 2020, 11, 5.
- Reddy, Y.J.; Dash, S.; Ramsesh, A.; Kumar, Y.V.P. Raju, K.P. Monitoring and Control of Real Time Simulated Microgrid with Renewable Energy Sources. (in English),2012 Ieee Fifth Power India Conference 2012.
- Zhou, Y.Z.; Zhai, Q.Z. Wu, L. Multistage Transmission-Constrained Unit Commitment With Renewable Energy and Energy Storage: Implicit and Explicit Decision Methods. (in English),Ieee T Sustain Energ Apr 2021, 12, 2.
- Cobos, N.G.; Arroyo, J.M.; Alguacil, N. Wang, J.H. Robust Energy and Reserve Scheduling Considering Bulk Energy Storage Units and Wind Uncertainty. (in English),Ieee T Power Syst Sep 2018, 33, 5.
- Oshnoei, A.; Kheradmandi, M.; Blaabjerg, F.; Hatziargyriou, N.D.; Muyeen, S.M. Anvari-Moghaddam, A. Coordinated control scheme for provision of frequency regulation service by virtual power plants. (in English),Appl Energ Nov 1 2022, 325.
- Zhang, X.; Hug, G.; Kolter, J.Z. Harjunkoski, I. Demand Response of Ancillary Service From Industrial Loads Coordinated With Energy Storage. (in English),Ieee T Power Syst Jan 2018, 33, 1.
- Karagiannopoulos, S.; Roald, L.; Aristidou, P. Hug, G., "Operational planning of active distribution grids under uncertainty," in IREP 2017, X Bulk Power Systems Dynamics and Control Symposium, 2017.
- Naughton, J.; Wang, H.; Cantoni, M. Co-optimizing virtual power plant services under uncertainty: A robust scheduling and receding horizon dispatch approach. Ieee T Power Syst 2021, 36, 5.

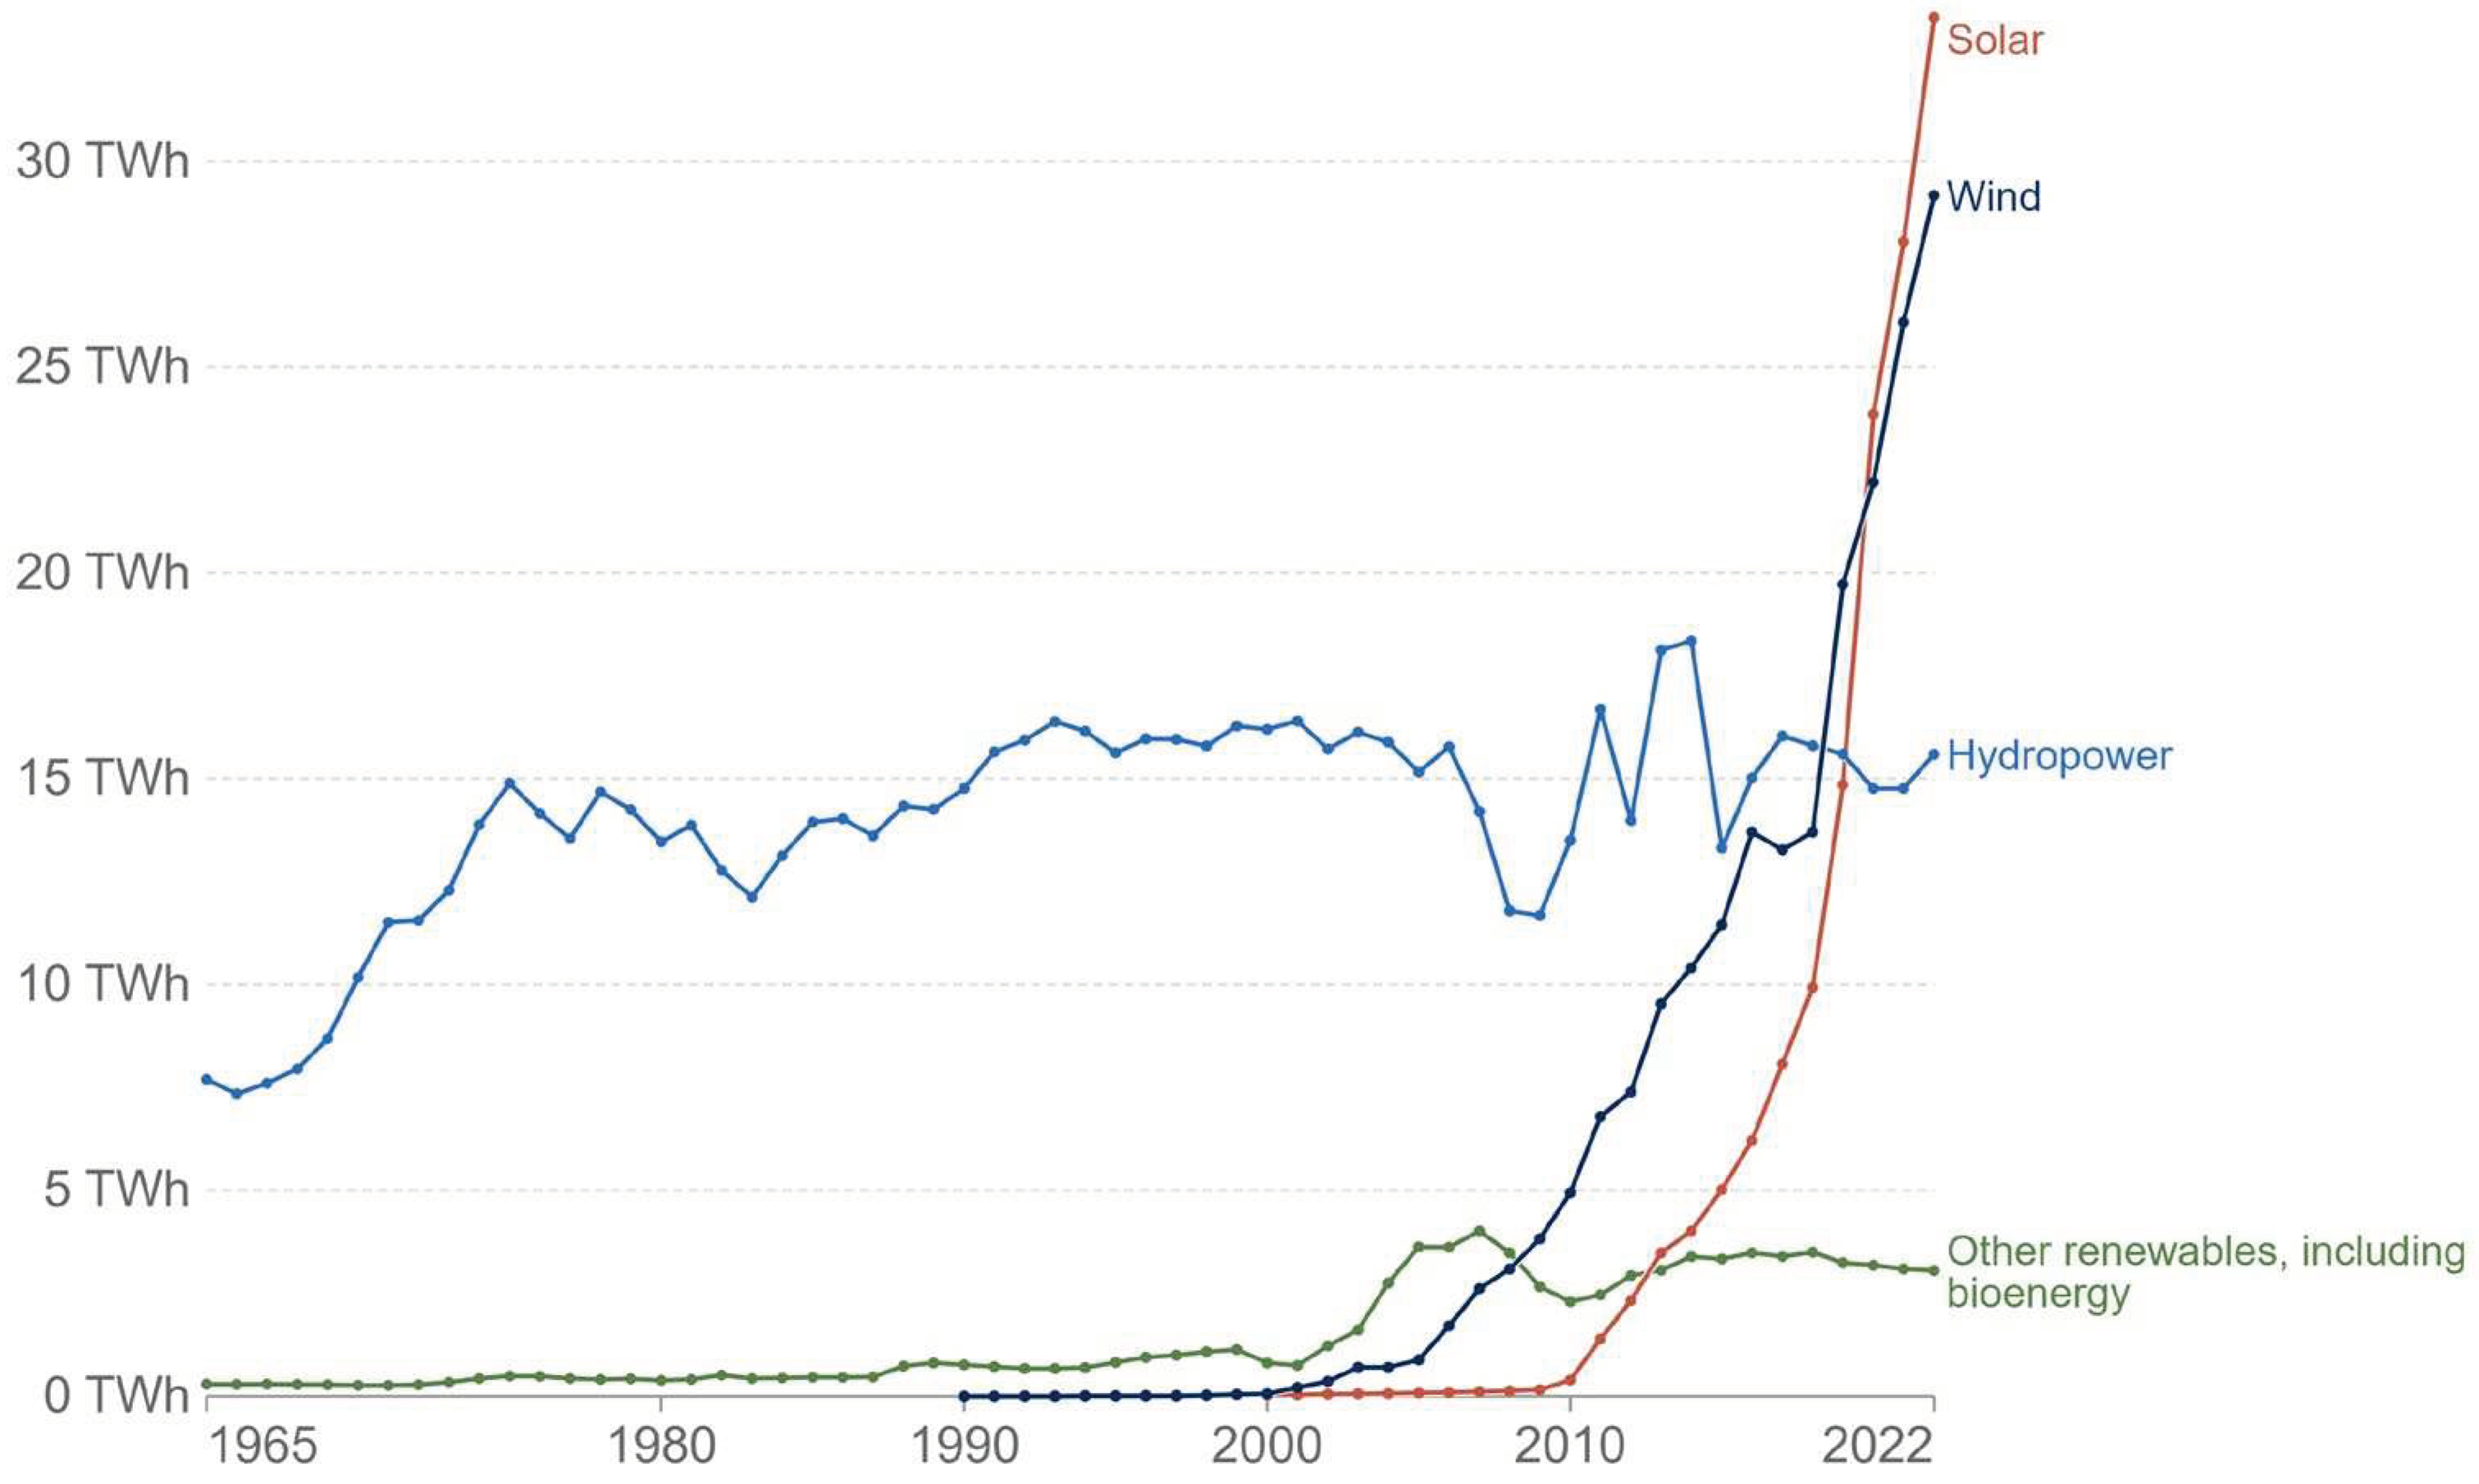
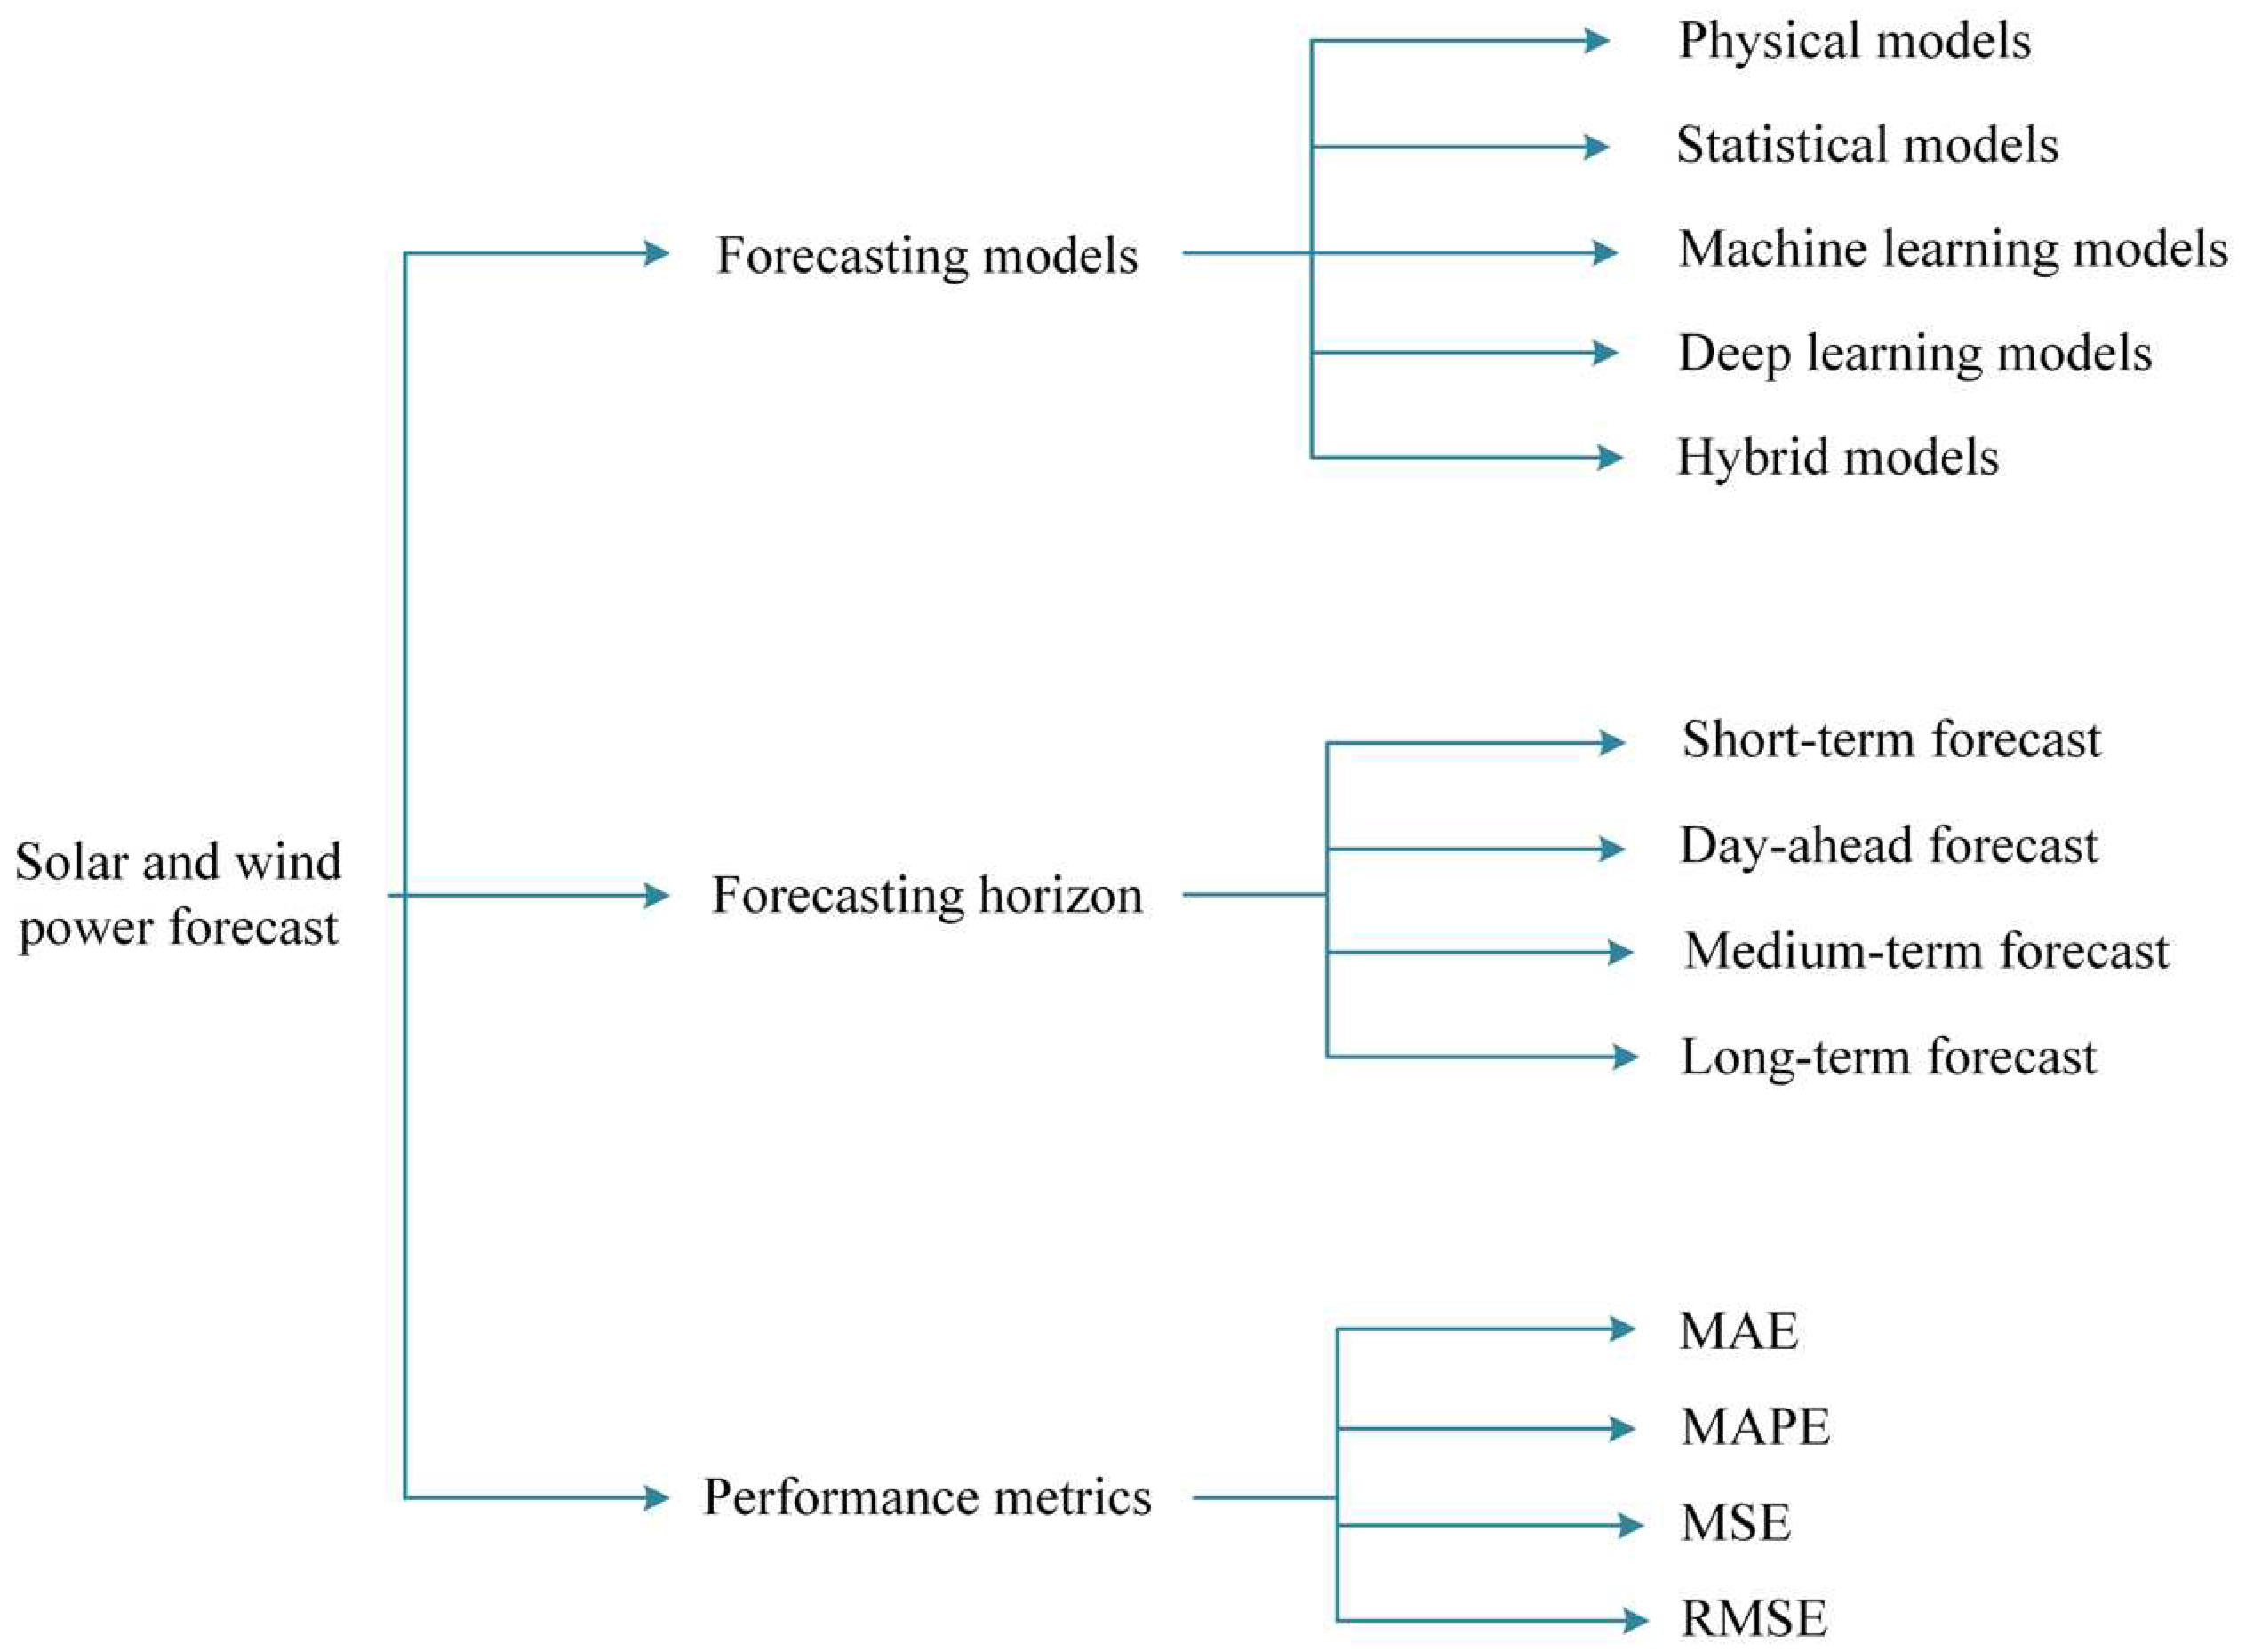
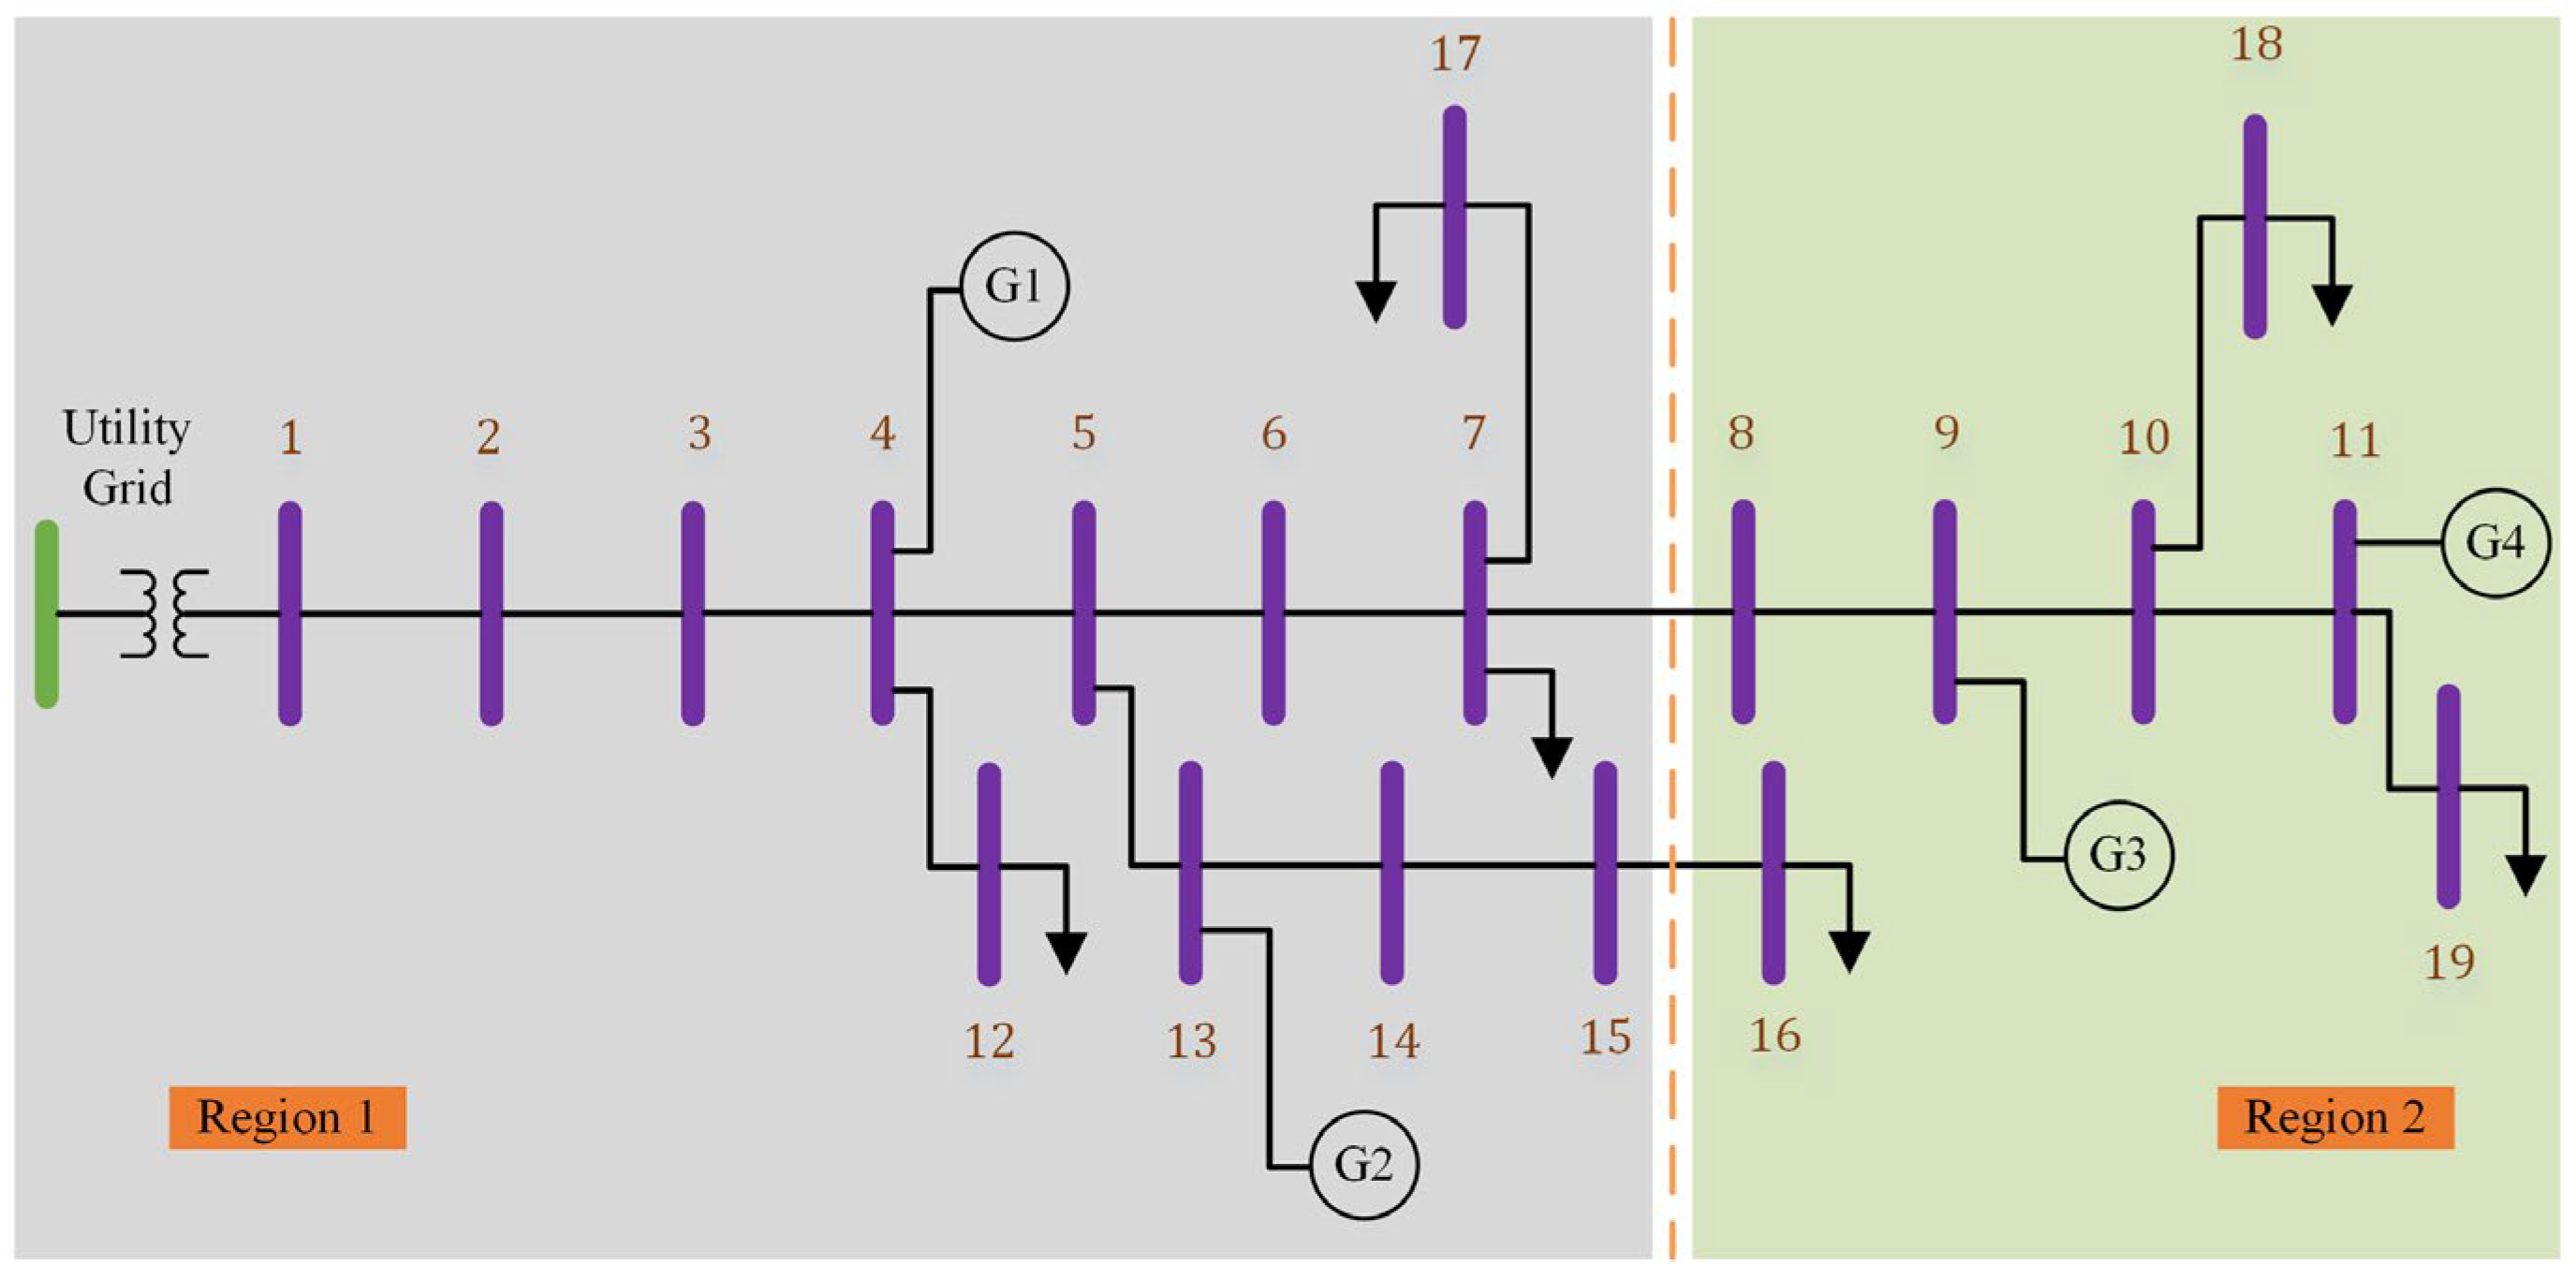
| Reference | Brief description | Input | Error metrics |
|---|---|---|---|
| [64] | The LSTM-based deep learning model is utilized for solar irradiance forecasts. | Solar irradiance | RMSE: 9.788 MSE: 9.721 |
| [62] | The LSTM-based deep learning model is applied for solar power forecast. | time, wind speed, air pressure, humidity, temperature, wind direction, and pyranometer | MSE |
| [52] | Machine learning models including SVM and regression trees are applied to predict solar radiation | Solar irradiance | RMSE |
| [50] | RNN based deep learning model is applied for short-term PV power forecast | Weather inputs from IoT dataset and historical PV generation | R2: 0.988 |
| [65] | Linear regression and Gaussian process regression-based machine learning models are utilized for solar irradiance forecasts. | Wind speed, temperature, humidity parameters, pressure and solar irradiance | MAE: 0.0166 RMSE: 0.0227 |
| [66] | ANN-based machine learning model is applied to wind power forecast. | Temperature, Pressure, Wind direction | NMAE: 0.0044 |
| [67] | ARMA model is utilized for wind speed forecast | Historical value of wind speed | MAE: 0.57 |
| [68] | Hybrid time-series models are applied for short-term wind speed forecasts. | Air pressure, wind speed, wind direction | RMSE: 2.27 |
| [69] | The SVM-based machine learning model is utilized for wind speed forecast | Wind speed, Wind direction, humidity, Solar radiation, temperature, atmospheric pressure, and heat radiation | NMAE: 0.15 |
| Category | Brief description | Reference |
|---|---|---|
| MGs | The report discusses the use of transition matrices to model the probability distribution of solar generation and demand at different intervals of the day. It presents heat maps of transition matrices for solar power generation, showing the likelihood of transition from one state to another. | [53] |
| The paper introduces a two-stage operation strategy for interconnected Microgrids (IMGs). In the initial stage, day-ahead scheduling is employed to forecast the electricity consumption baseline and regulation capacity for the subsequent day. The second stage focuses on real-time power consumption control, utilizing dynamic regulation (RegD) signals. This second stage consists of two layers: the upper layer manages demand response signals and facilitates electricity exchange among microgrids through an energy-sharing mechanism, while the lower layer executes real-time power consumption control for each individual microgrid. | [62] | |
| The decentralized control approach divides the distribution system into intelligent small grids called microgrids, which can operate autonomously. In island mode, microgrids use voltage and frequency droop control characteristics to share the load automatically without the need for communication systems. In order to reduce the complexity of the network, a de-centralized approach using microgrids is suggested. | [107] | |
| This document is a review of microgrid control techniques, specifically focusing on controlling microgrids with distributed RESs in island mode. | [104] | |
| ESS control | The paper proposes explicit and implicit decision methods, to address the scheduling problem with a focus on solution robustness and nonparticipative qualities. The explicit decision method assumes affine policies linking decision variables and uncertainty realizations, whereas the implicit decision method explores secure ranges of thermal unit outputs and SOC levels to ensure the feasibility of future economic dispatch solutions. | [108] |
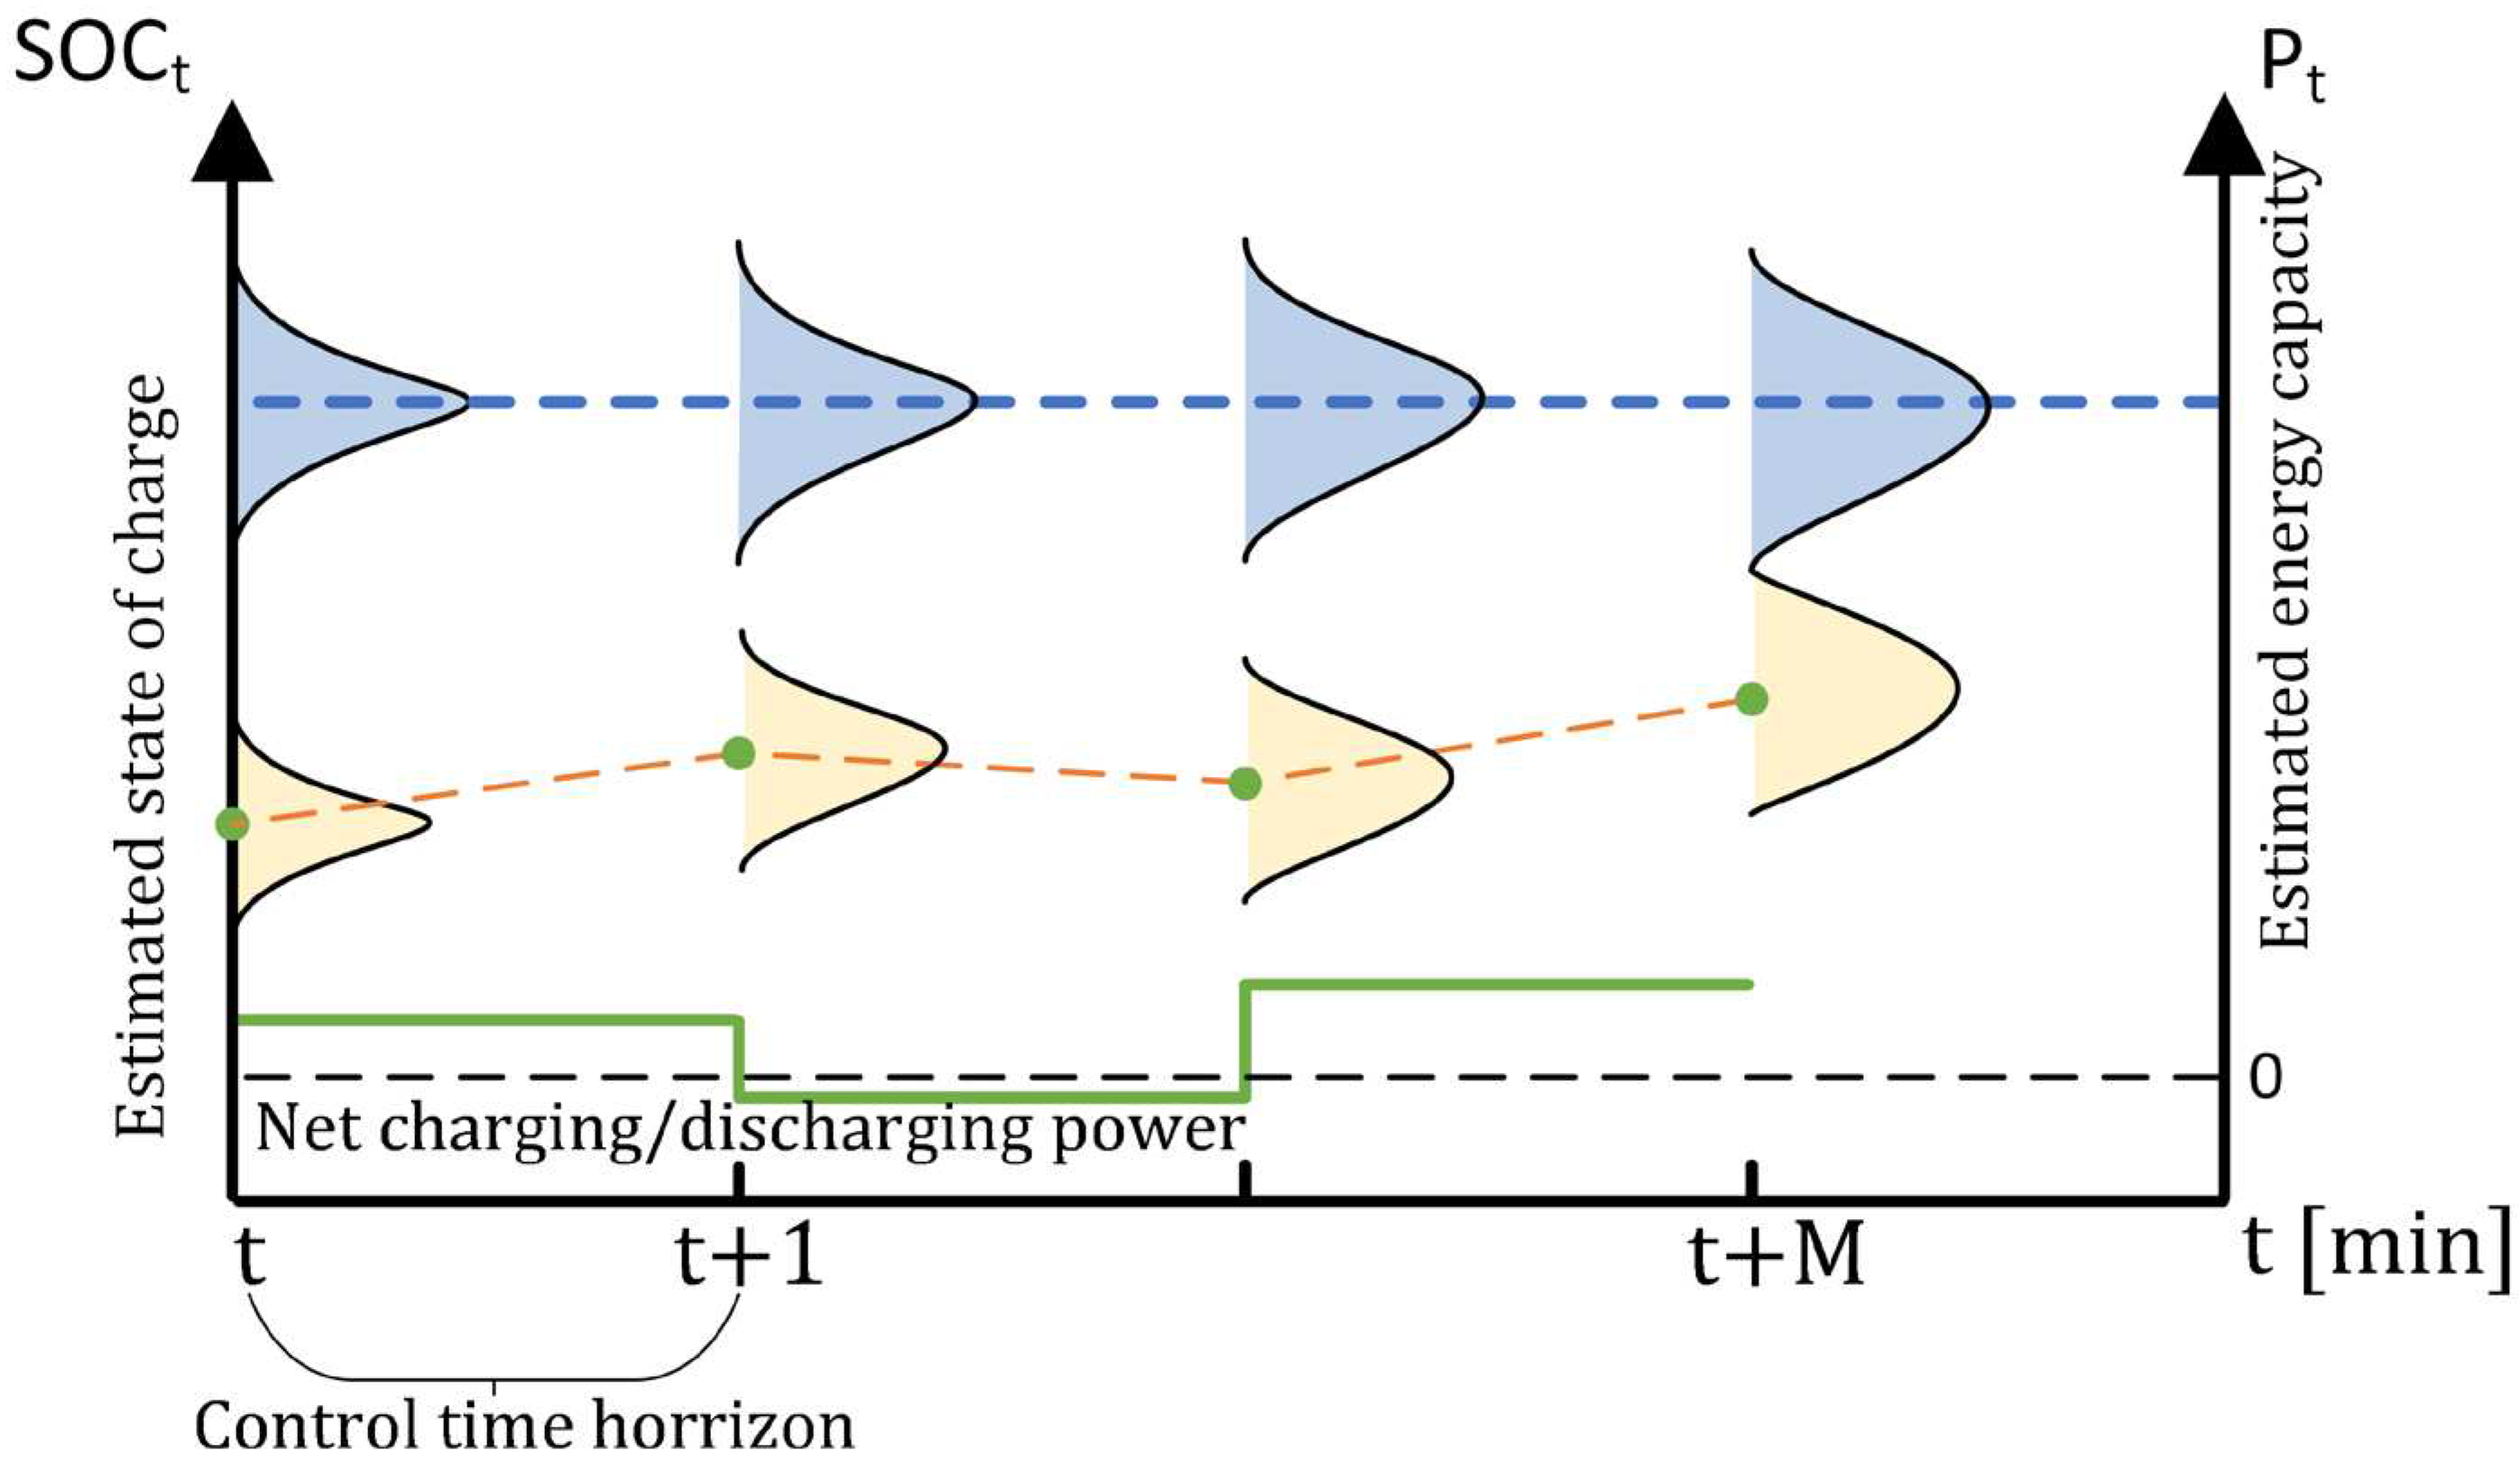
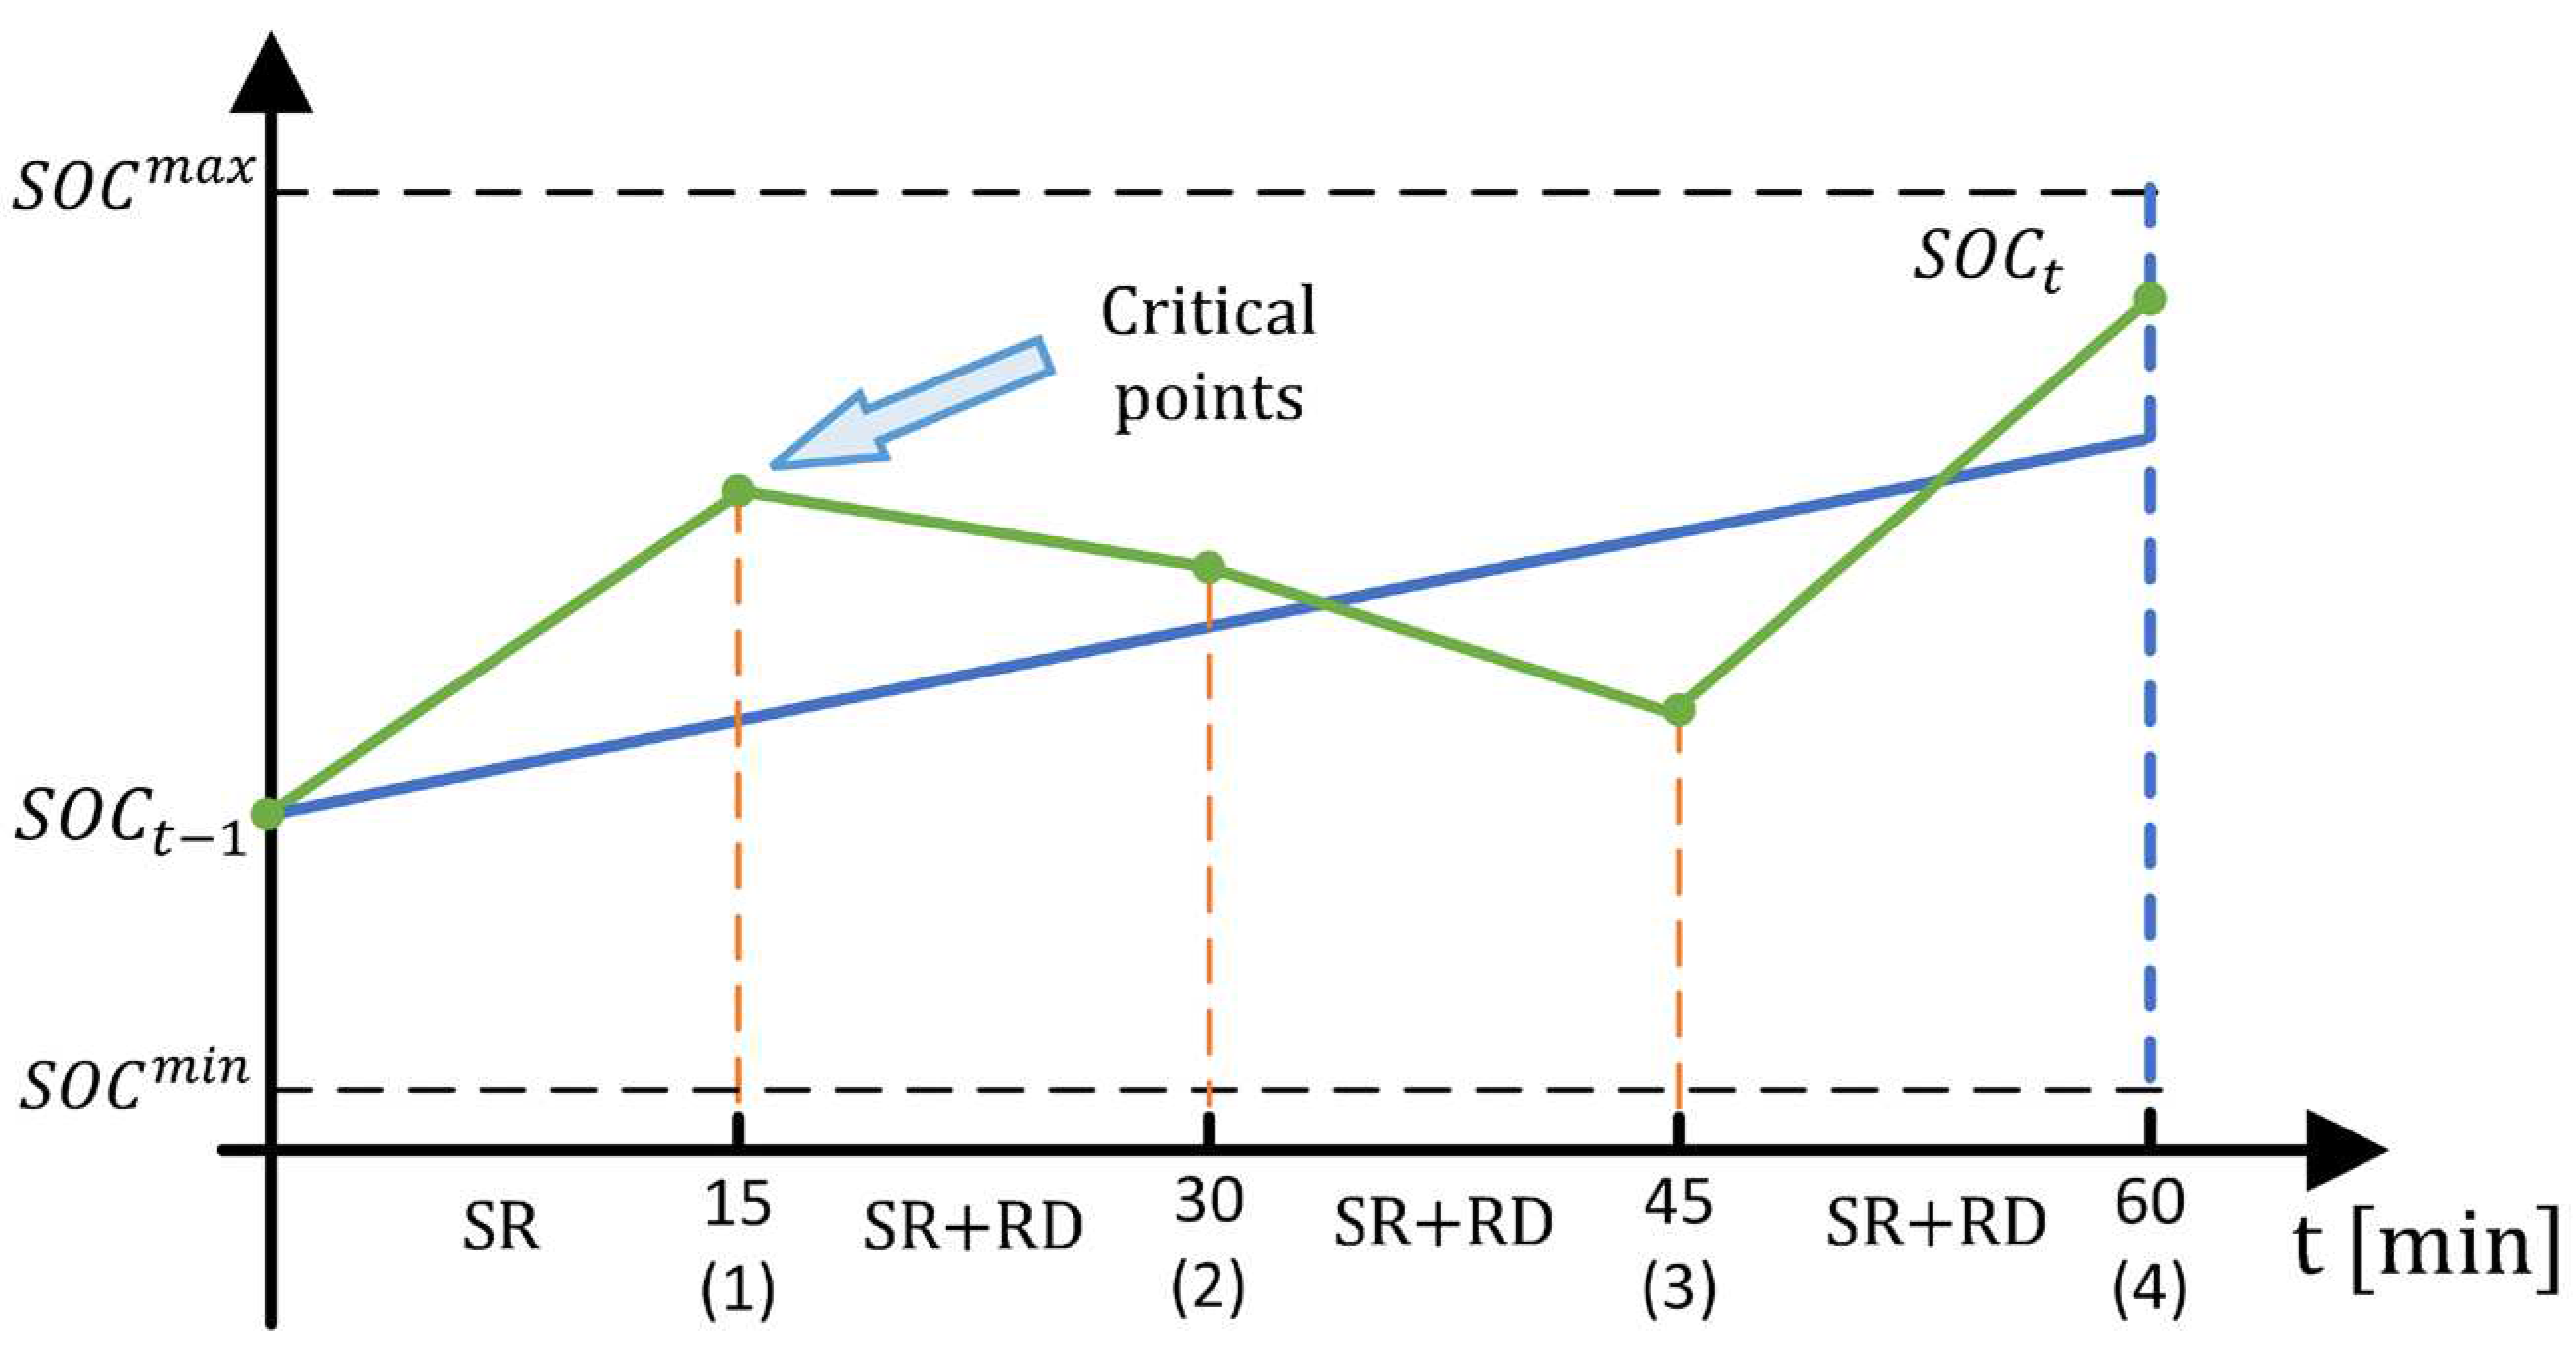
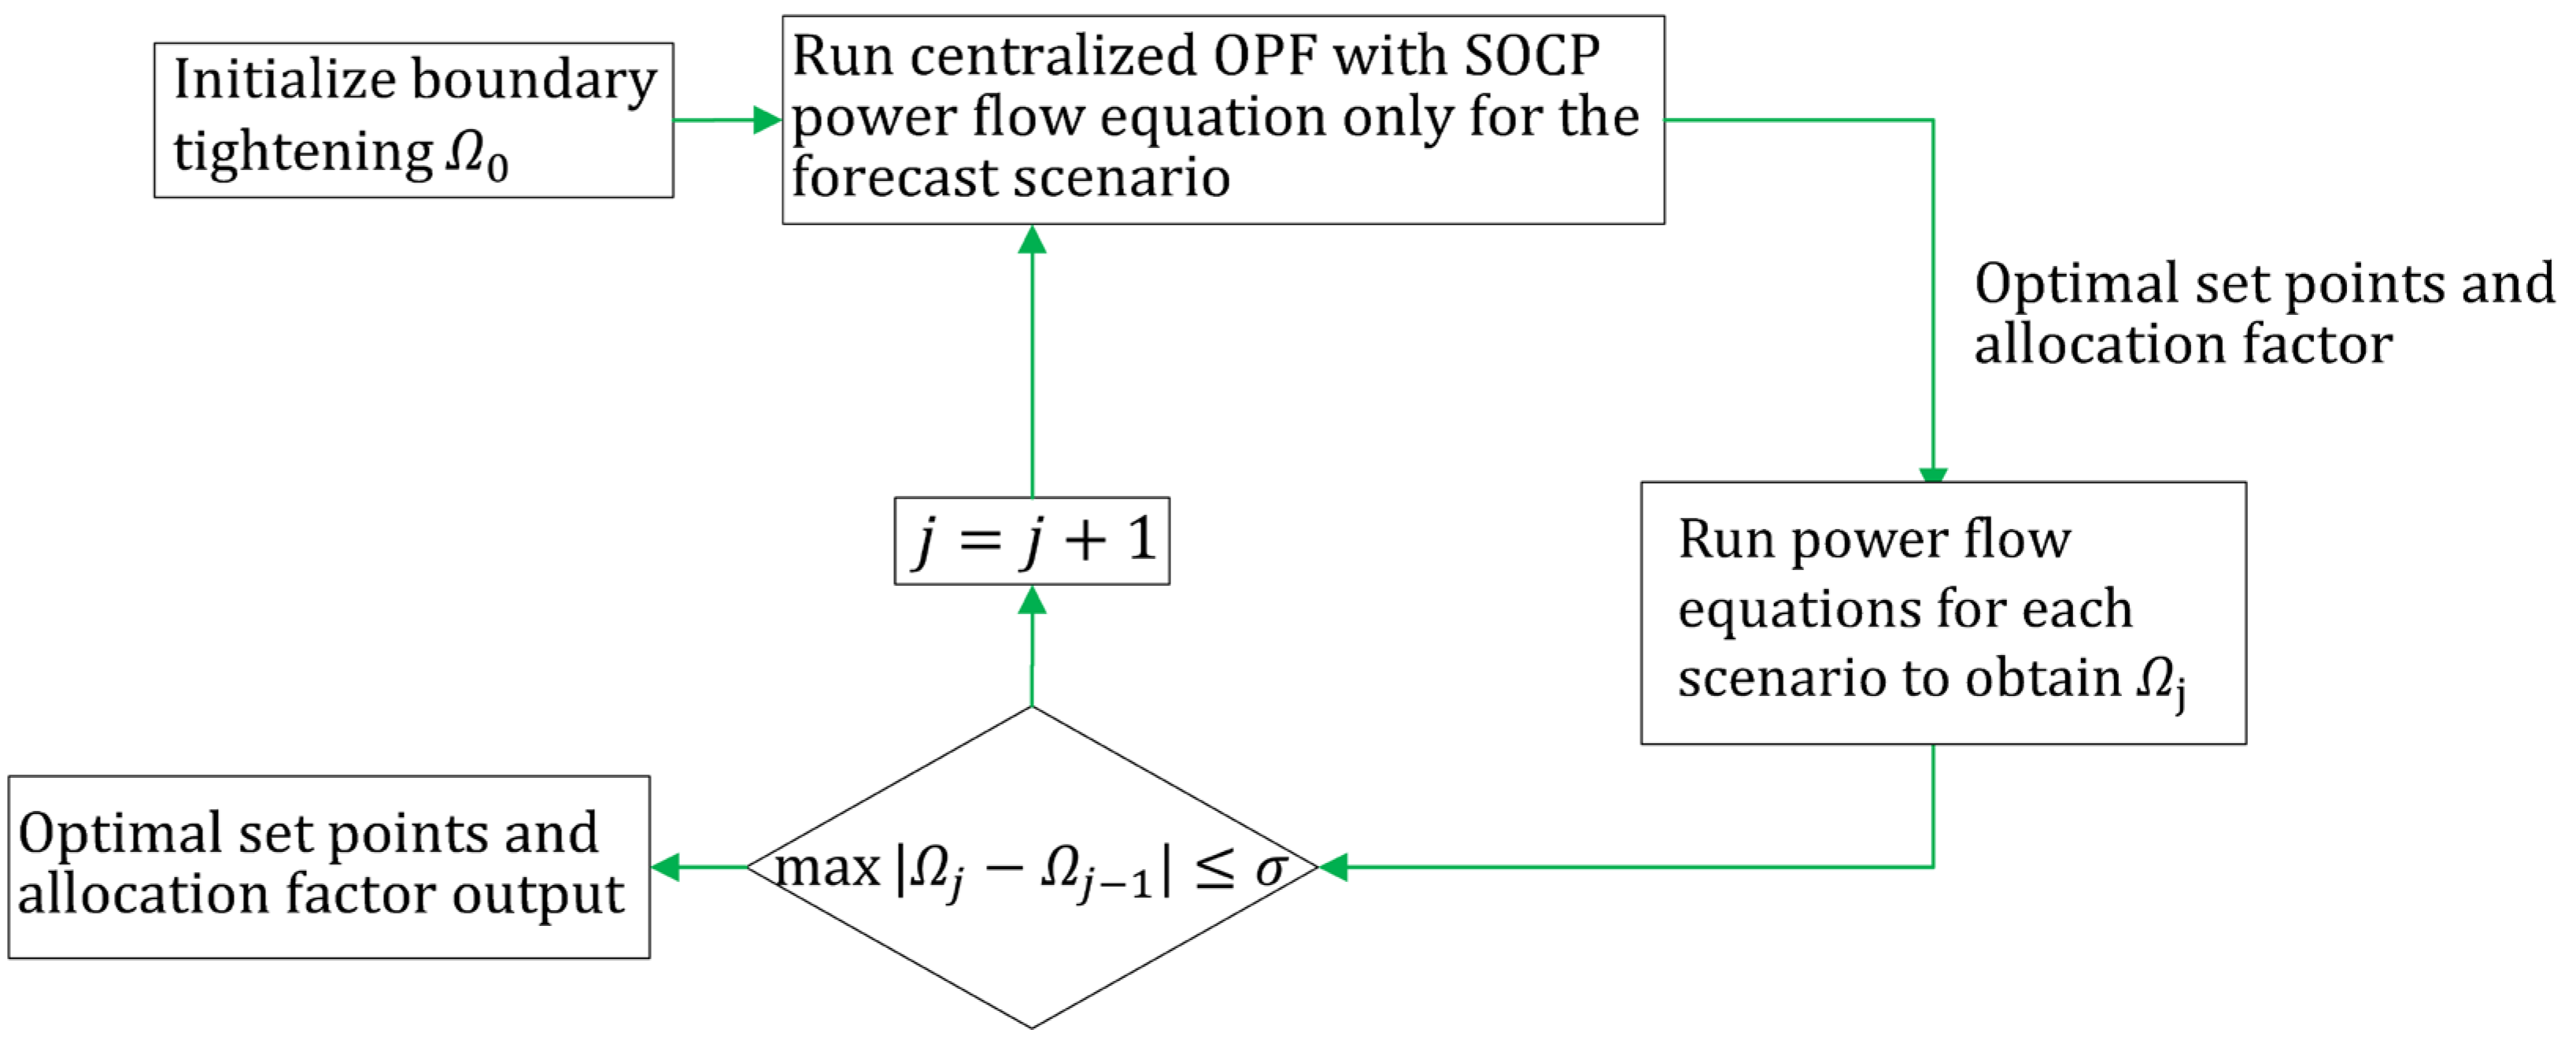
| The paper proposes a risk-based chance-constrained control strategy to optimize the dispatch of energy-constrained ESSs, taking into account the uncertainty associated with estimating the SOC and capacity of the ESSs. The controller coordinates the ESSs to minimize the unscheduled participation of generators and overcome ramp-rate limitations for balancing variability from renewable generation. The paper also introduces a temperature-based dynamic line rating (DLR) approach to integrate ESSs and increase renewable generation. | [106] | |
| The authors introduce an innovative two-stage robust optimization approach that effectively captures the operation of storage devices, accounting for the anticipatory nature of the two-stage setting. The resultant robust counterpart constitutes a mixed-integer trilevel program featuring lower-level binary variables. To tackle the nonconvexity of the problem, the authors suggest employing an exact nested column-and-constraint generation algorithm. | [109] | |
| D-FCAS | This paper proposes a coordinated control strategy for a Virtual Power Plant (VPP) aiming to enhance load frequency control. The VPP coordinates the allocation of energy and regulation signals among battery energy storage systems (BESSs) and heat pump water heaters (HPWHs), determined by distribution coefficients derived through multi-objective optimization. | [110] |
| The paper highlights the importance of demand response in enhancing the operational flexibility of power systems and the advantages of industrial loads in providing such a response. However, the discrete power changes in these loads restrict them from offering valuable ancillary services. To address this constraint, the document suggests techniques that empower these loads to offer regulation or load following with the assistance of an onsite energy storage system. The coordination between industrial loads and energy storage is established through a model predictive control approach. | [111] | |
| Researchers in this paper propose an optimization strategy that includes day-ahead scheduling and frequency regulation service to maximize profits and ensure real-time load-following performance. The paper presents a case study that demonstrates the cost-effectiveness and load-following capability of the proposed method compared to industrial loads equipped with only on-site ESS or passive use of solar energy. | [54] |
Disclaimer/Publisher’s Note: The statements, opinions and data contained in all publications are solely those of the individual author(s) and contributor(s) and not of MDPI and/or the editor(s). MDPI and/or the editor(s) disclaim responsibility for any injury to people or property resulting from any ideas, methods, instructions or products referred to in the content. |
© 2023 by the authors. Licensee MDPI, Basel, Switzerland. This article is an open access article distributed under the terms and conditions of the Creative Commons Attribution (CC BY) license (http://creativecommons.org/licenses/by/4.0/).


