1. Introduction
The human digestive tract commonly hosts a diverse range of microorganisms, including bacteria, fungi, viruses, and parasites, collectively known as the gut microbiota. This microbiota, comprising over 100 billion to 100 trillion microorganisms, plays a crucial role in maintaining the dynamic equilibrium of human health and diseases [
1,
2,
3]. The microorganisms in the gut have a significant impact on the metabolism, immune system, and overall physiology of the human host. Numerous researches have indicated that imbalances in the gastrointestinal microbiome can play a crucial role in the emergence of various ailments, including metabolic syndrome (excessive weight and associated conditions), high blood pressure, and depressive disorders [
4,
5,
6]. Obesity is currently one of the most widespread public health issues globally among chronic diseases. Projections suggest that over 1 billion individuals will face the risk of obesity by 2030 [
7]. Additionally, visceral obesity contributes significantly to chronic conditions like type 2 diabetes, hepatic steatosis, and cardiovascular disease [
8,
9]. Studies in epidemiology have indicated that dietary interventions play a crucial role in combating obesity and its associated illnesses, and can also impact the makeup of the gut microbiome [
10,
11]. According to reports, people with varying eating habits possess distinct microbiomes. Consuming diets rich in sugar and fat can disturb bacterial metabolism and balance, resulting in microbiota dysbiosis, obesity, and metabolic syndrome [
12]. On the other hand, the intake of phytonutrients that are abundant in vitamins, polyphenols, flavonoids, and other compounds can enhance the distribution of lipids and regulate the imbalance of gut ecology in the body. As a result, this can contribute to the prevention and treatment of different metabolic disorders [
13,
14]. Furthermore, alterations in dietary habits can swiftly lead to modifications in the makeup of the intestinal microbiota [
15].
Red cabbage (RC), a vegetable of the Brassica genus, is a readily available consumer dietary product that is rich in purported health-promoting bio-actives [
16]. RC has a higher level of polyphenols and antioxidant activity compared to white cabbage [
17]. The majority of polyphenols do not get absorbed in the small intestine, instead, they go into the colon where they alter the makeup of the gut microbiota. This alteration promotes the growth of helpful bacteria while suppressing harmful bacteria, ultimately enhancing the availability of polyphenols [
18]. Other well-known bioactive compounds in RC, such as glucosinolates (GSLs) that are stable in the natural matrix but readily hydrolyzed by endogenous mustard enzymes (EC 3.2.1.147), activate mechanical actions when consumed, to produce compounds such as isothiocyanates (ITC) and indole [
19]. According to previous reports, indole derived from GSL plays a role in preserving the natural defense of the human gut, activating aryl hydrocarbon and pregnane X receptors to exert anti-inflammatory effects, and consequently impacting the functioning of the immune system [
20,
21]. The positive impacts of these effects on intestinal health are substantial, and they hold immense promise for treating inflammatory bowel disease and neurodegenerative disorders [
22,
23]. We and others also reported that feeding RC or RC extract contains the bio-actives in rodent models, resulting in lowering blood lipids, cholesterol, cardiovascular disease risk factors, and promoting liver health [
24]. We also reported that indole-3-carbinol, a dietary digestive derivative of GSL, can modulate the gut microbiome and is associated with attenuation of tumor xenograft growth [
25]. Nevertheless, even though the health benefits of RC are well-known, there is still uncertainty regarding its influence on the gut microbiome as a dietary component and its potential impact on overall well-being.
We hypothesized that consumption of RC can modulate the gut microbiome and provide a protective effect on health. The present investigation aims to expand our prior research on the impact of RC on health to clarify: 1) if RC intake can influence the gut microbiome and, if it does, what modifications occur; 2) if alterations in the gut microbiome are linked to the reduction of disease risk factors. We utilized a mice model of obesity induced by high-fat intake and implemented a factorial design of 2 × 2 (level of fat, with or without RC). We used 16S rRNA sequencing analysis, and ecological network analysis to identify specific genera that cause alterations in gut microbiota structure and microbial symbiosis patterns. AI (Random Forest) assisted algorithm was used to elucidate the relationship between microbiome changes and obesity-related risk factors to address the questions raised. The findings of our research offer fresh mechanistic proof that RC has the potential to decrease the likelihood of metabolic disorders, like obesity, through the regulation of the gut microbiota.
4. Discussion
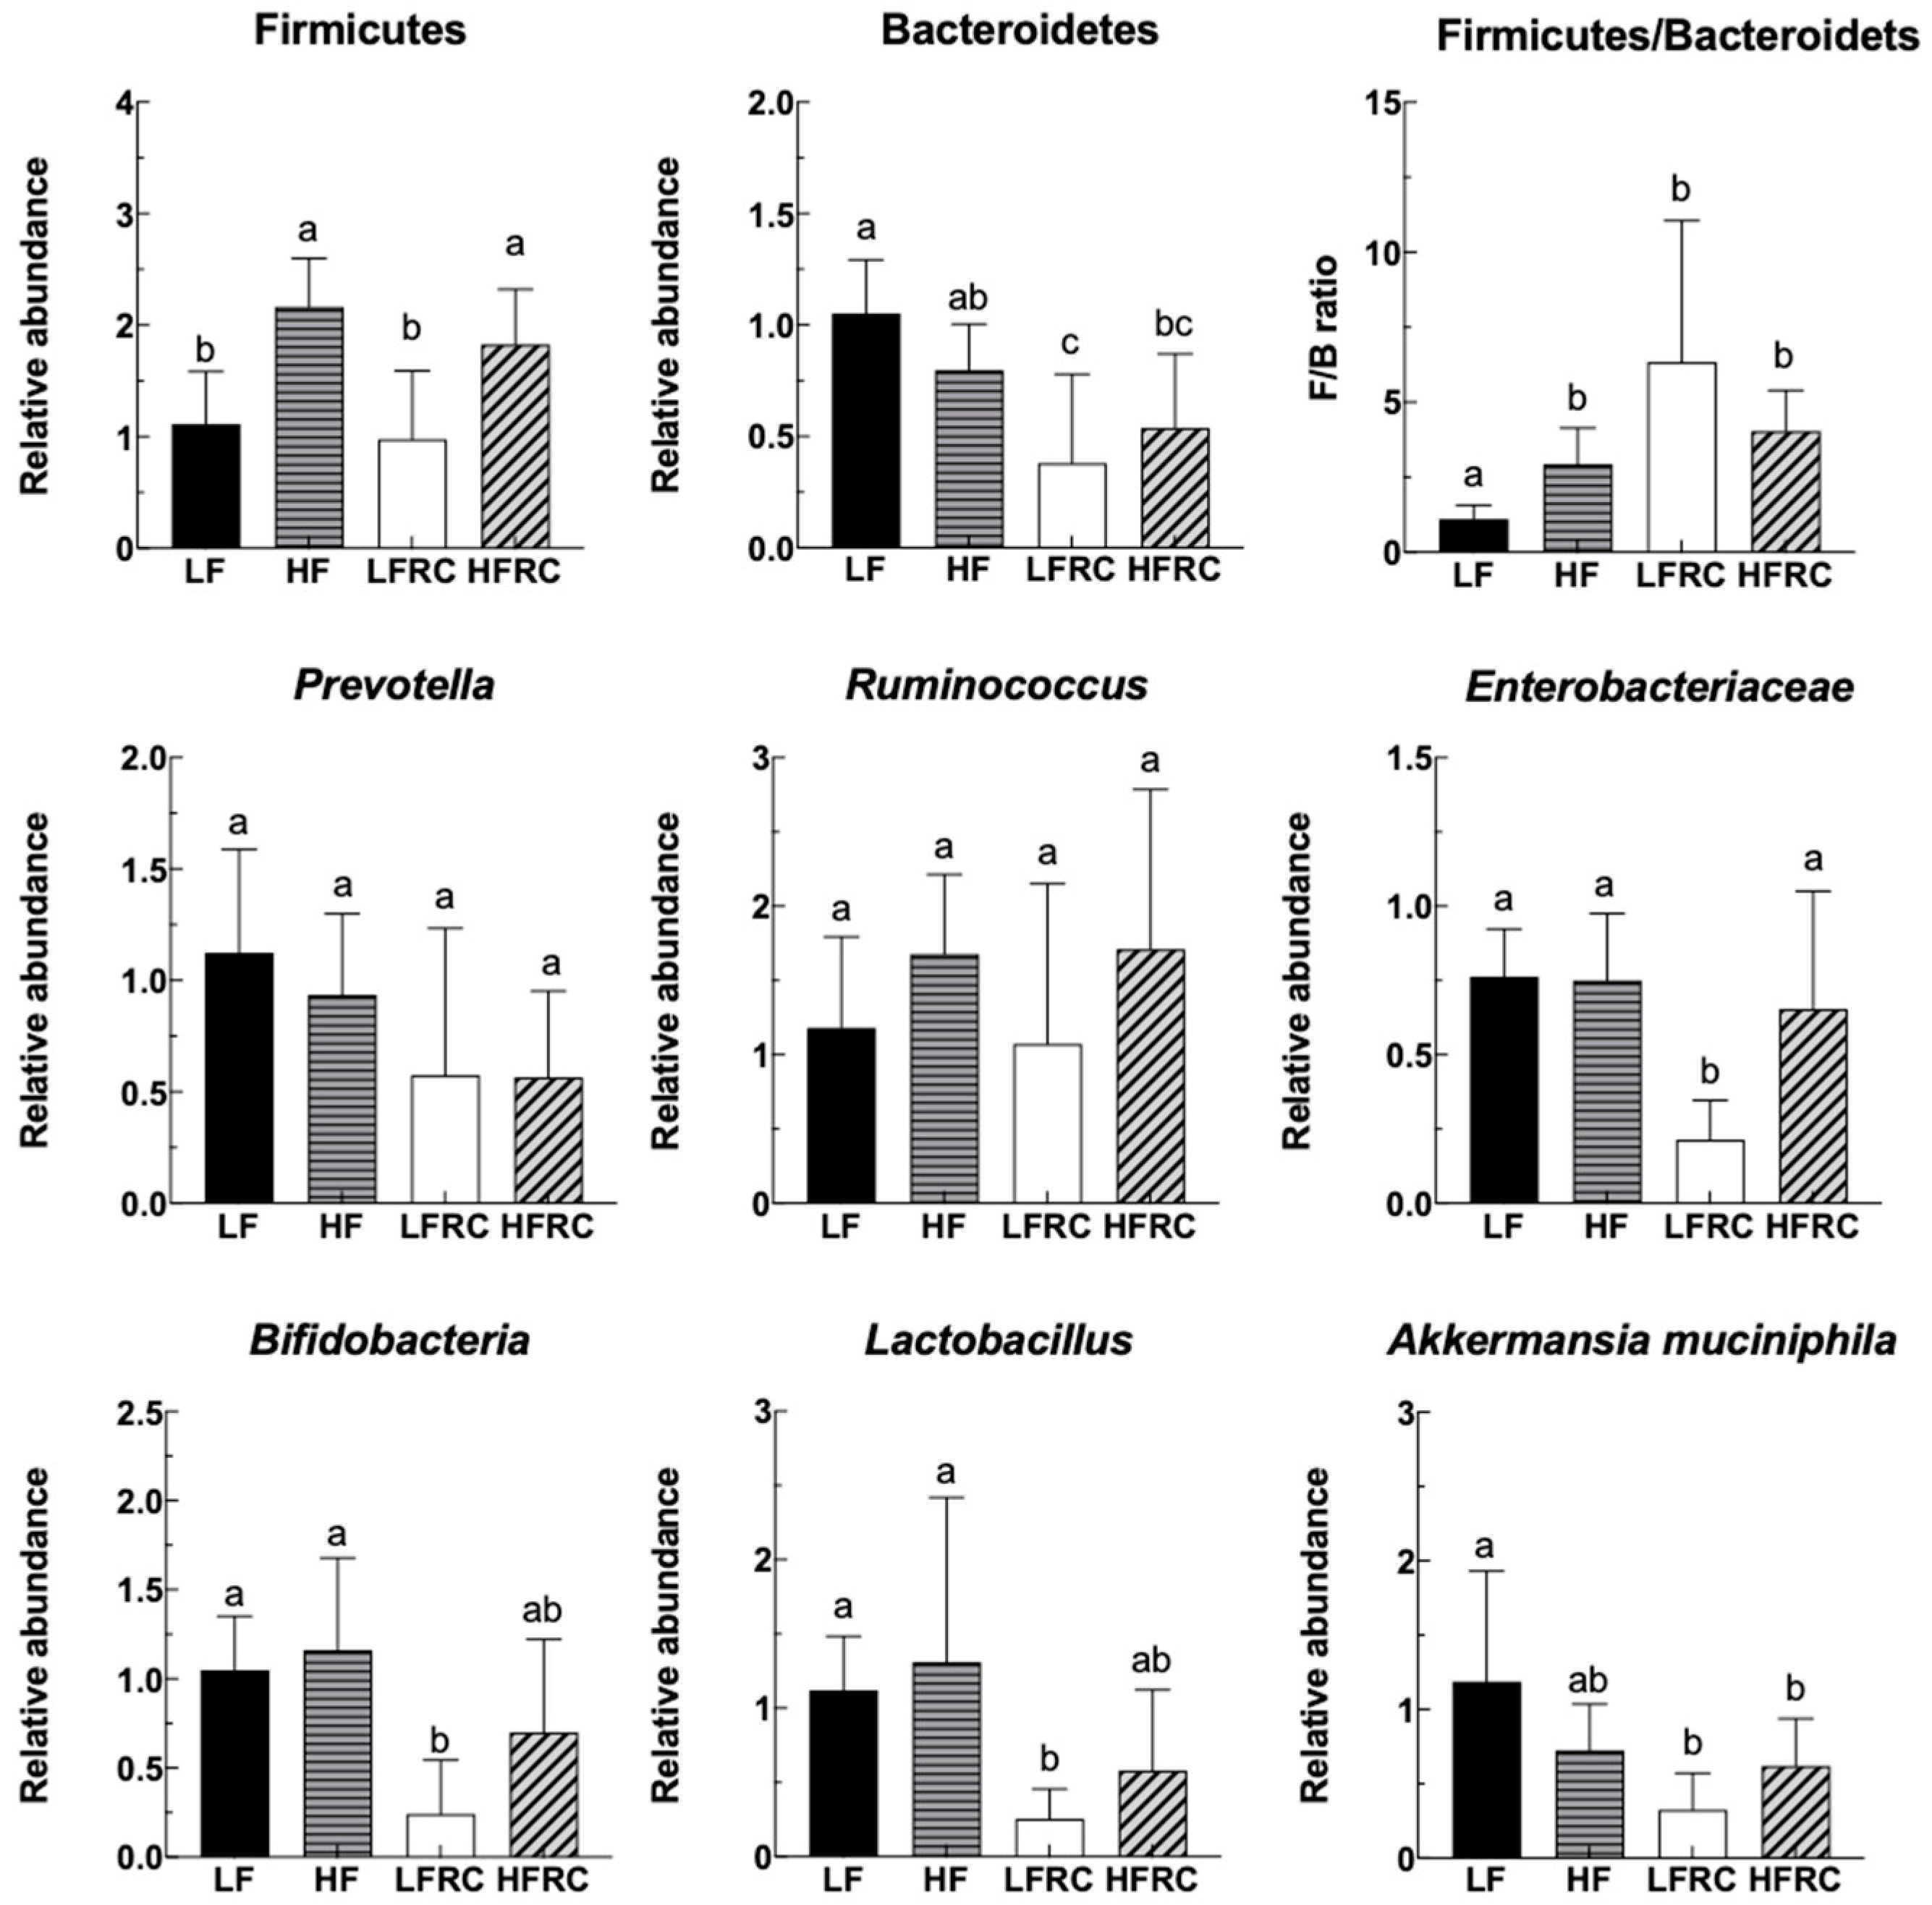
In the current research, various new findings were discovered regarding the consumption of red cabbage and its impact on the gut microbiome in a rodent model. Firstly, we found that dominant bacteria in the mouse feces responded rapidly to diet change 24 hours after the introduction of experimental diets, similar to previous literature examining responses of the gut microbiome in humans [
15]. These results support the utility of the mouse model to emulate human responses toward a short-term dietary intervention. Interestingly, short-term supplements of RC caused alterations in fecal bacteria in the LF matrix but not HF diet. The relative abundance of important genera, including
Bifidobacteria,
Lactobacillus, and
Akkermansia muciniphila, was decreased in the feces of mice supplemented with RC in the LF diet matrix, however, these alterations in fecal microbiota were not found in the cecal microbiota of mice fed 8-weeks red cabbage.
Bifidobacteria and
Lactobacillus are common probiotic strains that are enriched by dietary sources such as fruits and vegetables [
32,
33,
34]. The bacterium
A. muciniphila has been known to reduce the risk of obesity by regulating metabolism and energy hemostasis. Moreover, the
Enterobacteriaceae, which contains many familiar pathogens, was also found to be reduced in the LFRC group. It is unclear how the above short-term changes of gut microbiota induced by RC consumption occurred. There are many phytochemicals, such as glucosinolates, in the RC. We have shown previously that glucosinolated-derived compounds can inhibit bacterial growth. The presence of those compounds may be sufficient to prevent specific bacterial growth. Alternatively, other bacteria may have been stimulated, therefore altering the bacterial profile in feces. The lack of effect in HF may be explained by the presence of fat which may serve as the dominant factor in maintaining the bacterial profile and the presence of phytochemicals may not be sufficient to alter that. Further studies are necessary to test these hypotheses.
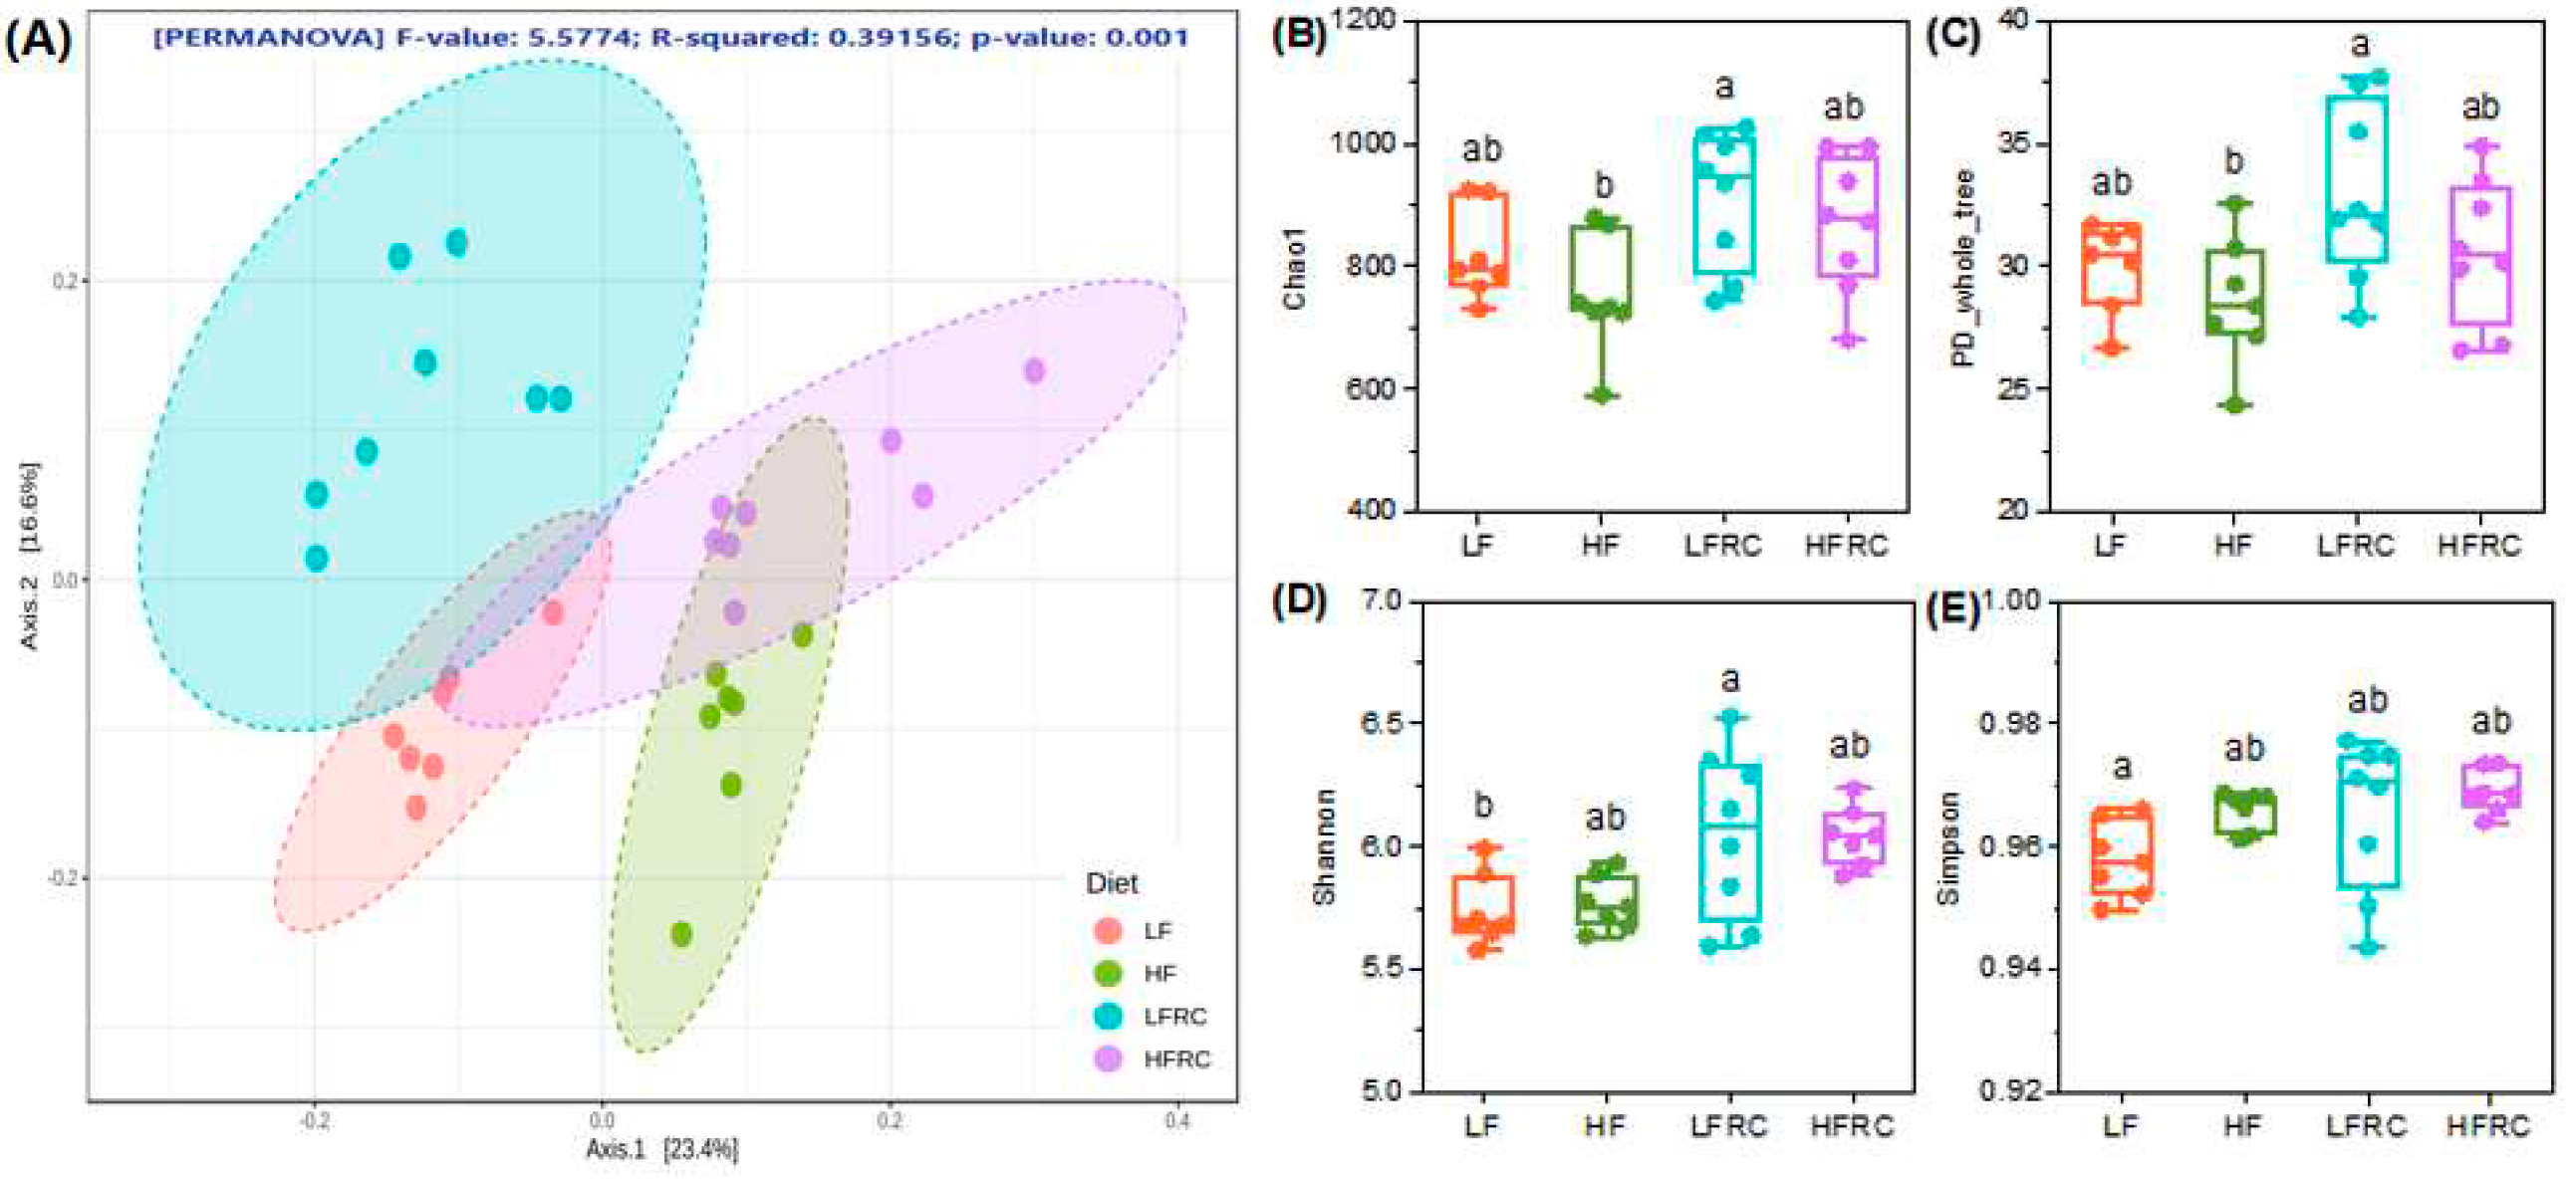
The second interesting observation is the relatively muted effect of RC on the microbiome diversities in the cecal samples, i.e., longer-term exposure as compared to short-term analysis. The principal component analysis (PCoA) visualized significant differences in cecal microbial diversity between the LF and HF groups, while RC consumption resulted in an overlap between the LFRC and HFRC groups, suggesting that RC reduced the differences in microbial community between LF and HF groups. However, we found that RC caused only a slight though not significant increase in microbial species richness and evenness. Hence, the general profiles of the gut microbiome were not dramatically affected by supplementation with RC as seen in the short-term analysis. It would appear that the animal’s microbiome adapted from the initial short-term changes after 8 weeks on the RC diet.
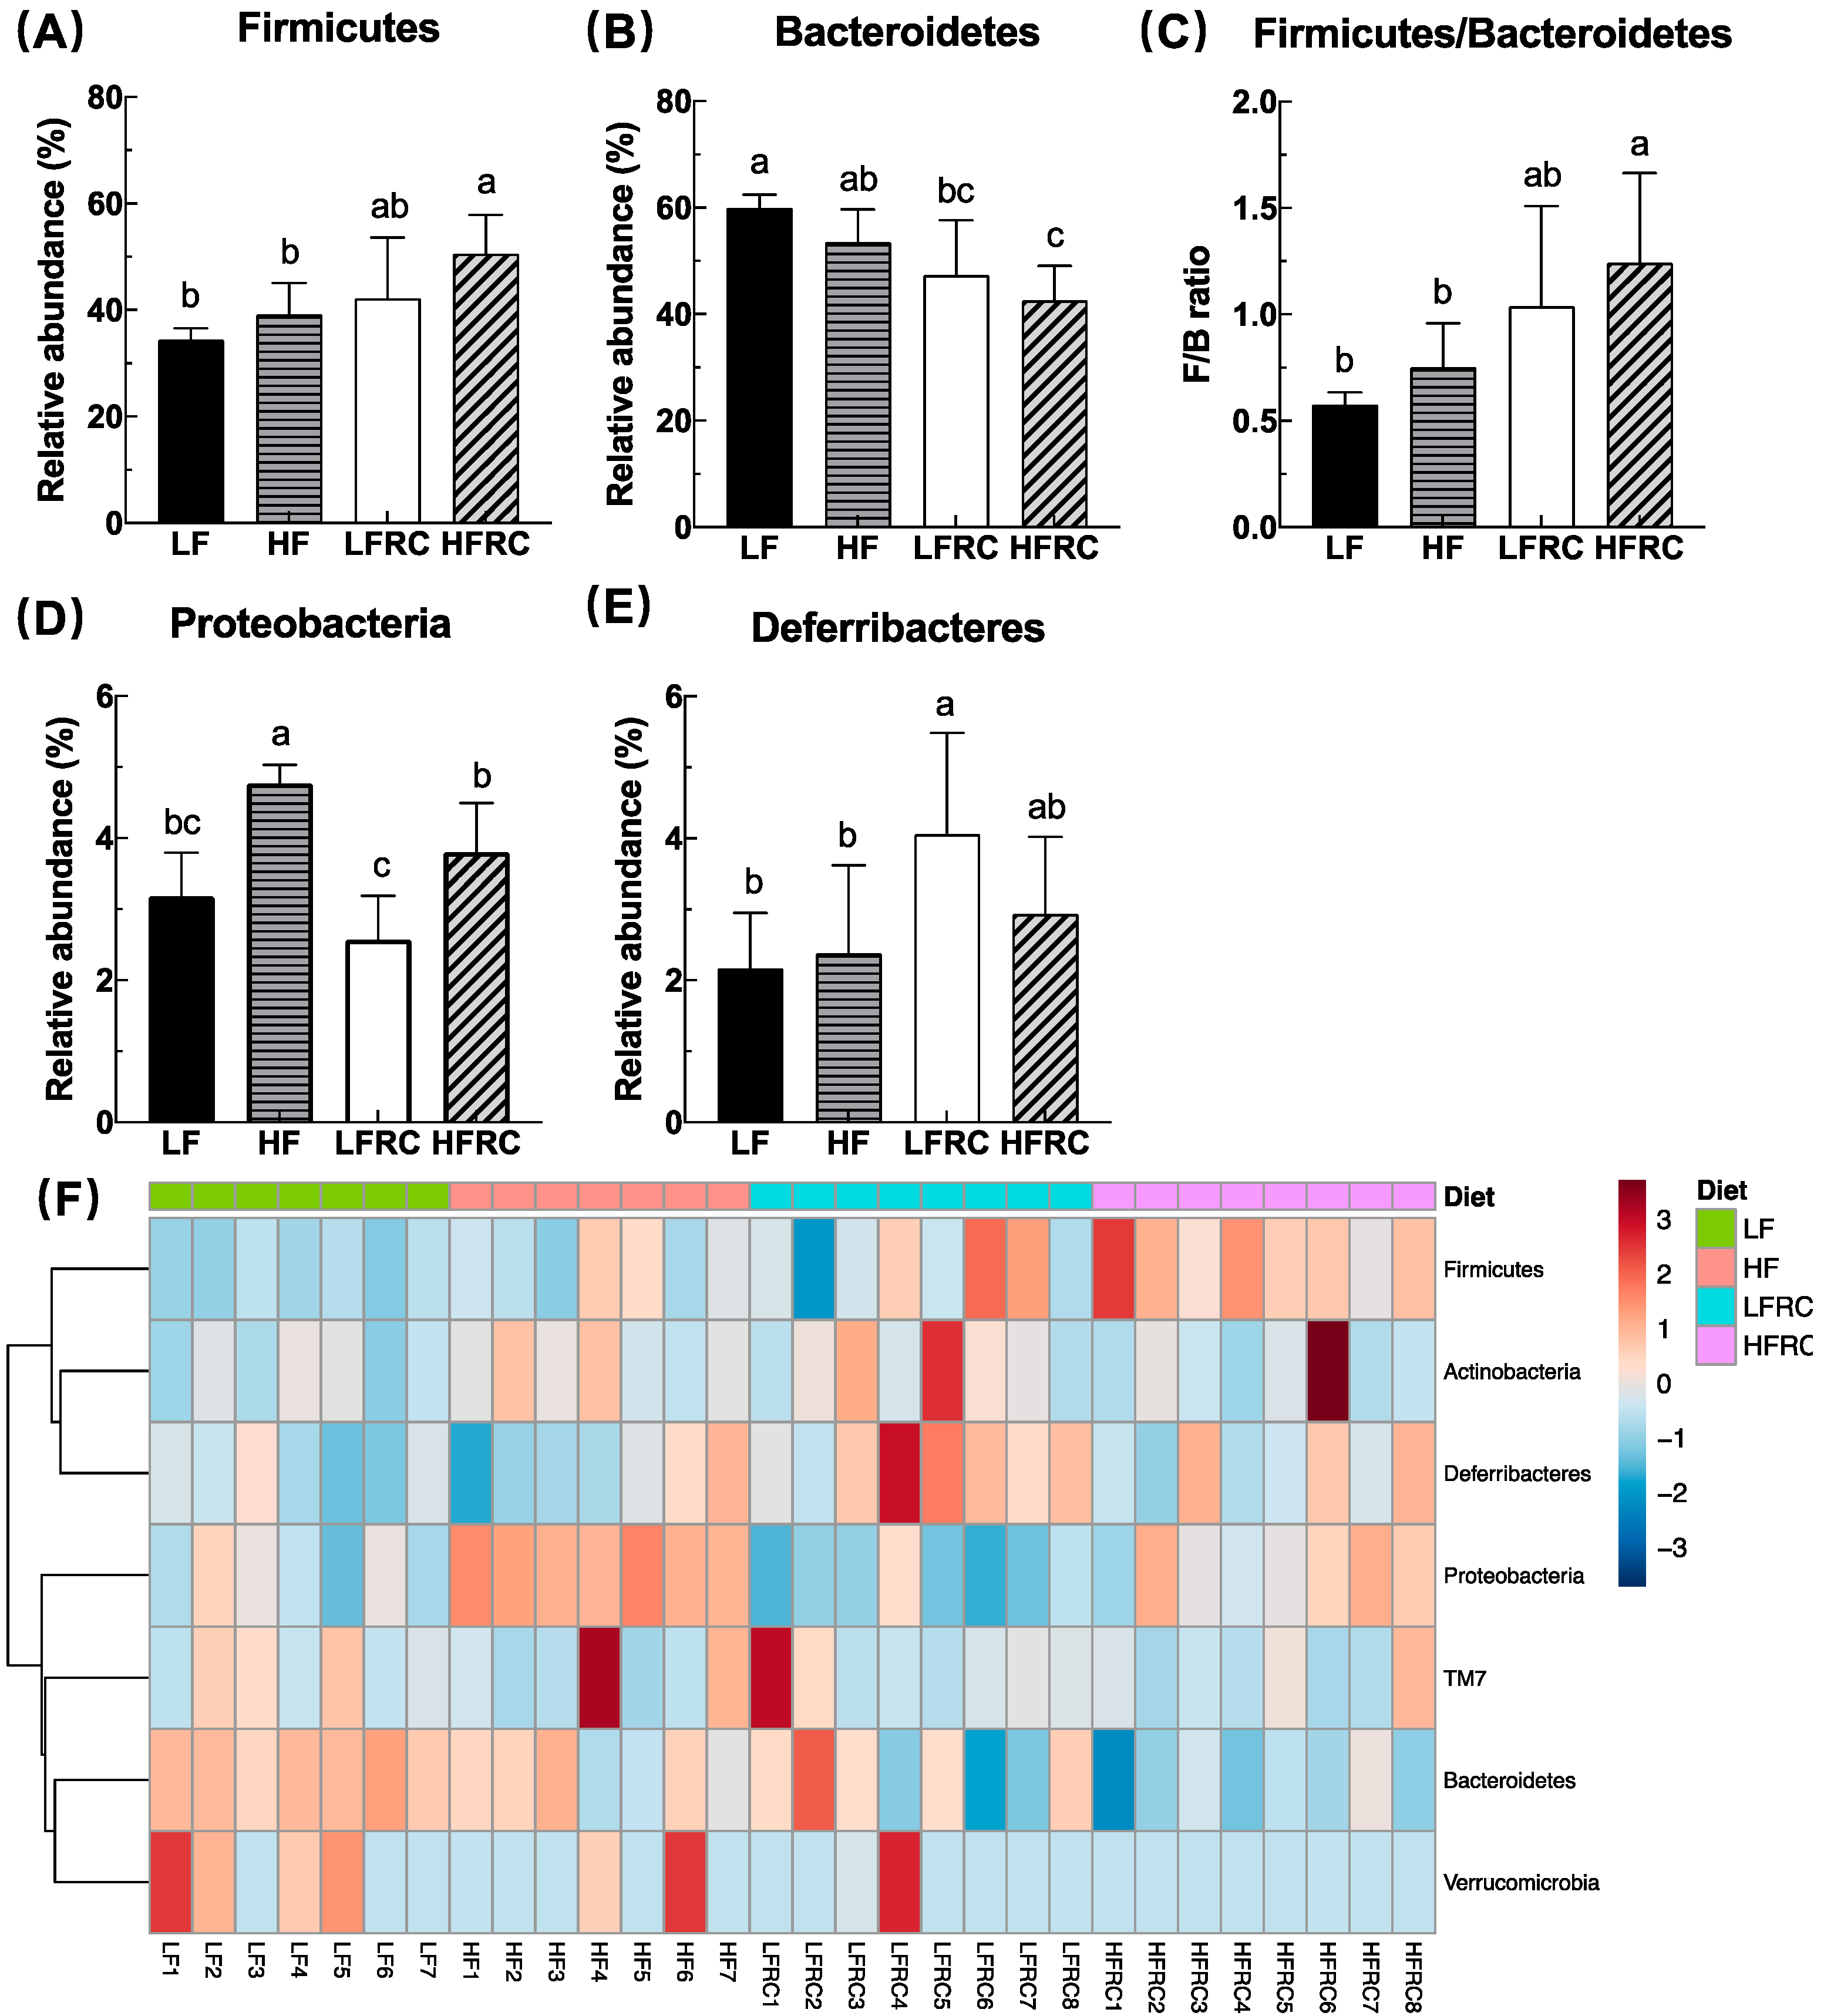
Thirdly, at the phylum level, the effect of RC on the composition of cecal microbiota in mice was slightly different from that of fecal microbiota in mice following the 24-hour meal. In addition to the increased F/B ratio, the RC consumption resulted in a significant suppression of HF-diet-induced increase in Proteobacteria. It is well known that Proteobacteria is the phylum most affected by diets rich in fat, sugar, and animal protein, and is associated with the metabolic and inflammatory state of the body [
35,
36]. Moreover, specific bacterial families, such as
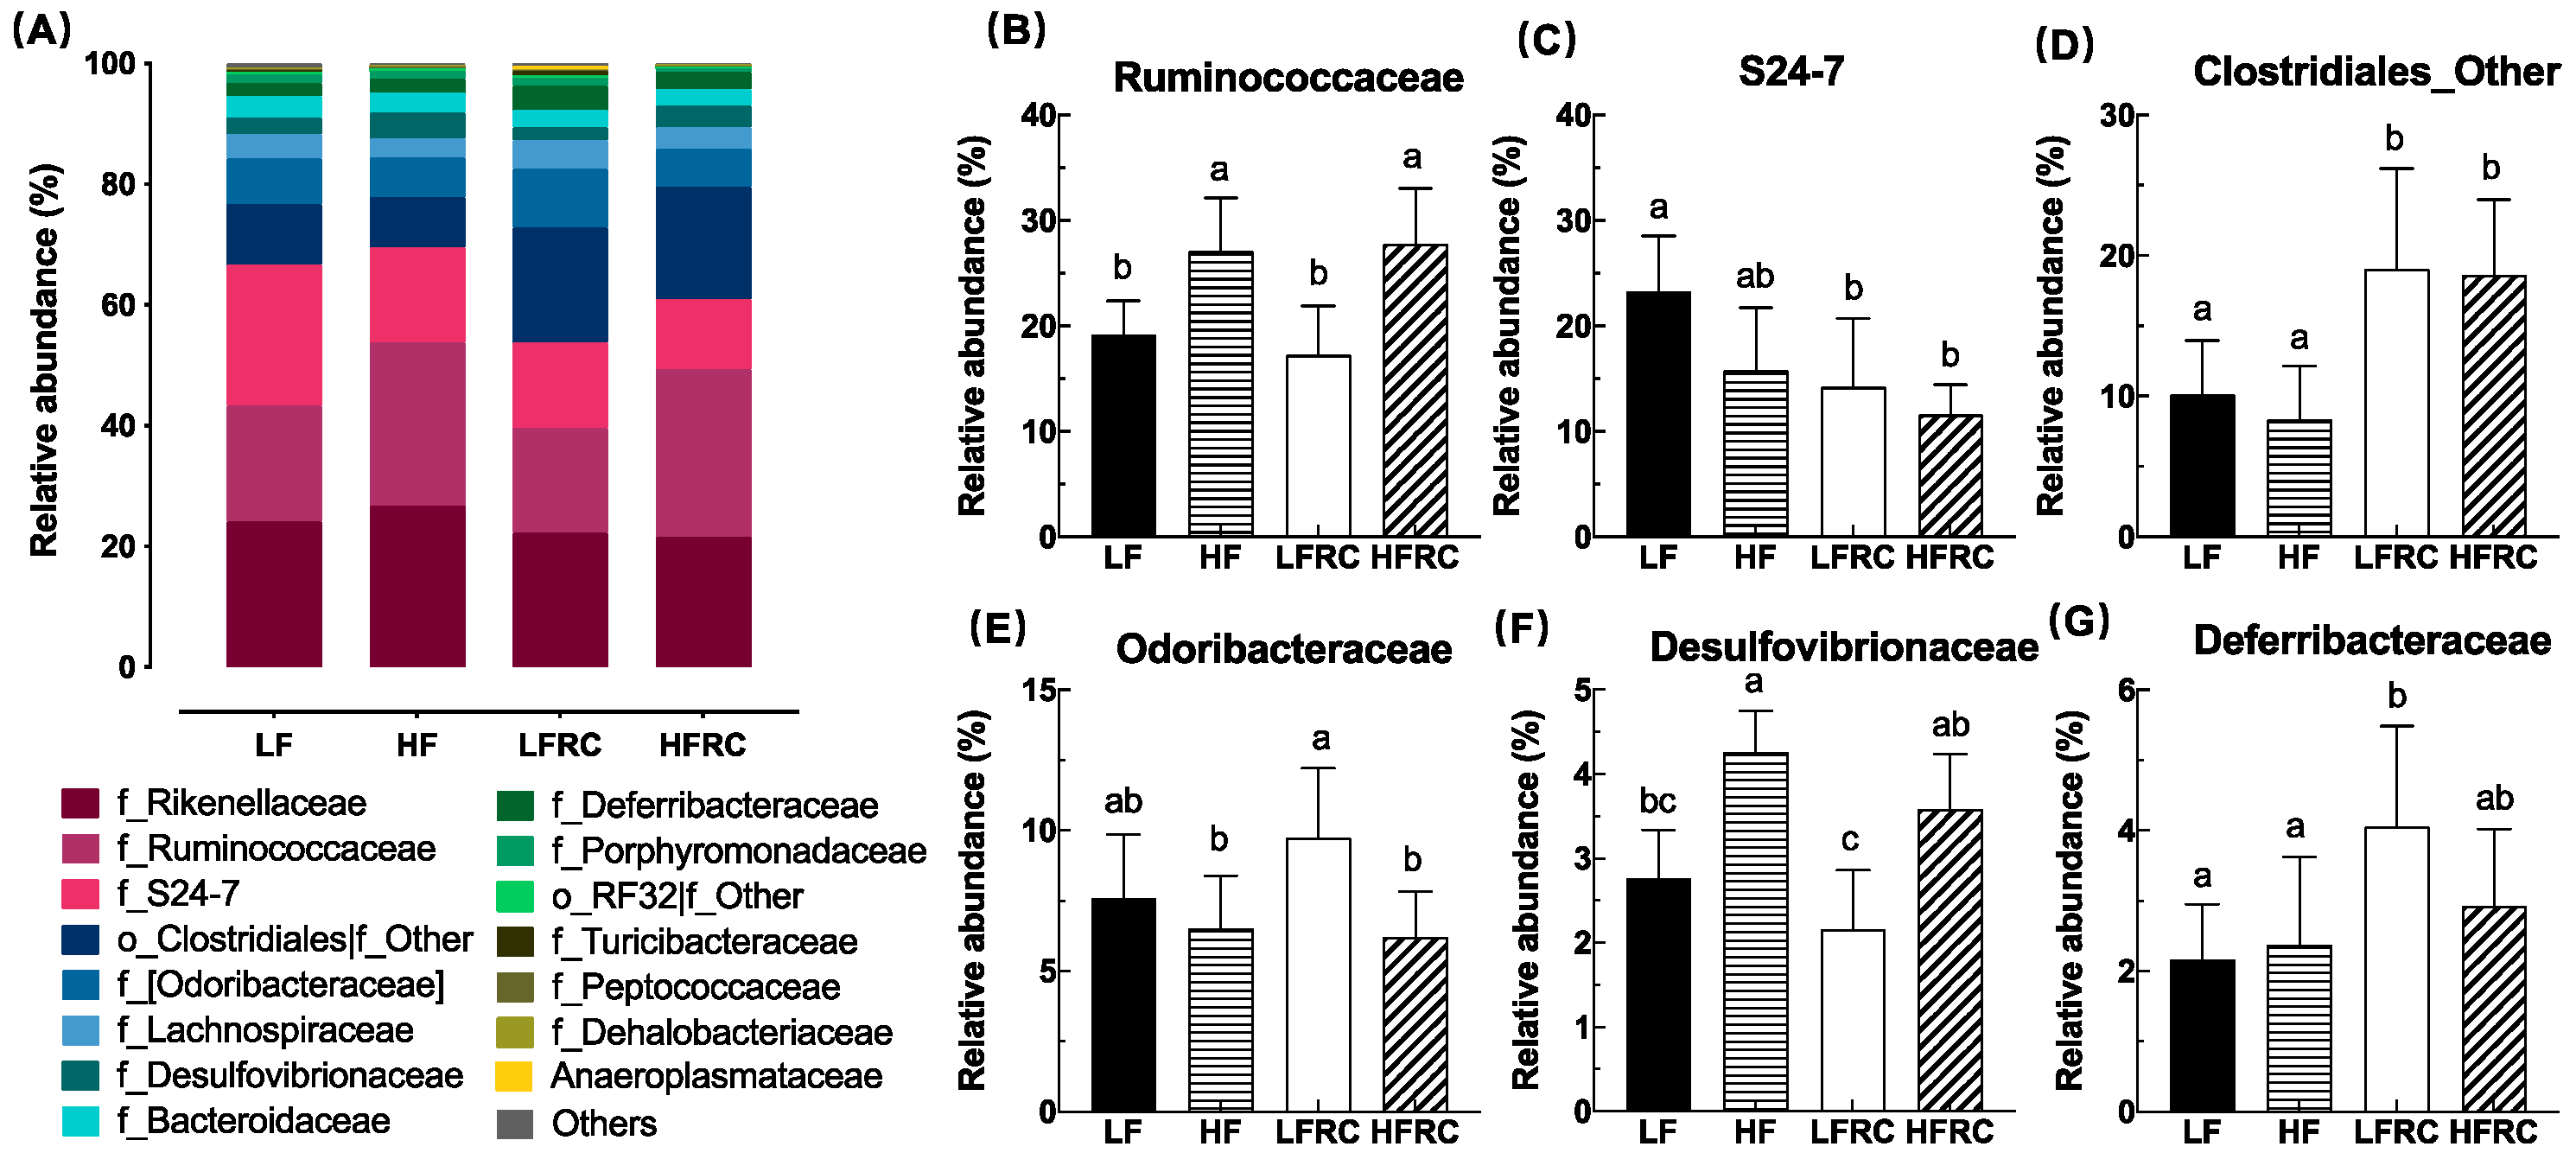
S24-7, an unclassified family in
Clostridiates and
Deferribacteraceae, were affected by RC both in the LF diet and HF diet, further indicating the regulatory role of RC on the gut microbiota. However, it is worth noting that the effect of RC on microbial composition at the phylum level seems to be related to the dietary matrices. For instance, the increase of Firmicutes and the decrease of Bacteroidetes by RC were significant in the HF matrix but not the LF matrix. Thus, the effect of food on gut microbial composition is complex and may be influenced by the interactions of other dietary elements ingested together.
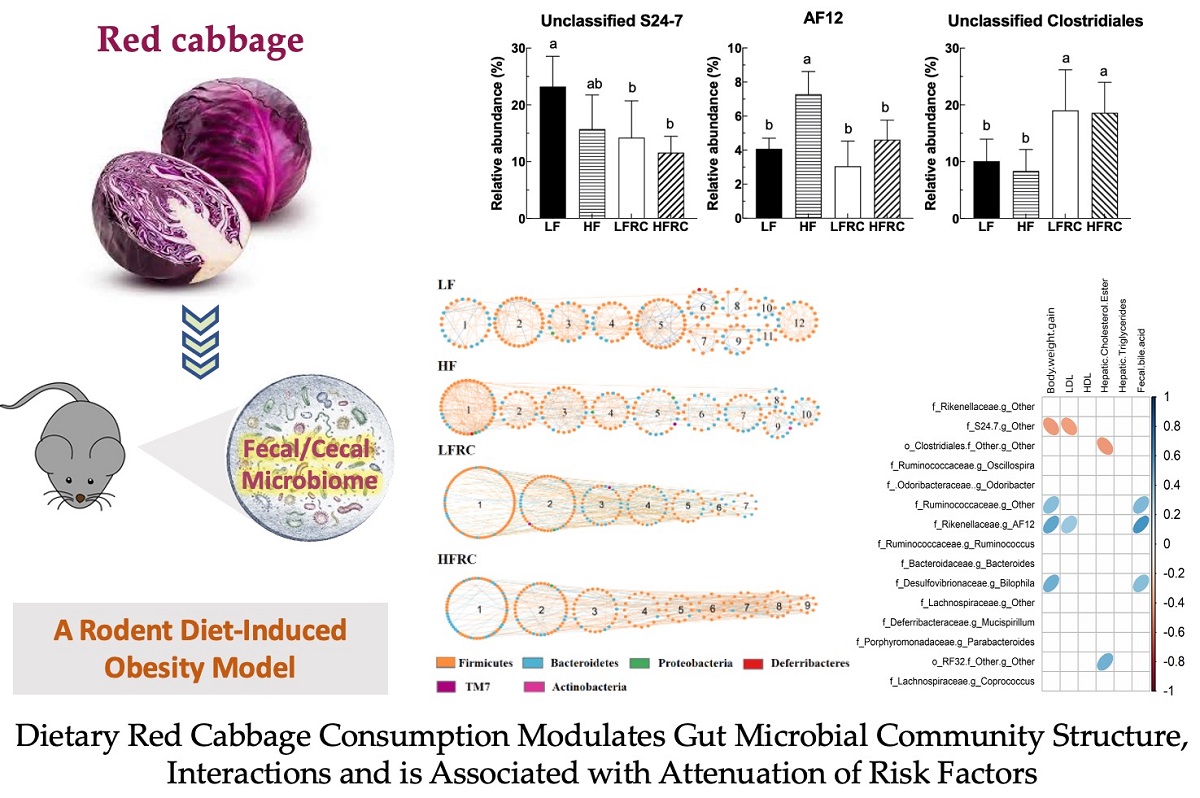
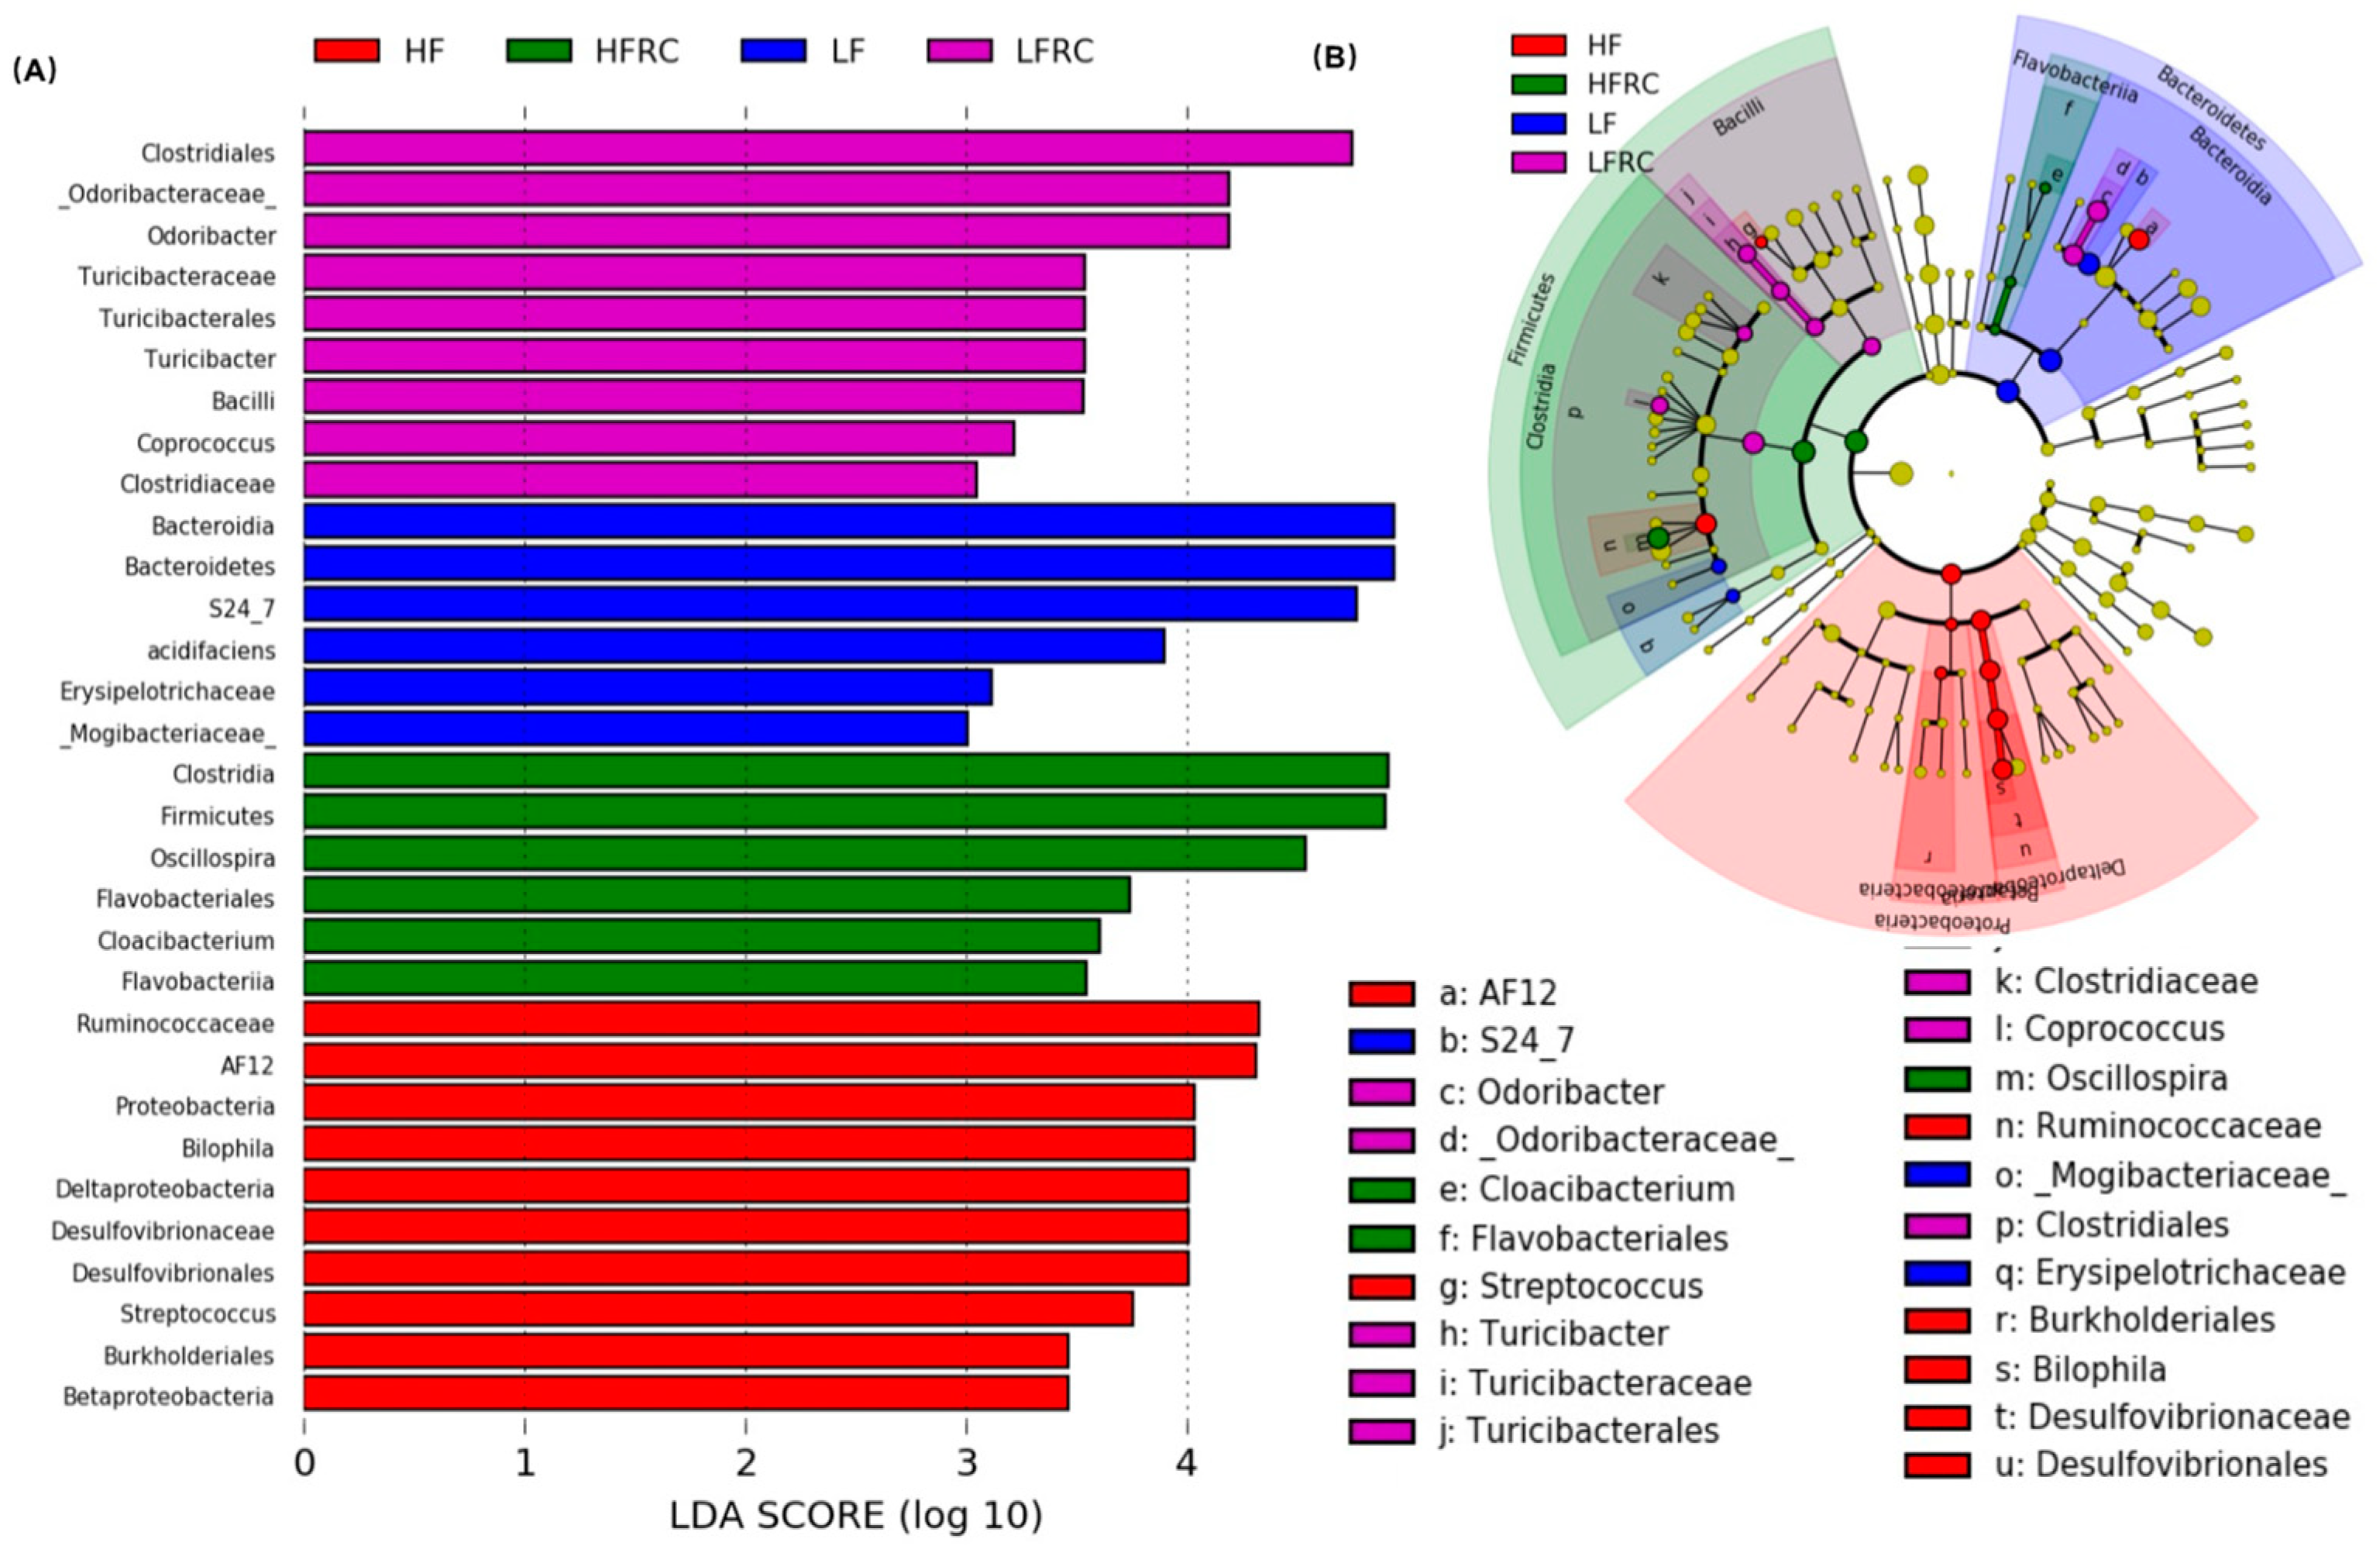
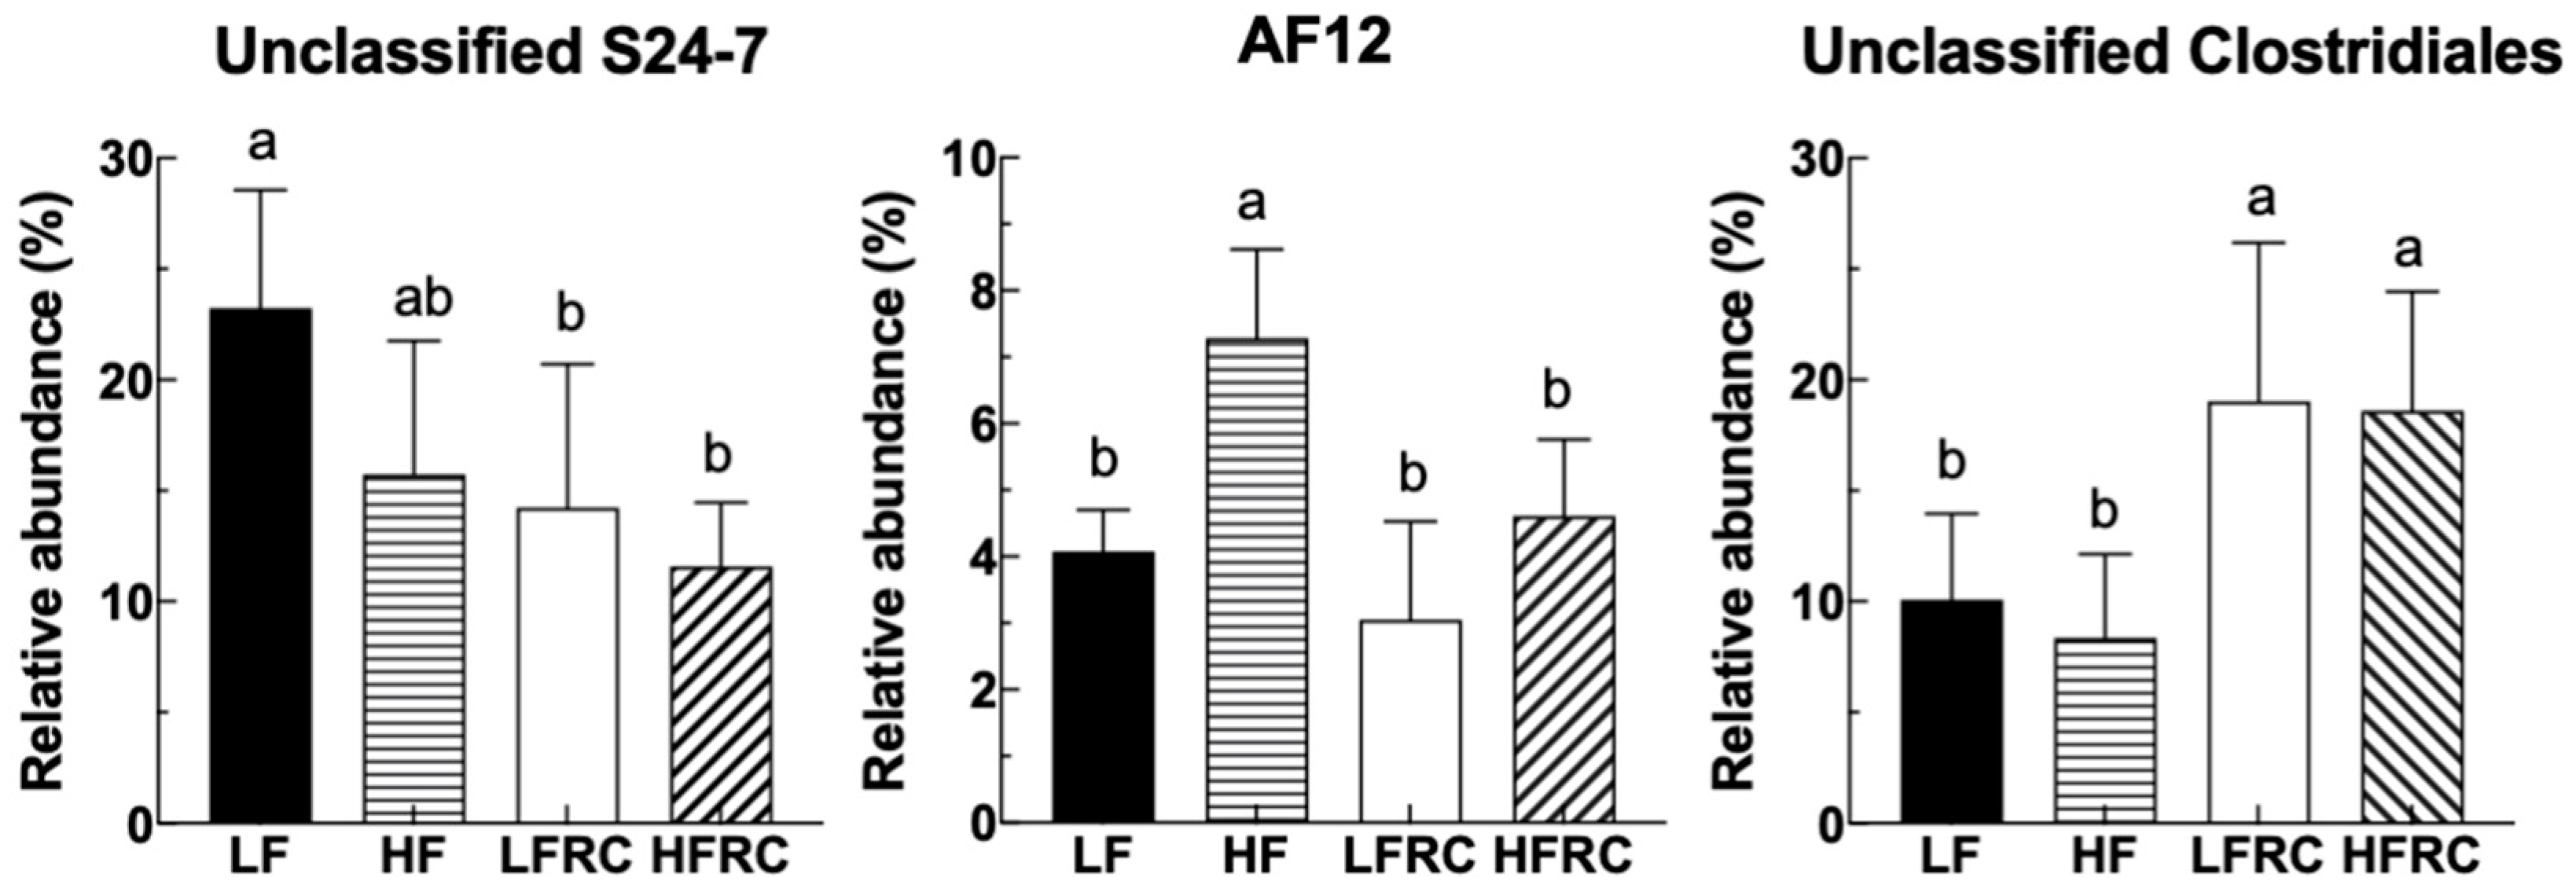
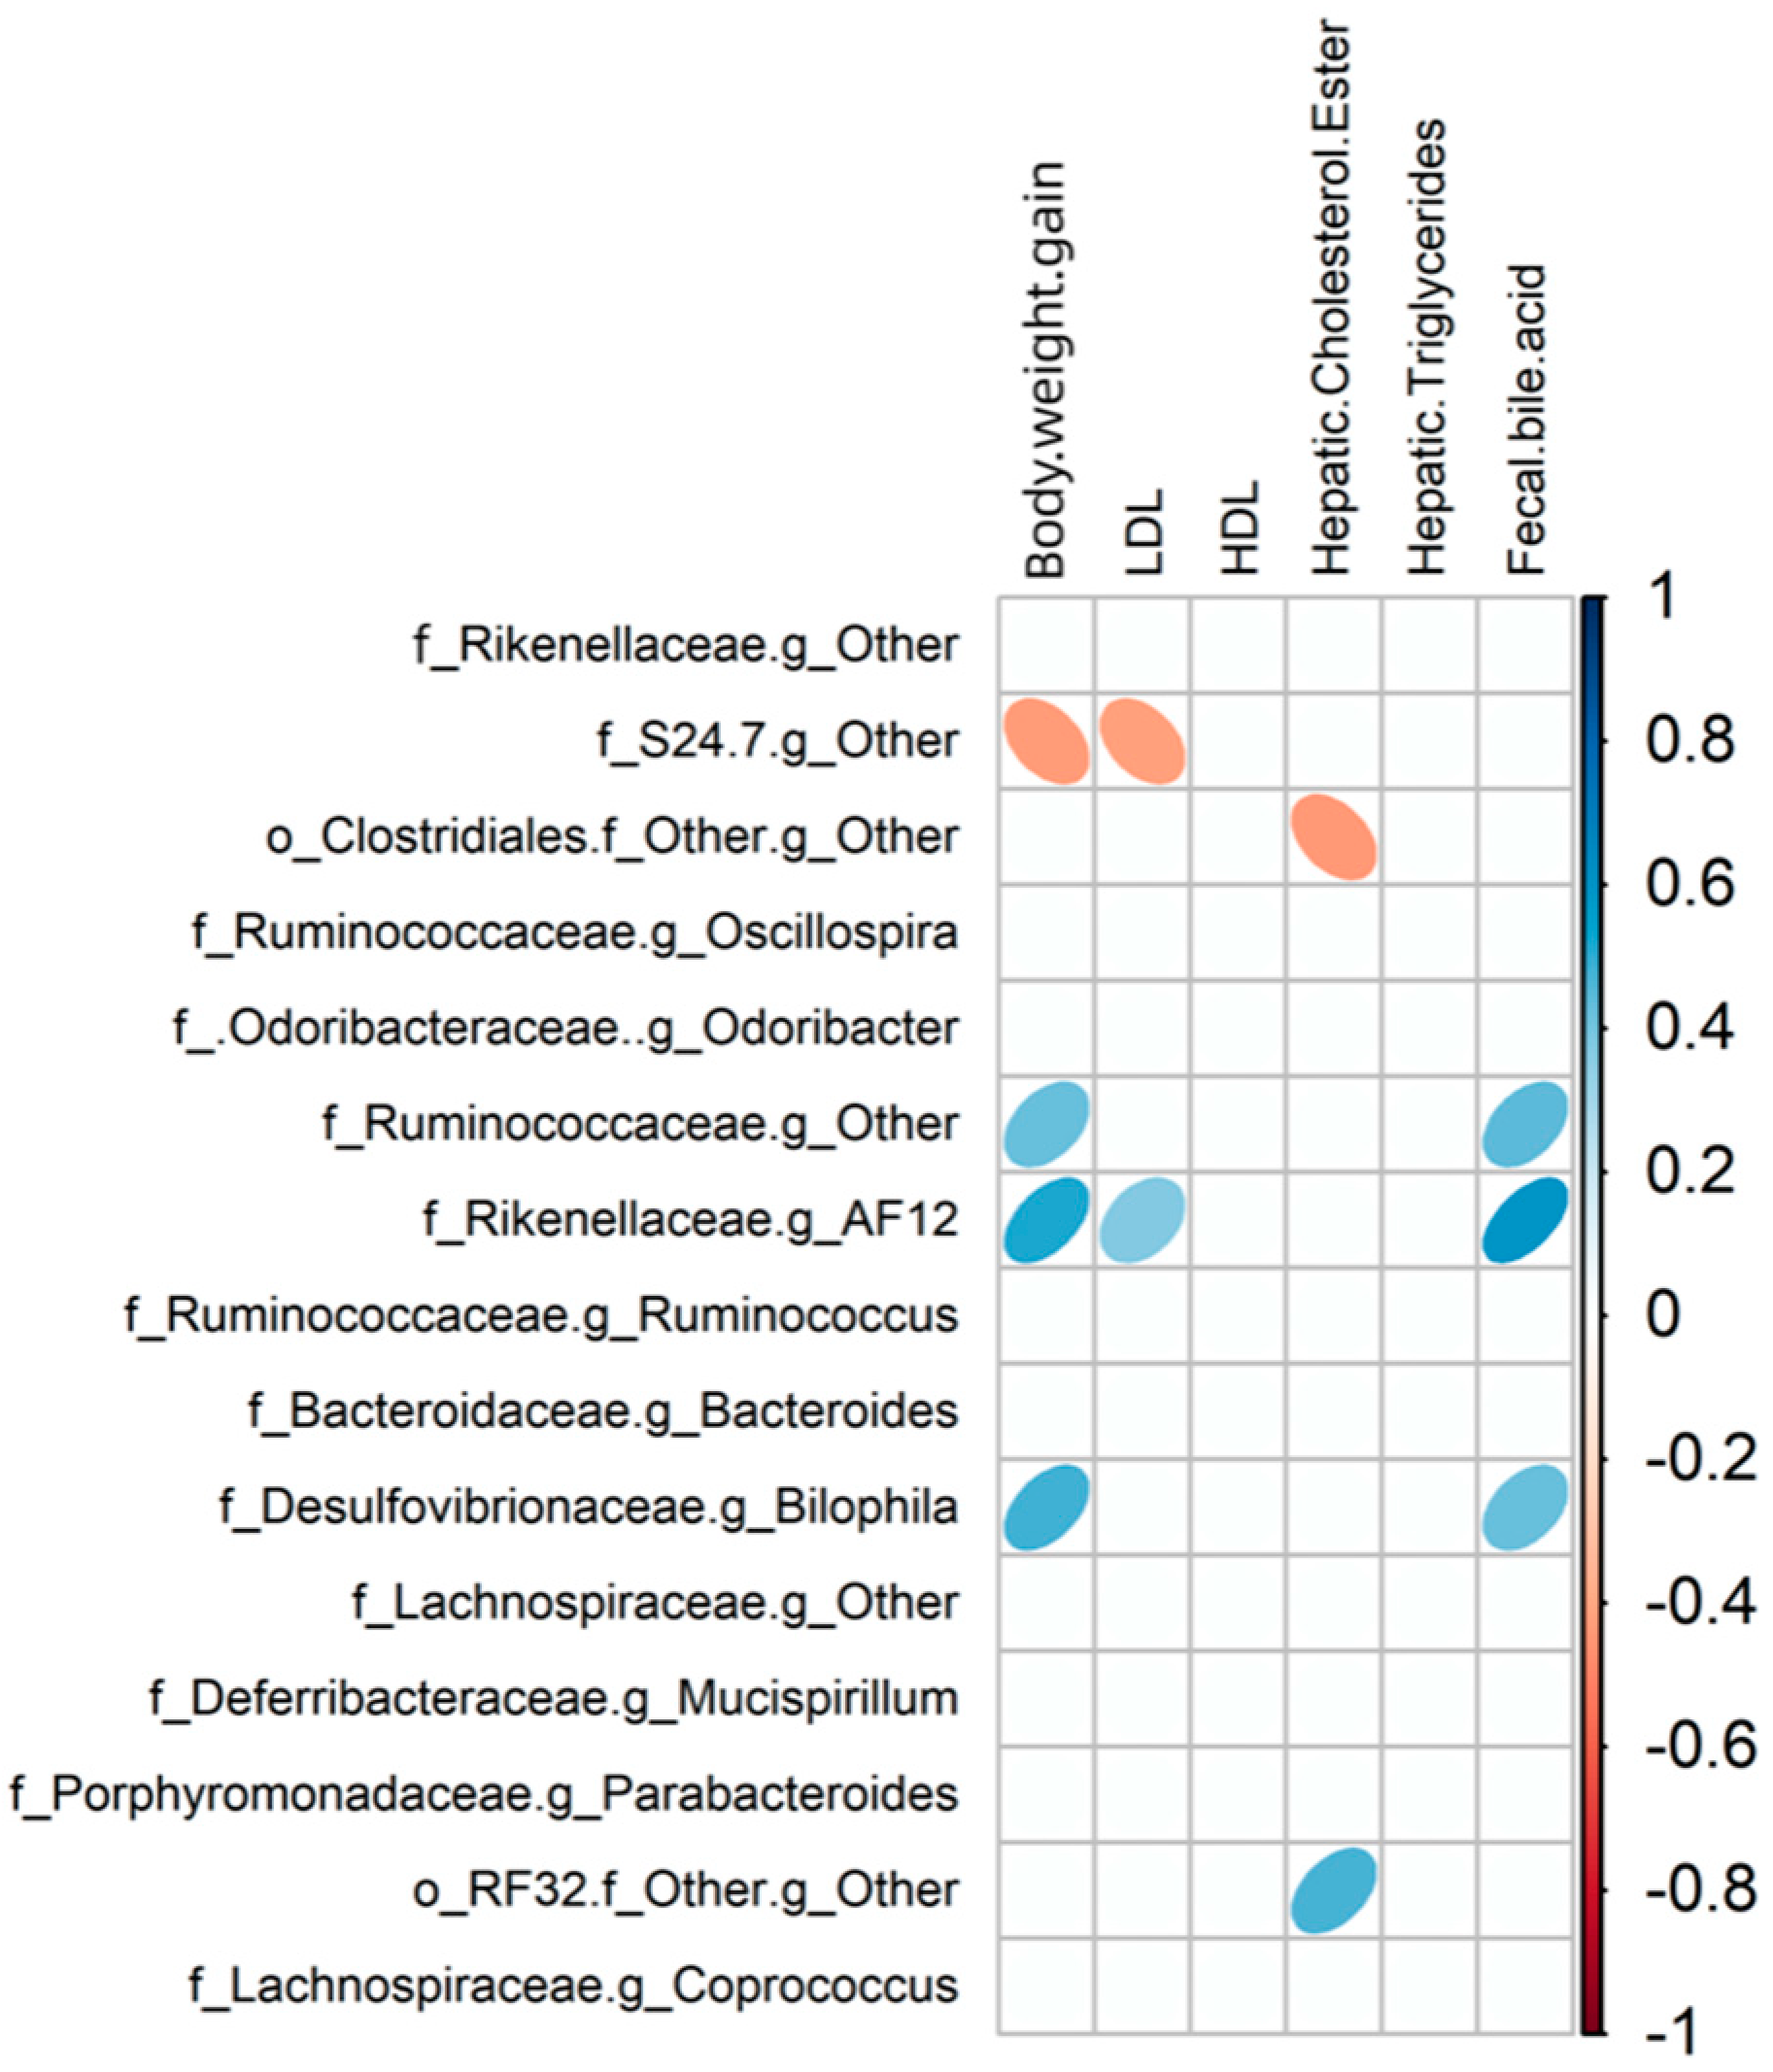
Fourthly, specific genera that distinguished between different dietary groups were pinpointed as predictive biomarkers for 8-week treatment outcomes using LEfSe analysis. We found that the reductions of important genera such as Bifidobacteria, Lactobacillus, and Akkermansia muciniphila in fecal microbiota of the LFRC group, were no longer significant in cecal microbiota of mice after 8 weeks of treatment. The differences in fecal and cecal microbiota in mice might be a consequence of mouse adaptation to food intake and environment, which warrants further elucidation. Furthermore, the link between these microbial markers and obesity-associated risk factors was reinforced by Pearson's correlation analysis. As an example, Genus AF12, which was recognized as a biomarker in the HF diet group, exhibited a favorable association with the increase in body weight, levels of LDL, and fecal bile acid in mice. The increased relative abundance of AF12 prompted by an HF diet was notably reduced by the addition of RC. Additionally, an unclassified genus within the Clostridiales order, which was augmented by RC supplementation, displayed a negative correlation with hepatic cholesterol ester concentrations in mice. These observations suggest that RC may counteract the rise in markers linked to gut inflammation and obesity-related conditions, including body weight, LDL, fecal bile acid, and hepatic free cholesterol, via alterations in gut microbiota composition. RC reduced the presence of an unclassified genus in the S24-7 family, which was found to be a biomarker in the LF diet and showed an inverse relationship with weight gain and LDL levels, in both LF and HF diets. This indicates that this bacterium could serve as an indicator of RC consumption and may contribute to the health-promoting effects of RC.
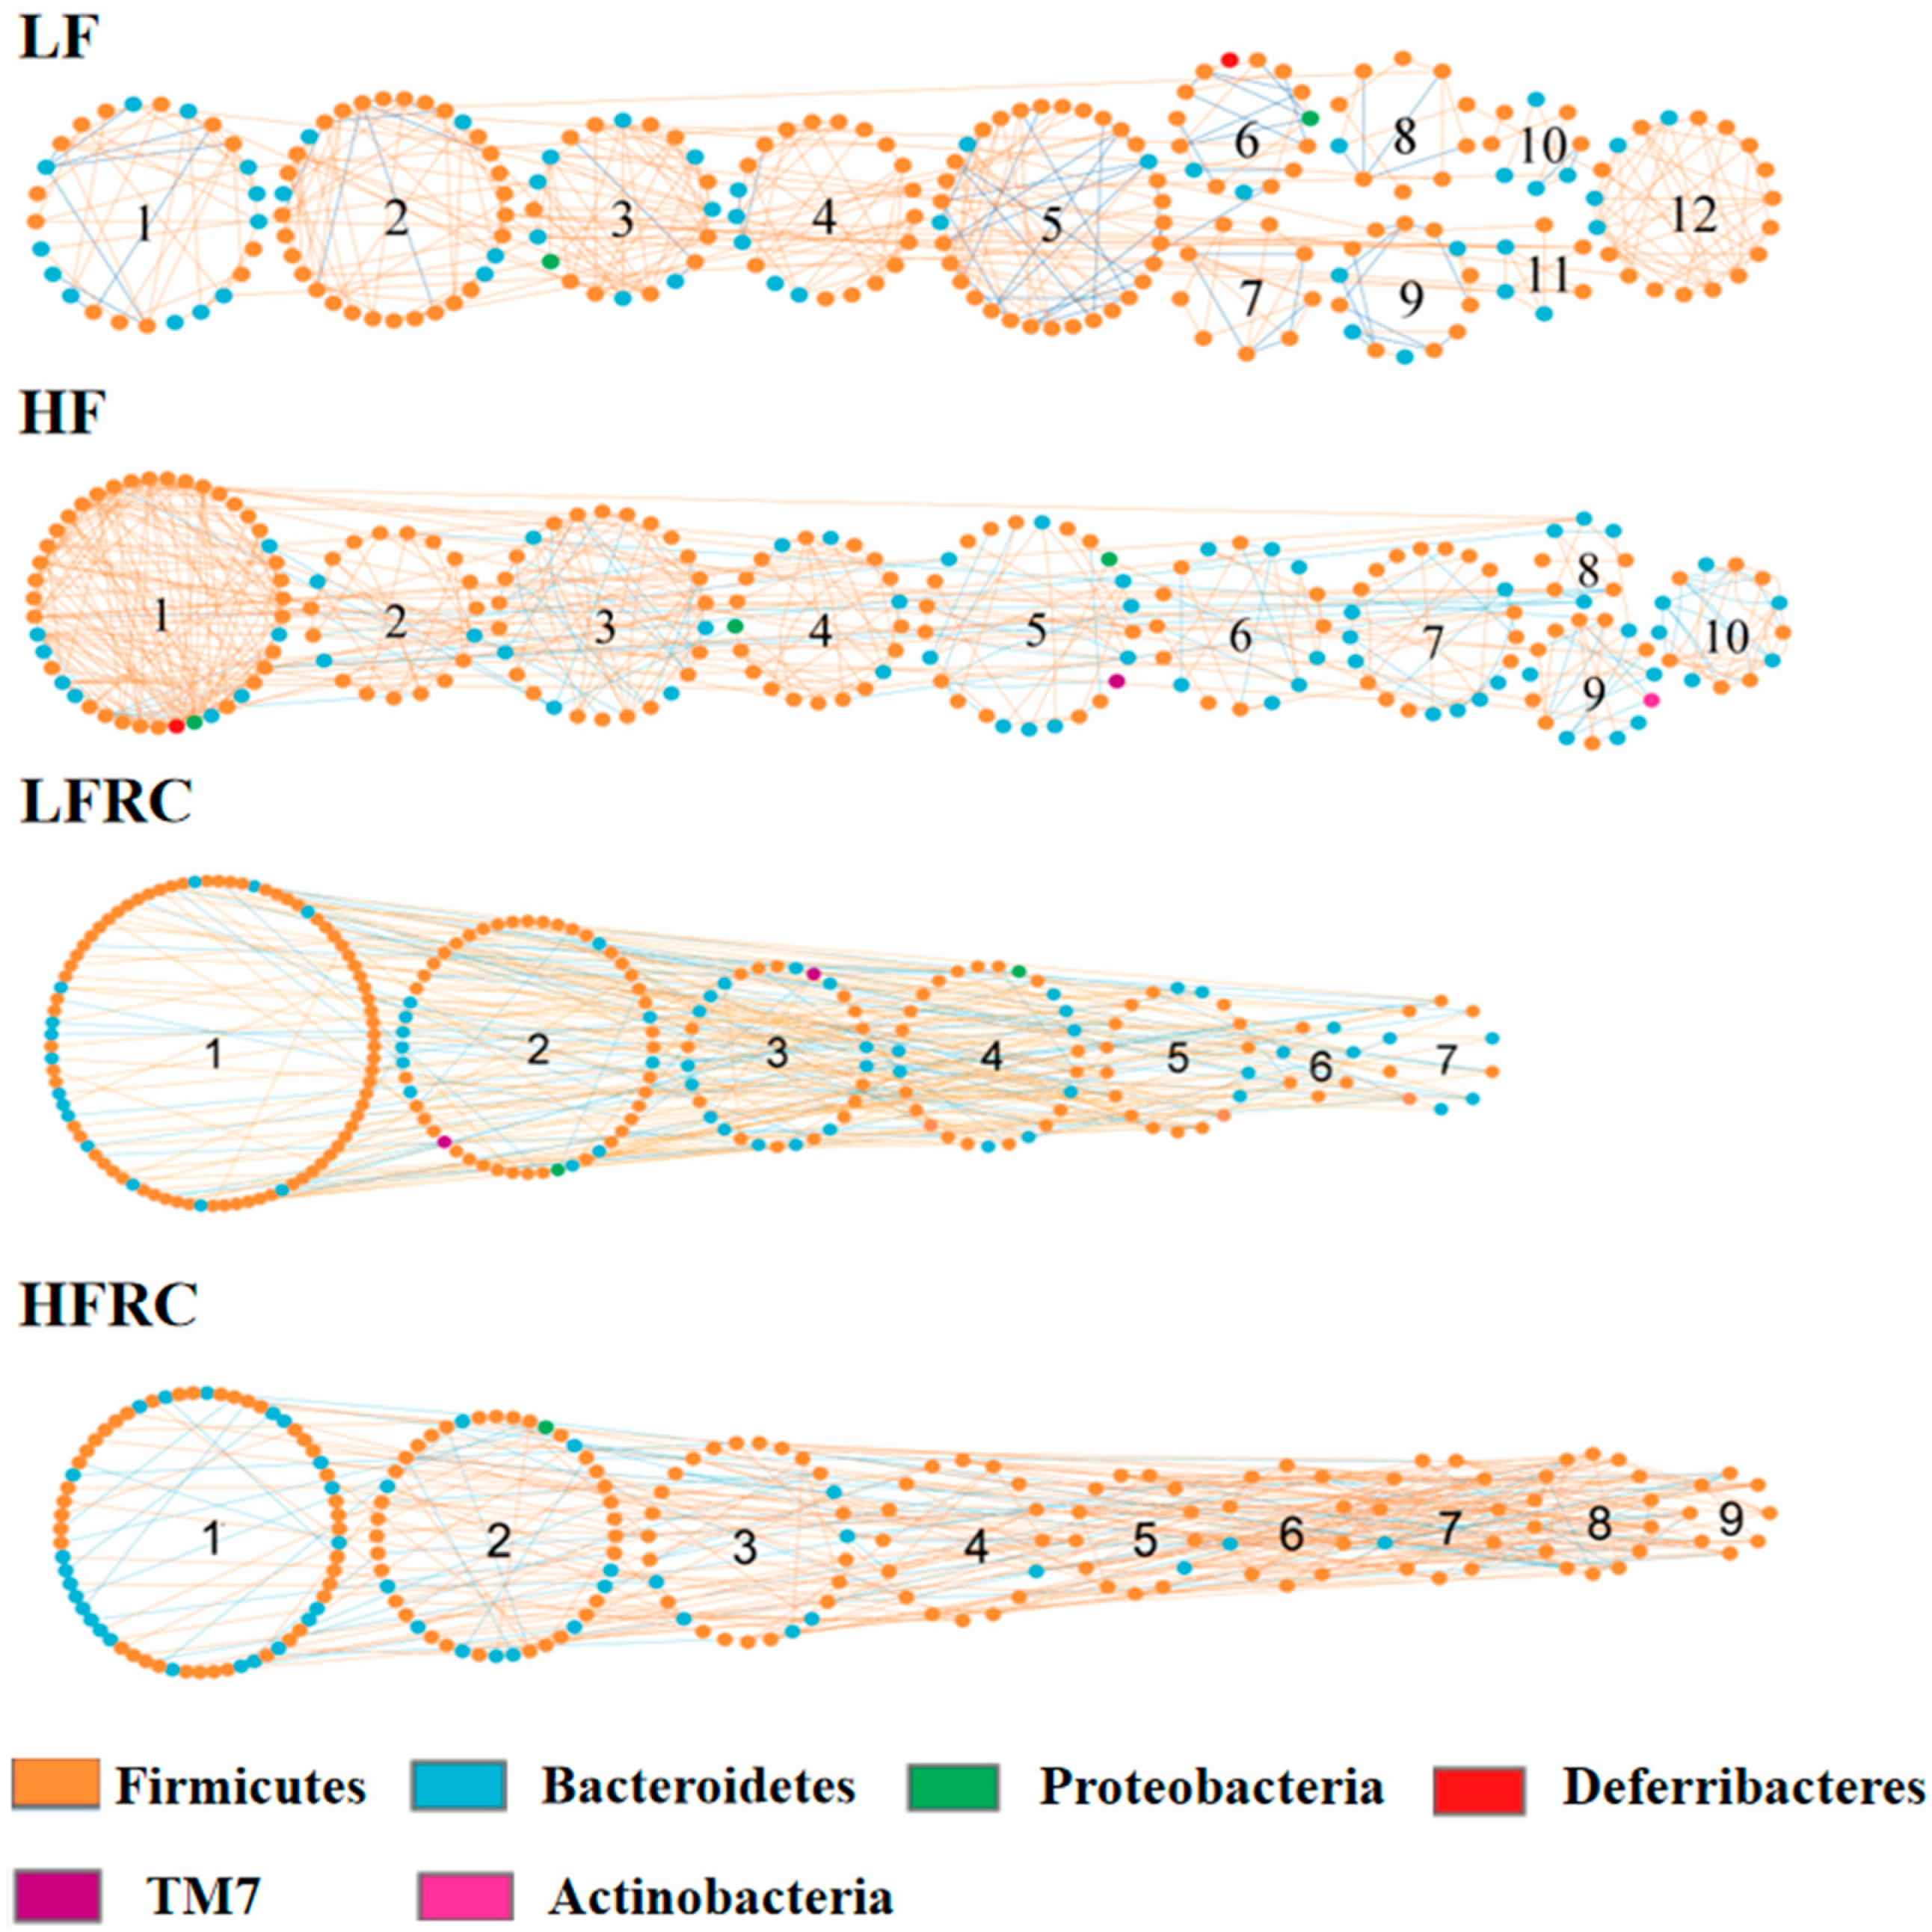
Ultimately, the analysis of the correlations within microbial co-occurrence networks provided greater clarity on how the topology of microbial networks is related to physiological features. Selected bacterial taxa in the microbial network of each dietary group were found to be closely associated with specific physiological characteristics. Bacteroidaceae and Bacteroides identified in LF and HF diet groups were found to be associated with cholesterol metabolism. These bacteria are likely involved in the uptake of dietary fat, which in turn regulates the metabolism of fecal bile acid and hepatic free cholesterol. Specifically, the OTUs from Bacteroides were linked with fecal bile acid and hepatic free cholesterol levels in both LF and HF diet groups, suggesting their role in dietary fat processing and cholesterol metabolism. The addition of RC seemed to diversify the bacterial involvement in cholesterol metabolism, as bacteria other than Bacteroides were also correlated with these metabolic indicators in the LFRC and HFRC groups. The correlation analysis between eigengenes based on modules and physiological characteristics in microbial co-occurrence networks provided additional support for this concept. The phylogenetic MEN for the four experimental groups all exhibited strong correlations between their submodules and physiological parameters, with notable differences in submodule responses to cholesterol metabolism when comparing diets with and without RC. Overall, our results show that RC could alter microbial interaction networks but the exact mechanisms of how these changes can modulate biological endpoints need further exploration.
We recently reported an effect of red cabbage microgreen, a young version of red cabbage, on the gut microbiome [
36]. Although RC microgreens and mature RC represent different growing stages of RC [
23], their effect on the microbiome appears to be different. RC microgreen seemed to elicit more robust changes in alpha diversity as more indices were found to be changed when animals consumed RC microgreen than the mature RC [
36]. Additionally, mature RC consumption led to changes in
Deferribacteraceae but not the consumption of RC microgreens. Given the composition of RC microgreens and mature RC are different [
23], these differences in the gut microbiome may be reflective of composition differences in the RC growing stages. However, there are also similarities in the gut microbiome in the animals elicited by consuming RC microgreens and mature RC. The abundance of the bacteria family
S24-7 was reduced when animals consumed RC microgreens [
36] or mature RC. In contrast, the unclassified
Clostridiales abundance was increased when animals consumed RC microgreen [
36] or mature RC. These data suggest common composition, for example, fiber, may determine the phenotype displayed. However, further experiments are needed to elucidate the precise component and substantiate the utilities of these bacteria changes as biomarkers of intake.
Figure 1.
The influence of RC on the intestinal bacteria of mice. Mouse fecal samples were collected 24 hours after feeding, from which bacterial DNA was extracted and quantified using qRT-PCR with specific primers. The information is displayed as mean ± SD. Statistically, significant differences between groups are denoted by distinct letters, with a p-value less than 0.05 indicating significance.
Figure 2.
The impact of RC on the diversity of microbes in the cecum of mice that were given an LF and HF diet. Following an 8-week treatment period, the contents of the cecum in mice were gathered and the DNA of bacteria in the cecal contents was extracted for sequencing the 16s rRNA. (A) Non-metric multidimensional scaling (NMDS) plot of the β diversity based on the OTU level Bray-Curtis distance matrix. The significance of clustering patterns in two-dimensional ordination diagrams was assessed using Permutation analysis of variance (PERMANOVA). (B-E) Box plot of OTU-level alpha diversity index (Chao1, PD whole tree, Shannon, Simpson). Detailed analysis was performed by conducting statistical evaluation using one-way ANOVA followed by Tukey's multiple comparison test. Boxes marked with different letters indicate statistically significant differences at a significance level of p ≤ 0.05.
Figure 3.
The cecal microbiota profile at the phylum level in mice under different dietary regimes shows variations. The relative percentage abundance of the predominant phyla (A, B, D, E) represents each group, where the four most abundant phyla make up at least 99% of all identified OTUs in each sample. Additionally, the ratio of Firmicutes to Bacteroidetes is provided for each group (C). The data are displayed as mean ± SD. Bars containing unique letters indicate statistically significant distinctions, with a p ≤ 0.05. Additionally, (F) exhibits a heatmap illustrating the relative prevalence of 16S rRNA gene sequences classified by phylum, employing hierarchical clustering analysis conducted via Microbiome Analyst utilizing the Ward clustering algorithm and the Euclidean distance metric.
Figure 4.
(A) The composition of the cecal microbiota at the family level was altered in mice on various diets. Data are presented for the top 15 families, with the collective contribution of other taxa represented as "Others." (B-G) Display the comparative relative abundances at the family level among different microbial populations. Results are shown as mean ± SD. Bars annotated with different letters denote significant intergroup differences at p ≤ 0.05.
Figure 5.
The comparison of alterations in cecal microbiota at the genus level was conducted using LEfSe analysis. (A) The LDA score histogram showed the effect size of each difference-rich feature between groups (only groups with significant LDA scores (log10) > 3); (B) Classification branch diagram with rich differences represented by the outermost ring gate and the innermost ring genus. Circle sizes correspond to their relative abundances.
Figure 6.
Intake of RC had significant effects on unclassified genera of S27-4, AF12, and unclassified genera of Clostridium. Data are expressed as mean ± SD, which are denoted by different letters to indicate a significant difference at p ≤ 0.05.
Figure 6.
Intake of RC had significant effects on unclassified genera of S27-4, AF12, and unclassified genera of Clostridium. Data are expressed as mean ± SD, which are denoted by different letters to indicate a significant difference at p ≤ 0.05.
Figure 7.
Pearson's correlation matrix presents the interrelationships between dietary-influenced physiological parameters and the fifteen most prevalent genera, with adjustments for multiple testing via the Benjamini-Hochberg correction method. The genera are ranked by abundance. Blue ellipses denote positive correlations, whereas red ellipses indicate negative correlations.
Figure 8.
The depiction of the molecular ecological network of the gut microbiota is shown for different dietary regimes, including LF, HF, LFRC, and HFRC. Each node symbolizes an OTU, with the node's color signifying different phyla. A positive interaction between two nodes is represented by a red line, whereas a negative interaction is indicated by a blue line.
Table 1.
Percentage relative abundance of key biomarkers as determined by LEfSe analysis.
Table 1.
Percentage relative abundance of key biomarkers as determined by LEfSe analysis.
Phylum/
Class; Order; Family |
Genus |
Diet |
| LF |
HF |
LFRC |
HFRC |
| Bacteroidetes |
|
|
|
|
|
| Bacteroidia; Bacteroidales; S24-7 |
Other |
23.24±5.32a |
15.74±6.01ab
|
14.23±6.49b
|
11.59±2.87b
|
| Bacteroidia; Bacteroidales; Rikenellaceae |
AF12 |
4.08±0.62b
|
7.29±1.33a |
3.05±1.48b
|
4.61±1.15b
|
| Bacteroidia; Bacteroidales; [Odoribacteraceae] |
Odoribacter |
7.60±2.26ab
|
6.52±1.88b
|
9.73±2.49a |
6.22±1.60b
|
| Firmicutes |
|
|
|
|
|
| Clostridia; Clostridiales; Ruminococcaceae |
Oscillospira |
10.17±1.97b
|
14.01±2.74ab
|
9.45±2.99b
|
16.80±4.34a |
| Clostridia; Clostridiales; Ruminococcaceae |
Other |
5.17±1.52b
|
8.70±1.80a |
4.19±1.57b
|
7.61±1.66a
|
| Clostridia; Clostridiales; Other |
Other |
10.10±3.87b
|
8.36±3.78b
|
19.04±7.16a |
18.62±5.36a
|
| Clostridia; Clostridiales; Lachnospiraceae |
Coprococcus |
0.24±0.05a
|
0.34±0.26a
|
0.55±0.22a |
0.53±0.22b
|
| Proteobacteria |
|
|
|
|
|
| Deltaproteobacteria; Desulfovibrionales; Desulfovibrionaceae |
Bilophila |
2.52±0.60a
|
4.03±0.47a |
1.81±0.66b
|
3.39±0.64b
|
Table 2.
The correlation between physiological traits and OTU significance in microbial symbiosis network.
Table 2.
The correlation between physiological traits and OTU significance in microbial symbiosis network.
| Diet group |
Physiological traits |
Bacterial taxa (rank) |
ra
|
p-Valueb
|
| LF |
Fecal bile acid |
Bacteroidaceae (Family) |
0.741 |
0. 004 |
| Fecal bile acid |
Bacteroides (Genus) |
0.741 |
0. 002 |
| HF |
Hepatic free cholesterol |
Bacteroidaceae (Family) |
0.684 |
0. 003 |
| Hepatic free cholesterol |
Bacteroides (Genus) |
0.684 |
0. 001 |
| LFRC |
Hepatic. free. cholesterol |
Oscillospira (Genus) |
0.316 |
0. 046 |
| LDL |
[Ruminococcus] (Genus) |
0.790 |
0. 017 |
| LDL |
Gnavus (Species) |
0.790 |
0. 017 |
| HFRC |
Hepatic triglycerides |
Lachnospiraceae (Family) |
0.269 |
0. 003 |
| Hepatic triglycerides |
S24-7 (Family) |
0.243 |
0. 036 |
| Hepatic triglycerides |
Coprococcus (Genus) |
0.718 |
0. 017 |
| Hepatic triglycerides |
Oscillospira (Genus) |
0.134 |
0. 048 |
Table 3.
Associations between node interconnectivity within modules and physiological traits in microbial co-occurrence networks.
Table 3.
Associations between node interconnectivity within modules and physiological traits in microbial co-occurrence networks.
| Diet group |
Module |
Physiological traits |
r a
|
p-Value b
|
| LF |
9 |
Body weight |
0.84 |
0.02 |
| 7 |
Hepatic cholesterol ester |
0.88 |
0.008 |
| 7 |
Hepatic free cholesterol |
-0.92 |
0.003 |
| 1 |
Fecal bile acid |
0.81 |
0.03 |
| HF |
10 |
Body weight |
-0.81 |
0.03 |
| 2 |
VLDL |
0.83 |
0.02 |
| 9 |
VLDL |
0.89 |
0.007 |
| 8 |
Hepatic cholesterol ester |
-0.79 |
0.04 |
| 6 |
Hepatic free cholesterol |
0.84 |
0.02 |
| 7 |
Fecal bile acid |
0.79 |
0.03 |
| LFRC |
7 |
Hepatic free cholesterol |
-0.72 |
0.05 |
| HFRC |
6 |
HDL |
-0.74 |
0.04 |
| 8 |
Hepatic triglycerides |
-0.80 |
0.02 |
| 5 |
Hepatic free cholesterol |
-0.73 |
0.04 |
