1. Introduction
Breast cancer ranks as the top cancer type in terms of incidence and the fifth leading cause of cancer death. [
1] Although conventional chemotherapeutic agents exhibit significant inhibitory effects on breast cancer, they also nonspecifically damage normal cells, causing harm to the human body. Additionally, the development of drug resistance limits their therapeutic efficacy. [
2] Targeted therapies, while demonstrating remarkable effectiveness for specific subsets of breast cancer patients, are not universally applicable due to their limited specificity. [
3] Targeting the commonly observed abnormal phenotypes in cancer cells offers a potential solution to overcome these therapeutic limitations and serves as a promising avenue for comprehensive cancer treatment.
Reactive oxygen species (ROS), as byproducts of oxidative phosphorylation, exert dual effects on cancer cells. On one hand, they mediate signaling pathways that promote cancer cell survival, proliferation, and metastasis. On the other hand, excessive ROS production triggers tumor suppression through DNA damage induction. [
4] Carcinogen-induced cancer cells characterized by rapid proliferation and metabolic abnormalities, commonly exhibit elevated levels of ROS. [
5] Increased ROS can attack macromolecules within cells, leading to various types of oxidative damage. Among these, nucleic acid damage can alter or disrupt genetic information within the genome, posing significant risks to cancer cells, including programmed cell death. However, normal cells are not fatally harmed by normal levels of ROS. Hence, cancer cells typically upregulate several DNA damage repair proteins, including human MutT homolog 1 (MTH1), to maintain genome integrity. [
6]
To overcome the inhibitory effects of high levels of ROS, cancer cells activate adaptive mechanisms. Research suggests that cancer cells rely heavily on the base excision repair mechanism mediated by MTH1 to prevent misincorporation of harmful oxidized nucleotides into the genome and thereby reduce genotoxicity. [
7] As a nudix phosphohydrolase, MTH1 catalyzes the hydrolysis of oxidized nucleoside triphosphates, including 8-oxo-7,8-dihydro-2’-deoxyguanosine triphosphate (8-oxo-dGTP), 2-hydroxyadenosine triphosphate (2-OH-dATP), and N6-methyl-dATP, into their respective monophosphates, thereby preventing the incorporation of these oxidized deoxyribonucleoside triphosphates into DNA during replication and minimizing the resulting DNA instability. [
8,
9]
This function of MTH1 ultimately protects cells from ROS-induced damage. [
10,
11] Compared to normal cells, MTH1 is overexpressed in many cancers, including breast cancer, brain tumor, lung cancer, gastric cancer, renal cancer, and colorectal cancer arising from ulcerative colitis. [
8,
12,
13] In particular, MTH1 is found to be overexpressed in distinct subtypes of breast cancer, independent of the molecular and clinicopathological characteristics of the tumor. [
14] This difference in expression is closely associated with the levels of ROS. Cancer cells with higher ROS levels rely more on MTH1 for cell survival due to intensified oxidative attacks, leading to increased MTH1 expression. [
10] Although research has shown that a small amount of normal cells also express MTH1 and play a beneficial role, MTH1 can protect platelet mitochondria from oxidative damage, regulate platelet function and thrombus formation. [
15] In neurodegenerative diseases, MTH1 plays a neuroprotective role by minimizing the accumulation of its substrate, 8-oxoguanine (8-oxoG), in the nuclear and mitochondrial genomes of Alzheimer’s disease patients. This inhibition of glial cell proliferation and neuronal loss highlights MTH1’s role in preserving neuronal integrity. [
16] But more importantly, MTH1 plays a crucial role in countering cell death induced by oxidative and reductive abnormalities commonly present in cancer cells. Additionally, high MTH1 expression correlates significantly with poor prognosis in various malignancies. [
12,
17,
18] Therefore, targeting MTH1 to enhance intracellular accumulation of oxidized nucleotides and thereby induce DNA damage can be considered a novel strategy for eradicating breast cancer. These findings provide new research directions in overcoming the challenges of breast cancer treatment.
The inhibition of MTH1 can exert anticancer effects by preserving normal cell viability and exhibits broad-spectrum anticancer activity, TH287 and TH588 are the first small molecule inhibitors targeting MTH1, and their potent anticancer effects have sparked interest among researchers in MTH1 inhibitors, [
8] which have sparked interest among researchers in MTH1 inhibitors. As a result, various types of MTH1 inhibitors have been developed, primarily classified as 2-aminopyrimidine derivatives, [
19,
20] (S)-crizotinib or pyrazoloquinoline derivatives, [
21] natural extracts, [
22,
23] nucleoside analogs, [
24] Kettle’s three classes of inhibitors, [
25] and nanoparticles. [
26] All of these demonstrate a significant inhibitory effect on MTH1. In the present work, we report a novel MTH1 inhibitor, MA-24, which exhibits potent tumor-specific anti-breast cancer activity both in vitro and in vivo. These findings provide insight and a candidate compound for the development of new therapies and drugs targeting the common abnormal phenotypes in breast cancer cells.
3. Discussion
In recent years, a diverse range of MTH1 inhibitors has been developed, including structural optimization of existing inhibitors, screening for novel small molecule inhibitors from compound libraries, and extraction from natural products. The current status indicates the need for the development of MTH1 inhibitors with improved activity. We identified MA-24 as an MTH1 inhibitor with anti-breast cancer effects through in vitro screening. We investigated the differential importance of MTH1 in normal and cancer cells and found that MA-24 outperformed conventional chemotherapeutic drugs in indiscriminately attacking both cancer and normal cells by specifically targeting cancer cells to exert its anticancer effects. Our study discovered the mechanisms of MA-24’s anti-MCF-7 cell effects at the DNA and protein levels. It significantly induced oxidative DNA damage in cells, inhibited cellular protective mechanisms by targeting MTH1, and activated apoptotic signals, ultimately leading to cell apoptosis. In an in vivo 4T1 tumor transplantation model, MA-24 exhibited significant inhibition of 4T1 tumor growth and metastasis. The considerable potential demonstrated by MA-24 in combating breast cancer provides theoretical and practical foundations for the development of new approaches targeting MTH1 for breast cancer treatment.
Currently, the combination of MTH1 inhibitors with other therapies provides potential strategies for cancer treatment. For example, MTH1 inhibition has been shown to alleviate immune suppression in experimental mesothelioma [
28] and improve the efficacy of anti-PD-L1 immunotherapy, as well as enhance tumor sensitivity to radiotherapy. [
29] Combination therapy with MTH1 inhibitors and reactive oxygen species enhancers can intensify oxidative damage, leading to increased cellular toxicity and inhibition of tumor growth. [
30] Additionally, TH287 has been shown to enhance tumor sensitivity to the anti-cancer drug NaAsO
2. [
31] These studies demonstrate the broad application prospects of MTH1 inhibitors in cancer treatment.
The success of MTH1 inhibition in anticancer therapy sparked a research frenzy in this field. Nadia Gul et al. [
32] have shown that microtubule proteins are the target of TH588 but not MTH1. Furthermore, Kettl. et al. [
25] synthesized three distinct chemical series of MTH1 inhibitors and demonstrated that non-essential role of MTH1 in cancer cell survival, which challenging the research conclusions of Gad Helge and other research groups. [
8] Interestingly, the Warpman Berglund U et al. [
33] later refuted the previously reported microtubule-targeting mechanism of TH588, demonstrating that TH588 has a distinct mode of action from microtubule-targeting drugs, such as paclitaxel and nocodazole, and emphasized the high selectivity of MTH1 inhibitors for MTH1 binding and inhibition. Subsequent studies once again affirm that MTH1 inhibition may provide a survival advantage to treated tumors by blocking DNA nicks caused by base excision repair and inducing p53. [
34] Warpman Berglund U further demonstrated that the MTH1 inhibitor TH1579 is an anticancer agent for acute myeloid leukemia via inducing oxidative DNA damage and mitotic arrest. [
35] This study aimed to report the therapeutic effect of novel MTH1 inhibitors MA-24 in breast cancer treatment. Additionally, we elucidate the necessity of MTH1 for the survival of breast cancer cells. We noticed that MTH1 overexpression rescued the damage caused by the MA-24 in MCF-7 cells, while the MTH1 knockdown group still showed susceptibility to MA-24 in
Figure 3e and
Figure 3f. There are two possible reasons for this observation: a, in the MTH1-silenced cells, MTH1 expression is reduced but not completely abolished, and the remaining MTH1 is affected by the inhibition of MA-24, leading to changes in cell viability. b, MA-24 may have other targets apart from MTH1 that collectively impede the survival of MCF-7 cells. Although off-target effects cannot be completely ruled out, current research demonstrates that MA-24 primarily targets MTH1 to exert its anti-MCF-7 effects. Additionally, it highlights the complexity of the mechanism of action of MTH1 inhibitors. Although we cannot exclude the possibility of off-target effects, our current research has not identified any other target that is more compelling than MTH1, which prompts us to further investigate this matter. In conclusion, this study provides a theoretical and practical foundation for the development of new approaches targeting MTH1 for breast cancer treatment.
4. Materials and Methods
4.1. Compounds
2,4,6-Triaminopyrimidine derivatives MA-19 – MA-24 and 2,4,6-triamino-1,3,5-triazine derivatives MB-16 – MA-17 were kindly provided by Professor Yisheng Lai (China Pharmaceutical University). 5-FU and TH287 hydrochloride were purchased from Aladdin (Shanghai, China) and Dalian Meilun Biotech Co., Ltd. (Dalian, China), respectively. The structure and purity of the compounds were checked using MS and HNMR.
4.2. IC50 Determination
MTH1, inorganic pyrophosphatase and dGTP (Thermo Fisher Scientific, Waltham, MA, USA) were diluted in assay buffer containing 100 mM Tris-acetate at pH 8.0, 40 mM NaCl, 10 mM Mg-acetate, 0.005% Tween 20, and 1 mM DTT. Briefly, serial dilutions of compounds were dissolved in assay buffer, meanwhile MTH1 was diluted to 4 μg/mL, and then these two solutions were mixed and filled with buffer to 186 µL. After 15 min incubation at 25°C, 10 µL dGTP (final concentration 100 mM) and 4 µL inorganic pyrophosphatase (final concentration 0.2 U/mL) was added to start the reaction. The reaction mixture was incubated with shaking for 45 min at 25°C. Finally, 50 µL malachite green assay reagent was added and incubated with shaking for 15 min at 25°C. The absorbance of the assay plate was read at 630 nm using a Multiskan GO Microplate Spectrophotometer (Thermo Fisher Scientific, Waltham, MA, USA) and IC50 values were calculated using GraphPad Prism Software.
4.3. Cell Lines and Cell Culture
Human breast cancer cell lines (MCF-7 and MDA-MB-231), a murine mammary cancer cell line (4T1), immortalized cell lines HEK-293F, CHO, and HUVEC cells were obtained from ATCC. All cells were cultured in suitable medium supplemented with 10% fetal bovine serum (FBS; Zhejiang Tianhang Biotechnology Co., Ltd.), 100 U/mL penicillin and 100 μg/mL streptomycin (Life Technologies, Australia) at 37°C in 5% CO2. MCF-7, MDA-MB-231, HEK-293F and HUVEC were grown in Dulbecco’s modified Eagle’s medium (DMEM; Life Technologies, Australia), 4T1 were cultivated in Roswell Park Memorial Institute (RPMI)-1640 medium (Life Technologies, Australia) and CHO cells were grown in Ham’s F-12 Nutrient Mix (Life Technologies, Australia).
4.4. Cell Viability Assays
Viability of the cells was measured using MTT assay (Aladdin, Shanghai, China), where cells were seeded into 96-well plates at densities of 4,000 (MCF-7, 4T1, HUVEC and CHO) and 8,000 (MDA-MB-231 and HEK-293F) cells per well and grown for 24 h. Subsequently, cells were treated with compound or vehicle (maximum 0.3% DMSO). After 48h cells were treated with MTT, the absorbance of the assay plate was read at 490 nm using a Multiskan GO Microplate Spectrophotometer (Thermo Fisher Scientific, Waltham, MA, USA). Each experiment was performed in triplicates and IC50 values were calculated using GraphPad Prism Software Inc., nonlinear curve fit with variable slope (four parameters).
4.5. Annexin V/PI Apoptosis Assay
3×10⁶ MCF-7 cells were seeded into 6-well plates and cultured at 37°C with 5% CO2 for 24 h. Then cells were exposed to tested compound or vehicle (maximum 0.3% DMSO) and after 48 h were treated with Annexin V-FITC/PI Apoptosis Detection Kit per the manufacturer’s instructions (Cwbio, Nanjing, China). Cells were analyzed on a MACSQuant™ flow cytometer (Miltenyi Biotec, Cologne, Germany) using FlowJo V10.6.2 software.
4.6. Comet Assay
MCF-7 cells (300,000 cells) were plated in 6-well plates and incubated for 24 h at 37°C and 5% CO2. Subsequently, cells were treated with compound (10 μM MA-24 and TH287), vehicle (0.1% DMSO) for 2 days or with 150 μM for 10 min on ice. Cells were harvested as above. After washing twice with PBS, cells were re-suspended in PBS. 30 μL cell suspension was mixed with 150 µL 1.2% low-melting agarose that was maintained at 37°C. The mixture was layered onto pre-warmed (37°C) agarose coated glass slides. The slides were kept on ice for 10 min and incubated in lysis buffer (10 mM Tris pH 7.7, 2.5 M NaCl, 0.1 M EDTA, 1% DMSO, and 1% Triton X-100) at 4°C overnight in the dark. Slides were washed twice times with enzyme reaction buffer (40 mM HEPES pH 8.0, 0.1 M KCl, 0.5 mM EDTA, and 0.2 mg/mL BSA) and incubated with buffer alone, Fpg (8 U/mL, New England Biolabs, Shanghai, China) at 37°C for 45 min. Slides were washed once with enzyme reaction buffer and incubated in alkaline electrophoresis buffer (50 mM NaOH, 1 mM EDTA and 1% DMSO) for 20 min. Electrophoresis was run at 300 mA, 25 V for 30 min in electrophoresis buffer. Slides were washed in neutralization buffer (0.4 M Tris-HCl pH 7.0) and stained with 3 μg/mL PI (Sigma Aldrich, Germany). Images were acquired with a fluorescence microscope (Olympus Corporation, Japan) and quantified using Comet Score software. At least 100 comets per sample were analyzed. Tail moment is calculated as percent DNA in the tail multiplied by the tail length.
4.7. Western Blot Analysis
Total protein was obtained using RIPA lysis buffer (Beyotime Biotechnology, Shanghai, China) supplemented with phenylmethanesulfonyl fluoride (Beyotime Biotechnology, Shanghai, China), separated by SDS-PAGE and transferred to the PVDF membrane by electroblotting (Bio-Rad, Hercules, CA, USA) followed by blocking with 5% milk in TBST. MTH1 antibody (ab200832, Abcam, USA), β-actin antibody (ab8227, Abcam, USA), ccaspae-3 antibody (14220, CST, Massachusetts, USA), cleaved caspase-3 antibody (Asp175) (9664, CST, Massachusetts, USA), cleaved PARP antibody (Asp214) (95696, CST, Massachusetts, USA), p38 (9212, CST, Massachusetts, USA), and phospho-p38 MAPK (Thr180/Tyr182) (9211, CST, Massachusetts, USA) were used at the dilution of 1:1000–1:5000. Upon addition of primary and HRP-conjugated secondary antibodies, blots were detected using ECL substrate (Thermo Fisher Scientific, Waltham, MA, USA) and Tanon 5200 Chemiluminescent Imaging System (Tanon, Shanghai, China). Band intensities were quantified using densitometry Image J 1.49 version software.
4.8. Target Engagement Assay
MCF-7 cells cultured in 6-well plates for 24 h were exposed to vehicle (0.5% DMSO) or 50 μM TH287 or MA-24 for 4.5 h. After trypsinization cells were detached, spun down and resuspended in PBS. Eight equational cells were heated for 3 min from 42 to 75°C, and then lysed using RIPA lysis buffer. Western blot analysis was used to analyze for the amounts of stabilized MTH1 using the MTH1 antibody.
4.9. RNA Interference
MCF-7 cells cultured in 6-well to 70% confluency were transfected with 100 nM siRNA oligos (GenePharma, Shanghai, China) and siRNA transfection reagent (Invitrogen, Waltham, MA, USA) according to the manufacturer’s protocol. After 48 h knockdown was verified by western blot. Target sequences were as follows: MTH1 siRNA#1 5’-CCUGCUUCAGAAGAAGAAATT-3’, MTH1 siRNA#2 5’-AGGAGAGACCAUCGAGGAUTT-3’, MTH1 siRNA#3 5’-GGUUCCAGCUGGAUCAGAUTT-3’, control scrambled siRNA 5’-UUCUCC GAACGUGUCACGUTT-3’.
4.10. MTH1 Overexpression Studies
The mth1 cDNA was obtained by PCR amplification and was inserted into pDsRed1-N1 with EcoRI and XhoI restriction sites. The pDsRed1-N1 MTH1 construct was identified by sequencing. MCF-7 cells were transfected with pDsRed1-N1 vector or pDsRed1-N1 MTH1 construct using Lipofectamine® 2000 Reagent (Invitrogen, Waltham, MA, USA) according to the manufacturer’s instruction. After 48 h the overexpression of MTH1 was verified by western blot.
4.11. Animals and In Vivo Efficacy Studies
All animal experiments were carried out in accordance with a protocol approved by the Animal Ethics Committee of China Pharmaceutical University. Female BALB/C mice were given food and water ad libitum. Approximately 7-week-old mice were injected subcutaneously with 2×10⁵ 4T1 cells at the left flank. When the mean tumor size reached 30~50 mm3, vehicle, MTH1 inhibitor (MA-24 at 60mg/kg or TH287 at 200mg/kg) or 5-FU (30mg/kg) was administered intraperitoneally every three days. Tumor size and body weights were measured twice weekly starting on the first day of treatment. Moreover, to minimize animal suffering, euthanasia by cervical dislocation was performed when the maximum diameter of the tumors exceeded 1 cm.
4.12. Molecular Docking Method
Molecular docking was completed with Glide 5.5 implemented in Schrödinger2009. The crystal structure (PDB ID: 4N1T) of MTH1 in complex with TH287 was obtained from the Protein Data Bank (
http://www.rcsb.org/). The crystal structure was prepared with the Protein Preparation Wizard workflow. All of the water molecules were removed. The grid file for molecular docking was generated based on the binding site, which was defined by a box centered on the centroid of the crystal ligand and in similar size to it. Compounds were prepared with LigPrep and docked using the Glide extra-precision (XP) mode. Default settings were used for all of the other parameters.
4.13. Statistical Analysis
Data are presented as mean ± standard deviation (SD). The student’s t-test or two-way ANOVA test was used for determining statistical significance between groups (*, p < 0.05; **, p < 0.01; ***, p < 0.001; ns, not significant). All experiments were repeated three times or more.
Author Contributions
Pro. designed the study, Pro. provided target compounds, including MA-24. Dr. has designed experiments and developed the methods in this study. and Yuling Hu performed the cell experiments. performed the animal experiments. Lei Wang performed the data analysis. Xuanling Zhang collected the data. All authors have read and agreed to the published version of the manuscript. Conceptualization: Y. L.; methodology, NN. K., J. M; software, RR. D.; validation, Y. L., YS. L. and NN. K.; formal analysis, YS. L.; investigation, YL. H. and L. W.; resources, YS. L.; data curation, XL. Z.; writing—original draft preparation, NN. K.; writing—review and editing, NN. K.; visualization, L. W.; supervision, Y.L.; project administration, Y. L.; funding acquisition, YS. L. and NN. K. All authors have read and agreed to the published version of the manuscript.”.
Figure 1.
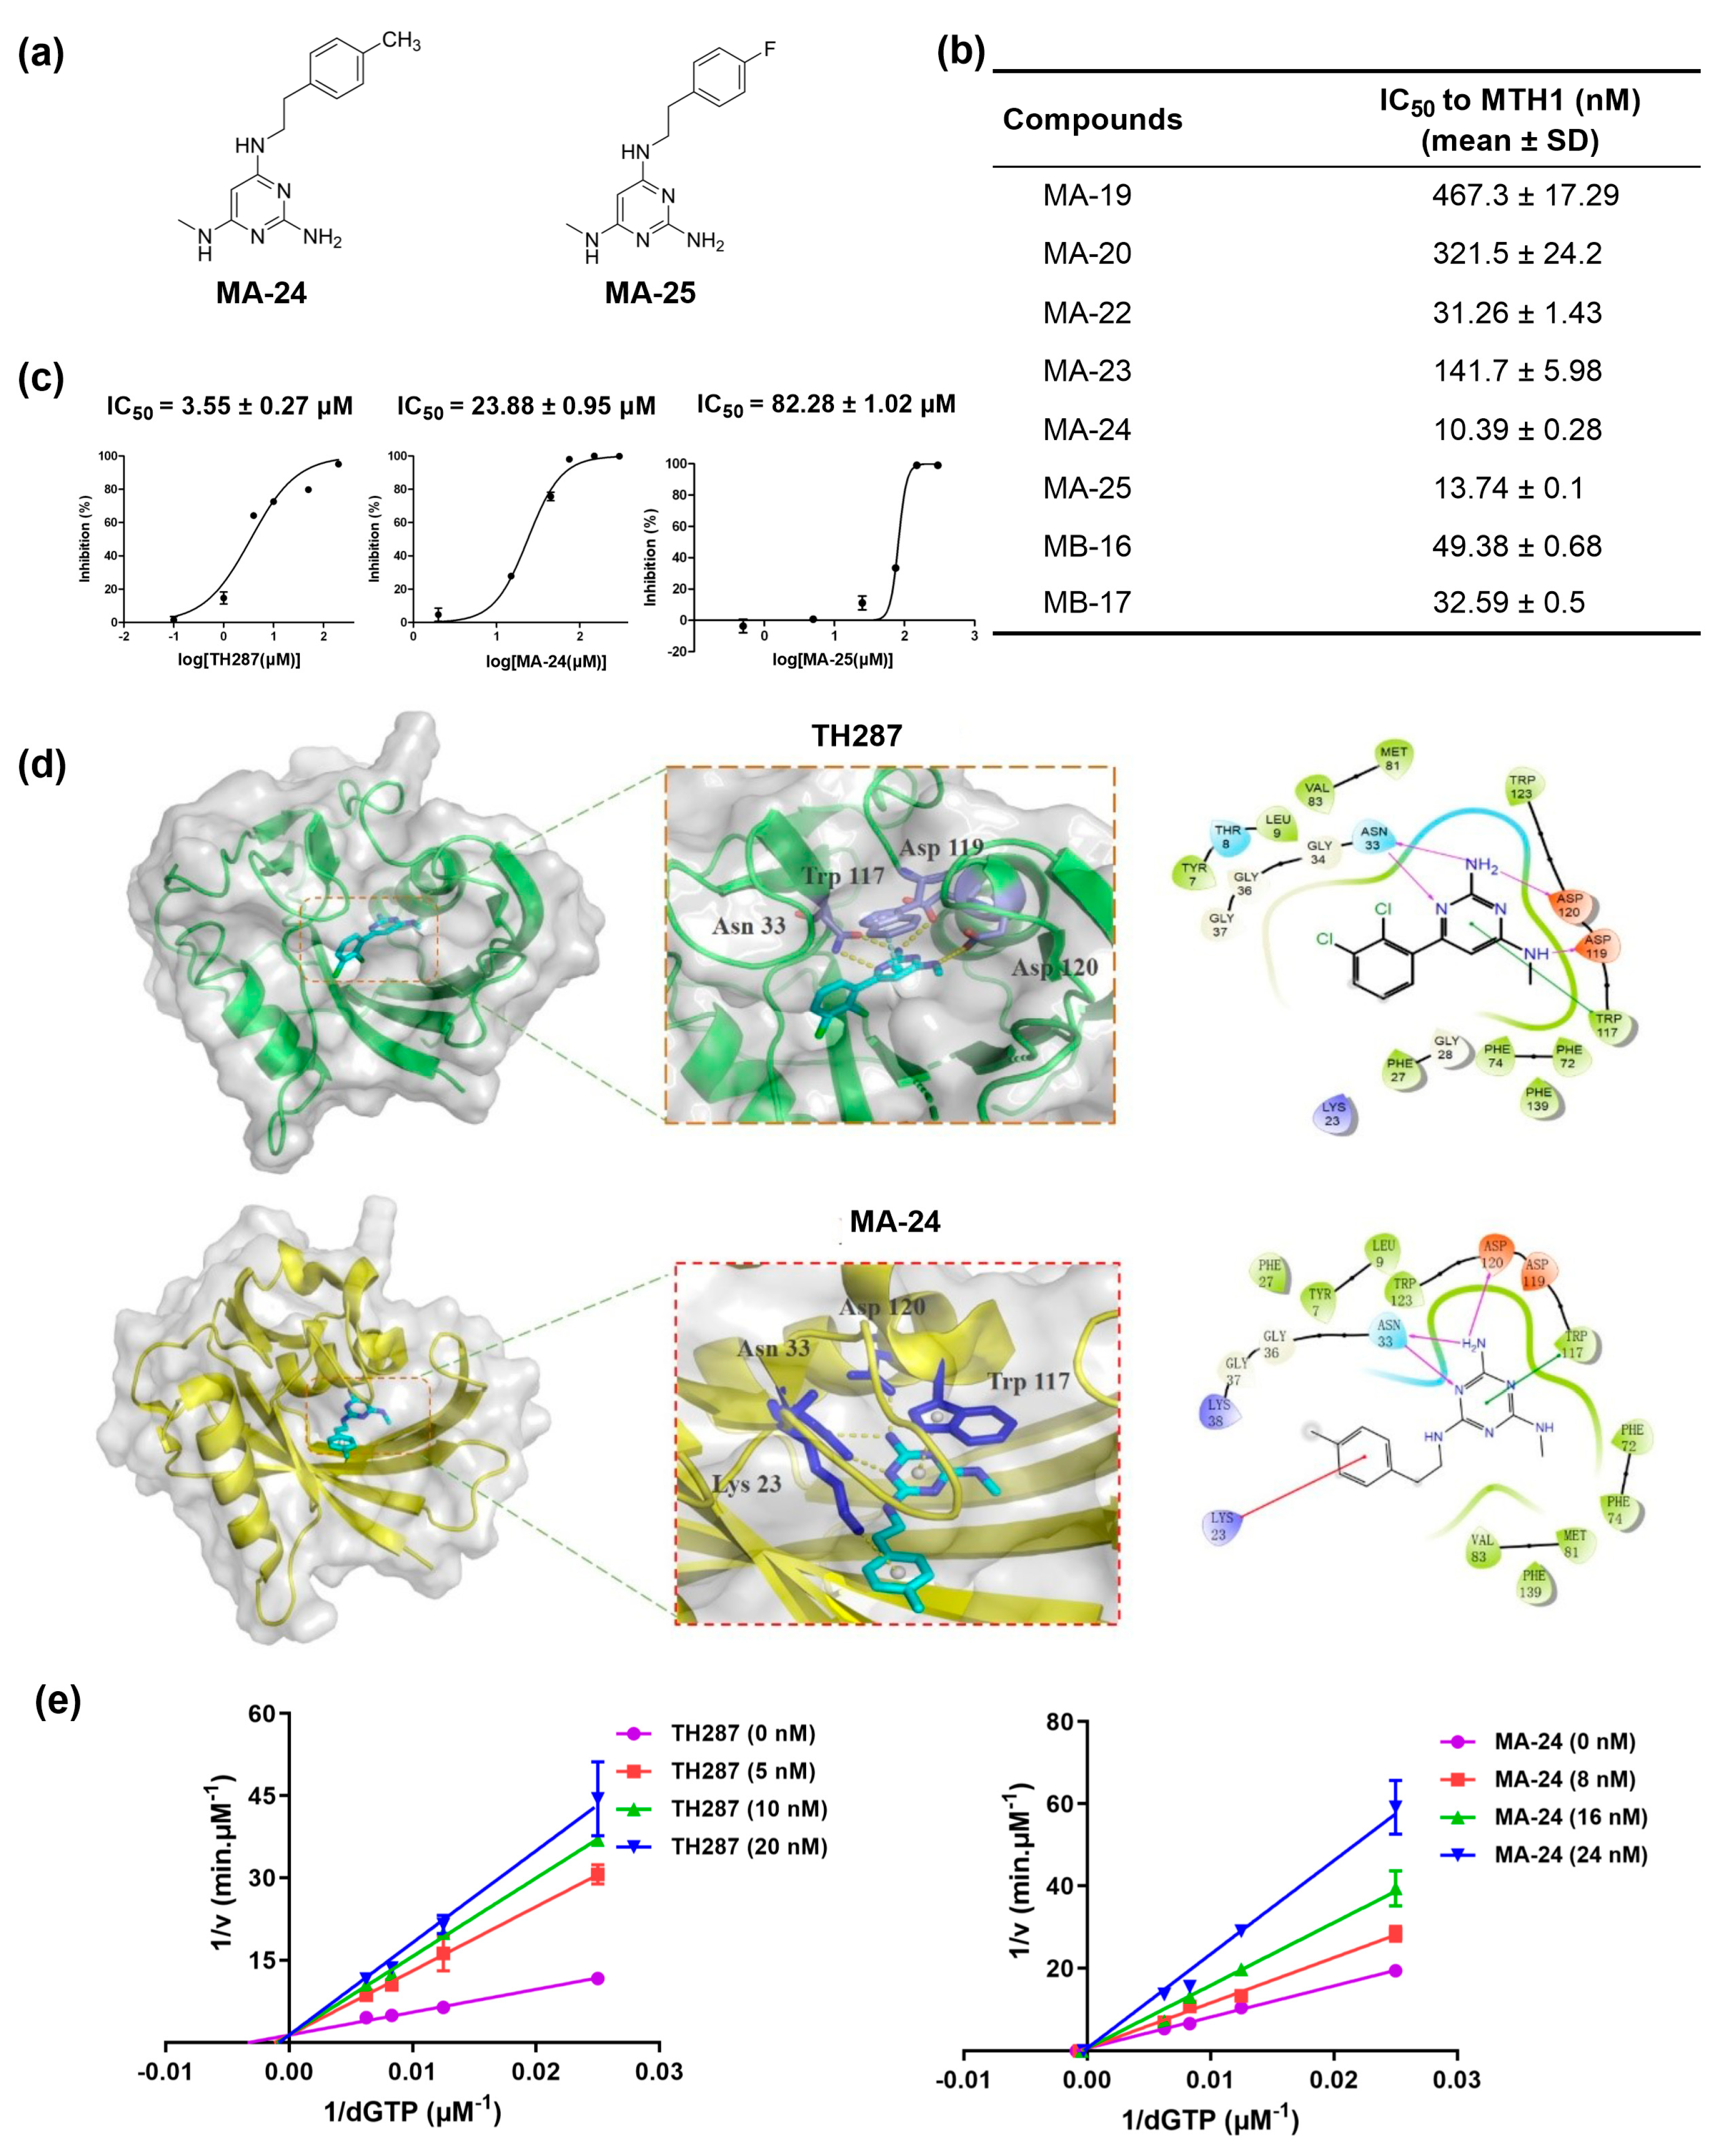
In vitro screening, protein-inhibitor molecular docking, and enzymatic characterization of MTH1 inhibitors. (a) Chemical structures of MA-24 and MA-25. (b) IC50 values (mean ± SD) of MA-19, MA-20, MA-22, MA-23, MA-24, MA-25, MA-16, and MB-17 against MTH1 enzyme determined by malachite green staining assay. (c) IC50 values (mean ± SD) of TH287, MA-24 and MA-25 against MCF-7 cell proliferation determined by MTT assay. (d) Binding mode of TH287 and MA-24 with MTH1 predicted by molecular docking using Schrödinger2009. The π−π stacking interactions are represented by cyan dash lines, π-cation interactions are represented by blue dash lines, and hydrogen-bonding interactions are represented by yellowish dash lines. (e) Kinetic analysis of TH287 and MA-24 inhibition of MTH1.
Figure 2.
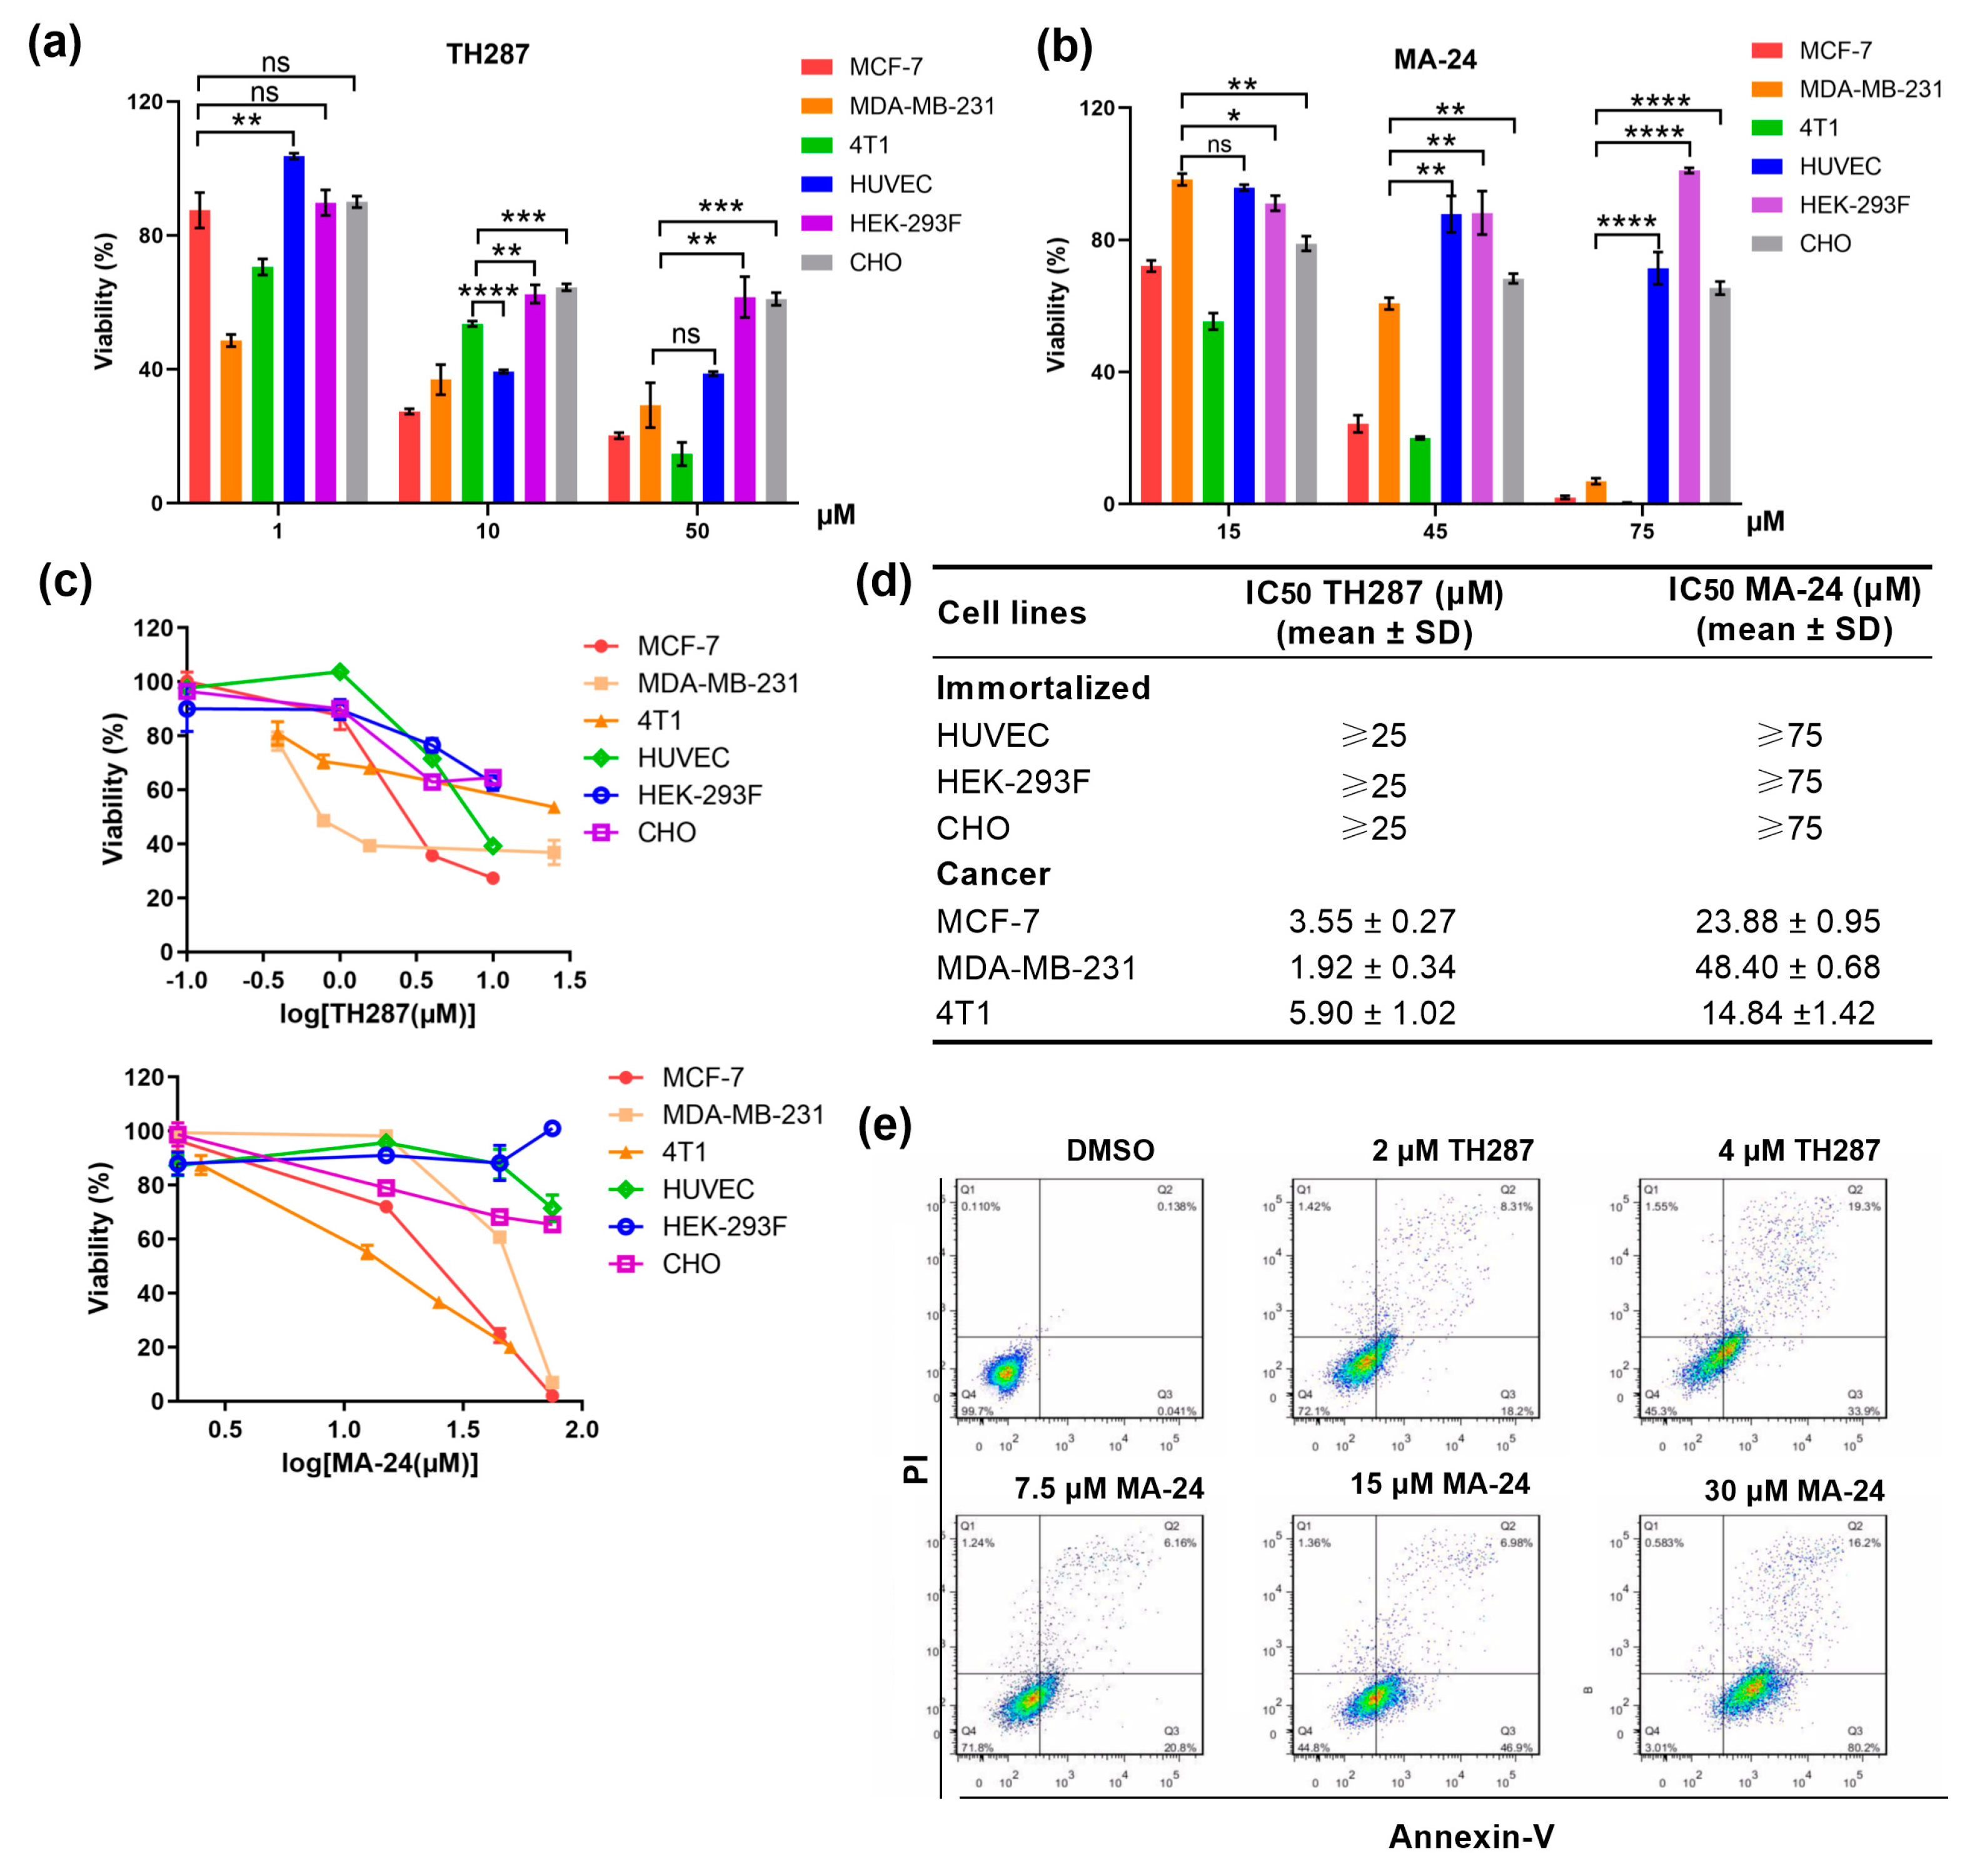
MTH1 inhibitor MA-24 reducing breast cancer cell viability and inducing apoptosis of MCF-7 cells. (a–c) Viability determined in breast cancer cell lines or immortalized cells after exposure to increasing concentrations of MTH1 inhibitors. **, p < 0.01; ***, p < 0.001; ****, p < 0.0001. t test. (d) Determination of the IC50 values (mean ± SD) of TH287 and MA-24 on normal cells and tumor cells proliferation using the MTT assay. (e) Induction of cell apoptosis in MCF-7 cells by TH287 and MA-24 evaluated using flow cytometry.
Figure 3.
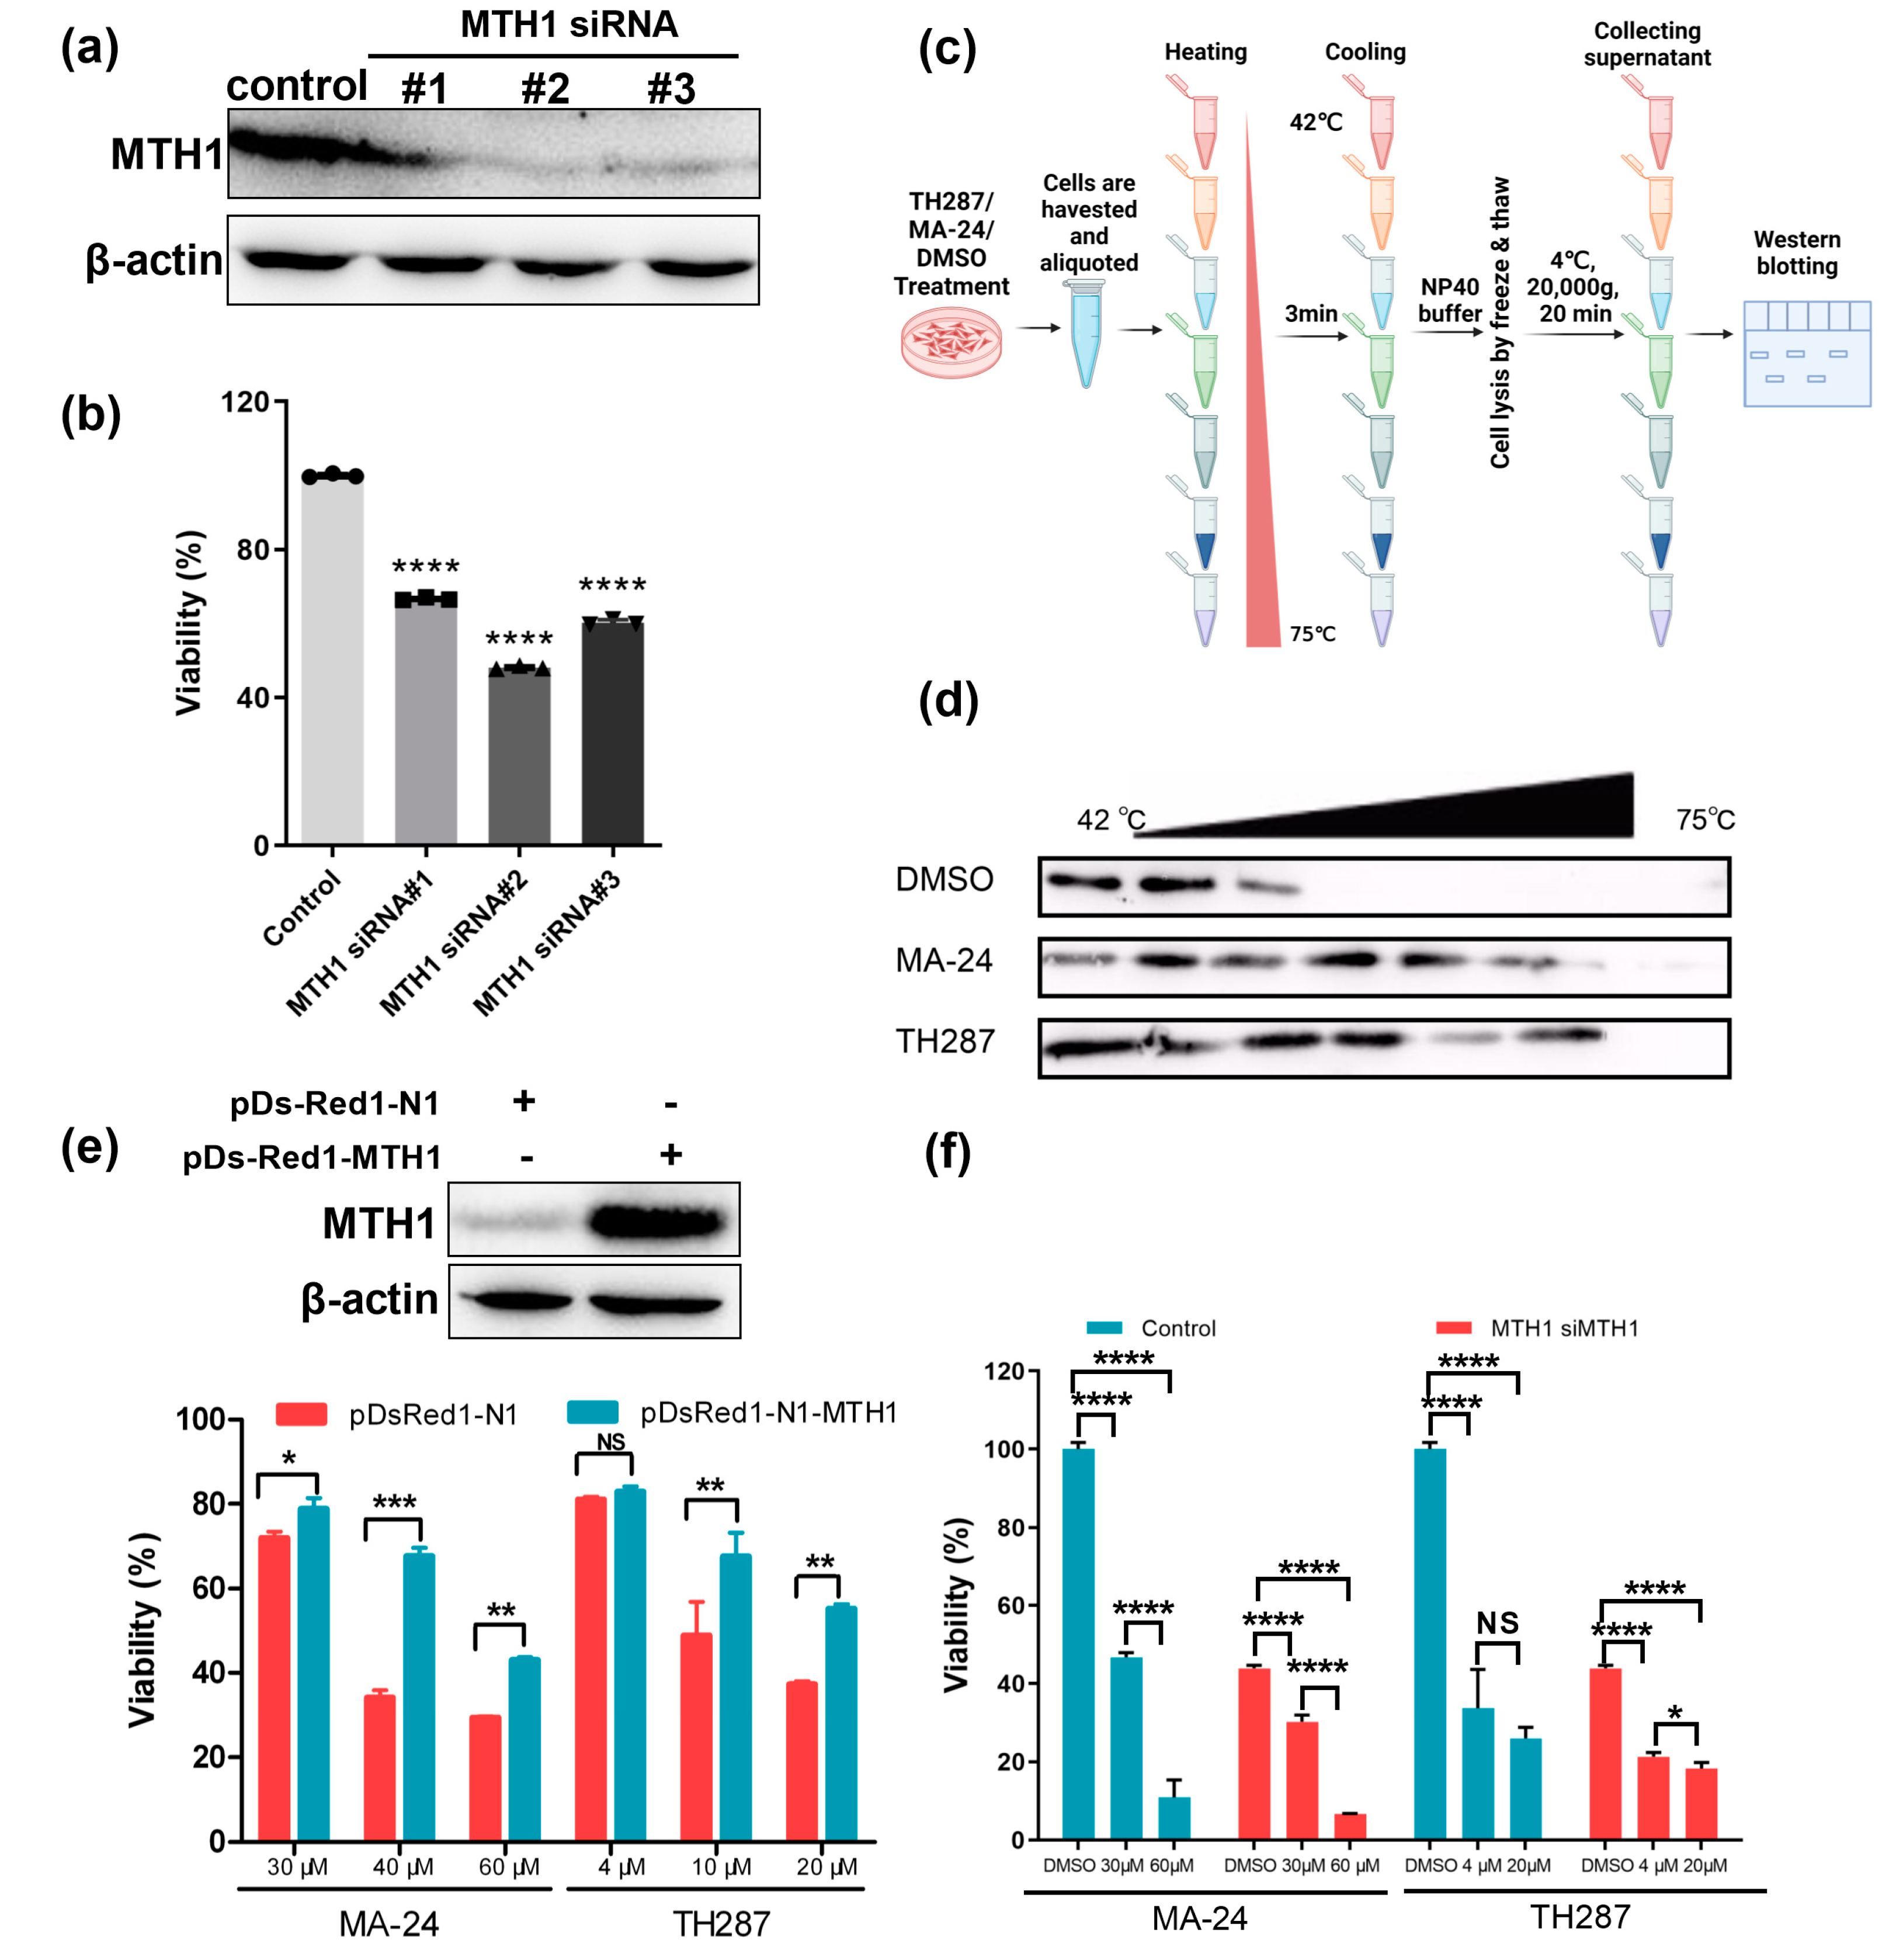
MTH1 as the target of MA-24 is a major determinant for the survival of cancer cells. (
a) Western blot analysis demonstrating MTH1 silencing using siRNA. (
b) MTT assay evaluating the impact of MTH1 silencing on the proliferation of MCF-7 cells.
****, p < 0.0001. t test. (
c) Schematic representation of the cellular thermal shift assay (CETSA) procedure, which is created using the BioRender website (
https://www.biorender.com/). (
d) CETSA results showing that both MA-24 and TH287 bind to MTH1 and increase the thermal stability of the MTH1 protein. (
e) Overexpression of MTH1 using pDs-Red1-MTH1 plasmid reverses the inhibitory effect of MTH1 inhibitors on the proliferation of MCF-7 cells.
*, p < 0.05; **, p < 0.01; ***, p < 0.001. t test. (
f) Under siRNA treatment, the inhibition of MTH1 intensifies the suppression of cellular viability.
*, p < 0.05; ****; p < 0.0001. t test.
Figure 4.
MA-24 promotes breast cancer cell death through multiple pathways. (a) Representative images and statistical results of comet assay in MCF-7 cells treated with DMSO (negative control), H2O2 (positive control), TH287, and MA-24. (Magnification: 20×). ****, p < 0.0001. t test. (b) MA-24 significantly increases the expression of apoptotic marker protein cleaved-PARP in a dose-dependent manner, which can be reversed by MTH1 overexpression. *, p < 0.05, **, p < 0.01, t test. (c) MA-24 significantly enhances the expression of cleaved caspase-3, while MTH1 overexpression elevates the cleaved-caspase 3 levels induced by MA-24 and TH287. *, p < 0.05; **, p < 0.01. t test. (d) High concentrations of MA-24 and TH287 significantly reduce the expression of p38, and increasing MTH1 expression partially restores the decreased levels of p38 protein. MA-24 significantly inhibits the expression of p-p38 protein, and this reduction can be reversed by MTH1 overexpression. *, p < 0.05; **, p < 0.01. t test.
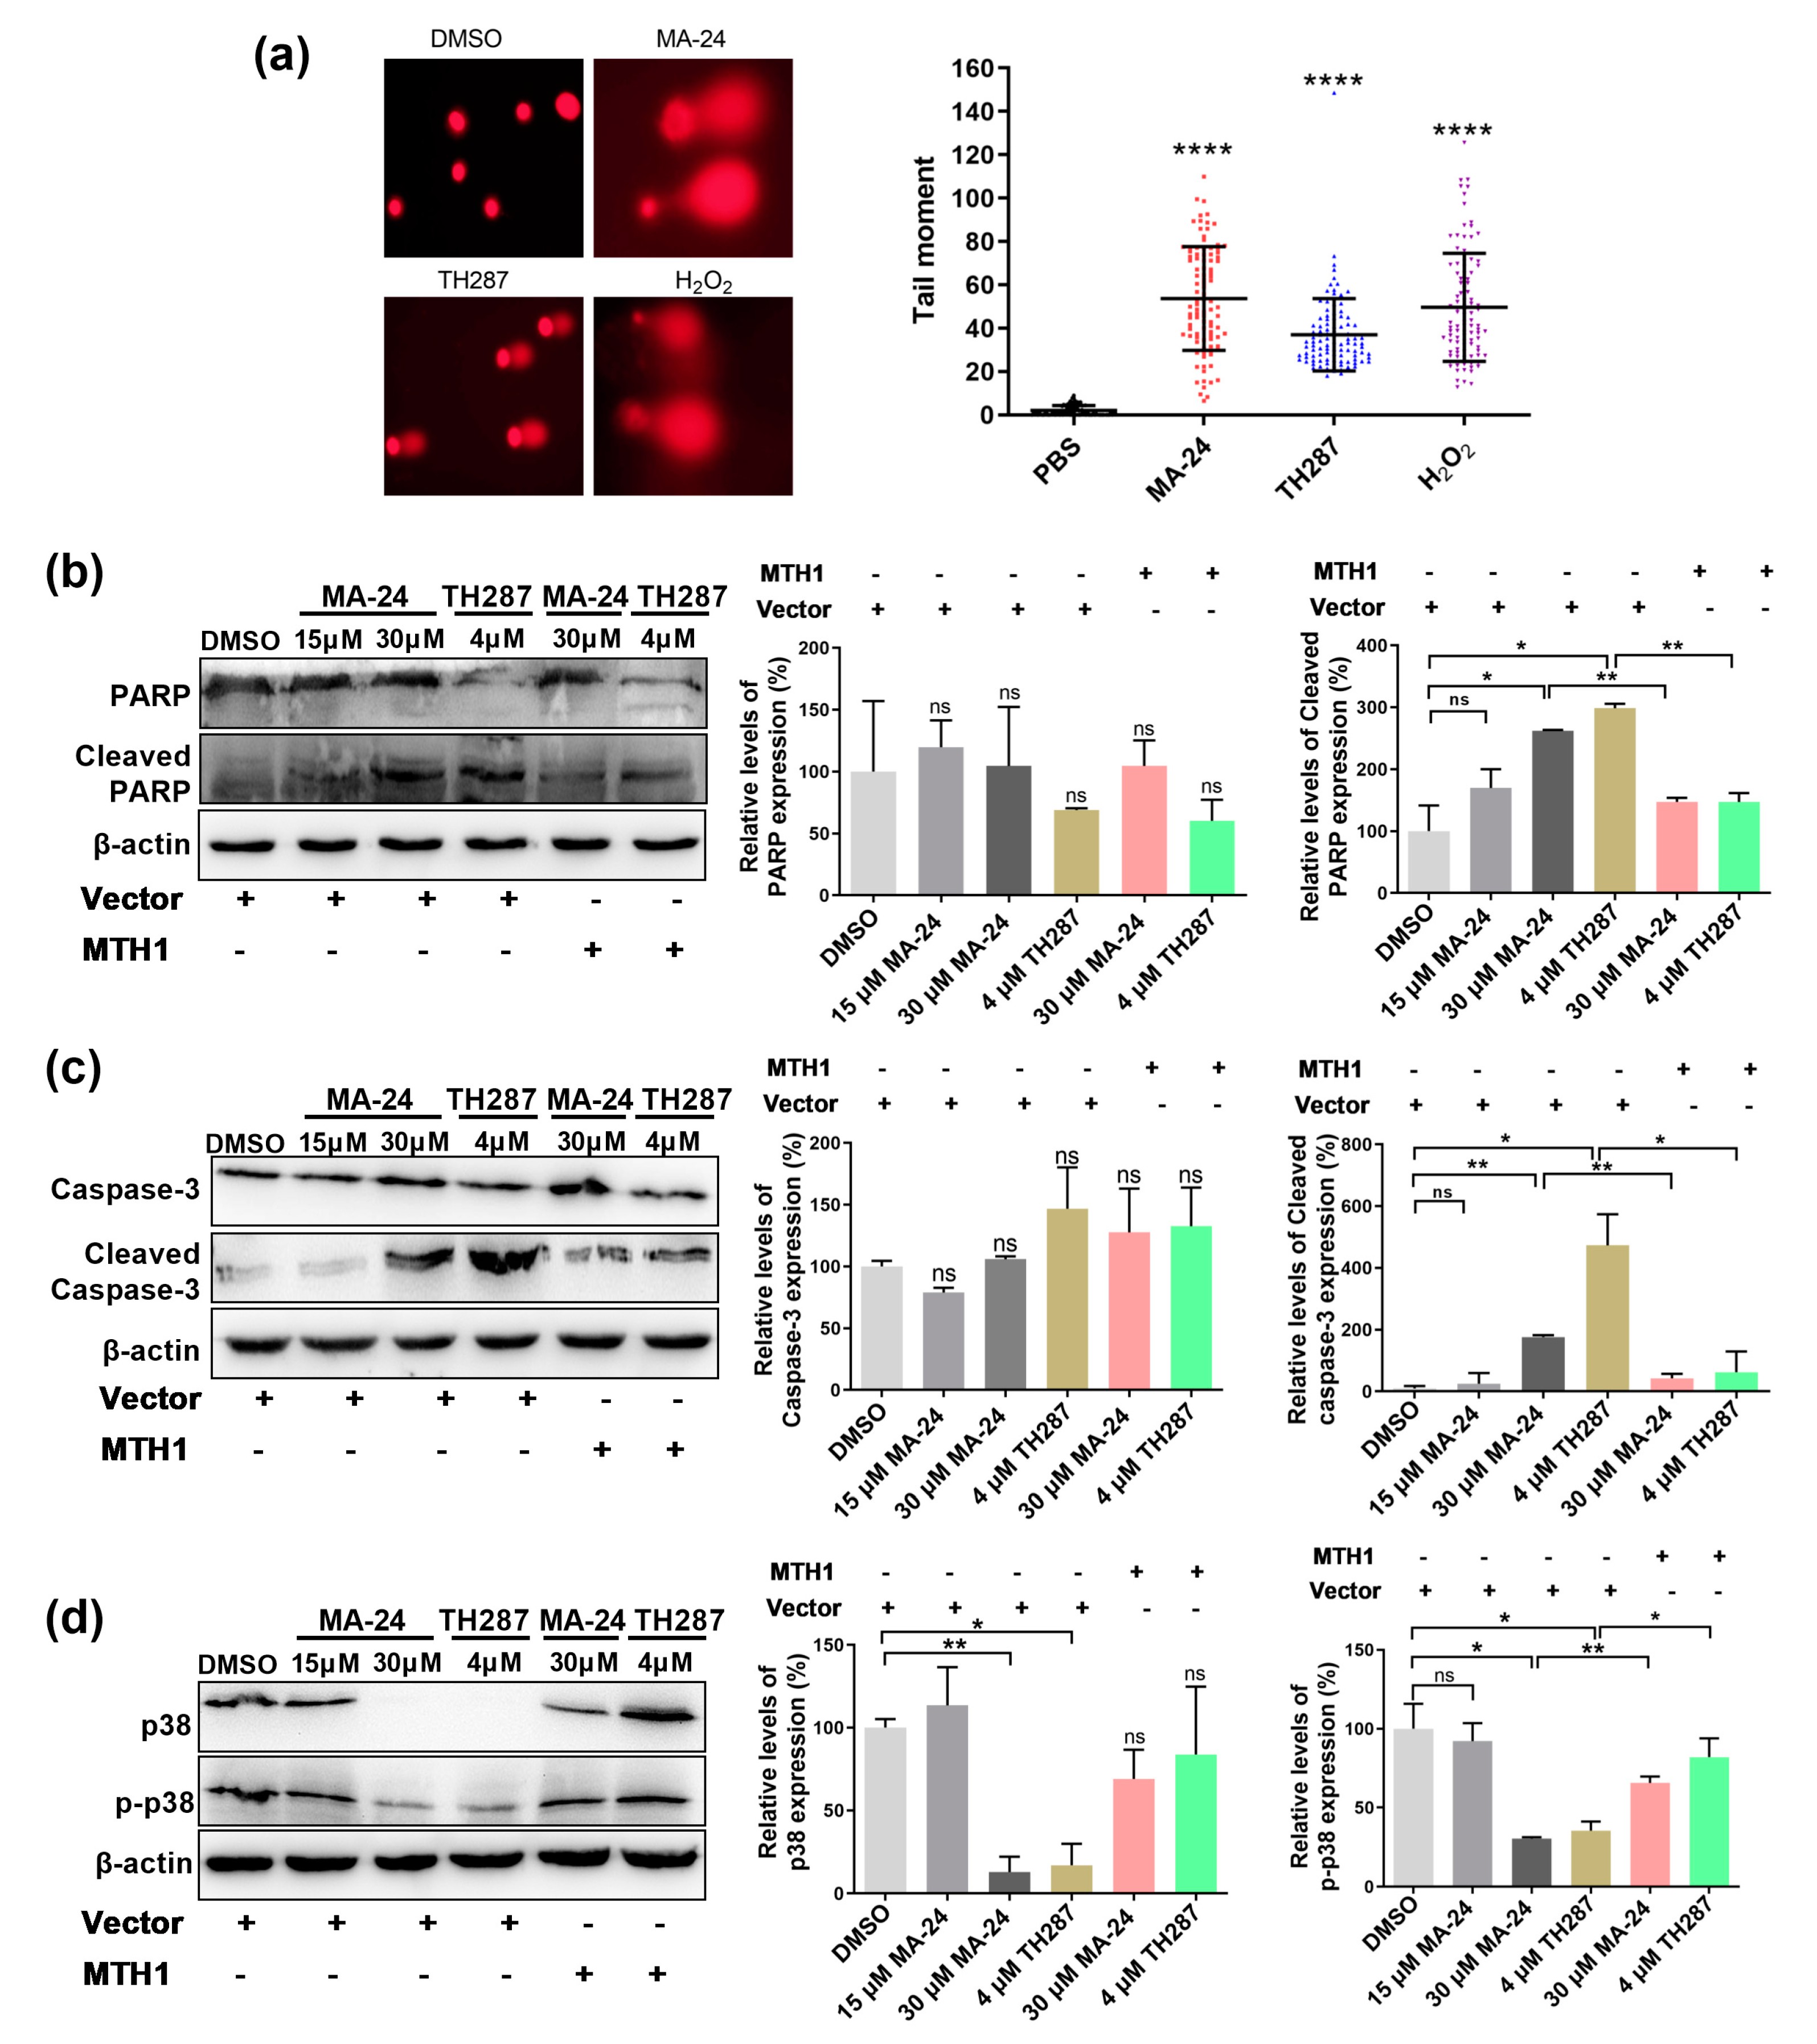
Figure 5.
MA-24 exhibits superior tumor-inhibiting and lung metastasis inhibiting abilities compared to the TH287 in vivo. (
a) Experimental design for animal studies. (
b) Tumor images in mice treated with vehicle control, 5-FU, TH287, and MA-24 after 18 days according to the experimental design. (
c) Tumor growth curves in mice treated with vehicle control, 5-FU, TH287, and MA-24. Tumor volume was calculated using the formula V = D1 (long axis) × D2
2 (short axis) × 0.52.
*, p < 0.05; ****, p < 0.0001. two-way ANOVA test. (
d) Tumor weights in mice treated with vehicle control, 5-FU, TH287, and MA-24.
***, p < 0.001. t test. (
e,
f) Representative images and statistical results of lung metastases in mice treated with vehicle control, 5-FU, TH287, and MA-24. The small nodules on lung tissues indicate tumor lung metastasis (Black arrow),
**, p < 0.01. t test. (
g) Body weight changes in mice treated with vehicle control, 5-FU, TH287, and MA-24.
****, p < 0.0001. t test. (
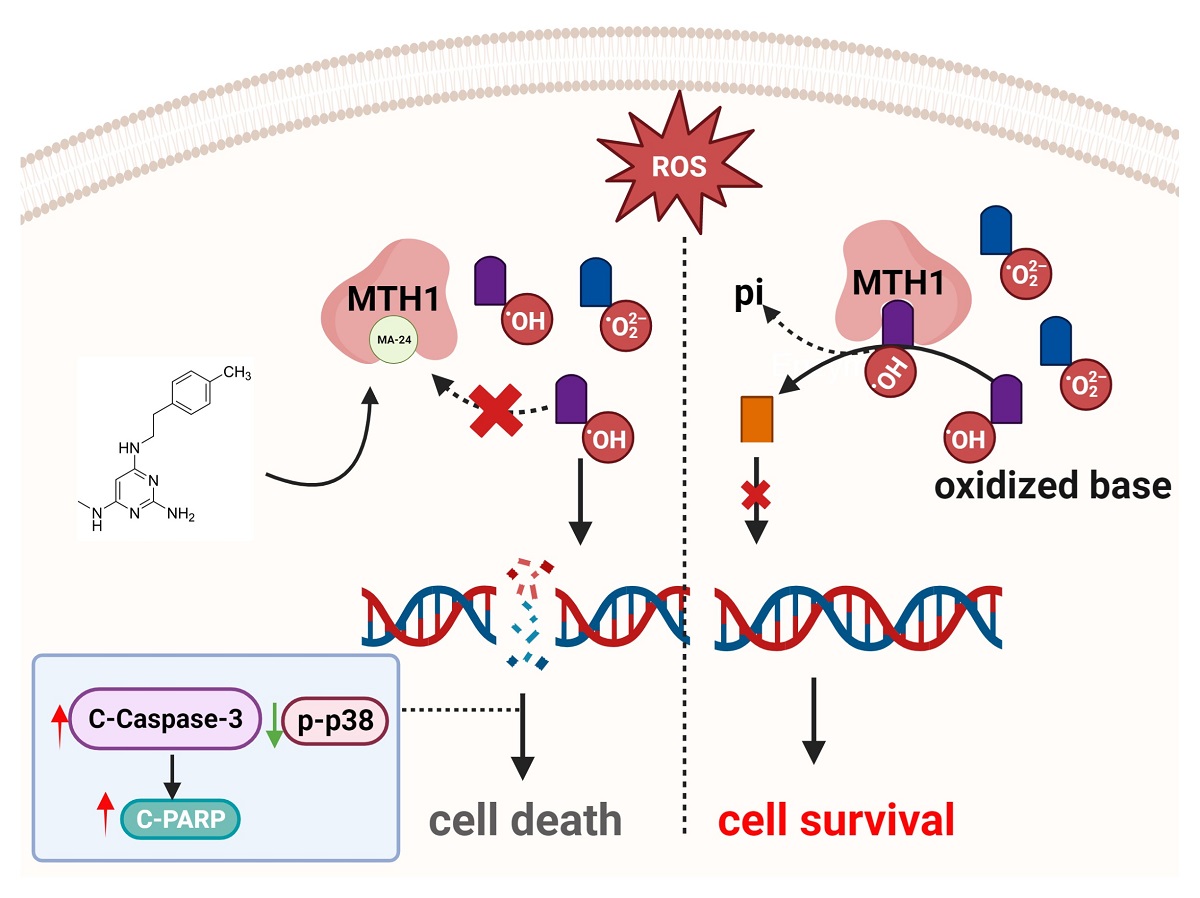
h), Graphical abstract of this study. In the tumor cell-generated microenvironment rich in reactive oxygen species, MA-24 competitively binds to oxidized bases, such as 8-oxo-dGTP or 2-OH-dATP, inhibiting MTH1 from dephosphorylating the oxidized bases and incorporating the oxidized bases into DNA double strands. This induction leads to cell apoptosis through a caspase-3/PARP-dependent pathway, ultimately achieving the goal of tumor suppression. This image was created using the BioRender website (
https://www.biorender.com/).
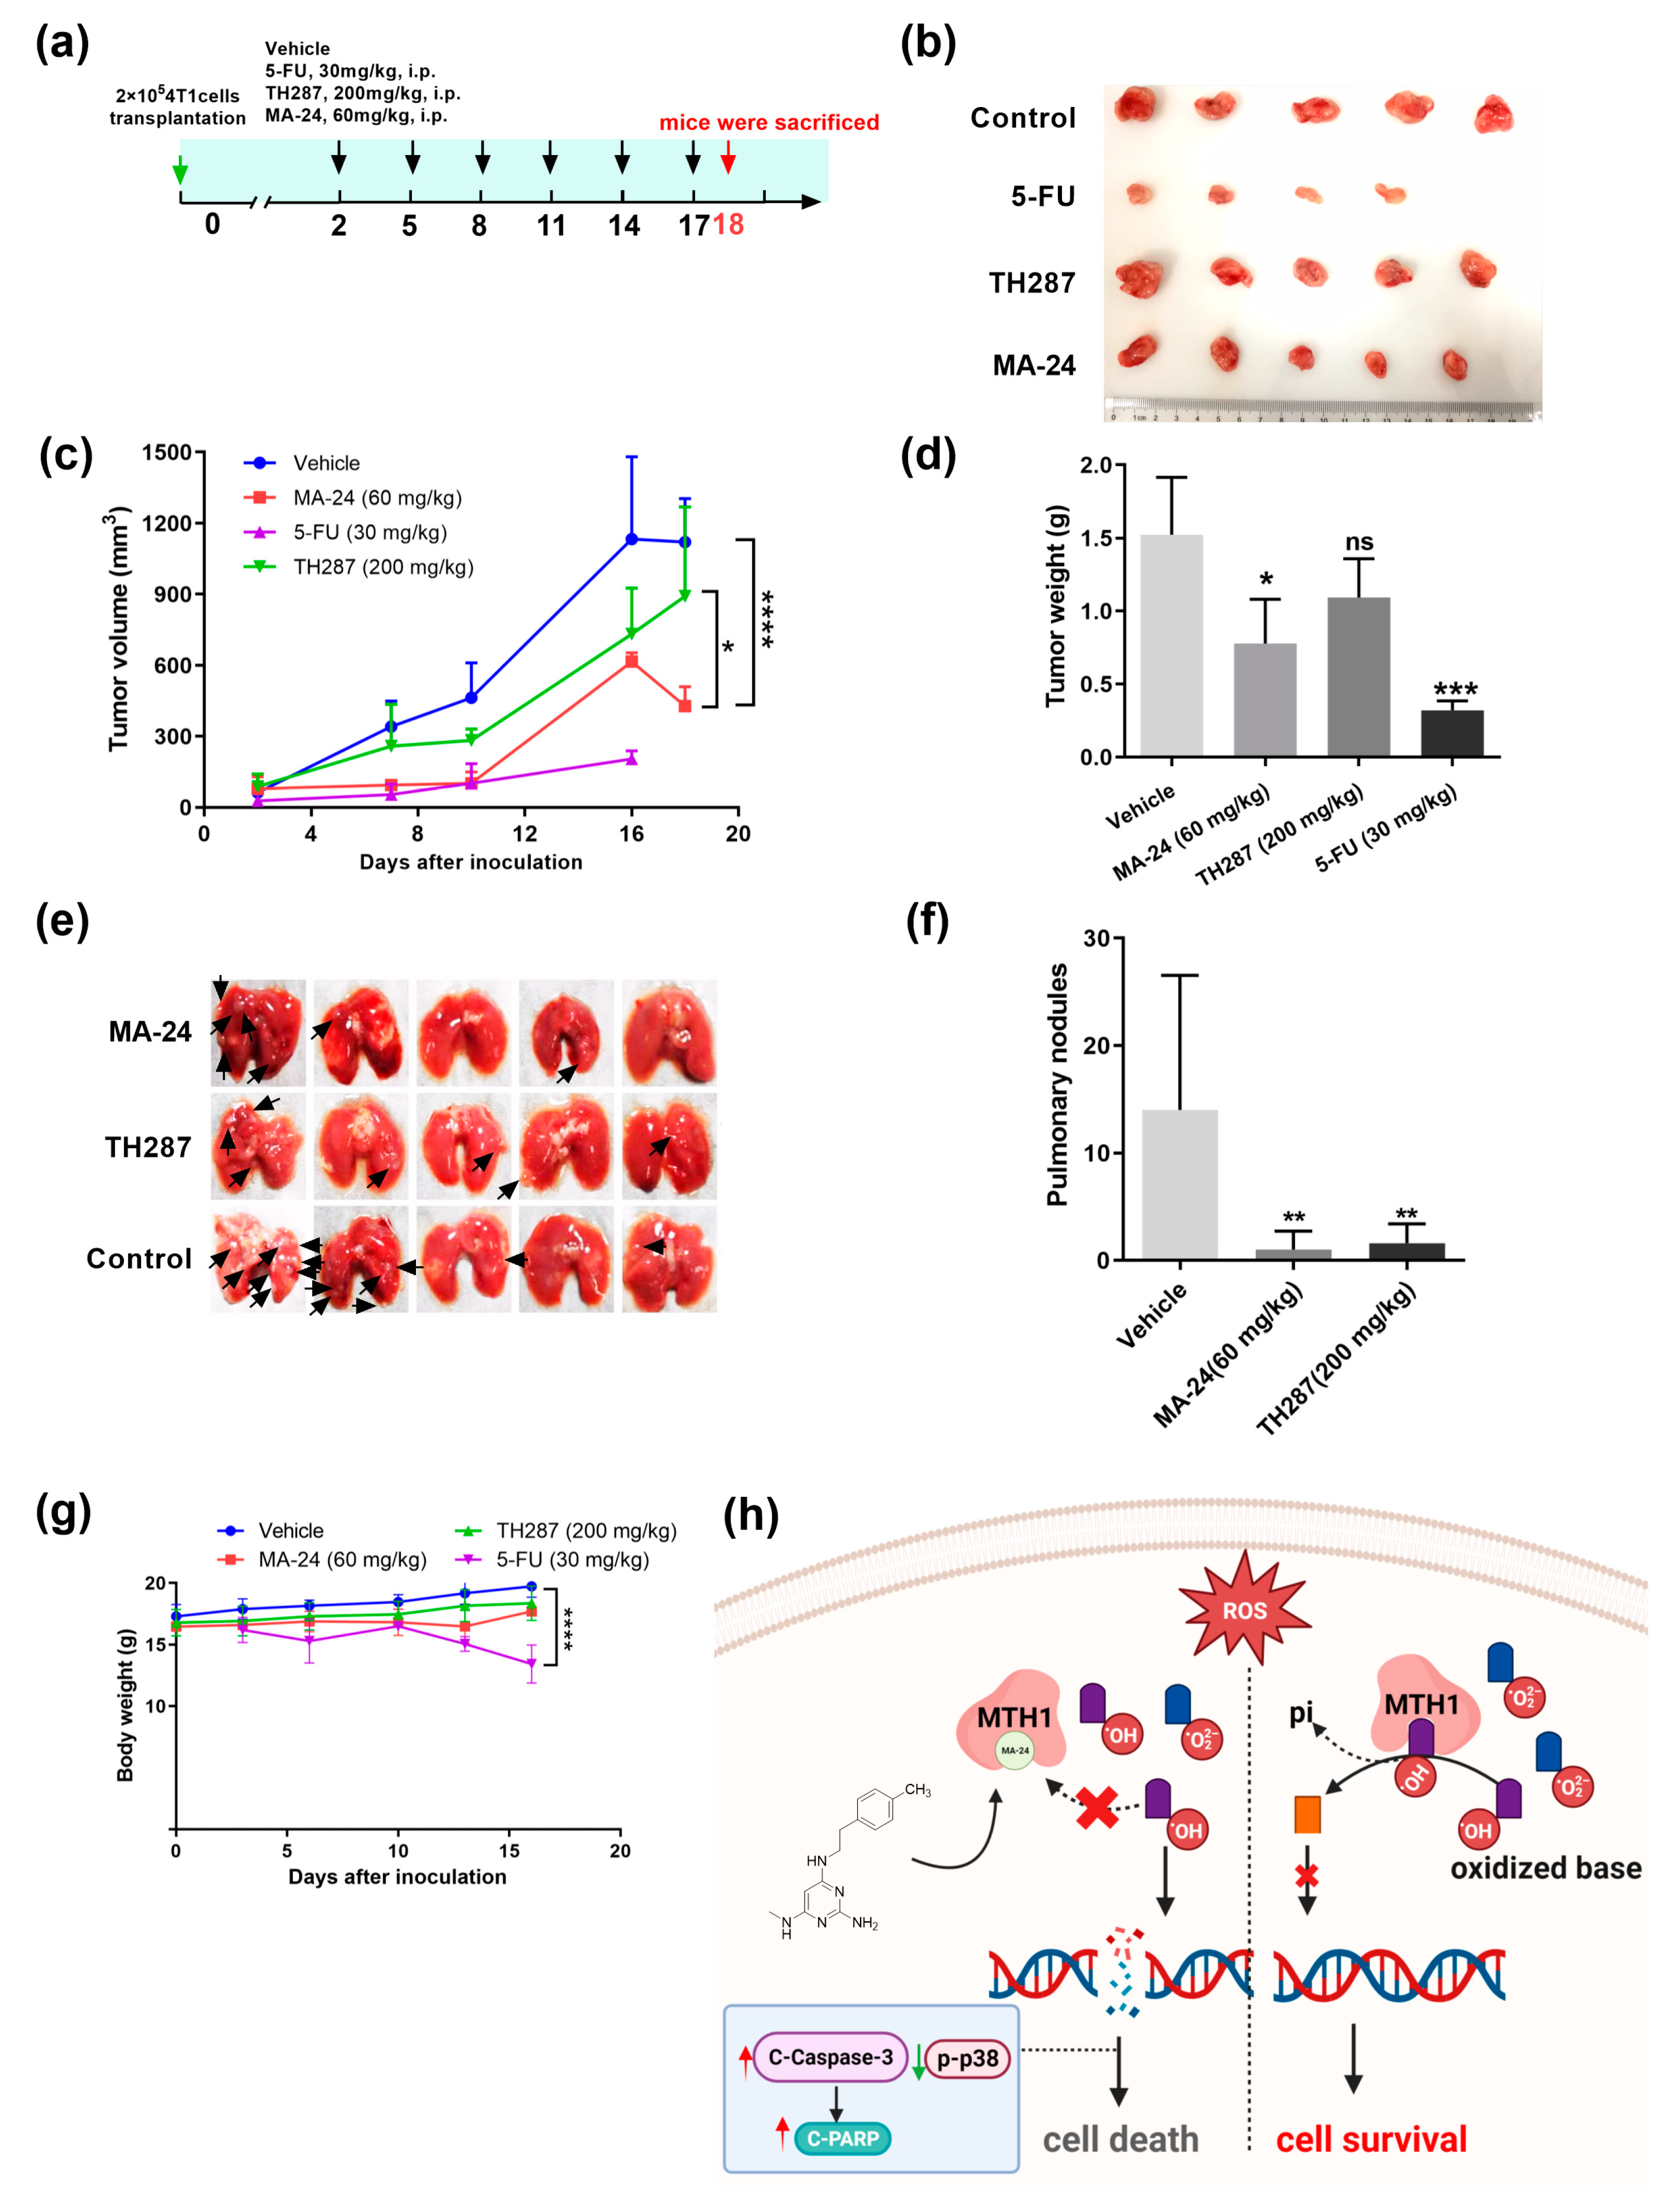
Table 1.
Compounds MA-19 - MA-25 and MB-16 - MB-17 were evaluated for their inhibitory effects on the proliferation of MCF-7 cells at concentration of 200 μM. The results demonstrated that MA-24 and MA-25 exhibited a close to 100% inhibition rate at the concentration of 200 μM.
Table 1.
Compounds MA-19 - MA-25 and MB-16 - MB-17 were evaluated for their inhibitory effects on the proliferation of MCF-7 cells at concentration of 200 μM. The results demonstrated that MA-24 and MA-25 exhibited a close to 100% inhibition rate at the concentration of 200 μM.
Compounds
(concentration: 200 μM) |
Inhibition (%)
(mean ± SD) |
| MA-19 |
37.8 ± 8.8 |
| MA-20 |
44.2 ± 8.4 |
| MA-21 |
28.1 ± 1.5 |
| MA-22 |
30.3 ± 4.1 |
| MA-23 |
11.8 ± 4.5 |
| MA-24 |
99.6 ± 0.4 |
| MA-25 |
100.0 ± 0.1 |
| MB-16 |
52.1 ± 2.9 |
| MB-17 |
27.3 ± 4.2 |
| MA-19 |
37.8 ± 8.8 |
