1. Introduction
Understanding the principles of fluid dynamics and their impact on drag is crucial to the design and function of cars (Acevedo-Giraldo et al., 2018). Since adopting gas-powered vehicles in the late 19th century, cars have become integral to our society (Forrester, 2020). They have increased mobility, reduced transportation barriers, and enhanced personal freedoms.
The optimization of vehicle aerodynamics plays a pivotal role in enhancing automotive efficiency, performance, and sustainability (Chen et al., 2021). As innovation drives the automotive industry, examining the intricate relationship between aerodynamic drag and vehicle design becomes paramount.
In recent years, the push for increased fuel efficiency and reduced carbon emissions has spurred remarkable advancements in automotive engineering (Sivaraj et al., 2023). Aerodynamic drag is a critical consideration among the various factors influencing a vehicle's overall efficiency (Nath et al., 2021). About 50-60% of the fuel is burned to overcome drag, so reducing the drag coefficient is paramount for design sustainability (Hassan et al., 2014). The drag force exerted on a moving vehicle is substantially impacted by its body design and shape, making it a prime target for optimization (Zhang et al., 2012).
1.1. Methods of Calculating Drag Force in Cars
In the pursuit of enhancing vehicle efficiency and performance, researchers and engineers have developed various methods to calculate the drag on automobiles. Below are a few approaches to analyze and minimize drag coefficients in car design.
1.1.1. Wind Tunnel Facility
Wind tunnel testing remains a cornerstone of aerodynamic research. Such testing provides a controlled environment for accurately measuring the drag coefficients of different vehicle models (Icingur & Solmaz, 2011). Wind tunnels use large fans to direct air at cars in a closed environment. Drag, lift, and various other elements are measured using sensitive scales (Sherman, 2014). Wind tunnel testing’s main limitation is that it can be resource-intensive and restrictive (Desai et al., 2008).
1.1.2. Computational Fluid Dynamics
Computational Fluid Dynamics (CFD) is an innovation that is 70+ years old, developed in the 1950s, that has revolutionized the analysis of the drag forces (Fu et al., 2020). CFD was popularized with ANSYS Fluent software in the late 1970s and with many other packages thereafter. It calculates fluid flow around objects, including vehicles, by solving complex mathematical equations governing fluid behavior (van Wachem & Almstedt, 2003). In calculating vehicle drag coefficients, CFD offers an invaluable virtual testing ground. CFD predicts aerodynamic forces by simulating airflow over vehicle surfaces, enabling researchers to quantify drag precisely.
CFD is one of the most commonly used techniques for analyzing vehicle drag because of its accuracy (especially for comparative tests) and cost efficiency (Vinuesa & Brunton, 2022). Unlike wind tunnel testing, CFD does not require physical cars or models to be built. Instead, it relies on virtual 2D or 3D models.
Specifically, CFD’s simulation-based approach employs complex mathematical models and high-performance computing to numerically solve the Navier-Stokes equations governing fluid flow around a vehicle. By partitioning the vehicle's surface into discrete elements, CFD simulations offer detailed insights into the distribution of drag forces, pressure gradients, and flow patterns. This method's adaptability to various conditions, geometries, and environmental factors makes it a versatile and efficient choice for modern vehicle aerodynamic analysis.
Regarding limitations, computational fluid dynamics relies on certain approximations that cause small margins of error between the predicted and actual results. CFD is ideal for comparative studies such as this one, in which we examine the relative differences between two designs since the error margins cancel out.
Incorporating CFD into drag coefficient calculations reduces the need for expensive physical prototypes and accelerates the design optimization process. Engineers can explore innovative design modifications virtually and pursue ideas based on simulation feedback.
1.2. Impact of Car Design on Drag
The design of a car significantly influences its aerodynamic performance and resultant drag. Factors such as body shape, surface contours, and the arrangement of components play crucial roles in determining a vehicle's drag coefficient (Singh et al., 2020). As a vehicle moves through the surrounding air, it encounters resistance in the form of drag, which directly affects fuel efficiency and overall performance (Nath et al., 2021).
A car’s design features are paramount in shaping its aerodynamic profile. Factors such as the body's curvature, the windshield's inclination, and the arrangement of side mirrors all contribute to how air flows over and around the vehicle. An aerodynamically efficient design aims to minimize turbulence, pressure differentials, and separation points that can elevate drag forces. By analyzing the geometric intricacies that impact airflow, engineers can strategically refine design elements to foster smoother airflow and reduce drag. The net effect is enhanced performance and fuel economy.
1.3. Car Variations
1.3.1. Types of Cars
After decades of innovation, the automotive landscape has become richly diverse, with various types of vehicles tailored to meet distinct performance, functionality, and aesthetic requirements. Vehicle categories are meticulously engineered to excel in specific domains, resulting in unique design and optimization strategies.
Sports cars: Sports cars epitomize speed, agility, and exhilaration, meticulously designed for exceptional performance. Their aerodynamic profiles, powerful engines, and lightweight construction prioritize driving pleasure and style, even at the expense of practicality and space (Khan & Manarvi, n.d.).
Racing cars: Racing cars are meticulously engineered for competitive motorsport events, striving for peak speed, cornering prowess, and track stability. Aerodynamics are central, with intricate body contours and wings for high-speed downforce, supported by lightweight construction, advanced suspension systems, and robust materials to endure the demands of racing (Susca et al., 2000).
Passenger Cars: Passenger cars, ubiquitous and diverse, are designed for everyday transportation, emphasizing comfort, efficiency, and safety. Their aerodynamics aim to improve fuel economy through streamlined profiles, while advanced technology enhances convenience, connectivity, and a smooth ride for a wide range of consumers (Mijailović, 2013).
SUVs (Sports Utility Vehicles): SUVs merge car comfort with off-road capability, emphasizing space and versatility while often tackling rough terrain. Despite the importance of aerodynamics for efficiency, SUVs prioritize ground clearance, robust suspension, and, occasionally, four-wheel drive (Sekine et al., 2008).
Luxury Cars: Luxury cars offer opulence, advanced tech, and refined performance, focusing on comfort and lavish interiors. Despite aerodynamics maintaining sleek profiles, these cars feature high-performance engines, advanced suspension, and cutting-edge entertainment and safety tech (Kim et al., 2009).
Understanding these distinctions offers insight into the intricate design choices and engineering strategies that define each category, ultimately shaping the diverse spectrum of vehicles on the road today.
1.3.2. Cars Used in this Study
We focused on consumer passenger cars seen in nearly any parking lot. These cars balance affordability, practicality, and performance, making them a quintessential choice for many drivers. Specifically, we will look at the 2023 Toyota Corolla, Hyundai Elantra, and Kia Soul models.
The Toyota Corolla and Hyundai Elantra are both sedan-style passenger cars that look very similar from the outside. Both vehicles are low to the ground and appear to optimize efficiency over spaciousness. The Kia Soul is a subcompact SUV that has a much different style than the other two. Hyundai is the parent company of Kia, so the Kia Soul and Hyundai Elantra share the same engine (Lee & Cho, n.d.).
1.4. Knowledge Gap
In modern day, even well-educated people do not always seem to understand why cars are designed the way that they are. While it’s true that perhaps they generally recognize the sleek design of racing cars and trucks for improved aerodynamics, many do so only superficially. Indeed, many consumers still buy and drive the boxy (squarish) cars—Kia Soul, Jeep Wrangler, Range Rover, Honda Element, and others—clearly demonstrating their lack of deep understanding of the role the sleek-vs-boxy design plays on the drag characteristics, gas mileage, and carbon footprint of a car (and, ultimately, on its effect on global warming). Thoughtful vehicle designs and, especially, their thoughtful choices by the consumers are thus crucial for reducing the significant 20% contribution of the automotive sector to greenhouse gas emissions in the USA (Safdie, 2023). Hence, educating the consumers in fluid mechanics is fundamental to achieving this goal.
Additionally, consumers predominantly perceive electric vehicles as environmentally friendly, seriously underestimating their impact. The production of an electric car battery alone contributes on average 7 tons of carbon dioxide (McKinsey & Company, 2023) but may contribute even up to 16 tons (Moseman and Paltsev, 2022). Moreover, given that over 60% of electricity in the United States is generated from fossil fuels (US EIA, 2023), electric cars are not yet emission-free in this country and may have a greater carbon footprint than hybrid cars (Moseman and Paltsev, 2022).
The lack of understanding of the role the sleek-vs-boxy design plays on the carbon footprint of a car parallels the likely biggest embarrassments of the US government caused by a failure of its liberal-arts-educated clerks to study fluid mechanics. As documented by Barenblatt (1987, pp. 41-44) and Taylor (1950ab), in order to intimidate the Soviet Union, the US government directed its clerks to release to the public the movie (Mack, 1947) of the 1945 atomic bomb (Trinity) explosion in New Mexico while simultaneously keeping the level of the released energy classified as top secret. Had the clerks had any background in fluid mechanics and its inseparable dimensional analysis, they would have immediately known that making the movie public would automatically disclose the data necessary for estimating the released energy (1021 ergs), as was painfully and embarrassingly demonstrated by the British fluid dynamicist, Sir Geoffrey Taylor (Taylor, 1950ab).
In summary, the misconceptions of principles of fluid mechanics and intuition related to problems such as drag forces on cars, their efficiency, and dimensional analysis represent the “gap in common knowledge.” The stories discussed above illustrate this gap and beg the question of whether or not basic fluid mechanics should be a part of not just STEM but also liberal-arts college education. We are offering our study as an affirmative answer to this question.
1.5. Goals and Thesis
This study analyzes the drag coefficients of three vehicles that are common to our urban landscape: Toyota Corolla, Hyundai Elantra, and Kia Soul. A limited number of studies look at the aerodynamic forces on different brands or styles of cars. Even fewer do so using computational fluid dynamics and ANSYS Fluent. We aim to bridge a gap in the understanding of why passenger cars look the way they do. Analyzing drag coefficients of typical vehicle types contributes to our comprehension of aerodynamics and offers insights into the design of more fuel-efficient and environmentally friendly automobiles. Through our comparative analysis, we aim to uncover how these vehicles' designs impact their aerodynamic efficiency and, consequently, their overall performance on the road. This study will allow engineers to design more efficient cars and consumers to make more informed choices about vehicle trade-offs.
Our study also offers insights into the broader engineering considerations for vehicle designs. Many car brands share similar design features with the Toyota Corolla and Hyundai Elantra, whereas the Kia Soul's design is uncommon in other brands. Are cars like the Toyota Corolla and Hyundai Elantra designed off of each other, or have they been created with aerodynamic efficiency in mind?
2. Theory
Fluid dynamics is the branch of physics that studies how fluids (in this case, air) move and interact with forces in various situations (Wang & Kabala, 2022). For an incompressible fluid, the governing equations are the Navier-Stokes equation and the continuity equation (Kleinstreuer, 2009).
The Navier-Stokes equations (Garvin, 2023) dictate the flow of motion according to Newton’s Second Law. They are as follows:

where ρ is the fluid density and u is the fluid velocity vector. Eq 1. is the Navier-Stokes equation (for moment evolution) and Eq. 2 is the continuity equation (for conservation of mass). These equations form the basis of the computational fluid dynamics performed by the ANSYS Fluent software in this study.
3. Materials and Methods
For this study, we used ANSYS Fluent to analyze the drag force on three unique car models. ANSYS Fluent simulations intricately consider factors such as air viscosity, pressure distribution, and turbulence, providing insights into how design alterations impact drag (González & Hinojosa, 2019).
ANSYS Fluent is a well-established program used since the 1980s to perform CFD on digital models, replicating real-world conditions in a computer-based environment (Lanzafame et al., 2016) (Ansys, n.d.). It has been used in several peer-reviewed studies to calculate the drag of motor vehicles, airplanes, etc. (S et al., 2019) (Czyż et al., 2018).
ANSYS Fluent was used to perform CFD on the 2D side profile of the car, as that shows the vehicle's unique shape. The cars look primarily flat from the top and front view, so these profiles are less relevant.
3.1. Modeling the Vehicles
For this study, we considered the 2D side view of each of the Toyota Corolla, Hyundai Elantra, and Kia Soul to model the drag coefficient of these cars. The models are based on photographs taken of the side view of each car (see
Figure 1). Note that some images have been flipped so the cars face the same direction. We used Adobe Photoshop to clean up the car images, removing any backgrounds and shadows. Adobe Illustrator was then used to compress the images into a single vector that shows the outline of the car and removes unnecessary details (see
Figure 2).
3.2. Importing the Models
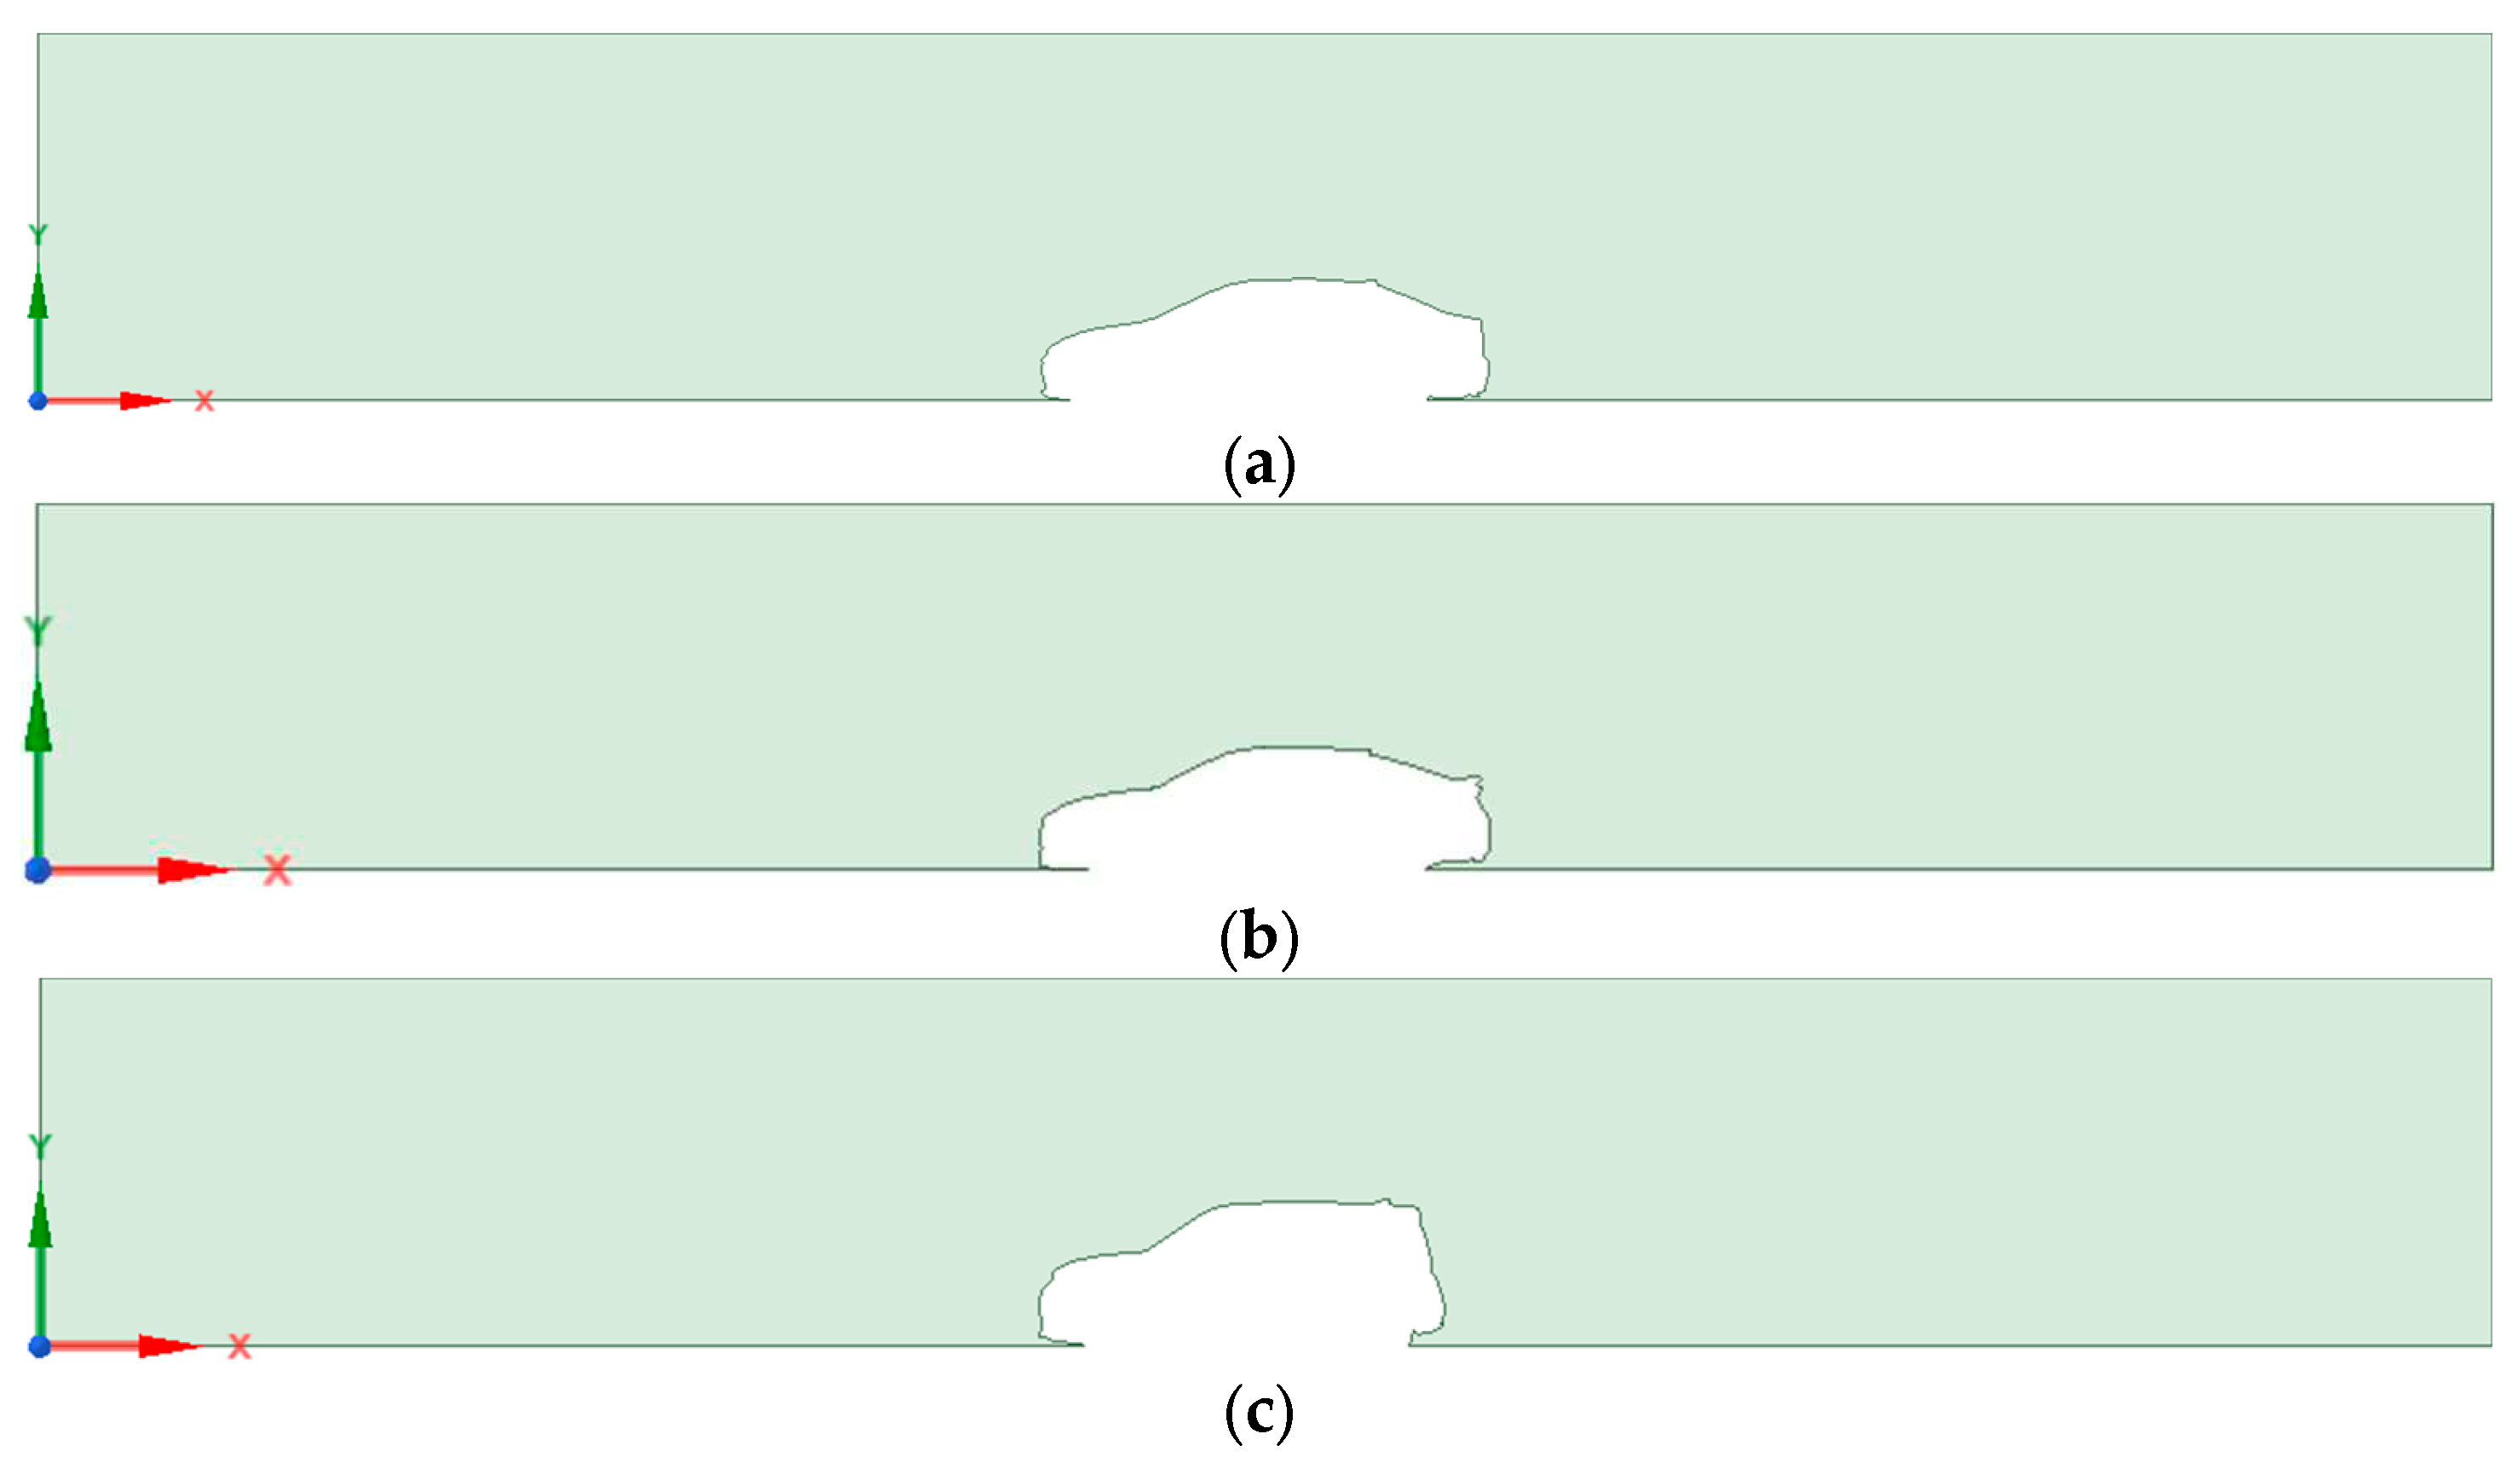
Using ANSYS SpaceClaim, we imported the vector images created in Adobe Illustrator and created 2D curves of the cars. We placed these curves into a box with the dimensions 150 in (height) x 1000in (width), as shown below in
Figure 3 (Nature, 2021). We placed these curves in the center lengthwise of the box. To simplify the fluid analysis, we removed the car's wheels and set the car as if the wheels did not exist.
3.3. Computational Fluid Dynamics (CFD) and Computational Setup
Computational fluid dynamics (CFD) stands as a branch of fluid dynamics dedicated to employing numerical simulations for the analysis and portrayal of fluid movement, and its interactions with solid objects. Using a numerical solver allows us to deduce accurate and intricate descriptions of fluid behavior by solving the Navier-Stokes and continuity equations (Felekos et al., 2022). Within this investigation, we harness a CFD solver to scrutinize the flow around a computer-generated two-dimensional car model. To effectively capture the airflow around vehicles, we opt for the widely accepted standard k-epsilon turbulence model with enhanced wall treatment (Zaïdi et al., 2010) (Nature, 2021).
For our study, we used ANSYS Fluent Fluid Flow, containing a new formulation for the turbulent viscosity, to increase the accuracy of projections (
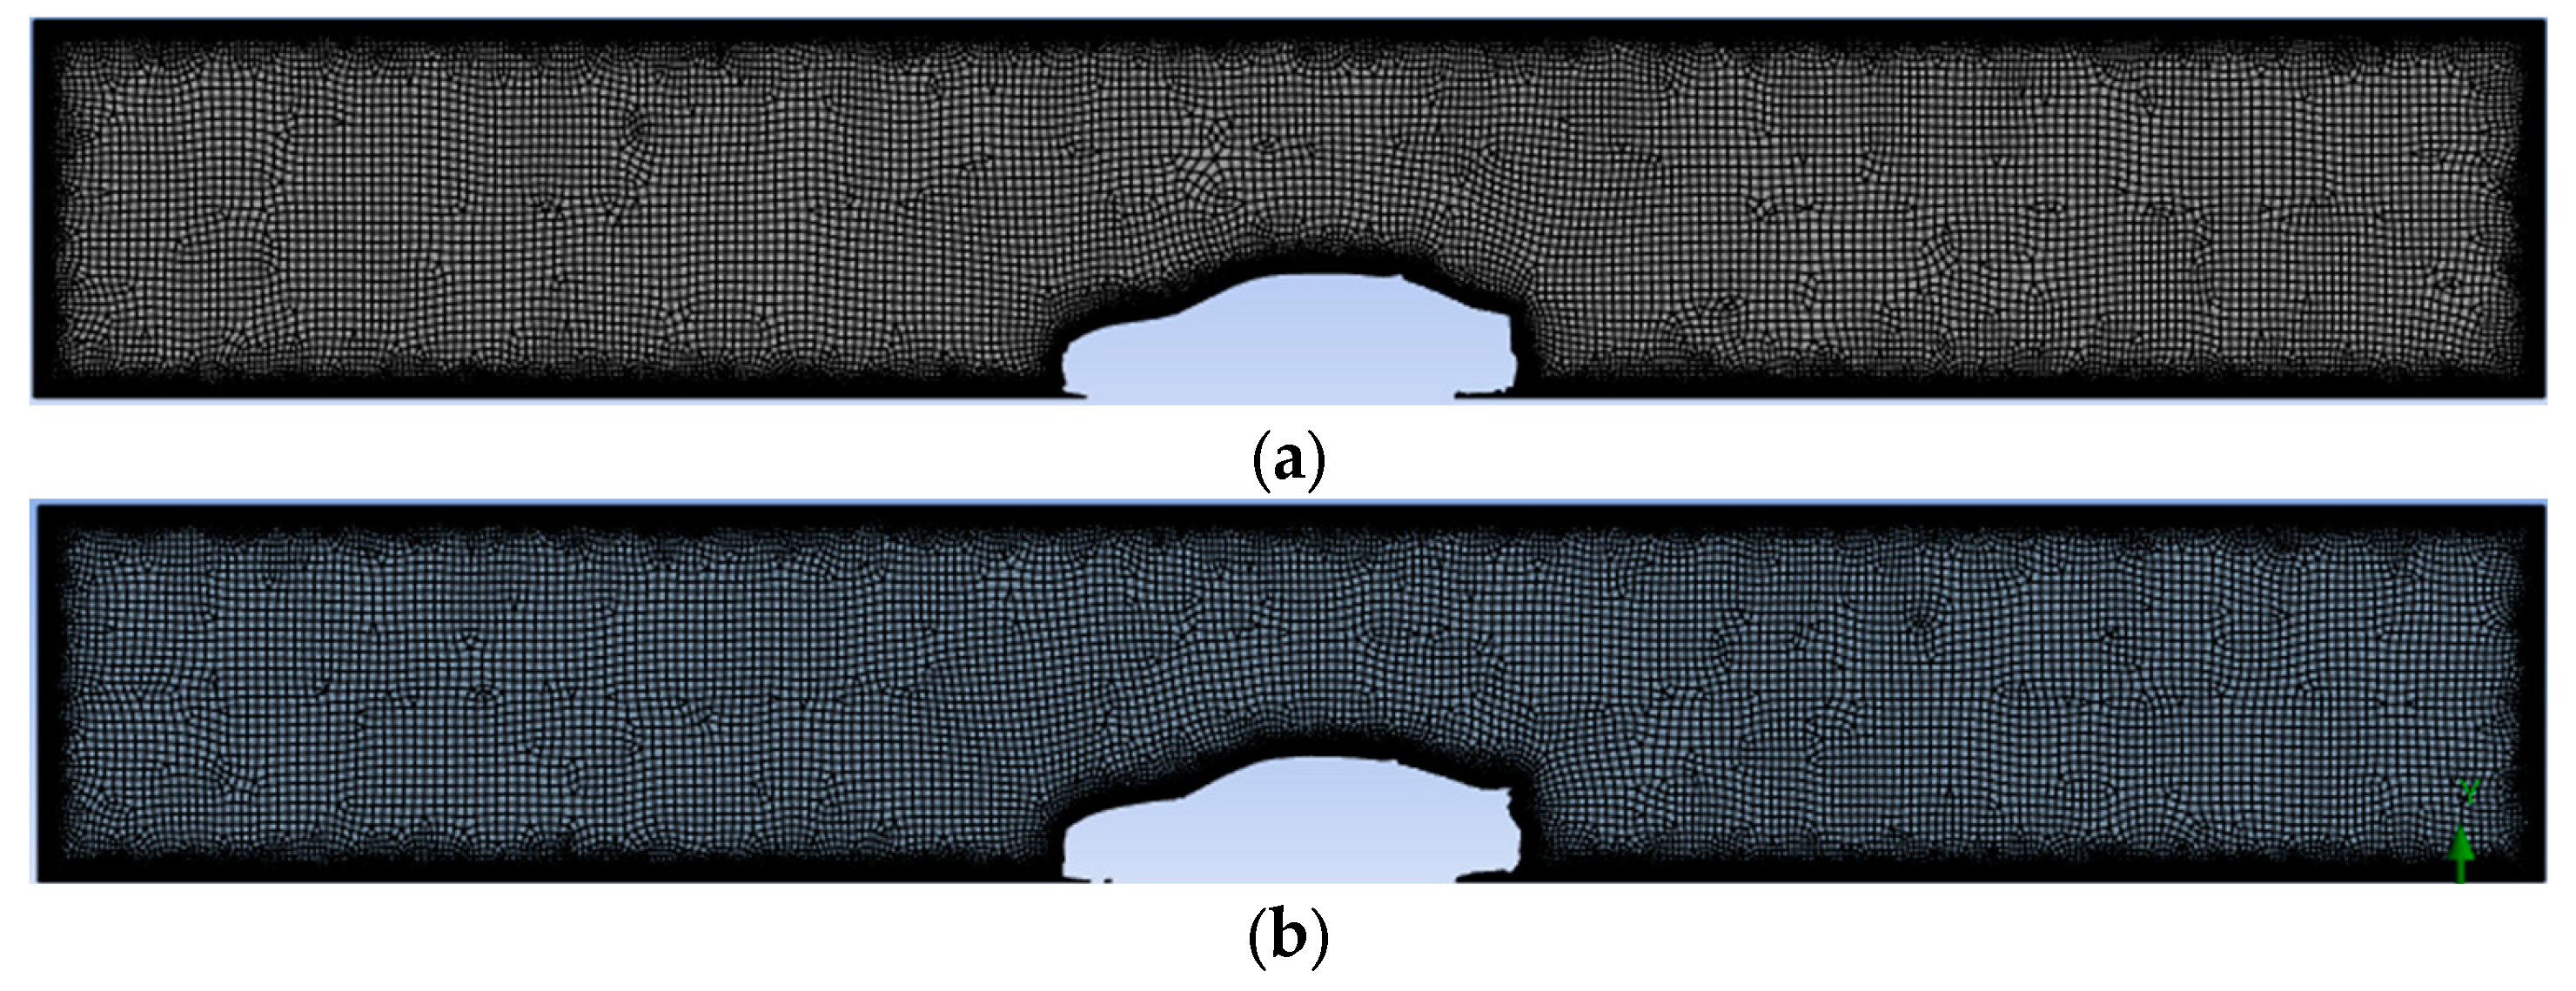
4.4.3 Realizable, n.d.). Mirroring methodologies applied in prior research, the computational domain is established with dimensions of 1000 meters in length and 150 meters in height to replicate a standard road test (Banuri et al., n.d.). The domain is consistently meshed across all simulations, featuring a finer mesh near the car and its boundaries (visually represented in
Figure 4). The inlet is on the side of the car’s hood, and the outlet is on the side of the car’s trunk.
To test the accuracy of the models in
Figure 4, we also compared the results with the meshing in
Figure 4 to the meshing in
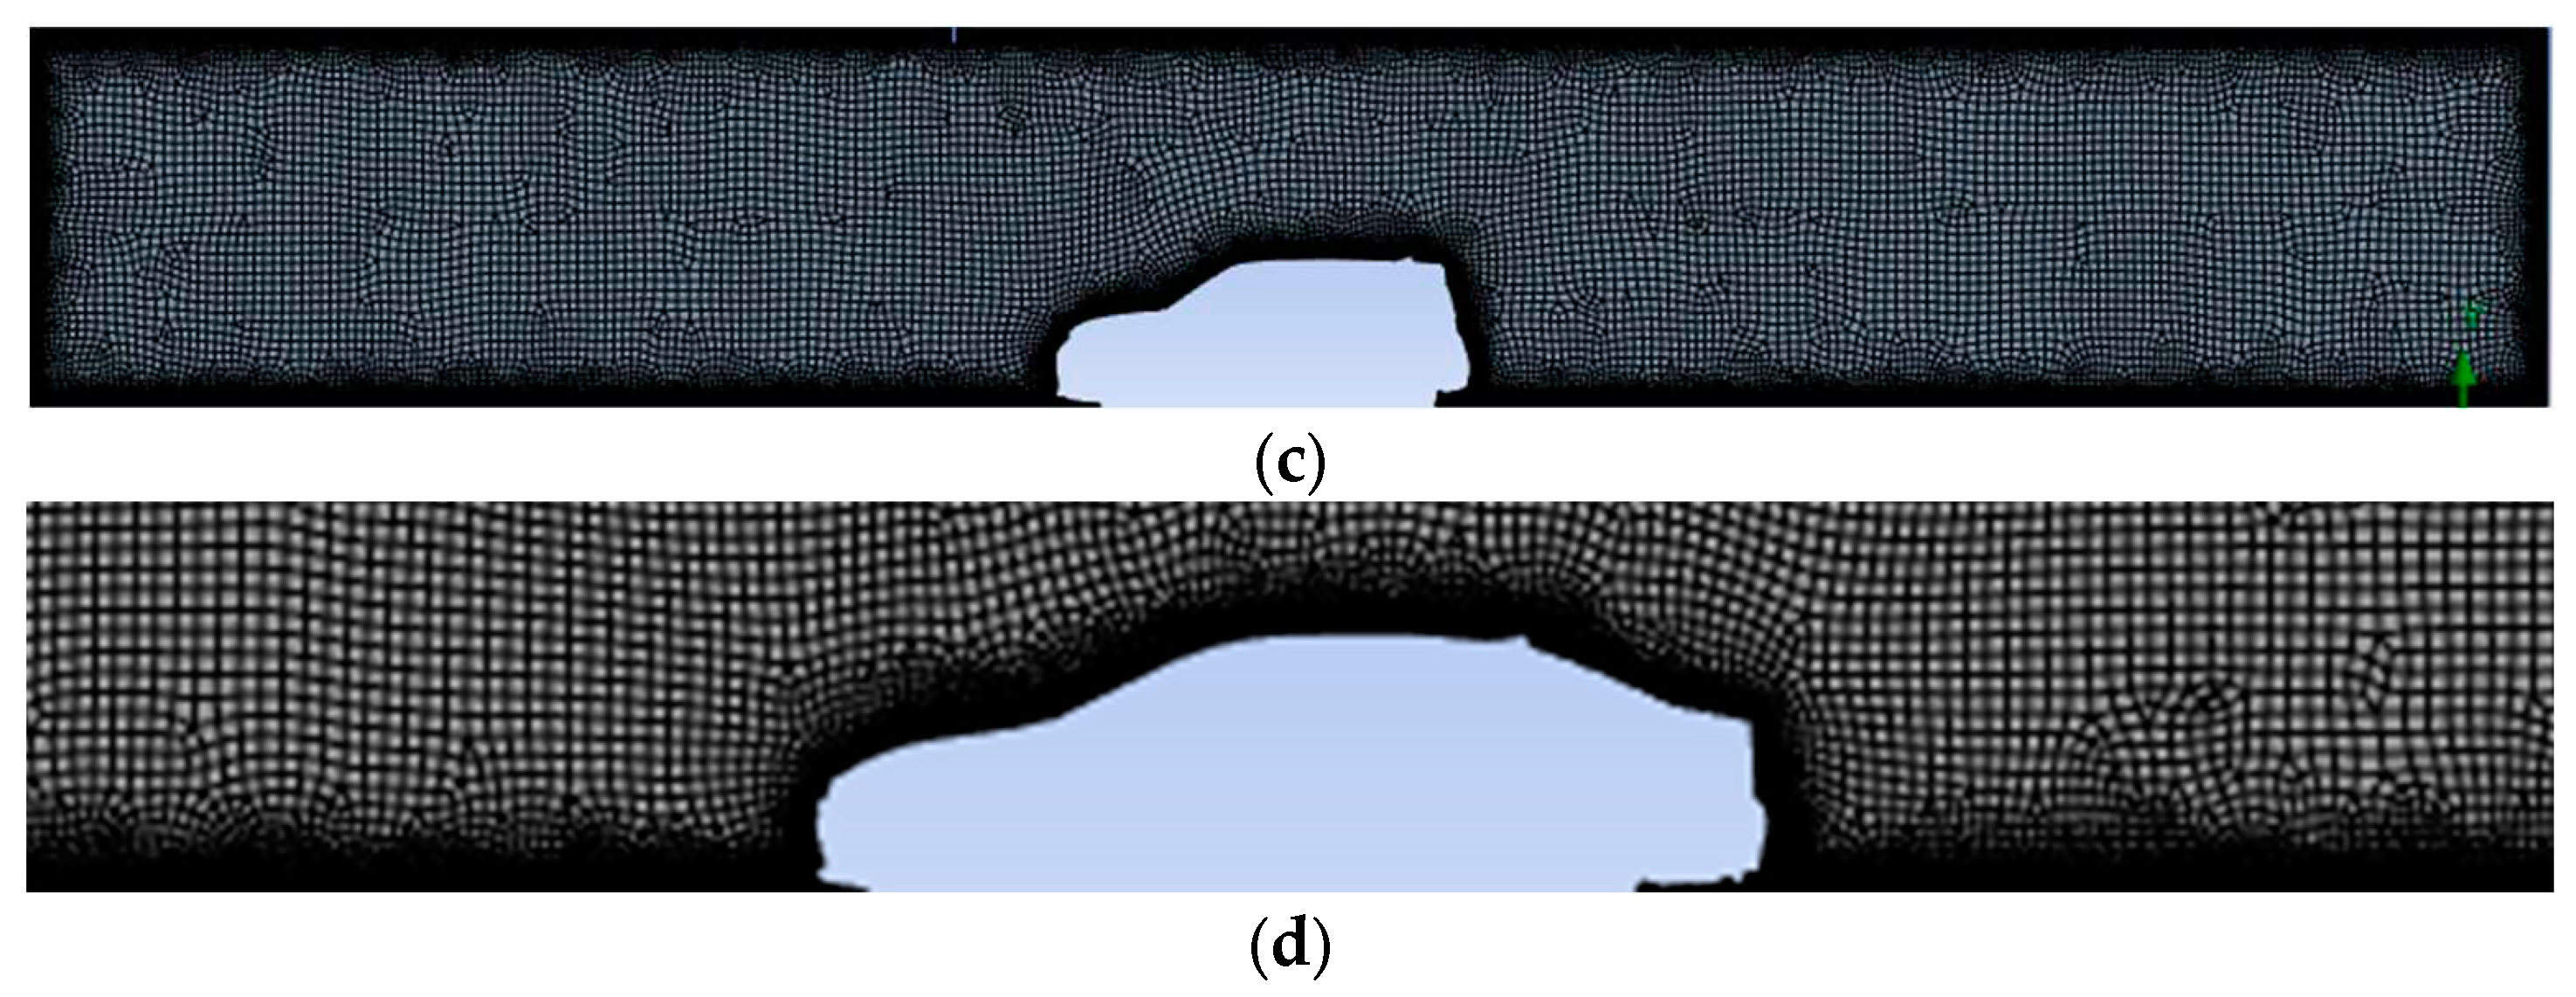
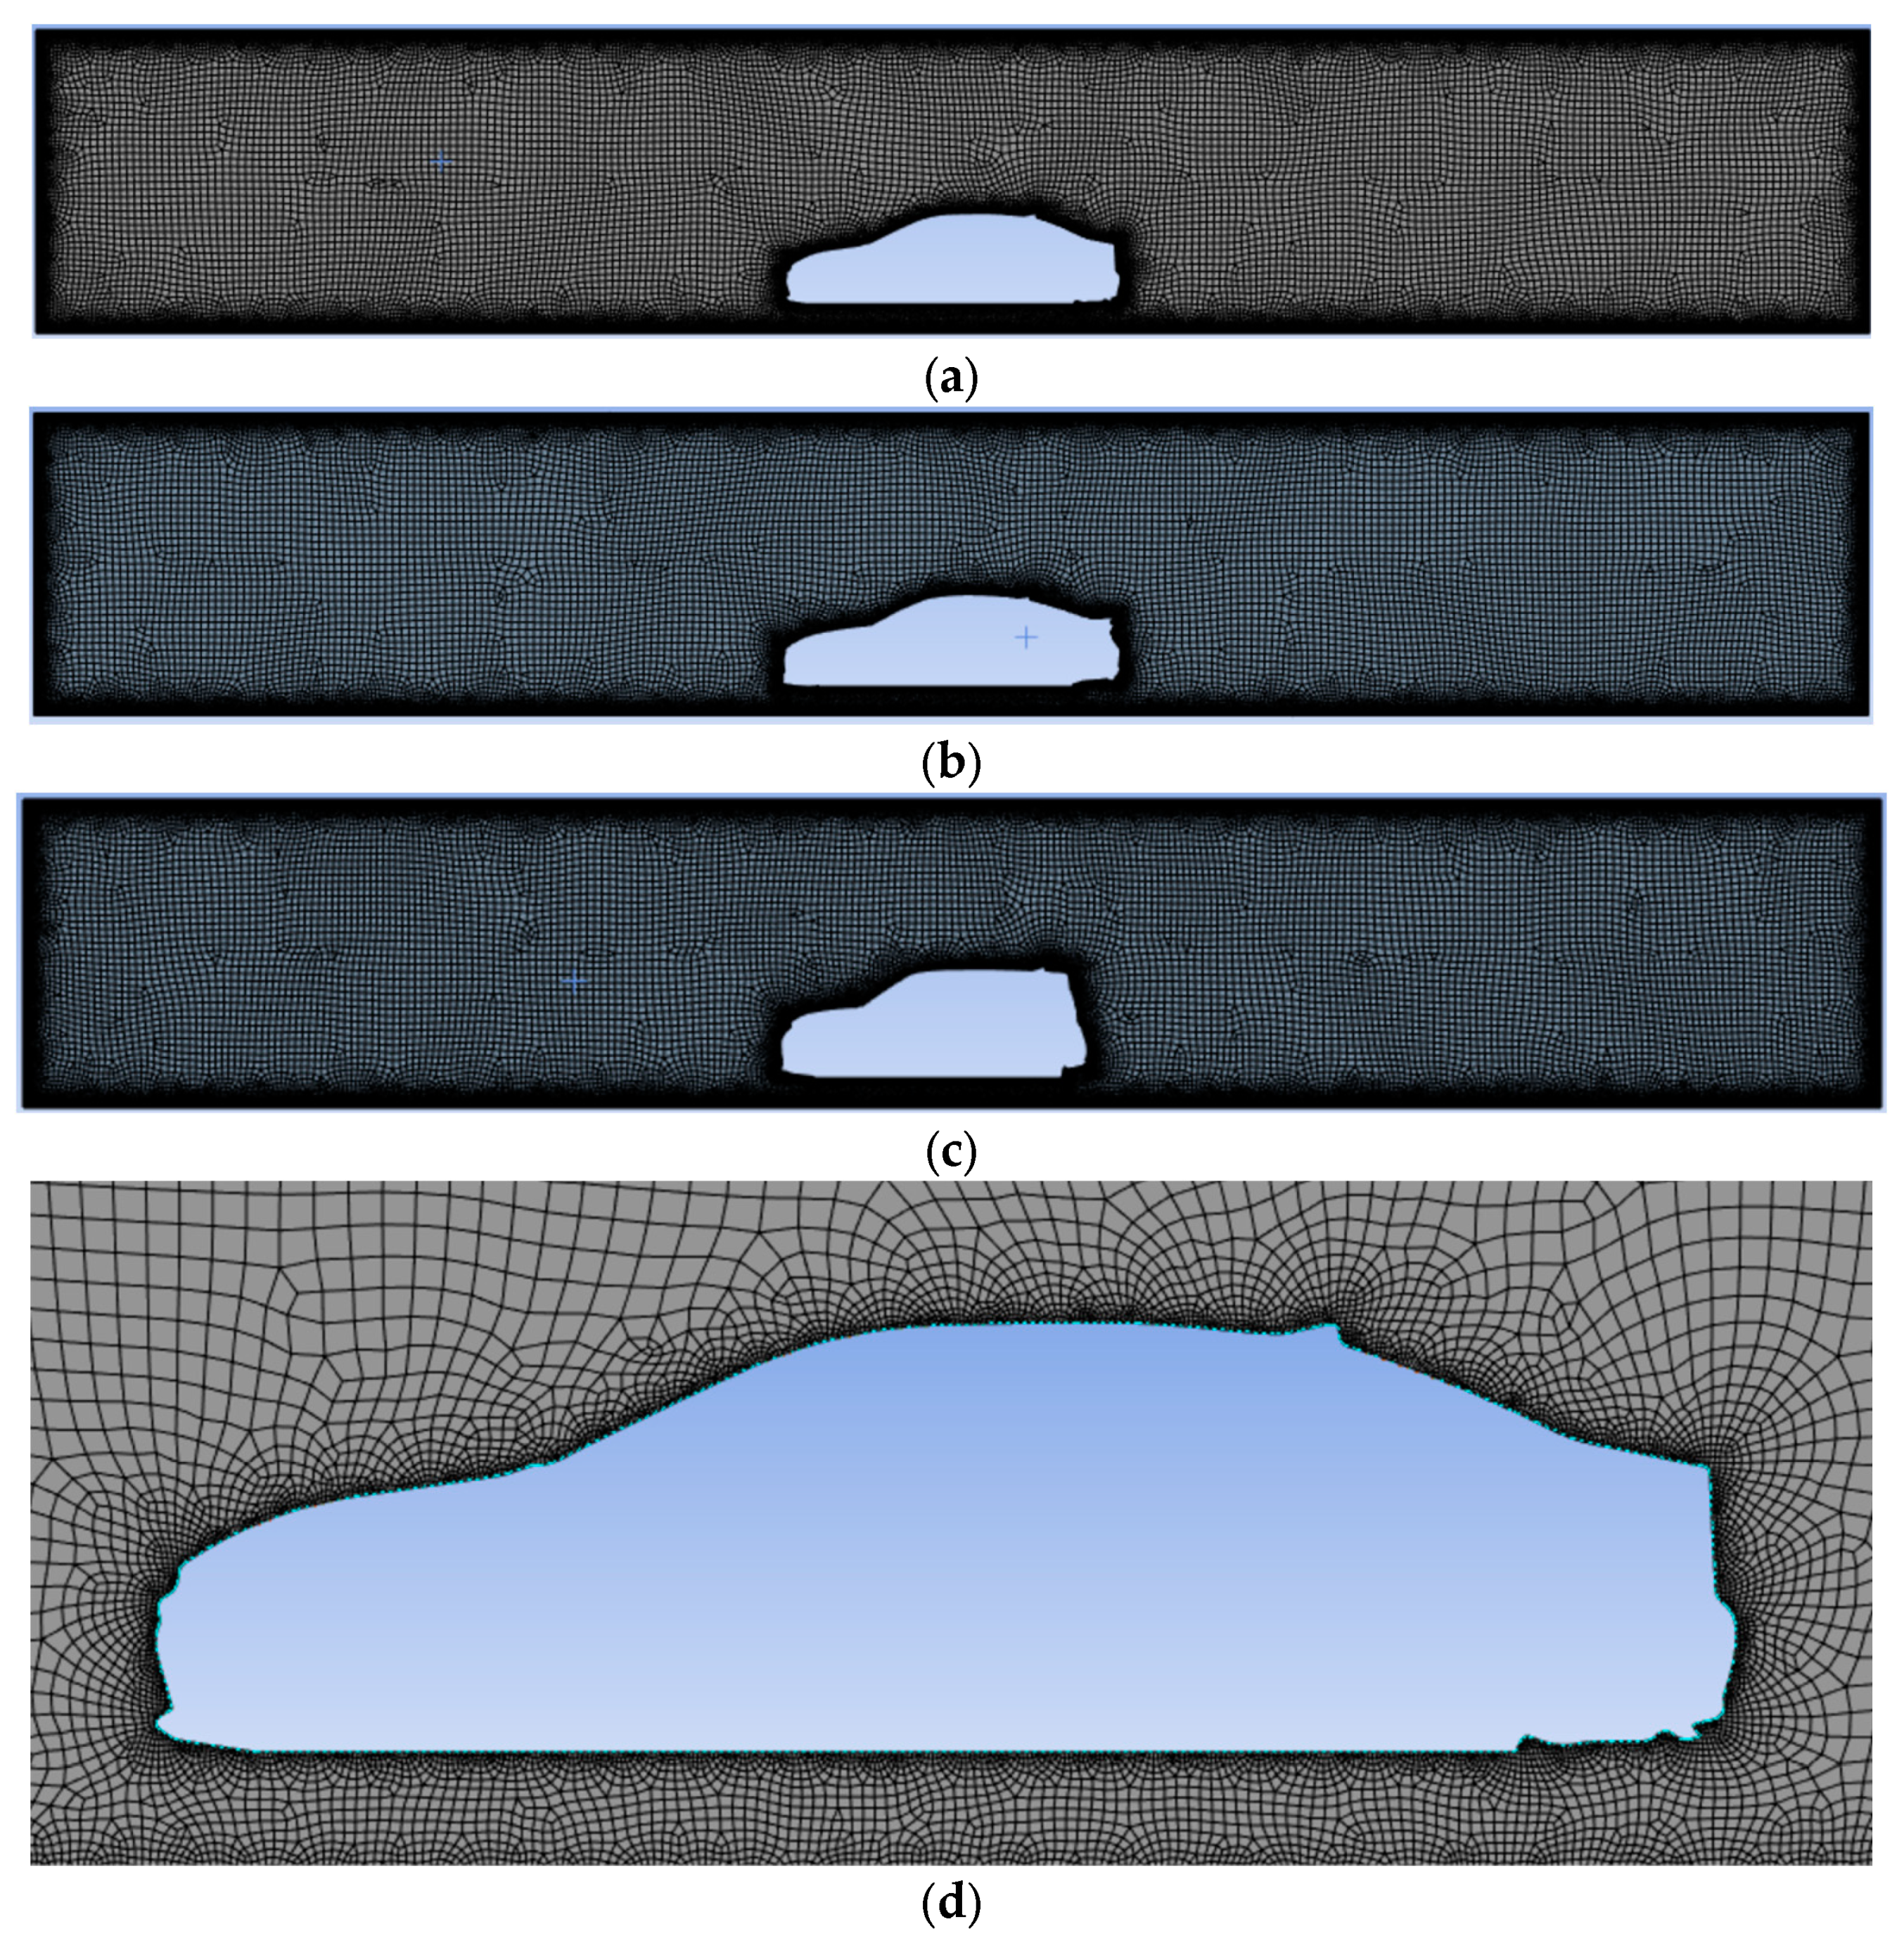
Figure 5.
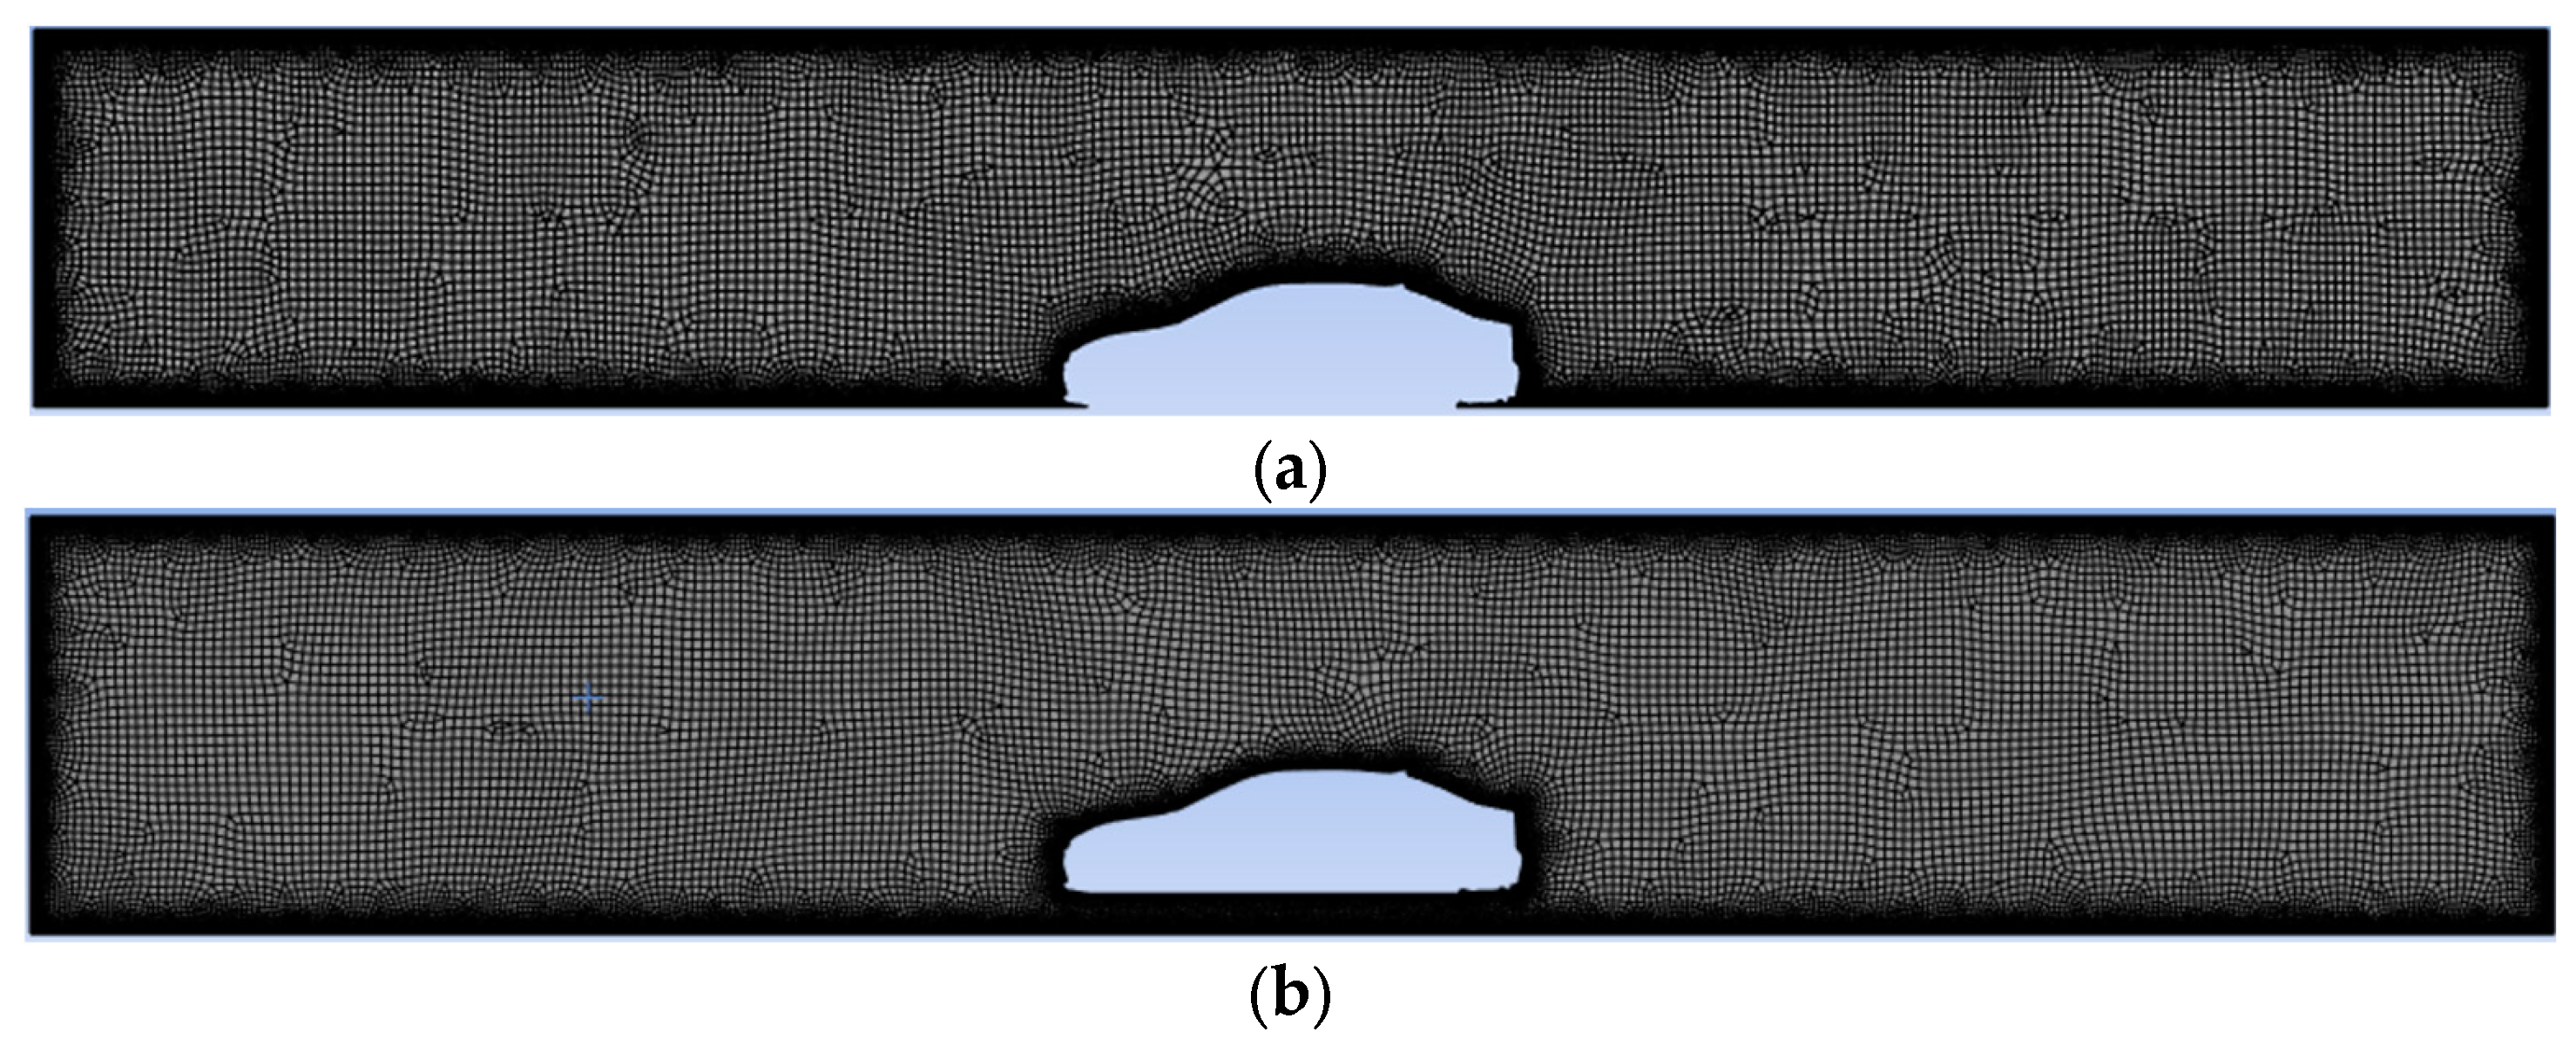
Figure 5 introduces a gap between the bottom of the car and the road, which mimics the distance that a car would be distanced from a road if it was lifted by wheels. This more accurately depicts the cross-section of the car.
3.4. Mesh Independence
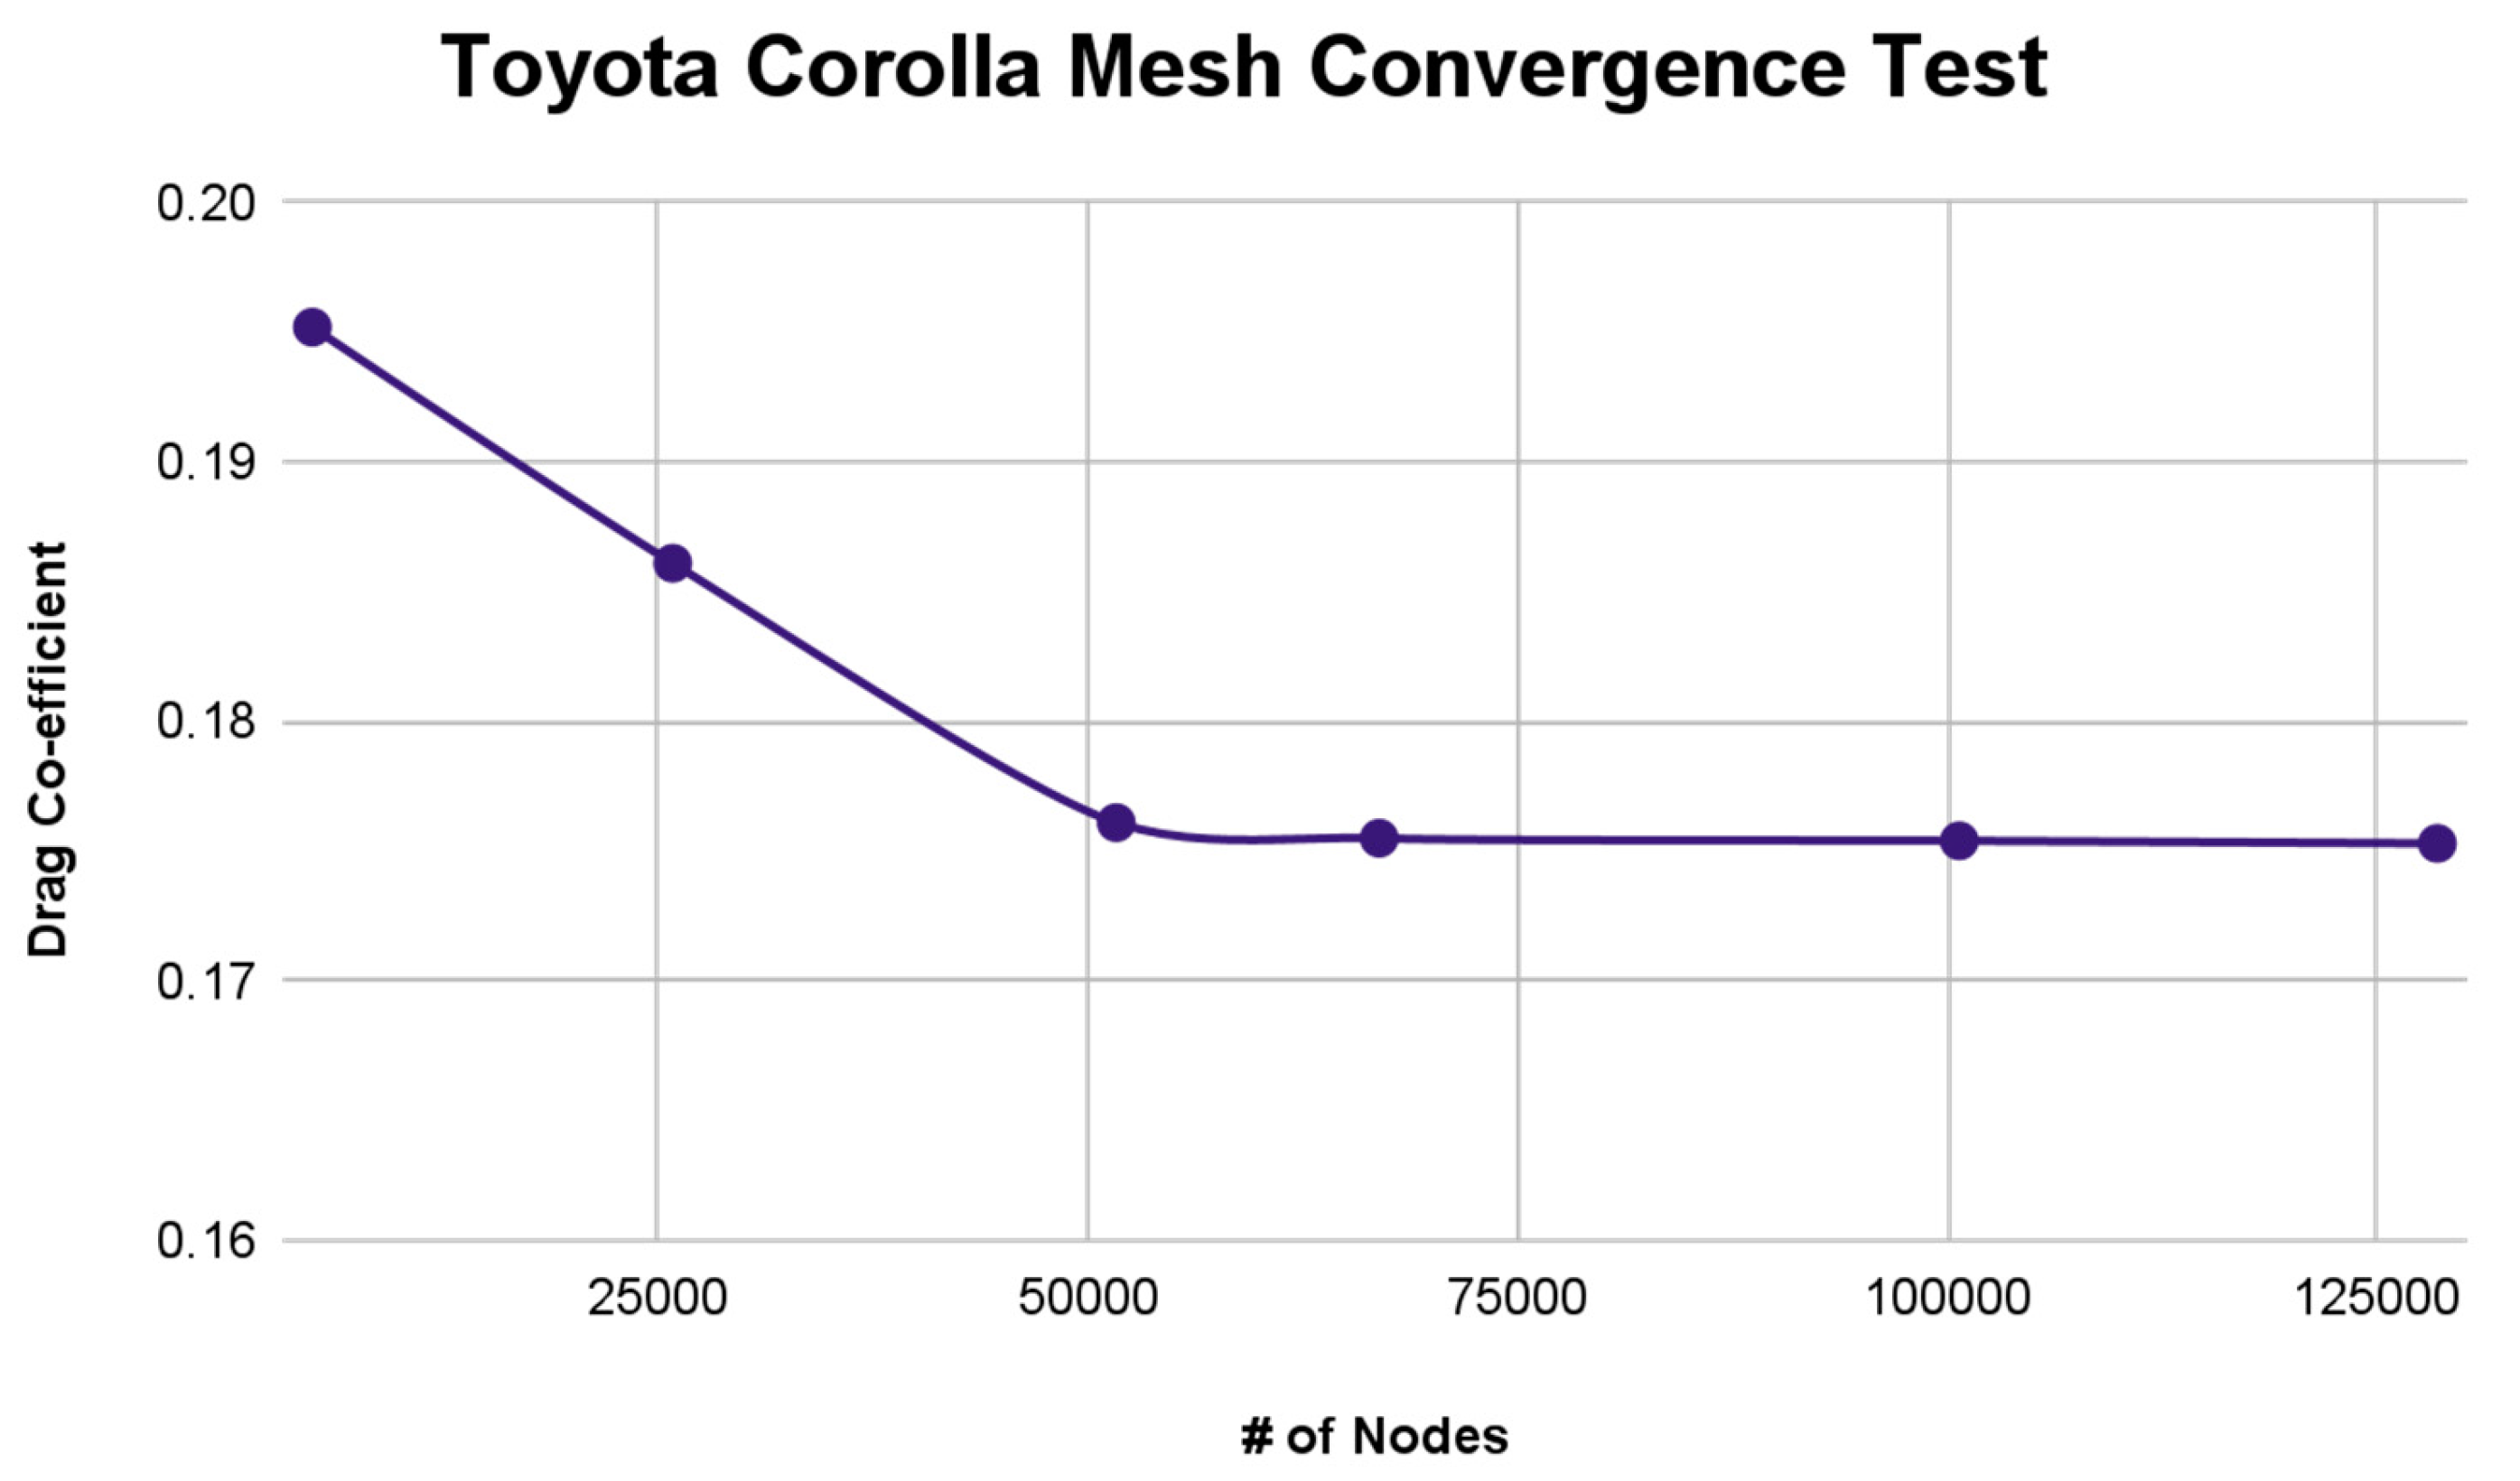
We performed a mesh convergence test to determine the number of nodes needed in the mesh to balance the accuracy of results with modeling efficiency. Results are based on the findings from the Toyota Corolla, as shown in
Figure 6 and
Table 1. This test aims to determine the number of nodes needed to achieve a balance of accuracy in results and efficiency in modeling. In meshes with more than 50,000 cells, the percent change from medium to fine mesh quality is less than 1%. Based on these results, we chose the medium mesh resolution to provide the necessary accuracy while cutting down on computation time needed for ANSYS Fluent simulations.
4. Results
We simulated 2D models of the Toyota Corolla, Hyundai Elantra, and Kia Soul using ANSYS Fluent software at varying velocities.
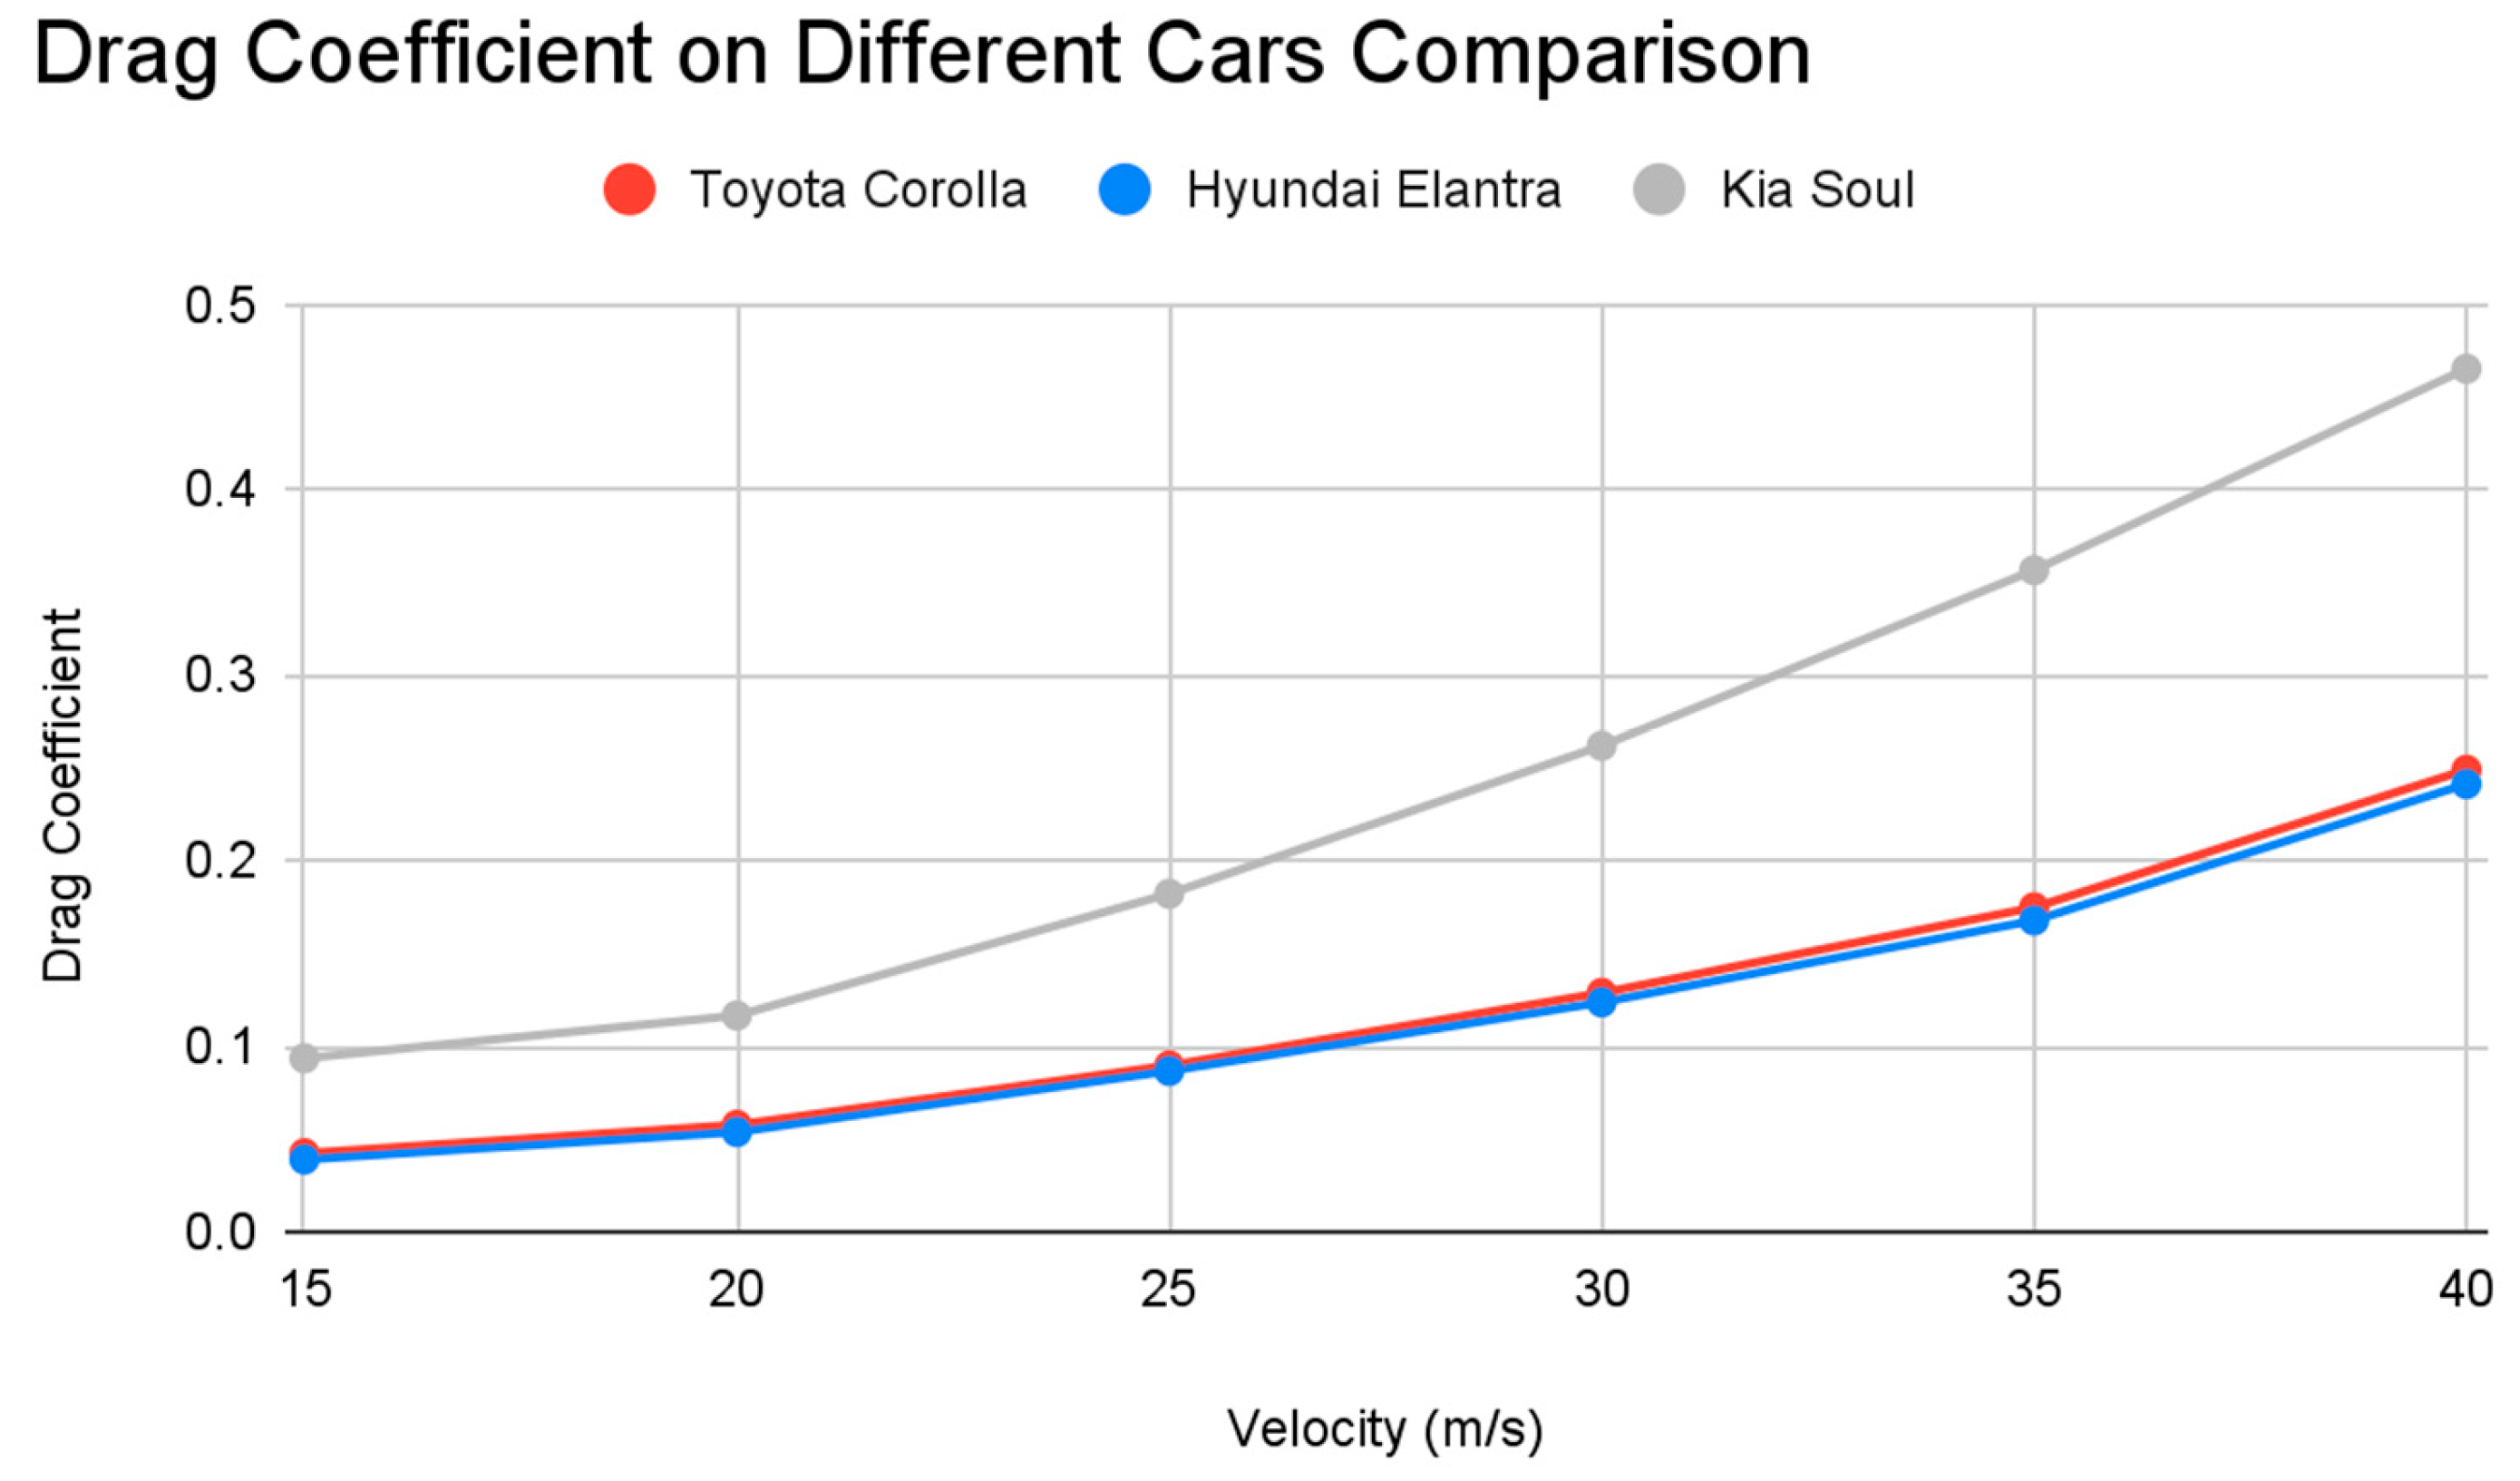
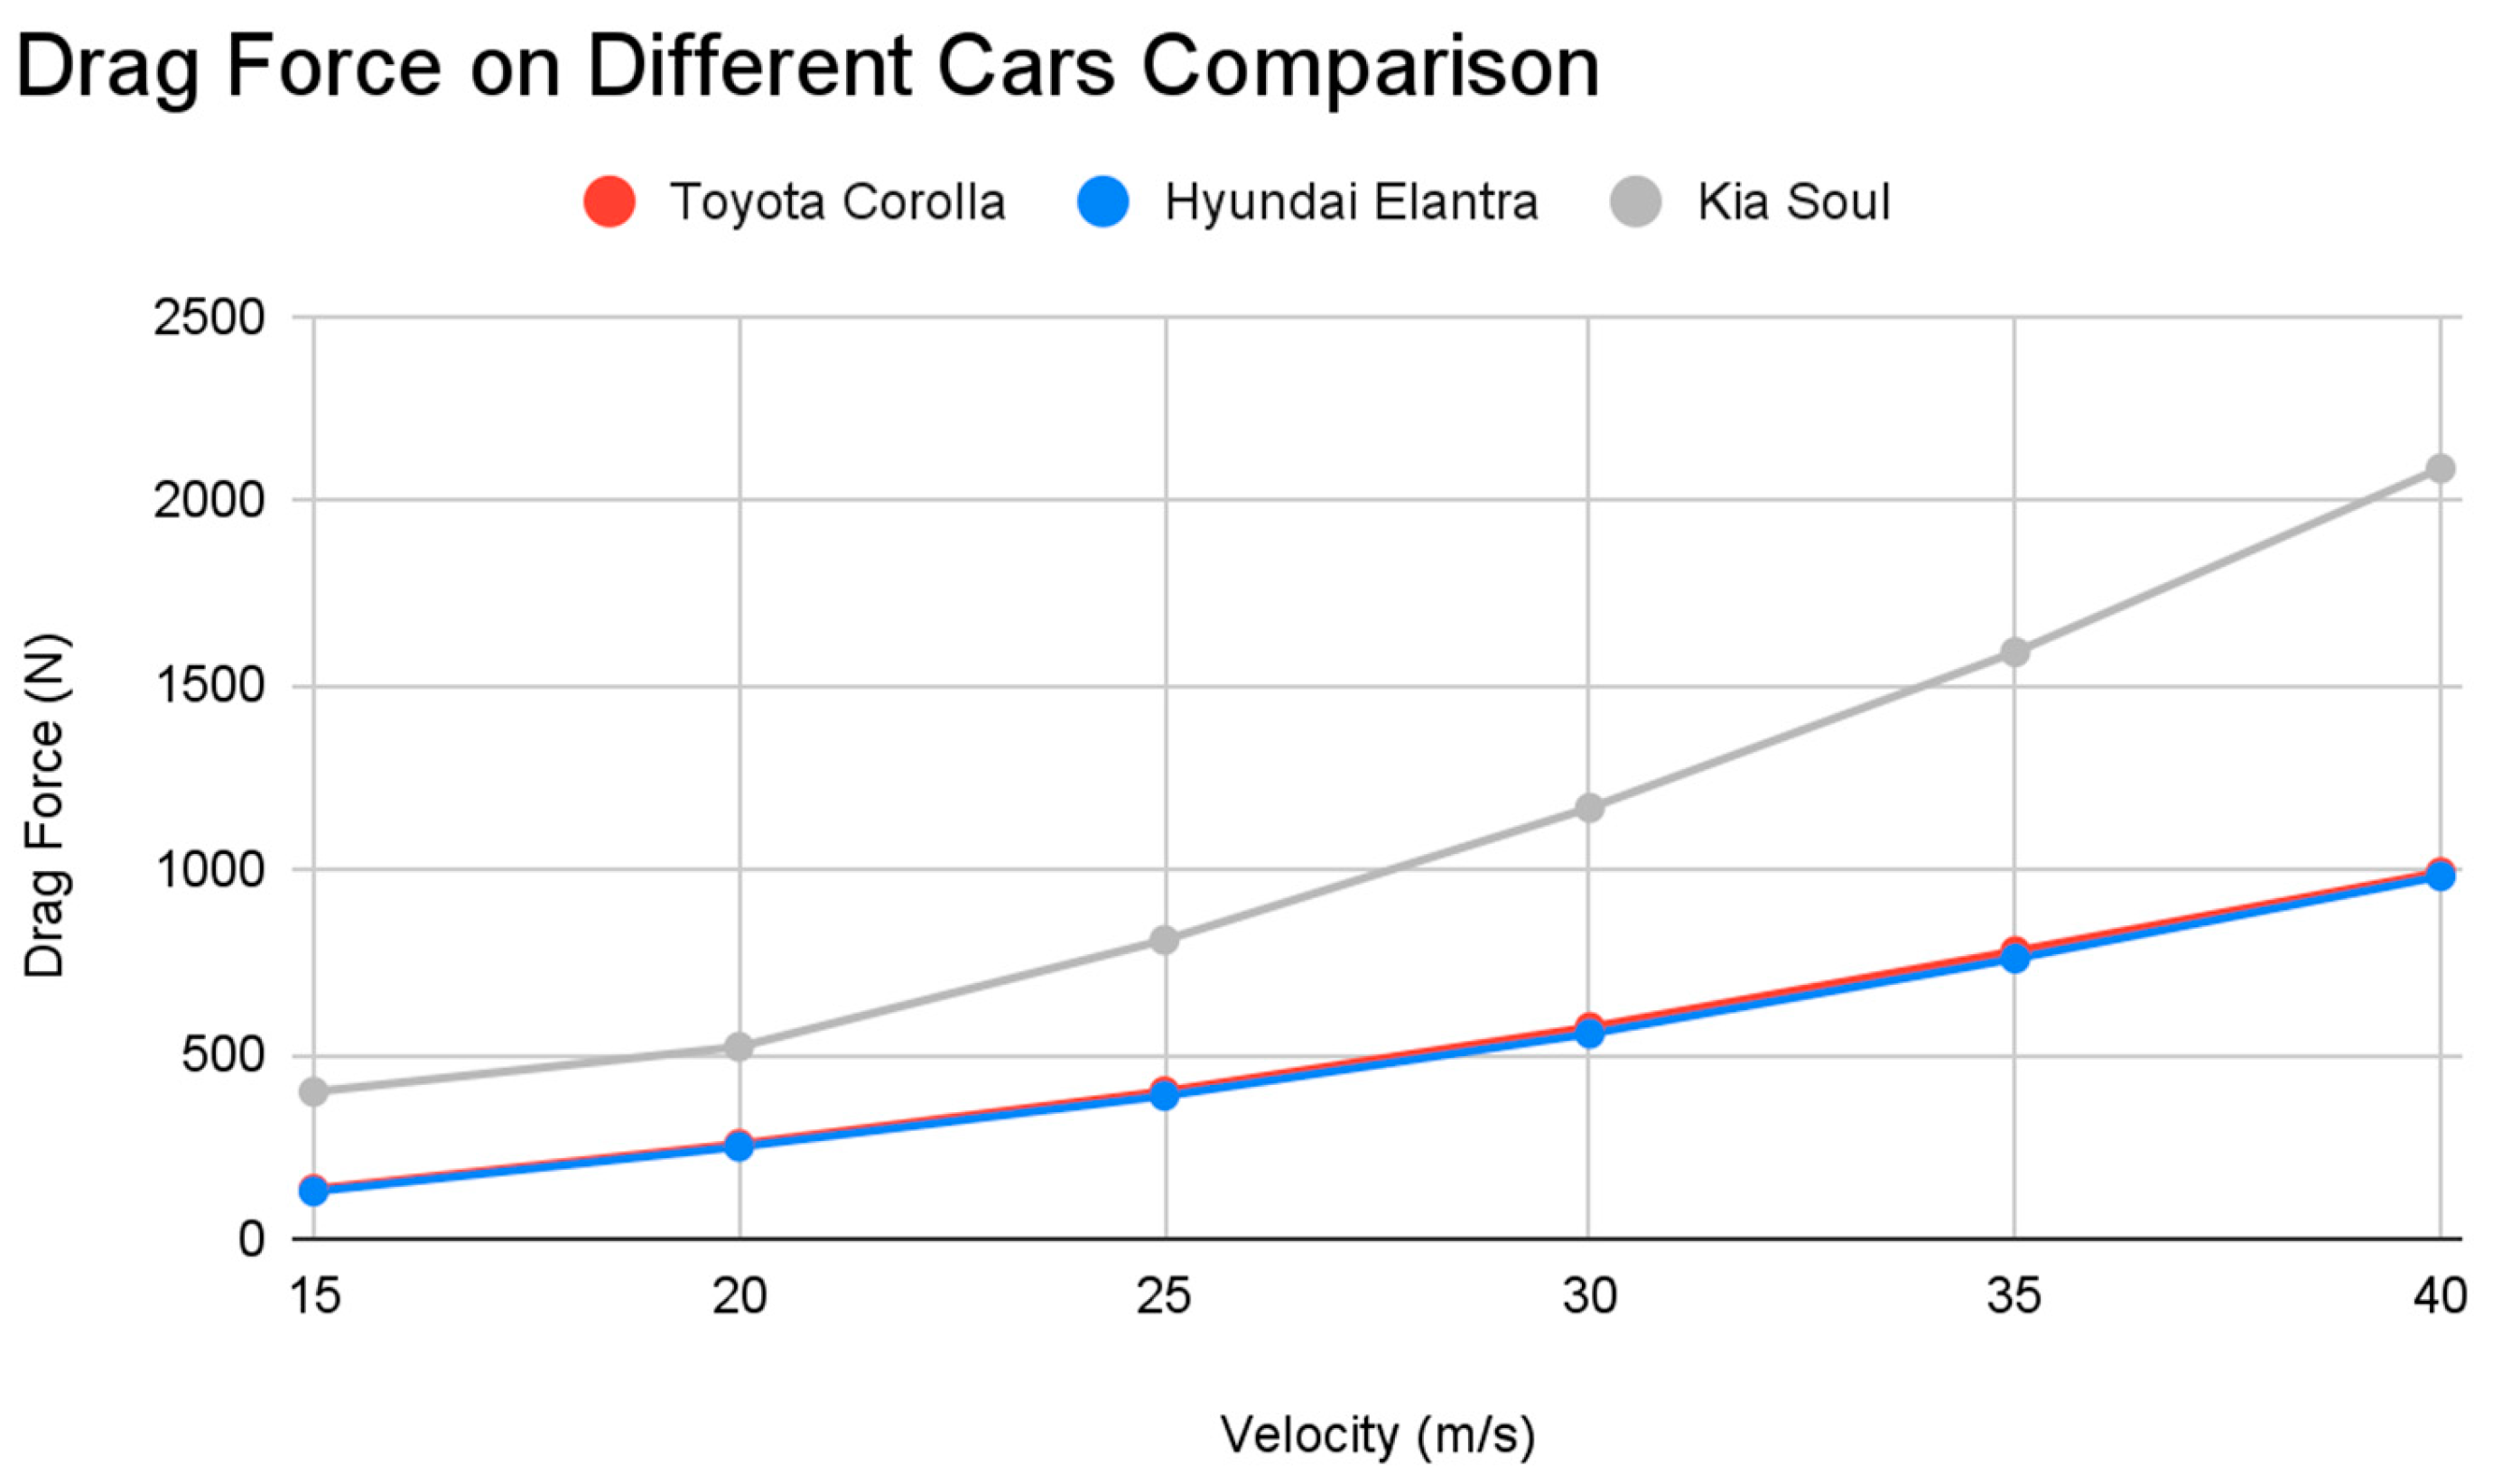
Figure 7 and
Figure 9 compare the average drag forces and coefficients of the car models at different velocities (measured in meters/second). The data in the graphs are recorded in
Table 3 and
Table 5. In compliance with the mesh convergence study, we used more than 50,000 nodes for each model. For the Toyota Corolla model, we used 51,652 nodes. For the Hyundai Elantra model, we used 53,234 nodes. For the Kia Soul model, we used 52,269 nodes. See
Table 1 for a complete list of car specifications.
Figure 7.
Graph of Drag Coefficients of 2D Models vs Velocity.
Figure 7.
Graph of Drag Coefficients of 2D Models vs Velocity.
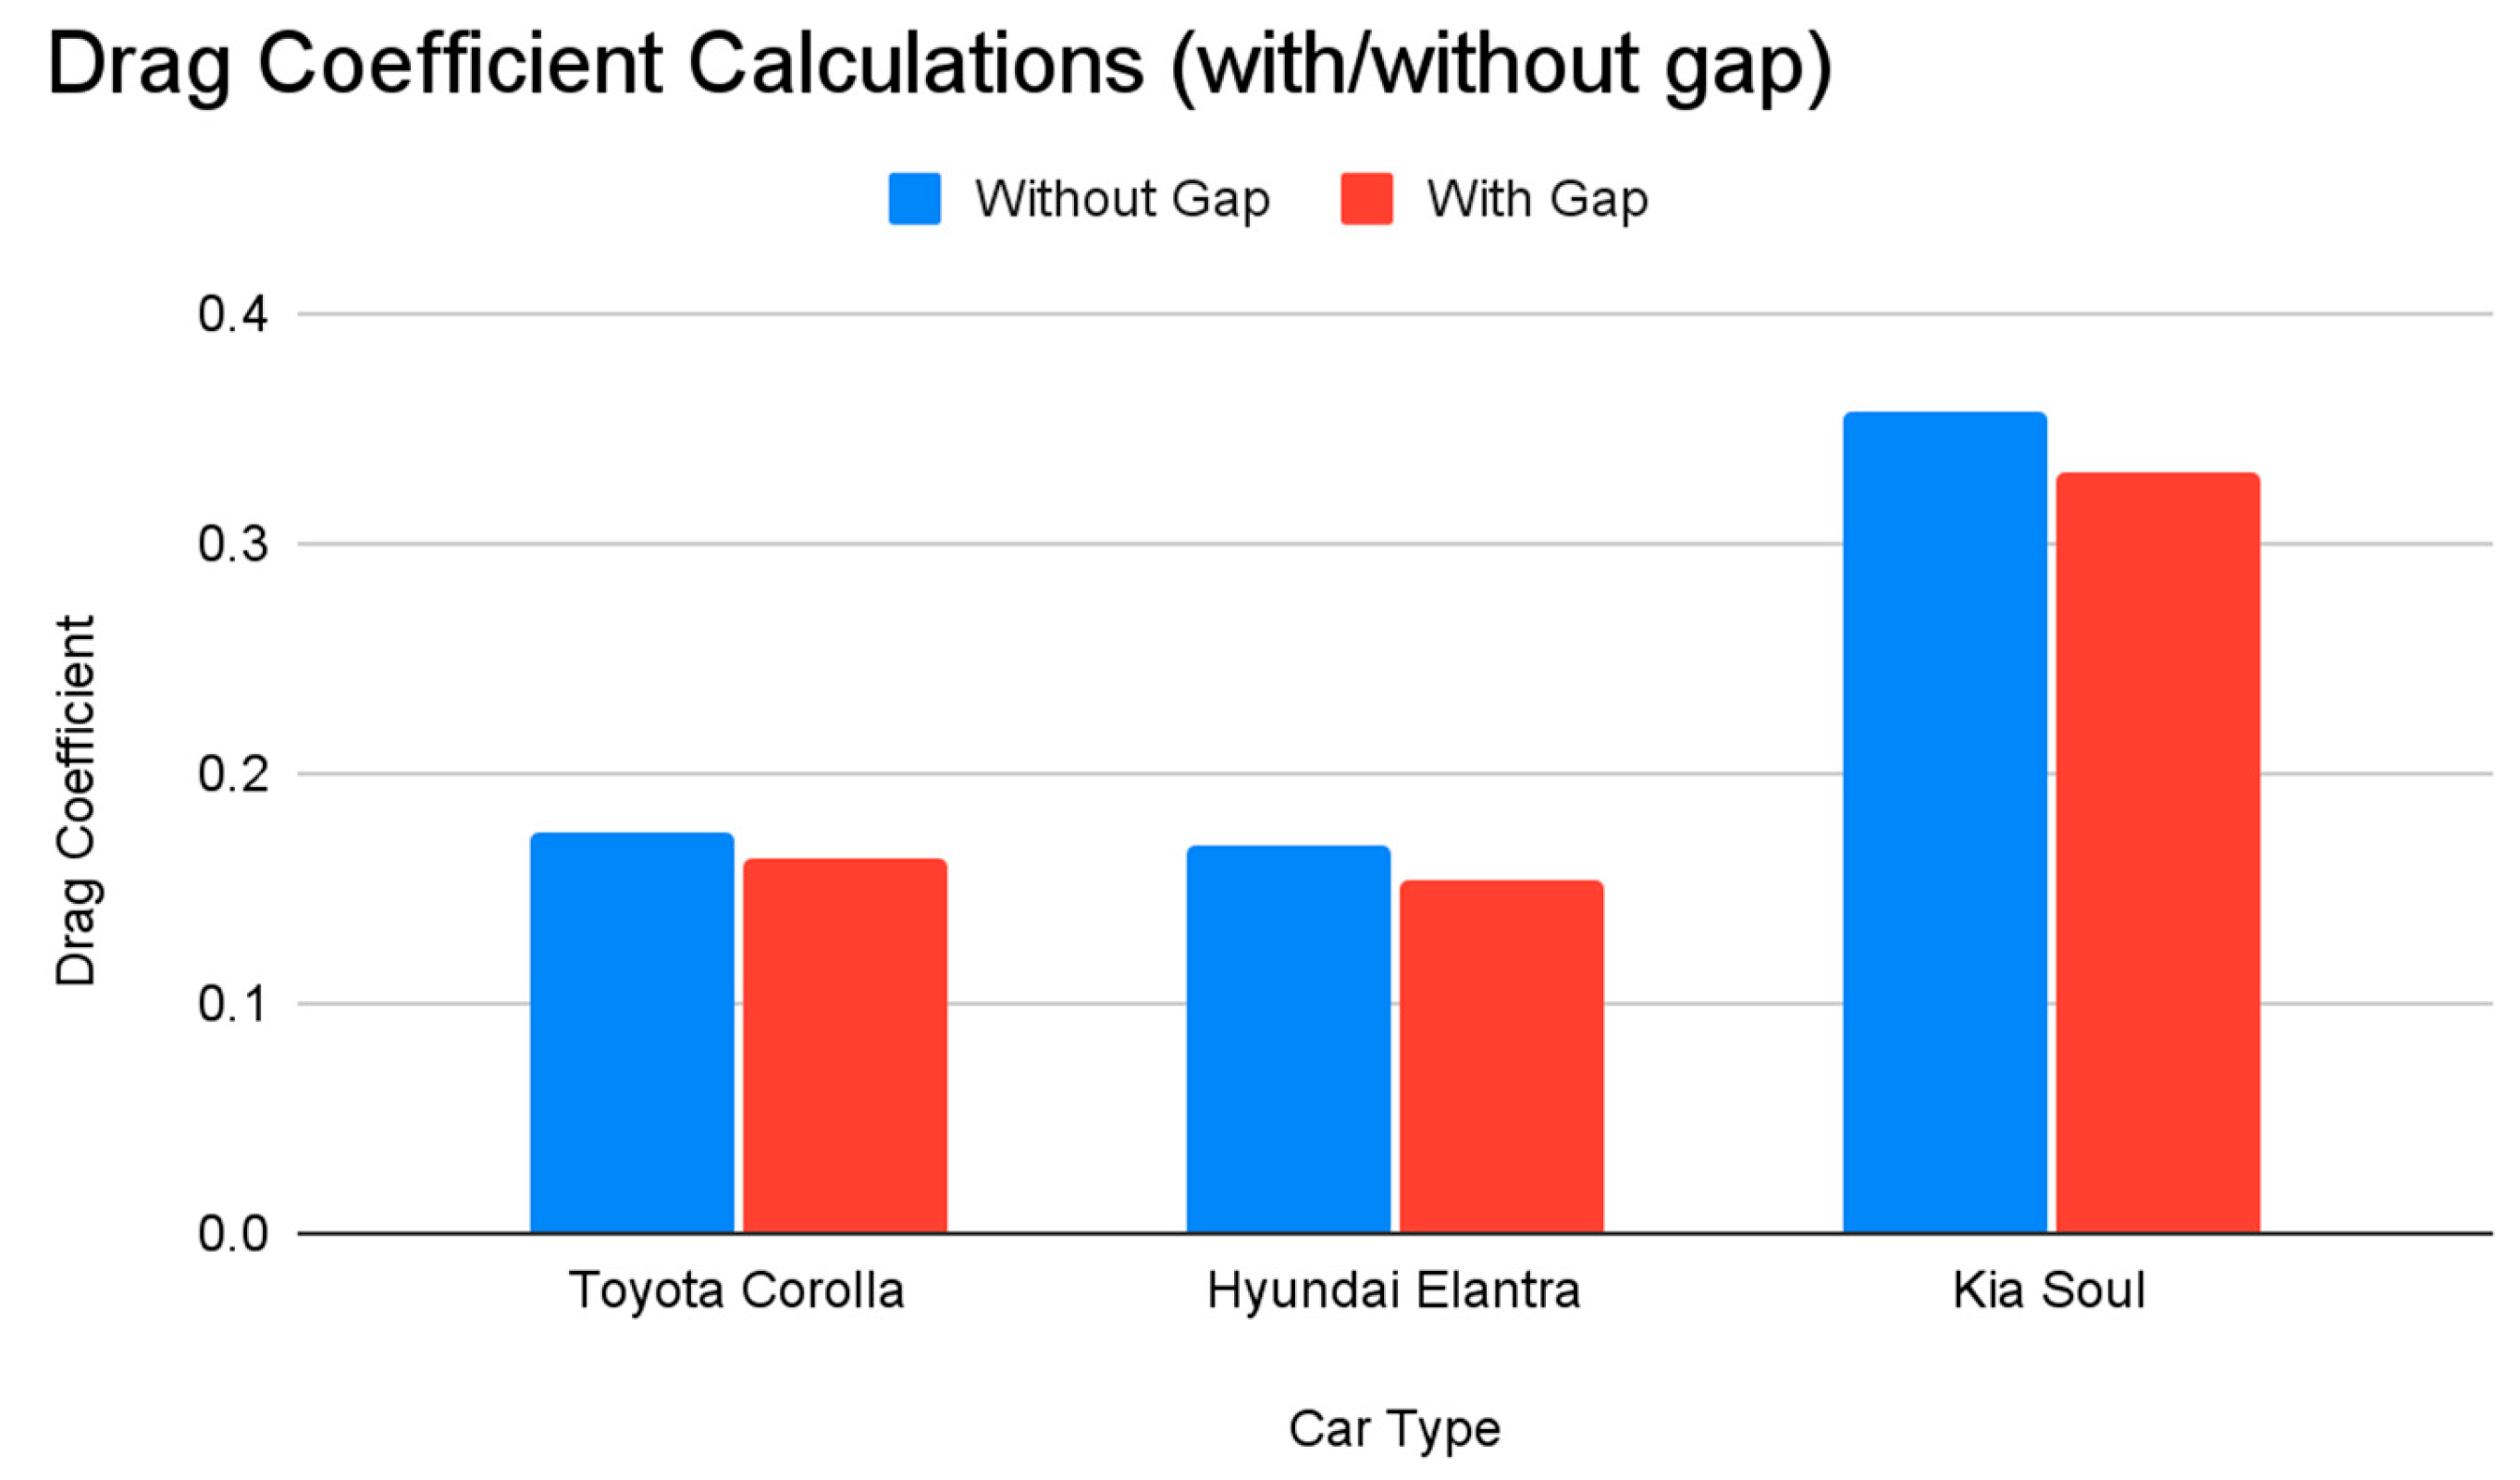
Figure 8.
Graph of Drag Coefficients of 2D Models With and Without Gap Beneath Car.
Figure 8.
Graph of Drag Coefficients of 2D Models With and Without Gap Beneath Car.
Figure 9.
Graph of Drag Force of 2D Models vs Velocity.
Figure 9.
Graph of Drag Force of 2D Models vs Velocity.
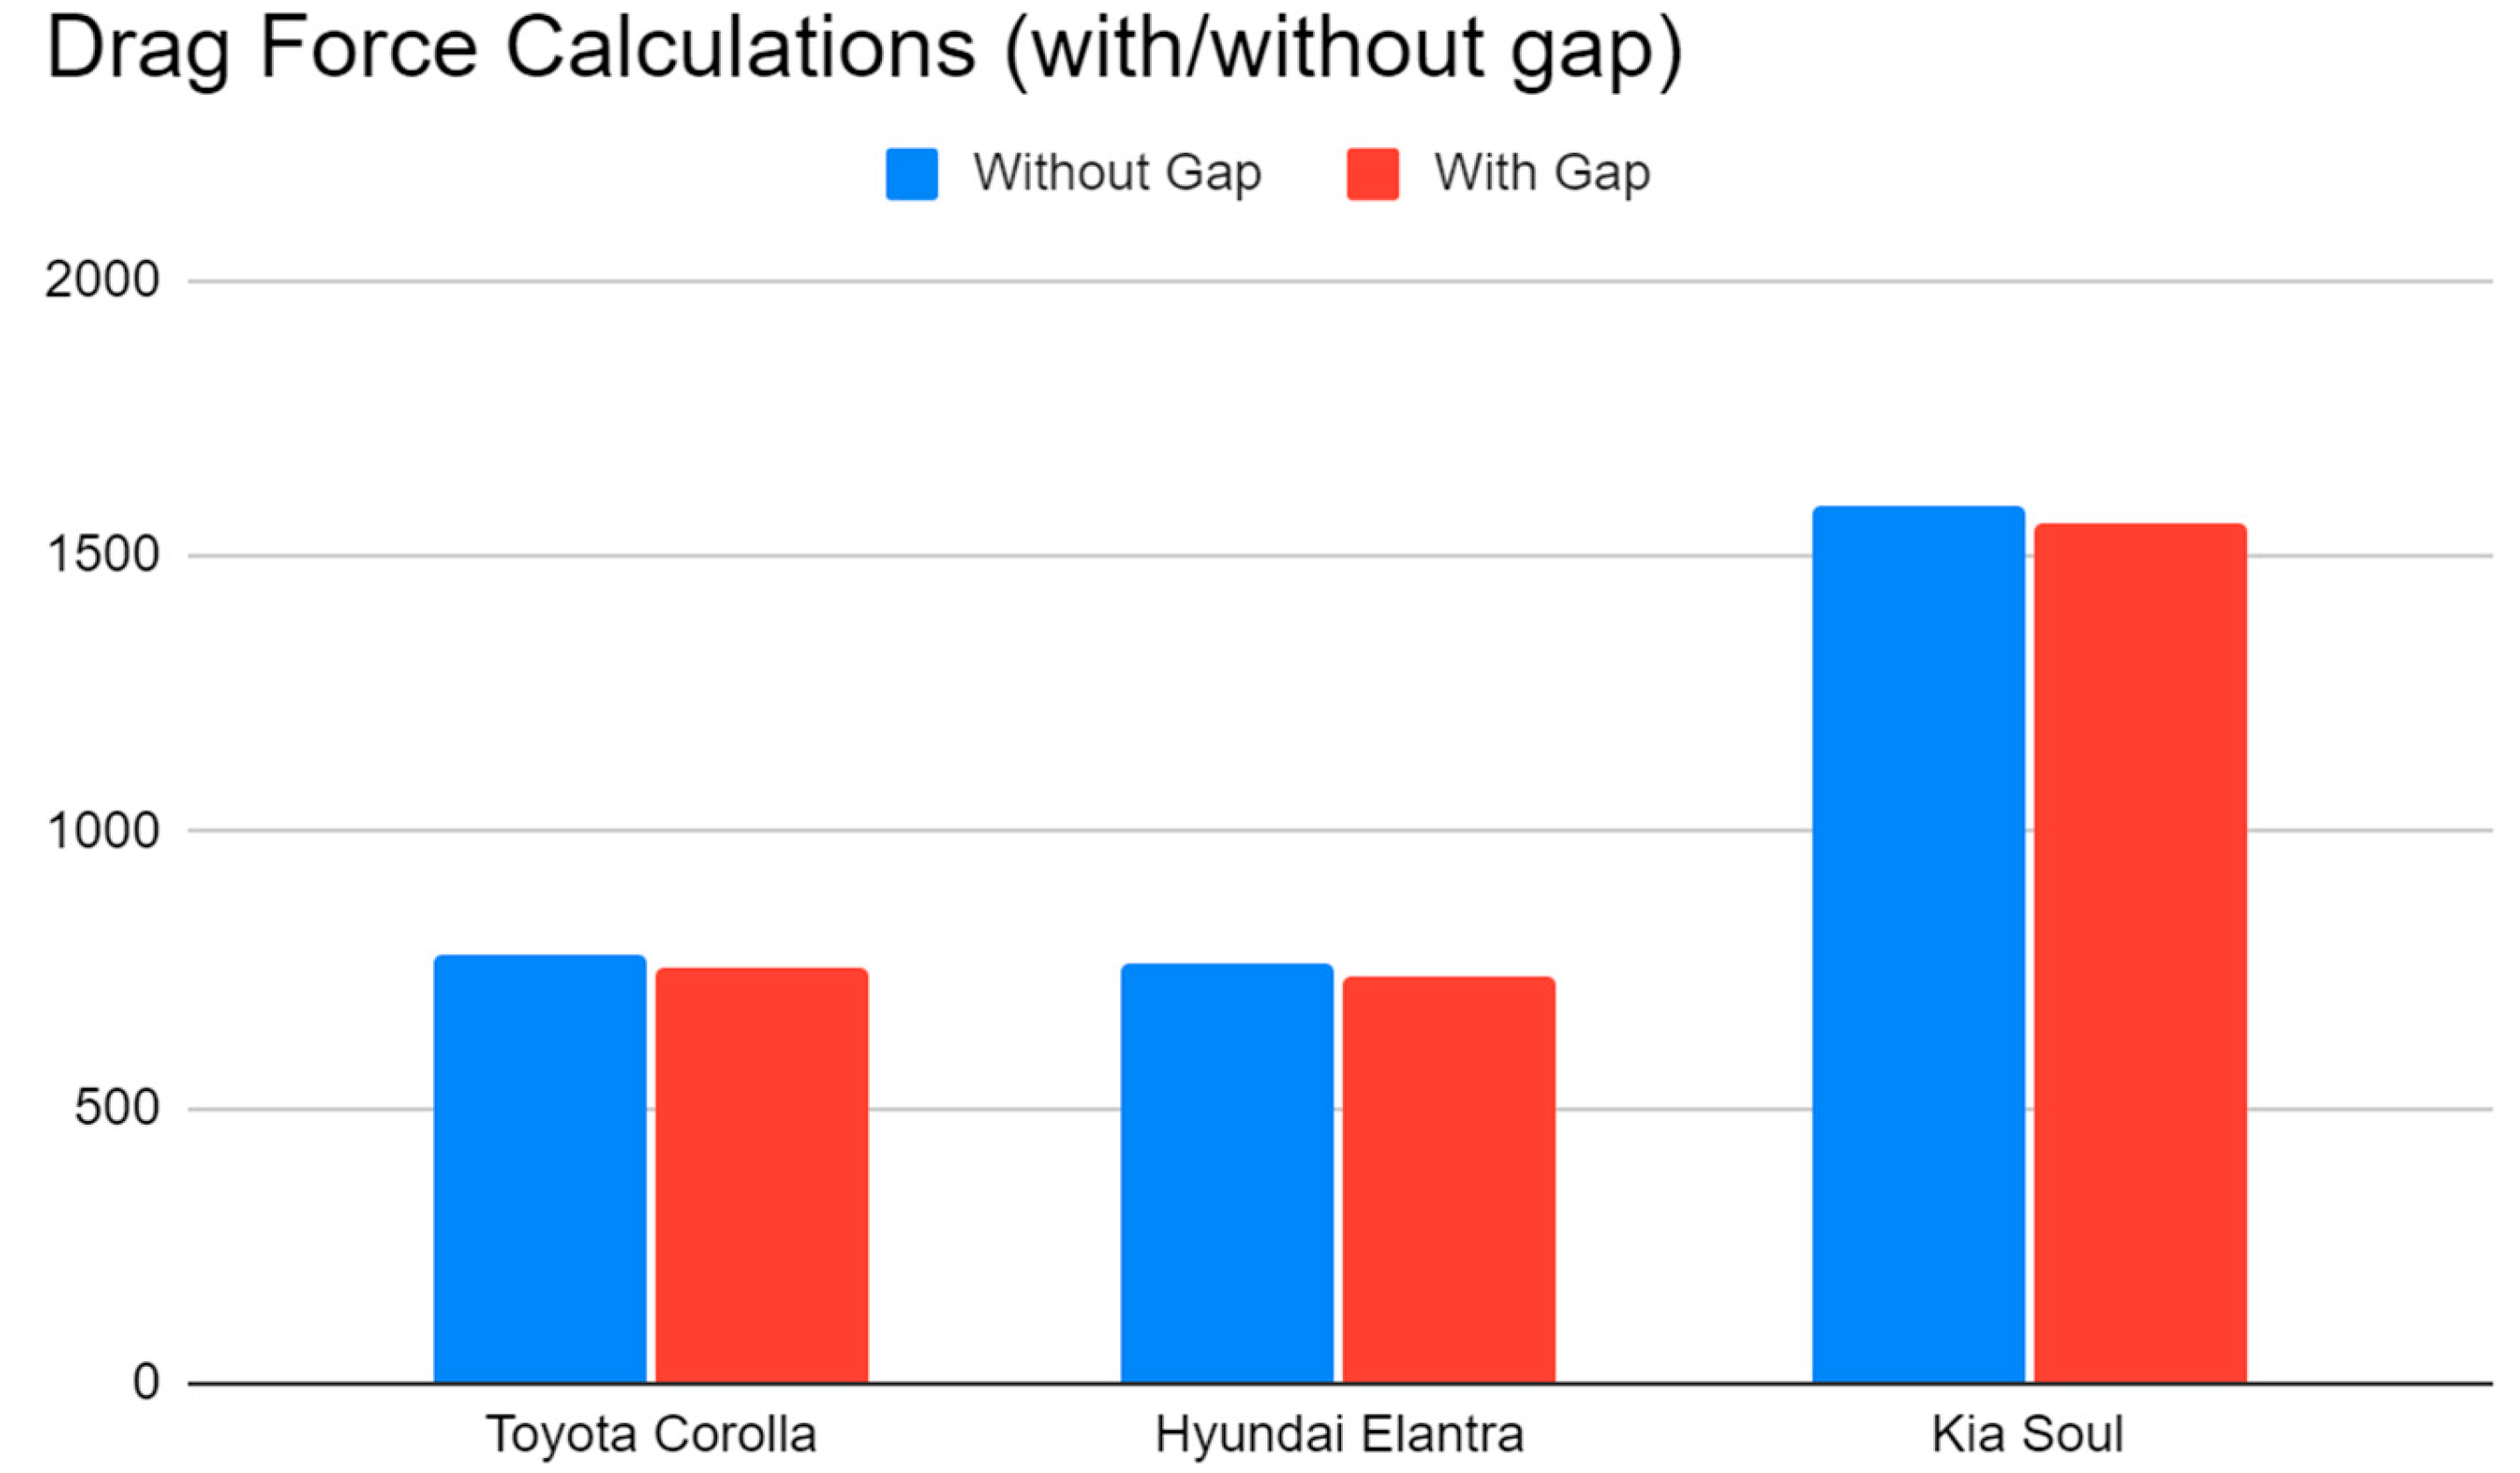
Figure 10.
Graph of Drag Force of 2D Models With and Without Gap Beneath Car.
Figure 10.
Graph of Drag Force of 2D Models With and Without Gap Beneath Car.
5. Discussion
Looking at
Table 1 in union with the results shows an inverse correlation between drag force and gas mileage. Additionally, we can see that the Hyundai Elantra is the most aerodynamic car of the three studied here. By contrast, the Kia Soul is the most inefficient by a large margin.
5.1. Toyota Corolla and Hyundai Elantra Comparison
As shown in the graphs above, the Toyota Corolla and Hyundai Elantra's drag force and drag coefficient are relatively similar. Logically, this makes sense, as the Toyota Corolla and Hyundai Elantra have very comparable body shapes (see
Figure 11). However, the Hyundai Elantra has an elongated back fin, while the Toyota Corolla has a less smooth underbelly. These minor differences may account for why the Hyundai Elantra is slightly more aerodynamic.
The drag coefficient of the Toyota Corolla is about 3-7% more than that of the Hyundai Elantra, depending on the car’s velocity, as shown in
Table 3. The drag force of the Toyota Corolla is about 2-3% more than that of the Hyundai Elantra (depending on what velocity the car is going at), which shows that the effects of air resistance between the two vehicles are very similar (see
Table 5).
5.2. Hyundai Elantra and Kia Soul Comparison
We next compared the Hyundai Elantra to the Kia Soul. In our experiments, we chose the Elantra because it was slightly more aerodynamic than the Toyota Corolla. Additionally, the Hyundai Elantra is made by the same parent company as the Kia Soul, eliminating some differences between the two cars (Lee & Cho, n.d.).
We expected the Kia Soul to produce a higher drag coefficient and drag force than the Hyundai Elantra based on visual inspection. Results show that our intuitions were correct. As shown in
Figure 2, the Kia Soul is a much larger car in terms of surface area and volume. It has a more box-like appearance and a higher center of gravity than the Hyundai Elantra.
Because of its more inefficient design, the Kia Soul has a significantly higher drag coefficient and drag force. The Kia Soul has a drag coefficient between 112-117% more than the Hyundai Elantra (depending on velocity) (based on data from
Table 3). Additionally, the drag force of the Kia Soul is 108-110% more than that of the Hyundai Elantra (depending on velocity) (based on data from
Table 5).
5.3. Specs Comparison
Our findings are significant when considering the similar specifications of the three cars studied. According to
Table 1, the cars in our experiment have comparable specifications. All three can carry five people. The horsepower is identical for the Hyundai Elantra and Kia Soul, as they have the same engine manufacturer (Lee & Cho, n.d.).
In terms of gas mileage, the cars do have some differences. The Hyundai Elantra has the best gas mileage, running at about 37 mpg (2023 Hyundai, n.d.). However, the Toyota Corolla is similar to the Hyundai Elantra, with a gas mileage of about 35 mpg (2024 Toyota, n.d). The Kia Soul has a gas mileage of 31 mpg, the worst of the three (2024 Kia, n.d.). While many factors go into gas mileage, drag is one of the most important. As shown by the data in this study, cars with a shape similar to the Hyundai Elantra (of which there are many) have a better drag coefficient than more boxy cars like the Kia Soul, which will give them better gas mileage.
5.4. Horsepower Discrepancy
Note that there is a significant discrepancy between the horsepower given in
Table 1 and the horsepower calculated in
Table 7. This is because if a car has a certain horsepower, it does not mean that it uses all its power all the time. Only when a car is being driven at its maximum speed will horsepower equal the advertised horsepower of a car. Normally, power usage is well below this maximum. This explains the discrepancy, considering we are testing the cars at street-legal speeds.
5.5. Results Comparison
When looking at our study's results, cars with inefficient drag have likely decreased gas mileage. Thus, the design of a vehicle is highly critical to affordability and sustainability. The lower the gas mileage, the more costly a car is to the environment (and consumers’ wallets). Vehicles with low gas mileage emit more carbon emissions into the atmosphere. Additionally, they require fuel refills more frequently, making them costly to own and depleting the world of fossil fuels, a natural, non-renewable resource.
Of course, not all cars with lower gas mileage are necessarily bad. Some vehicles (including most SUVs) counteract their low gas mileage with other benefits, like having more seating to increase travel efficiency. Unfortunately, the Kia Soul does not have these extra benefits. When compared to the Hyundai Elantra, it seems to be a less friendly choice for the environment.
Car engineers need to start thinking about their car designs' environmental effects. Designing vehicles with low drag in mind will make them fuel efficient, increasing consumer satisfaction and benefiting the environment. Although design modifications might seem insignificant, they affect many cars, helping to slow climate change and preserve our planet.
5.6. Comparison of Drag Force Modeled With and Without a Gap Beneath Car
Here we discuss the comparison of the modeling results for the drag force on the cars with and without a gap between the street and the car bottom. Although the values of the drag coefficient and drag force change slightly in comparison to our previous simulations, the order of these variables for our three cars remains the same. Therefore, our initial analysis holds despite its simplicity.
Furthermore, based on the above discussed simulations, we expect that adding wheels and performing 3D rather than 2D simulations would produce small changes in the variables but their order for the three cars would remain the same.
Figure 7 and
Figure 8 show the results for drag coefficients on the car meshes.
Figure 8 and
Figure 10 show the results for drag force on the meshes. As shown
Figure 8 and 10, the results between the cars without the gap between the bottom of the car and the road (used in drag calculations for
Figure 7 and
Figure 9) are very similar to the drag calculations of the cars with the gap.
Figure 12, above, shows the difference between the meshes Toyota Corolla without a gap beneath the car and a Toyota Corolla with a gap beneath the car. The gap in
Figure 12b mimics the distance that would be placed between the car and the road if a wheel was present. Based on the results in
Figure 7,
Figure 8,
Figure 9,
Figure 10, there is a relatively little margin of error in the accuracy of this study’s results. It also confirms the efficacy of 2D testing. The results of the drag coefficient and drag force comparisons do not change with our without the gap, which leads us to assume that the comparison would remain the same with or without a 3D model or a model with wheels. Thus, for the results of comparison, the meshes used in this study are sufficiently accurate.
5.7. Environmental Implications
This study emphasizes the implications of vehicle design and lowered drag coefficient on the environment. Sustainable design has the possibility to significantly increase fuel efficiency, thereby reducing the carbon emissions in cars. Even more promising is the idea that sustainable design can be implemented in cars, no matter what their power source is. Whether gas, hybrid, electric, or something new, efficient designs can be implemented as an added carbon emission reducing feature. This has the possibility to significantly reduce the share of carbon emissions that cars add to our atmosphere.
6. Conclusion
Our study compared the impact of car design on drag using 2D models of the Toyota Corolla, Hyundai Elantra, and Kia Soul. Our simulations, created using ANSYS Fluent, show that the similarly shaped, sleek and smooth Hyundai Elantra and Toyota Corolla have similar drag coefficients and drag force (although the Elantra is slightly better). For the considered velocity range, there is a 3-7% difference in the drag coefficient and a 2-3% difference in the drag force between these two cars. However, the boxy (squarish) Kia Soul has a markedly higher drag coefficient and drag force than the Elantra or Corolla. For the considered velocity range, the difference between the Kia Soul and the other two cars, in terms of drag coefficient, is 112-117%, and, in terms of drag force, 108-110%. The Kia Soul is less aerodynamically efficient and contributes more to climate change without offering other benefits to offset this adverse effect. Our results demonstrate that cars that may look similar, such as the Toyota Corolla and Hyundai Elantra, are designed with fuel efficiency and aerodynamic, rather than aesthetic, considerations in mind.
Our study highlights the existence of the persistent fluid-mechanics knowledge gap that, we argue, could be eliminated by bringing basic fluid mechanics not just to STEM but also liberal-arts college education. Then informed decisions about car purchases could lead to a collective effort to slow climate change and preserve our planet, one efficient and aerodynamically designed vehicle at a time.
Author Contributions
Conceptualization, Methodology, Software selection, Writing—review and editing: A.R.M. and Z.J.K.; Simulations, Visualization, Analysis, Writing—original draft: A.R.M.; Supervision: Z.J.K. All authors have read and agreed to the published version of the manuscript.
Funding
This research received no external funding.
Data Availability Statement
Fluent simulation data files are available upon request
Conflicts of Interest
The authors declare no conflict of interest.
References
- Acevedo-Giraldo, D., Botero-Bolivar, L., Munera-Palacio, D., & García-Navarro, J. G. (2018). Aerodynamic evaluation of different car carrier devices for drag reduction using CFD. Journal of Aerospace Technology and Management, 10. https://doi.org/10.5028/jatm.v10.971. [CrossRef]
- Andrew Moseman and Sergey Paltsev, 22 October 2022. Are electric vehicles definitely better for the climate than gas-powered cars? https://climate.mit.edu/ask-mit/are-electric-vehicles-definitely-better-climate-gas-powered-cars, accessed 11 December 2023.
- Ansys. (n.d.). Wikipedia. Retrieved September 16, 2023, from https://en.wikipedia.org/wiki/Ansys.
- Aprovitola, A., Aurisicchio, F., Di Nuzzo, P. E., Pezzella, G., & Viviani, A. (2022). Low speed aerodynamic analysis of the n2a hybrid wing–body. Aerospace, 9(2), 89. https://doi.org/10.3390/aerospace9020089. [CrossRef]
- Auto Action,16 February 2021, 10 Popular Features to Consider When Buying a Car. https://www.autoactionaz.com/blog/10-popular-features-to-consider-when-buying-a-car/, accessed 11 December 2023.
- Banuri, S. H. A. S., Qayyum, U., Qureshi, K. R., & Ahmed, A. (2020). Investigation of drag coefficients for various car models. IEEE Xplore. https://doi.org/10.1109/ibcast47879.2020.9044503. [CrossRef]
- Barenblatt, G.I. 1987. Dimensional Analysis. Gordon and Breach Science Publishers, pp. 135.
- Chen, Y., Sun, R., & Wu, X. (2021). Estimating bounds of aerodynamic, mass, and auxiliary load impacts on autonomous vehicles: A powertrain simulation approach. Sustainability, 13(22), 12405. https://doi.org/10.3390/su132212405. [CrossRef]
- Czyż, Z., Karpiński, P., Gęca, M., & Diaz, J. (2018). THE AIR FLOW INFLUENCE ON THE DRAG FORCE OF A SPORTS CAR. Advances in Science and Technology Research Journal, 12(2), 121-127. https://doi.org/10.12913/22998624/86213. [CrossRef]
- Desai, M., Channiwala, S. A., & Nagarsheth, H. J. (2008). Experimental and Computational Aerodynamic Investigations of a Car. WSEAS Transactions on Fluid Mechanics, 3(4), 359-368. https://citeseerx.ist.psu.edu/document?repid=rep1&type=pdf&doi=7096780f09b5394d4262c259ff8d380c324fd9e1.
- Felekos, G., Douvi, E., & Margaris, D. (2022). Cost-effective numerical analysis of the drivaer fastback model aerodynamics. Proceedings of the Institution of Mechanical Engineers, Part D: Journal of Automobile Engineering, 095440702211359. https://doi.org/10.1177/09544070221135908. [CrossRef]
- Findlay Kia. (n.d.). Findlay Kia. Retrieved September 16, 2023, from https://www.findlaykia.com/searchnew.aspx.
- Forrester, R. (2020). The invention of the internal combustion engine and the motor car. Humanities Commons. https://doi.org/10.17613/73DC-BQ47. [CrossRef]
- 4.4.3 Realizable k-epsilon Model. (n.d.). AFS. https://www.afs.enea.it/project/neptunius/docs/fluent/html/th/node60.htm.
- Fu, C., Uddin, M., & Zhang, C. (2020). Computational analyses of the effects of wind tunnel ground simulation and blockage ratio on the aerodynamic prediction of flow over a passenger vehicle. Vehicles, 2(2), 318-341. https://doi.org/10.3390/vehicles2020018. [CrossRef]
- Garvin, J. (2023). A Student's Guide to the Navier-Stokes Equations (Student's Guides). Cambridge: Cambridge University Press. https://doi.org/10.1017/9781009236119. [CrossRef]
- González, A., & Hinojosa, J. (2019). Study of the influence of protuberances in the trailing edge of airfoils and determination of their aerodynamic efficiency through CFD using ansys fluent. Revista Internacional De Métodos Numéricos Para Cálculo Y Diseño En Ingeniería, 35. https://doi.org/10.23967/j.rimni.2019.07.001. [CrossRef]
- Hassan, S. R., Islam, T., Ali, M., & Islam, M. Q. (2014). Numerical study on aerodynamic drag reduction of racing cars. Procedia Engineering, 90, 308-313. https://doi.org/10.1016/j.proeng.2014.11.854. [CrossRef]
- Icingur, Y., & Solmaz, H. (2011). Determination of Drag Coefficients of Various Automobile Models in a Low-Speed Wind Tunnel. Journal of the Faculty of Engineering and Architecture of Gazi University, 26(no 2), 454-459.
- Khan, S. A., & Manarvi, I. (n.d.). Selecting a sports car through data mining of critical features. IEEE Xplore. https://doi.org/10.1109/iccie.2009.5223721. [CrossRef]
- Kim, T. G., Lee, S.-K., & Lee, H. H. (2009). Characterization and quantification of luxury sound quality in premium-class passenger cars. Proceedings of the Institution of Mechanical Engineers, Part D: Journal of Automobile Engineering, 223(3), 343-353. https://doi.org/10.1243/09544070jauto989.
- Kleinstreuer, C. (2009). Fundamental equations and solutions. Fluid Mechanics and Its Applications, 41-98. https://doi.org/10.1007/978-1-4020-8670-0_2. [CrossRef]
- Lanzafame, R., Mauro, S., & Messina, M. (2016). Numerical and experimental analysis of micro hawts designed for wind tunnel applications. International Journal of Energy and Environmental Engineering, 7(2), 199-210. https://doi.org/10.1007/s40095-016-0202-8. [CrossRef]
- Lee, B.-H., & Cho, S.-J. (n.d.). Merger and reconfiguring of Hyundai-Kia. Research Gate. https://gerpisa.org/rencontre/9.rencontre/S13Lee-Cho.pdf.
- Mack, J.E. 1947. Semi-popular motion picture record of the Trinity explosion. MDDC221. U.S. Atomic Energy Commission.
- Mijailović, R. (2013). The optimal lifetime of passenger cars based on minimization of co2 emission. Energy, 55, 869-878. https://doi.org/10.1016/j.energy.2013.04.008. [CrossRef]
- McKinsey & Company, 23 February 2023: The race to decarbonize electric-vehicle batteries. https://www.mckinsey.com/industries/automotive-and-assembly/our-insights/the-race-to-decarbonize-electric-vehicle-batteries, accessed 11 December 2023.
- Nath, D. S., Pujari, P. C., Jain, A., & Rastogi, V. (2021). Drag reduction by application of aerodynamic devices in a race car. Advances in Aerodynamics, 3(1). https://doi.org/10.1186/s42774-020-00054-7. [CrossRef]
- Nature, E. (2021, June 22). ANSYS-Fluent tutorial || flow over car-vehicle || drag calculation [Video]. YouTube. https://www.youtube.com/watch?v=NGbelRBMhjk&t=878s&ab_channel=EngineeringNature.
- S, V., Gangad, V. S., V, J., Maheswarreddy, Krishna, A., & Mukkamala, Y. S. (2019). Windscreen angle and hood inclination optimization for drag reduction in cars. Procedia Manufacturing, 30, 685-692. https://doi.org/10.1016/j.promfg.2019.02.062. [CrossRef]
- Sekine, Y., Takahashi, K., Hayamizu, H., Kawamoto, D., & Nakagawa, D. (2008). Compatibility between sports-utility vehicles and sedan-type vehicles. International Journal of Crashworthiness, 13(5), 551-558. https://doi.org/10.1080/13588260802267453. [CrossRef]
- Sherman, D. (2014, June 6). How a Wind Tunnel Works. Car and Driver. https://www.caranddriver.com/news/a15362503/how-a-wind-tunnel-works/.
- Singh, A., Jain, A., & Sharma, A. (2020). Designing a 3-D model of bodywork of a vehicle with low coefficient of drag and high downforce. Materials Today: Proceedings, 28, 2197-2204. https://doi.org/10.1016/j.matpr.2020.04.253. [CrossRef]
- Sivaraj, G., Parammasivam, K. M., Prasath, M. S., & Lakshmanan, D. (2023). KK. Journal of Applied Fluid Mechanics, 16(9). https://doi.org/10.47176/jafm.16.09.1828. [CrossRef]
- Susca, L., Mandorli, F., Rizzi, C., & Cugini, U. (2000). Racing car design using knowledge aided engineering. Artificial Intelligence for Engineering Design, Analysis and Manufacturing, 14(3), 235-249. https://doi.org/10.1017/s0890060400143057. [CrossRef]
- Stephanie Safdie, updated 20 Sep 2023. What’s the Impact of Vehicle Emissions on the Planet? Greenly. https://greenly.earth/en-us/blog/ecology-news/vehicle-emissions-whats-the-impact-on-the-planet, accessed 11 December 2023.
- Taylor, Geoffrey Ingram. 1950a. The formation of a blast wave by a very intense explosion I. Theoretical discussion. Proceedings of the Royal Society of London. Series A. Mathematical and Physical Sciences 201.1065: 159-174.
- Taylor, Geoffrey Ingram. 1950b. The formation of a blast wave by a very intense explosion II. The atomic explosion of 1945. Proceedings of the Royal Society of London. Series A. Mathematical and Physical Sciences 201.1065: 159-174.
- The U.S. Energy Information Administration (US EIA), October 2023, What is U.S. electricity generation by energy source? https://www.eia.gov/tools/faqs/faq.php?id=427, accessed 11 December 2023.
- Toyota Corolla. (n.d.). Toyota. Retrieved September 16, 2023, from https://www.toyota.com/corolla/.
- 2024 Kia Soul LX IVT Features And Specs. (n.d.). Car and Driver. Retrieved September 16, 2023, from https://www.caranddriver.com/kia/soul/specs.
- 2024 Toyota Corolla LE CVT (Natl) Features And Specs. (n.d.). Car and Driver. Retrieved September 16, 2023, from https://www.caranddriver.com/toyota/corolla/specs.
- 2023 Hyundai Elantra N Sedan. (n.d.). SRHyundai. https://www.srhyundai.com/showroom/2023/Hyundai/Elantra+N/Sedan.htm.
- 2023 Hyundai Elantra SE IVT Features And Specs. (n.d.). Car and Driver. Retrieved September 16, 2023, from https://www.caranddriver.com/hyundai/elantra-2023/specs.
- van Wachem, B., & Almstedt, A. (2003). Methods for multiphase computational fluid dynamics. Chemical Engineering Journal, 96(1-3), 81-98. https://doi.org/10.1016/j.cej.2003.08.025. [CrossRef]
- Vinuesa, R., & Brunton, S. L. (2022). Emerging trends in machine learning for computational fluid dynamics. Computing in Science & Engineering, 24(5), 33-41. https://doi.org/10.1109/mcse.2023.3264340. [CrossRef]
- Wang, A. X. G., & Kabala, Z. J. (2022). Body morphology and drag in swimming: CFD analysis of the effects of differences in male and female body types. Fluids, 7(10), 332. https://doi.org/10.3390/fluids7100332. [CrossRef]
- Zaïdi, H., Fohanno, S., Taïar, R., & Polidori, G. (2010). Turbulence model choice for the calculation of drag forces when using the CFD method. Journal of Biomechanics, 43(3), 405-411. https://doi.org/10.1016/j.jbiomech.2009.10.010. [CrossRef]
- Zhang, Y. C., Zhao, F., Shao, S. X., & Jin, G. Y. (2012). Aerodynamic drag reduction design of concept sports car. Applied Mechanics and Materials, 184-185, 24-27. https://doi.org/10.4028/www.scientific.net/amm.184-185.24 . [CrossRef]
Figure 1.
Toyota Corolla, Hyundai Elantra, Kia Soul (respectively), after Adobe Photoshop adjustment.
Figure 1.
Toyota Corolla, Hyundai Elantra, Kia Soul (respectively), after Adobe Photoshop adjustment.
Figure 2.
Toyota Corolla, Hyundai Elantra, Kia Soul (respectively), after Adobe Illustrator adjustment.
Figure 2.
Toyota Corolla, Hyundai Elantra, Kia Soul (respectively), after Adobe Illustrator adjustment.
Figure 3.
(a) Toyota Corolla Contour, (b) Hyundai Elantra Contour, and (c) Kia Soul Contour.
Figure 3.
(a) Toyota Corolla Contour, (b) Hyundai Elantra Contour, and (c) Kia Soul Contour.
Figure 4.
(a) Toyota Corolla Meshing, with 51652 nodes (b) Hyundai Elantra Meshing, with 53234 nodes, (c) Kia Soul Meshing, with 52269 nodes, (d) zoomed-in example of Toyota Corolla meshing, to show more grid details.
Figure 4.
(a) Toyota Corolla Meshing, with 51652 nodes (b) Hyundai Elantra Meshing, with 53234 nodes, (c) Kia Soul Meshing, with 52269 nodes, (d) zoomed-in example of Toyota Corolla meshing, to show more grid details.
Figure 5.
(a,b,c) Meshing to include a gap between the car and road: (a) Toyota Corolla Mesh-ing, with 59050 nodes (b) Hyundai Elantra Meshing, with 59548 nodes (c) Kia Soul Meshing, with 59190 nodes; (d,e,f) zoomed-in example of Toyota Corolla meshing, to demonstrate grid details .
Figure 5.
(a,b,c) Meshing to include a gap between the car and road: (a) Toyota Corolla Mesh-ing, with 59050 nodes (b) Hyundai Elantra Meshing, with 59548 nodes (c) Kia Soul Meshing, with 59190 nodes; (d,e,f) zoomed-in example of Toyota Corolla meshing, to demonstrate grid details .
Figure 6.
Graph of Mesh Convergence Test on Toyota Corolla.
Figure 6.
Graph of Mesh Convergence Test on Toyota Corolla.
Figure 11.
(a) Toyota Corolla, (b) Hyundai Elantra.
Figure 11.
(a) Toyota Corolla, (b) Hyundai Elantra.
Figure 12.
(a) Toyota Corolla Mesh without Gap, (b) Toyota Corolla Mesh with Gap.
Figure 12.
(a) Toyota Corolla Mesh without Gap, (b) Toyota Corolla Mesh with Gap.
Table 1.
Toyota Corolla, Hyundai Elantra, and Kia Soul specs (2024 Toyota, n.d) (2023 Hyundai, n.d.) (2024 Kia, n.d.).
Table 1.
Toyota Corolla, Hyundai Elantra, and Kia Soul specs (2024 Toyota, n.d) (2023 Hyundai, n.d.) (2024 Kia, n.d.).
 |
| |
Toyota Corolla |
Hyundai Elantra |
Kia Soul |
| # of Passengers |
5 |
5 |
5 |
| Gas Mileage |
35 mpg |
37 mpg |
31 mpg |
| Horsepower @ RPM |
169 @ 6600 |
147 @ 6200 |
147 @ 6200 |
| Length |
182.5 in |
184.1 in |
165.2 in |
Table 2.
Results for Mesh Convergence Test on Toyota Corolla.
Table 2.
Results for Mesh Convergence Test on Toyota Corolla.
| Mesh Quality |
Nodes |
Drag Coefficient |
Change (%) |
| Very Coarse |
4878 |
0.1952 |
N/A |
| Coarse |
25849 |
0.1861 |
4.66 |
| Medium-Coarse |
51652 |
0.1761 |
5.37 |
| Medium-Fine |
66954 |
0.1755 |
0.34 |
| Fine |
100705 |
0.1754 |
0.06 |
| Very Fine |
128519 |
0.1753 |
0.11 |
Table 3.
Results for Drag Coefficient Simulations on the Different Car Models.
Table 3.
Results for Drag Coefficient Simulations on the Different Car Models.
| Velocity (m/s) |
Drag Coefficient (Toyota Corolla) |
Drag Coefficient (Hyundai Elantra) |
Drag Coefficient
(Kia Soul) |
| 15 |
0.0423 |
0.0389 |
0.0935 |
| 20 |
0.0576 |
0.0547 |
0.1165 |
| 25 |
0.0896 |
0.0866 |
0.1821 |
| 30 |
0.1287 |
0.1236 |
0.2618 |
| 35 |
0.1748 |
0.1677 |
0.3566 |
| 40 |
0.2489 |
0.2412 |
0.4653 |
Table 4.
Results for Drag Force Simulations With and Without Car Gap.
Table 4.
Results for Drag Force Simulations With and Without Car Gap.
| Car Model |
Velocity |
Drag Coefficient(without gap) |
Drag Coefficient(with gap) |
| Toyota Corolla |
35 |
0.1748 |
0.1635 |
| Hyundai Elantra |
35 |
0.1677 |
0.1536 |
| Kia Soul |
35 |
0.3566 |
0.3315 |
Table 5.
Results for Drag Force Simulations on the Different Car Models.
Table 5.
Results for Drag Force Simulations on the Different Car Models.
| Velocity (m/s) |
Drag Force (N)
(Toyota Corolla) |
Drag Force (N)
(Hyundai Elantra) |
Drag Force (N)
(Kia Soul) |
| 15 |
134.4791 |
128.3412 |
398.2012 |
| 20 |
256.5661 |
249.4005 |
520.1565 |
| 25 |
399.4771 |
387.2746 |
809.3776 |
| 30 |
573.1431 |
555.6874 |
1167.4348 |
| 35 |
779.3907 |
759.2669 |
1589.6189 |
| 40 |
992.9319 |
982.2931 |
2087.1231 |
Table 6.
Results for Drag Force Simulations With and Without Car Gap.
Table 6.
Results for Drag Force Simulations With and Without Car Gap.
| Car Model |
Velocity |
Drag Force (N)(without gap) |
Drag Force (N)(with gap) |
| Toyota Corolla |
35 |
779.3907 |
755.3492 |
| Hyundai Elantra |
35 |
759.2669 |
735.6234 |
| Kia Soul |
35 |
1589.6189 |
1559.3424 |
Table 7.
Power utilized by each car at different velocities, based on Drag Force Calculations from
Table 5. The power is calculated as dW/dt = F
DV in Watts and then converted to horsepower.
Table 7.
Power utilized by each car at different velocities, based on Drag Force Calculations from
Table 5. The power is calculated as dW/dt = F
DV in Watts and then converted to horsepower.
| Velocity (m/s) |
Power (hp)
(Toyota Corolla) |
Power (hp)
(Hyundai Elantra) |
Power (hp)
(Kia Soul) |
| 15 |
2.705 |
2.582 |
8.010 |
| 20 |
6.881 |
6.689 |
13.951 |
| 25 |
13.392 |
12.983 |
27.134 |
| 30 |
23.058 |
22.355 |
46.966 |
| 35 |
36.581 |
35.636 |
74.609 |
| 40 |
53.261 |
52.690 |
111.953 |
| Max Power |
169 |
147 |
147 |
|
Disclaimer/Publisher’s Note: The statements, opinions and data contained in all publications are solely those of the individual author(s) and contributor(s) and not of MDPI and/or the editor(s). MDPI and/or the editor(s) disclaim responsibility for any injury to people or property resulting from any ideas, methods, instructions or products referred to in the content. |
© 2023 by the authors. Licensee MDPI, Basel, Switzerland. This article is an open access article distributed under the terms and conditions of the Creative Commons Attribution (CC BY) license (http://creativecommons.org/licenses/by/4.0/).

