Submitted:
20 December 2023
Posted:
21 December 2023
You are already at the latest version
Abstract
Keywords:
1. Introduction
2. The Five-equations Diffuse Interface Model
2.1. Cut-off Methods
3. Numerical model
3.1. Finite volume framework
3.2. CWENO scheme
3.3. Fluxes & Time advancement
4. Test Cases
- 1.
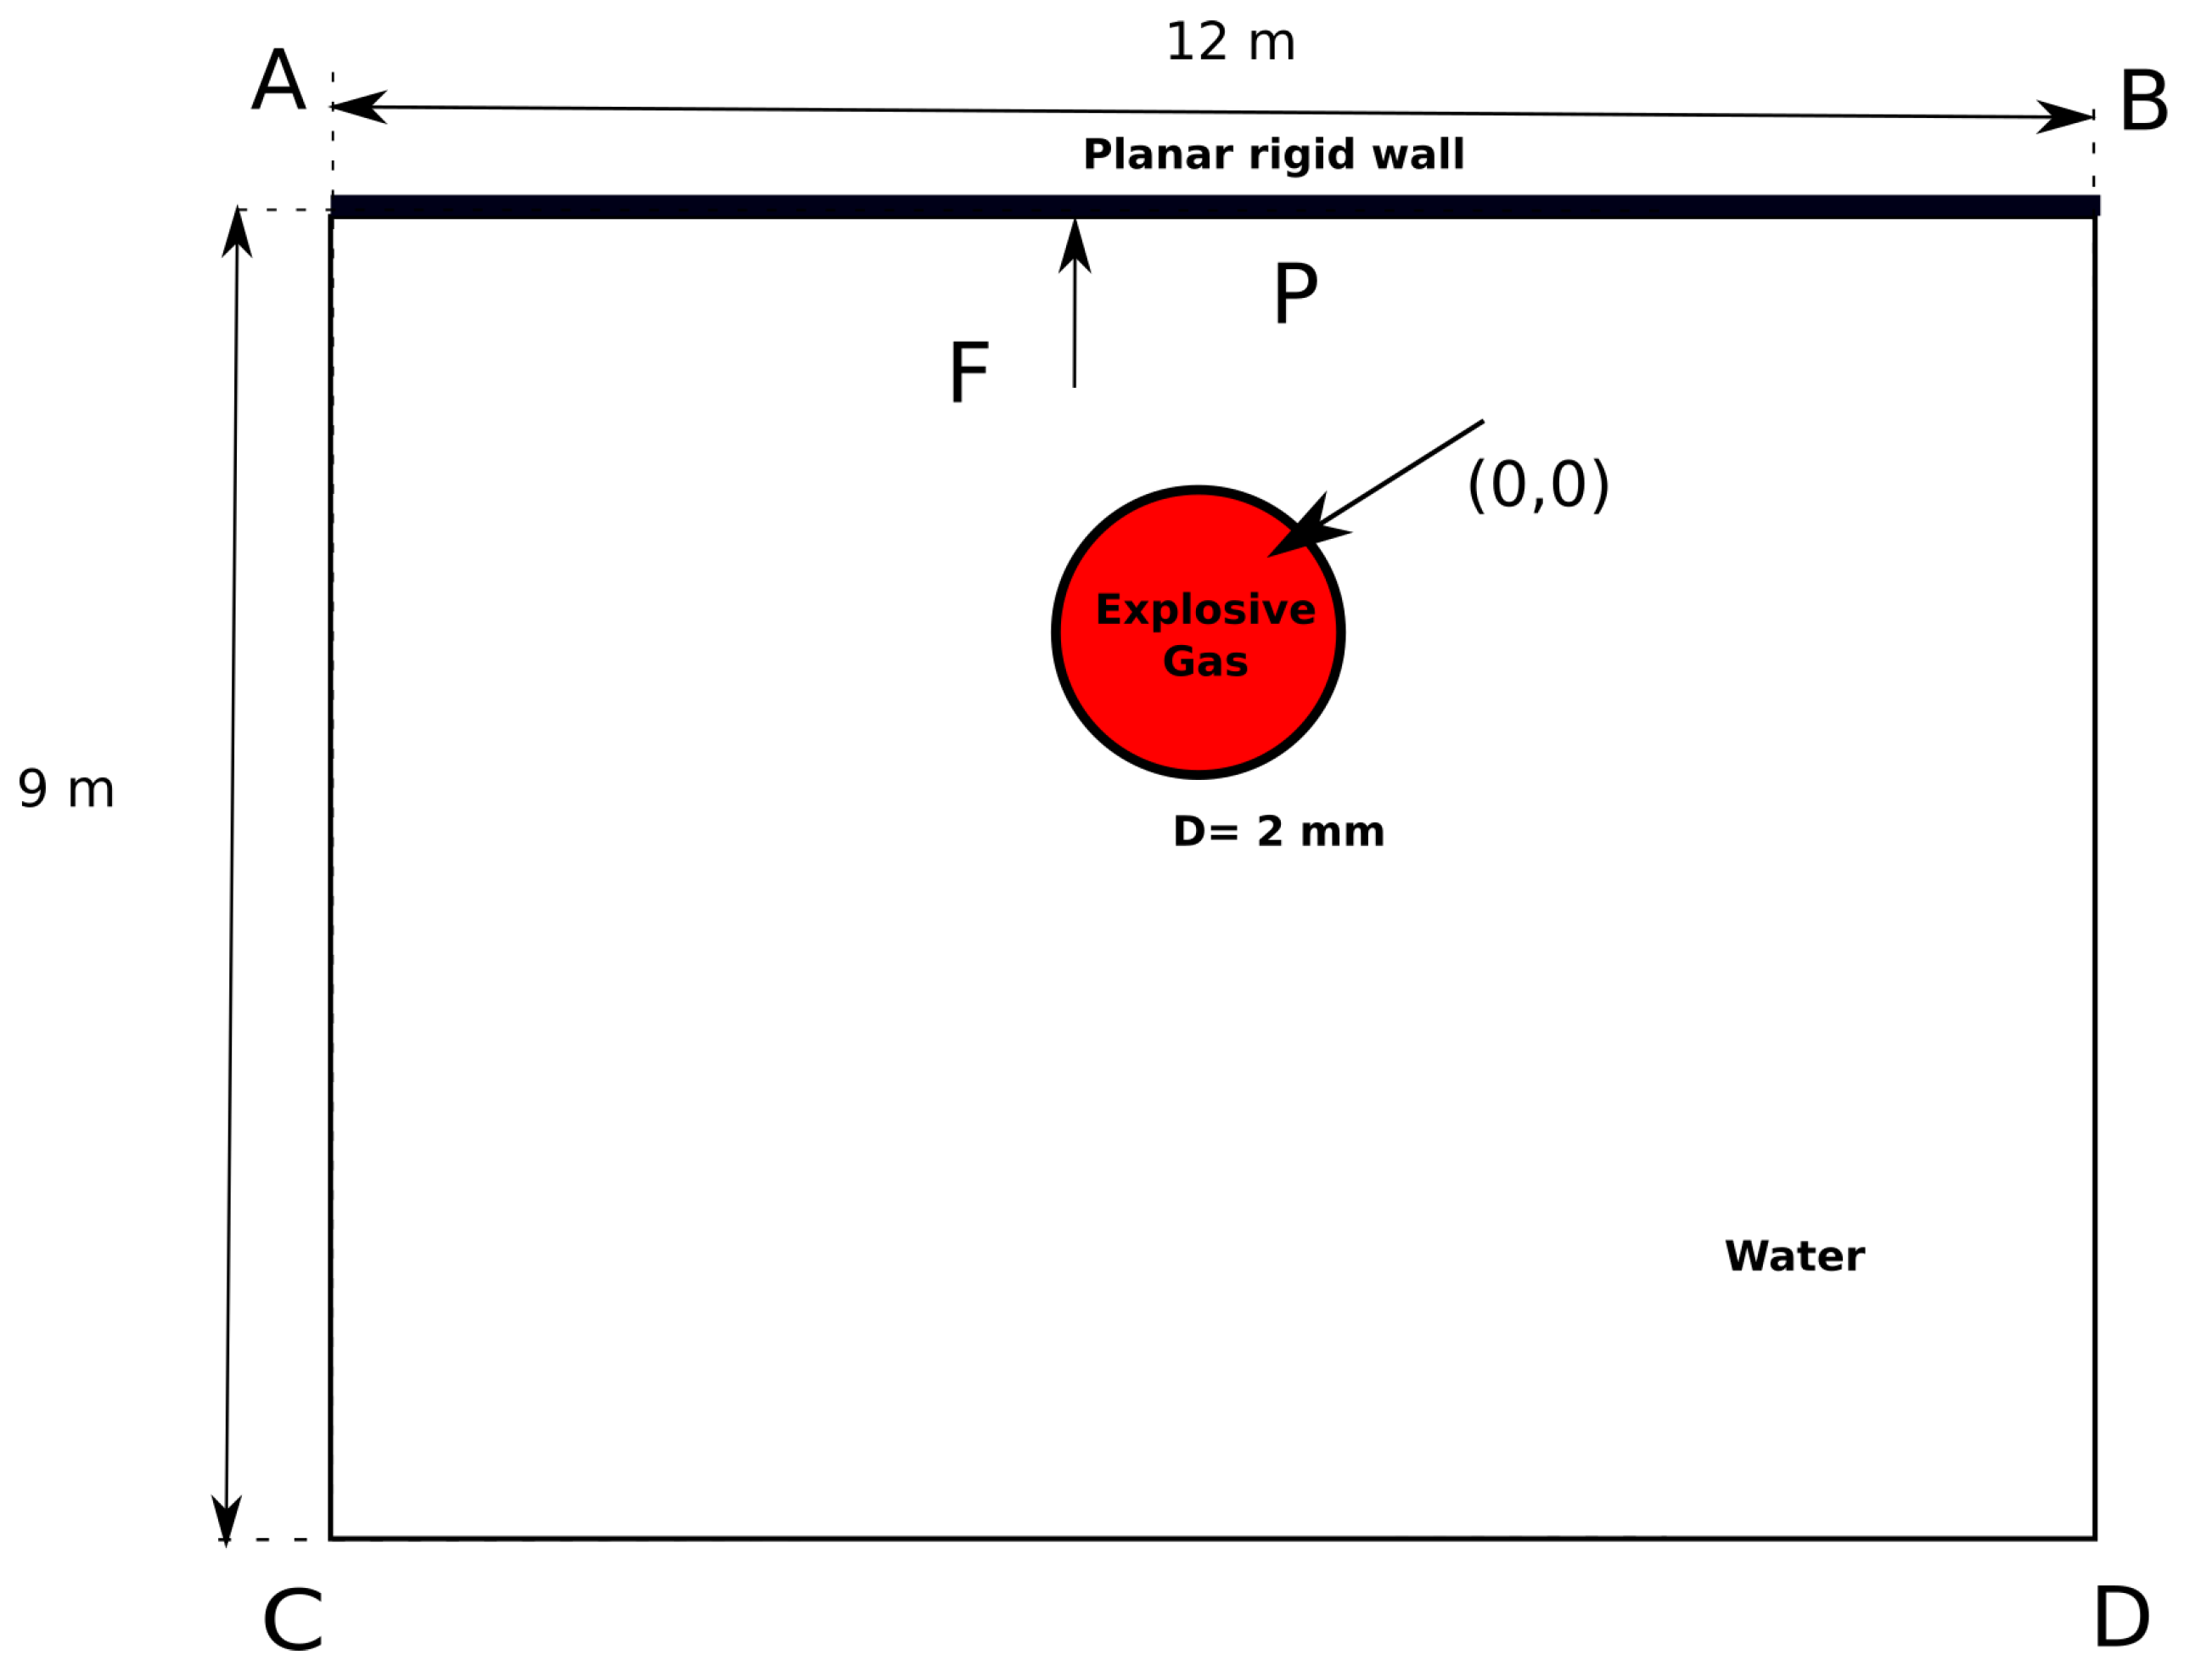
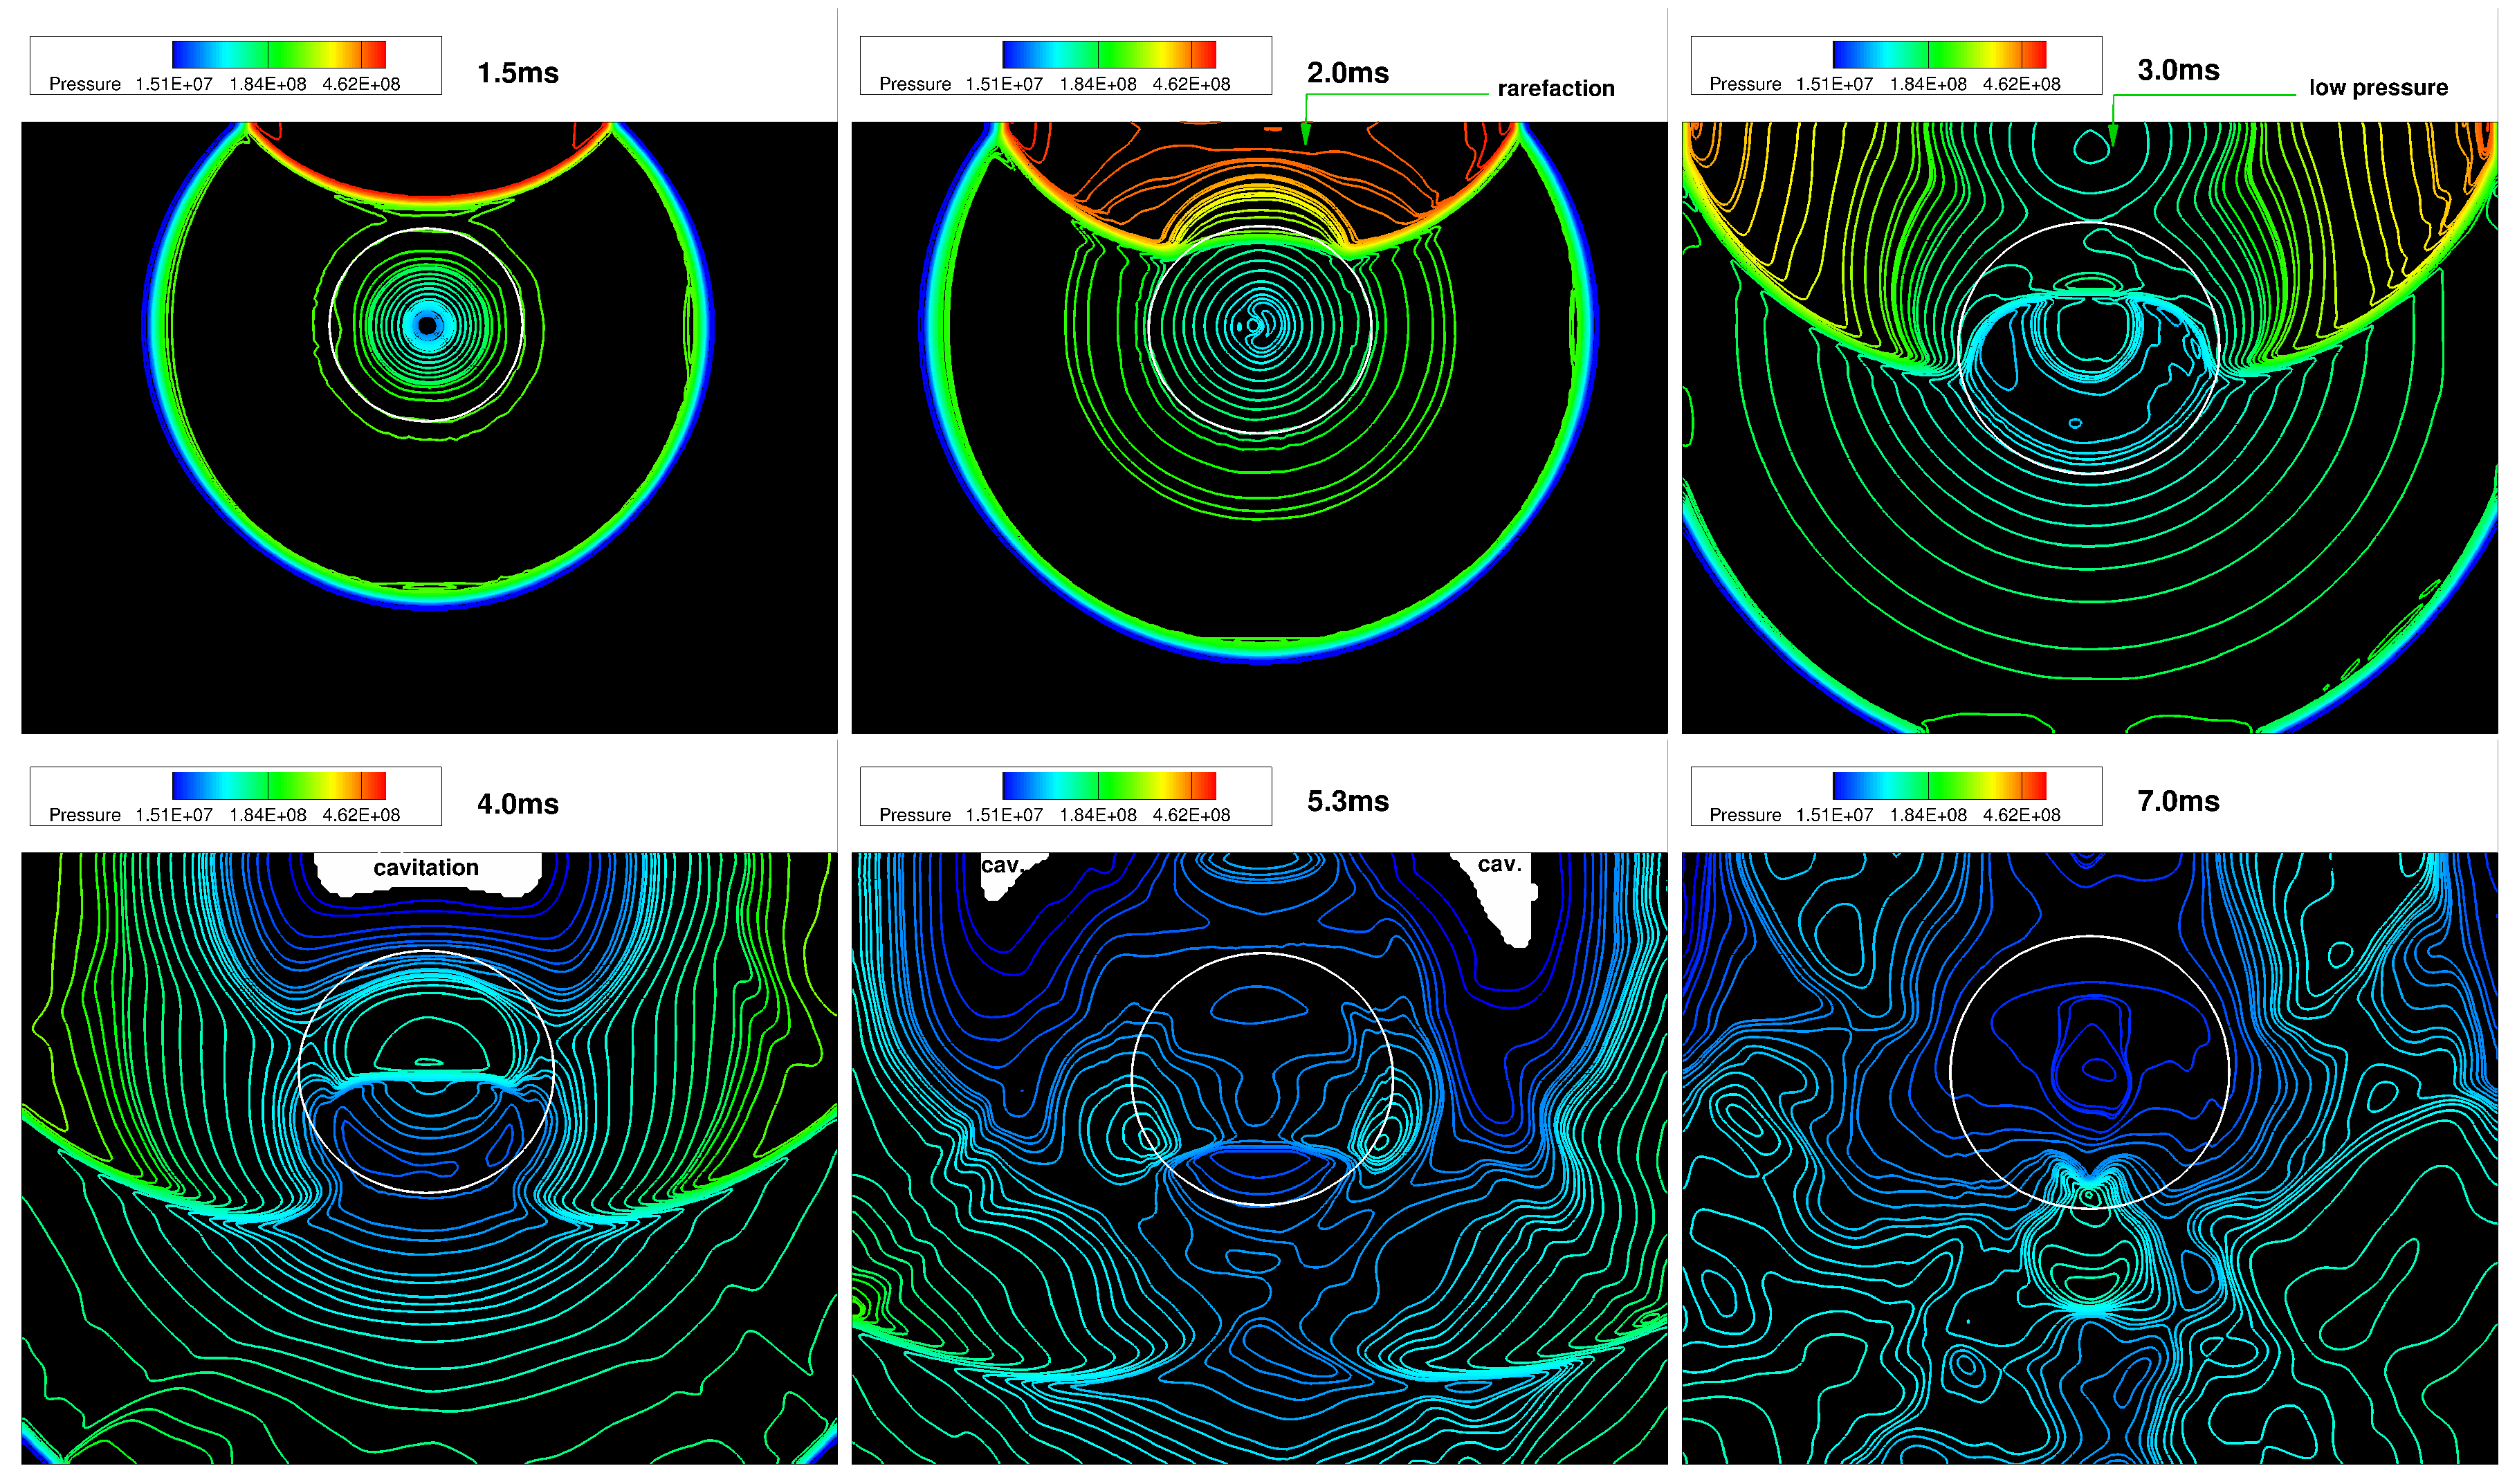
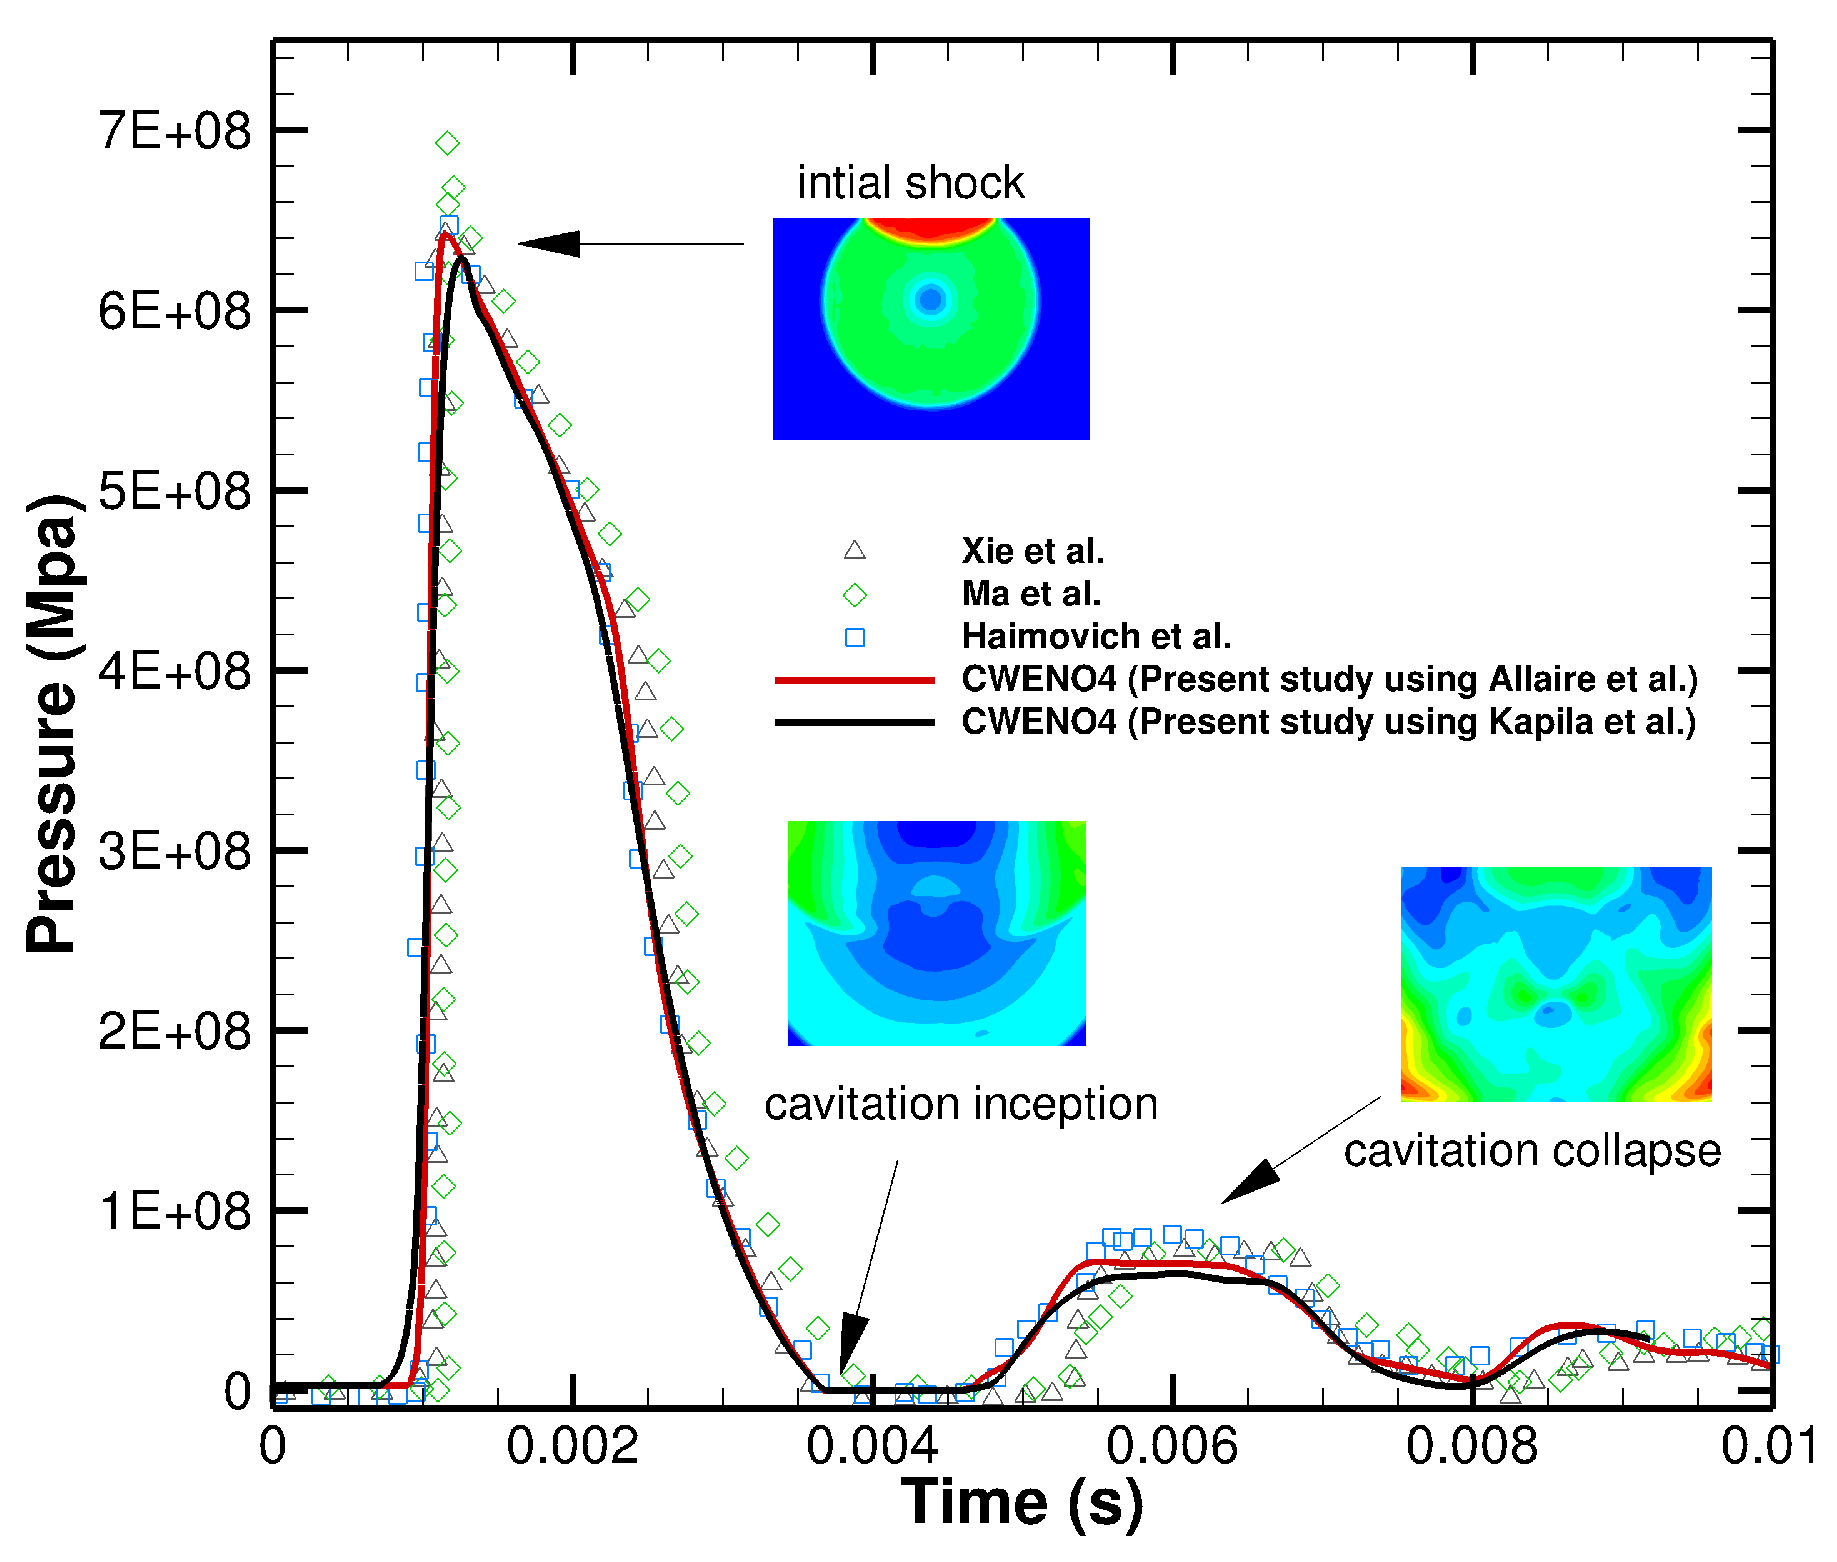
- 2D Underwater explosion near a planar wall.
- 2.
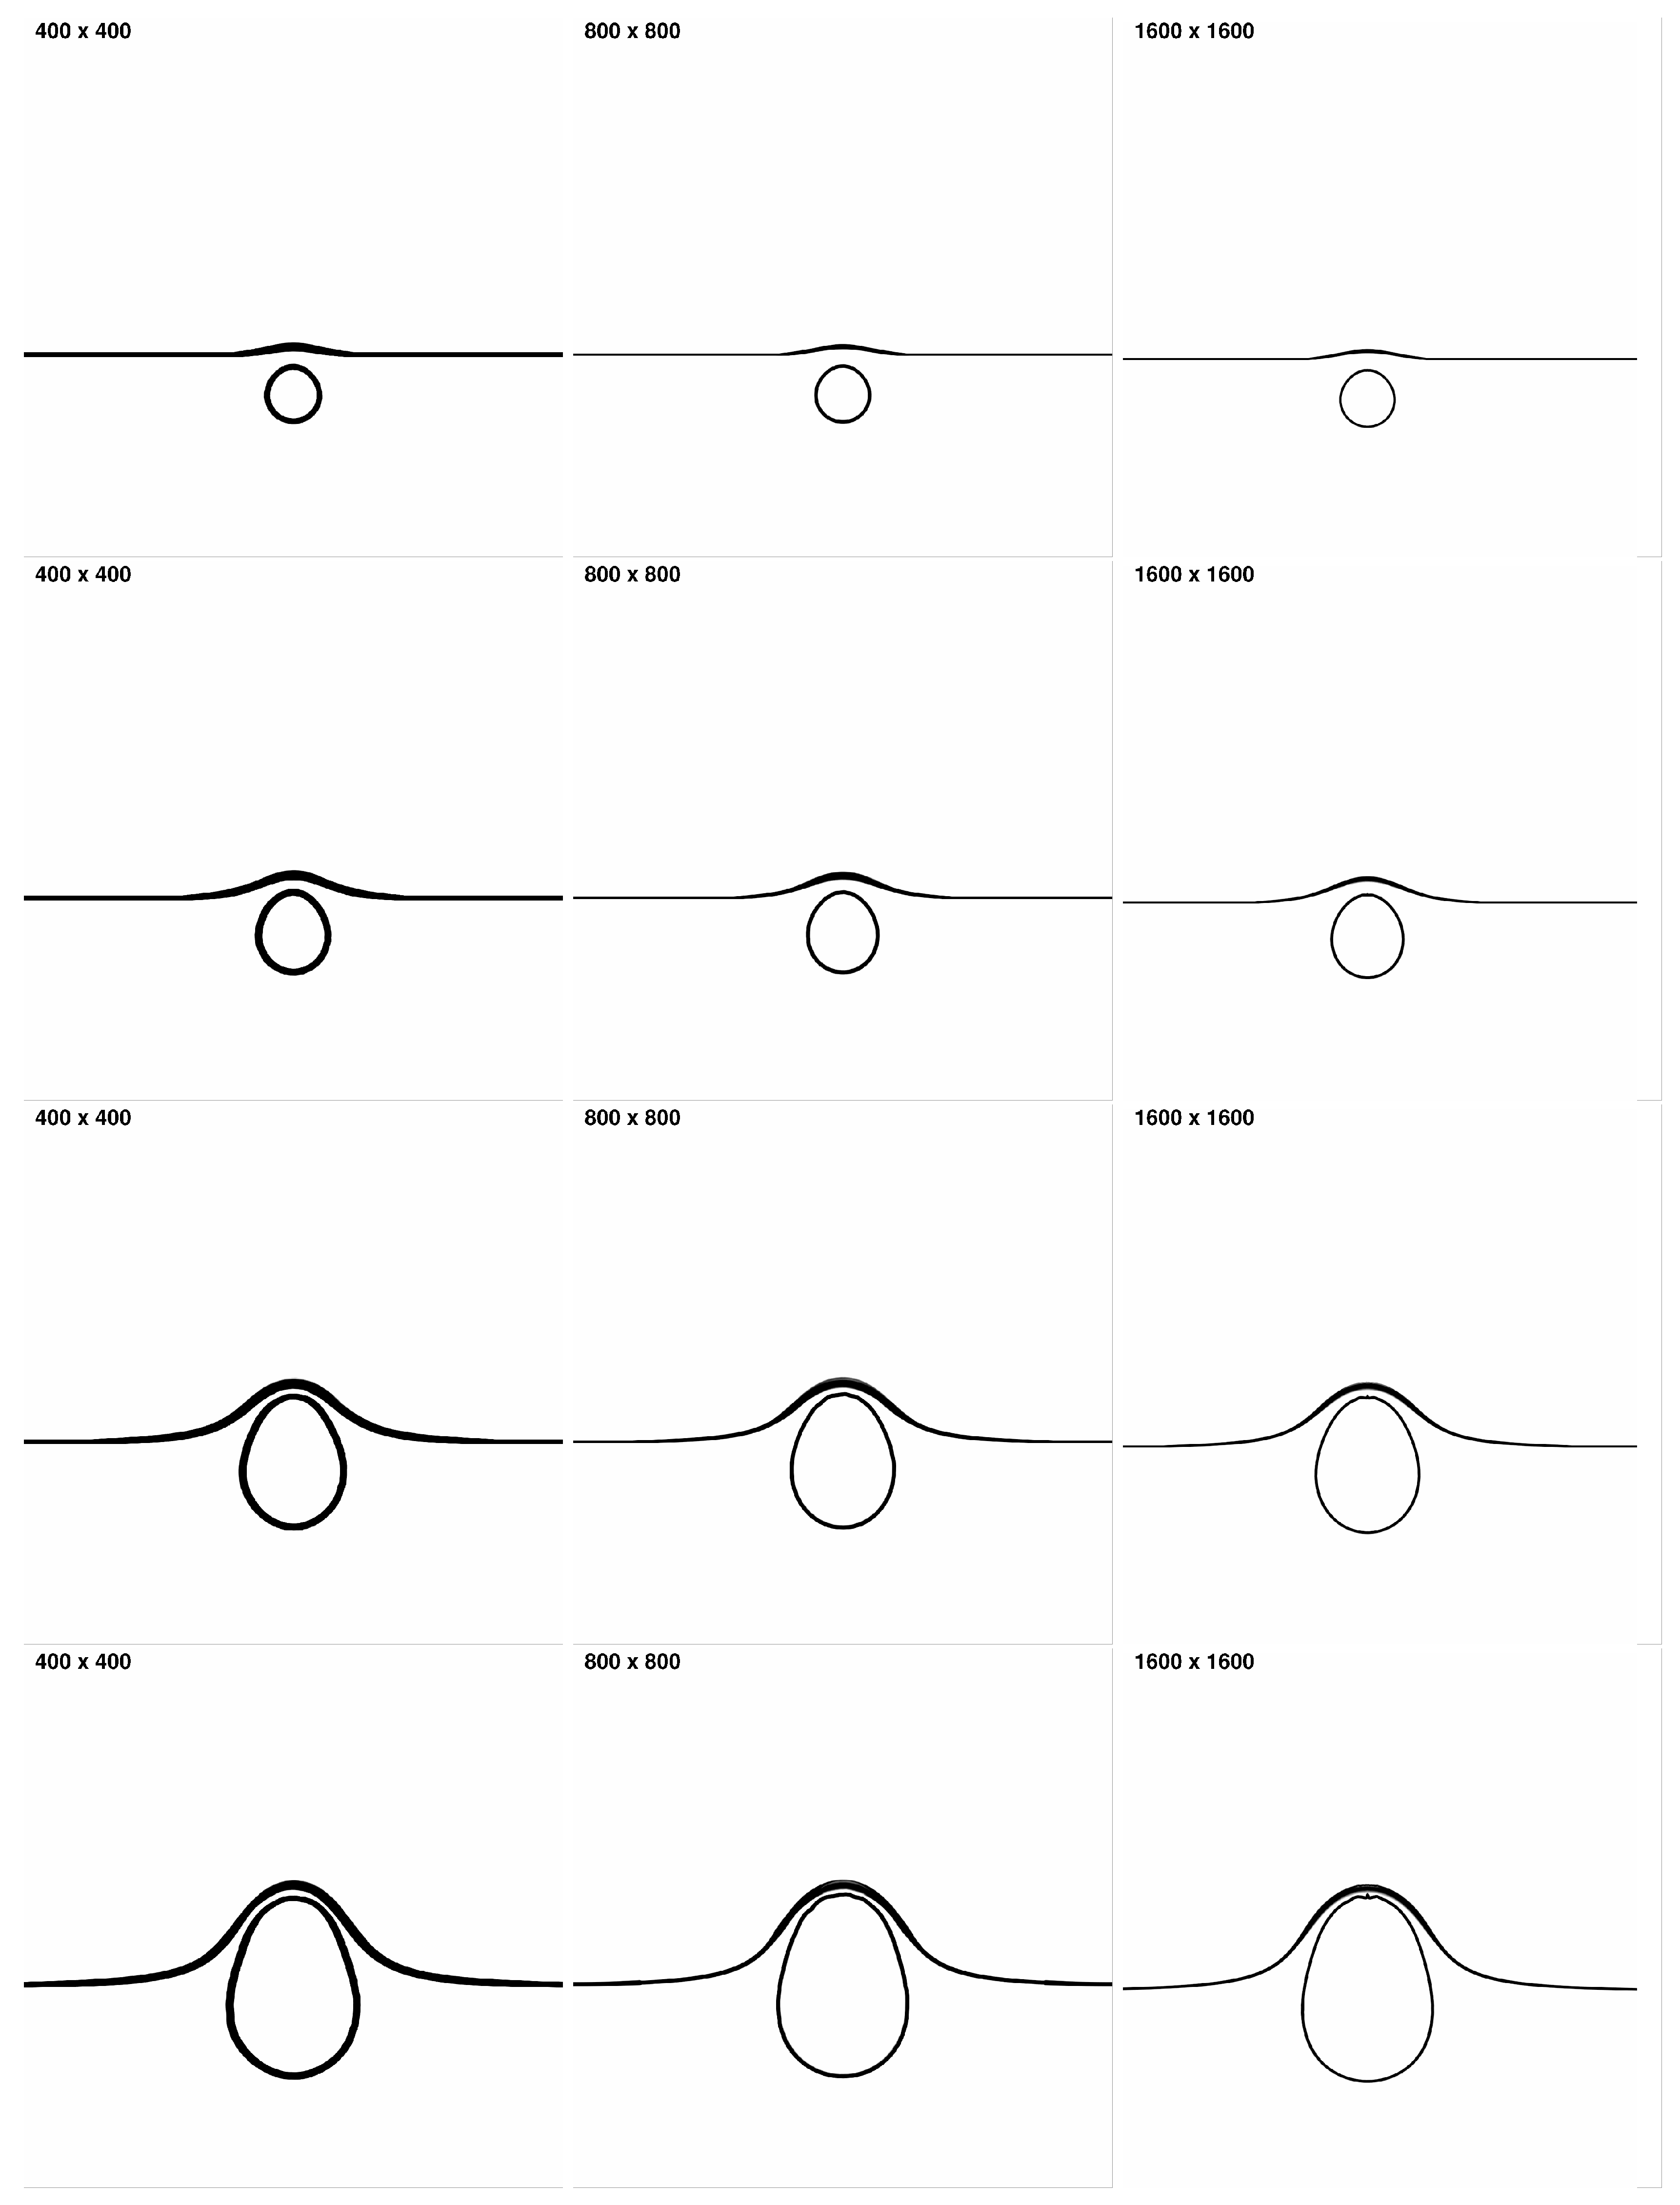
- 2D Underwater explosion near a free surface.
- 3.
- 3D Underwater explosions in a rigid cylinder.
- 4.
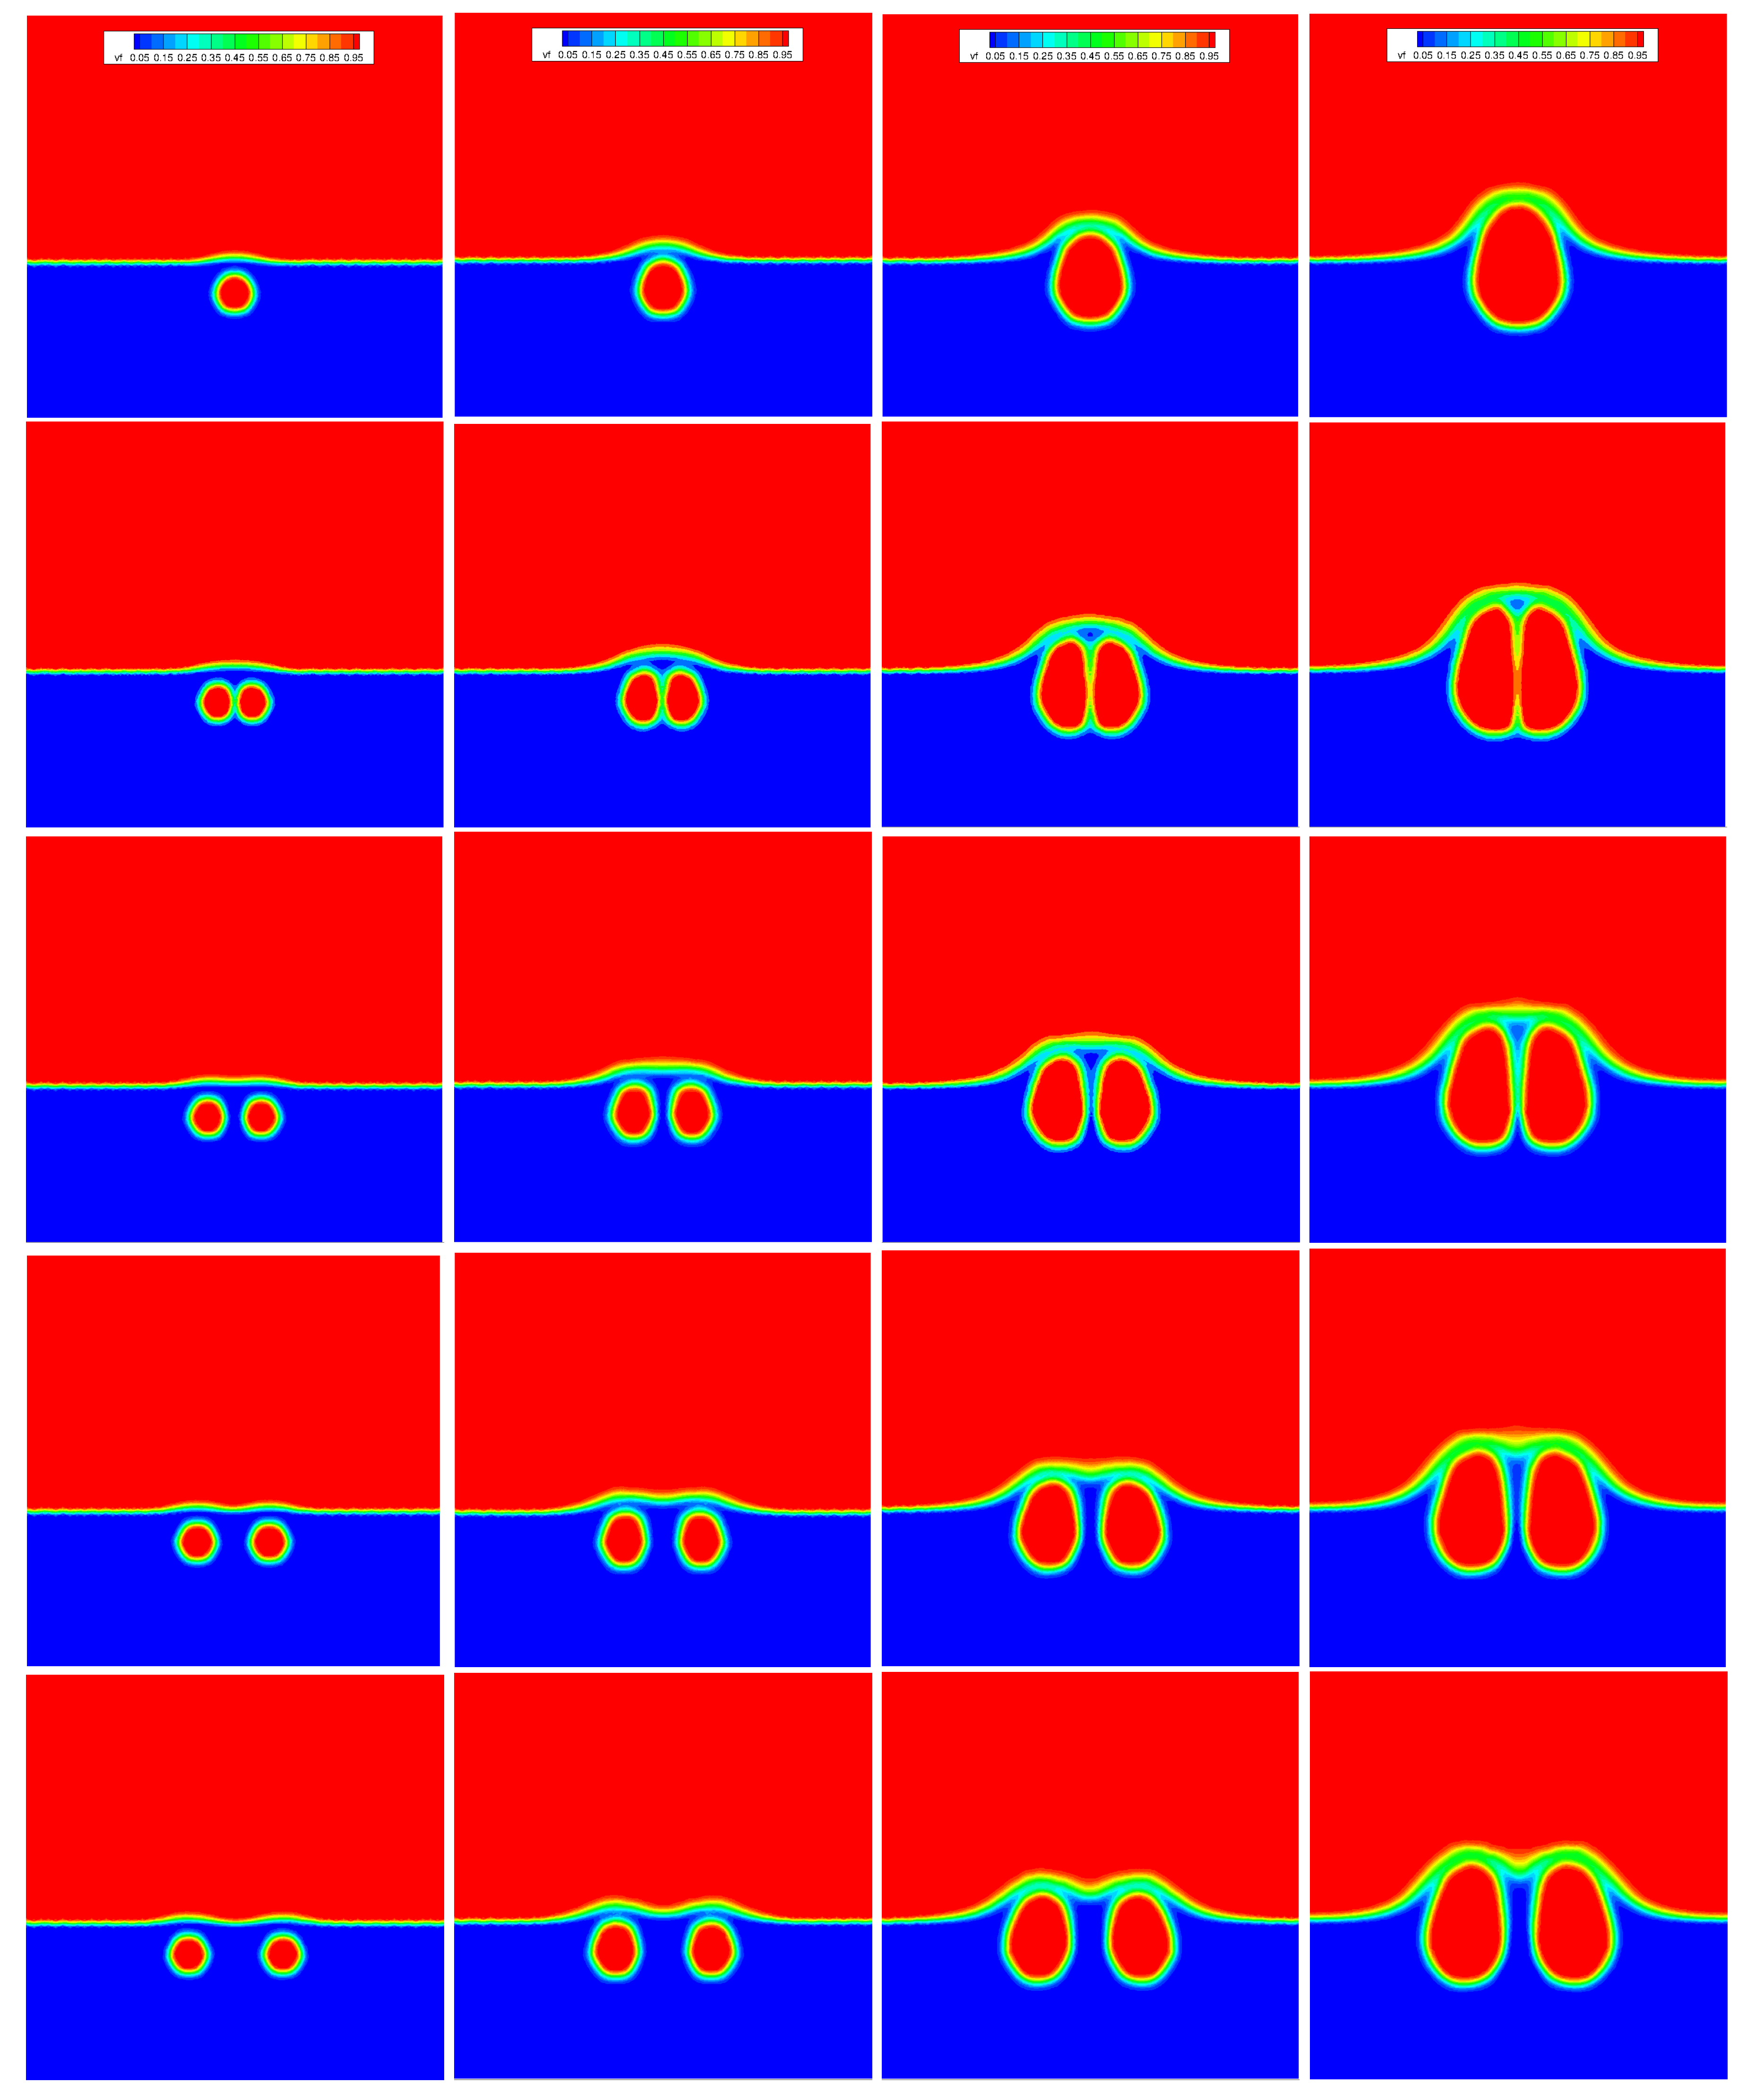
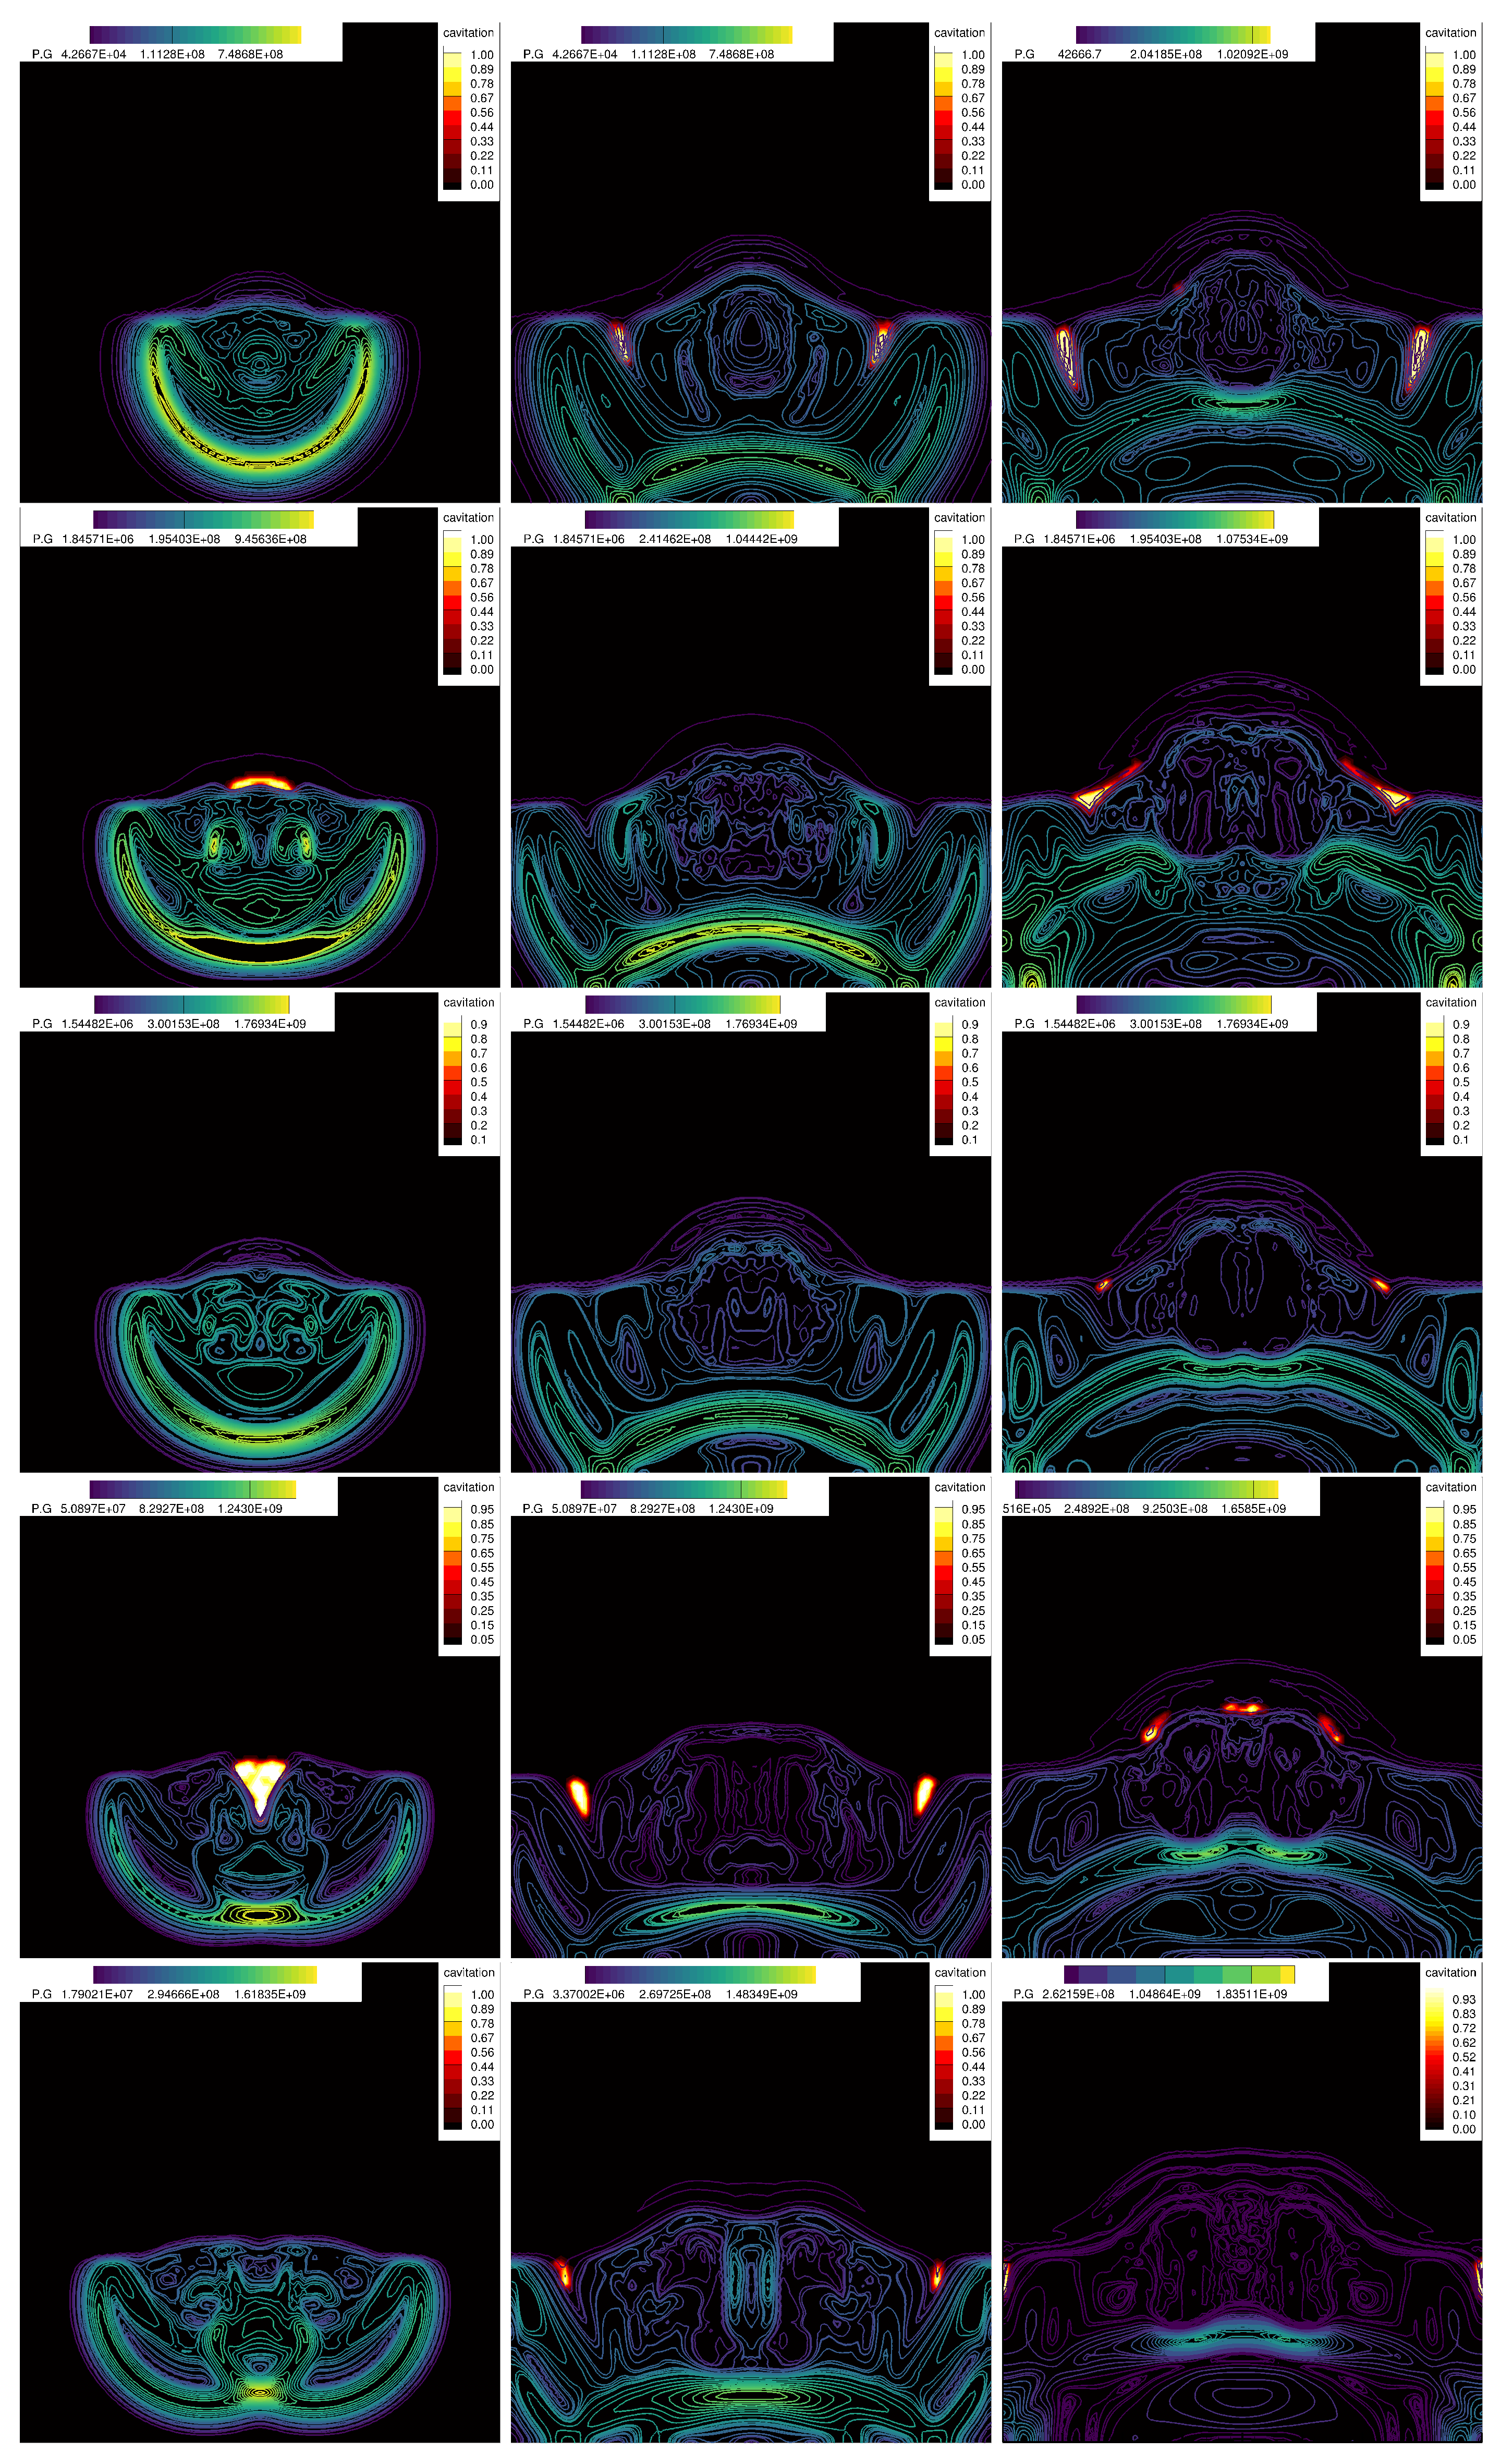
- 2D underwater explosion of two bubbles placed horizontally near a free surface.
- 5.
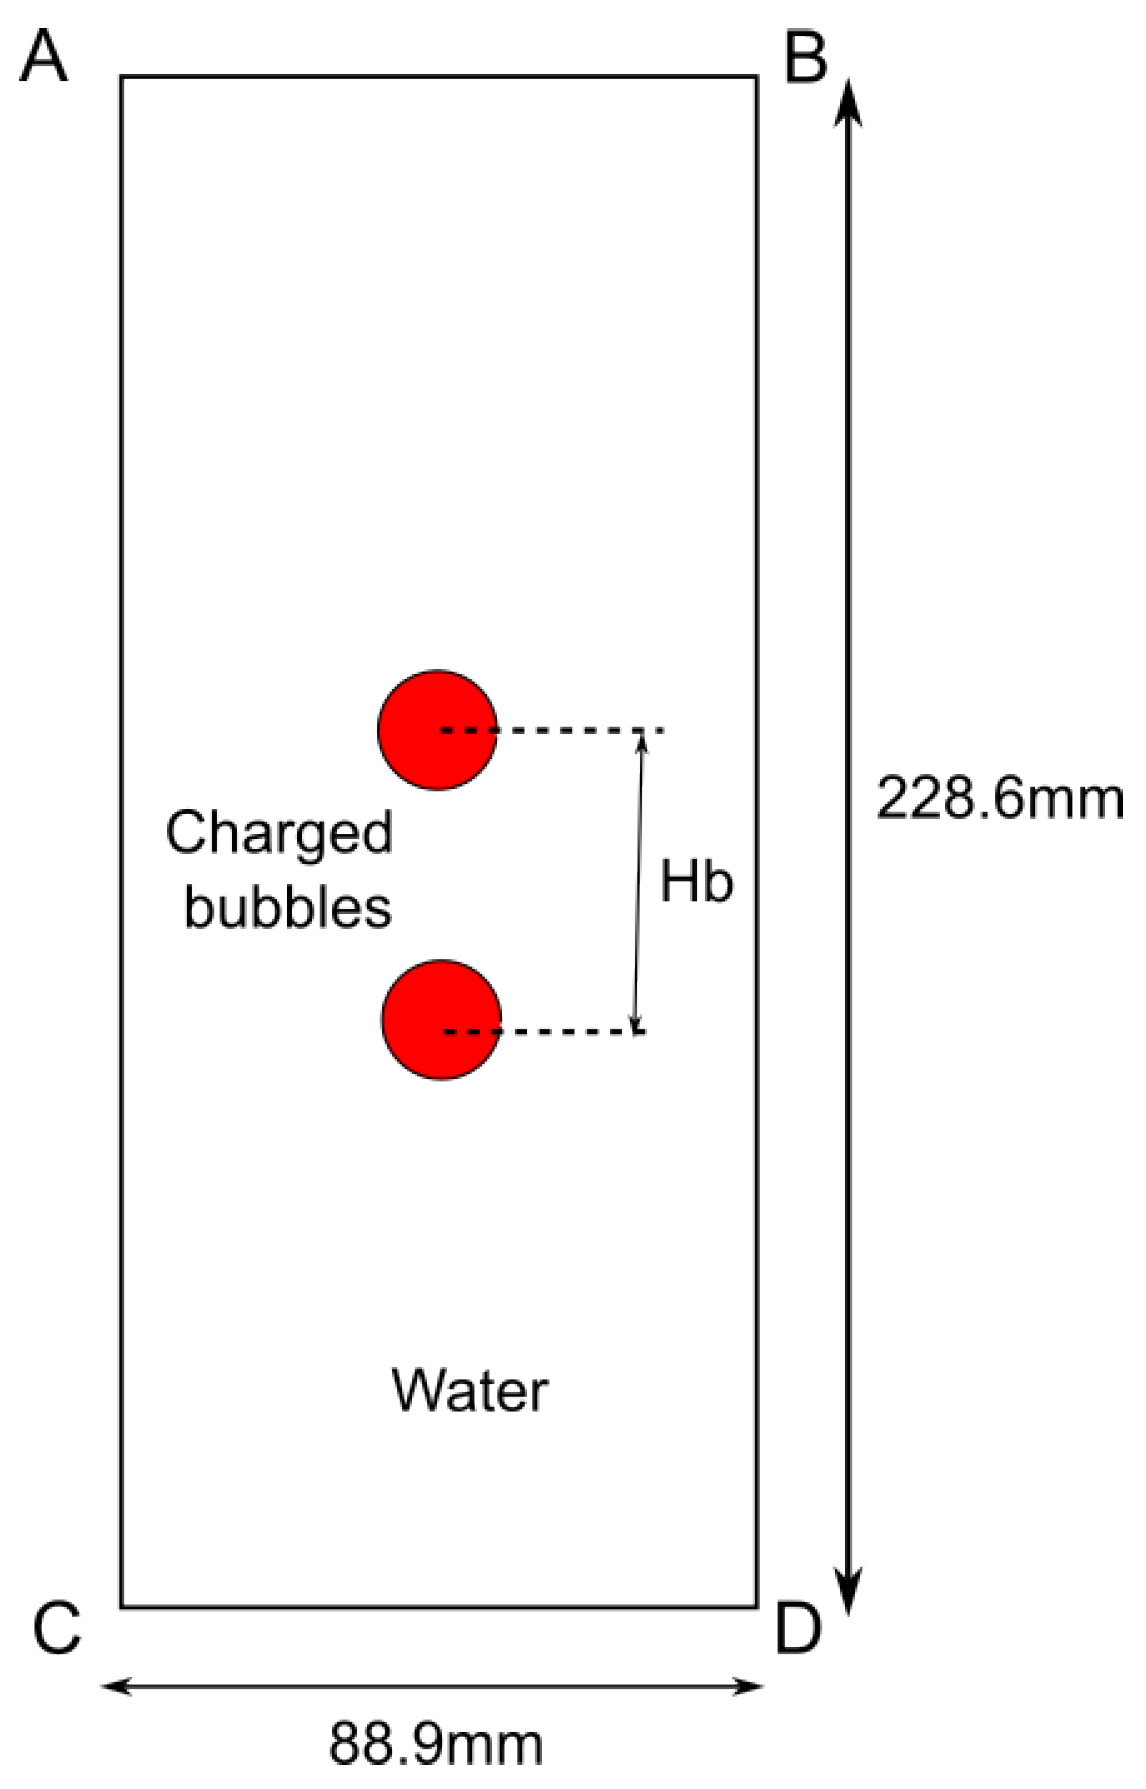
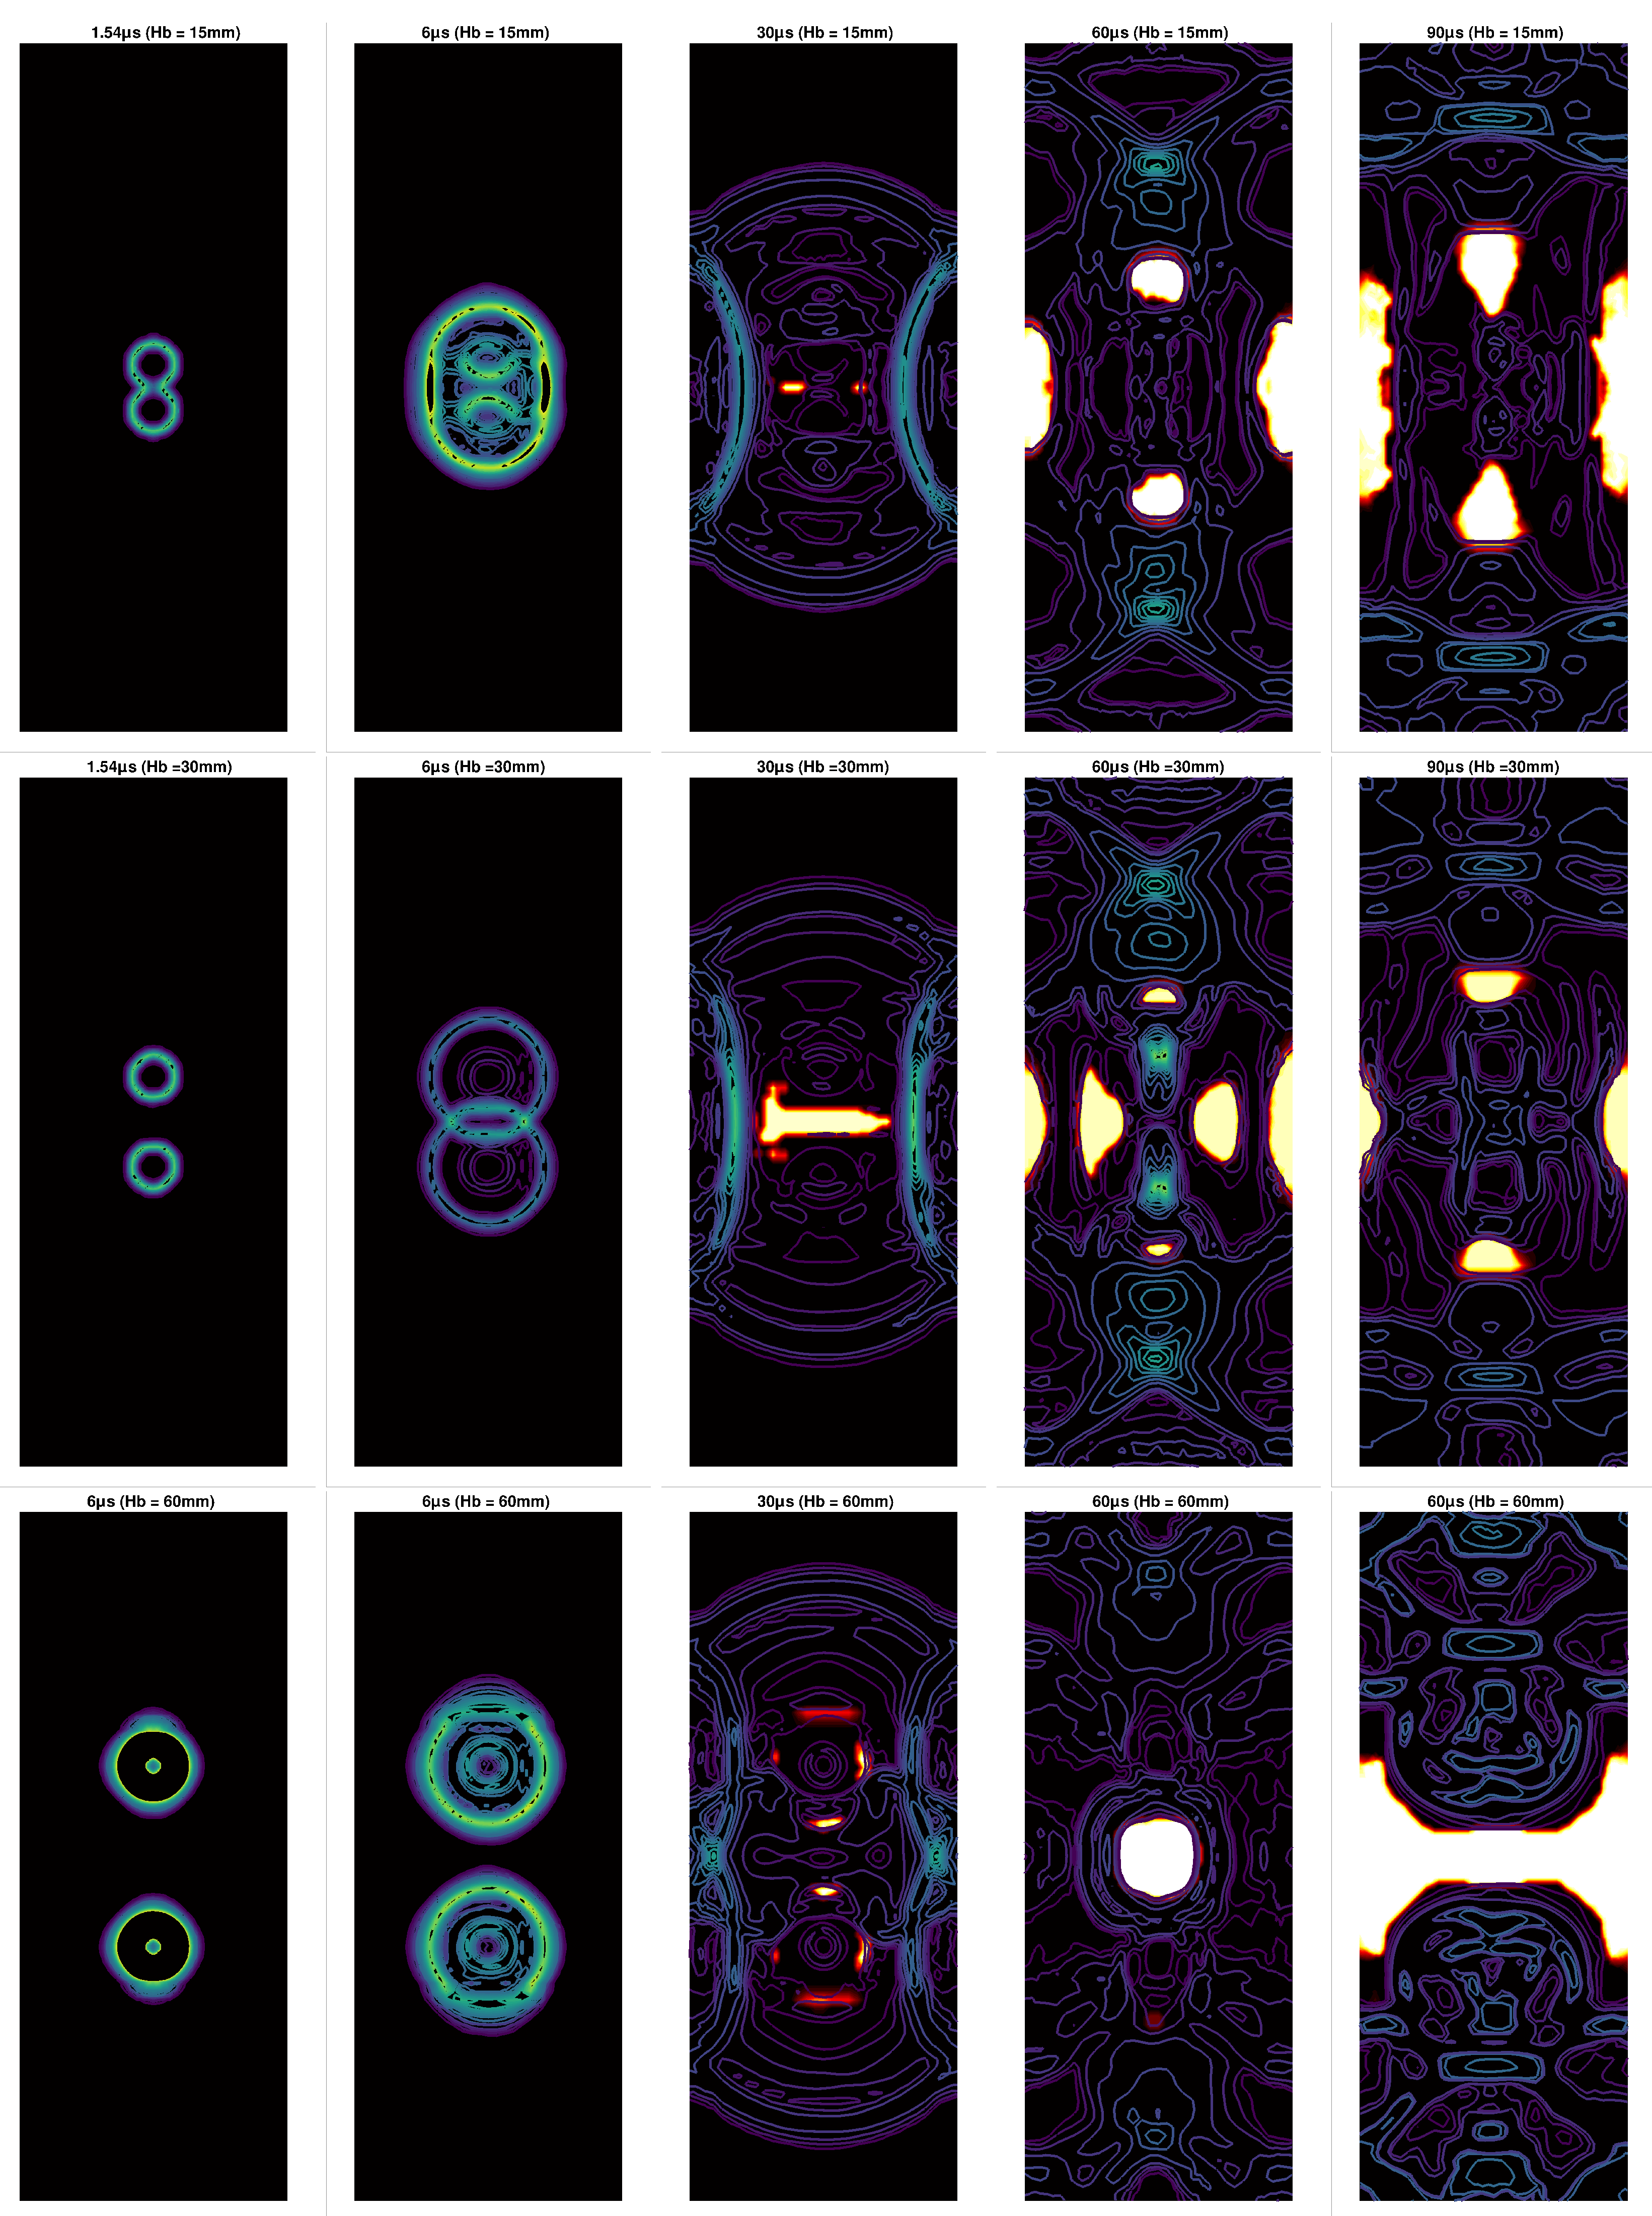
- 3D Underwater of two bubbles placed vertically in an enclosed region.
4.1. 2D underwater explosion near a free surface
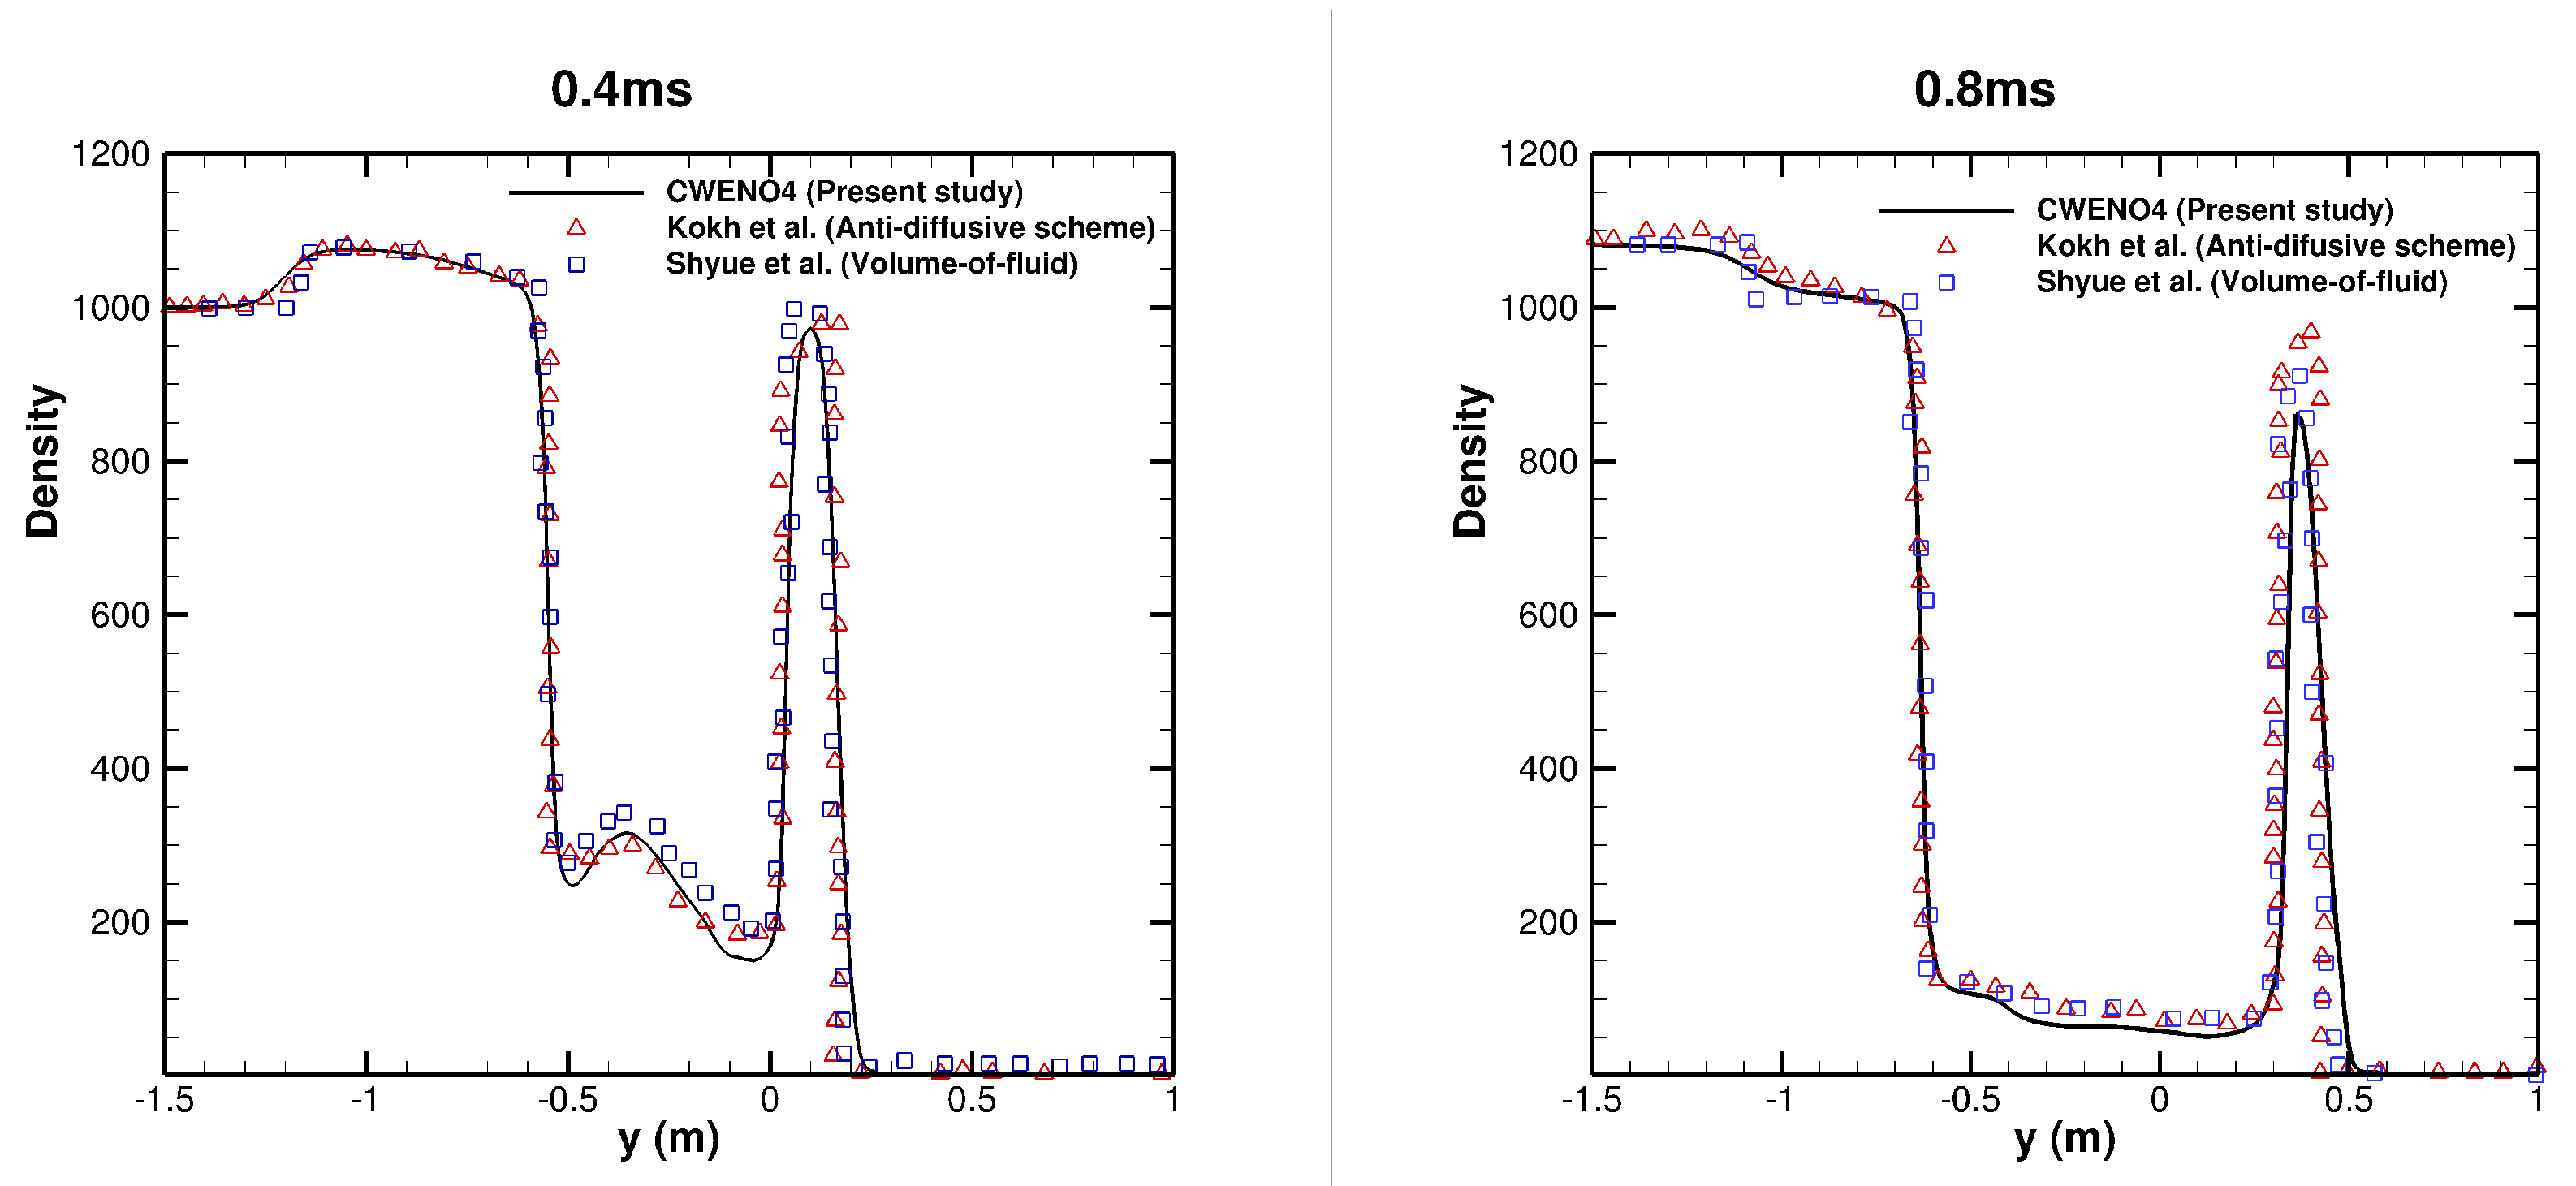

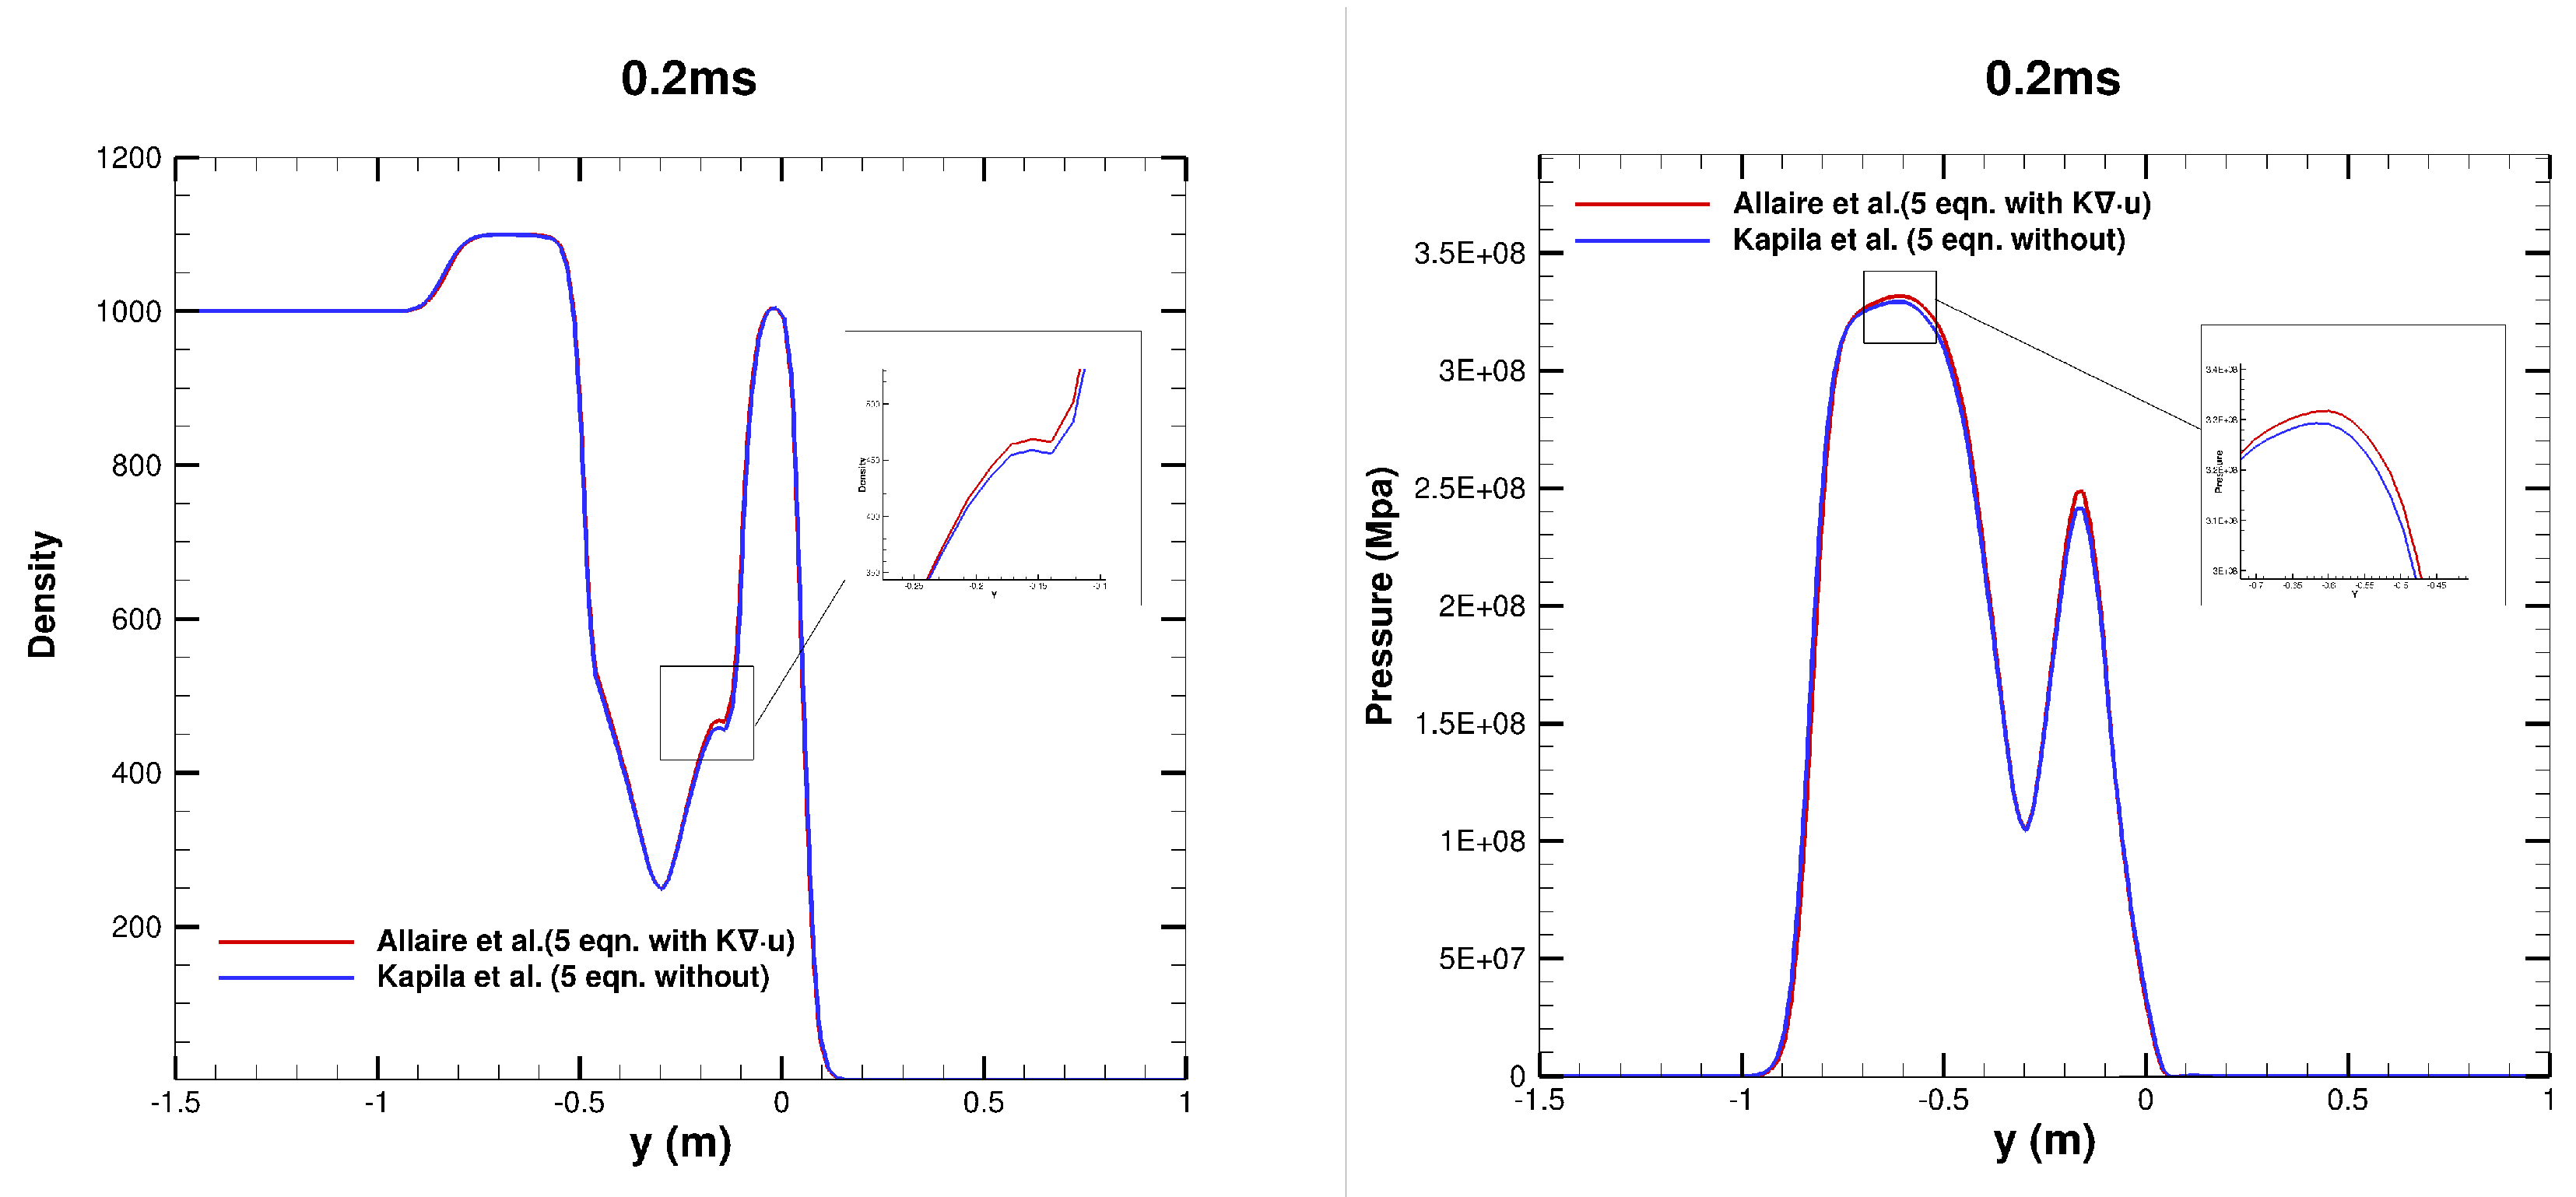
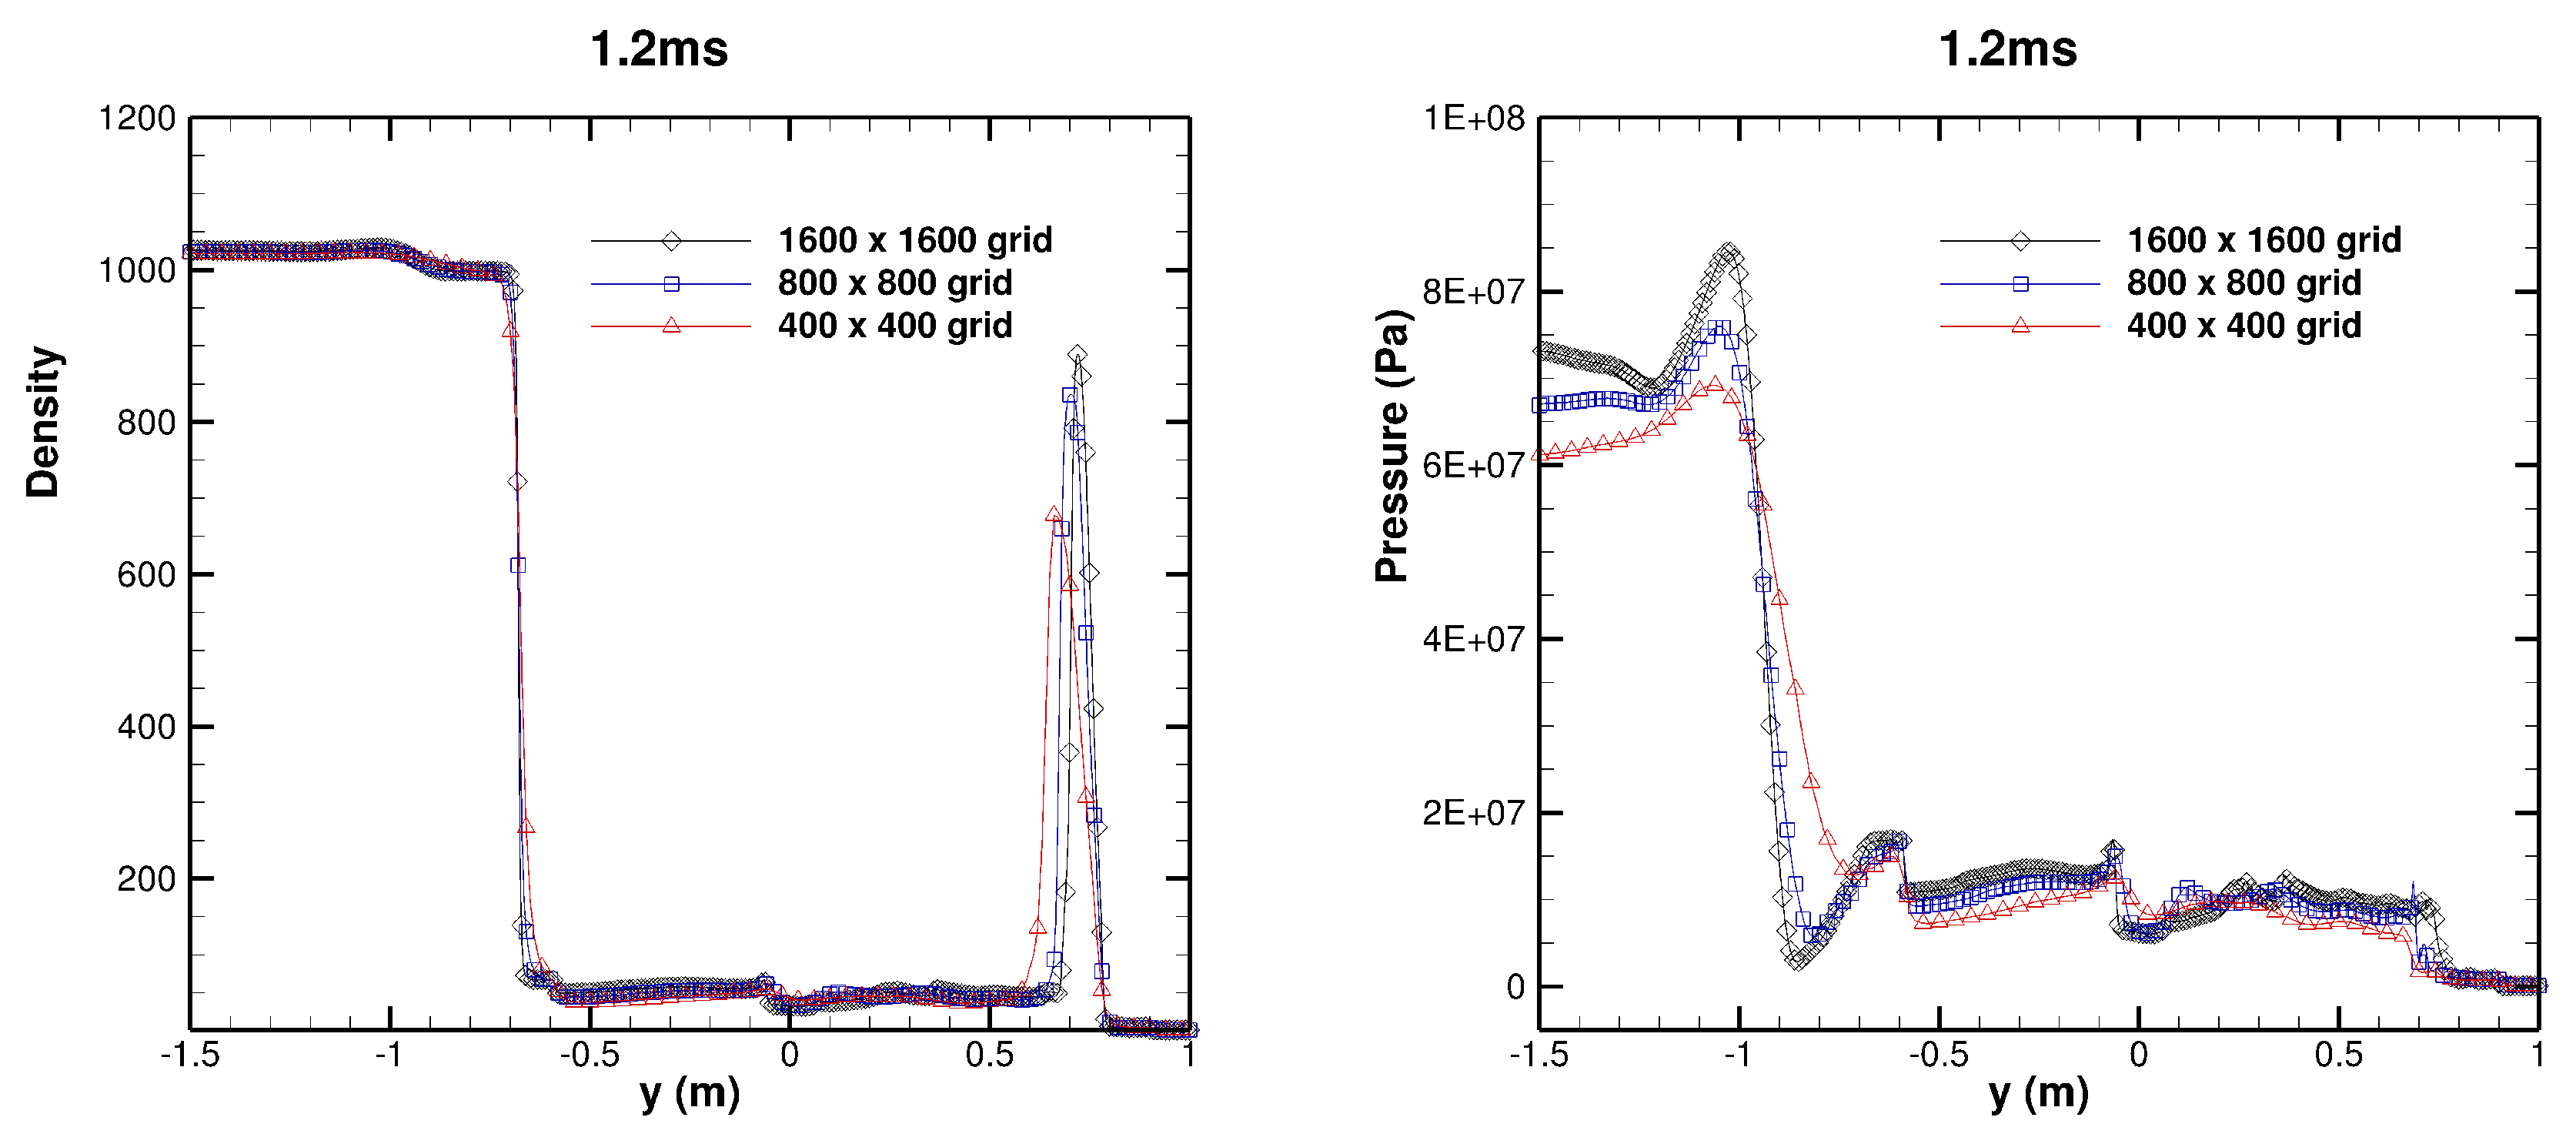
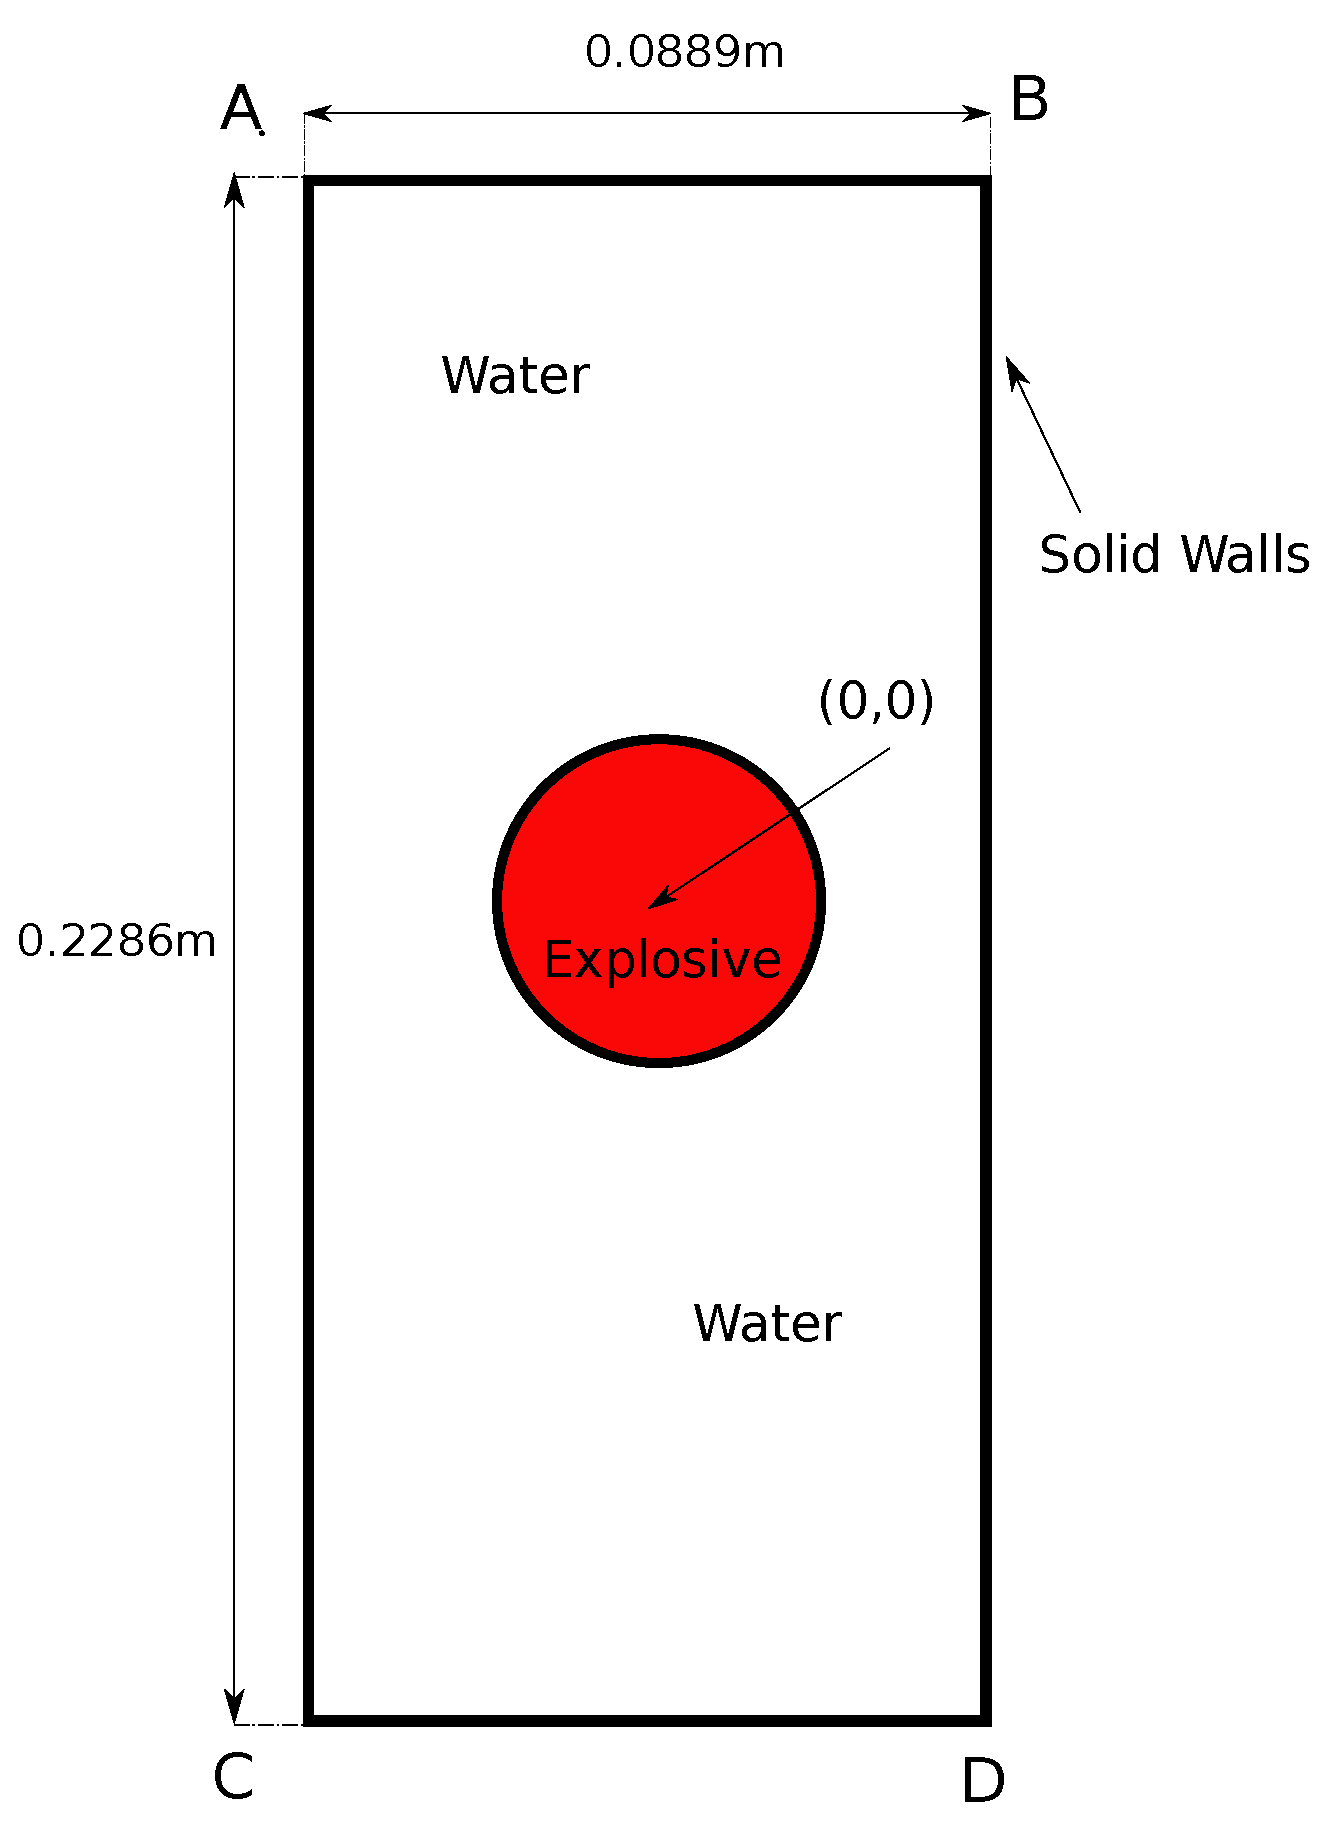
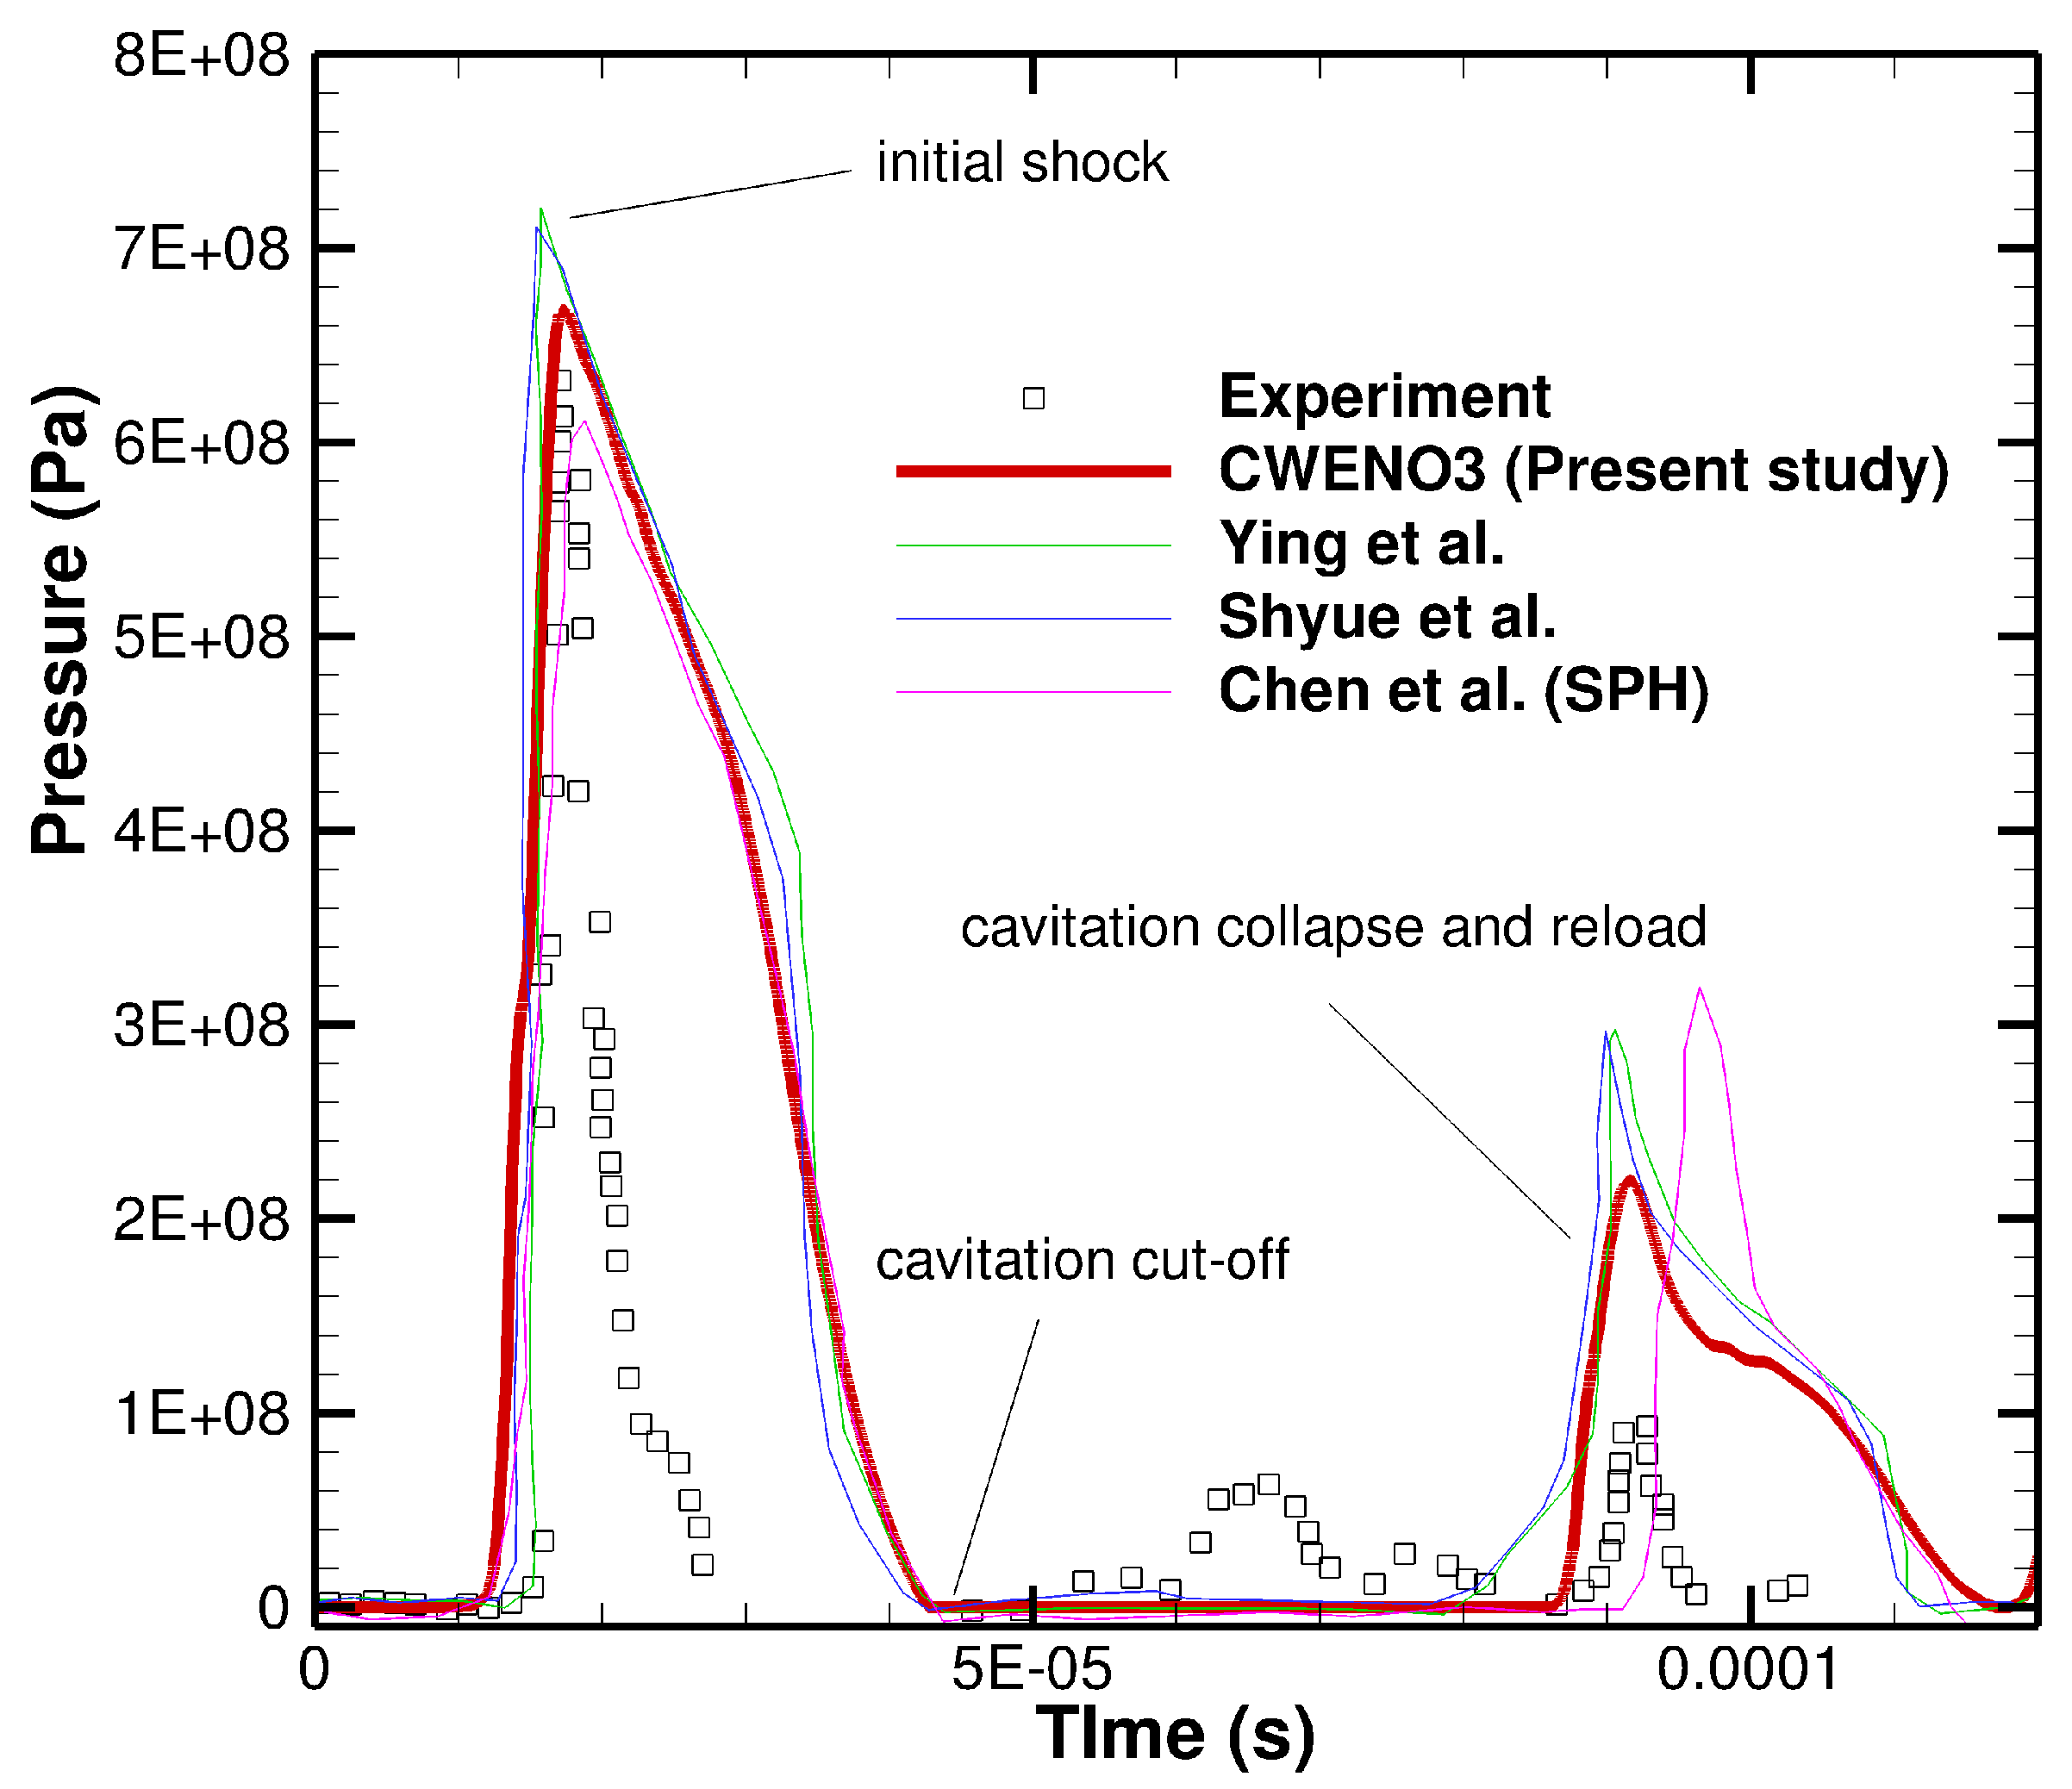
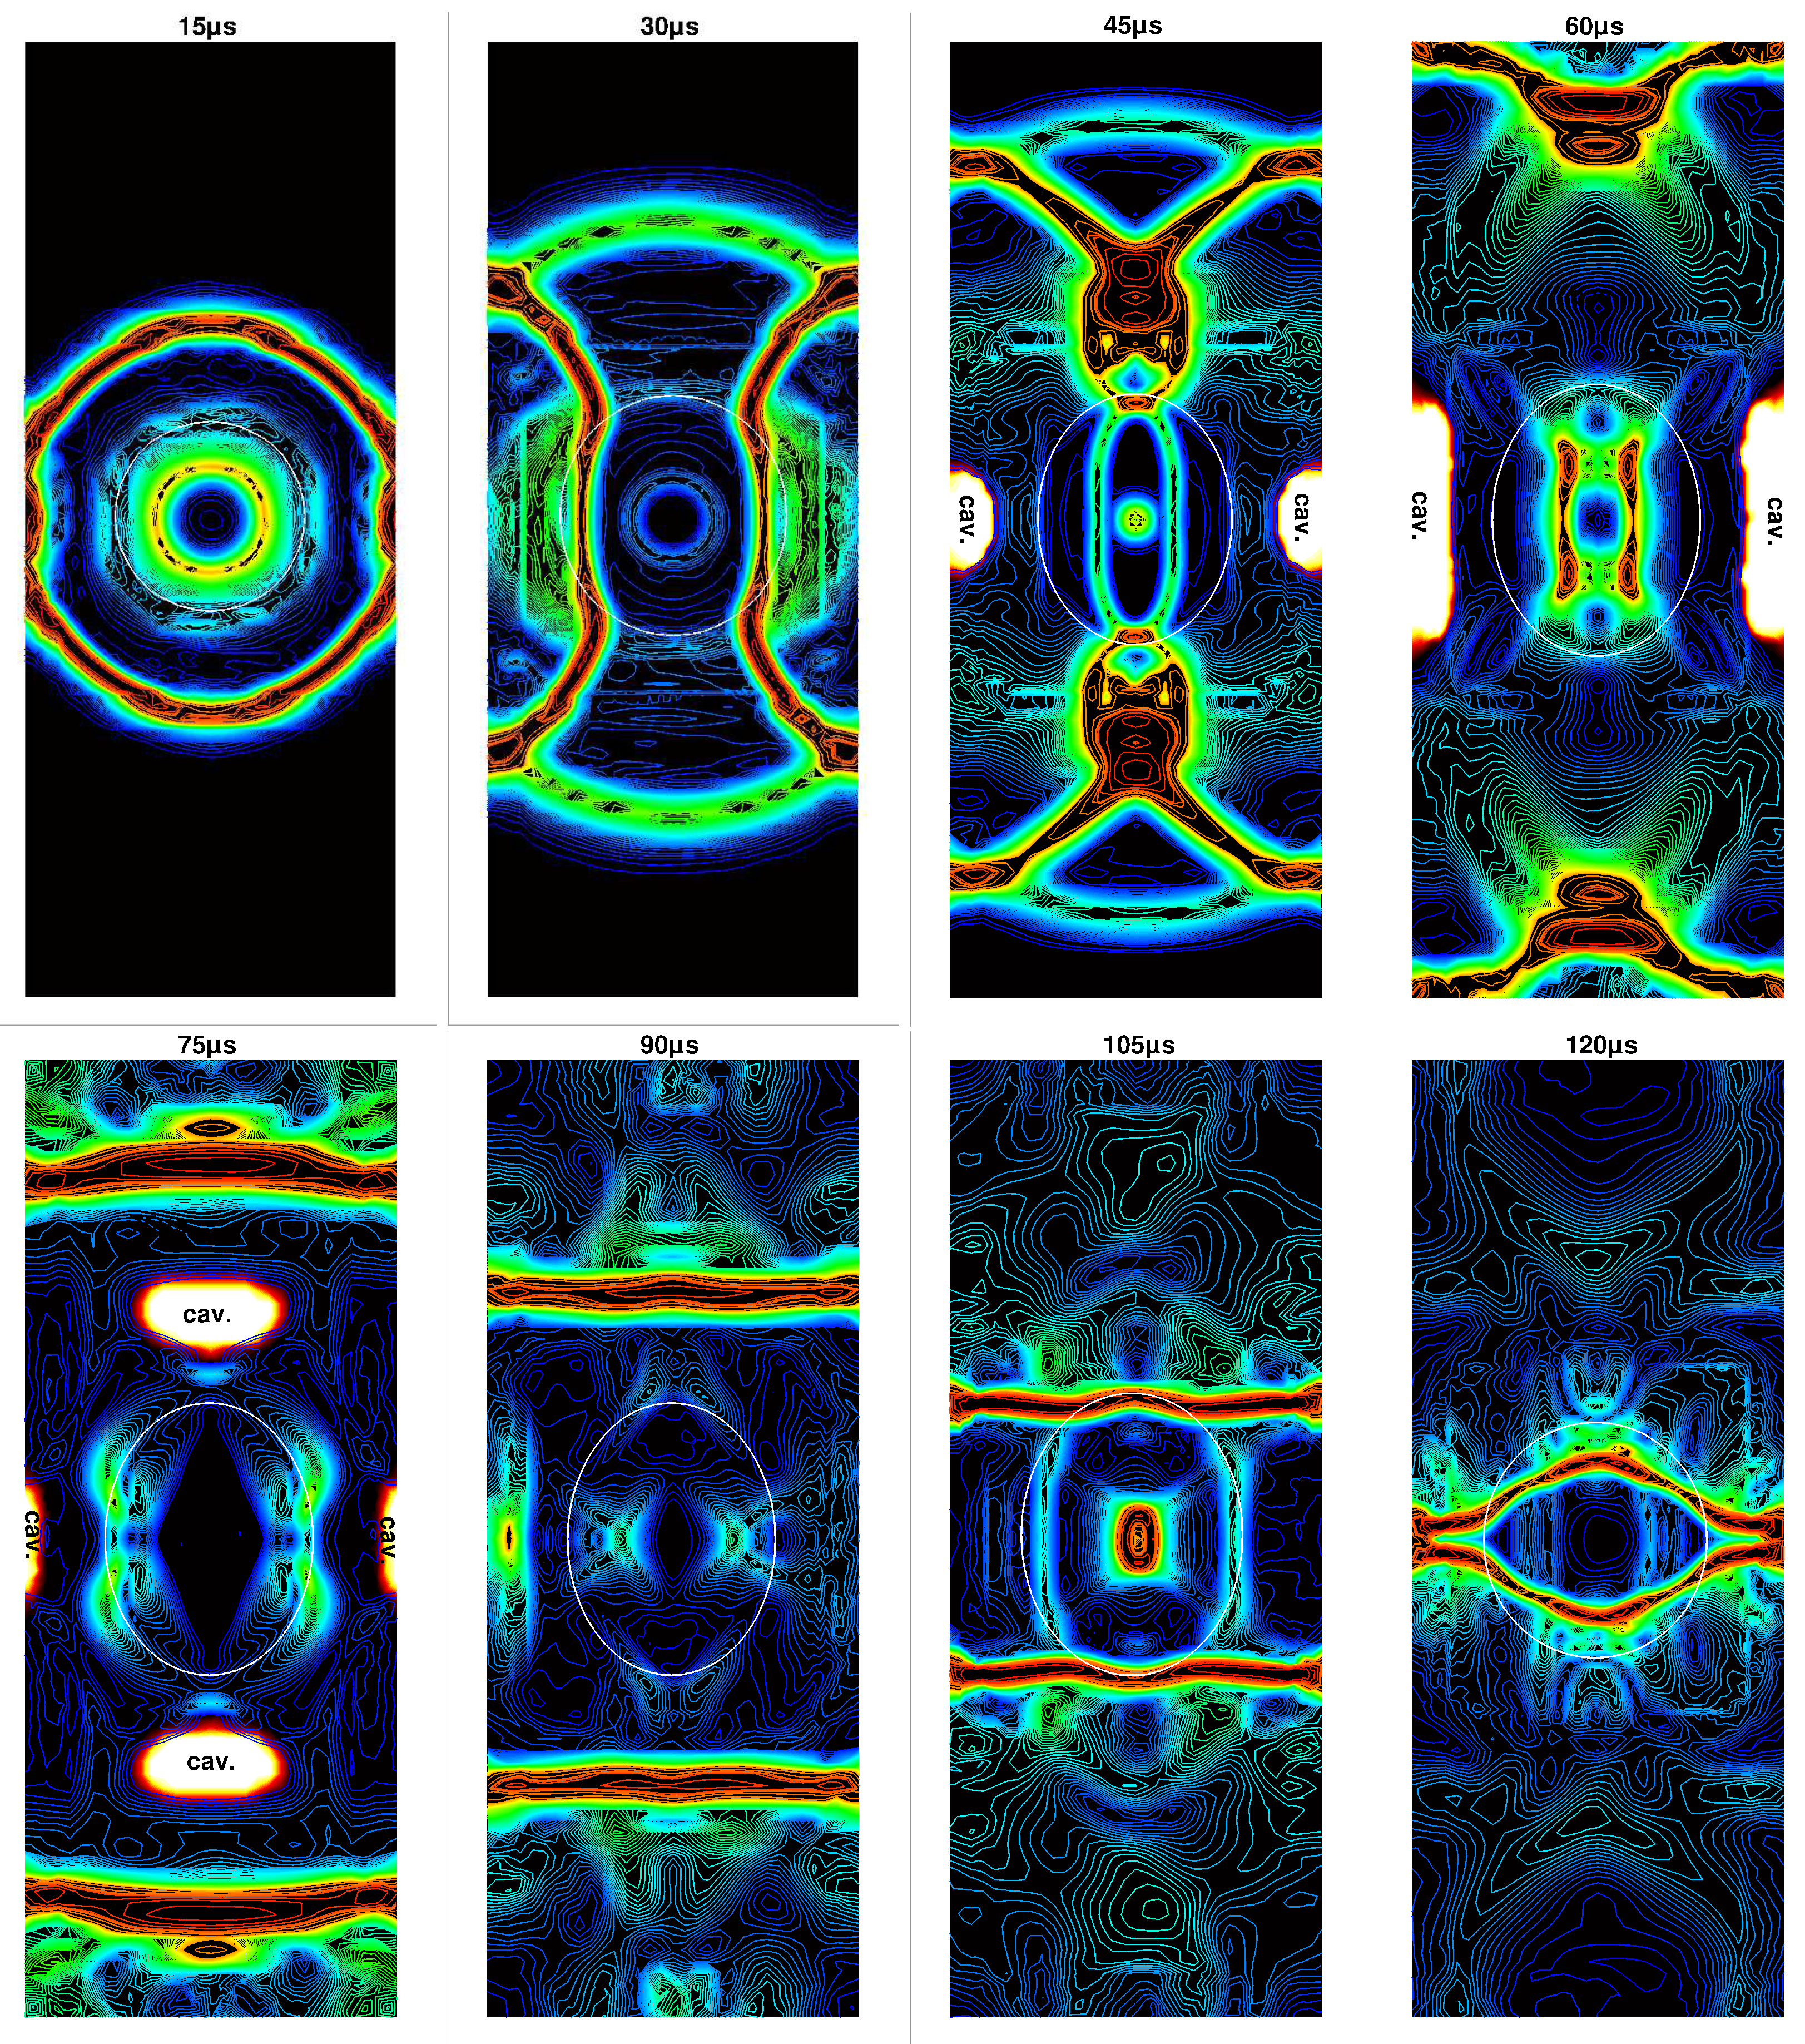
4.2. 2D cylindrical underwater explosion near a planar rigid wall.
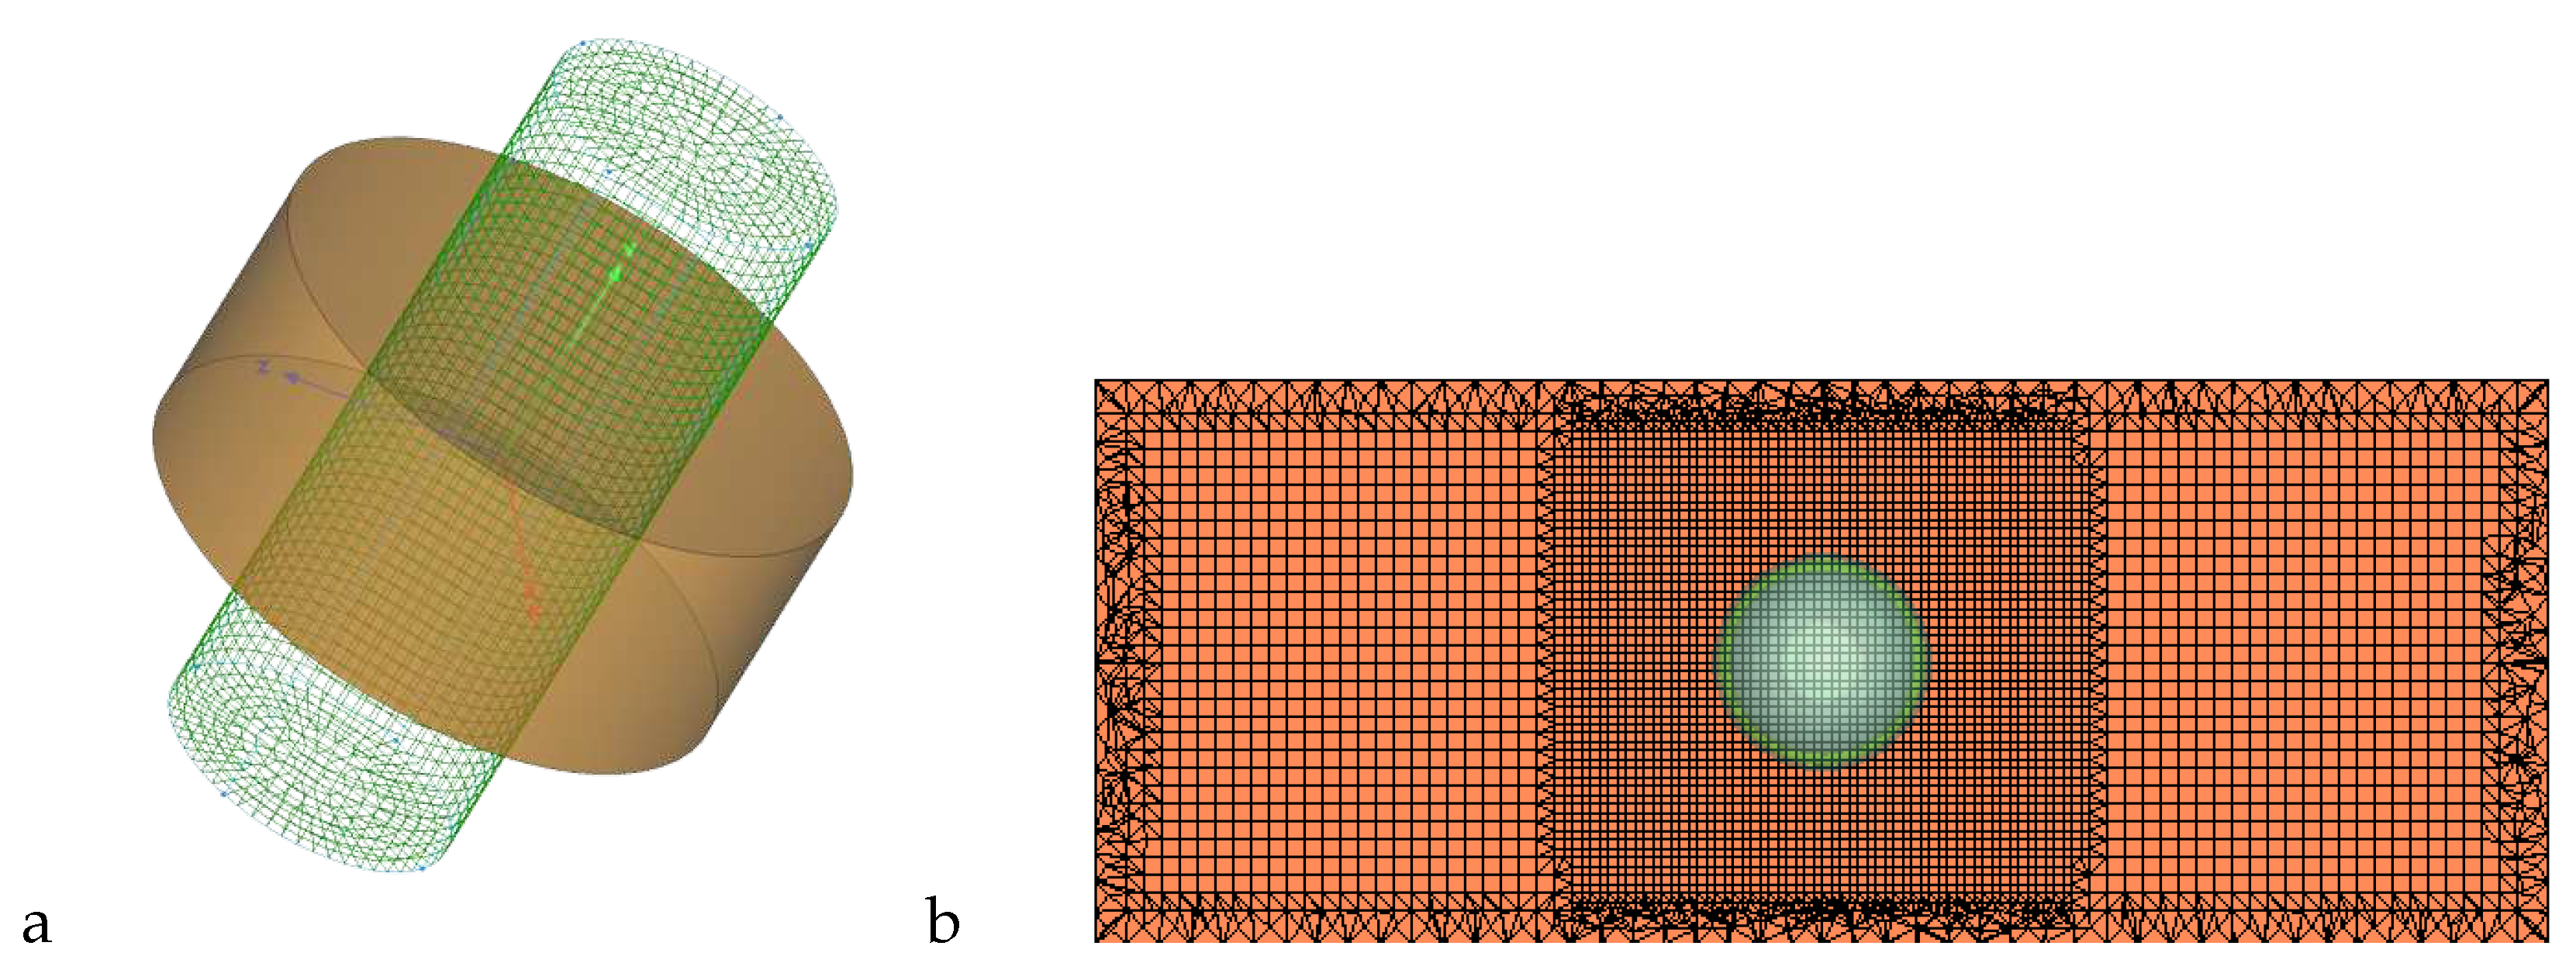
4.3. 3D underwater explosion in an enclosed, rigid cylindrical wall.
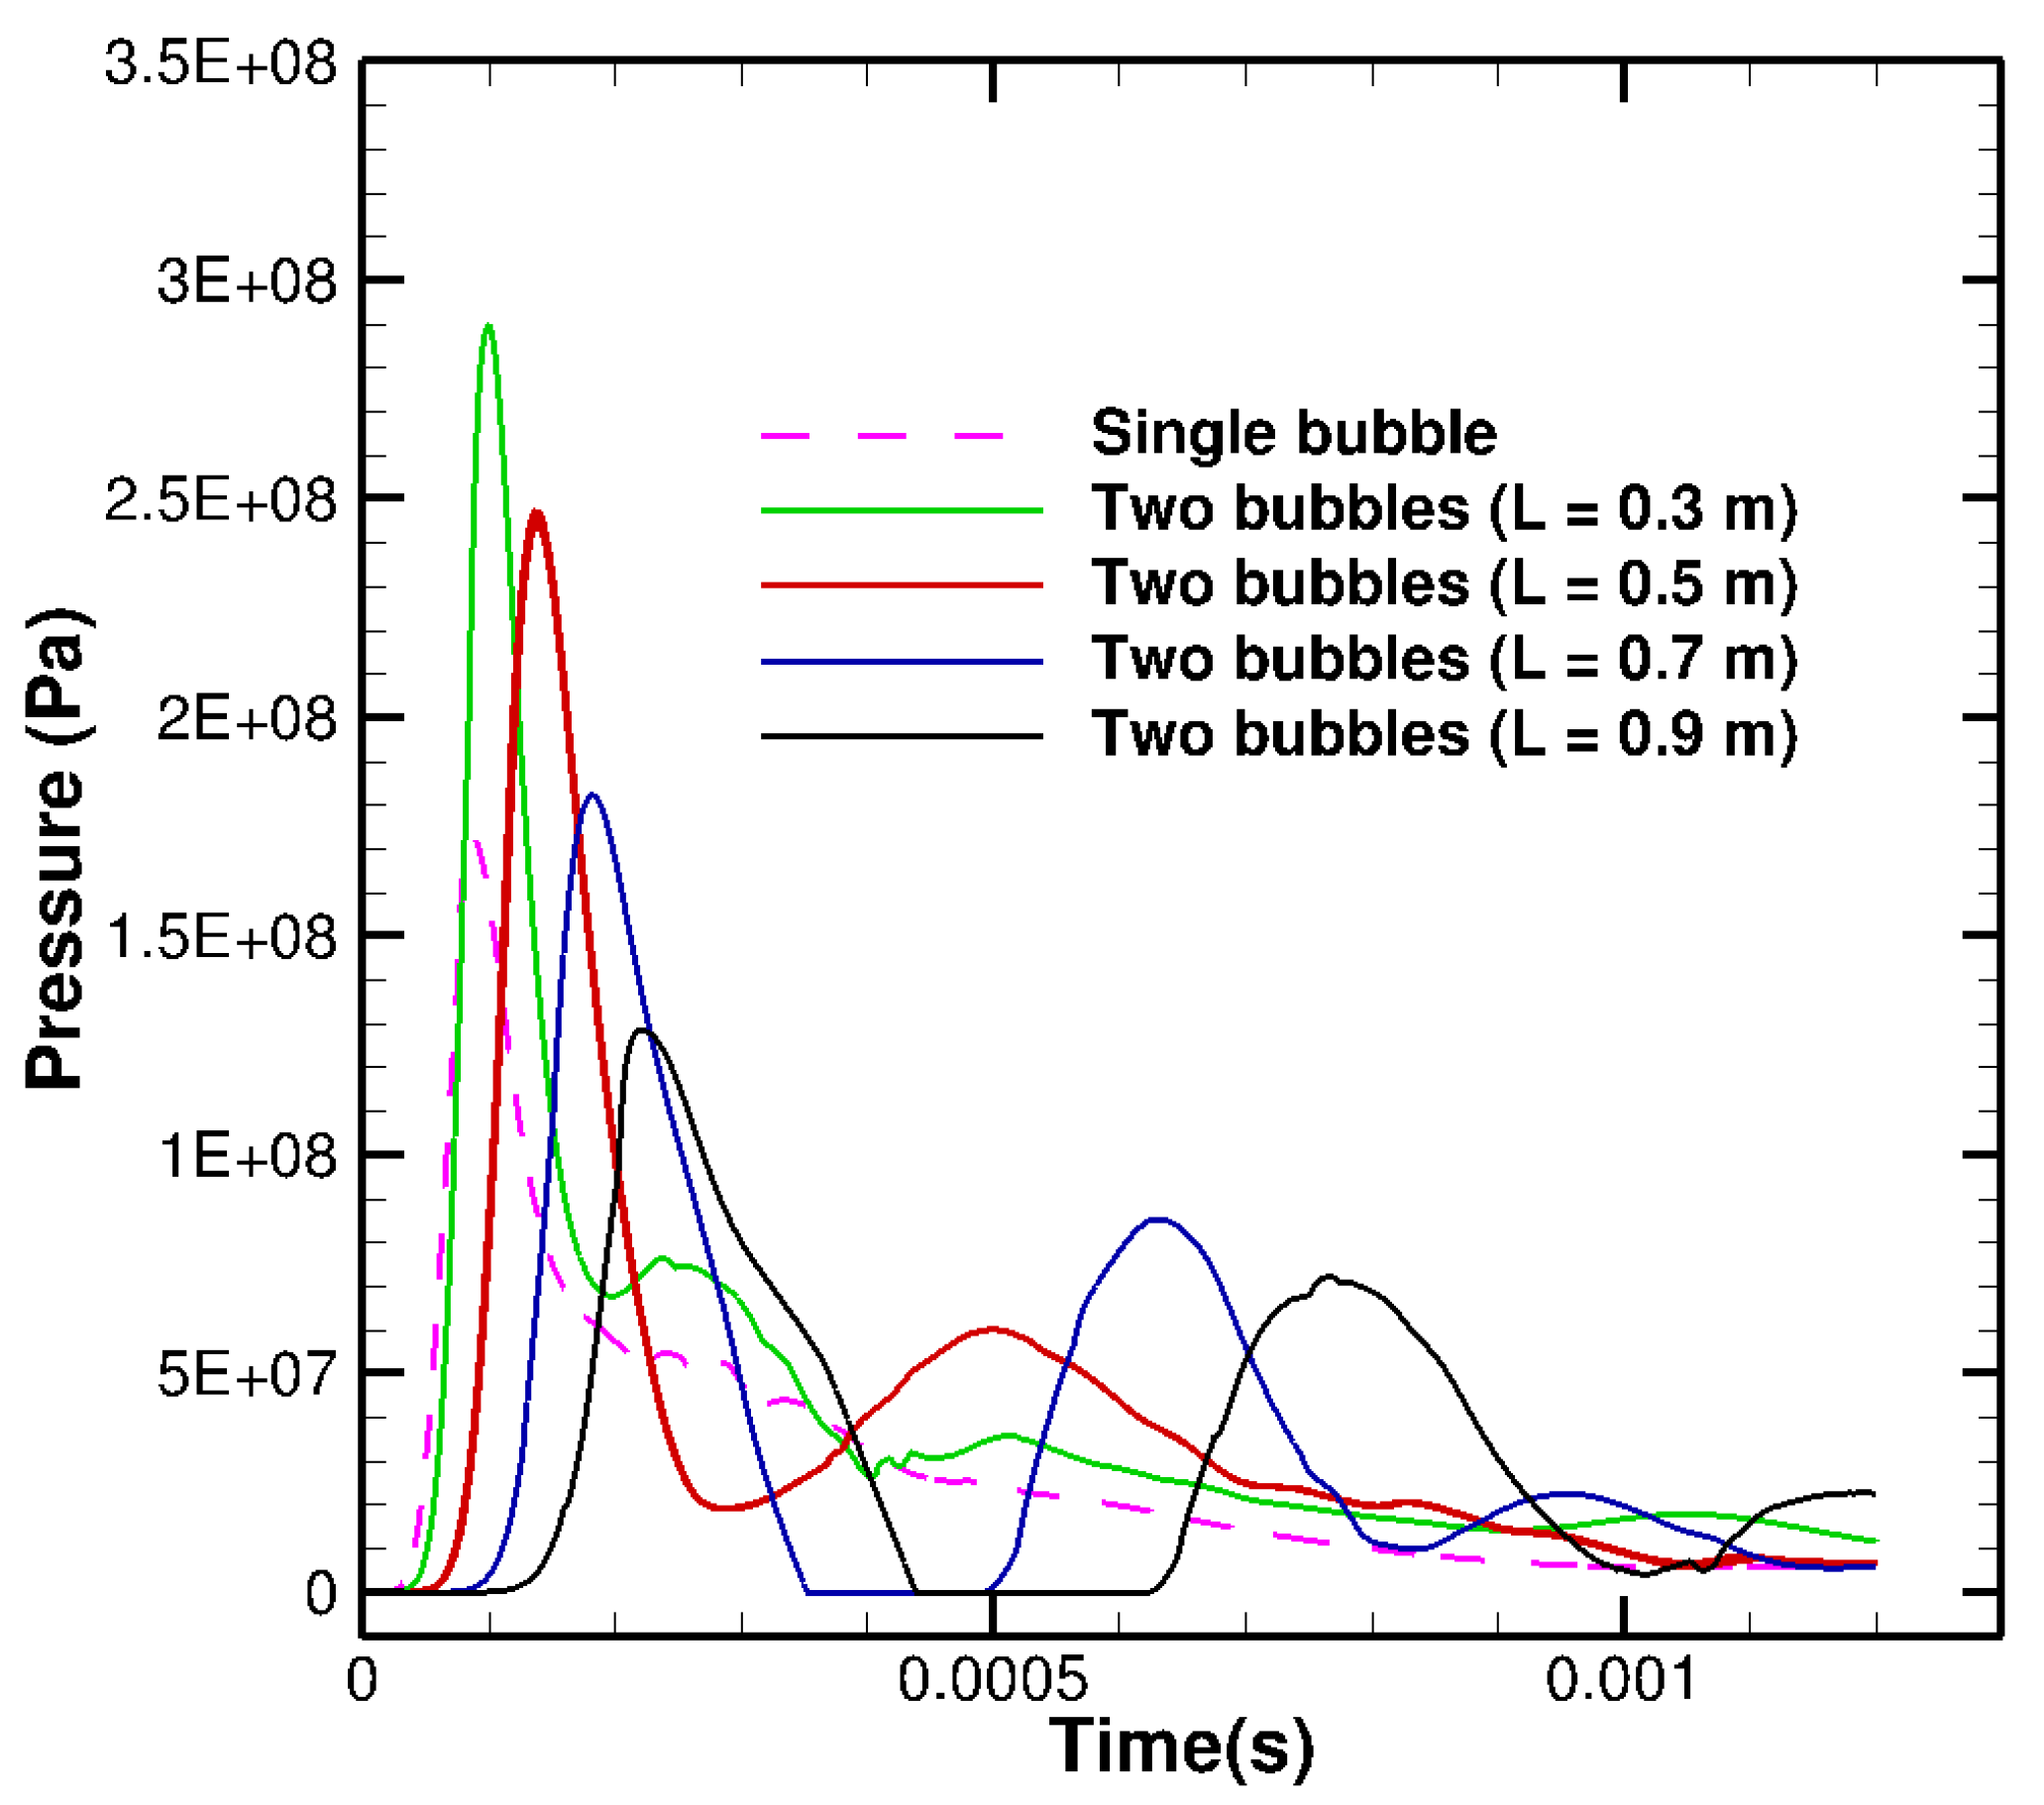
4.4. 2D underwater explosion of two bubbles placed horizontally near a free surface
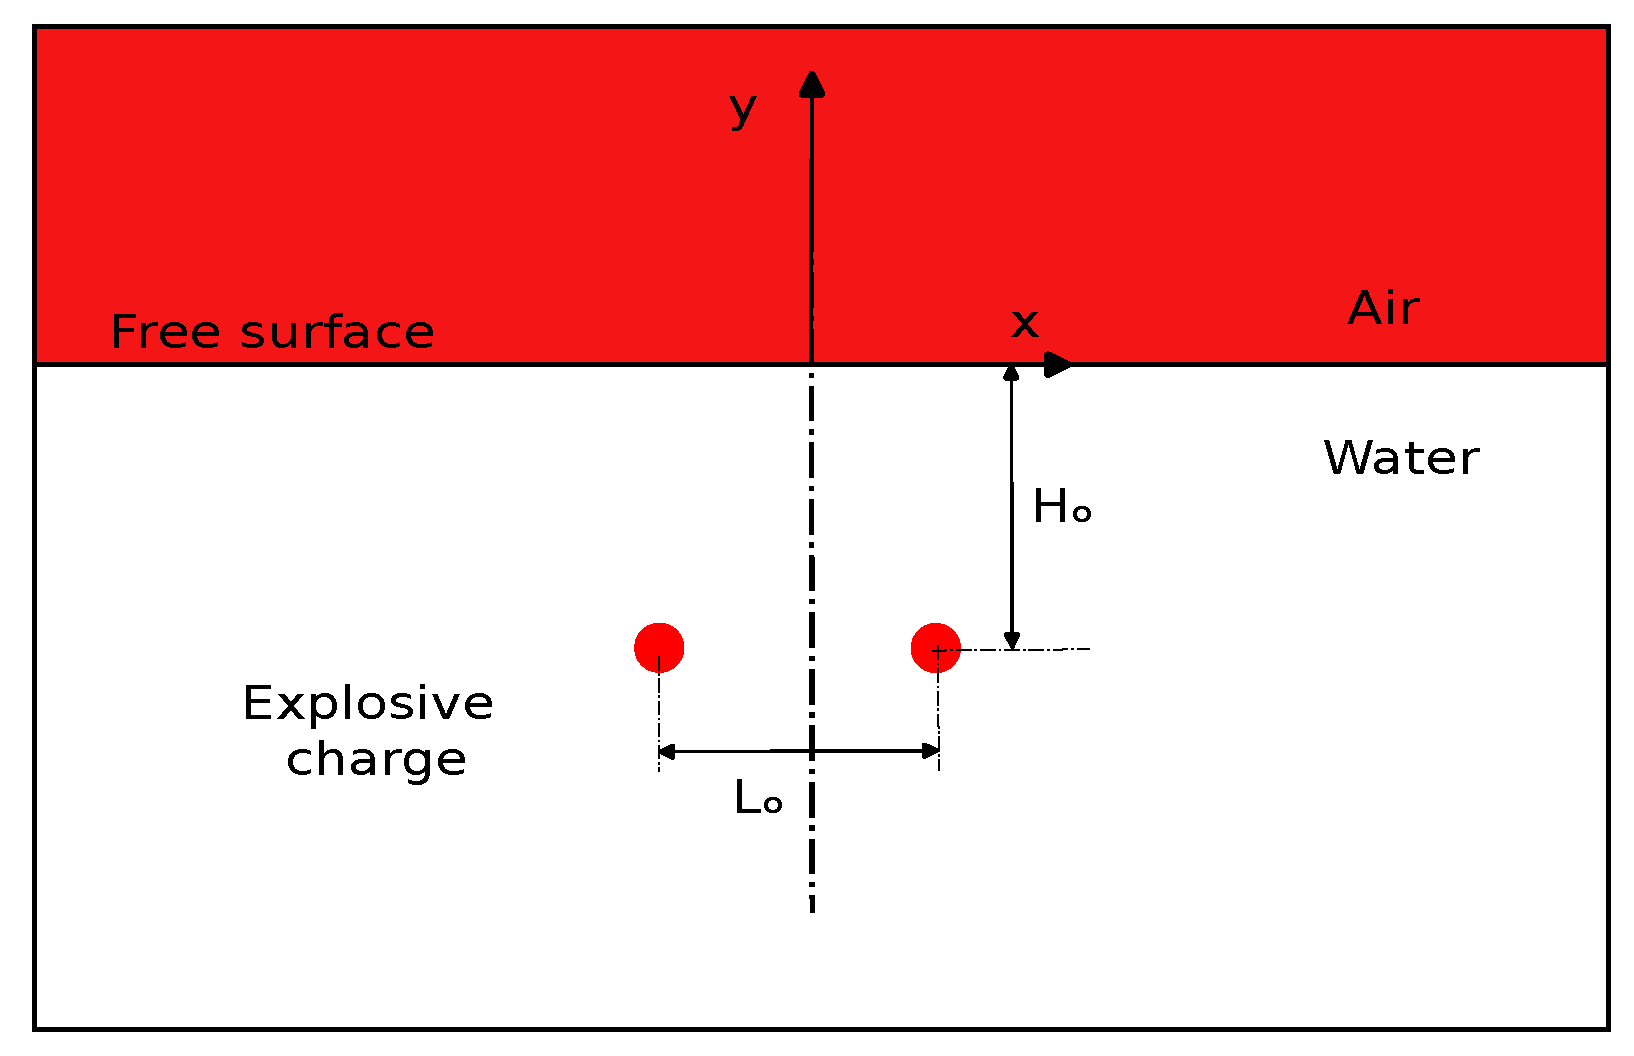
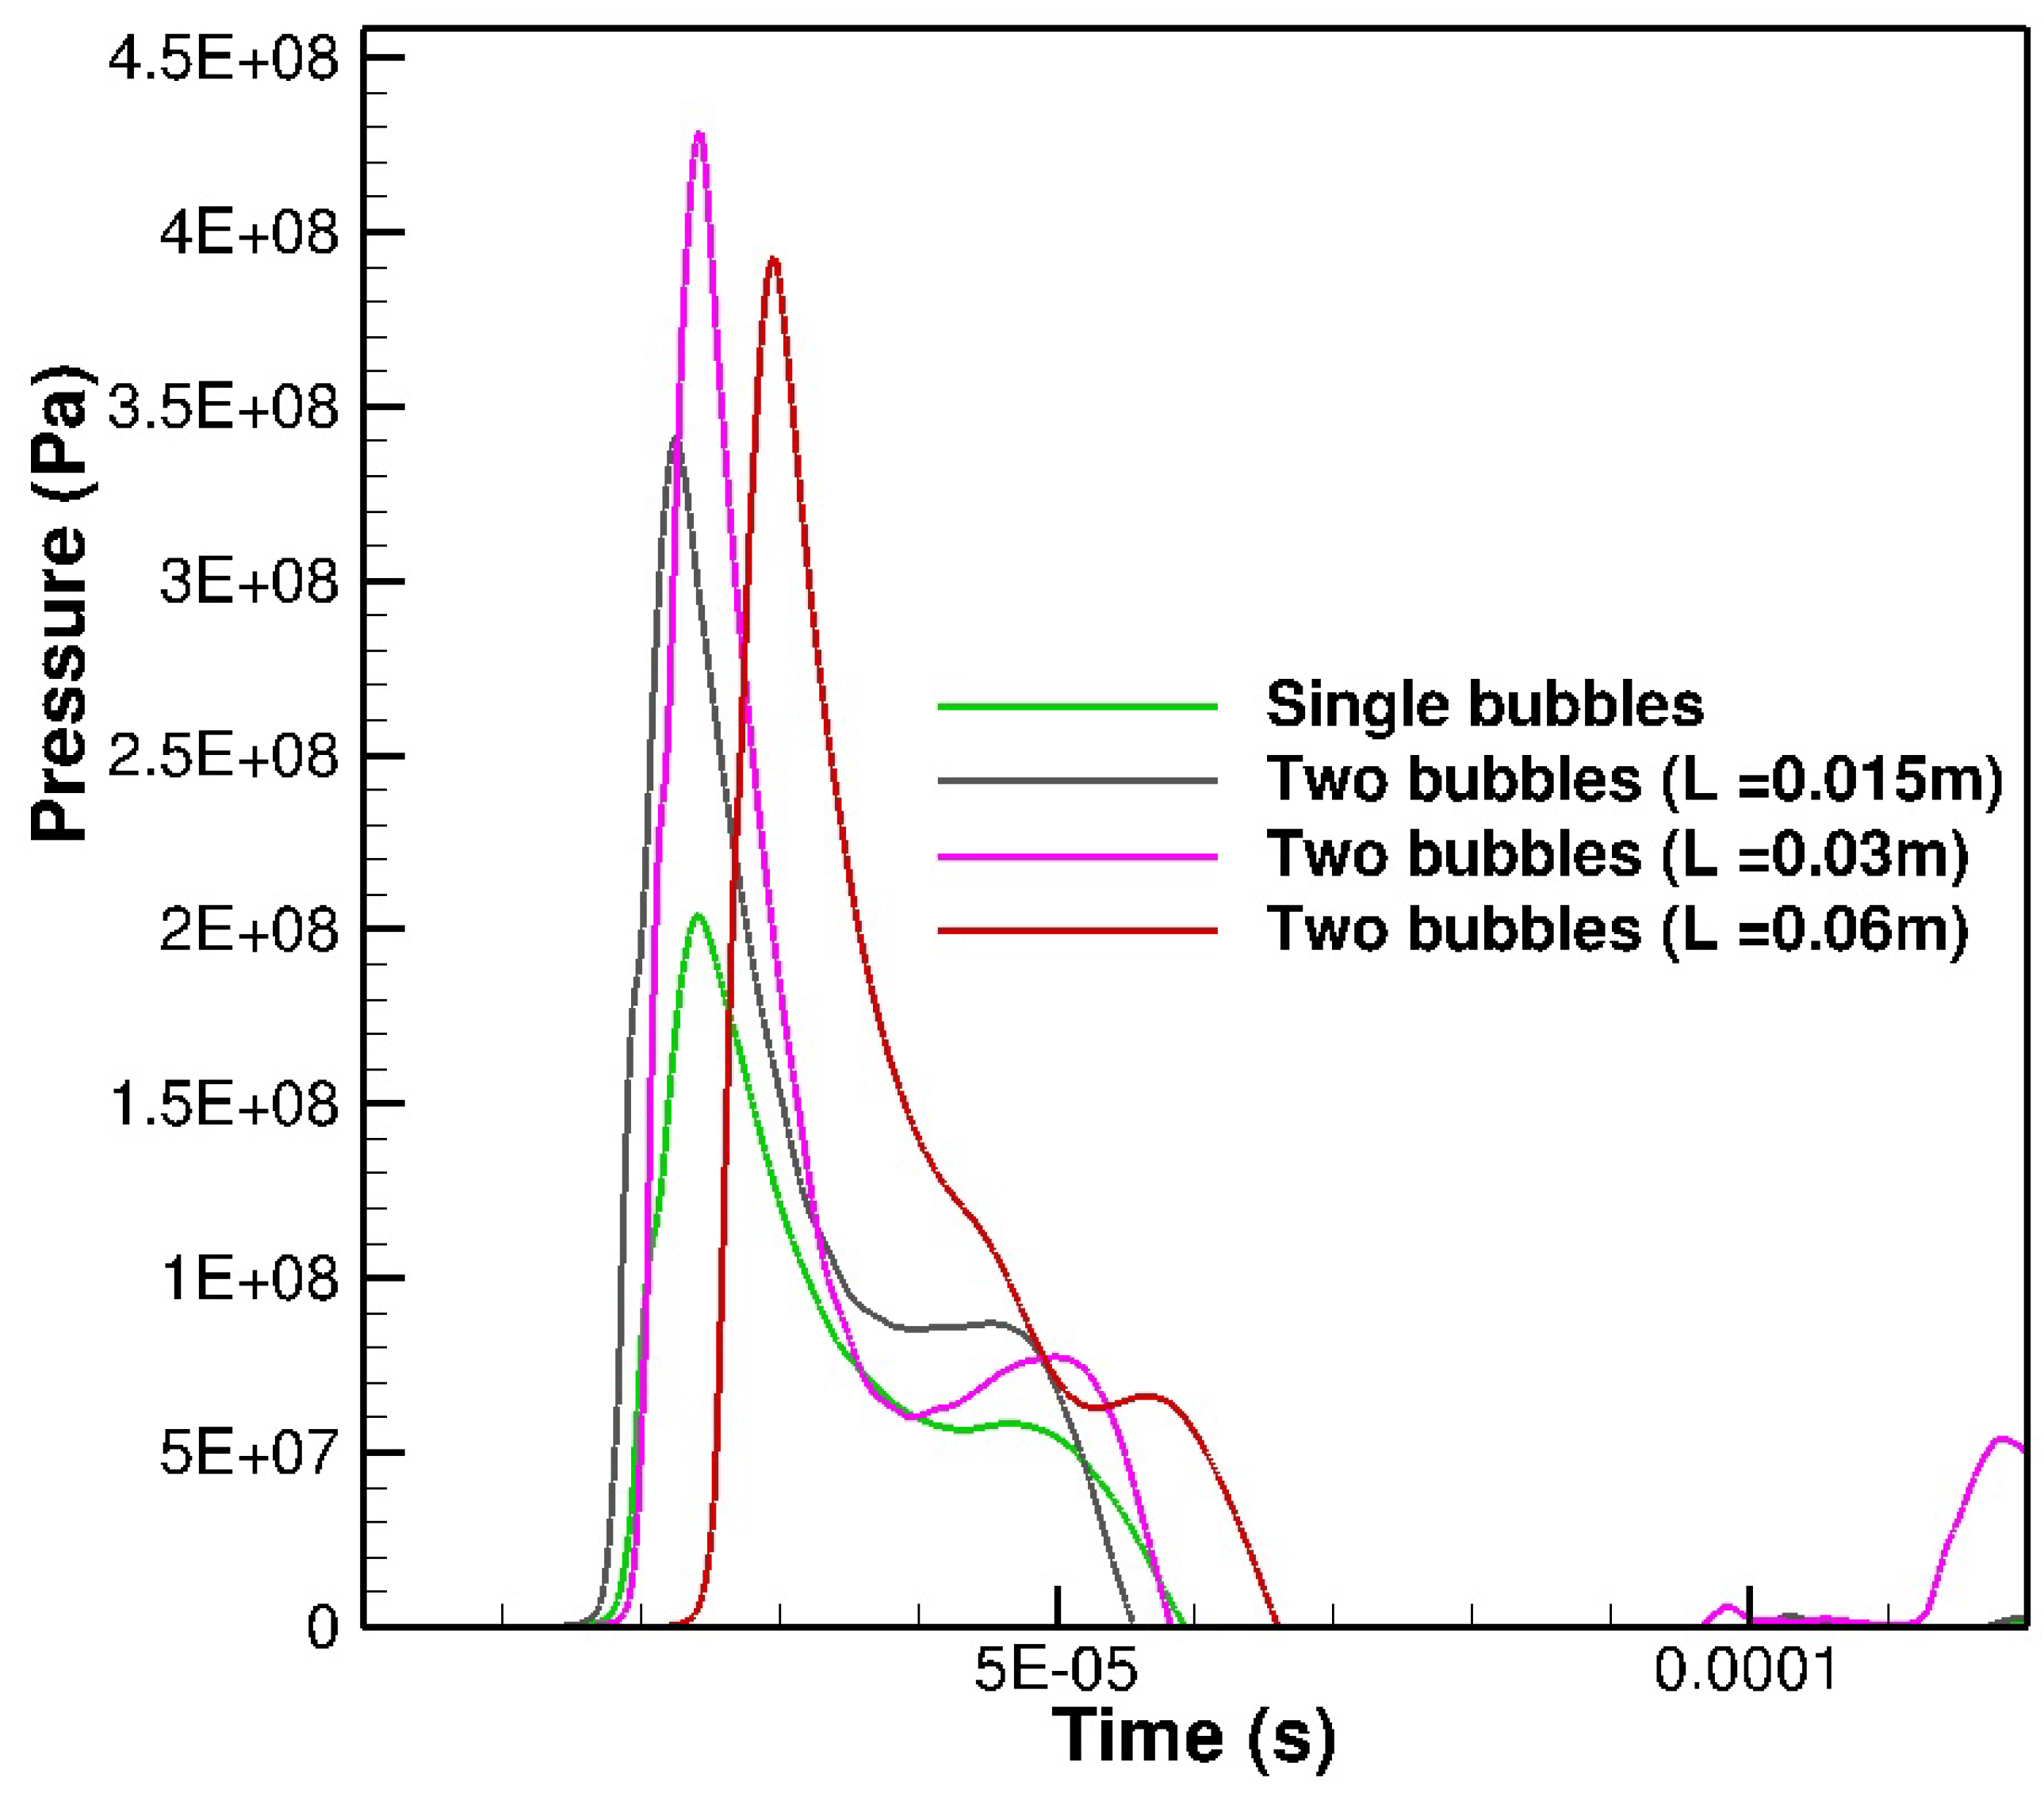
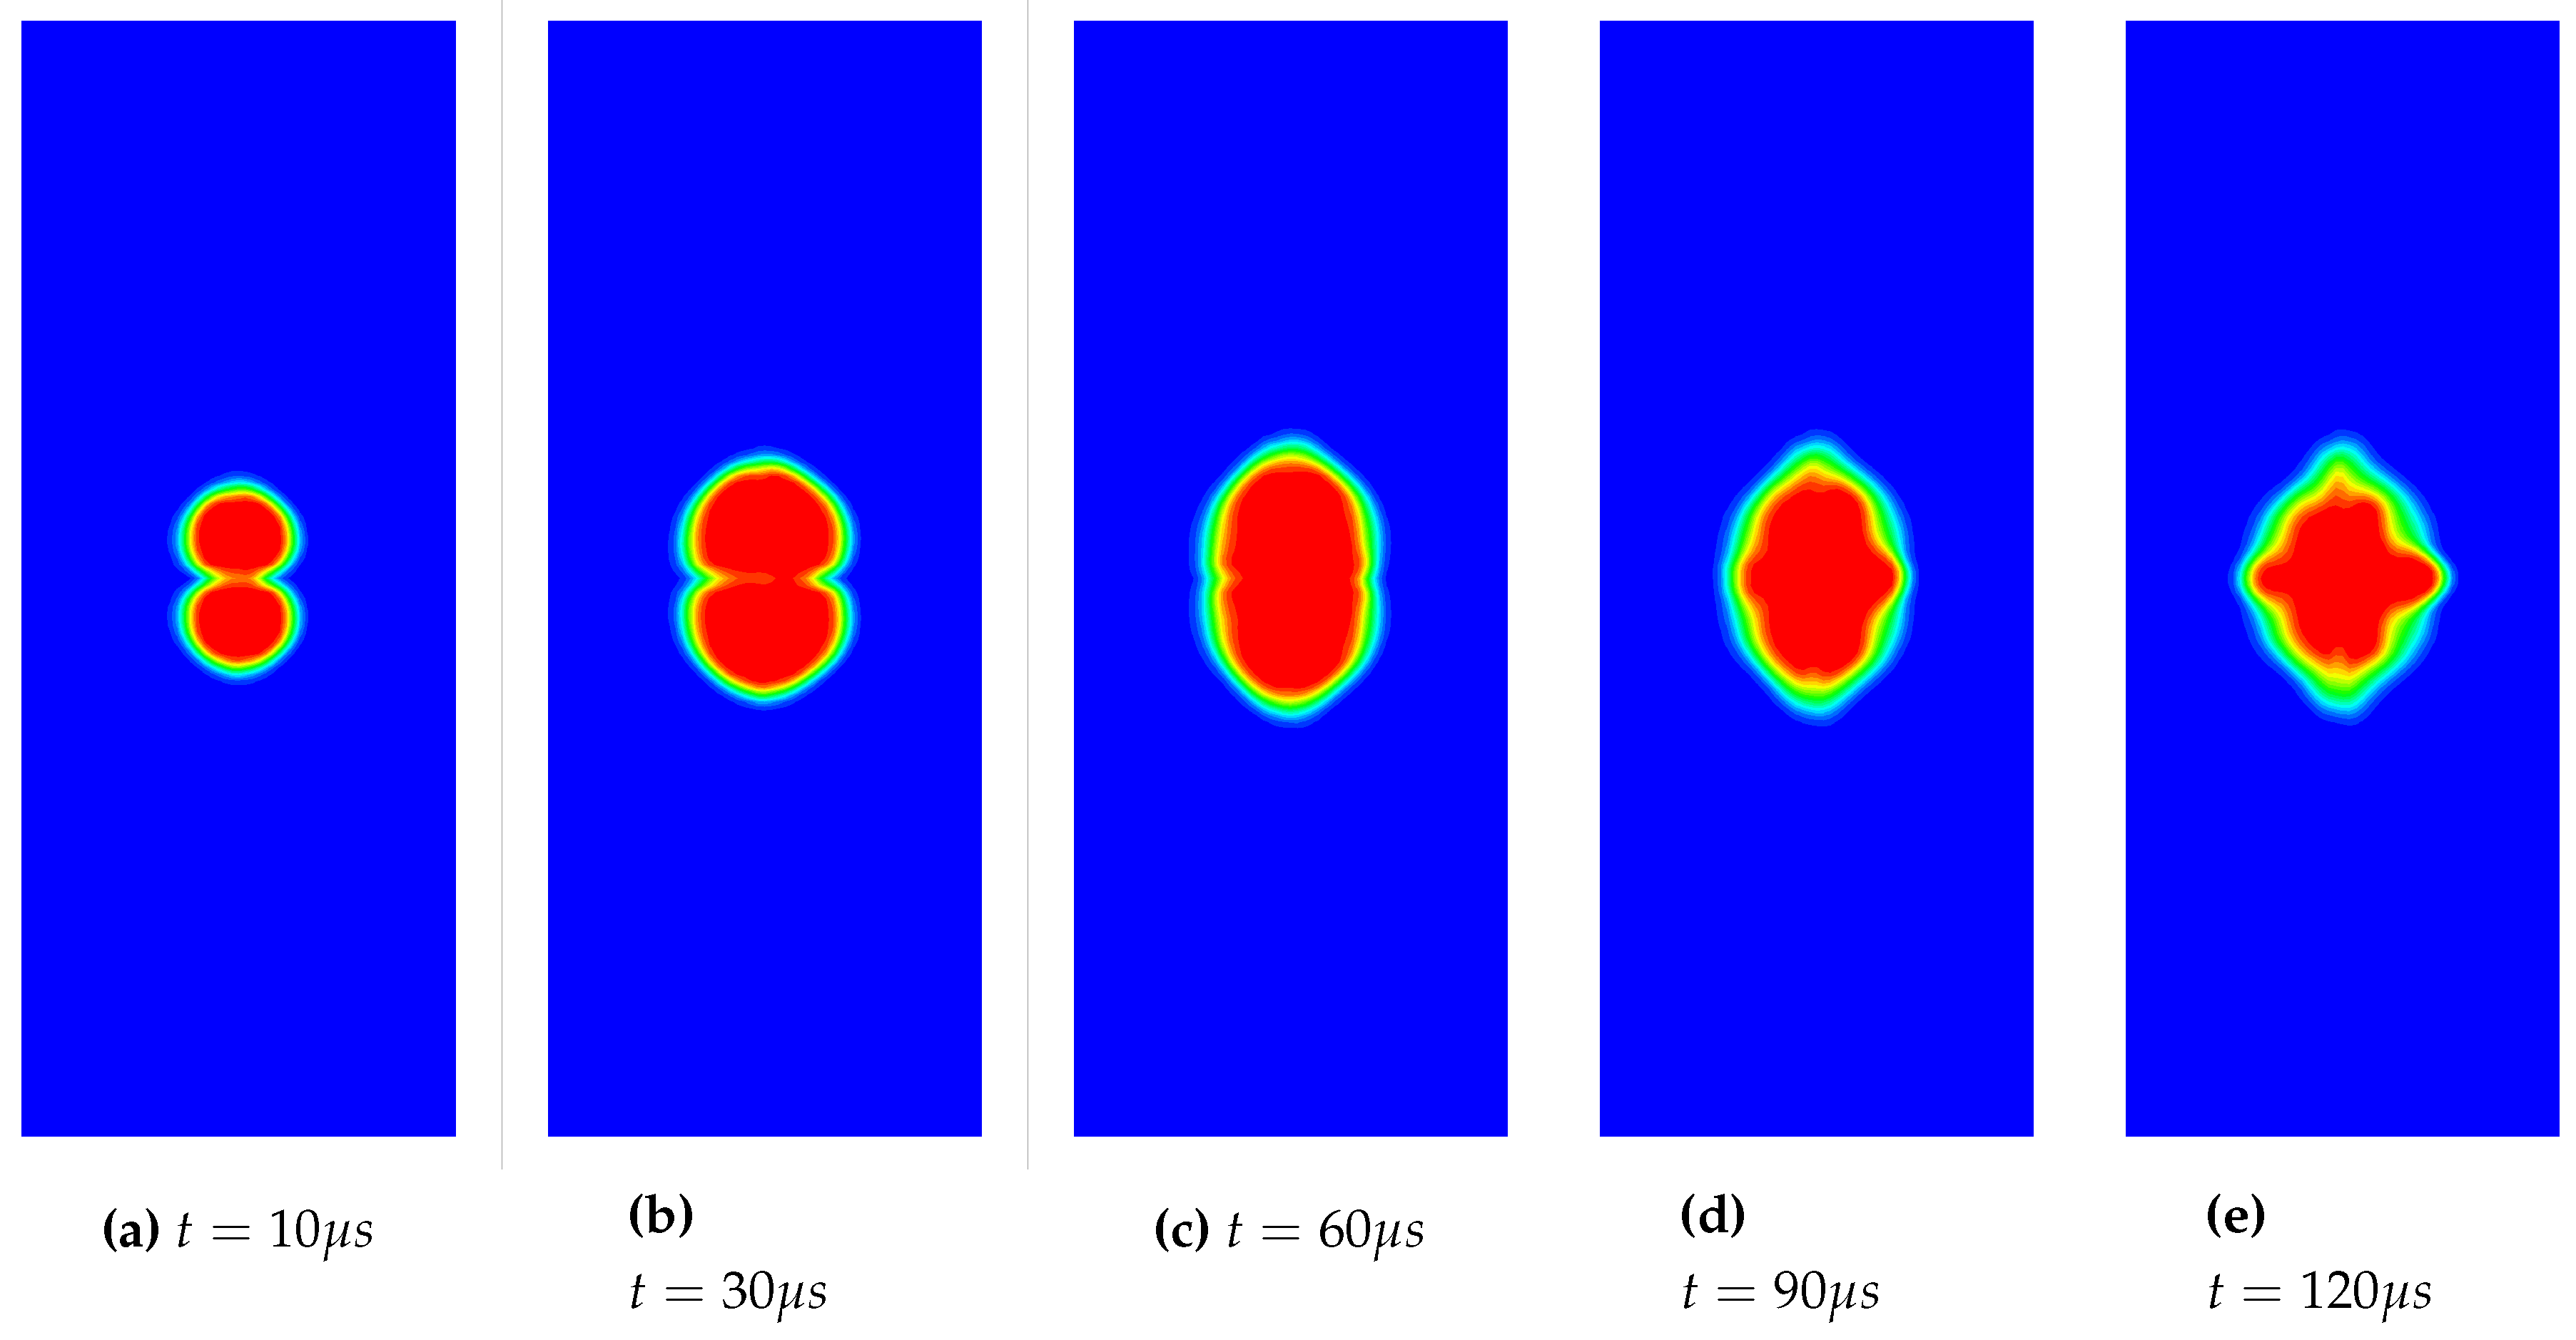
4.5. 3D Underwater of two bubbles placed vertically in an enclosed region.
5. Conclusions
Author Contributions
Funding
Data Availability Statement
Acknowledgments
Conflicts of Interest
Abbreviations
| UNDEX | Underwater Explosion |
| DIM | Diffuse Interface Models |
| UCNS3D | Unstructured Compressible Navier Stokes 3D |
| CWENO | Central Weighted Essentially Non-Oscillatory scheme |
| FV | Finite Volume |
References
- Petitpas, F.; Massoni, J.; Saurel, R.; Lapebie, E.; Munier, L. Diffuse interface model for high speed cavitating underwater systems. International Journal of Multiphase Flow 2009, 35, 747–759. [Google Scholar] [CrossRef]
- Petitpas, F.; Saurel, R.; Ahn, B.K.; Ko, S. Modelling cavitating flow around underwater missiles. International Journal of Naval Architecture and Ocean Engineering 2011, 3, 263–273. [Google Scholar] [CrossRef]
- Kwack, Y.K.; Ko, S.H. Numerical analysis for supercavitating flows around axisymmetric cavitators. International Journal of Naval Architecture and Ocean Engineering 2013, 5, 325–332. [Google Scholar] [CrossRef]
- Wenfeng, X. A numerical simulation of underwater shock-cavitation-structure interaction. PhD Thesis 2005, 53, 1–207. [Google Scholar]
- Daramizadeh, A.; Ansari, M.R. Numerical simulation of underwater explosion near air-water free surface using a five-equation reduced model. Ocean Engineering 2015, 110, 25–35. [Google Scholar] [CrossRef]
- Xie, W.F.; Liu, T.G.; Khoo, B.C. The simulation of cavitating flows induced by underwater shock and free surface interaction. Applied Numerical Mathematics 2007, 57, 734–745. [Google Scholar] [CrossRef]
- Saurel, R.; Lemetayer, O. A multiphase model for compressible flows with interfaces, shocks, detonation waves and cavitation. Journal of Fluid Mechanics 2001, 431, 239–271. [Google Scholar] [CrossRef]
- Ghidaglia, J.M.; Mrabet, A.A. A regularized stiffened-gas equation of state. Journal of Applied Analysis & Computation 2018, 8, 675–689. [Google Scholar] [CrossRef]
- Shyue, K.M. An Anti-Diffusion based Eulerian Interface-Sharpening Algorithm for Compressible Two-Phase Flow with Cavitation. Proceedings of the 8th International Symposium on Cavitation 2012, 268, 7–12. [Google Scholar] [CrossRef]
- Maltsev, V.; Skote, M.; Tsoutsanis, P. High-order methods for diffuse-interface models in compressible multi-medium flows: A review. Physics of Fluids 2022, 34. [Google Scholar] [CrossRef]
- Pelanti, M.; Shyue, K.M. A mixture-energy-consistent six-equation two-phase numerical model for fluids with interfaces, cavitation and evaporation waves. Journal of Computational Physics 2014, 259, 331–357. [Google Scholar] [CrossRef]
- Pelanti, M.; Shyue, K.M. A numerical model for multiphase liquid–vapor–gas flows with interfaces and cavitation. International Journal of Multiphase Flow 2019, 113, 208–230. [Google Scholar] [CrossRef]
- Baer, M.; Nunziato, J. A two-phase mixture theory for the deflagration-to-detonation transition (ddt) in reactive granular materials. International Journal of Multiphase Flow 1986, 12, 861–889. [Google Scholar] [CrossRef]
- Saurel, R.; Petitpas, F.; Abgrall, R. Modelling phase transition in metastable liquids: application to cavitating and flashing flows. Journal of Fluid Mechanics 2008, 607, 313–350. [Google Scholar] [CrossRef]
- Jun, Y.; Jian-qiang, P.; Hai-kun, W.; Hai-bin, M. Application of Compressible Multi-component Flow in Underwater Explosion Problems. Procedia Engineering 2015, 126, 339–343. [Google Scholar] [CrossRef]
- Chiapolino, A.; Saurel, R.; Nkonga, B. Sharpening diffuse interfaces with compressible fluids on unstructured meshes. Journal of Computational Physics 2017, 340, 389–417. [Google Scholar] [CrossRef]
- LeMartelot, S.; Nkonga, B.; Saurel, R. Liquid and liquid–gas flows at all speeds. Journal of Computational Physics 2013, 255, 53–82. [Google Scholar] [CrossRef]
- Zein, A. Numerical methods for multiphase mixture conservation laws with phase transition. PhD Thesis 2010, 120. [Google Scholar]
- Ma, Z.H.; Causon, D.M.; Qian, L.; Gu, H.B.; Mingham, C.G.; Martínez Ferrer, P. A GPU based compressible multiphase hydrocode for modelling violent hydrodynamic impact problems. Computers and Fluids 2015, 120, 1–23. [Google Scholar] [CrossRef]
- Kapila, A.K.; Menikoff, R.; Bdzil, J.B.; Son, S.F.; Stewart, D.S. Two-phase modeling of deflagration-to-detonation transition in granular materials: Reduced equations. Physics of Fluids 2001, 13, 3002–3024. [Google Scholar] [CrossRef]
- Allaire, G.; Clerc, S.; Kokh, S. A five-equation model for the simulation of interfaces between compressible fluids. Journal of Computational Physics 2002, 181, 577–616. [Google Scholar] [CrossRef]
- Antoniadis, A.; Drikakis, D.; Farmakis, P.; Fu, L.; Kokkinakis, I.; Nogueira, X.; Silva, P.; Skote, M.; Titarev, V.; Tsoutsanis, P. UCNS3D: An open-source high-order finite-volume unstructured CFD solver. Computer Physics Communications 2022, 279. [Google Scholar] [CrossRef]
- Tsoutsanis, P.; Dumbser, M. Arbitrary high order central non-oscillatory schemes on mixed-element unstructured meshes. Computers and Fluids 2021, 225. [Google Scholar] [CrossRef]
- Murrone, A.; Guillard, H. A five equation reduced model for compressible two phase flow problems. Journal of Computational Physics 2005, 202, 664–698. [Google Scholar] [CrossRef]
- Wackers, J.; Koren, B. A fully conservative model for compressible two-fluid flow. International Journal for Numerical Methods in Fluids 2005, 47, 1337–1343. [Google Scholar] [CrossRef]
- Schmidmayer, K.; Bryngelson, S.H.; Colonius, T. An assessment of multicomponent flow models and interface capturing schemes for spherical bubble dynamics. Journal of Computational Physics 2020, 402, 109080. [Google Scholar] [CrossRef]
- Zhang, J. A simple and effective five-equation two-phase numerical model for liquid-vapor phase transition in cavitating flows. International Journal of Multiphase Flow 2020, 132, 1–47. [Google Scholar] [CrossRef]
- Johnsen, E.; Colonius, T. Implementation of WENO schemes in compressible multicomponent flow problems. Journal of Computational Physics 2006, 219, 715–732. [Google Scholar] [CrossRef]
- Harlow, F.H.; Amsden, A.A. A numerical fluid dynamics calculation method for all flow speeds. Journal of Computational Physics 1971, 8, 197–213. [Google Scholar] [CrossRef]
- Saurel, R.; Abgrall, R. Simple method for compressible multifluid flows. SIAM Journal of Scientific Computing 1999, 21, 1115–1145. [Google Scholar] [CrossRef]
- Quirk, J.J.; Karni, S. On the dynamics of a shock-bubble interaction. Journal of Fluid Mechanics 1996, 318, 129–163. [Google Scholar] [CrossRef]
- Tsoutsanis, P.; Adebayo, E.; Merino, A.; Arjona, A.; Skote, M. CWENO Finite-Volume Interface Capturing Schemes for Multicomponent Flows Using Unstructured Meshes. Journal of Scientific Computing 2021, 89. [Google Scholar] [CrossRef]
- Schmidmayer, K.; Petitpas, F.; Daniel, E.; Favrie, N.; Gavrilyuk, S. A model and numerical method for compressible flows with capillary effects. Journal of Computational Physics 2017, 334, 468–496. [Google Scholar] [CrossRef]
- Liu, T.; Khoo, B.; Xie, W. Isentropic one-fluid modelling of unsteady cavitating flow. Journal of Computational Physics 2004, 201, 80–108. [Google Scholar] [CrossRef]
- Ansari, M.; Daramizadeh, A. Numerical simulation of compressible two-phase flow using a diffuse interface method. International Journal of Heat and Fluid Flow 2013, 42, 209–223. [Google Scholar] [CrossRef]
- Zhang, J. A simple and effective five-equation two-phase numerical model for liquid-vapor phase transition in cavitating flows. International Journal of Multiphase Flow 2020, 132, 1–47. [Google Scholar] [CrossRef]
- Tsoutsanis, P.; Titarev, V.; Drikakis, D. WENO schemes on arbitrary mixed-element unstructured meshes in three space dimensions. Journal of Computational Physics 2011, 230, 1585–1601. [Google Scholar] [CrossRef]
- Titarev, V.; Tsoutsanis, P.; Drikakis, D. WENO schemes for mixed-elementunstructured meshes. Communications in Computational Physics 2010, 8, 585–609. [Google Scholar] [CrossRef]
- Tsoutsanis, P. Extended bounds limiter for high-order finite-volume schemes on unstructured meshes. Journal of Computational Physics 2018, 362, 69–94. [Google Scholar] [CrossRef]
- Simmonds, N.; Tsoutsanis, P.; Antoniadis, A.; Jenkins, K.; Gaylard, A. Low-Mach number treatment for Finite-Volume schemes on unstructured meshes. Applied Mathematics and Computation 2018, 336, 368–393. [Google Scholar] [CrossRef]
- Maltsev, V.; Yuan, D.; Jenkins, K.; Skote, M.; Tsoutsanis, P. Hybrid discontinuous Galerkin-finite volume techniques for compressible flows on unstructured meshes. Journal of Computational Physics 2023, 473. [Google Scholar] [CrossRef]
- Tsoutsanis, P.; Pavan Kumar, M.; Farmakis, P. A relaxed a posteriori MOOD algorithm for multicomponent compressible flows using high-order finite-volume methods on unstructured meshes. Applied Mathematics and Computation 2023, 437. [Google Scholar] [CrossRef]
- Farmakis, P.; Tsoutsanis, P.; Nogueira, X. WENO schemes on unstructured meshes using a relaxed a posteriori MOOD limiting approach. Computer Methods in Applied Mechanics and Engineering 2020, 363. [Google Scholar] [CrossRef]
- Antoniadis, A.; Tsoutsanis, P.; Drikakis, D. High-order schemes on mixed-element unstructured grids for aerodynamic flows. 42nd AIAA Fluid Dynamics Conference and Exhibit 2012 2012. [Google Scholar] [CrossRef]
- Kokkinakis, I.; Antoniadis, A.; Drikakis, D.; Tsoutsanis, P.; Rana, Z. High-order methods for hypersonic shock wave turbulent boundary layer interaction. 20th AIAA International Space Planes and Hypersonic Systems and Technologies Conference, 2015.
- Antoniadis, A.; Tsoutsanis, P.; Drikakis, D. Numerical accuracy in RANS computations of high-lift multi-element airfoil and aircraft configurations. 53rd AIAA Aerospace Sciences Meeting 2015. [Google Scholar] [CrossRef]
- Antoniadis, A.; Tsoutsanis, P.; Rana, Z.; Kokkinakis, I.; Drikakis, D. Azure: An advanced CFD software suite based on high-resolution and high-order methods. 53rd AIAA Aerospace Sciences Meeting 2015. [Google Scholar] [CrossRef]
- Fernandez-Fidalgo, J.; Ramirez, L.; Tsoutsanis, P.; Colominas, I.; Nogueira, X. A reduced-dissipation WENO scheme with automatic dissipation adjustment. Journal of Computational Physics 2021, 425. [Google Scholar] [CrossRef]
- Tsoutsanis, P.; Kokkinakis, I.; Könözsy, L.; Drikakis, D.; Williams, R.; Youngs, D. Comparison of structured- and unstructured-grid, compressible and incompressible methods using the vortex pairing problem. Computer Methods in Applied Mechanics and Engineering 2015, 293, 207–231. [Google Scholar] [CrossRef]
- Srinivasan, H.; Tsoutsanis, P. Adaptive mesh refinement techniques for high-order finite-volume weno schemes. ECCOMAS Congress 2016 - Proceedings of the 7th European Congress on Computational Methods in Applied Sciences and Engineering 2016, 2, 2883–2899. [Google Scholar] [CrossRef]
- Tsoutsanis, P.; Drikakis, D. Addressing the challenges of implementation of high-order finite-volume schemes for atmospheric dynamics on unstructured meshes. ECCOMAS Congress 2016 - Proceedings of the 7th European Congress on Computational Methods in Applied Sciences and Engineering 2016, 1, 684–708. [Google Scholar] [CrossRef]
- Simmonds, N.; Tsoutsanis, P.; Gaylard, A. Implementation OFA low-Mach number modification for high-order finite-volume schemes for arbitrary hybrid unstructured meshes. ECCOMAS Congress 2016 - Proceedings of the 7th European Congress on Computational Methods in Applied Sciences and Engineering 2016, 2, 2900–2915. [Google Scholar] [CrossRef]
- Silva, P.; Tsoutsanis, P.; Antoniadis, A. Simple multiple reference frame for high-order solution of hovering rotors with and without ground effect. Aerospace Science and Technology 2021, 111. [Google Scholar] [CrossRef]
- A. S.F. Silva, P.; Tsoutsanis, P.; Antoniadis, A. Numerical investigation of full helicopter with and without the ground effect. Aerospace Science and Technology 2022, 122. [Google Scholar] [CrossRef]
- Ricci, F.; Silva, P.; Tsoutsanis, P.; Antoniadis, A. Hovering rotor solutions by high-order methods on unstructured grids. Aerospace Science and Technology 2020, 97. [Google Scholar] [CrossRef]
- Adebayo, E.; Tsoutsanis, P.; Jenkins, K. Implementation of CWENO schemes for compressible multicomponent/multiphase flow using interface capturing models. World Congress in Computational Mechanics and ECCOMAS Congress 2022. [Google Scholar] [CrossRef]
- Maltsev, V.; Tsoutsanis, P.; Skote, M. HHybrid finite-volume/discontinuous Galerkin framework for the solution of multiphysics problems using unstructured meshes. World Congress in Computational Mechanics and ECCOMAS Congress 2022. [Google Scholar] [CrossRef]
- Yuan, D.; Tsoutsanis, P.; Jenkins, K. Hybrid high-order finite volume discontinuous Galerkin methods for turbulent flows. World Congress in Computational Mechanics and ECCOMAS Congress 2022. [Google Scholar] [CrossRef]
- Tsoutsanis, P.; Adebayo, E.; Merino, A.; Arjona, A.; Skote, M. CWENO Finite-Volume Interface Capturing Schemes for Multicomponent Flows Using Unstructured Meshes. Journal of Scientific Computing 2021, 89. [Google Scholar] [CrossRef]
- Tsoutsanis, P.; Farmakis, P. A posteriori mood limiting approach for multicomponent flows on unstructured meshes. World Congress in Computational Mechanics and ECCOMAS Congress 2022. [Google Scholar] [CrossRef]
- Tsoutsanis, P. Stencil selection algorithms for WENO schemes on unstructured meshes. Journal of Computational Physics 2023, 475. [Google Scholar] [CrossRef]
- Toro, E.; Spruce, M.; Speares, W. Restoration of the contact surface in the HLL-Riemann solver. Shock Waves 1994, 4, 25–34. [Google Scholar] [CrossRef]
- Tsoutsanis, P.; Antoniadis, A.; Jenkins, K. Improvement of the computational performance of a parallel unstructured WENO finite volume CFD code for Implicit Large Eddy Simulation. Computers and Fluids 2018, 173, 157–170. [Google Scholar] [CrossRef]
- Petrov, N.V.; Schmidt, A.A. Multiphase phenomena in underwater explosion. Experimental Thermal and Fluid Science 2015, 60, 367–373. [Google Scholar] [CrossRef]
- Haimovich, O.; Frankel, S.H. Numerical simulations of compressible multicomponent and multiphase flow using a high-order targeted ENO (TENO) finite-volume method. Computers and Fluids 2017, 146, 105–116. [Google Scholar] [CrossRef]
- Yeom, G.S.; Chang, K.S. A modified HLLC-type Riemann solver for the compressible six-equation two-fluid model. Computers and Fluids 2013, 76, 86–104. [Google Scholar] [CrossRef]
- Shukla, R.K.; Pantano, C.; Freund, J.B. An interface capturing method for the simulation of multi-phase compressible flows. Journal of Computational Physics 2010, 229, 7411–7439. [Google Scholar] [CrossRef]
- Shukla, R.K. Nonlinear preconditioning for efficient and accurate interface capturing in simulation of multicomponent compressible flows. Journal of Computational Physics 2014, 276, 508–540. [Google Scholar] [CrossRef]
- Zhang, Z.F.; Wang, C.; Zhang, A.M.; Silberschmidt, V.V.; Wang, L.K. SPH-BEM simulation of underwater explosion and bubble dynamics near rigid wall. Science China Technological Sciences 2019, 62, 1082–1093. [Google Scholar] [CrossRef]
- Kleine, H.; Tepper, S.; Takehara, K.; Etoh, T.; Hiraki, K. Cavitation induced by low-speed underwater impact. Shockwaves 2009, 2, 895–900. [Google Scholar] [CrossRef]
- Kokh, S.; Lagoutière, F. An anti-diffusive numerical scheme for the simulation of interfaces between compressible fluids by means of a five-equation model. Journal of Computational Physics 2010, 229, 2773–2809. [Google Scholar] [CrossRef]
- Oomar, M.; Malan, A.; Jones, B.; Horwitz, R.; Langdon, G. An all-Mach number HLLC based scheme for Multi-phase Flow with Surface Tension. Applied Sciences 2021, 11. [Google Scholar] [CrossRef]
- Deng, X.; Inaba, S.; Xie, B.; Shyue, K.M.; Xiao, F. High fidelity discontinuity-resolving reconstruction for compressible multiphase flows with moving interfaces. Journal of Computational Physics 2018, 371, 945–966. [Google Scholar] [CrossRef]
- Shyue, K.M. A wave-propagation based volume tracking method for compressible multicomponent flow in two space dimensions. Journal of Computational Physics 2006, 215, 219–244. [Google Scholar] [CrossRef]
- Xie, W.F.; Young, Y.L.; Liu, T.G.; Khoo, B.C. Dynamic response of deformable structures subjected to shock load and cavitation reload. Computational Mechanics 2007, 40, 667–681. [Google Scholar] [CrossRef]
- Qin, Y.; Wang, Y.; Wang, Z.; Yao, X. The Influence of Various Structure Surface Boundary Conditions on Pressure Characteristics of Underwater Explosion. Computer Modeling in Engineering Sciences 2021, 126, 1093–1123. [Google Scholar] [CrossRef]
- Xie, W.; Liu, T.; Khoo, B. Application of a one-fluid model for large scale homogeneous unsteady cavitation: The modified Schmidt model. Computers & Fluids 2006, 35, 1177–1192. [Google Scholar] [CrossRef]
- Zhang, Z.F.; Wang, C.; Wang, L.K.; Zhang, A.M.; Silberschmidt, V.V. Underwater explosion of cylindrical charge near plates: Analysis of pressure characteristics and cavitation effects. International Journal of Impact Engineering 2018, 121, 91–105. [Google Scholar] [CrossRef]
- Hong, Y.; Wang, B.; Liu, H. Numerical simulation of compressible multiphase hydrodynamic problems using reduced five-equation model on body-fitted grids. Computers and Fluids 2022, 233, 105243. [Google Scholar] [CrossRef]
- Jafarian, A.; Pishevar, A. An exact multiphase Riemann solver for compressible cavitating flows. International Journal of Multiphase Flow 2017, 88, 152–166. [Google Scholar] [CrossRef]
- CHENG Juan, S.C.W. High Order Schemes for CFD: A Review. Chinese Journal of Computational Physics 2009, 26, 633–655. Available online: http://www.cjcp.org.cn/EN/abstract/article_825.shtml.
- Wang, Y.; Yao, X.; Qin, Y. Investigation on influence factors about damage characteristics of ice sheet subjected to explosion loads: Underwater explosion and air contact explosion. Ocean Engineering 2022, 260, 111828. [Google Scholar] [CrossRef]
- Wardlaw, A.B.; Luton, J.A. Fluid-structure interaction mechanisms for close-in explosions. Shock and Vibration 2000, 7, 265–275. [Google Scholar] [CrossRef]
- Cheng, L.; Deng, X.; Xie, B.; Jiang, Y.; Xiao, F. Low-dissipation BVD schemes for single and multi-phase compressible flows on unstructured grids. Journal of Computational Physics 2021, 428, 110088. [Google Scholar] [CrossRef]
- Schmidt, D.; Rutland, C.; Corradini, M. A fully compressible, two-dimensional model of small, high-speed, cavitating nozzles. Atomization and Sprays 1999, 9, 255–276. [Google Scholar] [CrossRef]
- Yu, J.; Liu, J.h.; Wang, H.k.; Wang, J.; Zhou, Z.t.; Mao, H.b. Application of two-phase transition model in underwater explosion cavitation based on compressible multiphase flows. AIP Advances 2022, 12. [Google Scholar] [CrossRef]
- Yingtang, D.; Lanhao, Z.; Jia, M.; Eldad, A. A resolved CFD-DEM-IBM algorithm for water entry problems. Ocean Engineering 2021, 240, 110014. [Google Scholar] [CrossRef]
Disclaimer/Publisher’s Note: The statements, opinions and data contained in all publications are solely those of the individual author(s) and contributor(s) and not of MDPI and/or the editor(s). MDPI and/or the editor(s) disclaim responsibility for any injury to people or property resulting from any ideas, methods, instructions or products referred to in the content. |
© 2023 by the authors. Licensee MDPI, Basel, Switzerland. This article is an open access article distributed under the terms and conditions of the Creative Commons Attribution (CC BY) license (http://creativecommons.org/licenses/by/4.0/).


