Submitted:
20 December 2023
Posted:
22 December 2023
You are already at the latest version
Abstract
Keywords:
1. Introduction
- Size substitution (iso-valency): Compensation for lattice expansion. Upon the reduction of Ce4+ cations to Ce3+ the unit cell of CeO2 increases. This is because the eight-coordinated Ce4+ cation size is about 1 Å, while the eight-coordinated Ce3+ cation size is about 1.1 Å. Substituting part of Ce4+ cations with a metal cation with the same formal oxidation state (M4+) but a smaller size compensates partly for the lattice expansion. This is in particular successful when Zr4+ cation is used (size ca. 0.8 Å) [7,8]. While the substitution is valid up to about 50% (maintaining the fluorite structure of CeO2) [9] phase segregation occurs at high temperatures (at 1000oC or so) [10].
- Charge transfer: substitution with reducible higher valence cations. In this case, a fraction of Ce4+ is substituted by a meal cation that can donate an electron and itself be oxidized [11]. The substitution of Ce4+ by U4+ was found to enhance the reduction of CeO2, in particular at low levels [12,13]. Upon the removal of an oxygen atom, three Ce3+ cations are formed (instead of two) and one U4+ is oxidized to U5+. In addition, the fact that both oxides CeO2 and UO2 have the fluorite structure and both cations have the same size, makes them miscible for the entire ratio range [14]. The optimal dosing for the reduction of Ce cations is not clear yet, and neither is the temperature at which phase segregation occurs.
- Charge compensation (alio-valencies): lattice distortion. While the substitution of Ce4+ with metal cations of lower oxidation will create vacancies, these vacancies are not charged. In other words, there is no increase in electron charge. The effect is however clear, for example, the substitution of Ce4+ by Fe3+ cations (up to about 20 %) results in a considerable reduction of the host oxide [15]. This is thought to be due to the distortion of the lattice structure making it less stable and therefore enabling further reduction [16]. In recent work, this was found to be the case upon high temperature reduction (with no chemical input). Yet, considerable phase segregation occurred after one TCWS reaction cycle [17].
2. Experimental
3. Results and Discussions
4. Conclusions
Supplementary Materials
Acknowledgments
References
- Trovarelli, A. Catalytic Properties of Ceria and CeO2-Containing Materials. Catalysis Reviews Science and Engineering 1996, 38, 439–520. [Google Scholar] [CrossRef]
- Yang, C.; Lu, Y.; Zhang, L.; Kong, Z.; Yang, T.; Tao, L.; Zou, Y.; Wang, S. Defect Engineering on CeO2-Based Catalysts for Heterogeneous Catalytic Applications. Small Struct. 2021, 2, 2100058. [Google Scholar] [CrossRef]
- Torrente-Murciano, L.; Garcia-Garcia, R.R. Effect of nanostructured support on the WGSR activity of Pt/CeO2 catalysts. Catalysis Communications 2015, 71, 1–6. [Google Scholar] [CrossRef]
- Idriss, H. Oxygen vacancies role in thermally driven and photon driven catalytic reactions. Chem. Catalysis 2022, 2, 1549–1560. [Google Scholar] [CrossRef]
- Onigbajumo, A.; Swarnkar, P.; Will, G.; Sundararajan, T.; Taghipour, A.; Couperthwaite, S.; Steinberg, T.; Rainey, T. Techno-economic evaluation of solar-driven ceria thermochemical water-splitting for hydrogen production in a fluidized bed reactor. Journal of Cleaner Production 2022, 371, 133303. [Google Scholar] [CrossRef]
- Chueh, W.C.; Falter, C.; Abbott, M.; Scipio, D.; Furler; Haile, S.M.; Steinfeld, A. High-flux solar-driven thermochemical dissociation of CO2 and H2O using nonstoichiometric ceria. Science 2010, 330, 797–801. [Google Scholar] [CrossRef]
- Alifanti, M.; Baps, B.; Blangenois, N.; Naud, J.; Grange, P.; Delmon, B. Characterization of CeO2-ZrO2 Mixed Oxides. Comparison of the Citrate and Sol-Gel Preparation Methods. Chem. Mater. 2003, 15, 395–403. [Google Scholar] [CrossRef]
- Andersson, D.A.; Simak, S.I.; Skorodumova, N.V.; Abrikosov, I.A.; Johansson, B. Redox properties of CeO2–MO2 (M = Ti, Zr, Hf, or Th) solid solutions from first principles calculations. Appl Phys Lett. 2007, 90, 031909. [Google Scholar] [CrossRef]
- Diagne, C.; Idriss, H.; Kiennemann, A. Hydrogen Production by Ethanol Reforming over Rh/CeO2-ZrO2 Catalysts. Catal. Commun. 2002, 3, 565–571. [Google Scholar] [CrossRef]
- Grau-Crespo, R.; de Leeuw, N.H.; Hamad, S.; Waghmare, U.V. Phase separation and surface segregation in ceria–zirconia solid solutions. Proc. R. Soc. A 2011, 467, 1925–1938. [Google Scholar] [CrossRef]
- Hanken, B.E.; Stanek, C.R.; Grønbech-Jensen, N.; Asta, M. Computational study of the energetics of charge and cation mixing in U1-xCexO2. Phys. Rev. B 2011, 84, 085131. [Google Scholar] [CrossRef]
- Scaranto, G.; Idriss, H. The Effect of Uranium Cations on the Redox Properties of CeO2 Within the Context of Hydrogen Production from Water. Top. Catal. 2015, 58, 143–148. [Google Scholar] [CrossRef]
- Al-Shankiti, I.; Al-Otaibi, F.; Al-Salik, Y.; Idriss, H. Solar thermal hydrogen production from water over modified CeO2 materials. Top. Catal. 2013, 56, 1129–1138. [Google Scholar] [CrossRef]
- Prieur, D.; Vigier, J.-F.; Popa, K.; Walter, O.; Dieste, O.; Varga, Z.; Beck, A.; Vitova, T.; Scheinost, A.; Martin, P. Charge distribution in U1-xCexO2+y nanoparticles. Inorganic Chemistry 2021, 60, 14550–14556. [Google Scholar] [CrossRef]
- Gupta, A.; Waghmare, U.V.; Hegde, M.S. Correlation of Oxygen Storage Capacity and Structural Distortion in Transition-Metal-, Noble-Metal-, and Rare-Earth-Ion-Substituted CeO2 from First Principles Calculation. Chem. Mater. 2010, 22, 5184–5198. [Google Scholar] [CrossRef]
- Gupta, A.; Kumar, A.; Waghmare, U.V.; Hegde, M.S. Origin of activation of Lattice Oxygen and Synergistic Interaction in Bimetal-Ionic Ce0.89Fe0.1Pd0.01O2-δ Catalyst. Chem. Mater. 2009, 21, 4880–4891. [Google Scholar] [CrossRef]
- Al-Taweel, S.; Nadeem, M.A.; Idriss, H. A study of CexFe1-xO2 as a reducible oxide for the thermal hydrogen production from water. Energy Technology 2022, 2100491, 1–9. [Google Scholar] [CrossRef]
- Cheng, L.; Yue, X.; Fan, J.; Xiang, Q. Site-Specific Electron-Driving Observations of CO2-to-CH4 Photoreduction on Co-Doped CeO2/Crystalline Carbon Nitride S-Scheme Heterojunctions. Adv. Mater. 2022, 34, 2200929. [Google Scholar] [CrossRef] [PubMed]
- Zhao, S.; Kang, D.; Liu, Y.; Wen, Y.; Xie, X.; Yi, H.; Tang, X. Spontaneous Formation of Asymmetric Oxygen Vacancies in Transition-Metal-Doped CeO2 Nanorods with Improved Activity for Carbonyl Sulfide Hydrolysis. ACS Catal. 2020, 10, 11739–11750. [Google Scholar] [CrossRef]
- He, W.; Ran, J.; Yang, G.; He, Z.; Huang, X.; Crittenden, J. Promoting effect of Co-doped CeO2 nanorods activity and SO2 resistance for Hg0 removal. Fuel 2022, 317, 123320–1. [Google Scholar] [CrossRef]
- Ahn, K.; Yoo, D.S.; Prasad, D.H.; Lee, H.-W.; Chung, Y.-C.; Lee, J.-H. Role of Multivalent Pr in the Formation and Migration of Oxygen Vacancy in Pr-Doped Ceria: Experimental and First-Principles Investigations. Chem. Mater. 2012, 24, 4261–4267. [Google Scholar] [CrossRef]
- Zhang, M.; Jiang, D.; Jiang, H. Enhanced oxygen storage capacity of Ce0.88Mn0.12Oy compared to CeO2: An experimental and theoretical investigation. Materials Research Bulletin 2012, 47, 4006–4012. [Google Scholar] [CrossRef]
- Krcha, M.D.; Janik, M.J. Examination of Oxygen Vacancy Formation in Mn-Doped CeO2 (111) Using DFT+U and the Hybrid Functional HSE06. Langmuir 2013, 29, 10120–10131. [Google Scholar] [CrossRef]
- Righi, G.; Benedetti, S.; Rita Magri, R. Investigation of the structural and electronic differences between silver and copper doped ceria using the density functional theory. J. Phys.: Condens. Matter, 2022; 34, 10p, 204010. [Google Scholar]
- Nolan, M. Enhanced oxygen vacancy formation in ceria (111) and (110) surfaces doped with divalent cations. J. Mater. Chem. 2011, 21, 9160–9168. [Google Scholar] [CrossRef]
- Wang, X.; Shen, M.; Wang, J.; Fabris, S. Enhanced Oxygen Buffering by Substitutional and Interstitial Ni Point Defects in Ceria: A First-Principles DFT+U Study. J. Phys. Chem. C 2010, 114, 10221–10228. [Google Scholar] [CrossRef]
- Grieshammer, S.; Grope, B.O.H.; Koettgen, J.; Martin, M. A combined DFT + U and Monte Carlo study on rare earth doped ceria. Phys. Chem. Chem. Phys. 2014, 16, 9974–9986. [Google Scholar] [CrossRef]
- Wang, H.; Qu, Z.; Xie, H.; Maeda, N.; Miao, L.; Wang, Z. Insight into the mesoporous FexCe1-xO2-x catalysts for selective catalytic reduction of NO with NH3: Regulable structure and activity. Journal of Catalysis 2016, 338, 56–67. [Google Scholar] [CrossRef]
- Liu, X.-S.; Wang, X.-D.; Yao, M.; Cui, W.; Yan, H. Effects of Fe doping on oxygen vacancy formation and CO adsorption and oxidation at the ceria(111) surface. Catalysis Communications 2015, 63, 35–40. [Google Scholar] [CrossRef]
- Lykaki, M.; Stefa, S.; Carabineiro, S.A.C.; Pandis, P.K.; Stathopoulos, V.N.; Konsolakis, M. Facet-Dependent Reactivity of Fe2O3/CeO2 Nanocomposites: Effect of Ceria Morphology on CO Oxidation. Catalysts 2019, 9, 371–1. [Google Scholar] [CrossRef]
- Kaneko, H.; Miura, T.; Ishihara, H.; Taku, S.; Yokoyama, T.; Nakajima, H.; Tamaura, Y. Reactive ceramics of CeO2–xMOx (M=Mn, Fe, Ni, Cu) for H2 generation by two-step water splitting using concentrated solar thermal energy. Energy 2007, 32, 656–663. [Google Scholar] [CrossRef]
- Liang, C.; Ma, Z.; Lin, H.; Ding, L.; Qiu, J.; Frandsen, W.; Su, D. Template preparation of nanoscale CexFe1-xO2 solid solutions and their catalytic properties for ethanol steam reforming. J. Mater. Chem. 2009, 19, 1417–1424. [Google Scholar] [CrossRef]
- Metal Oxide Nanostructures Chemistry: Synthesis from Aqueous Solutions. Second Edition. Jean-Pierre Jolivet, Oxford University Press (2015) Editions EDP Sciences. Chapter 5, Surface Chemistry and Physicochemistry of Oxides. 181–226.
- Maslakov, K.I.; Teterin, Y.A.; Popel, A.J.; Teterin, A.Y.; Ivanov, K.E.; Kalmykov, S.N.; Petrov, V.G.; Petrov, P.K.; Farnan, I. XPS study of ion irradiated and unirradiated CeO2 bulk and thin film Samples. Applied Surface Science 2018, 448, 154–162. [Google Scholar] [CrossRef]
- Maslakov, K.I.; Teterin, Y.A.; Ryzhkov, M.V.; Ivanov, K.E.; Popel, A.J.; Teterin, A.Y.; Kalmykov, S.N.; Petrov, V.G.; Petrov, P.K.; Farnan. The electronic structure and the nature of the chemical bond in CeO2. Phys. Chem. Chem. Phys. 2018, 20, 16167–16175. [Google Scholar] [CrossRef]
- Eck, S.; Castellarin-Cudia, C.; Surnev, S.; Ramsey, M.G.; Netzer, F.P. Growth and thermal properties of ultrathin cerium oxide layers on Rh(111). Surface Science 2002, 520, 173–185. [Google Scholar] [CrossRef]
- Soria, E.; Román, E.; Williams, E.M.; de Segovia, J.L. Observations with synchrotron radiation (20–120 eV) of the TiO2(110)–glycine interface. Surface Science 1999, 433–435, 543–548. [Google Scholar] [CrossRef]
- Parkinson, G.S. Iron oxide surfaces. Surface Science Reports 2016, 71, 272–365. [Google Scholar] [CrossRef]
- Mansour, A.N.; Brizzolara, R.A. Characterization of the Surface of FeO Powder by XPS. Surf. Sci. Spectra 1996, 4, 345–350. [Google Scholar] [CrossRef]
- Preisinger, M.; Krispin, M.; Rudolf, T.; Horn, S.; Strongin, D.R. Electronic structure of nanoscale iron oxide particles measured by scanning tunneling and photoelectron spectroscopies. Phys. Rev. B 2005, 71, 165409–1. [Google Scholar] [CrossRef]
- Radu, T.; Iacovita, C.; Benea, D.; Turcu, R. X-Ray Photoelectron Spectroscopic Characterization of Iron Oxide Nanoparticles. Applied Surface Science 2017, 405, 337–343. [Google Scholar] [CrossRef]
- Grosvenor, A.P.; Kobe, B.A.; McIntyre, N.S. Studies of the oxidation of iron by water vapour using X-ray photoelectron spectroscopy and QUASES. Surface Science 2004, 572, 217–227. [Google Scholar] [CrossRef]
- Temesghen, W.; Sherwood, P.M.A. Analytical utility of valence band X-ray photoelectron spectroscopy of iron and its oxides, with spectral interpretation by cluster and band structure calculations. Anal Bioanal Chem 2002, 373, 601–608. [Google Scholar] [CrossRef] [PubMed]
- Bagus, P.S.; Nelin, C.J.; Brundle, C.R.; Vincent Crist, C.B.; Lahiri, N.; Rosso, K.M. Combined multiplet theory and experiment for the Fe 2p and 3p XPS of FeO and Fe2O3. J. Chem. Phys. 2021, 154, 094709. [Google Scholar] [CrossRef] [PubMed]
- Fondell, M.; Gorgoi, M.; Boman, M.; Lindblad, A. Surface modification of iron oxides by ion bombardment – Comparing depth profiling by HAXPES and Ar ion sputtering. Journal of Electron Spectroscopy and Related Phenomena 2018, 224, 23–26. [Google Scholar] [CrossRef]
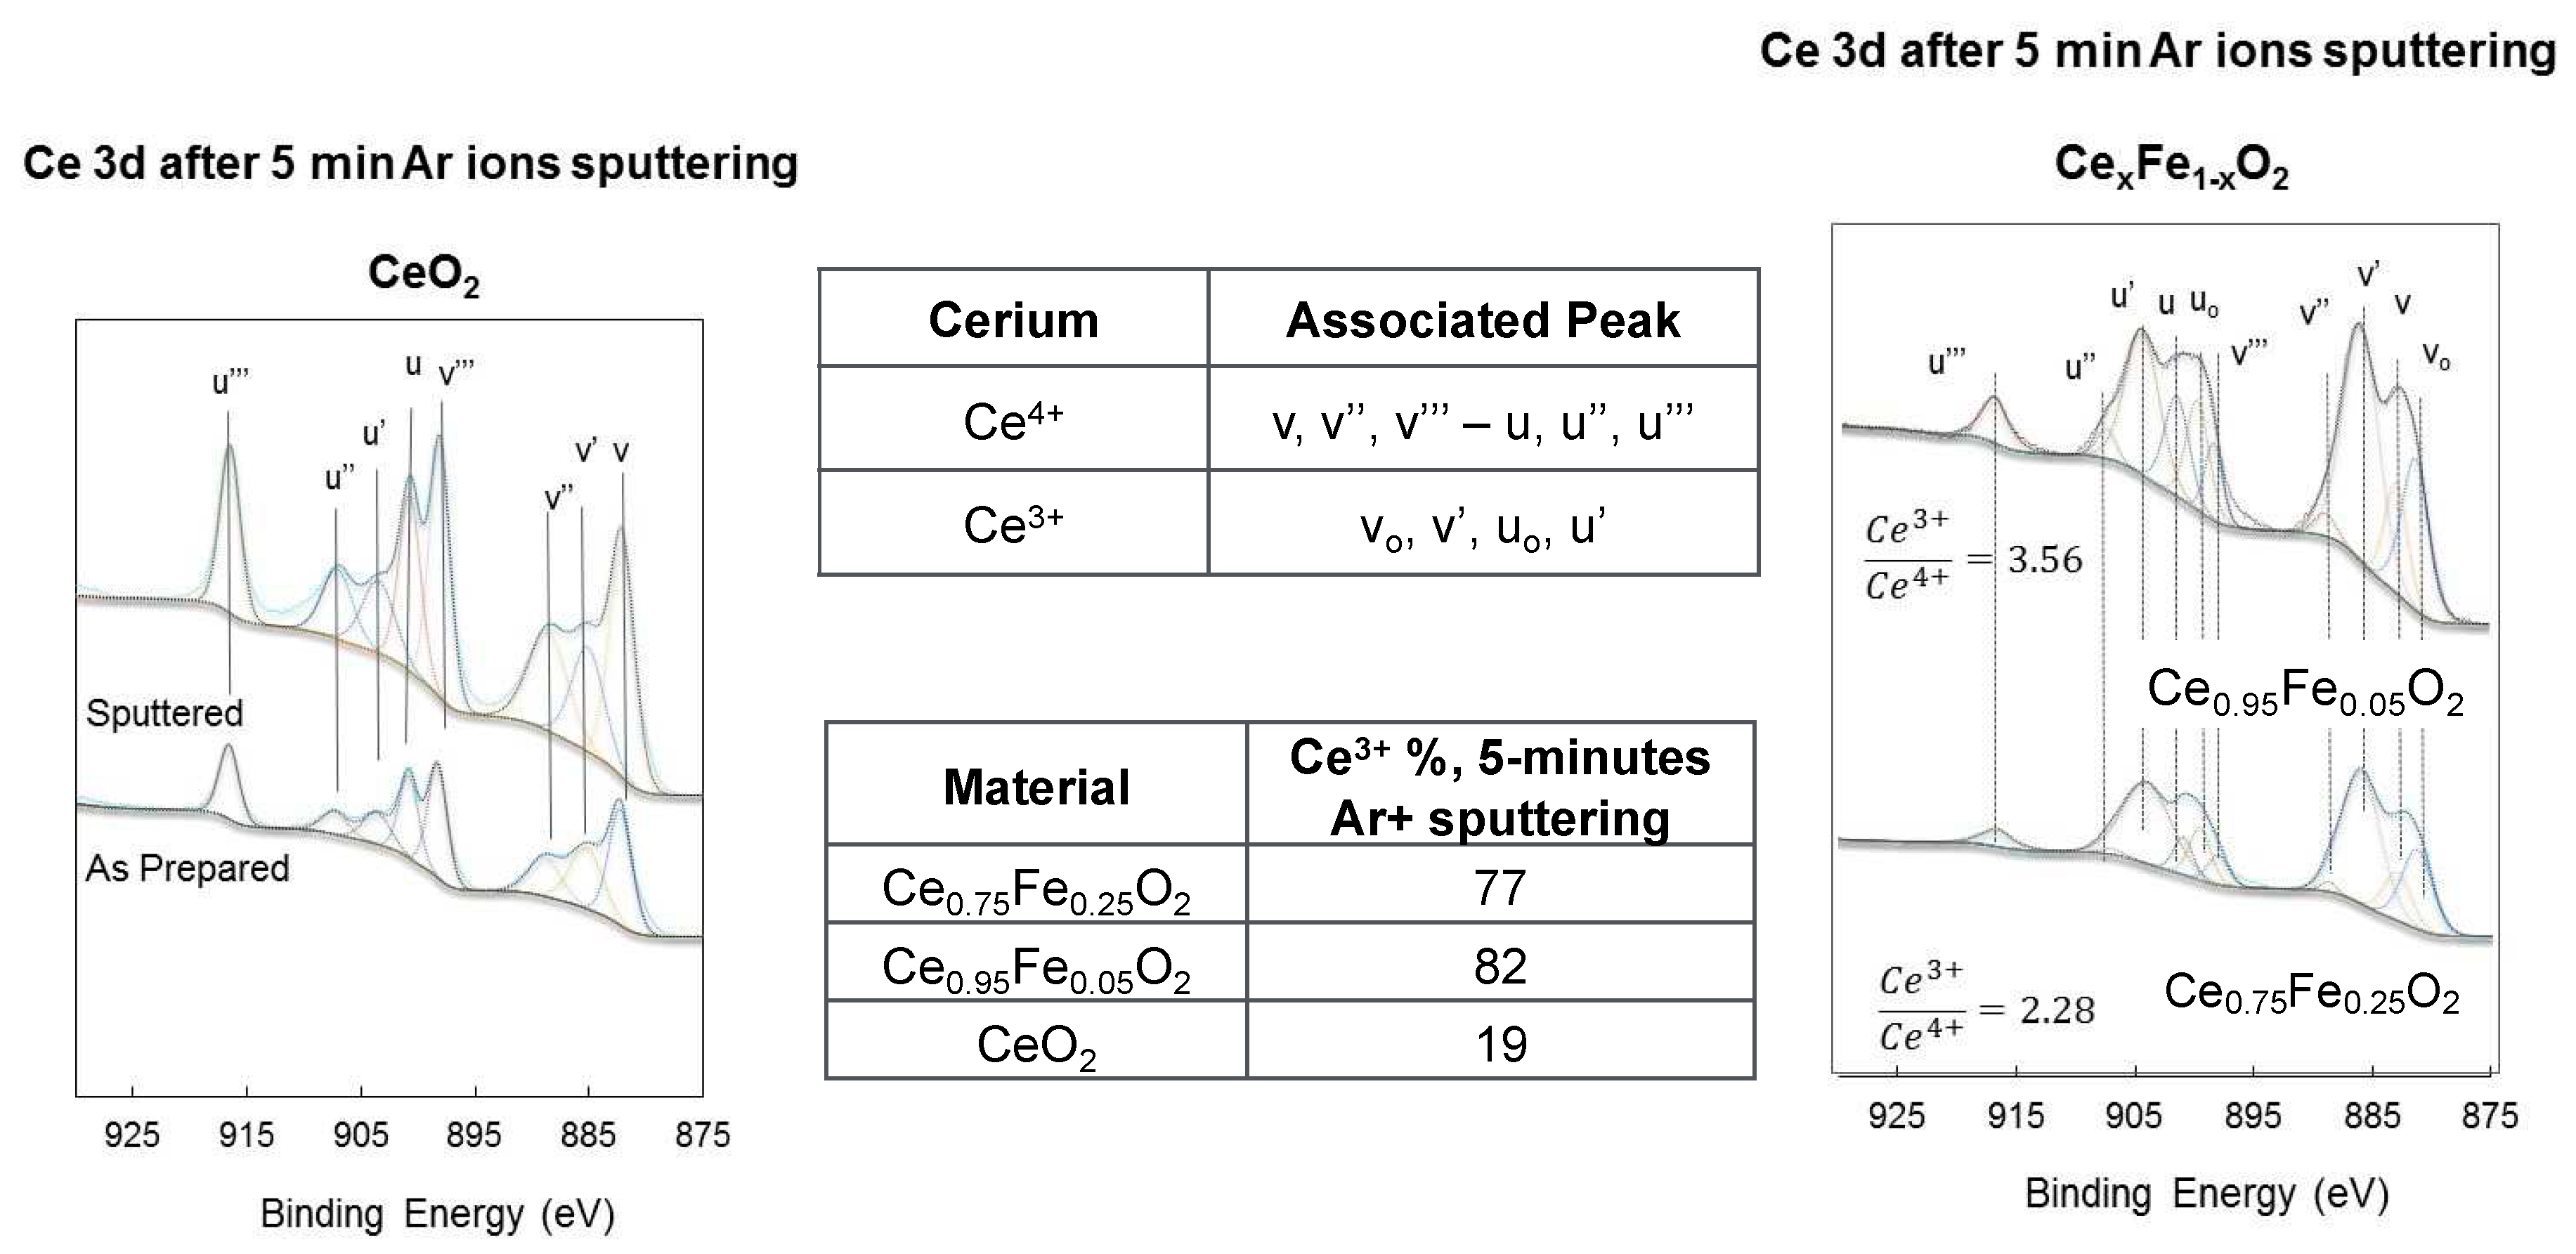
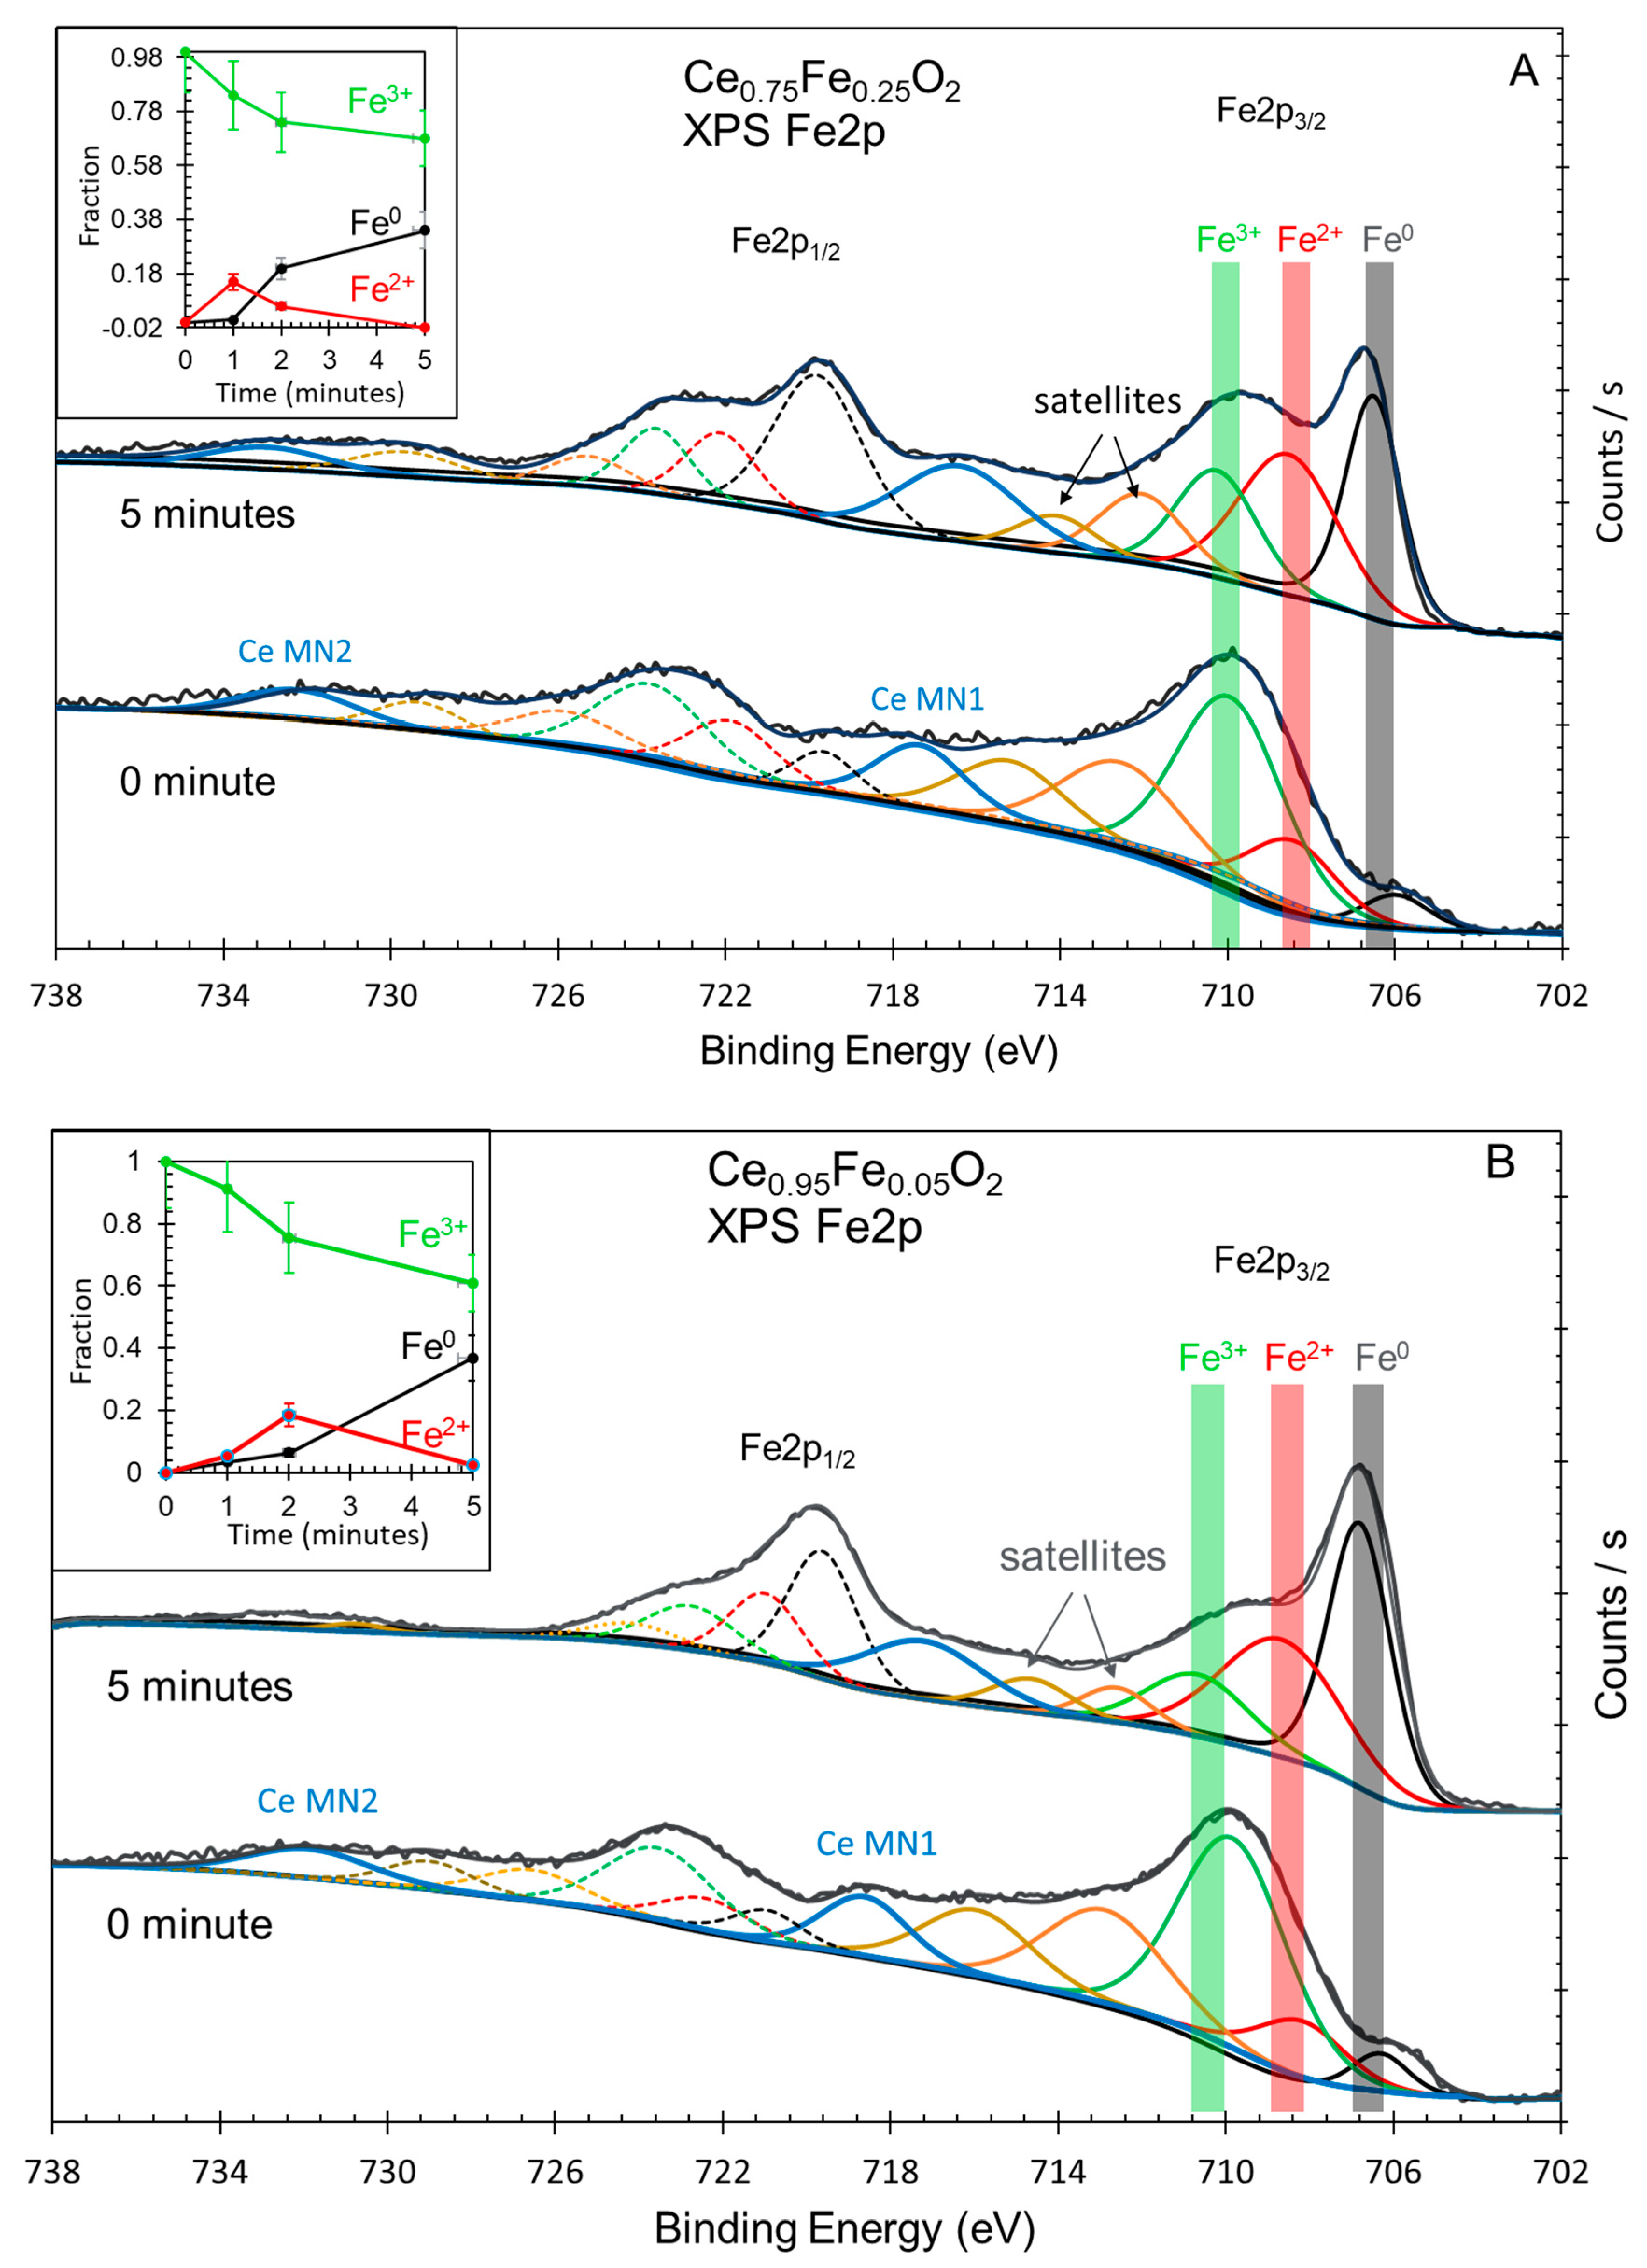
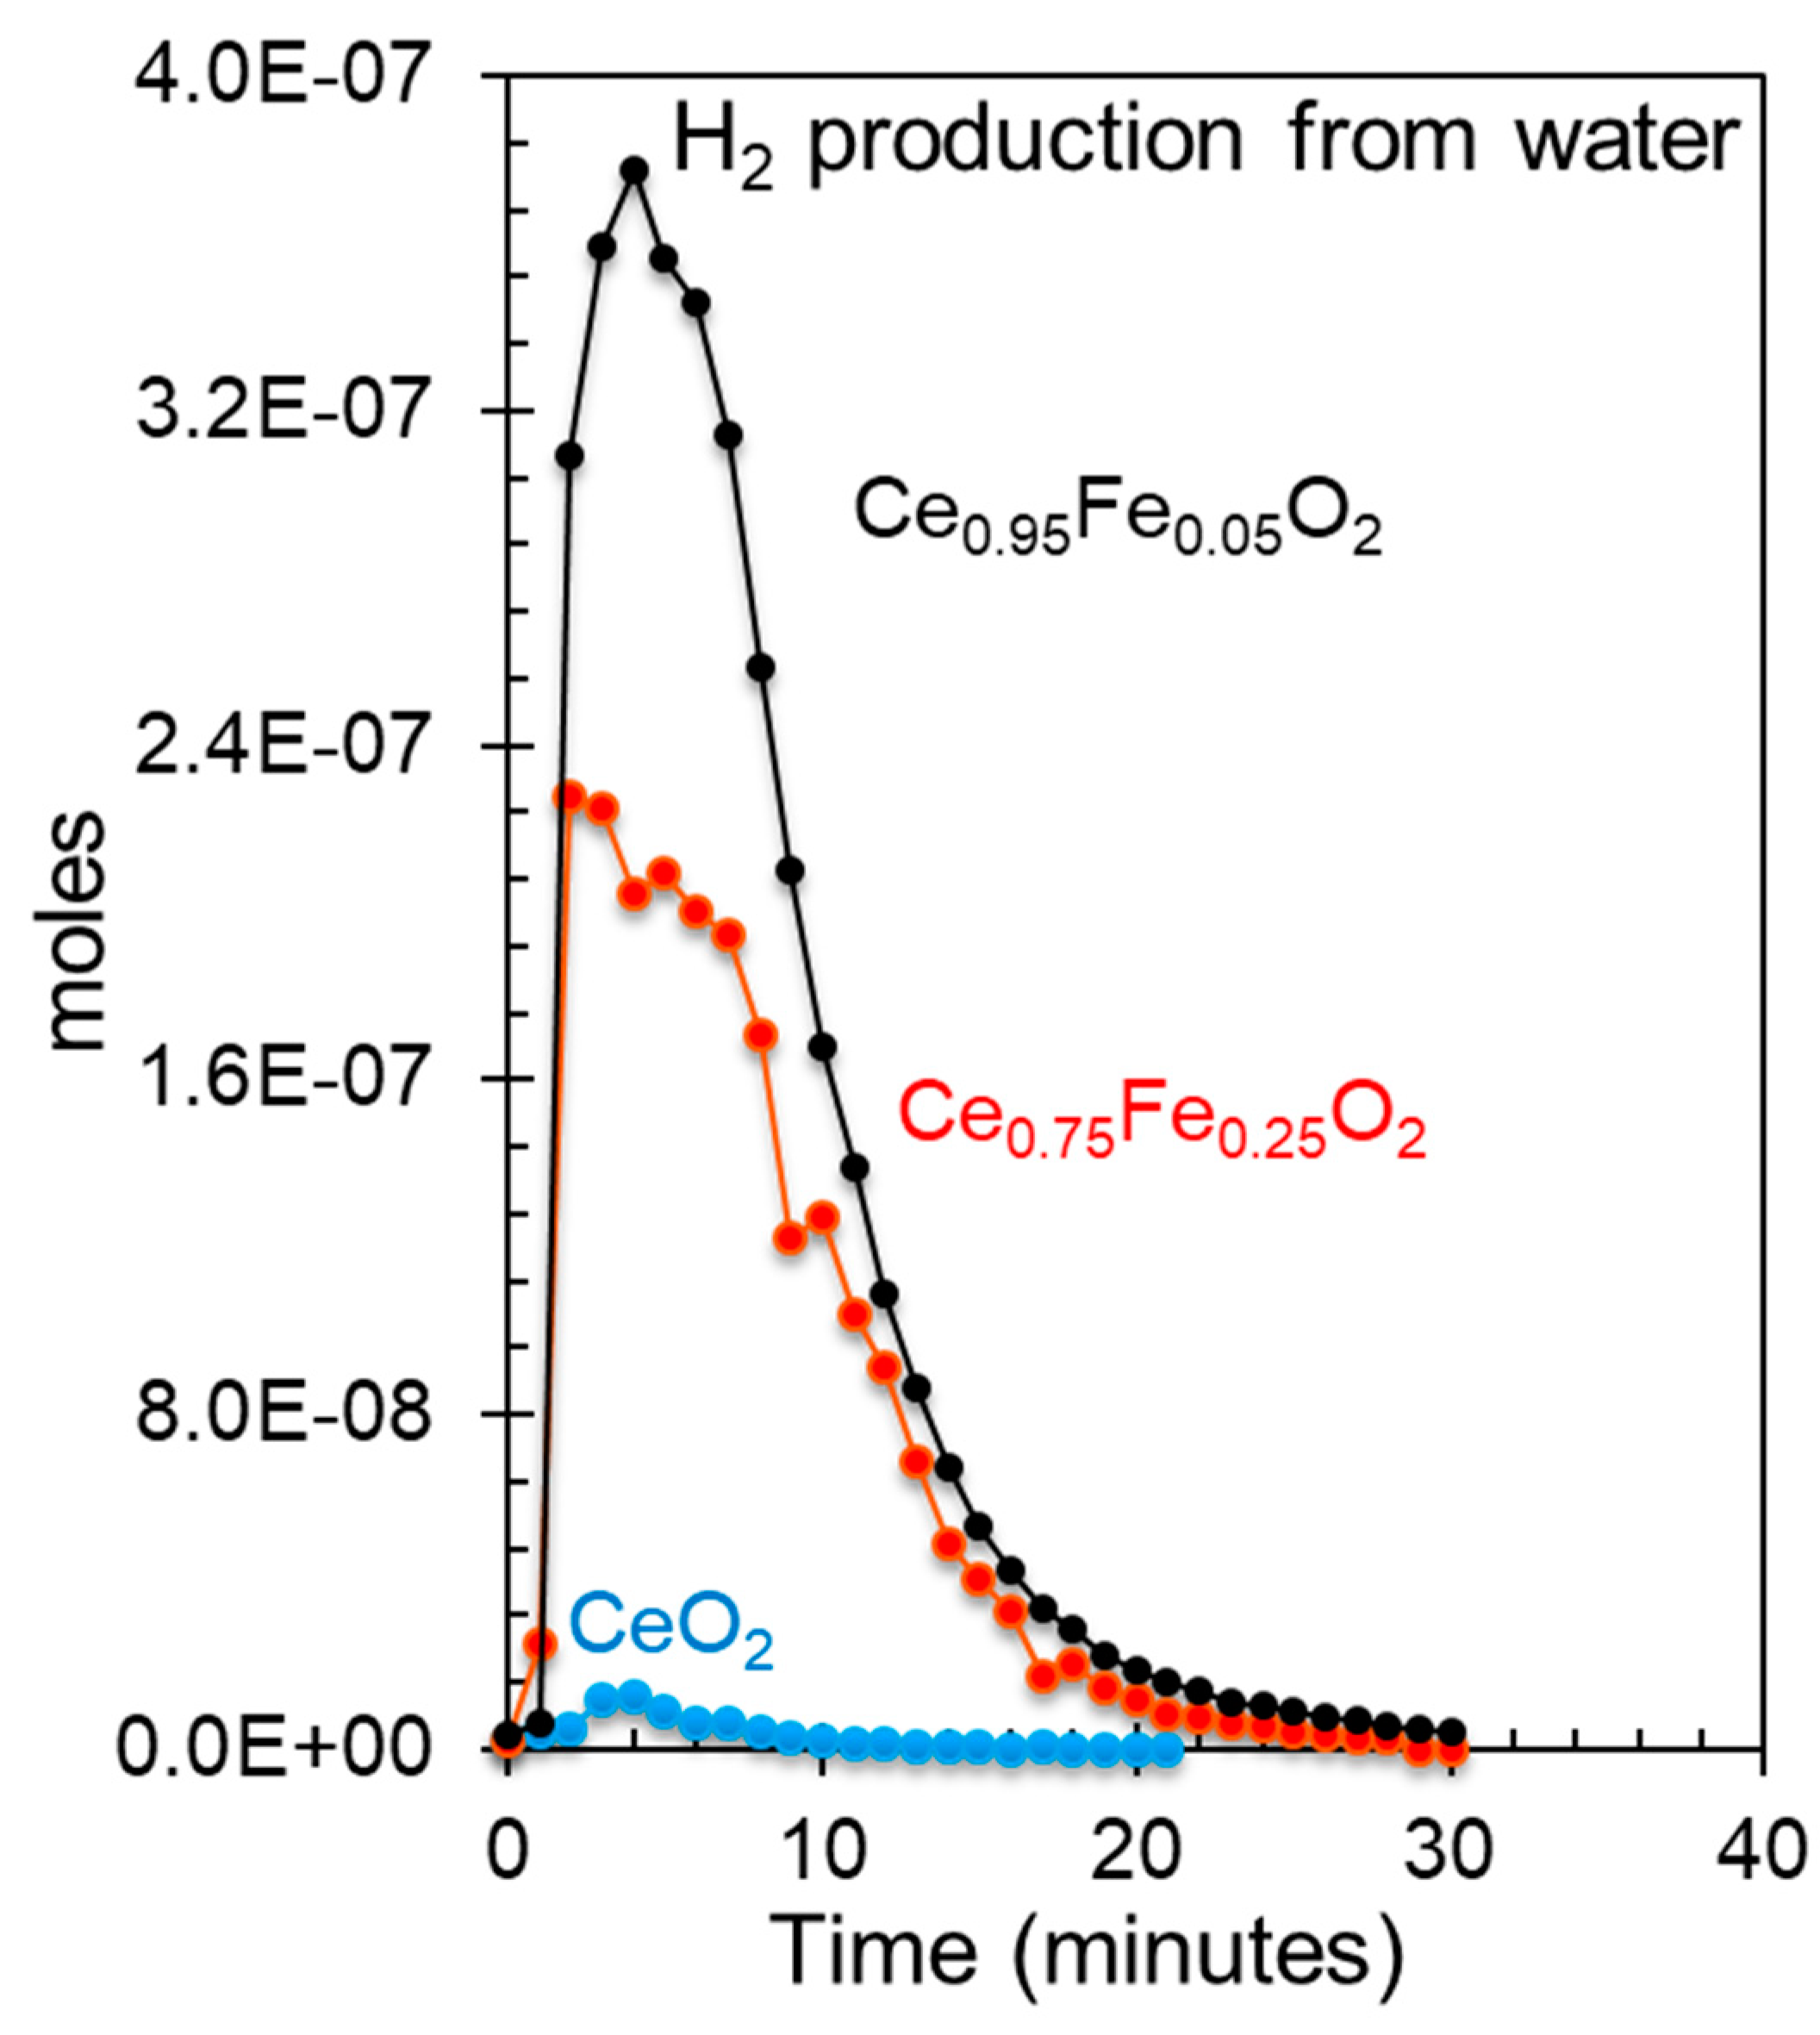
| Oxide | Ce3+/Ce4+ Ce3d |
[Ce 4f + Fe 3dx]/O 2p | Fe0/Fe3+ Fe2p |
Ce 5p/O 2s | H2 Production (mol/g) |
|---|---|---|---|---|---|
| CeO2 | 0.2 | - | - | 0 | 0.2 × 10⁻⁶ |
| Ce0.75Fe0.25O2 | 2.3 | 0.3 | 0.5 | 1.6 | 7.4 × 10⁻⁶ |
| Ce0.95Fe0.05O2 | 3.6 | 0.4 | 0.6 | 1.75 | 11.4 × 10⁻⁶ |
Disclaimer/Publisher’s Note: The statements, opinions and data contained in all publications are solely those of the individual author(s) and contributor(s) and not of MDPI and/or the editor(s). MDPI and/or the editor(s) disclaim responsibility for any injury to people or property resulting from any ideas, methods, instructions or products referred to in the content. |
© 2023 by the authors. Licensee MDPI, Basel, Switzerland. This article is an open access article distributed under the terms and conditions of the Creative Commons Attribution (CC BY) license (http://creativecommons.org/licenses/by/4.0/).


