1. Introduction
Diffuse intrinsic pontine glioma (DIPG), primarily occurring in children [
1], is a high-grade glioma (HGG) belonging to the category of diffuse midline glioma (DMG), as recently classified by WHO [
2].
DIPG is the most common brainstem tumor in children, accounting for approximately 75-80% of all cases; 150-300 patients are diagnosed with DIPG in the USA per year, and a similar number occurs in Europe. The median age of patients with DIPG is approximately 4-7 years (
Figure 1A). No gender difference has been observed among DIPG patients [
2].
DIPG clinical treatment, like many other diseases, is borrowed from adults, with unsuccessful results despite extensive research efforts made in the field, as indicated by hundreds of publications, with more than 500 paper in the last six years. Radiation therapy is the first-line treatment of DIPG patients with a survival benefit of only 3 months [
3] (
Figure 1B), transiently improving neurological deficits.
Most of research on DIPG is performed with ONC201 (
Figure 2A), an imipridone, which has raised hopes as its use in the treatment of glioblastomas of bevacizumab-resistant adults led to an increase in overall survival (OS) and in some cases regression of the primary thalamic lesion [
4].
In May 2019, the diffractometric characterization (single crystal X-ray) of the complex between the human mitochondrial caseinolytic serin-protease P (
hClpP) and ONC201 (PDB ID: 6DL7) (
Figure 2A) led to the identification of this enzyme as its main ONC201biological target [
5].
hClpP is part of a ClpXP mitochondrial matrix cylinder-shaped complex (
hClpP serine protease and the ATP-dependent proteases (AAA+ proteases) ClpX), which is an ATP-dependent protease that mediates the active remodeling, unfolding, and degradation of mitochondrial proteins using energy derived from ATP (
Figure 2B). AAA+ proteases identify misfolded or damaged proteins in mitochondria [
6]. Changes in cellular metabolism and bioenergetics, oxidative stress, and intracellular level of ROS are hallmarks of cancer development, these proteases are also important for the proliferation and metastasis of some types of cancers [
7].
Both genetic and chemical inhibition of ClpXP and its overactivation by chemical and mutation cause the tumor cell death. In fact, on the one hand, inhibition leads to the accumulation of misfolded and damaged respiratory chain proteins and impairs oxidative phosphorylation, resulting in the selective death of cancer cells [
8]. Inhibitors of
hClpP covalently modify the fourteen catalytic residues of Ser153 located within the lumen of the
hClpP tetradecamer [
9]. Several inhibitors of
hClpP have been developed, and their chemical structures optimized. Beta-lactones were initially developed as antibiotics to treat
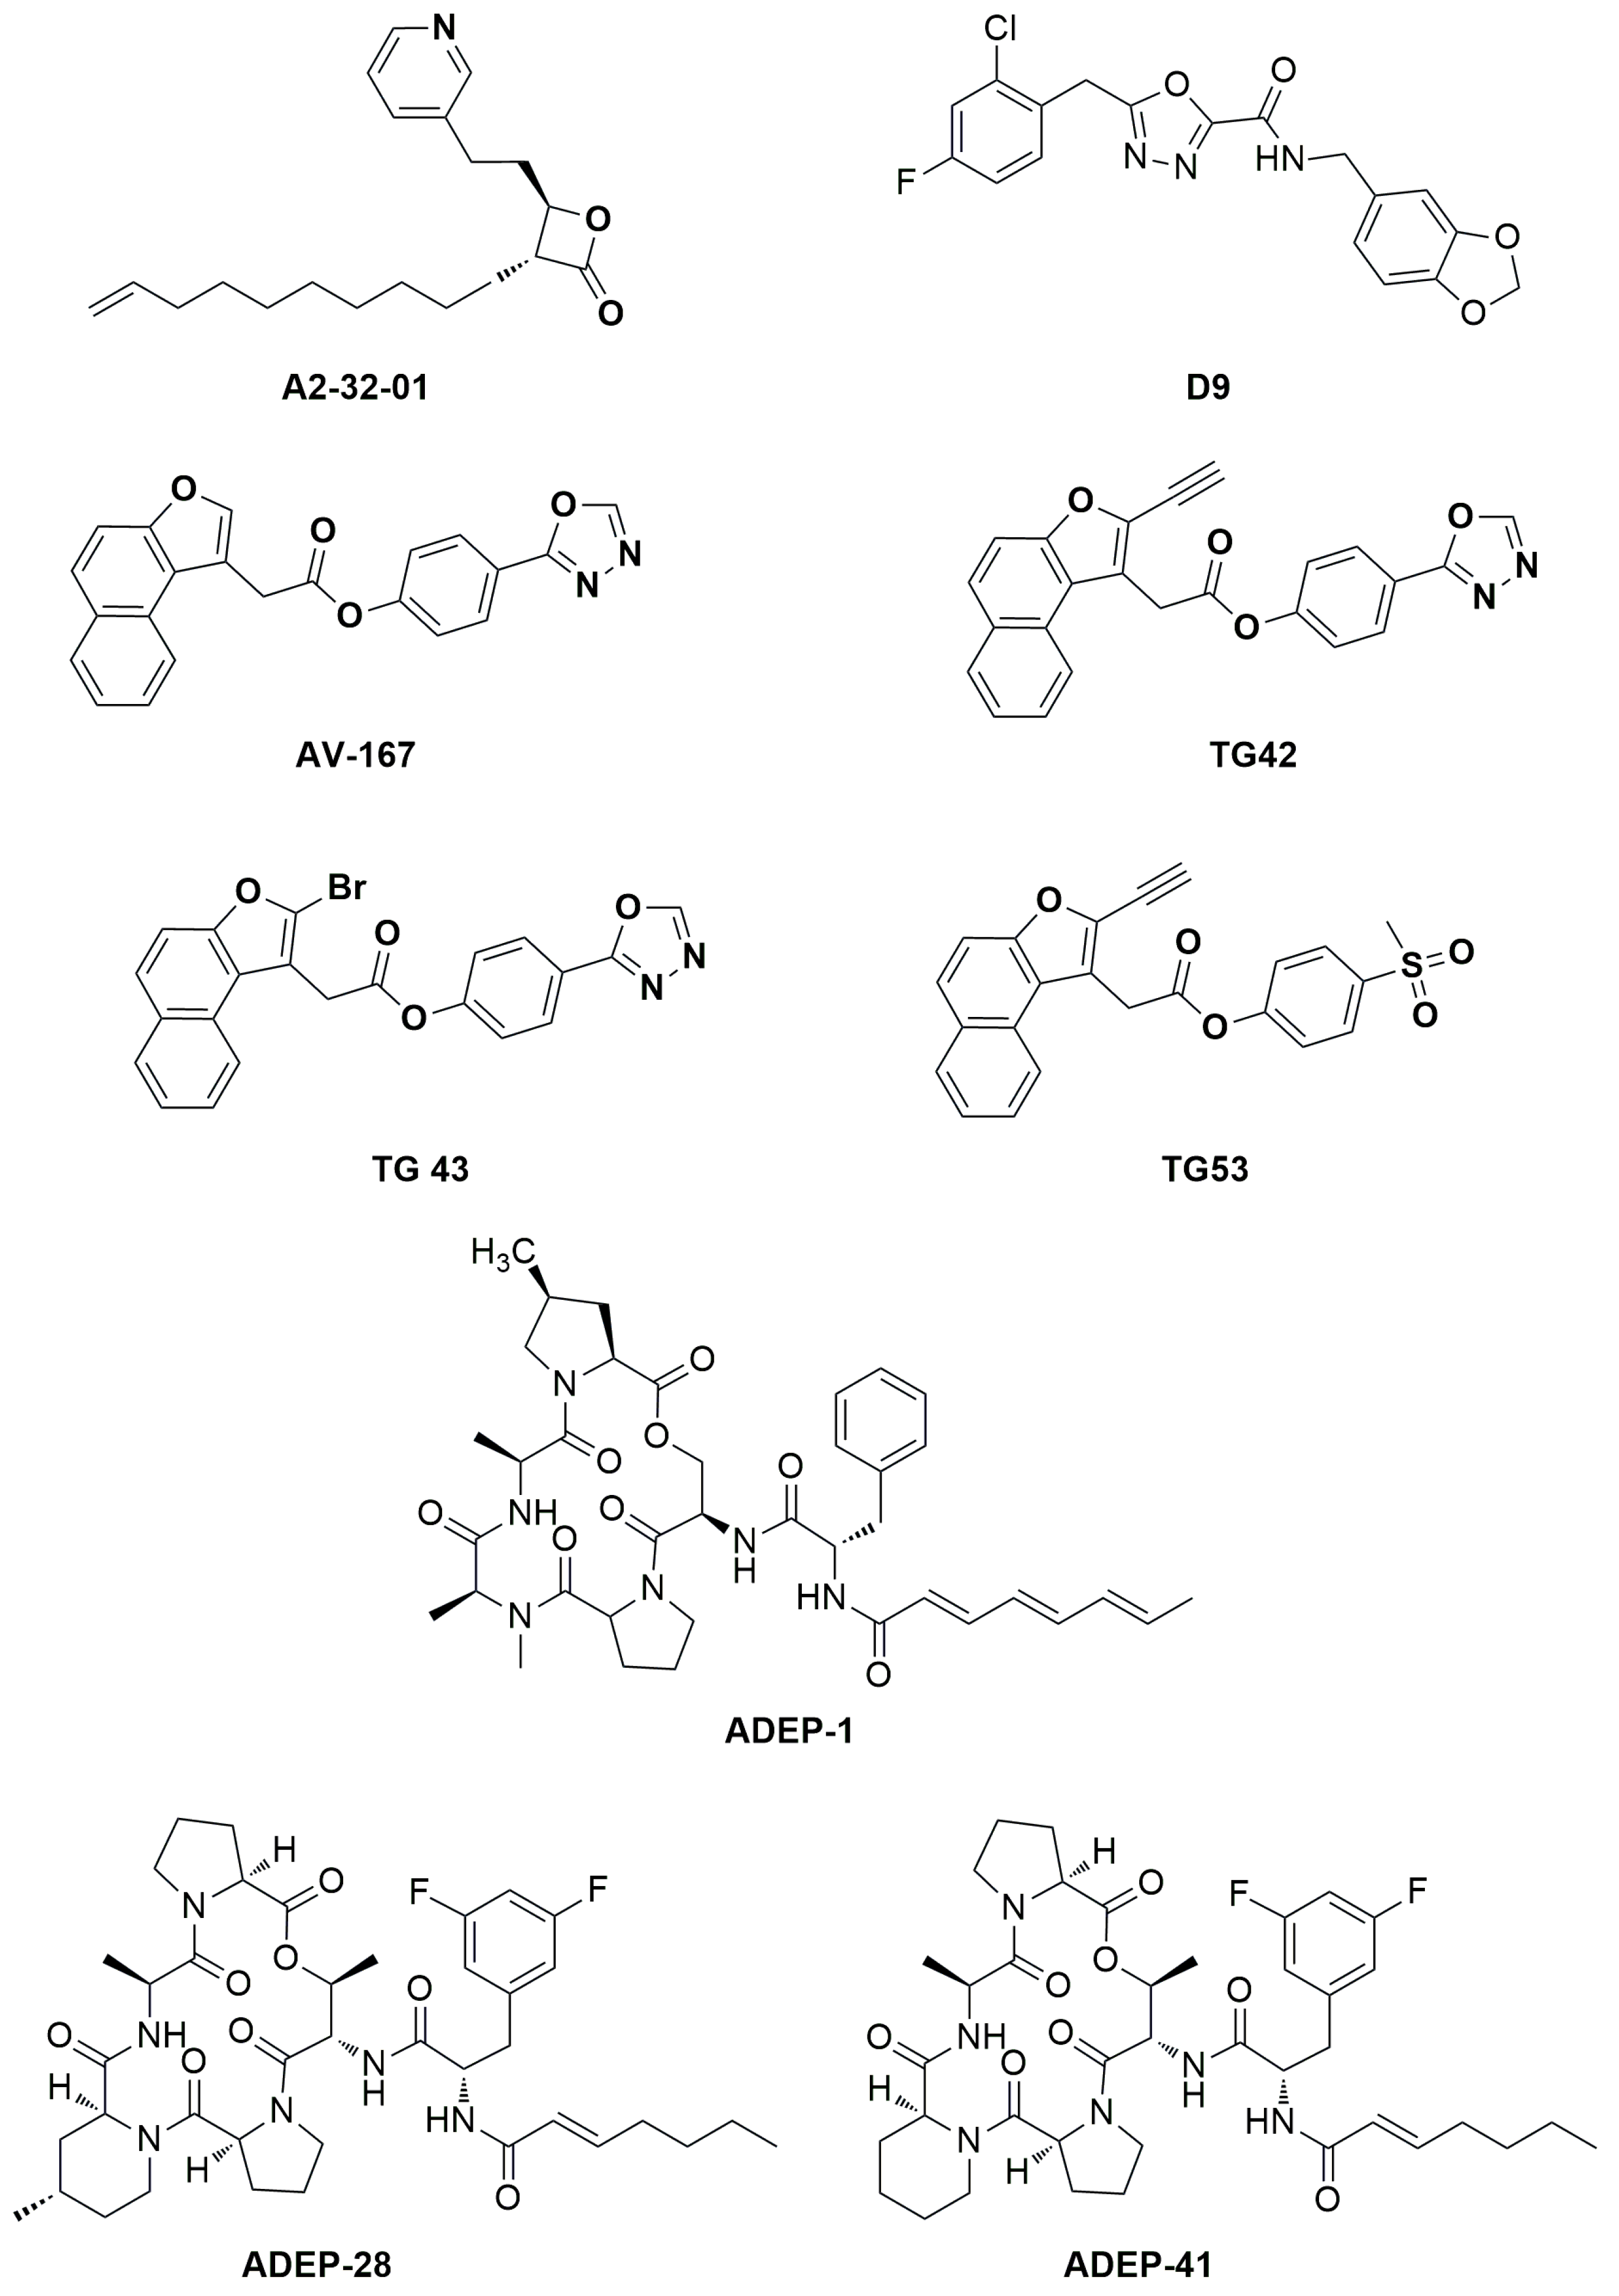
Staphylococcus aureus infections. A2-32-01 (
Figure 3) also showed cytotoxicity in leukemic cell lines, osteosarcoma cell line 143B, and primary leukemic cells over-expressing
hClpP [
7,
10]. Despite the positive results in
in vitro tests, the reduced plasma stability due to the easy lactone hydrolysis and their poor selectivity limited the corresponding clinical development [
11].
The phenyl esters AV-167, TG42, TG43, and TG53 (
Figure 3) developed to improve the chemical stability and potency of β-lactones, exhibited off- and on-target effects that blocked any further study [
9].
Over-activation of
hClpP by its activators results in mitochondrial morphological damage and a decrease in oxidative phosphorylation, inducing tumor cell death [
8]. Therefore, targeting AAA+ proteases like ClpXP could be a strategy against malignant cells sparing normal tissues. Activators binding to the allosteric
hClpP site, produce conformational changes in the enzyme complex, resulting in the enlargement of the axial proteolytic pore and compaction of the protease. These changes lead to
hClpP hyperactivation and increase substrate degradation in a selective and uncontrolled manner [
8]. To date, it is not known whether inhibition or activation of
hClpP would be the preferred therapeutic strategy.
Three classes of
hClpP activators are known: 1) acyldepsipeptides [ADEPs: representative members of ADEPs are ADEP-1, ADEP-28 and ADEP-41 (
Figure 3)] are antibiotics that bind to hydrophobic pockets present between neighboring
hClpP subunits, which usually bind the IGF loop of ClpX, inducing enlargement of the axial pore and structuring of the axial
hClpP loop, resulting in unregulated entry and protein degradation [
12,
13]; 2) oxadiazocarboxyamides, like D9 (
Figure 3), whose binding induces dissociation of the ClpXP complex, and stabilization of the
hClpP activated state by widening the axial pore of the protease [
14]; 3) imipridones, like ONC201, activate
hClpP in a dose-dependent manner as ADEP and D9 [
15]. ONC201 binds noncovalently to the hydrophobic allosteric pockets present between neighboring subunits of
hClpP. Specifically, ONC201 binding induces
hClpP axial pore enlargement, while the complex adopts a more compact conformation like that induced by the binding of ADEP and D9 [
16].
Despite ONC201 rapid development, its pharmacokinetic and pharmacodynamic profile needs to be improved. In fact, the doses used in clinical trials are very high, not all patients respond to the treatment, and its antipsychotic effects should also be considered, as it acts as a Dopamine D2 receptor (DRD2) antagonist [
17].
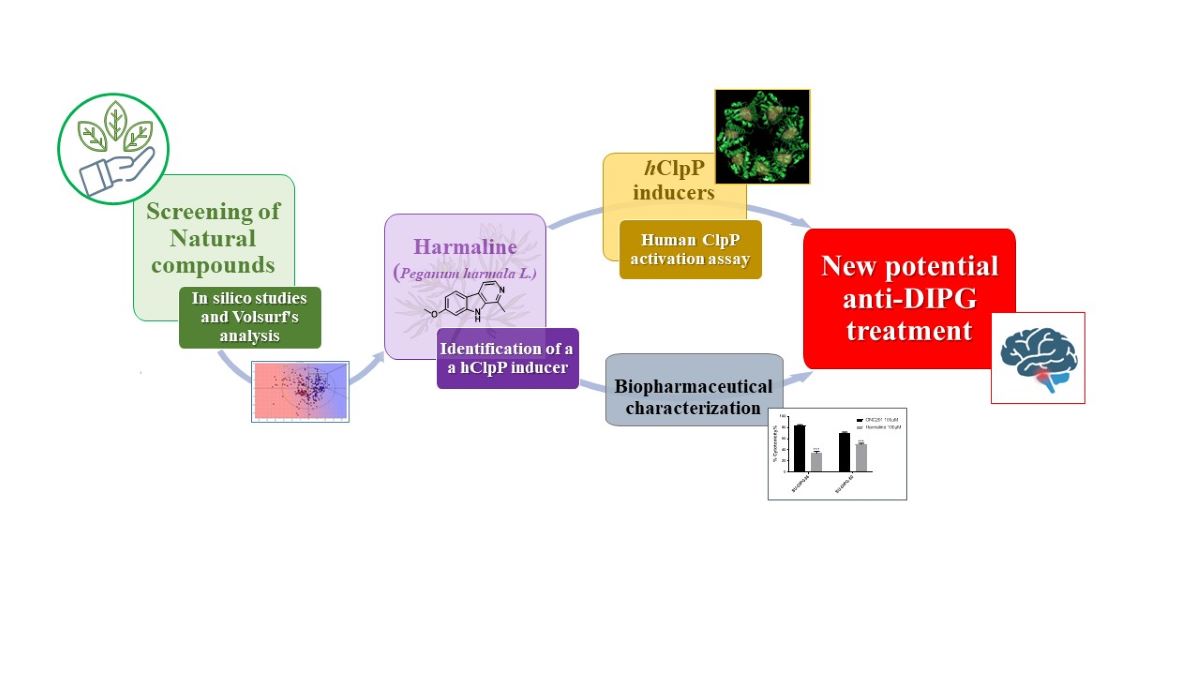
Herein, a drug repurposing study is described. It was accomplished starting by an in silico investigation using ~1500 natural products already on the market with other therapeutic indications, aimed at identifying a novel original scaffold to be used to build more performant hClpP activators. Harmaline was identified by a structure-based Virtual Screening study using Fingerprints for Ligands and Proteins (FLAP). It was tested as a hClpP activator, cytotoxic compound on two representative DIPG cell lines (SU-DIPG-36 and SU-DIPG-50) and spheroids of mitochondrial SH-SY-5Y and SK-N-AS, and efflux pump substrate or modulator. Molecular dynamic experiments were used to explain the obtained results.
2. Materials and Methods
2.1. Computational studies
A database of NPs was downloaded from INDOFINE Chemical Company (
https://indofinechemical.com) and SPECS libraries (
https://www.specs.net/index.php). This Database consists of 1,536 natural compounds, 1489 from SPECS library and 47 from INDOFINE; these are all commercially easily available. They are NPs reflected in the pharmaceutical industry and have a specific activity. The in-silico evaluation (PLS analysis) of the database was carried out using Volsurf+ (VS+) software. Virtual screenings were performed through FLAP software in Structure-based mode (SBVS) [
18]. The software identifies the interaction fields (MIFs), calculated in GRID, which represent the interactions between the molecules under examination and the areas of interest (called pockets) identified within the crystalline structure [
18,
19]. GRID MIFs were generated using four molecular probes: H (shape, steric effects), DRY (hydrophobic interactions), N1 (H-bond donor), and O (H-bond acceptor) interactions. In addition, SBVS mode returns three other important scores for evaluating interactions: GLOB-SUM, GLOB-PROD, and Distance. The first two values refer to the summation and production of the interactions, respectively. The Distance score represents the overall similarity derived from a combination of the degree of overlap between the individual probes (H, DRY, O, and N1) of the MIFs calculated for each candidate ligand and binding site. The crystallized structure used on FLAP is
hClpP in complex with ONC201 (PDB code: 6DL7 resolution 2.00 A°). The GLOB-SUM score was used as a reference to evaluate the degree of interaction. The GLOB-PROD is not used because it is not very indicative; it could be influenced by interaction scores with zero values.
Molecular dynamics simulations were conducted using the optimal poses for harmaline and ONC201 within the pocket. Molecular dynamics studies were performed using Flare software version 6 (Cresset®, Litlington, Cambridgeshire, UK) [
20,
21].
The structures of the ligands were obtained from molecular docking studies and subsequently optimized using the software function "Flare preparation ligand" to minimize their energy. Protein preparation was performed using the "ProteinPrep" function of the software. This tool allows for the automated preparation of proteins for docking and molecular dynamics simulations. A TIP3P waterbox was produced, and the complexity was minimized. The force field used for proteins was AMBER FF14SB, and AMBER GAFF2 was used for the ligands [
22,
23].
Three simulations were conducted over a period of 10 ns. The root-mean-square deviation (RMSD) evaluation at the 10 ns mark revealed no significant variations. The Flare 6.0 software was employed to visualize and examine the molecular dynamics simulations. Furthermore, the WaterSwap absolute binding free energy method was utilized to determine the binding free energies of the ligand-protein complexes investigated, employing a function available in Flare software. The binding free energy was calculated using Bennett's method, thermodynamic integration (TI), and free energy perturbation (FEP). The binding free energy values were obtained by calculating the arithmetic mean of the energies determined using these methods.
2.2. Biochemical studies. Plasmid construction, hClpP expression, and affinity purification
To obtain the
hClpP construct suitable for protein expression, the cDNA was engineered by PCR.
hClpP cDNA (GenBank accession no. Z50853.1) coding sequence was deprived of the first 57 amino acids [
24] corresponding to the mitochondrial targeting sequence MTS, and the ATG codon of the initiating methionine was added. At the 3’ end of the coding sequence, the TEV cleavage site, a V5 epitope, and a 6xHis tag were added [43-44], followed by a stop codon (
Table 1). The construct was cloned into the isopropyl-1-thio-B-D-galactopyranoside (IPTG)-inducible expression vector pET-21b. The
hClpP/pET recombinant plasmid was transformed into E. coli BL21-CodonPlus (DE3)-RIL competent cells (Stratagene); plasmid DNA was isolated from positive clones, and the insert was verified by DNA sequencing. The amino acid sequence is shown in
Table 1.
The recombinant protein was expressed in E. coli BL21-Codon Plus (DE3)-RIL cells. Briefly, a log-phase 250-ml culture (OD600 ~ 0.6), grown in Luria-Bertrani Broth (LB; 10 g/L tryptone, 5 g/L yeast extract, 10 g/L NaCl) supplemented with 0.1 mg/ml ampicillin, was induced with 0.5 mM Isopropil-β-D-1-tiogalattopiranoside (IPTG, Sigma) for 3 h at 22 °C with shaking at 260 rpm.
Bacteria were harvested by centrifugation at 4,600 g for 15 min at +4 °C; pellets were washed with cold PBS and either immediately processed for protein extraction or fast frozen in liquid nitrogen and stored at -80°C. To disrupt bacteria, pellets were resuspended in 25 ml of Lysis/binding buffer (25 mM Tris/HCl pH 7,8, 150 mM NaCl, 10% glycerol, 5 mM imidazole); the mixture was added with 1mg/ml of freshly prepared lysozyme (Sigma) in 10 mM Tris/HCl pH 8.0 and incubated on ice for 30 min with occasional swirling. Cells were sonicated on ice/water with Vibracell Sonics (large probe), 30-sec pulse, 30-sec pause, amplitude 40% for ~ 60 min. Protein purification was achieved by immobilized metal ion affinity chromatography (IMAC) using a Ni-NTA prepacked column. After cell disruption, the cell lysate was cleared by ultracentrifugation at 100,000 g or, alternatively, by filtering through a 0.4 μm membrane. The NaCl concentration in all buffers was low (150 mM) in order to preserve the double heptamer ring of the oligomeric
hClpP complex and, with it, the enzymatic activity. The S100 was passed through the IMAC column and extensive washing was performed to remove most of the impurities, while the recombinant
hClpP protein remained bound due to the high affinity of the 6xHis tag. To improve
hClpP purification two step elutions were applied, one with a buffer containing 50 mM imidazole, which removed most of the
E. coli contaminating proteins, and the other at 300 mM imidazole to elute the specifically bound protein. Identification of
hClpP in the eluted fractions was performed by SDS-PAGE / western blot analysis using a monoclonal antiserum against recombinant
hClpP. As shown in
Figure 4A, all eluted fractions revealed immunopositive bands. A typical profile of specific affinity elution was obtained in the fractions eluted at 300 mM imidazole. In particular, fractions 7-10 showed several bands, two of which migrated with an apparent molecular mass between ~34 kDa and ~30 kDa. The calculated mass value for the recombinant
hClpP is 27.9 kDa, which is closer to the apparent size of the faster migrating band (asterisk). The slower migrating bands, which are more evident in fraction n° 8, could be likely caused by atypical forms of SDS-polypeptide complexes and/or partially denatured proteins, which often occur during gel separation [
27,
28]. Interestingly, a higher electrophoretic mobility for the human recombinant
hClpP separated by SDS-PAGE was also reported [
29]. Fraction n° 8 from 300 mM imidazole elution, which was highly enriched in
hClpP, was also subjected to native PAGE. The
hClpP protein was revealed by western blot analysis, showing three major bands (
Figure 4B). Although it is difficult to predict the apparent molecular mass of the bands, however one could speculate that the band migrating as ~ 250 kDa (asterisk) might represent the heptamer ring. This would be in line with the finding that
hClpP expressed in
E. coli forms a stable heptamer [
30]. The bands with a higher apparent molecular mass could likely correspond to different oligomeric complexes, including the tetradecamer that is the enzymatic active form.
For SDS-PAGE, column fractions (5 μl) were solubilized in 1x Laemmli buffer (Bio-Rad) and separated on a 4-12% denaturing polyacrylamide gel (Bio-Rad Criterion XT Bis-Tris) in MOPS 1X buffer. For native PAGE, a 5-μl volume of the indicated fraction was solubilized in 6X Native protein loading buffer (600mM TrisHCl pH 6.8, 50% Glycerol, 0.02% Bromophenol blue without DTT) and separated on a 4-15% protein gel (Bio-Rad Mini-PROTEAN TGX) in TGX 1X buffer. For western blotting, proteins in the gel were electrotransferred onto polyvinylidene difluoride (PVDF) membranes (Immobilion-P PVDF Membrane 0.45µm) at +4°C for 3 h. Immunoblotting was performed according to standard techniques. The primary antibody was from Abcam; detection was performed with the HRP-conjugated secondary antibody (Bio-Rad). Chemiluminescent detection was achieved using Amersham ECL™PrimeWestern blotting detection reagent (GE Healthcare Life Sciences, Marlborough, MA, USA) or ClarityWestern ECL substrate (Bio-Rad, Hercules, CA, USA); signals were revealed by ChemiDoc MP Imaging System (Bio-Rad, Hercules, CA, USA). Fractions containing hClpP were stored on ice in the cold room for 24 hours for the fluorogenic assay.
2.3. hClpP activity test
To assess the potency of the proteolytic activity of hClpP, a FITC-Casein assay was performed. In a black flat bottom 96-well plate, a 3 μM solution of purified hClpP in Assay Buffer (50 mM HEPES, pH 7.5, 300mM KCl, 1mM DTT, 15%v/v glycerol; AB) preincubated at 37°c for 15 min was added to 5 μL of tested compounds in DMSO at different concentrations (ranging from 1 to 100 μM) and incubated for 15 min at 37°C under shaking. As a control, three wells were filled with 5 µL DMSO. Kinetic measurement was started after adding 2 µM of the fluorogenic peptides FITC-Casein (Merck, C3777), used as a hydrolytic substrate. Fluorescence of the cleaved FITC was recorded over 60 min at 37 °C on a Tecan Infinite M200 pro (λex: 485 nm, emission λem: 535 nm, gain 60). The slope in linear range between 600-1800s was determined and plotted against time. EC50 for each tested compound was calculated using GraphPad Prism 7.05. Results are reported as the mean of two independent experiments performed in triplicate.
2.4. Cell cultures
Patient-derived diffuse intrinsic pontine glioma (DIPG) cell cultures (SU-DIPG-36, SU-DIPG-50) were provided and previously characterized by Dr Michelle Monje with the approval of the Institutional Review Board (Stanford University). These cells were maintained as a monolayer in Tumor Stem Media (TSM) consisting of 1:1 mixture of DMEM /F12 (Invitrogen) and Neurobasal (-A) (Invitrogen), supplemented with B27 (-A) (Life Technologies), human basic fibroblast growth factor (bFGF) (20 ng/ml) (Life Technologies), recombinant human epidermal growth factor (EGF) (20 ng/ml) (Life Technologies), platelet-derived growth factor-AA (PDGF-AA, 10 ng/mL), PDGF-BB (10 ng/ mL) (Life Technologies) and heparin (20 ng/ml) (StemCell Technologies) at 37°C in 5% CO
2 (media change once a week) [
31,
32,
33].
Caco-2 cells were grown in Dulbecco's Modified Eagle Medium high glucose (DMEM high glucose, Euroclone S.p.A., Pero, MI, Italy) supplemented with 10% Fetal Bovine Serum (FBS, Euroclone S.p.A., Pero, MI, Italy), 2 mM glutamine (Euroclone S.p.A., Pero, MI, Italy), 100 U/mL penicillin and 0.1 mg/mL streptomycin (Euroclone S.p.A., Pero, MI, Italy). MDCK-BCRP cells are from Prof. P. Borst, NKI-AVL Institute, Amsterdam. MDCK cells were grown in DMEM high glucose supplemented with 10% fetal bovine serum, 2 mM glutamine, 100 U/mL penicillin, 100 µg/mL streptomycin, in a humidified incubator at 37 °C with a 5 % CO2 atmosphere. Human neuroblastoma SH-SY5Y (ATCC-CRL-2266, MYCN not amplified) and SK-N-AS (ATCC CRL-2137, MYCN not amplified) cells (from Prof. E. Cimetta, Istituto di Ricerca Pediatrica Citta’ della Speranza, Padova, Italy) were cultured in monolayer in DMEM high glucose with L-glutamine medium supplemented with 10% FBS, 1% MEM NEAA (100X) and 1% penicillin/streptomycin. Cells were grown at pH 7.4, 5% CO2 at 37 ◦C and 95% air atmosphere at constant humidity. The medium was replaced every 2–3 days. To obtain a single, centred, and highly reproducible spheroid per well, ultra-low attachment (ULA, Sarstedt®) 96-well round bottom plates were used. The 3D spheroid cultures were generated from single-cell suspensions obtained from trypsinized monolayers of both cell lines. Then, 200 μl of cell suspension (2 × 10³ cells) were seeded into each well of the plates. Each plate was centrifuged at 1,200 rpm for 5 min to help cells settle rapidly to the bottom of the wells. Each spheroid for both cell lines measured approximately 500 μm in diameter.
3D spheroids growth and morphology were monitored for seven days regarding changes in volume and shape. Bright-field microscope images and morphological analyses of spheroids were carried out with the inverted light microscope Zeiss Primo Vert equipped with a Zeiss camera (Axiocam 208 color, Zeiss Microscopy, Germany) at 10× magnification. The software Zen Lite version 2.6 (Zeiss Microscopy, Germany) was used to achieve morphological parameters (diameter and area).
2.5.2. D Cell viability Assay
Determination of cell growth was performed using the CCK8 assay at 72 h. On day 1, 10,000 cells per well were seeded into 96-well plates at 100 µl. On day 2, 100 µL of different concentrations (ranging from 1 to 100 µM) of test compounds, solved in a culture medium, were added to monolayers and incubated in a humidified atmosphere with 5% CO2 at 37°C. In all the experiments, the various drug solvents (EtOH, DMSO) were added in each control to evaluate a possible solvent cytotoxicity. After incubation time with drugs, CCK8 (cat#96992 Sigma Aldrich, Milan, Italy) (10 µl) was added to each well, and after 3-4 h incubation at 37 °C, the absorbance values at λ=450 nm were determined on the Tecan Infinite 200 Microplate Reader. Using the GraphPad Prism, the IC50 for each drug treatment and for each cell line used was determined. Results are reported as the mean of two independent experiments performed in triplicate.
2.6.3. D cell viability assay
SH-SY5Y and SK-N-AS cultures were exposed to drugs on day 7 after spheroids formation, by replacing 100 μl of culture medium with medium containing the different drugs to obtain final concentrations ranging from 12.5 to 100 μM. Appropriate controls containing the same amount of solvent (≤1% v/v) were included in each experiment. Intracellular ATP levels were measured using the CellTiter-Glo® 3D Luminescent Cell Viability Assay (Promega®, G968B, Milan, Italy) according to the manufacturer’s protocols. At the end of the exposure time (72 h), 150 μl of the medium was removed from each well and 50 μl/well of CellTiter-Glo reagent was added. The content was vigorously mixed for 5 minutes to induce cell lysis and to effectively extract ATP from 3D microtissue spheroids. Then, the plate was incubated at room temperature for 25 min, protected from light. The supernatant was transferred to an opaque white flat bottom 96-counter-well plate and the luminescence was measured on a Tecan microplate reader.
2.7. Calcein-AM experiment
These experiments were carried out as reported by Contino et al. with minor modifications to measure the P-gp activity [
34]. MDCK-MDR1 cell line (30,000 cells per well) were seeded into black CulturePlate 96/wells plate with 100 µL medium and allowed to become confluent overnight in a humidified atmosphere with 5% CO
2 at 37°C. 100 µL of different concentrations (ranging from 0.1 to 100 µM) of test compounds, solved in culture medium, were added to monolayers and incubated for 30 min in humidified atmosphere with 5% CO
2 at 37°C. Then, 100 μL of Calcein-AM, solved in Phosphate Buffered Saline (PBS) (final concentration of 2.5 μM), was added to all the wells and the plate was incubated for 30 min at 37 °C, 5% CO
2. Each well was washed 3x100µL ice-cold PBS, and saline buffer was added to each well, and the plate was read with Victor3 (PerkinElmer) at excitation and emission wavelengths of 485 nm and 535 nm, respectively. In these experimental conditions, Calcein cell accumulation was evaluated in the absence and presence of test compounds, and fluorescence basal level was estimated with untreated cells. In treated wells, fluorescence increase was measured, with respect to the basal level. EC
50 values were determined by fitting the fluorescence increase percentage versus log[dose].
2.8. Hoechst 33342 experiment
These experiments were carried out as described by Contino et al. with minor modifications to measure the BCRP activity profile [
34]. MDCK-BCRP cell line (30,000 cells per well) was seeded into black CulturePlate 96/wells plate with 100 µL medium and allowed to become confluent overnight in a humidified atmosphere with 5% CO
2 at 37°C. 100 µL of several concentrations (ranging from 0.1 to 100 µM) of test compounds, solubilized in culture medium, were added to monolayers, and the plate was incubated for 30 min at 37 °C, 5% CO
2. Hoechst 33342 was added in 100 µL of Phosphate Buffered Saline (PBS) to yield a final concentration of 8 μM to the 96-wells plate, and the plate was incubated for 30 min at 37 °C, 5% CO
2. The supernatants were drained, and the cells were fixed for 20 min under light protection using 100 µL per well of a 4% PFA solution. Each well was washed 3 times with 100 µL ice-cold PBS and 100 µL saline buffer added to each well, and the plate was read with Victor3 (PerkinElmer) at excitation and emission wavelengths of 340/35 nm and 485/20 nm, respectively. In these experimental conditions, Hoechst 33342 accumulation was evaluated in the absence and presence of test compounds, and fluorescence basal level was estimated with untreated cells. In treated cells, fluorescence increase with respect to basal level was measured. EC
50 values were determined by fitting the fluorescence increase percentage versus log[dose].
2.9. ATPlite assay
The MDCK-MDR1 cells were seeded into a 96-well plate in complete medium (100 µL) at a density of 2x10
4 cells per well [
34], and the plate was incubated overnight in a humidified atmosphere with 5% CO
2 at 37°C. The medium was removed, and a complete medium (100 µL) was added in the presence or absence of different concentrations of the test compounds. The plate was incubated for 2 h in a humidified atmosphere with 5% CO
2 at 37 °C. Mammalian cell lysis solution (50 µL) was added to all wells, and the plate was shaken for 5 min in an orbital shaker. Substrate solution (50 µL) was added to all wells, and the plate was shaken for 5 min in an orbital shaker. The plate was dark-adapted for 10 min, and the luminescence was measured in Victor3 (PerkinElmer).
2.10. Permeability experiments
Preparation of Caco-2 monolayer. Caco-2 cells were seeded onto a Millicell assay system (Millipore), in which a cell monolayer was set in between a filter cell and a receiver plate at a density of 20000 cells well
-1. The culture medium was replaced every 48 h, and the cells were kept for 21 days in culture. The trans-epithelial electrical resistance (TEER) of the monolayers was measured daily, before and after the experiment, by using an epithelial voltohmmeter (Millicell-ERS) [
35]. Generally, TEER values greater than 1000 W for a 21-day culture are considered optimal.
2.11. Drug-transport experiment
After 21 days of Caco-2 cell growth, the medium was removed from the filter wells and the receiver plate, and they were filled with fresh Hank’s balanced salt solution (HBSS) buffer (Invitrogen). This procedure was repeated twice, and the plates were incubated at 37 °C for 30 min. After the incubation time, the HBSS buffer was removed, and drug solutions and reference compounds were added to the filter well at a concentration of 100 mm, whereas fresh HBSS was added to the receiver plate. The plates were incubated at 37 °C for 120 min. Afterward, samples were removed from the apical (filter well) and basolateral (receiver plate) side of the monolayer to measure the permeability.
The apparent permeability (P
app), in units of nm s
-1, was calculated by using the following equation:
in which VA is the volume (in mL) in the acceptor well, the area is the surface area of the membrane (0.11 cm2 of the well), time is the total transport time (7200 s), [drug]acceptor is the concentration of the drug measured by UV spectroscopy, and [drug]initial is the initial drug concentration (1x10⁻⁴) in the apical or basolateral wells.
Author Contributions
Conceptualization, A.S., M.G.P., C.G.F.; methodology, M.M., F.R. A.C., R.S., O.M.B, D.A., P.S., G.A, M.C. G.C., S.R., F.M.P; validation, M.M., P.L.P. C.G.F., M.G.P., A.S; investigation, M.M., M.G.P. A.S.; data curation, M.M., M.G.P., V.Z., S.F., E.C. A.S. All authors contributed to write the manuscript and have read and approved to the published version of the manuscript. All named authors meet the international criteria for authorship for this article, take responsibility for the integrity of the work, contribute to write this manuscript and have given their approval for this version to be published.
Figure 2.
(a) Chemical structure of ONC201 and horizontal view of the complex between ONC201 and hClpP (Adapted from PDB ID: 6DL7); (b) Structure of the ClpXP complex.
Figure 2.
(a) Chemical structure of ONC201 and horizontal view of the complex between ONC201 and hClpP (Adapted from PDB ID: 6DL7); (b) Structure of the ClpXP complex.
Figure 3.
Chemical structure of hClpP inhibitors and inducers.
Figure 3.
Chemical structure of hClpP inhibitors and inducers.
Figure 4.
Western blot analysis of Ni-NTA eluted fractions. (a) Fractions eluted at 50 mM and 300 mM imidazole buffer were resolved on a 4-12% denaturing polyacrylamide gel (Bio-Rad Criterion XT Bis-Tris) in MOPS 1X buffer and blotted onto PVDF membrane for western blotting. 5-µl sample of each fraction was loaded. Marker (M): PageRuler Prestained Protein Ladder (Thermo). hClpP specific bands were visualized by immunoreaction with polyclonal antiserum against hClpP (1:20000, Abcam, ab124822); (b) Native PAGE/Western blotting of fraction n° 8 from the IMAC chromatography. 5 µl sample were separated on a 4-15% protein gel (Bio-Rad Mini-PROTEAN TGX) in TGX 1X buffer. The positions and molecular masses of co-electrophoresed marker proteins are shown on the left (Precision Plus Dual Color Marker, Bio-Rad).
Figure 5.
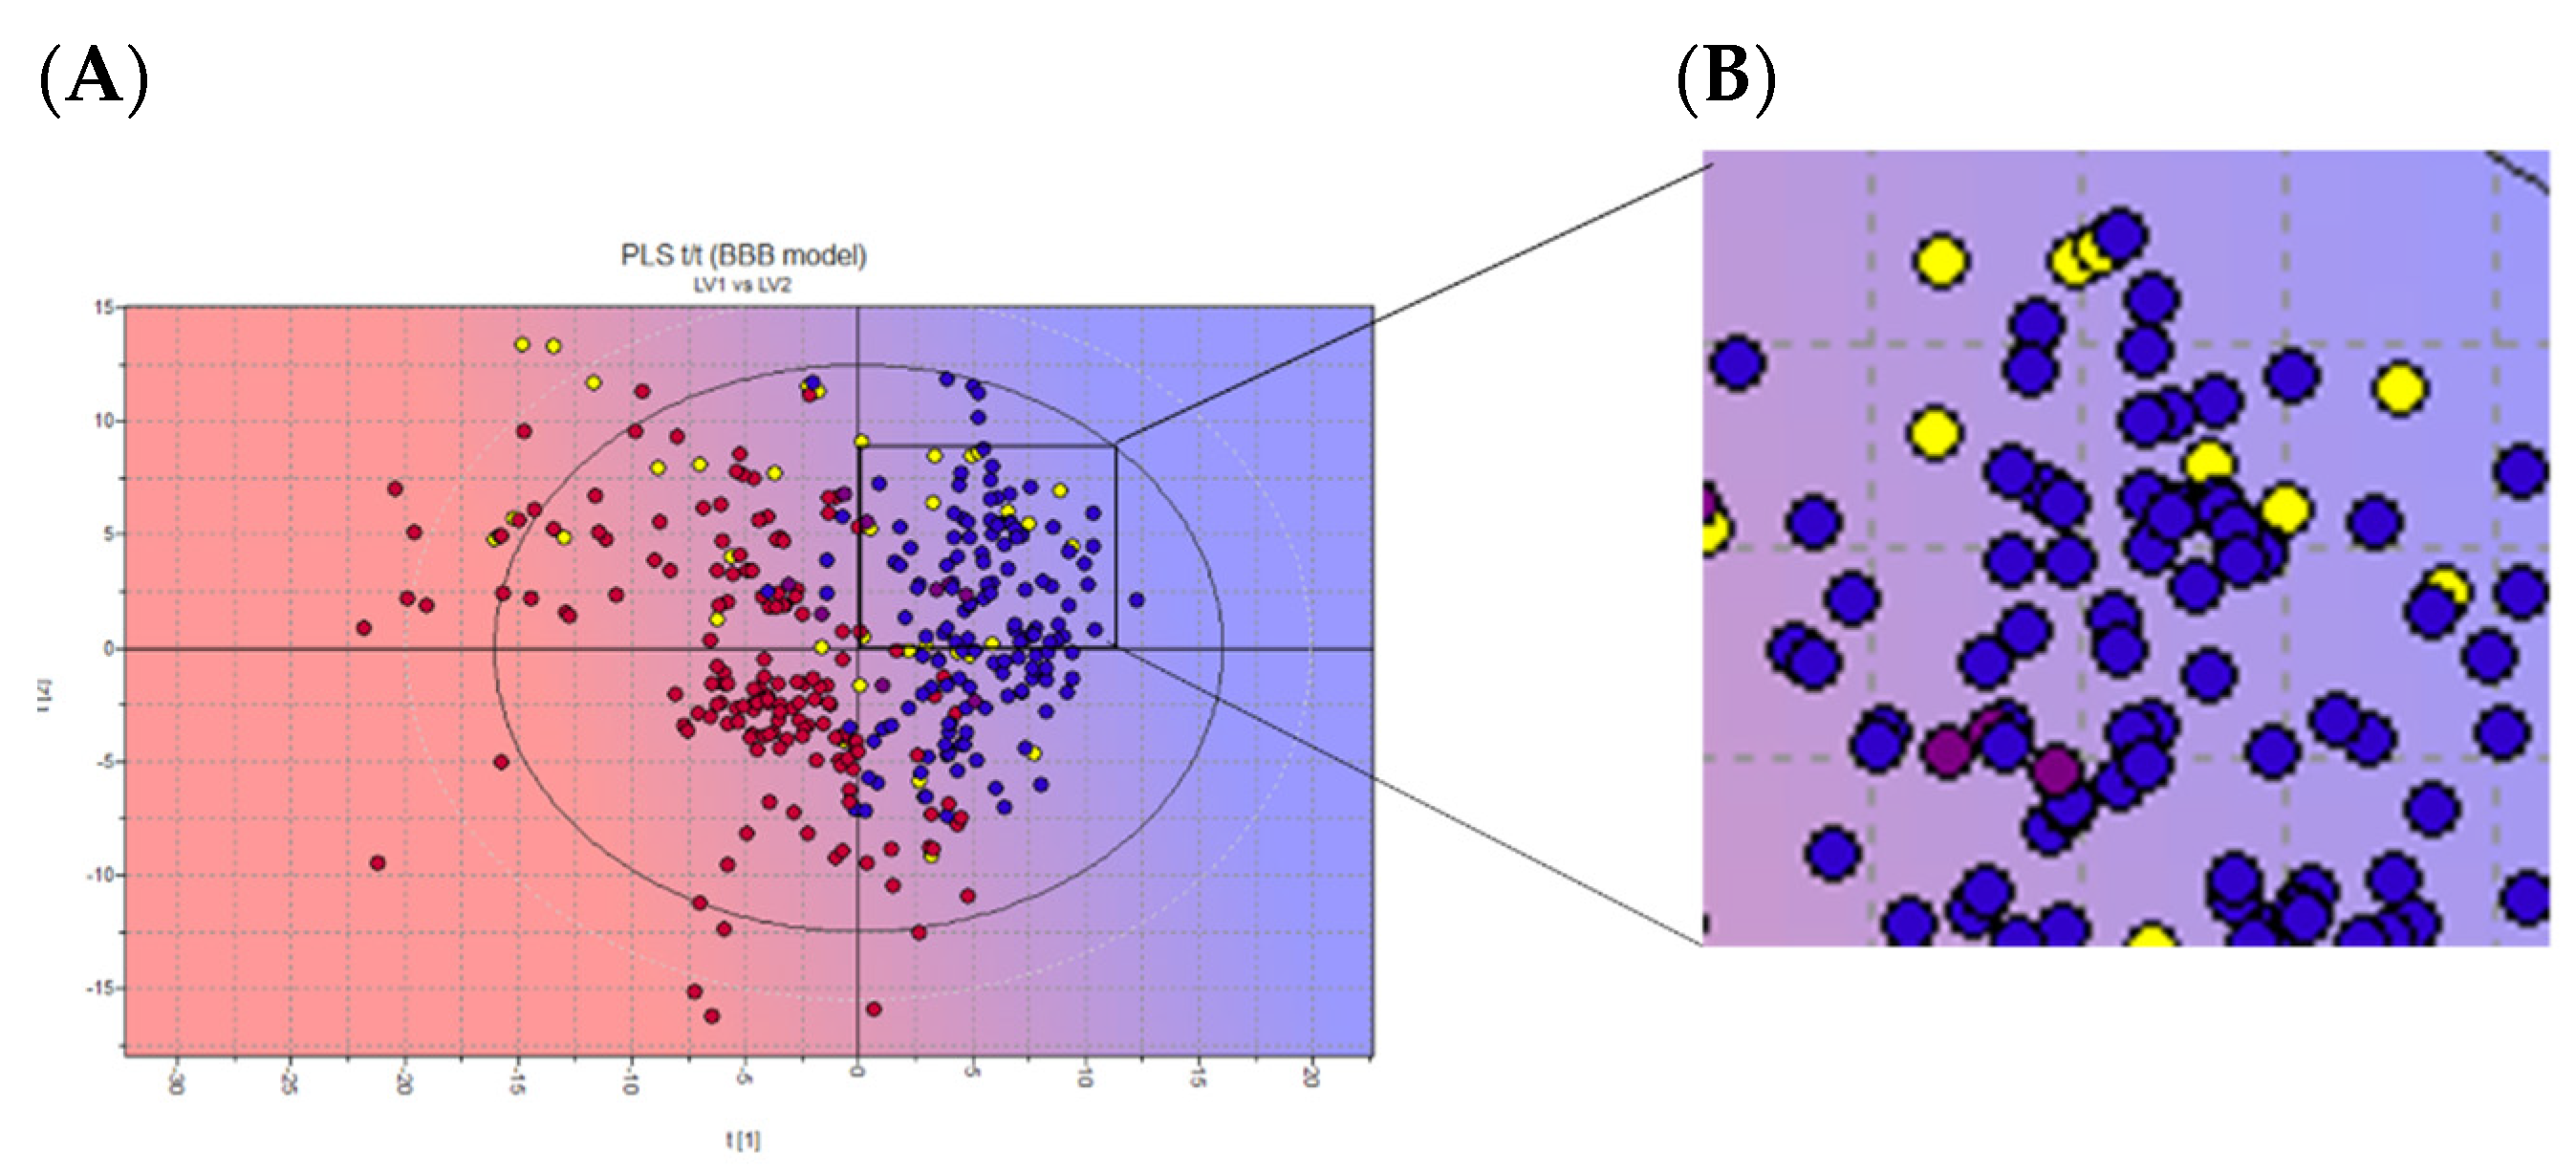
(a) 2D scores plot of the PLS activity model of BBB crossing. (b) Zoom on chosen NPs. Projected compounds are colored according to their BBB permeability: red for low BBB permeability and blue for high; yellow dots: NPs database. Representative image of the INDOFINE Chemical Company library only.
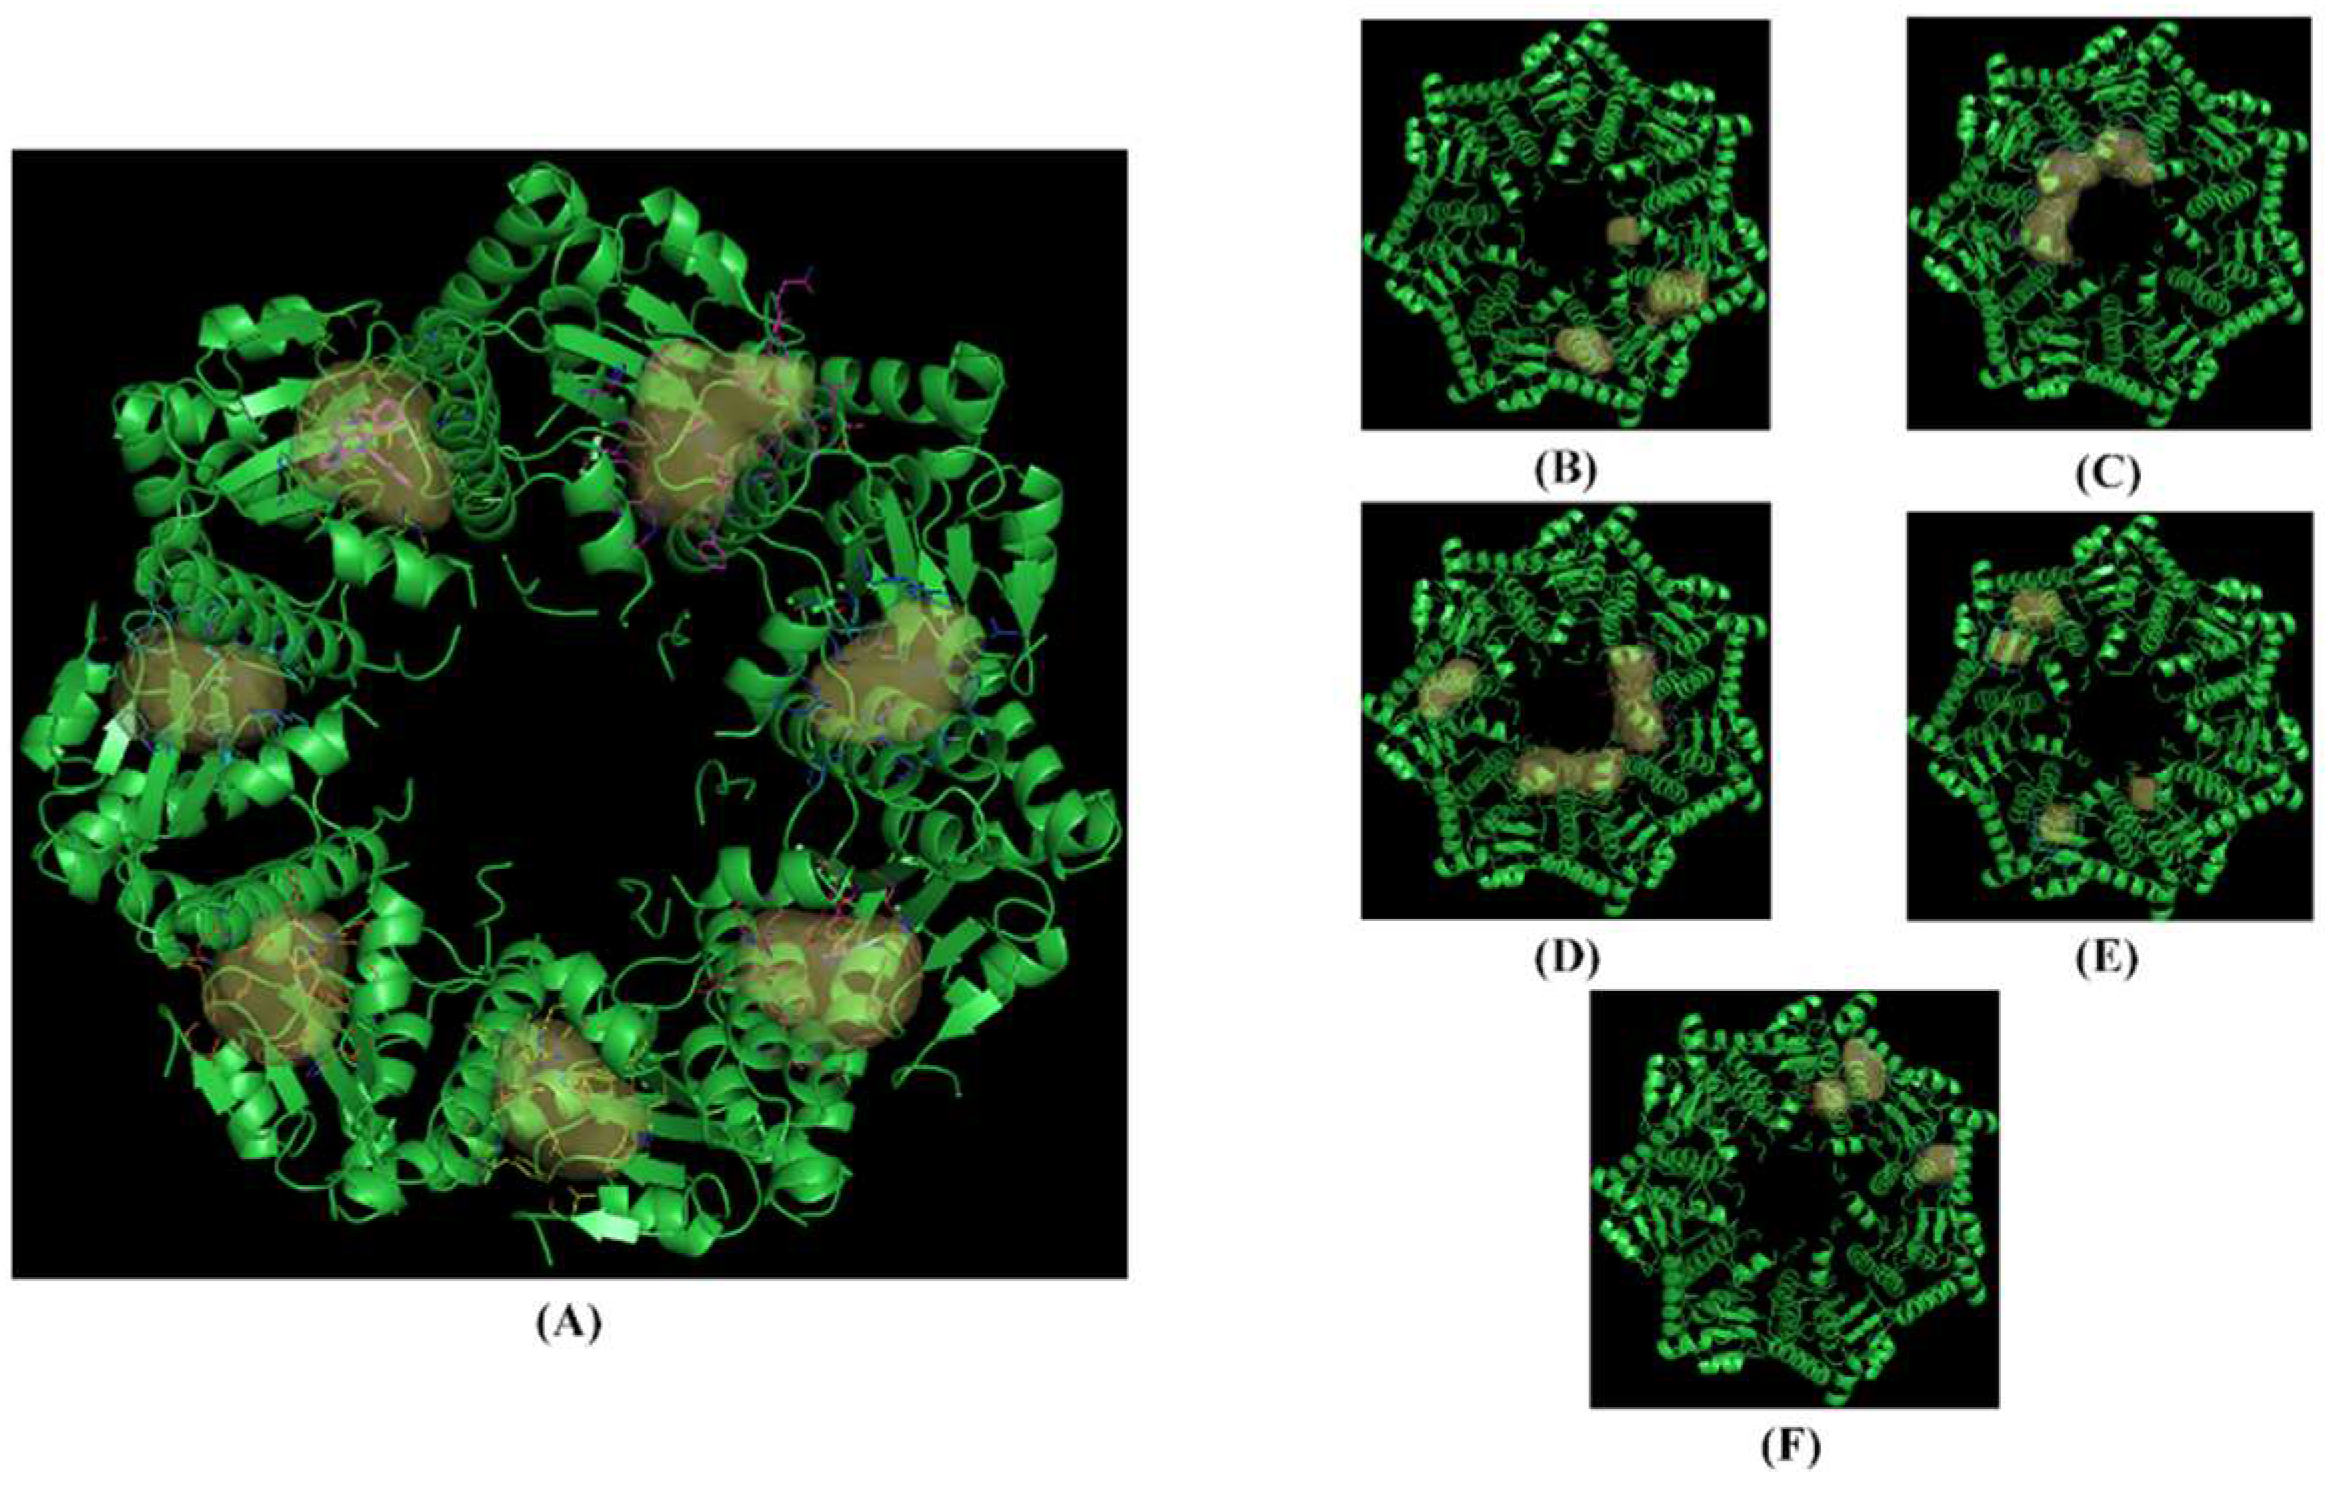
Figure 6.
The crystallized structure and pockets of hClpP: ONC201 complex. (a) Front view, pockets 1 to 7; (b) back view, pockets 8 to 10; (c) back view, pocket 11; (d) back view, pockets 12 to 14; (e) back view, pockets 15 to 18; (f) back view, pockets 19 to 21.
Figure 6.
The crystallized structure and pockets of hClpP: ONC201 complex. (a) Front view, pockets 1 to 7; (b) back view, pockets 8 to 10; (c) back view, pocket 11; (d) back view, pockets 12 to 14; (e) back view, pockets 15 to 18; (f) back view, pockets 19 to 21.
Figure 7.
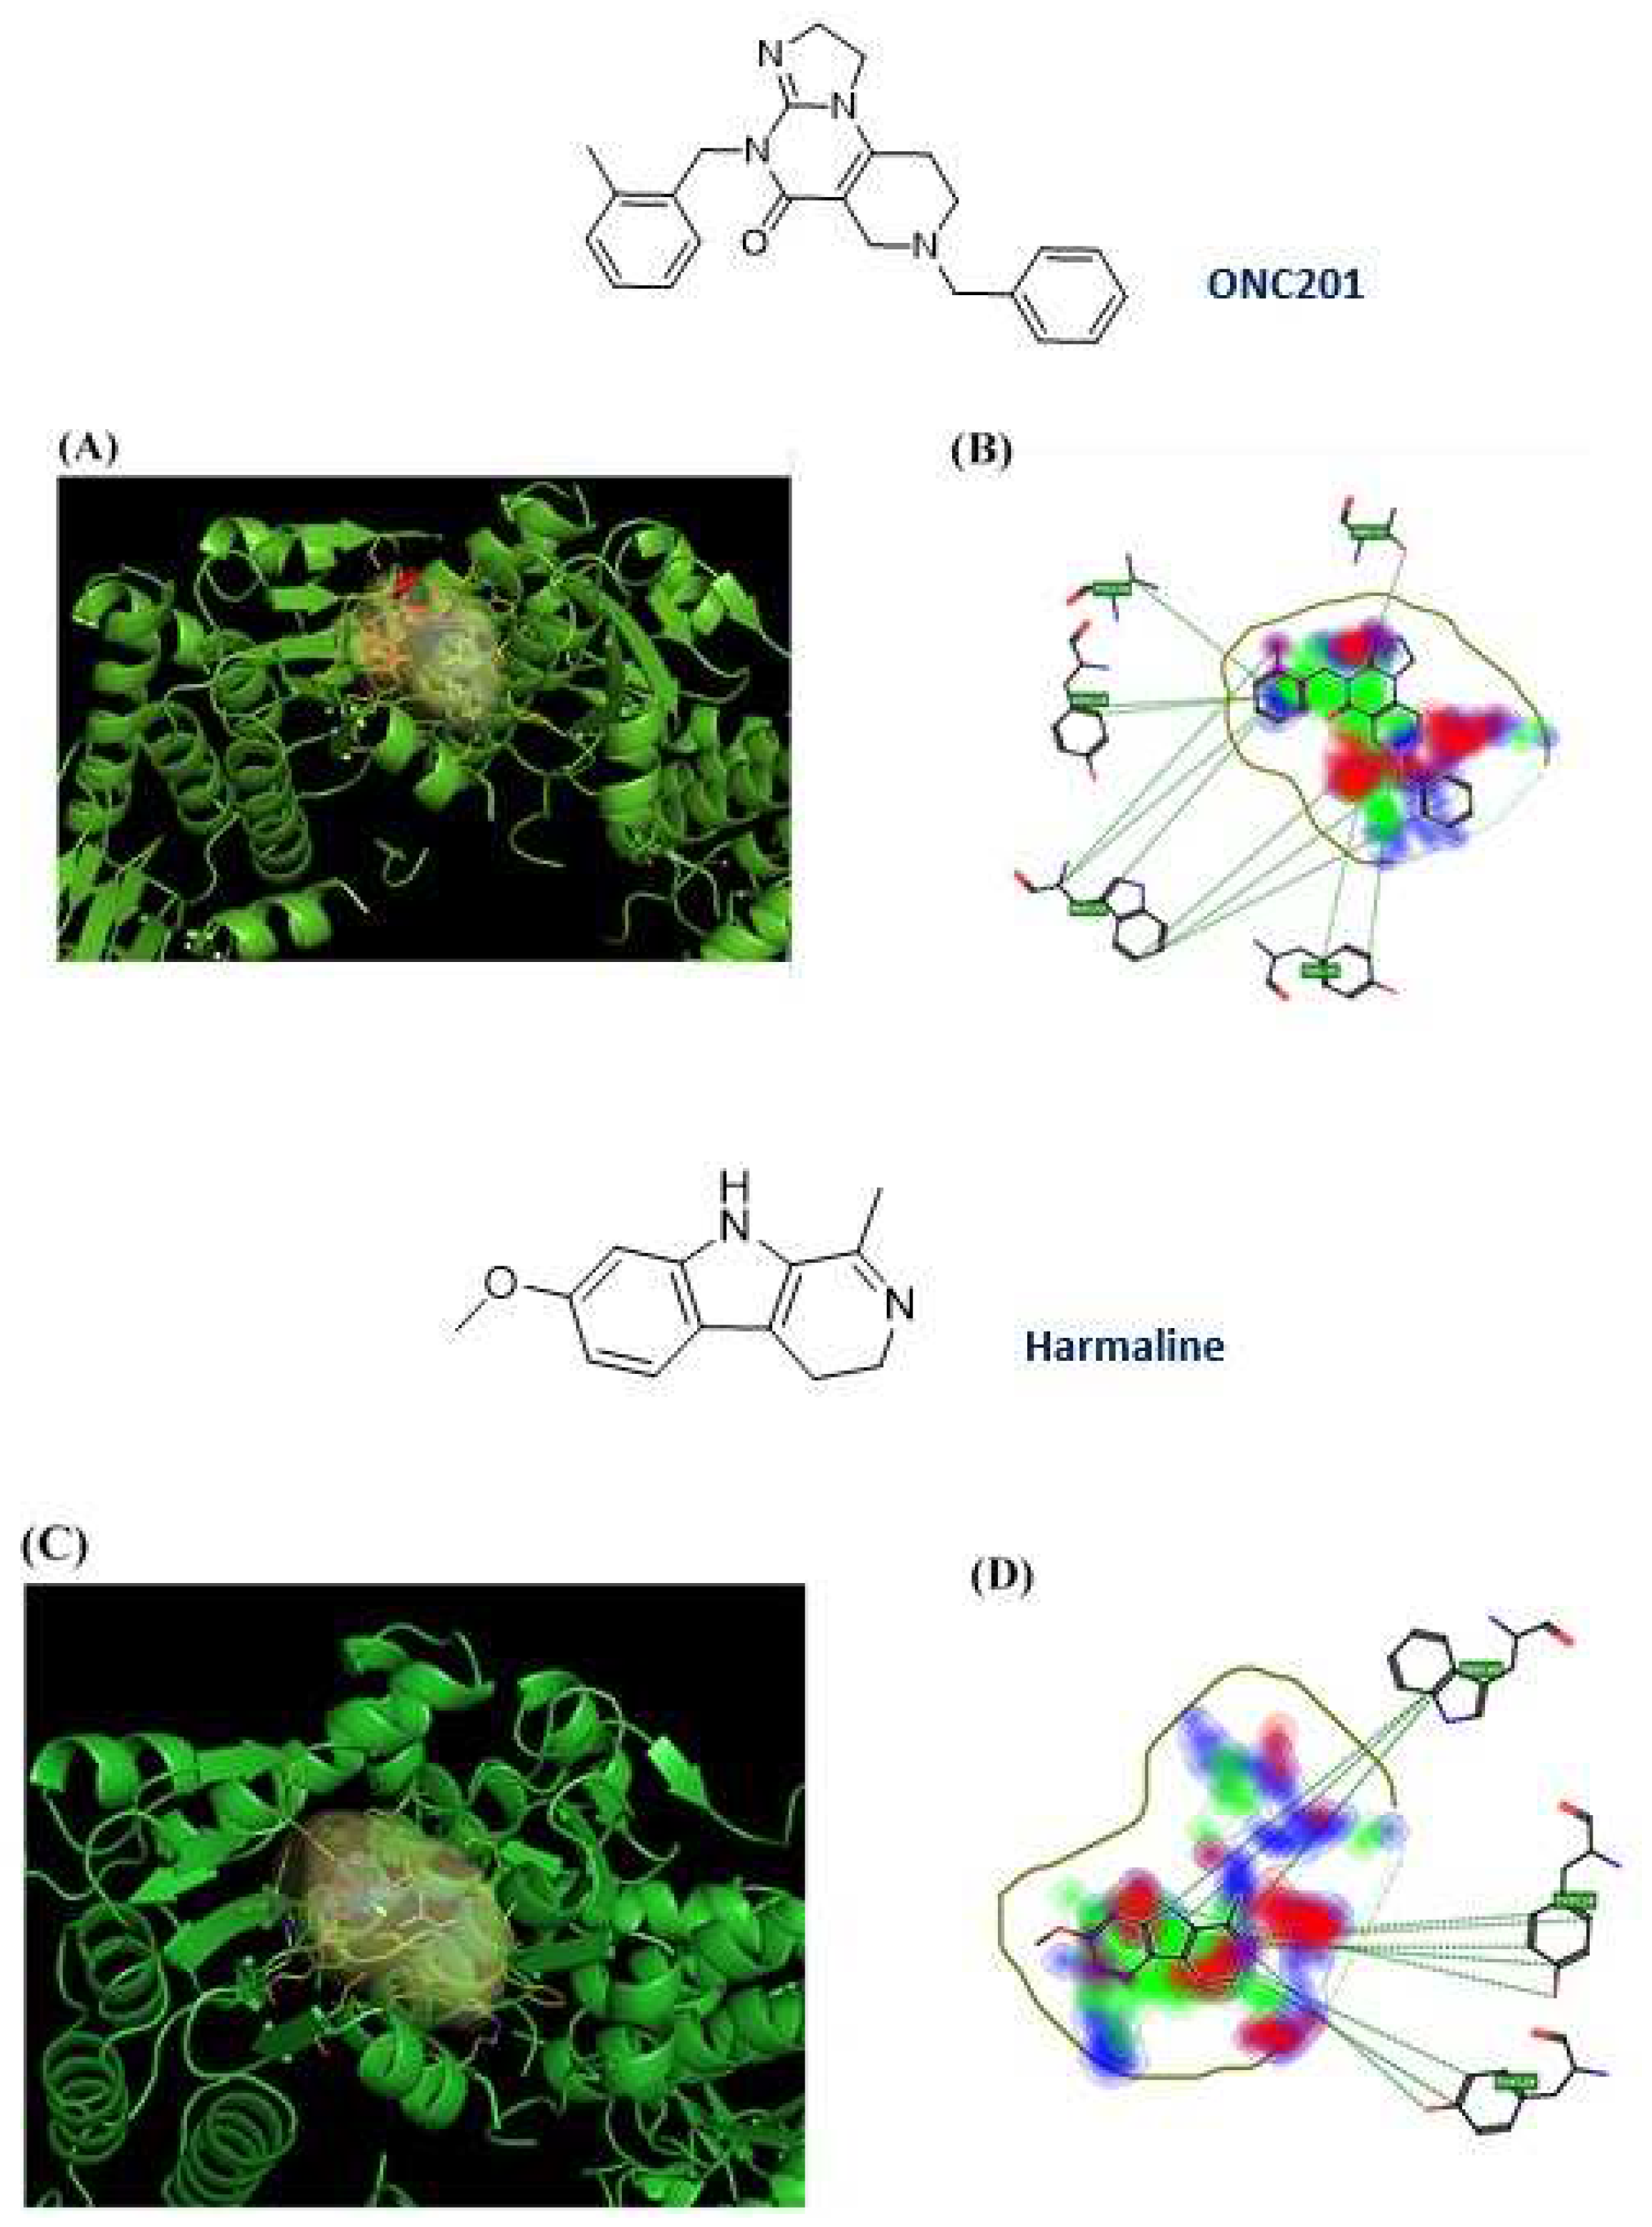
ONC201 and harmaline chemical structure and their 3D and 2D binding poses; (a) 3D binding poses for ONC201; (b) 2D binding pose for ONC201; (c) 3D binding poses for harmaline; (d) 2D binding poses for harmaline.
Figure 7.
ONC201 and harmaline chemical structure and their 3D and 2D binding poses; (a) 3D binding poses for ONC201; (b) 2D binding pose for ONC201; (c) 3D binding poses for harmaline; (d) 2D binding poses for harmaline.
Figure 8.
Pose of the two ligands in the pocket of hClpP. Water and hydrogen were omitted for clarity. (a): Pose of Harmaline (orange) in the pocket of hClpP. The frame was captured at 8.2 ns. (b): Pose of ONC201 (magenta) in the pocket of hClpP. The frame was captured at 6.5 ns.
Figure 8.
Pose of the two ligands in the pocket of hClpP. Water and hydrogen were omitted for clarity. (a): Pose of Harmaline (orange) in the pocket of hClpP. The frame was captured at 8.2 ns. (b): Pose of ONC201 (magenta) in the pocket of hClpP. The frame was captured at 6.5 ns.
Figure 9.
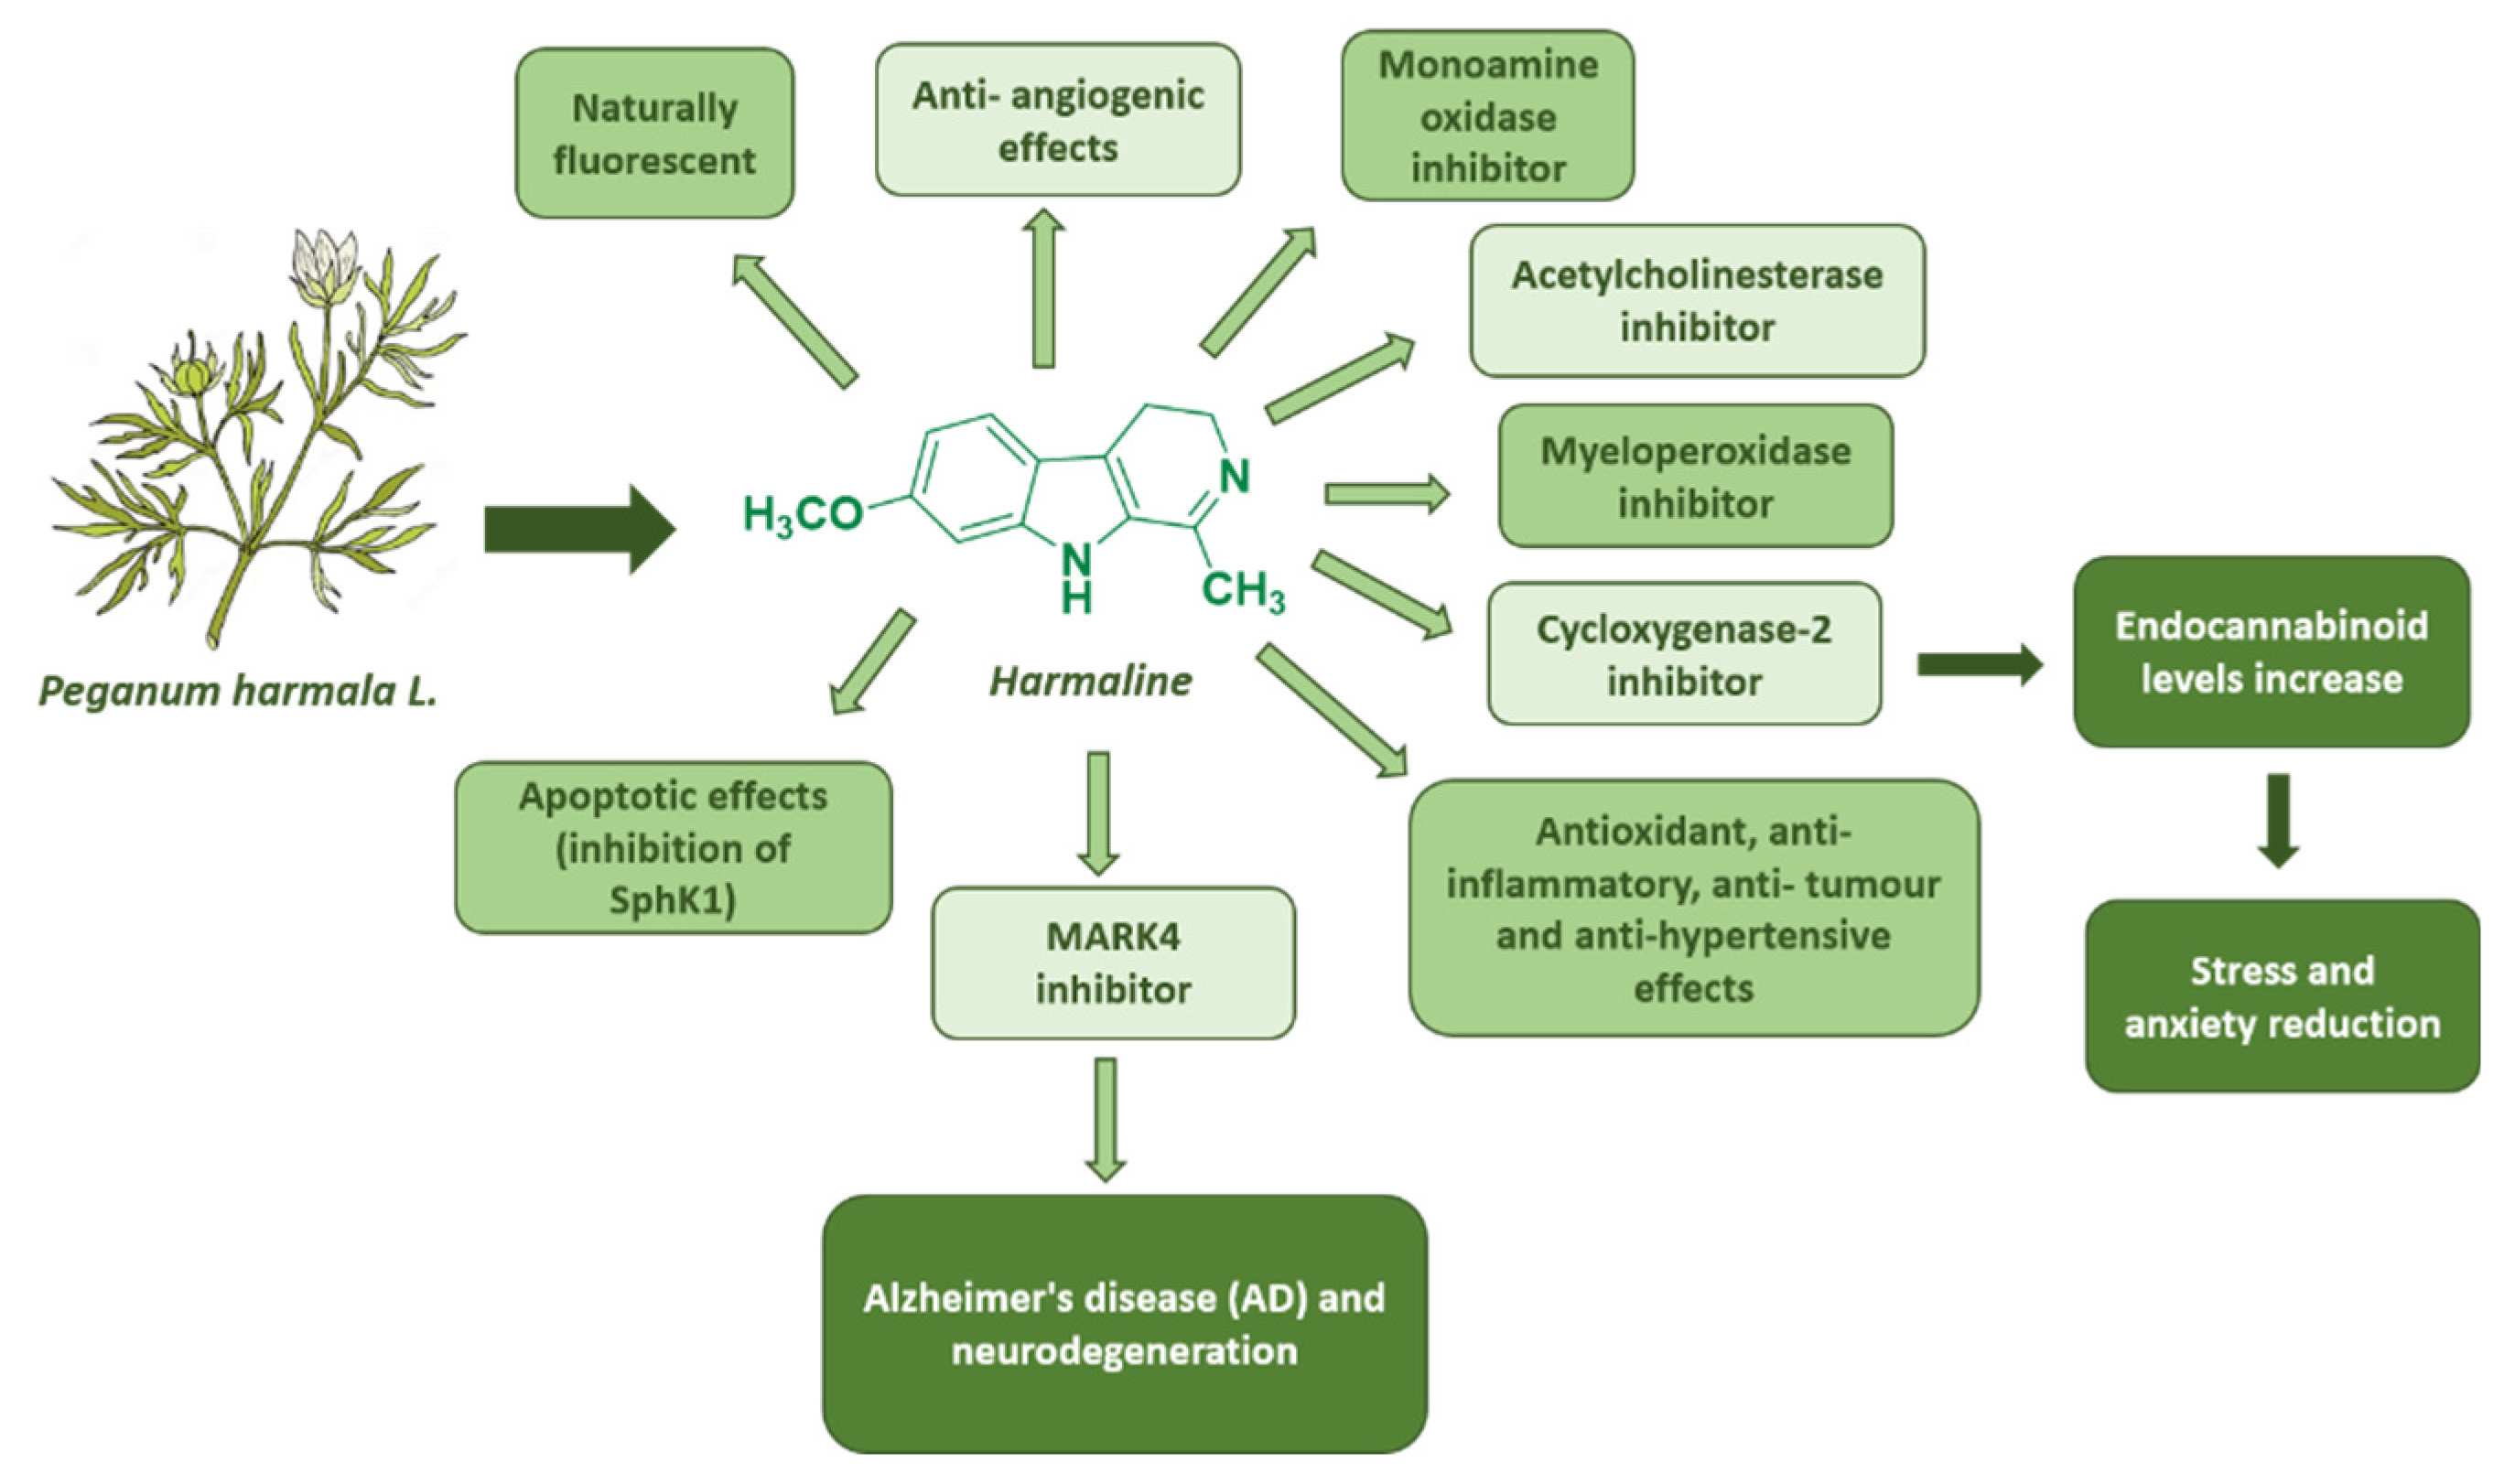
Summary of harmaline biological effects.
Figure 9.
Summary of harmaline biological effects.
Figure 10.
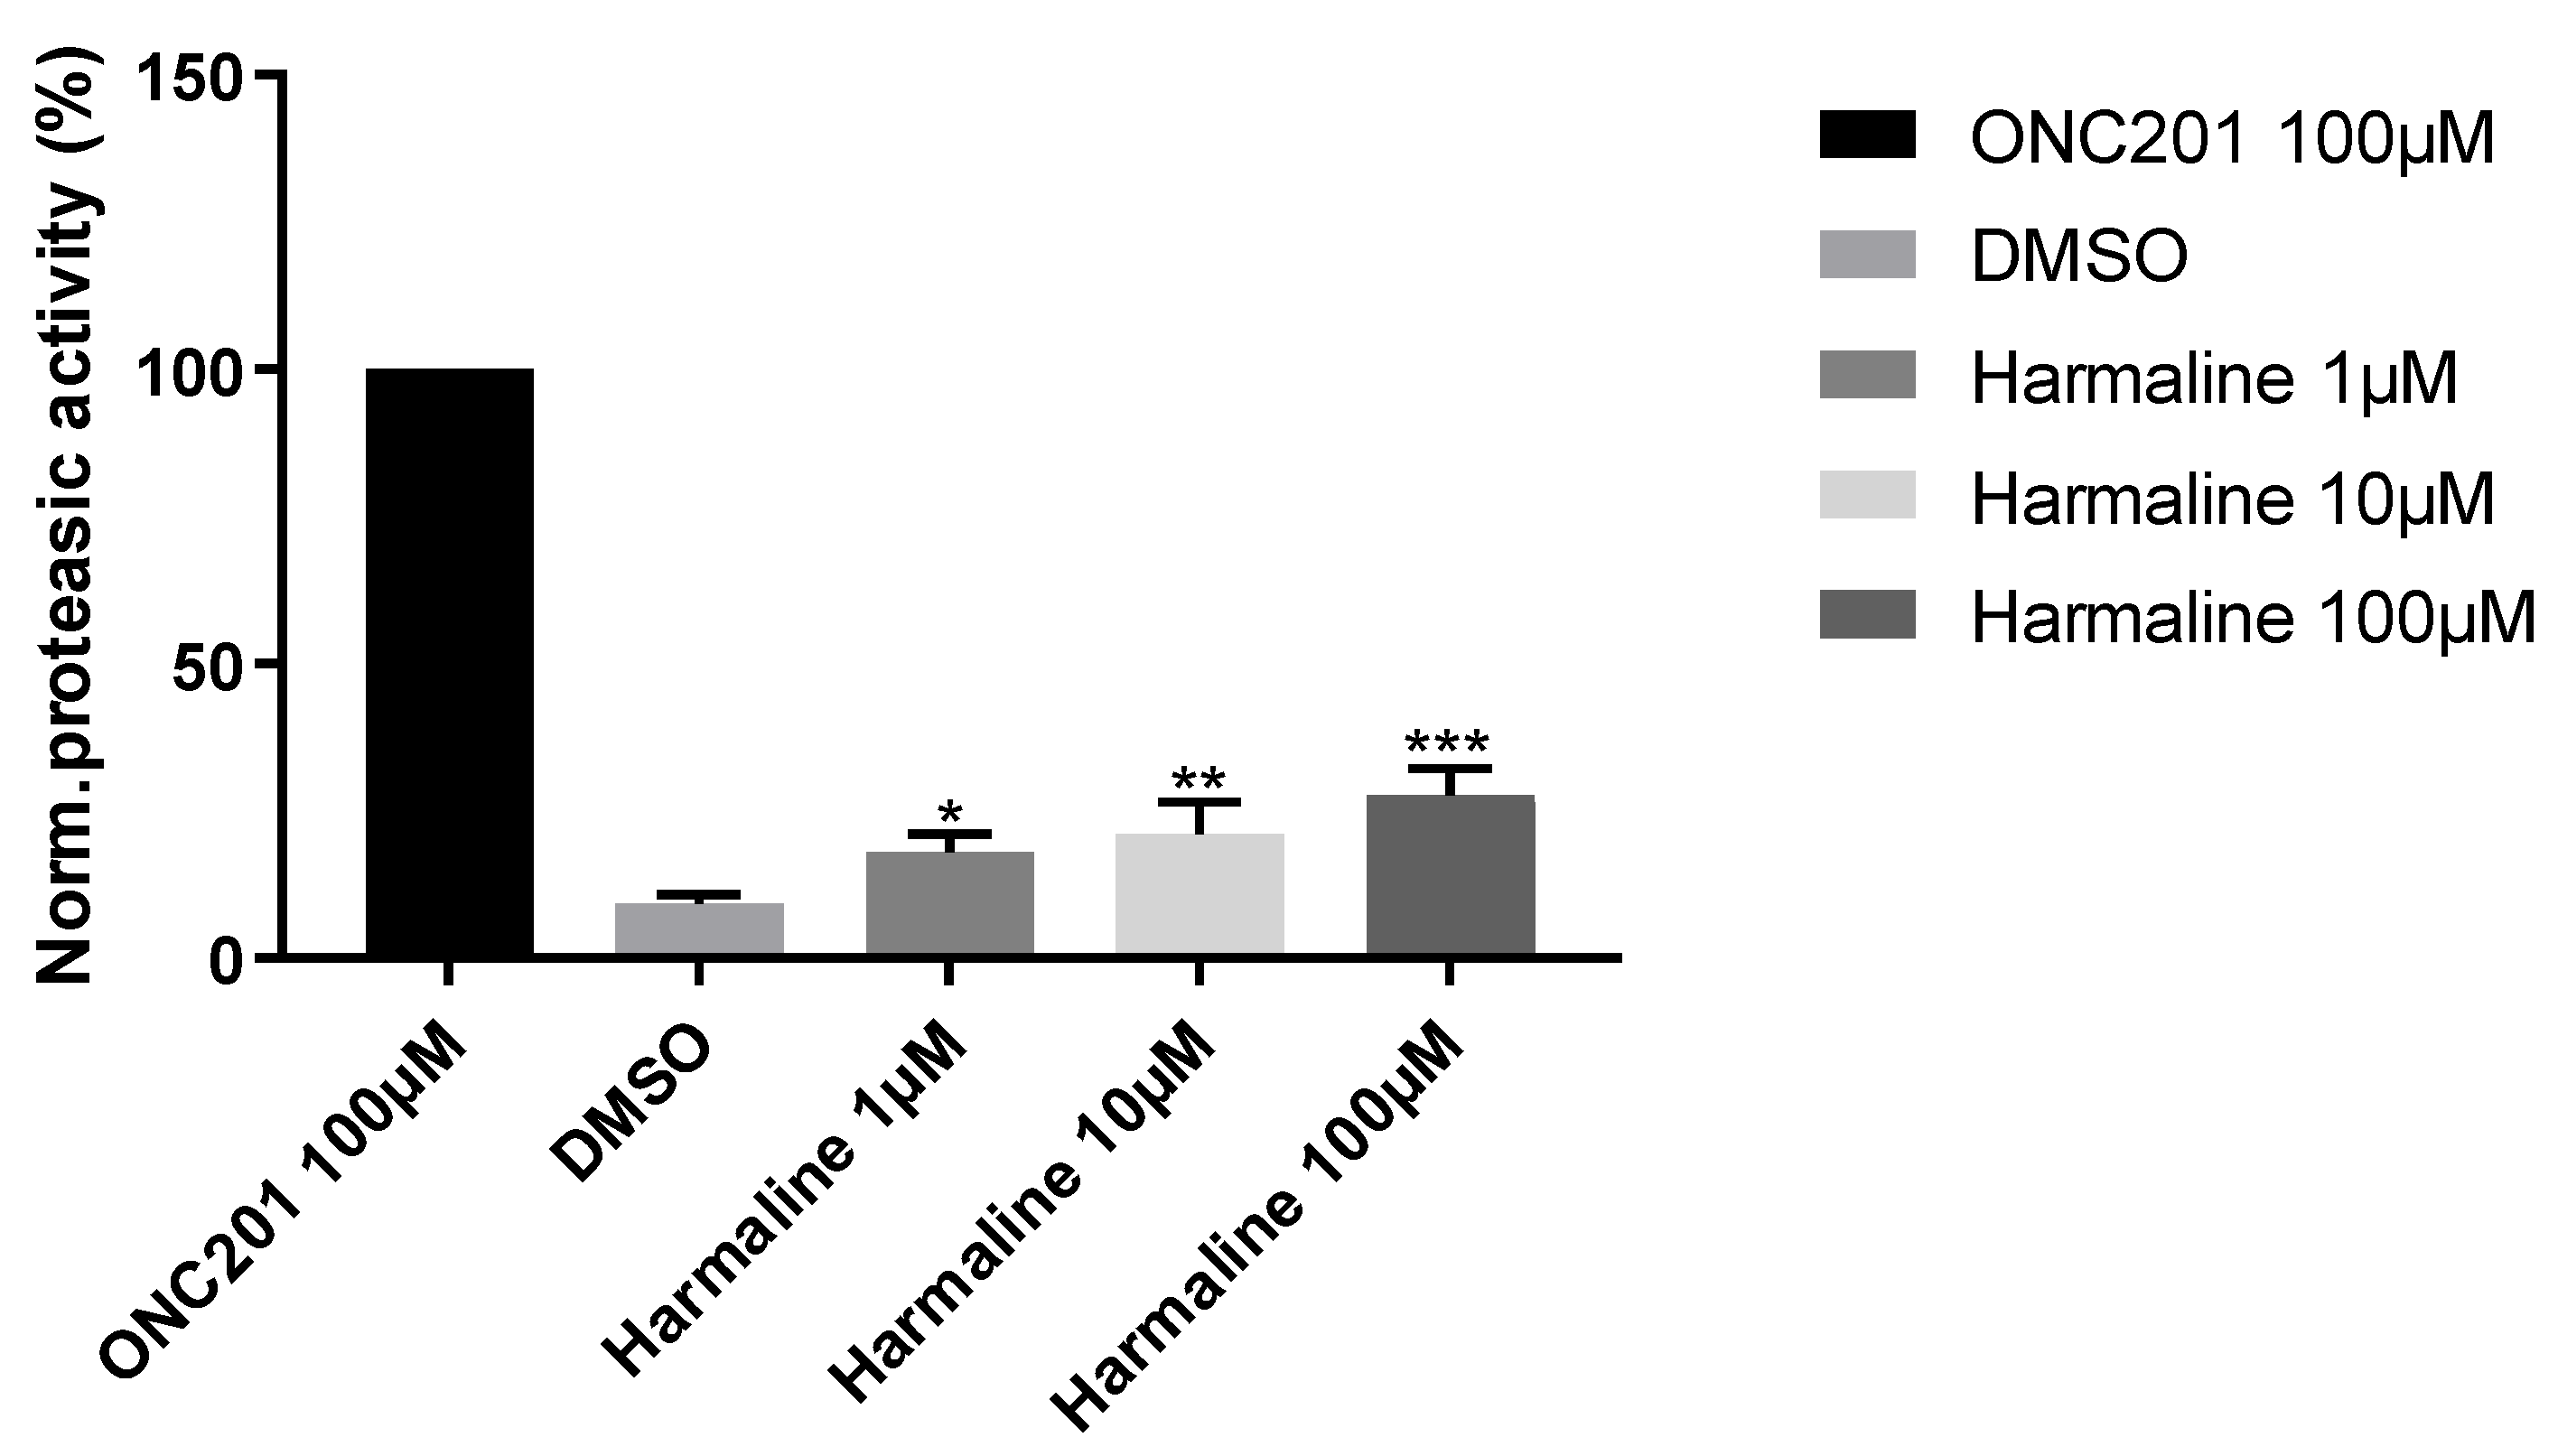
hClpP induction by harmaline at different concentrations normalized to 100 µM ONC201 activity. DMSO was used as a control. Each bar represents the mean ± SEM of three experiments performed in triplicate. One-Way ANOVA vs. DMSO was applied and for * = p < 0.05; ** = p < 0.01; *** = p < 0.0005.
Figure 11.
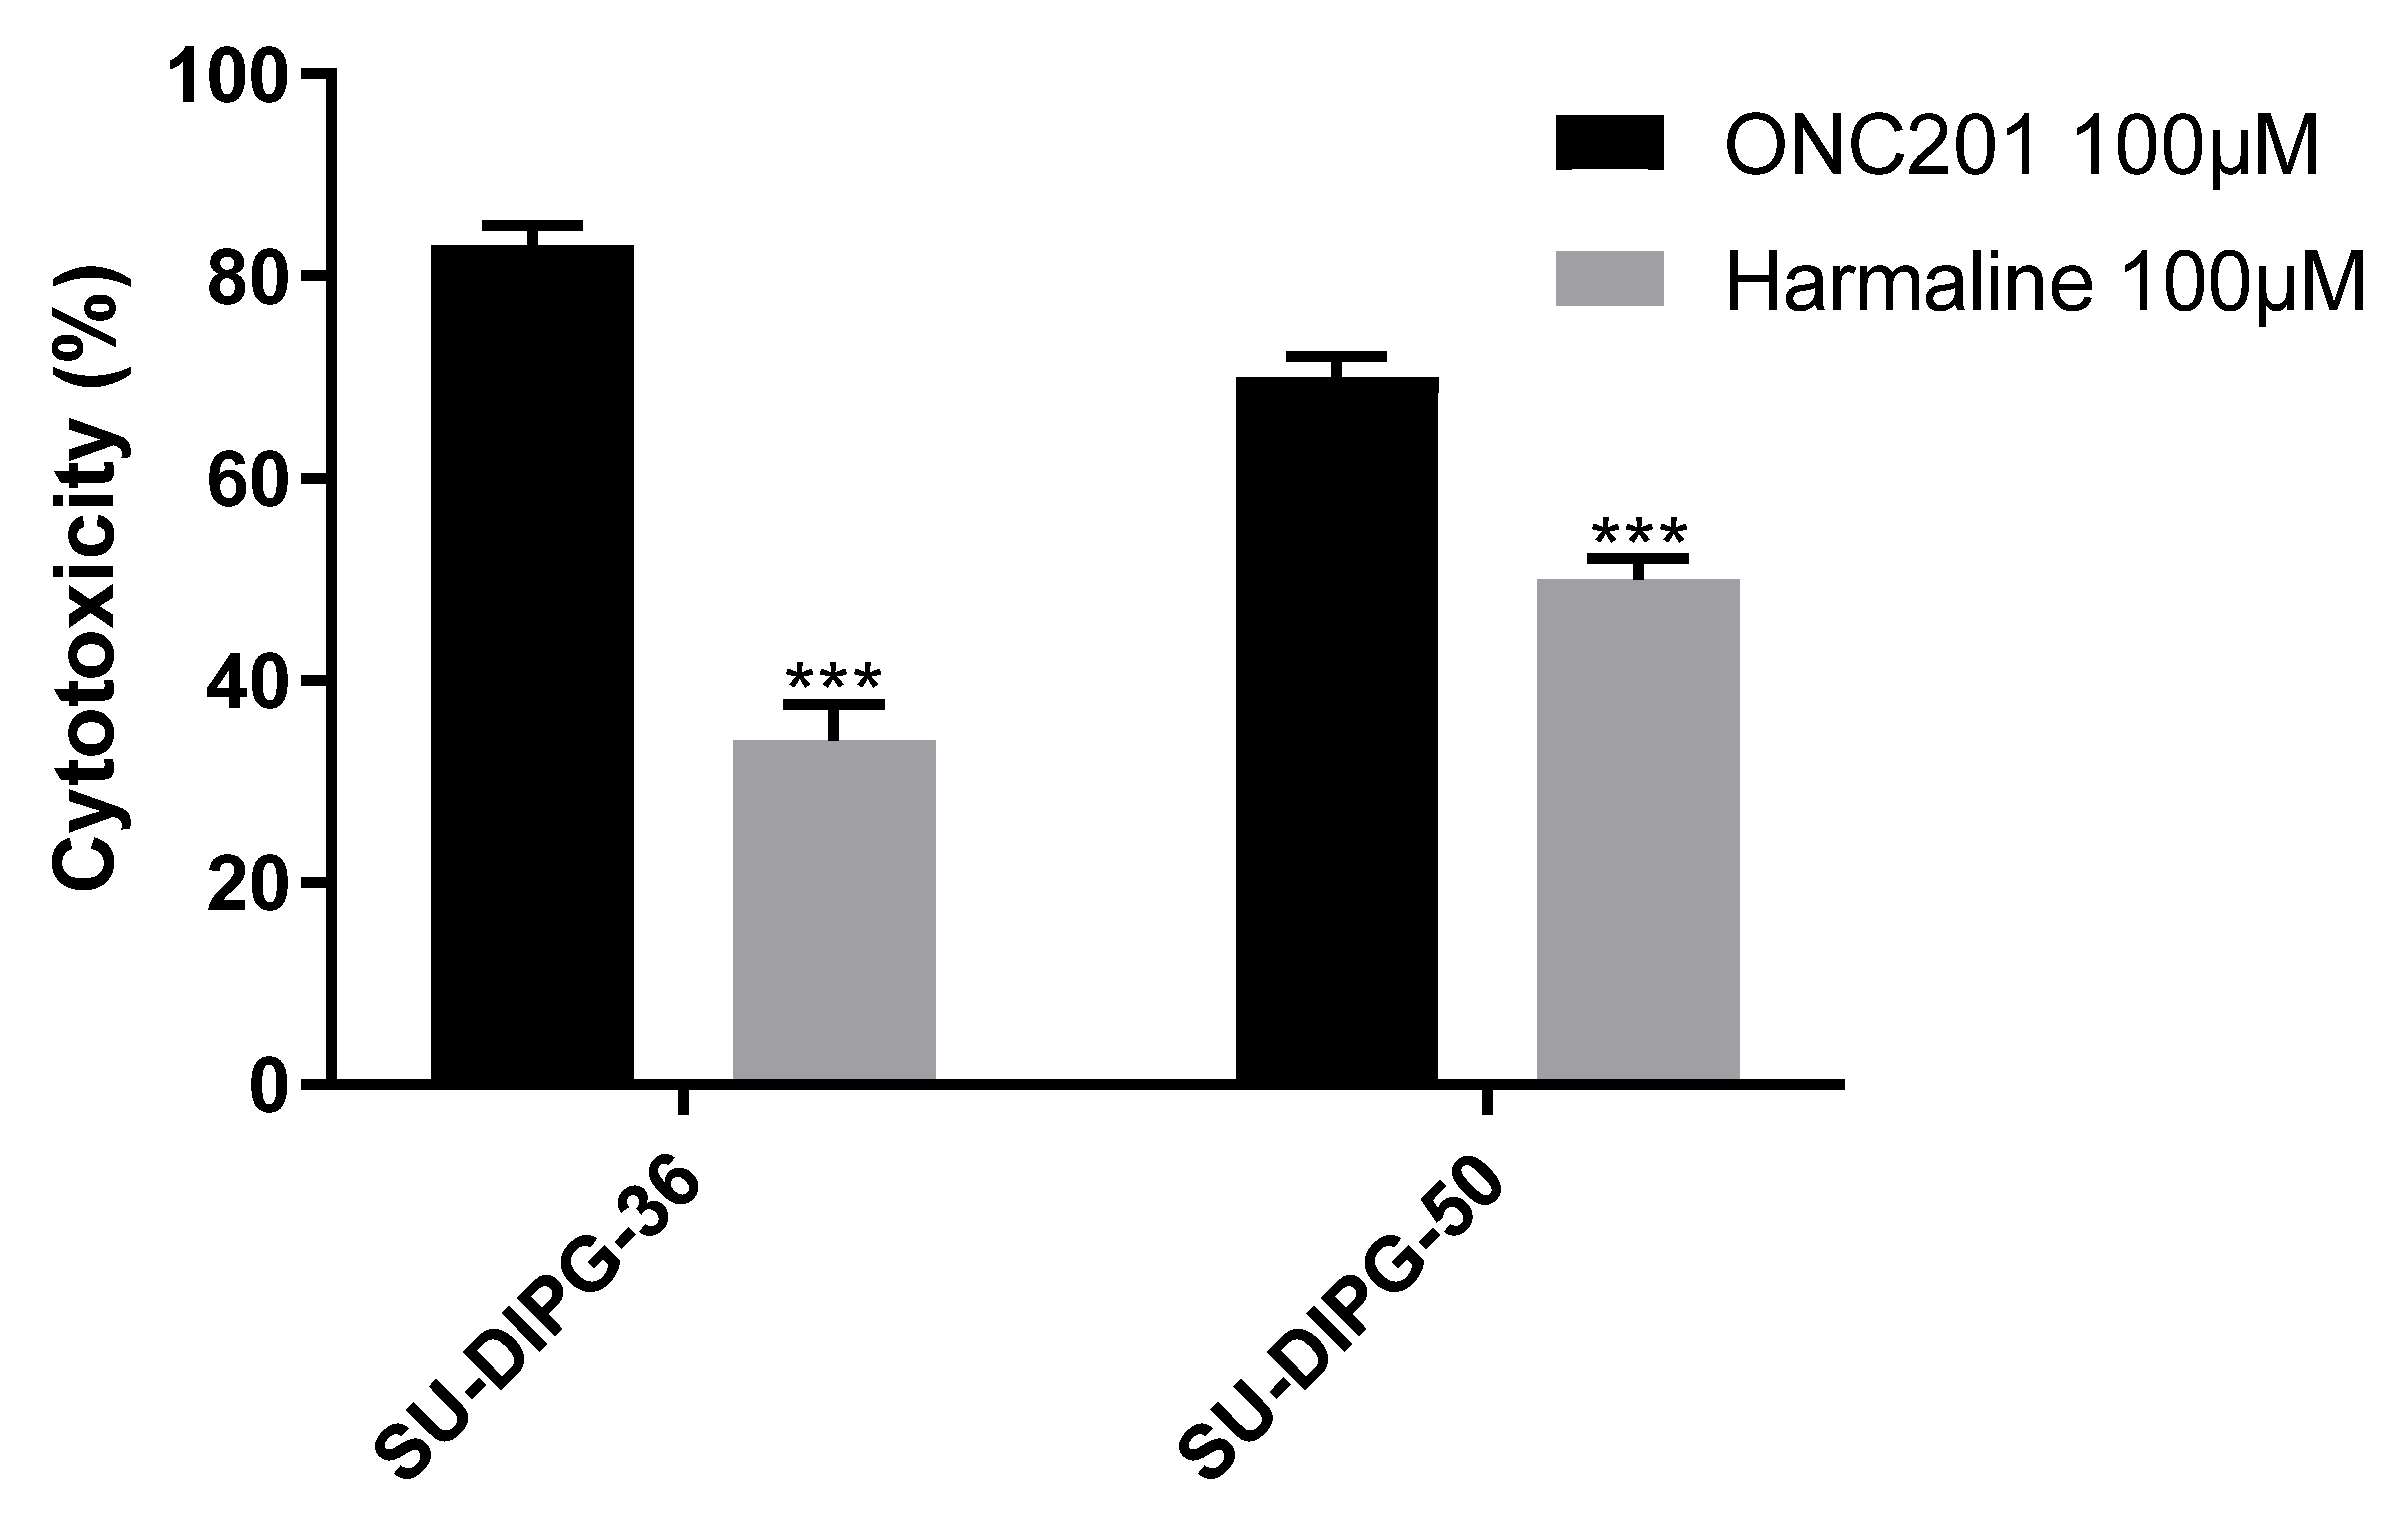
Cytotoxicity of 100 µM ONC201 and 100 µM harmaline on SU-DIPG-36 and SU-DIPG-50. Each bar represents the mean ± SEM of three experiments performed in triplicate. Two-Way ANOVA was applied, SU-DIPG-36: ONC201 vs. Harmaline p = 0.001, SU-DIPG-50: ONC201 vs. Harmaline p = 0.001.
Figure 11.
Cytotoxicity of 100 µM ONC201 and 100 µM harmaline on SU-DIPG-36 and SU-DIPG-50. Each bar represents the mean ± SEM of three experiments performed in triplicate. Two-Way ANOVA was applied, SU-DIPG-36: ONC201 vs. Harmaline p = 0.001, SU-DIPG-50: ONC201 vs. Harmaline p = 0.001.
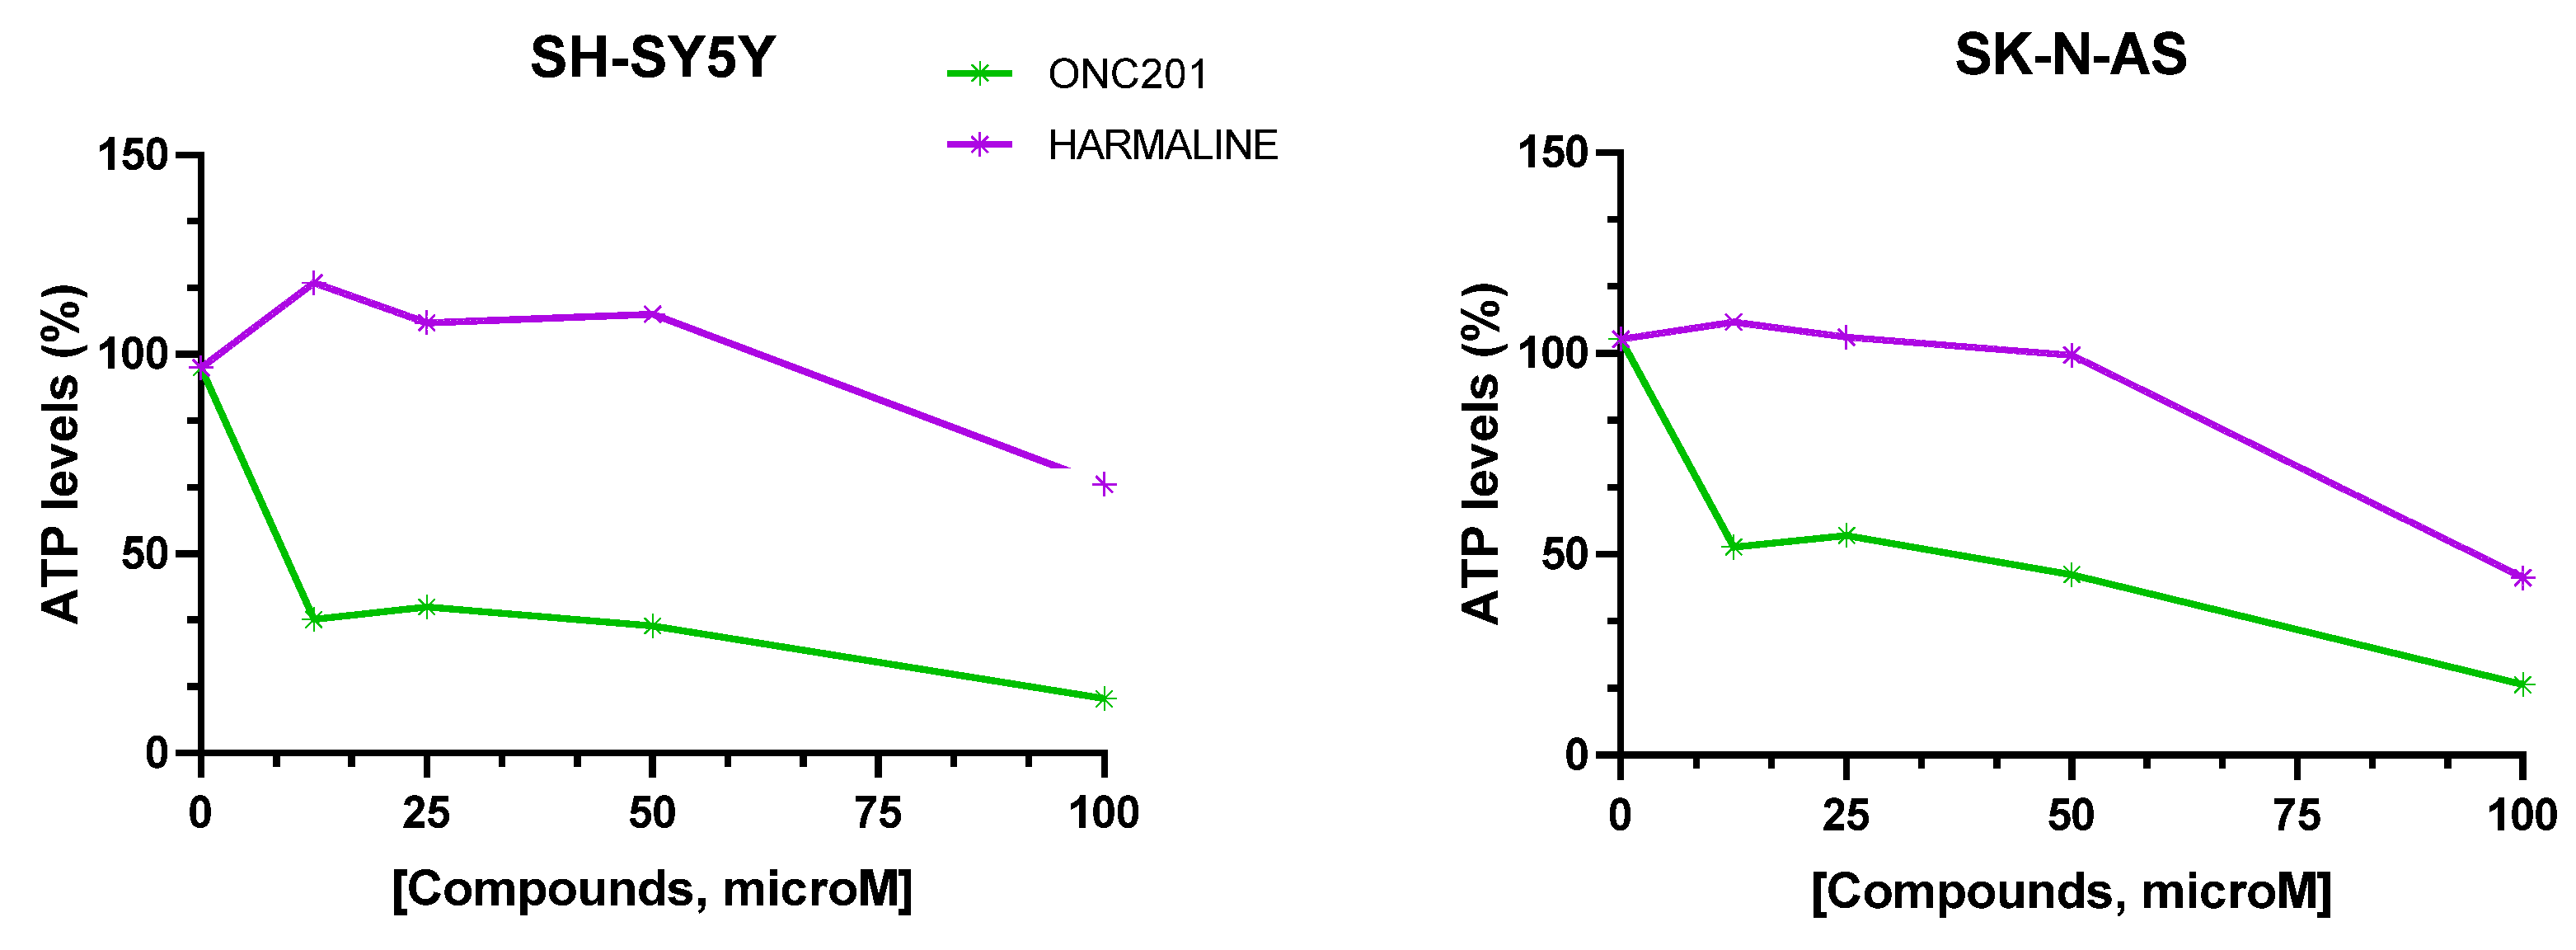
Figure 12.
Percentage (%) ATP levels in SH-SY-5Y and SK-N-AS spheroids after 72 hours of drug exposure. Data are expressed as mean ± SEM of two independent experiments (n = 2).
Figure 12.
Percentage (%) ATP levels in SH-SY-5Y and SK-N-AS spheroids after 72 hours of drug exposure. Data are expressed as mean ± SEM of two independent experiments (n = 2).
Table 1.
hClpP amino acid sequence.
Table 1.
hClpP amino acid sequence.
| MPLIPIVVEQTGRGERAYDIYSRLLRERIVCVMGPIDDSVASLVIAQLLFLQSESNKKPIHMYINSPGGVVTAGLAIYDTMQYILNPICTWCVGQAASMGSLLLAAGTPGMRHSLPNSRIMIHQPSGGARGQATDIAIQAEEIMKLKKQLYNIYAKHTKQSLQVIESAMERDRYMSPMEAQEFGILDKVLVHPPQDGEDEPTLVQKEPVEAAPAAEPVPASTENLYFQGKLGKPIPNPLLGLDSTRTGHHHHHH
|
| TEV sequence |
ENLYFQG |
| V5 epitope |
GKPIPNPLLGLDST |
| His Tag |
HHHHHH |
Table 2.
Binding free energies of ONC201 and Harmaline with hClpP calculated by Bennet, TI and FEP methods and relative consensus average.
Table 2.
Binding free energies of ONC201 and Harmaline with hClpP calculated by Bennet, TI and FEP methods and relative consensus average.
| Ligand |
Bennet(kcal/mol)
|
FEP (kcal/mol)
|
TI (kcal/mol)
|
Consensus (kcal/mol)
|
| Harmaline |
-28.13 |
-28.08 |
-27.49 |
-27.91 ± 1.87 |
| ONC201 |
-34.08 |
-32.51 |
-32.44 |
-33.27 ± 1.64 |
Table 3.
ONC201 and harmaline (100 µM) mitochondrial toxicity in SH-SY-5Y and SK-N-AS spheroids performed by ATP assay after 72h of exposure to drugs. Data are expressed as mean ± SEM of three independent experiments (n = 3).
Table 3.
ONC201 and harmaline (100 µM) mitochondrial toxicity in SH-SY-5Y and SK-N-AS spheroids performed by ATP assay after 72h of exposure to drugs. Data are expressed as mean ± SEM of three independent experiments (n = 3).
| Drugs |
SH-SY-5Y cell viability (%) |
SK-N-AS cell viability (%) |
| ONC201 |
13.67 ± 6.23 |
17.5 ± 6.80 |
| Harmaline |
67.48 ± 13.91 |
44.24 ± 24.25 |
Table 4.
Tested compounds efflux pumps activity and Apparent Permeability (Papp) values. Data are expressed as mean of three independent experiments, NT = Not Tested.
Table 4.
Tested compounds efflux pumps activity and Apparent Permeability (Papp) values. Data are expressed as mean of three independent experiments, NT = Not Tested.
| Drugs |
P-gp
EC50, µM |
ATP |
PappBA
(nm/sec) |
PappAB
(nm/sec) |
BCRP
EC50, µM |
| ONC201 |
13.4 |
NO |
2157 |
356 |
>100 |
| Harmaline |
>100 |
NT |
2539 |
496 |
14.9 |
