
Submitted:
21 December 2023
Posted:
22 December 2023
You are already at the latest version
Abstract
In this study, we report a novel synthesis of hydrophobic silica aerogel powder composites, functionalized and binary-doped with [Tb(phen)₂](NO₃)₃ and [Eu(phen)₂](NO₃)₃ nanocrystals, employing a two-step sol-gel methodology. The investigation delves into the structural elucidation, optical properties and thermal conductivity of these functionalized Tb(III)-Eu(III) composites. Our analysis encompasses diffuse reflectance spectra, along with excitation and luminescence spectra, highlighting the quantum yields of composites with varying chemical composition. Remarkably, these samples exhibit a strong luminescence, with distinct hues of red or green color upon the specific doping type and level. The detailed examination of excitation spectra and quantum yields unequivocally establishes robust energy transfer mechanisms from the 1,10-phenanthroline molecule to the lanthanide ions. Notably, our study uncovers a Tb³⁺→Eu³⁺ energy transfer phenomenon within the binary functionalized samples, providing compelling evidence for a structural formation process occurring within the mesoporous framework of the aerogel powders.
Keywords:
luminescence
; aerogel powders
; europium
; terbium
; energy transfer
1. Introduction
Optical composite materials based on aerogels, doped with functional nanocrystallites are increasingly important in LED technologies, microelectronics and sensorics. Due to their high specific surface and porosity, silica aеrogel matrices have the possibility of incorporating in them hybrid molecules, d- and f-ions with desired electrical and optical properties [1]. This is the reason for an increasing number of papers dealing with the preparation and characterization of functional aerogel composites and aerogels including their physical properties and physicochemical preparation strategies.
The first known publication that we have encountered with optical composites based on silica hydrophobic aerogels shows the possibility of obtaining composites with composition SiO2(aerogel):[Eu(phen)2](NO3)3 using a two-step sol-gel process [2].
In a next contribution, the knowledge of this process was extended by finding dependences of the quantum yield (QY) and spectral intensities of SiO2:[Eu(phen)2](NO3)3 and SiO2:[Tb(phen)2](NO3)3 composites on the degree of hydrophobicity, α, of the starting aerogel matrix [3]. In the same paper, an increased thermal stability of these composites up to 200 °C is shown, compared to that of hydrophilic sol-gel composites. Thus, the hydrophobization of silicate surfaces affects the quantum yield of the obtained luminescent materials, reducing the concentration of surface OH-groups and at the same time increasing the thermal stability of the obtained aеrogel granules [4]. Stable green or red emitting materials enable the production of LED additives and the production of multi-color emitting aerogel powders.
The preparation of optical aеrogel composites is based on a simple two-step sol-gel process. At the first stage, we have the formation of an inorganic silica aerogel matrix with a selected degree of hydrophobicity. The next step is functionalizing the matrix. The matrix is soaked in solution of appropriate concentration of Ln(NO3)3 (Ln=Eu, Tb) in ethanol, followed by the addition of ethanolic solution of 1,10-phenanthroline (phen). After which the granules are washed and dried in subcritical conditions.
The aim of the present contribution is to obtain binary SiO2(aerogel):[Eu(phen)2](NO3)3; [Tb(phen)2](NO3)3 optical composites using a two-step activation sol-gel approach and to investigate their optical and thermal conductivity properties as a part of the framework preparation – structure – properties of gel composties. In our best knowledge, there are not contributions dealing with binary hybrid nanocrystallites, incorporated in silica aerogels.
Inorganic silicate materials, containing Eu3+ and Tb3+ are already known from a number of publications with a theoretical and applied focus [5, 6, 7]. Moreover, pure binary lanthanide aerogels are prepared in the search of porous materials with suitable optical and catalytic activities [8]. The pure, mixed binary and ternary lanthanide oxide phases are a well-known example for high-entropy materials, as well [9].
2. Results and Discussion
2.1. Optical properties
The UV-Vis-NIR spectra of the luminescent samples and of a non-hydrophobized and non-functionalized silica powders (notes GR0) are show on Figure 1. All silica samples display overtones and combinational vibrations attributed to SiO2 in the range 2250-2400 nm. Even the hydrophobic samples have some residual water according to the spectra in the NIR region. Water molecules have two intense overtones in the near-infrared. The peaks are centered around 1940 and 1450 nm. The luminescent samples also display peaks at 1186 nm and a doublet at 1696 and 1745 nm. These bands are associated with combinational and overtone vibrations of C-H groups in aromatic compounds, however, the position of the maxima are slightly shifted compared to C-H energies in pure benzene. This means they most likely originate from the phen molecule and the shift of the maxima is due to the presence of a N-heteroatom in the aromatic ring of the molecule [10].
Due to the low concentration of Ln3+ (1%) complex in the matrix the f-f transition in the ions are not visible in the reflection spectra of the samples (Figure 1). These transitions are forbidden by the Laporte selection rules and have a low oscillator strength, therefore, a low intensity. The UV region of the reflectance spectra is dominated by ligand (phen) and matrix (SiO2) absorption bands. The phen molecule has strong and broad absorption band around 350 nm which is seen as a shoulder in the reflectance spectra. This is the most important excitation channel in these complexes and composite materials doped with them. The energy is transferred trough the following path: first the UV photon (350 nm) is absorbed by the phen molecule and it is excited to the first singlet state. Afterwards the phen molecules relax non-radiatively to it’s first triplet state from which though intersystem crossing it transfers the energy to the emitting level of the lanthanide ion. A simplified energy transfer scheme is S0→S1→T1→5DJ(Ln3+) [3], [11]. Furthermore, very intense ligand to metal charge transfer transitions (CTT) are visible in the UV region around 220 nm and 260 nm. It is the well known O2-→Ln3+ transition observed in oxide matrices [5], [12], [13]. These transitions partially overlap with some phen peaks in the UV (232 and 265 nm).
Figure 2. a and b show the excitation and emission spectra, respectively, of the composite samples. The excitation spectra do not follow the reflectance spectra. They clearly show three distinct energy transfer pathways in the luminescent [Ln(phen)2](NO3)3 complexes depending on the dopant type and doping level. The first is the ligand to metal CTT at 260 nm. The second and the most intense is the ligand to metal resonant energy transfer described above. This transition occurs when the ligand is excited with UV light with wavelength around 350 nm. Similar to our previous findings, this energy transfer from 1,10 - phenanthroline molecules is more efficient for the Eu3+ complex rather than for the Tb3+ one [3]. The resonant energy transfer in hybrid molecules is the most efficient when the triplet T1 state of the ligand is 2000-3000 cm-1 above the metal receiving level (5DJ, J=0,1,2 for Eu3+ and J=3,4 for Tb3+) [5]. This ensures there is little-to-non back energy transfer from the metal ion to the ligand molecule. The last energy transfer path is via direct excitation of the lanthanide ion (380-390 nm). This is the least efficient excitation path due to the forbidden nature of the f-f transition. The intensity of this transition is about 1/10th of the intensity of the FRET transition, Figure 2 a.
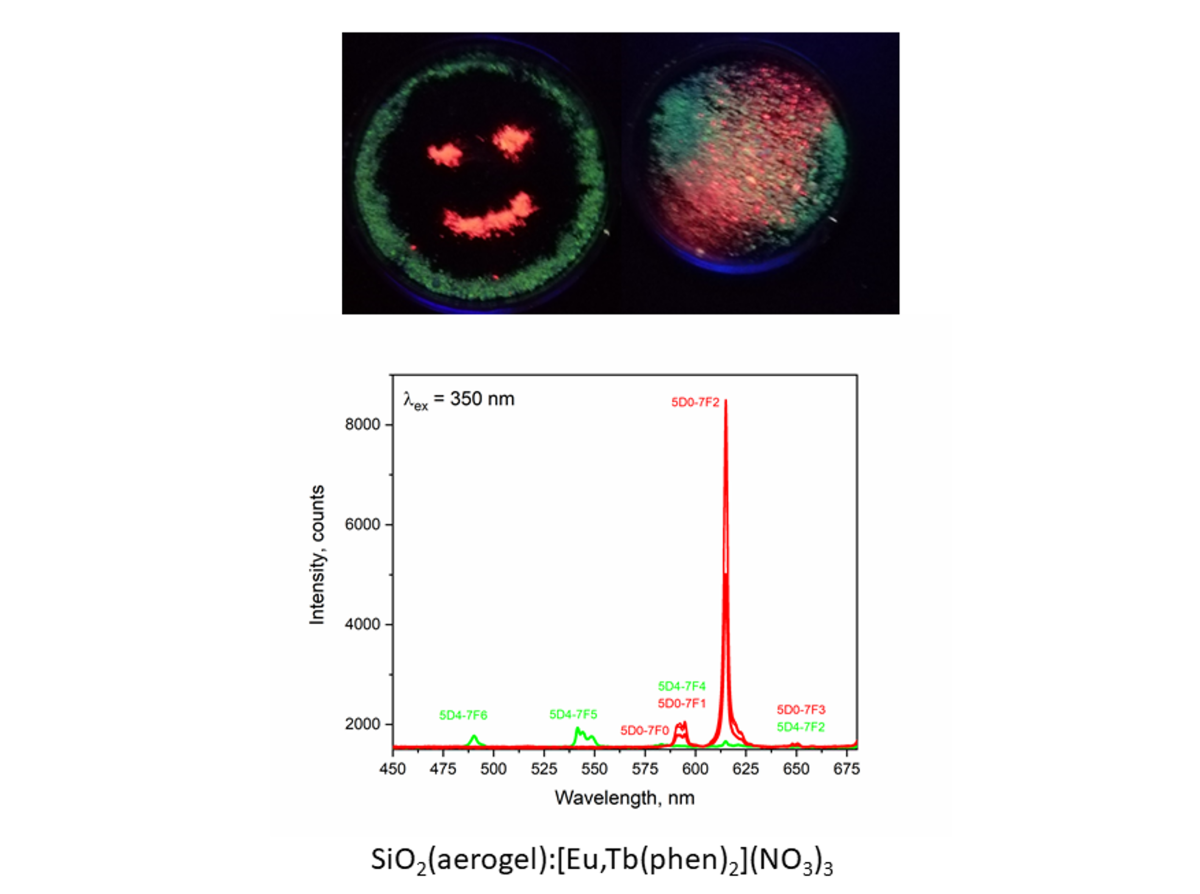
The emission spectra, shown in Figure 2b, display the well known f-f transition peaks for the Eu3+ and Tb3+ emission. The mixed samples, containing Eu3+ and Tb3+, do not show any emission originating from Tb3+ ions. This effect is discussed in the following paragraphs. Samples 1%Eu, EuTb_11 and EuTb_15 have only Eu3+ emission peaks. There can be observed 5D0-7FJ (J=1,2,3) transition. The most intense is the f-f electric dipole transition 5D0-7F2 at 615 nm which gives the distinct red emission color of the Eu3+-doped composites. The only sample exhibiting green Tb3+ emission is the one doped with pure [Tb(phen)2](NO3)3 complex, namely sample 1%Tb, fig 2b. There, one can observe the 5D4-7FJ (J=6,5,4,3,2) transitions. The most intense Tb3+ peak is the 5D4-7F5 transition, centered at 542 nm and giving the green color of the emission.
The optical properties of the aerogel nanocomposites are summarized in Table 1. The relative spectral intensities between the electro-dipole and magnetic-dipole transitions clearly indicates a low site symmetry, C2V or lower, around the Ln3+ ions [12], [14]. For the [Eu(phen)2](NO3)3 complex the ratio between the electro-dipole transition 5D0-7F2 and the magnetic-dipole transition 7D0-7F1 is calculated. The calculated ratios for samples 1%Eu, EuTb_11 and EuTb_15 are 5.98, 5.92 and 6.06, respectively. They are lower than the calculated ratio for the pure [Eu(phen)2](NO3)3 complex. This indicates some structural changes and inhomogeneities forming during the in situ formation of the nanocrystalites inside the silica gel pores. The intensity ratios for the composites are similar in value but they tend to increase when higher concentration of Tb3+ is used. This indicates a lowering of the site symmetry around Eu3+ ions or increased polarizability of the phen ligand in the different environment [12].
The Tb3+ ion’s f-f electron transitions are less site sensitive than the electro-dipole transition 5D0-7F2 in the Eu3+ ion. For this reason, Tb3+ is rarely used as a spectroscopic probe, nevertheless, different relative intensities in the emission peaks of the Tb3+ ion still indicate some structural and site changes around the ion. There is no definitive procedure to determine the site symmetry around the Tb3+ ion from the emission spectra, although there is one developed for Eu3+. The intensity ratio 5D4-7F6 to 5D4-7F5 is calculated for sample 1%Tb. It’s value is 0.39 and is close to the ratio for the pure complex [Tb(phen)2](NO3)3 – 0.37 [5], [15].
In Table 1., quantum yield, spectral ratio and CIE-1931 color coordinates are compared to that of the pure solid complexes. It is visible that the Tb – green f-f emission is suppressed by the Eu – doping, which indicates for a possible energy transfer 1,10-phenanthroline →Tb3+→Eu3+. Such an assumption correlates with the Diecke diagrams of the terbium and europium ions. The energy of the emitting Tb3+ level 5D4 (20660 cm-1) is slightly above the two lowest energy levels of Eu3+ ion (5D0 and 5D1 with energy 17240 and 21550 cm-1, respectively). The next energy level of the Tb3+ 5D3 (26315 cm-1) has similar energy as the Eu3+’s 5G8 and is above the 5L6 (25450 cm-1) and 5D3 (24100 cm-1) [16, 17, 18]. Binnenmans et al [5], [12] predict such behavior. The relative spectral intensities are expressed through the ratio IED/IMD, which is a semi-quantitative indicator for the site symmetry of the lanthanide ions [13]. The assumption of a Tb3+→Eu3+is supported by the relative peak intensities in the excitation spectra, Figure 2a, at 350 nm.
According to the concept of Foerster resonant energy transfer (FRET), the intensity of the transfer is strongly proportional to the inverse of the distance between the species. The mean distance between the europium and terbium ions, incorporated in the pores of the aerogels is less than 10 nm. Such an assumption is well supported by texture investigations of the silica matrix, showing a mean pore diameter about 7 nm [4]. The question about an in situ formation of a binary [Eu-Tb(phen)2](NO3)3 nanostructure in the pore system during the two step activation, however, needs additional structure investigations, which will be a subject of next contribution.
The quantum yield (QY) of the samples containing Eu3+ are similar to that of the pure powder complex [Eu(phen)2](NO3)3. The QY of the samples with europium are 30-35% and that of the pure complex is 35%. Sample 1%Tb has QY 6.3%, which is half the QY of the pure Tb3+ complex (13%). This could be due to concentration quenching or strong non-radiative relaxation. Glasses and ceramics doped with europium usually display significant concentration quenching above 5% dopant [19].
2.2. Thermal properties

Table 2.
Thermal conductivity properties of the investigated samples. The table contains the degree of hydrophobicity (α), thermal conductivity (λ), effusivity (e) and the bulk density of the samples. Experimental errors are also given.
Table 2.
Thermal conductivity properties of the investigated samples. The table contains the degree of hydrophobicity (α), thermal conductivity (λ), effusivity (e) and the bulk density of the samples. Experimental errors are also given.
| Sample | α | λ | Δλ | e | Δe | ρ | nLn/nSiO2 |
|---|---|---|---|---|---|---|---|
| W/m.K | W/m.K | W.s1/2/m.K | W.s1/2/m.K | g/cm3 | |||
| GR0 | 0 | 0.0640 | 0.0002 | 145.3896 | 0.8531 | 0.45 | 0 |
| 1% Eu | 1.1 | 0.0523 | 0.0001 | 95.6041 | 0.5516 | 0.23 | 0.01 |
| 1% Tb | 1.1 | 0.0467 | 0.0001 | 71.2591 | 0.5505 | 0.18 | 0.01 |
| EuTb_11 | 1.1 | 0.0510 | 0.0001 | 90.2086 | 0.4896 | 0.18 | 0.01 |
| EuTb_15 | 1.1 | 0.0523 | 0.0003 | 95.5750 | 1.1232 | 0.18 | 0.01 |
The aerogel-like character of the functionalized composites investigated here is manifested by their low thermal conductivities, arising from more than 90% porosity. Such an observation proves the effectivity of the aerogel powder drying conditions applied for hydrophilic and hydrophobic species.
The hydrophobization with trimethylchlorosilane (TMCS) leads to a decrease of thermal conductivity by about 20%. It is known, that hydrophobization of the silica matrix also leads to an increase of the mean pore diameter [4].The thermal conductivities are not affected by the kind of the dopant. The values of the thermal conductivity and effusivity are in good agreement with the thermal conductivity vs. density dependence of porous silicate materials [20].
2.3. X-ray diffraction results
The optically active nanocrystallites in this study display structural polymorphism. The [Eu(phen)2](NO3)3 and [Tb(phen)2](NO3)3 are isostructural with small differences in the cell parameters. However, [Eu(phen)2](NO3)3 has two polymorphs [21]. The pure powdered [Eu(phen)2](NO3)3 complex crystalizes in a monoclinic phase described by Mirochnik et al. [22]. The XRD pattern of this phase is shown in Figure 3. as Euphen_th (black line), while the theoretical patterns of the [Tb(phen)2](NO3)3 are given as Tbphen_th (green line). PowderCell program [20] was applied to construct the XRD pattern using data collected from the crystal structure information. The crystals are monoclinic with space group C2/c. The cell parameters are a = 11.168(1), b = 17.976(2), c = 13.053(1) Å, β = 100.577(2)°. The XRD pattern for the Tb complex was constructed using structure data from [23]. Hence, being isostructural the two complexes display very similar XRD patterns.
Lindenberg et. al. [21] have found that depending on the reaction conditions two different polymorphs of [Eu(phen)2](NO3)3 or a mixture of both can be obtained. They give the following cell parameters for the second [Eu(phen)2](NO3)3 phase: a = 9.515, b = 15.454, c = 17.176 Å, β = 93.45° with a space group P21/c. In agreement with these results the X-ray diffraction patterns here show the presence of both structures as the peaks of the phase observed by Lindenberg et. al. [20] are marked with *. Thus, we can conclude that a mixture of the two polymorphic forms of [Ln(phen)2](NO3)3 is obtained in the pores of the silica gels during the in- situ preparation procedure.
No diffraction patterns from Eu(NO3)3, Tb(NO3)3 or 1,10-phenanthroline were found. For the full, the presence of both anhydrous and different possible crystalhydrates were also checked. It should also be stressed that the interpretation of the XRD pattern of the samples is hampered by the low concentration of the dopant (1%) and the presence of intense broad amorphous halo originating from the silica matrix [4]. Therefore, the formation of a new nanostructure in the pores of the silica matrix with a composition [Eu,Tb(phen)2](NO3)3 cannot be excluded.
The mean crystallite sizes of the crystallites in Figure 3 are about 20 nm.
3. Conclusions
An effective and simple two-step sol-gel approach for the preparation of aerogel-like powders, binary doped with [Tb(phen)₂](NO₃)₃ and [Eu(phen)₂](NO₃)₃ nanocrystals, is demonstrated. The as-prepared hydrophobic nanocomposites have a density of about 0.2 g/cm-3 and thermal conductivity of about 0.05 W / m.K. Luminescence, excitation spectra and quantum yield determination strongly suggest for an effective energy transfer from the 1,10-phenathroline molecule to the Eu3+ ion, resulting in a quantum yield of about 30% of the red europium f-f emission. An energy transfer from the Tb3+ to the Eu3+ ion, leading to a suppression of the green terbium f-f luminescence is observed. There is also evidence for a structural polymorphism in the binary composites, proven by X-ray diffraction and luminescence spectra analysis.
4. Materials and Methods
The following chemicals were used for the syntheses of the composite materials: absolute ethanol 99.6% (abs EtOH), (Merck), 65% Nitric acid (Fluka), Europium (III) oxide 99.9% (Eu2O3) (Merck), Terbium (III, IV) oxide 99.9% (Tb4O7) (Merck) and anhydrous 1,10-phenanthroline (Merck) were used without further purification.
Non-doped aerogel-like samples without hydrophobisation (GR0) was prepared using a standard procedure for sol-gel oxide powders, given in [4]. The starting reagent was TEOS, followed by H2O addition, acid hydrolysis catalysis and basic gelation catalysis. The ratio nTEOS/nH2O was 1:1, while the acid and basic catalyst added were nCH3COOH/nTEOS = 1.17 and nNH3/nTEOS = 0.04, respectively. The drying conditions applied were: room temperature and pressure 100 mbar.
Aerogel-like granules with a given degree of hydrophobicity α = 1.1 were synthesized through hydrolysis, solvent exchange, hydrophobization and drying using Tetraethyl orthosilicate (TEOS). Such aerogel powders have a bulk density 0.2 g/cm3, specific surface area of 870 m2/g and mean pore diameter of 7 nm. The degree of hydrophobicity, α, is defined as a ratio between the moles Trimethyl chlorosilane (TMCS), used as a hydrophobisation agent and TEOS. More details about the subcritical process used here can be found in [4].
Solutions of Eu(NO3)3 and Tb(NO3)3 were prepared by dissolving appropriate amounts Eu2O3 or Tb4O7 in concentrated nitric acid. After the oxides dissolve, the solutions are heated to evaporate the leftover water and nitric acid and crystals are formed. The prepared salts were dissolved in absolute EtOH to obtain solutions with concentration 60 mM.
For the preparation of the aerogel-like composites a two-step colloidal route was used, starting with the hydrophobic silica micropowders, described above. In the first step hydrophobic SiO2 granules are soaked in Eu(NO3)3, Tb(NO3)3 or a mixture of both. The suspension was stirred for an hour to let the solution fill the pores of the gel. The molar ratio of Ln/SiO2 (Ln=Eu, Tb) was fixed here at 0.01. In this way both single functionalized composites, SiO2:0.01[Tb(phen)₂](NO₃)₃, SiO2:0.01[Eu(phen)₂](NO₃)₃ and binary doped composites SiO2:[EuxTb1-x(phen)₂](NO₃)₃ were obtained. For the preparation of binary doped composites an ethanol solution, containing Eu and Tb nitrates was used. Afterwards, excess solution of 1,10-phenanthroline (0.11M is ethanol) is added and the suspension is stirred for an additional hour. Then, the granules are filtered and washed thoroughly with ethanol in order to remove the unreacted phen.
All samples were dried in a vacuum oven NÜVE at room temperature and constant pressure of 100 mbar.
UV/Vis/NIR powder reflectance spectra were measured on an Agilent Cary 5000 spectrophotometer with a “Praying mantis” sample holder using Spectralon® as a reference between 200 nm and 2500 nm. The Kubelka–Munk function F(R) was calculated from the diffuse reflectance of all samples. As a standard for all diffuse reflection measurements, Ho2O3 powder was used, and all peaks and relative intensities of the Ho(III) f–f transitions at 300–2000 nm are in agreement with spectral data published in [24].
The luminescence spectra of the powders were recorded on a fluorimeter PE FL 8500, equipped with an integrating sphere (N4201017) for absolute quantum yield (QY) measurements using a quartz cell for the QY measurements. The absolute QY was achieved using the calculation method of Suzuki et. al [25]. The error of the QY determination here was about 5%.
Emission and excitation spectra were recorded using a variable angle solid sample holder (N4201014) equipped with a precision cell for powder samples (N4201032). The calculation of x and y values were performed by home-made program able to read the raw data file as it comes out from the instrument, based on the procedure published in [20]. The data points were validated trough OSRAM Sylvanya Color Calculator program. All the diffuse reflectance, excitation and emission spectra were quantified using Gaussian deconvolution.
The structure and microstructure of the samples were characterized by X-ray diffraction with Cu-Kα radiation (Panalytical Empyrean 3 diffractometer). The mean crystallite sizes were calculated using Scherrer’s equation for the most intense peak of [Ln(phen)2](NO3)3. The error of the lattice constant determination is about 0.005 Å. A qualitative phase analysis was performed on the following structures: [Tb(phen)2](NO3)3, [Eu(phen)2](NO3)3, 1,10 – phenanthroline, Tb(NO3)3, Eu(NO3)3.
The thermal conductivities were measured on a C-Therm MTPS (Modified Transient Plane Source) TCi Thermal Conductivity Analyzer equipped with a powder and liquid sample holder. The error of the thermal conductivity determination of the gel powders is about 0.0002 W/mּK.
Author Contributions
Author Contributions: Conceptualization, S.G. and T.S.; methodology, D.S. and N.D.; investigation, D.S., N.D., V.P., S.G. and T.S. resources, T.S.; data curation, S.G., V.P.; writing—original draft preparation, S.G., N.D., D.S.; writing, D.S.; visualization, D.S.; supervision, S.G.; project administration, T.S. All authors have read and agreed to the published version of the manuscript.
Data Availability Statement
We encourage all authors of articles published in MDPI journals to share their research data. In this section, please provide details regarding where data supporting reported results can be found, including links to publicly archived datasets analyzed or generated during the study. Where no new data were created, or where data is unavailable due to privacy or ethical restrictions, a statement is still required. Suggested Data Availability Statements are available in section “MDPI Research Data Policies” at https://www.mdpi.com/ethics.
Acknowledgments
Thanks are due to the European Union-NextGenerationEU, through the National Recovery and Resilience Plan of the Republic of Bulgaria, project No BG-RRP-2.004-0008. The authors are grateful to G. Avdeev for experimental help.
Conflicts of Interest
The authors declare no conflict of interest.
Sample Availability
Samples of the compounds are available from the authors.
References
- M. A. Aegerter, N. Leventis, and M. M. Koebel, Aerogels Handbook. New York: Springer, 2011. [CrossRef]
- S. Gutzov, N. Danchova, R. Kirilova, V. Petrov, and S. Yordanova, “Preparation and luminescence of silica aerogel composites containing an europium (III) phenanthroline nitrate complex,” J. Lumin., vol. 193, pp. 108–112, 2017. [CrossRef]
- S. Gutzov, D. Shandurkov, N. Danchova, V. Petrov, and T. Spassov, “Hybrid composites based on aerogels: preparation, structure and tunable luminescence,” J. Lumin., vol. 251, p. 119171, 2022.
- D. Shandurkov, P. Ignatov, I. Spassova, and S. Gutzov, “Spectral and texture properties of hydrophobic aerogel powders obtained from room temperature drying,” Molecules, vol. 26, no. 6, pp. 1–12, 2021. [CrossRef]
- R. Hull, J. R. M. Osgood, J. Paris!, and H. Warlimont, Spectroscopic properties of Rare Earths in Optical Materials. Springer, 2014.
- Koseva, P. Tzvetkova, P. Ivanov, A. Yordanova, and V. Nikolova, “Terbium and europium co-doped NaAlSiO4 nano glass-ceramics for LED application,” Optik (Stuttg)., vol. 137, pp. 45–50, 2017.
- Koseva, P. Tzvetkov, P. Ivanov, A. Yordanova, and V. Nikolov, “Some investigations on Tb3+ and Eu3+ doped Na2SiO3 as a material for LED application,” Optik (Stuttg)., vol. 168, pp. 376–383, 2018.
- S. V. Kameneva et al., “Epoxide synthesis of binary rare earth oxide aerogels with high molar ratios (1:1) of Eu, Gd, and Yb,” J. Sol-Gel Sci. Technol., 2023. [CrossRef]
- Y. Zhang, High-Entropy Materials A Brief Introduction. Springer Singapore, 2019. [CrossRef]
- J. Workman and L. Weyer, Practical Guide to Interpretive Near-Infrared Spectroscopy. CRC Press Taylor & Francis Group, 2008.
- T. Zahariev et al., “Phenanthroline chromophore as efficient antenna for Tb3+ green luminescence: A theoretical study,” Dye. Pigment., vol. 185, p. 108890, 2020.
- K. Binnemans, “Interpretation of europium(III) spectra,” Coord. Chem. Rev., vol. 295, pp. 1–45, 2015.
- G. Blasse and B. C. Grabmaier, Luminescent Materials. Telos: Springer-Verlag, 1994.
- Fumito FUJISHIRO, M. MURAKAMI, T. HASHIMOTO, and M. TAKAHASHI, “Orange luminescence of Eu3+ doped CuLaO2 delafossite oxide,” J. Ceram. Soc. Japan, vol. 118, no. 12, pp. 1217–1220, 2010.
- P. Gomez-Romero and C. Sanchez, Functional Hybrid Materials. Wiley-VCH, 2003. [CrossRef]
- G. H. Dieke, H. M. Crosswhite, and H. Crosswhite, Spectra and energy levels of rare earth ions in crystals. Interscience Publishers, 1968.
- S. Singh and D. Singh, “Synthesis and spectroscopic investigations of trivalent europium-doped M2SiO5 (M = Y and Gd) nanophosphor for display applications,” J. Mater. Sci. Mater. Electron., vol. 31, pp. 5165–5175, 2020.
- Z. Boruc, B. Fetlinski, M. Kaczkan, S. Turczynski, D. A. Pawlak, and M. Malinowski, “Temperature and Concentration Quenching of Tb3+ Emissions in Y4Al2O9 Crystals,” J. Alloys Compd., vol. 532, pp. 92–97, 2012.
- S. Culubrk, V. Lojpur, Z. Antic, and M. D. Drami, “Structural and optical properties of europium doped Y2O3 nanoparticles prepared by self-propagation room temperature reaction method,” J. Res. Phys., vol. 37, no. 1, pp. 39–45, 2013. [CrossRef]
- T. Xie, Y.-L. He, and Z.-J. Hu, “Theoretical study on thermal conductivities of silica aerogel composite insulating material,” Int J Heat Mass Transf, vol. 58, pp. 540–552, 2013.
- P. Lindenberg et al., “New insights into the crystallization of polymorphic materials:from real-time serial crystallography to luminescence analysis,” React. Chem. Eng., vol. 4, 2019. [CrossRef]
- G. Mirochnik, B. V. Bukvetskii, P. A. Zhikhareva, and V. E. Karasev, “Crystal Structure and Luminescence of the [Eu(Phen)2(NO3)3] Complex. The Role of the Ion-Coactivator,” Russ. J. Coord. Chem., vol. 27, pp. 443–448, 2001.
- D.-Y. Wei, J.-L. Lin, and Y.-Q. Zheng, “Note: The crystal structure of Tris(nitrato-O,O’)bis(1,10-phenanthroline-N,N’)terbium(III),” J. Coord. Chem., vol. 55, no. 11, pp. 1259–1262, 2002. [CrossRef]
- R. Yadav et al., “Preparation of Holmium Oxide Solution as a Wavelength Calibration Standard for UV–Visible Spectrophotometer,” Mapan - J. Metrol. Soc. India, vol. 37, no. 3, 2021.
- K. Suzuki et al., “Reevaluation of absolute luminescence quantum yields of standard solutions using a spectrometer with an integrating sphere and a back-thinned CCD detector,” Phys. Chem. Chem. Phys., vol. 11, no. 42, pp. 9850–9860, 2009. [CrossRef]
Figure 1.
UV-Vis-NIR spectra of the samples.
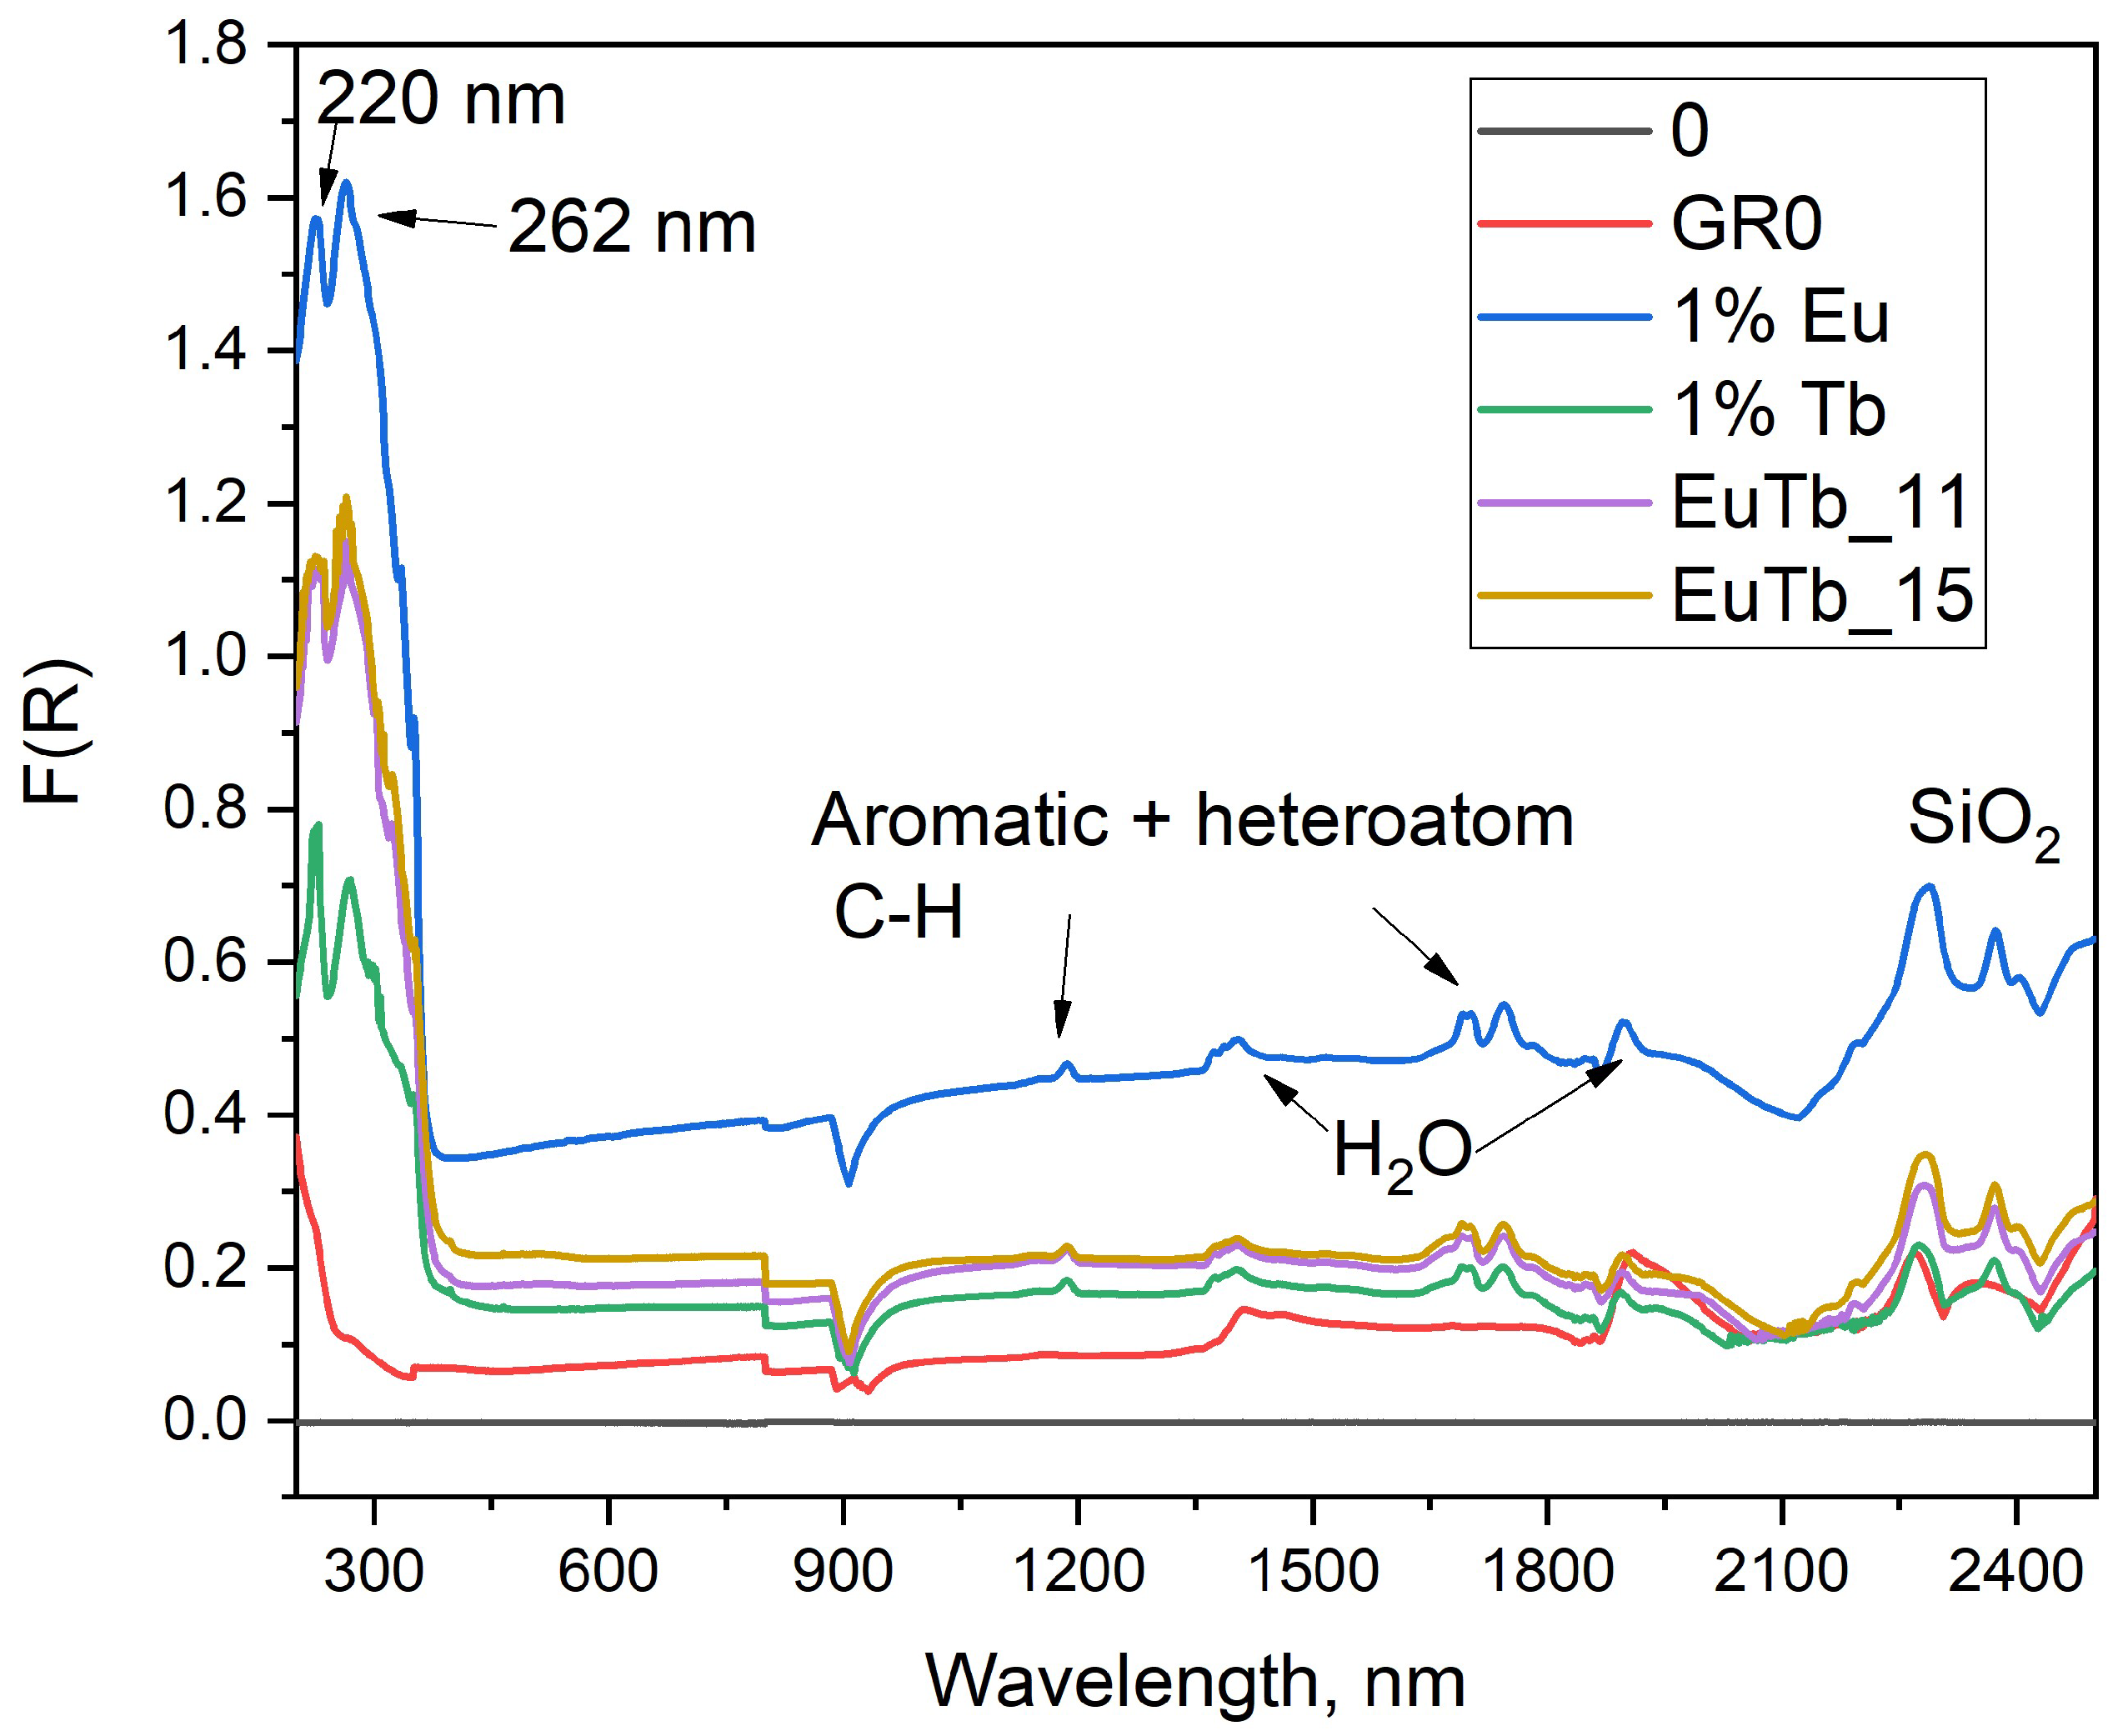
Figure 2.
a) Excitation spectra of the luminescent composite samples monitoring the 615 nm Eu3+ transition or the 542 nm Tb3+ transition; b) Emission spectra of the samples at 350 nm excitation. Electronic transitions are given, green for Tb3+ and red for Eu3+ ions.
Figure 2.
a) Excitation spectra of the luminescent composite samples monitoring the 615 nm Eu3+ transition or the 542 nm Tb3+ transition; b) Emission spectra of the samples at 350 nm excitation. Electronic transitions are given, green for Tb3+ and red for Eu3+ ions.
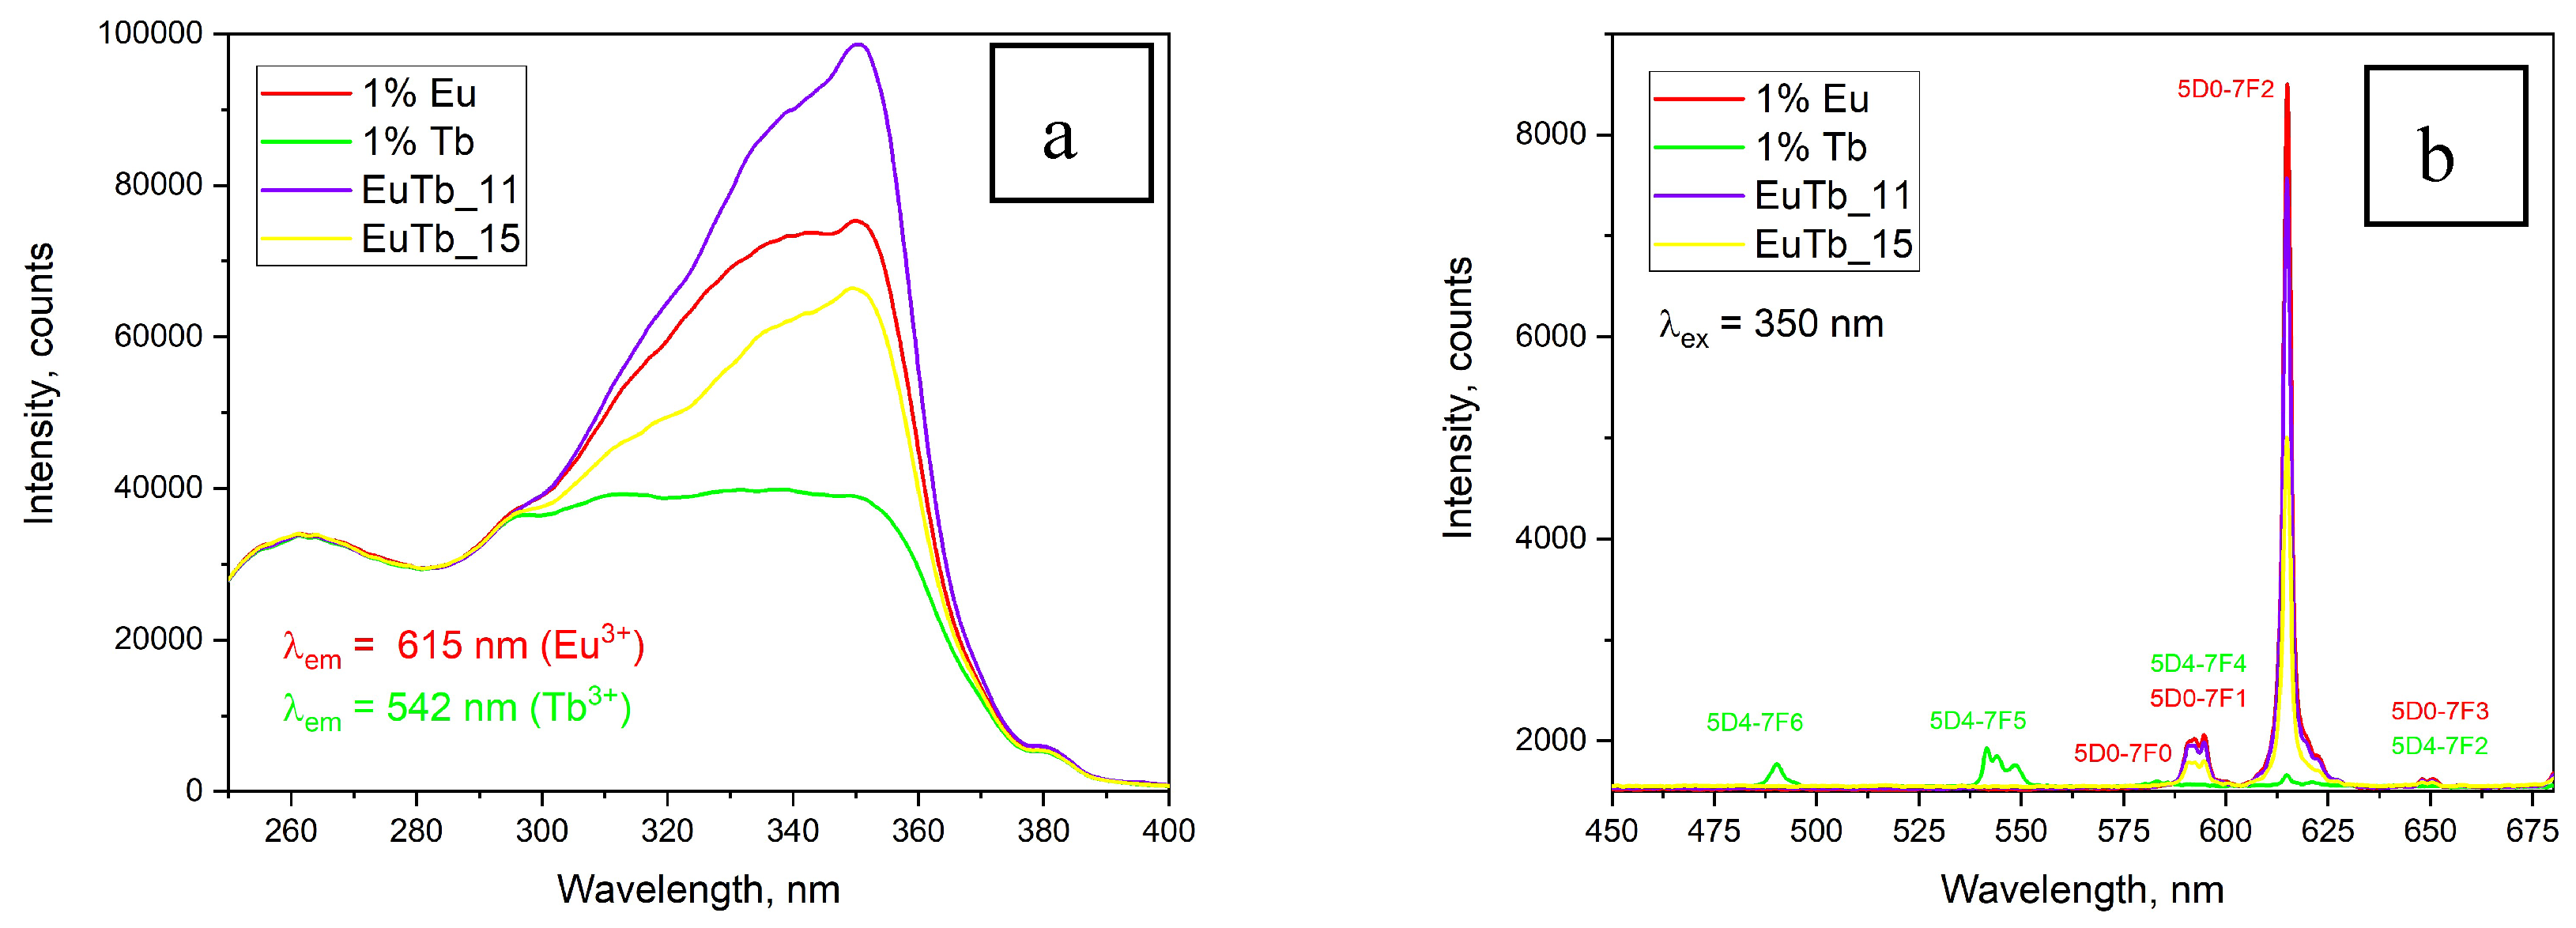
Figure 3.
XRD patterns of the luminescent samples. The peak originating from the second [Eu(phen)2](NO3)3 phase are marked with *.
Figure 3.
XRD patterns of the luminescent samples. The peak originating from the second [Eu(phen)2](NO3)3 phase are marked with *.
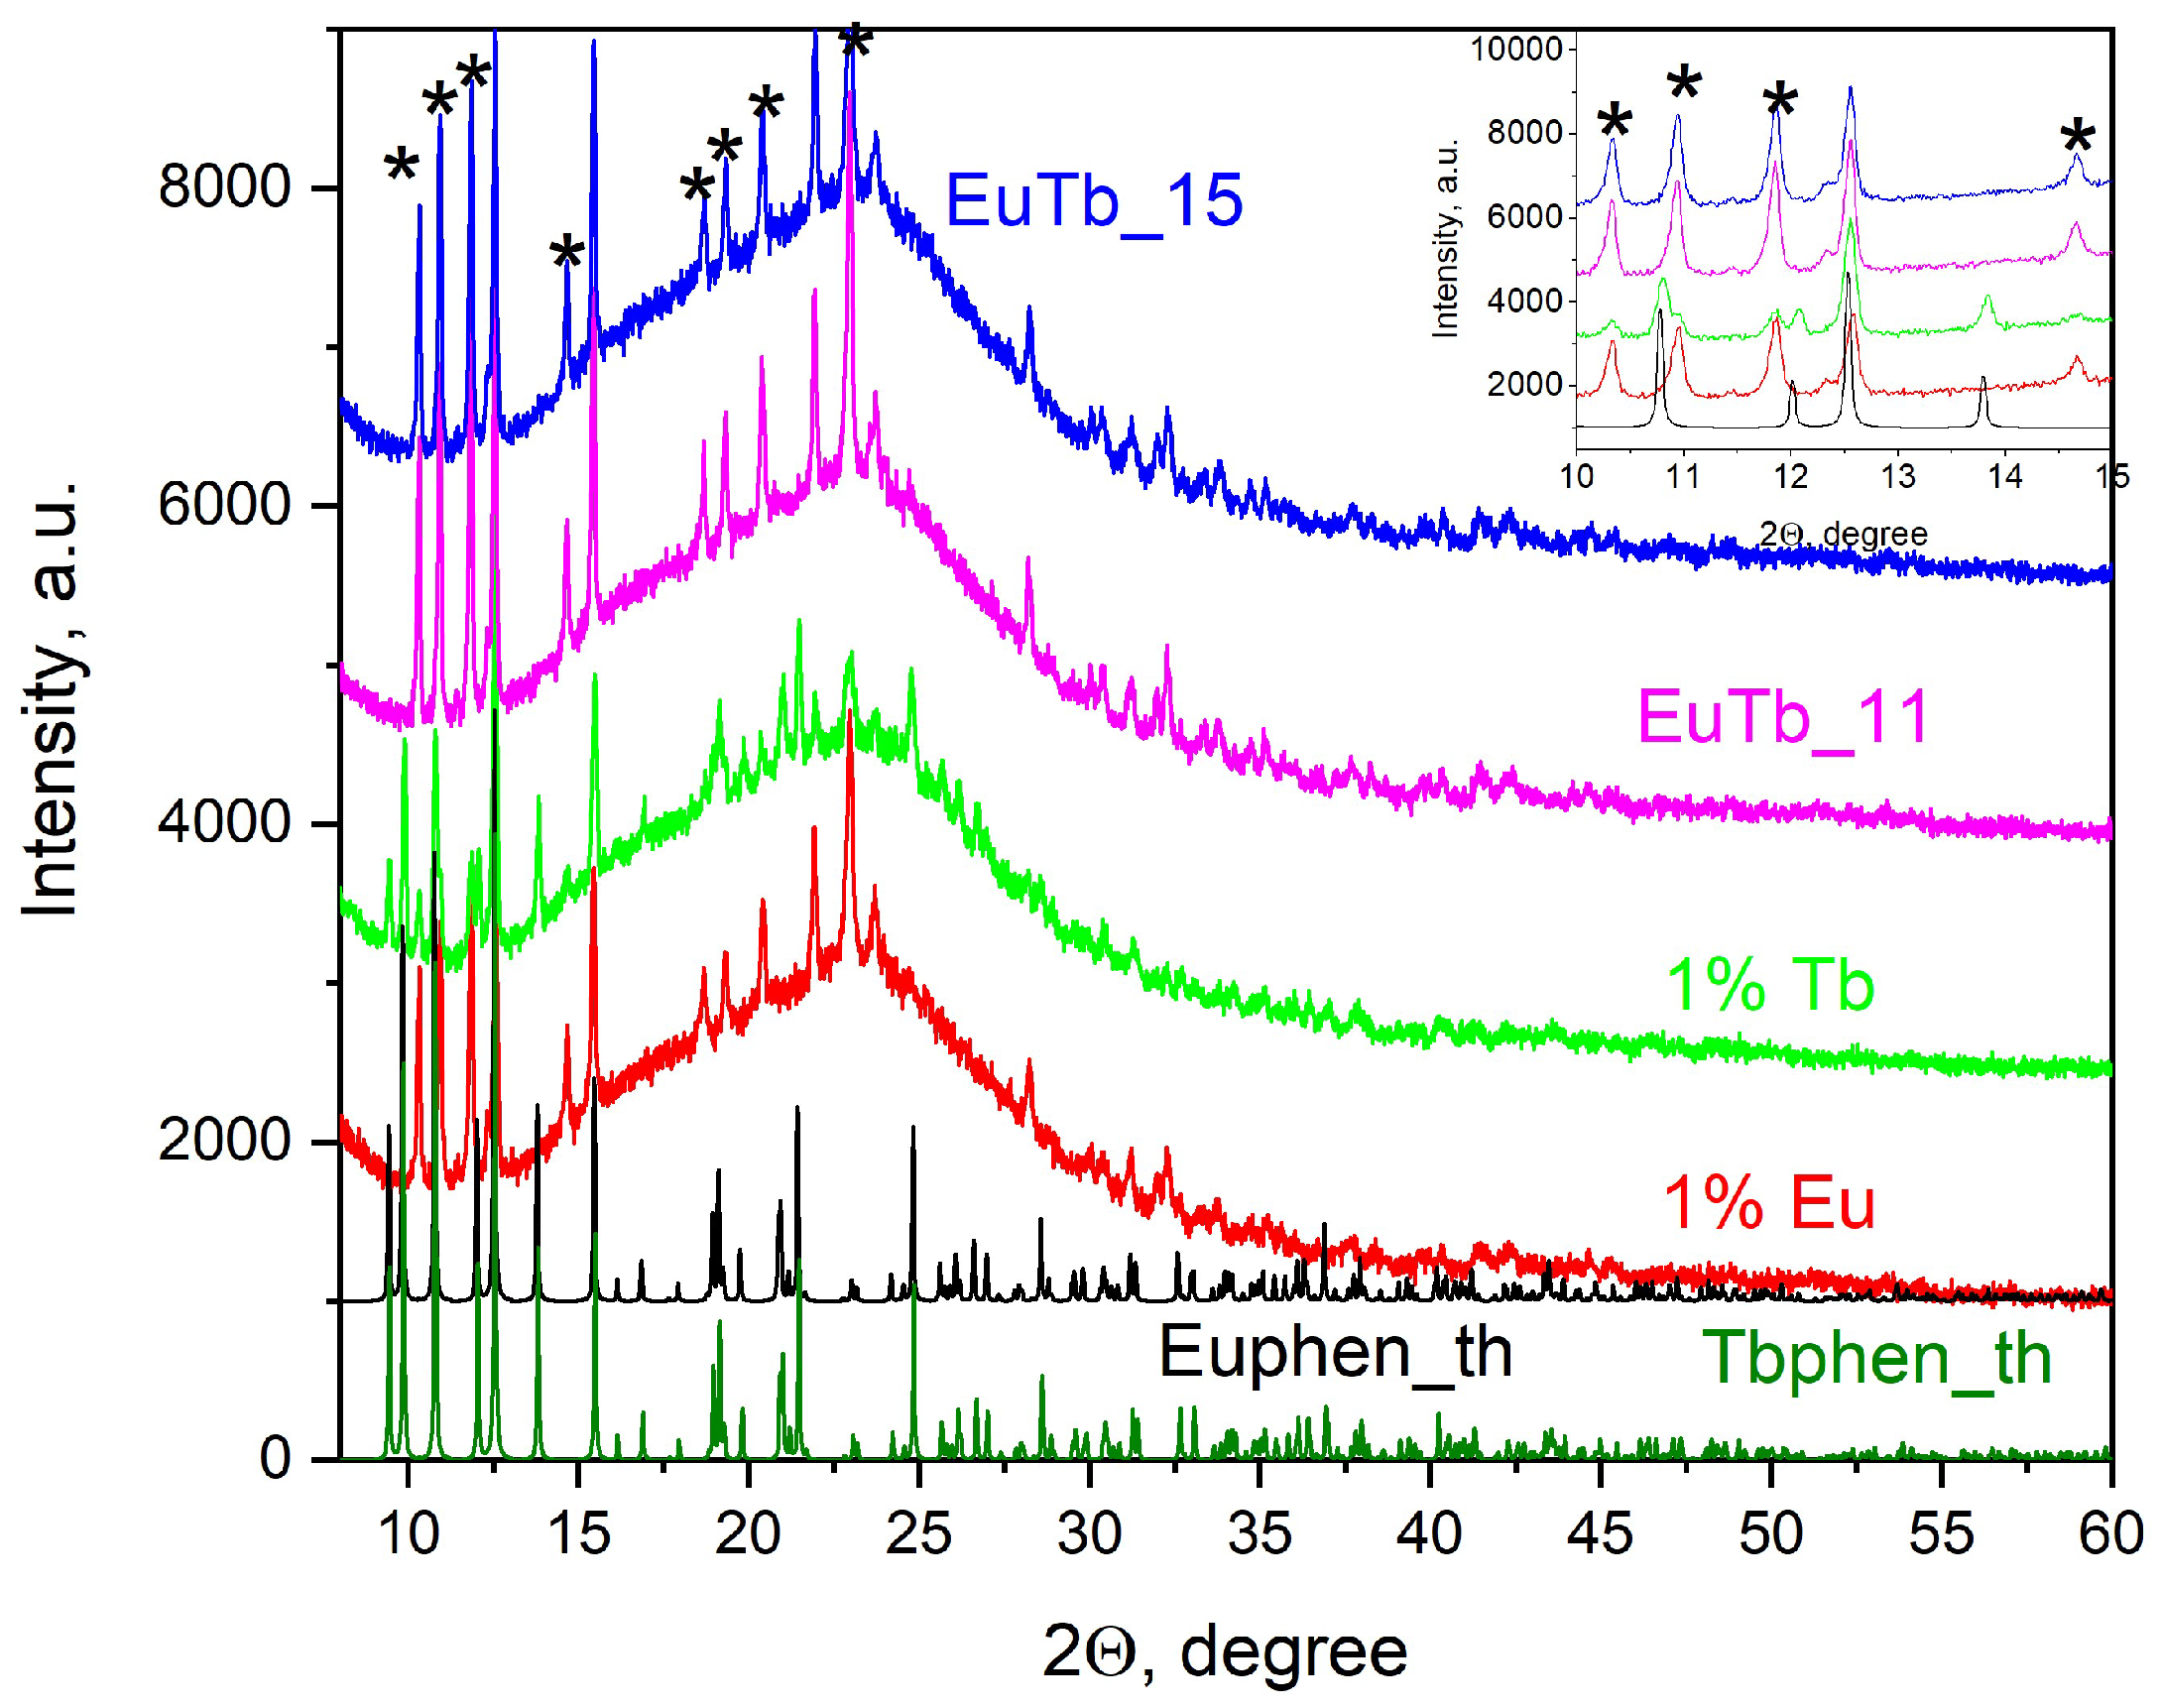
Table 1.
Summary of the optical properties of the composite samples: sample name, chemical composition, quantum yield, relative intensity ration and CIE-1931 color coordinates of the emission.
Table 1.
Summary of the optical properties of the composite samples: sample name, chemical composition, quantum yield, relative intensity ration and CIE-1931 color coordinates of the emission.
| Sample | Chemistry | QY, red % |
QY, green % |
IED/IMD | x | y | z |
|---|---|---|---|---|---|---|---|
| GR0 | SiO2 | - | - | - | - | - | - |
| 1%Tb | SiO2:0.01Tb | - | 6.3 | 0.39 | 0.631 | 0.340 | 0.03 |
| 1%Eu | SiO2:0.01Eu | 35 | - | 5.98 | 0.358 | 0.486 | 0.156 |
| EuTb1_1 | SiO2:0.005Eu;0.005Tb | 30 | - | 5.92 | 0.626 | 0.336 | 0.038 |
| EuTb1_5 | SiO2:0.0017Eu;0.0083Tb | 32 | - | 6.06 | 0.597 | 0.322 | 0.081 |
| Euphen | [Eu(phen)2](NO3)3 | 35 | - | 7.25 | 0.309 | 0.602 | 0.089 |
| Tbphen | [Tb(phen)2](NO3)3 | - | 13 | 0.37 | 0.665 | 0.333 | 0.003 |
Disclaimer/Publisher’s Note: The statements, opinions and data contained in all publications are solely those of the individual author(s) and contributor(s) and not of MDPI and/or the editor(s). MDPI and/or the editor(s) disclaim responsibility for any injury to people or property resulting from any ideas, methods, instructions or products referred to in the content. |
© 2023 by the authors. Licensee MDPI, Basel, Switzerland. This article is an open access article distributed under the terms and conditions of the Creative Commons Attribution (CC BY) license (http://creativecommons.org/licenses/by/4.0/).
Copyright: This open access article is published under a Creative Commons CC BY 4.0 license, which permit the free download, distribution, and reuse, provided that the author and preprint are cited in any reuse.


