1. Introduction
The assessment of blood amino acid (AA) and acylcarnitine (AC) concentrations has long been established as part of newborn screening to identify congenital disorders [
1]. Furthermore, blood AA and AC concentrations are also informative on physiological and disease-associated changes in human metabolic pathways, such as fatty acid oxidation, the carnitine shuttle system, the urea cycle, and the metabolism of branched-chain amino acids. Previously, AAs and ACs were examined as potential biomarkers or predictors of complex metabolic diseases in adults (e.g., type 2 diabetes, cardiovascular disease, obesity) [
2,
3,
4] as well as in children and adolescents [
2,
5,
6,
7,
8]. However, there is still a lack of studies examining physiological AA and AC blood levels and the influence of factors such as weight and excess body fat in healthy pediatric populations. The LIFE Child study, a large-scale longitudinal pediatric cohort study, aims to identify factors related to lifestyle-related diseases. A previous study based on the LIFE Child cohort examined AA and AC concentrations and the influence of age, sex, weight, and pubertal status as well as laboratory parameters of carbohydrate, fat, liver, kidney, and thyroid metabolism. They found associations between both weight and pubertal status and AA and AC levels under physiological conditions and suggested that AA and AC levels are potential biomarkers for metabolic alterations in overweight and obese pediatric individuals [
9]. In this follow-up study, we asked how stable blood AA and AC concentrations are during repeated measurements and whether they differ in their stability. Furthermore, we wanted to examine the association between weight status and blood AA/AC values in more detail and asked if associations exist with different parameters for excess body fat, body fat distribution and IGF1 serum levels and whether sex and pubertal status would have an impact on these associations. With this study, we want to further contribute to understanding the complex changes of AA and AC metabolism during childhood and adolescence and aid in the identification of potential biomarkers and early predictors for pathological processes that lead to metabolic disorders like type 2 diabetes and hypertriglyceridemia.
2. Materials and Methods
2.1. Study Population and Design
LIFE Child is a prospective, longitudinal, population-based childhood cohort study carried out at the Leipzig Research Center for Civilization Diseases (LIFE) in the city of Leipzig (Saxony, Germany). Participants join the study at any age from 3 months to 16 years and attend annual follow-up visits until the age of 20. For participants recruited during the first year of life, data is collected at 3, 6, and 12 months of age. Most participants are German residents living in Leipzig and its vicinity. The LIFE Child study is designed to investigate the impact of metabolic, genetic, and environmental factors on health and development in children and adolescents [
10,
11]. The sub-study presented includes all visits where metabolite assessments were performed (4029 measurements from 2213 children aged between 3 months and 19 years). Measurements of skinfold thickness (biceps, triceps, iliac crest, subscapular) started from the age of 2. Children aged 4 years and older were instructed to fast overnight for at least 8 hours. From age 8 to age 15, for each year more than 100 measurements for the follow-up visits on year later were collected, whereas for lower and older ages, the number of available measurements was lower (
Supplement Table S1).
2.2. Preanalytics and Analytics
22 AAs, 6 ACs and free carnitine were determined by liquid chromatography/tandem mass spectrometry of dried whole blood samples collected by venous blood sampling. IGF1 was measured by immunoassay from serum blood samples. The detailed procedures have been described elsewhere [
9,
12,
13,
14]. The data collection for this study was carried out between May 2011 and December 2014.
2.3. Other Measures
Qualified and certified staff conducted all measurements during anthropometric assessments of the participants. Measurements of height, weight, skinfold thicknesses, waist circumference and hip circumference were used in this study. The categorization into pre-pubertal and pubertal was done based on Tanner Stages (Stage 1=prepubertal, Stage 2-5=pubertal).
2.3. Statistical Analysis
To reduce the confounding of age and sex regarding the investigated correlations, AAs, ACs, free carnitine and anthropometric measurements were transformed to age- and sex-adjusted standard deviation scores (SDS) [
9,
12,
15,
16]. Subjects were categorized into normal weight: BMI-SDS −1.28 to 1.28 and overweight/obese: BMI-SDS > 1.28 [
17]. Extreme outliers with SDS values of more than
±9 standard deviations were excluded. For statistical analysis, hierarchical linear regression analysis and the Pearson correlation coefficient were applied. To estimate the stability of metabolites, the age of the participants was rounded (e.g. age 3,5-4,49 = age 4) and then the coefficient of determination (r
2) was calculated through linear regression for every pair of consecutive visits. Data analyses were carried out using R software (version 4.2.2; R Foundation for Statistical Computing, Vienna, Austria) [
18]. ggplot2 was used for visualization [
19]. The statistical significance level was set to α = 0.05.
3. Results
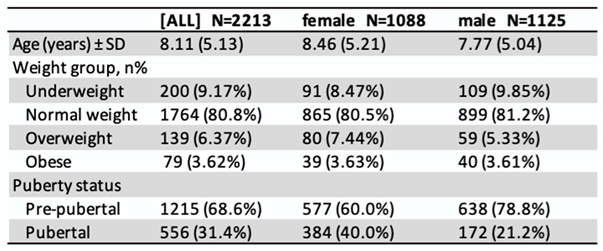
The distribution of sex, weight, and pubertal status of the study population at the time of their first visit is presented in
Table 1.
3.1. Variance of metabolites
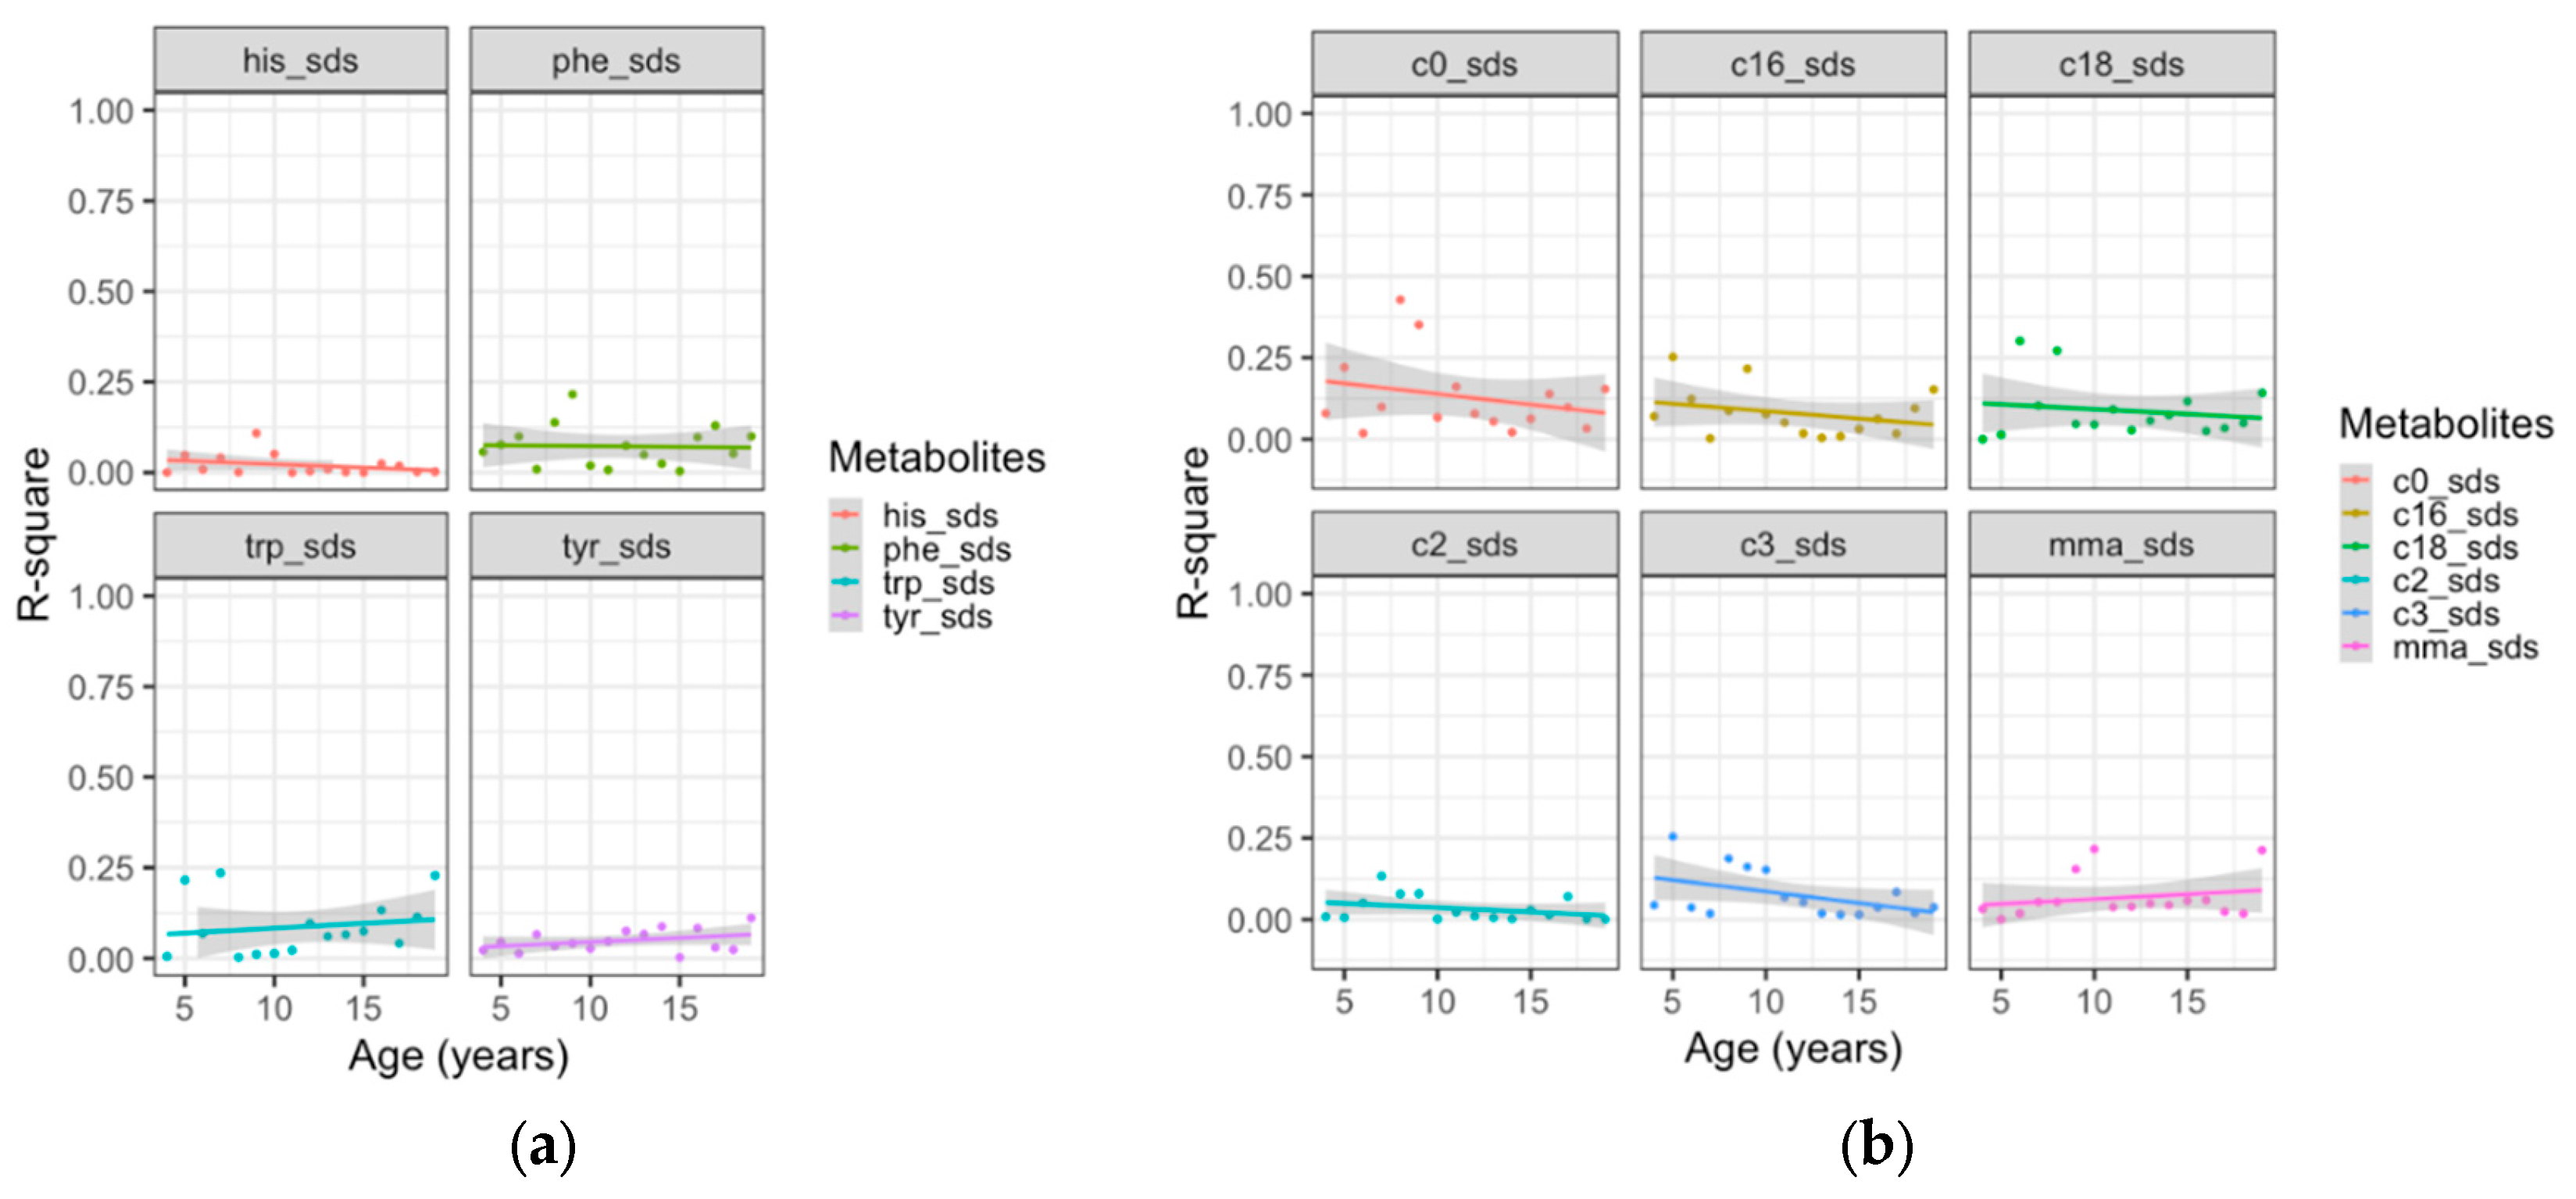
AAs and ACs showed low year-to-year correlations, indicating low longitudinal stability. As an example, we present the trend of yearly correlations across age for aromatic AAs and ACs in
Figure 1. The mean r
2-values of the aromatic AAs histidine (r
2=0.020), phenylalanine (r
2=0.072), tryptophan: (r
2=0.086) and tyrosine: (r
2=0.048) showed no significant change with age (p>0.05 for all), as did the mean values of free carnitine (r
2=0.129), and the ACs acetylcarnitine (r
2=0.032) propionylcarnitine (r
2=0.075) palmitoylcarnitine (r
2=0.079) stearoylcarnitine (r
2=0.087) and methylmalonyl carnitine: (r
2=0.067) (p>0.05 for all ACs). Results for the other AAs are provided in
Supplement Figure S1.
3.2. Metabolites and anthropometric parameters
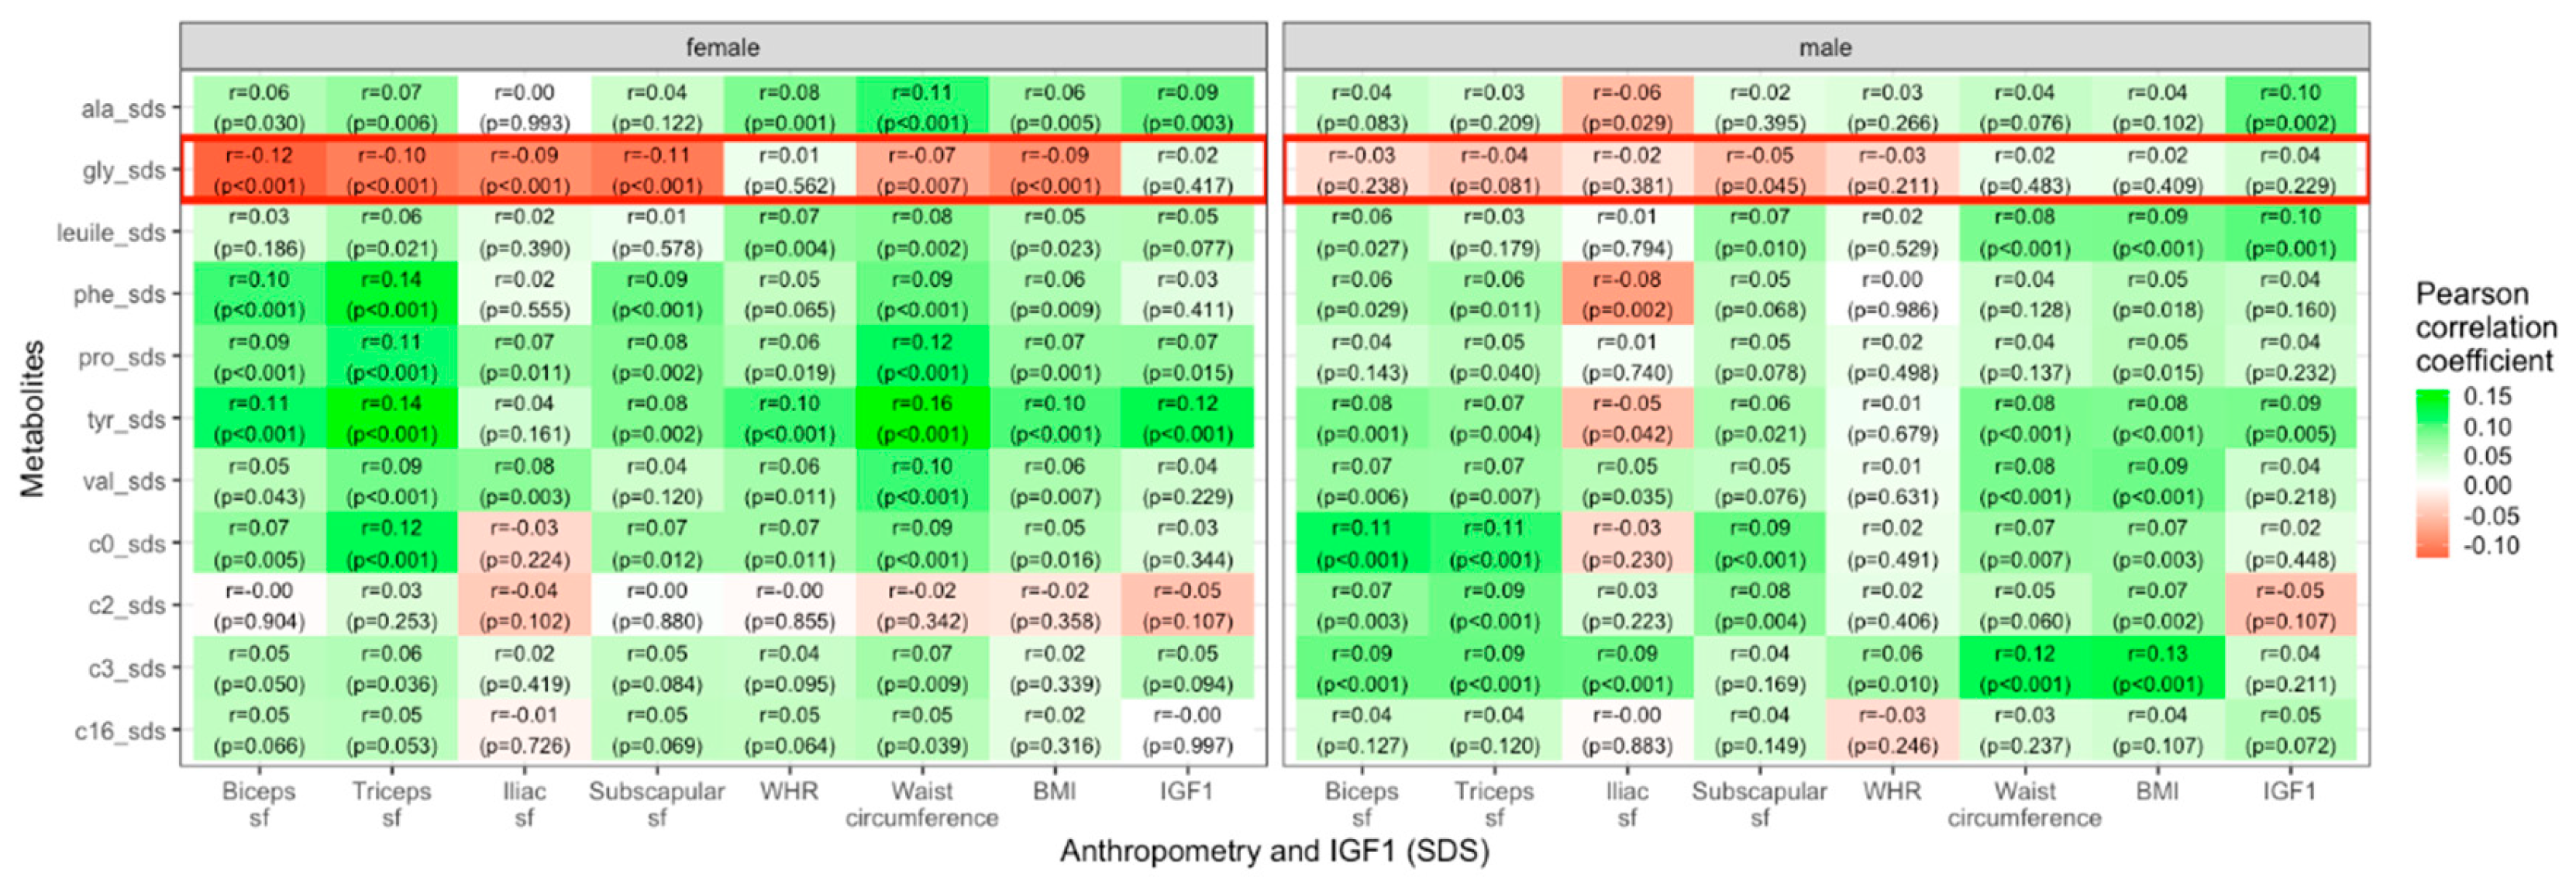
Most AAs and ACs were positively correlated with BMI, WHR, waist circumference, skinfold thicknesses and IGF1. In contrast, glycine showed negative correlations in female individuals with skinfold thicknesses of biceps (r = − 0.12, p < 0.001), triceps (r = − 0.11, p < 0.001), iliac crest (r = −0.09, p < 0.001), and subscapular (r = − 0.11, p < 0.001), as well as waist circumference (r = − 0.07, p = 0.007 and BMI (r = −0.09, p < 0.001). For males, the only significant correlation of glycine with an anthropometric parameter existed for subscapular skinfold thickness (r = − 0.05, p = 0.045). The association between metabolite concentrations and parameters of body fat distribution showed a weaker correlation for WHR in comparison to waist circumference. These findings are presented in
Figure 2.
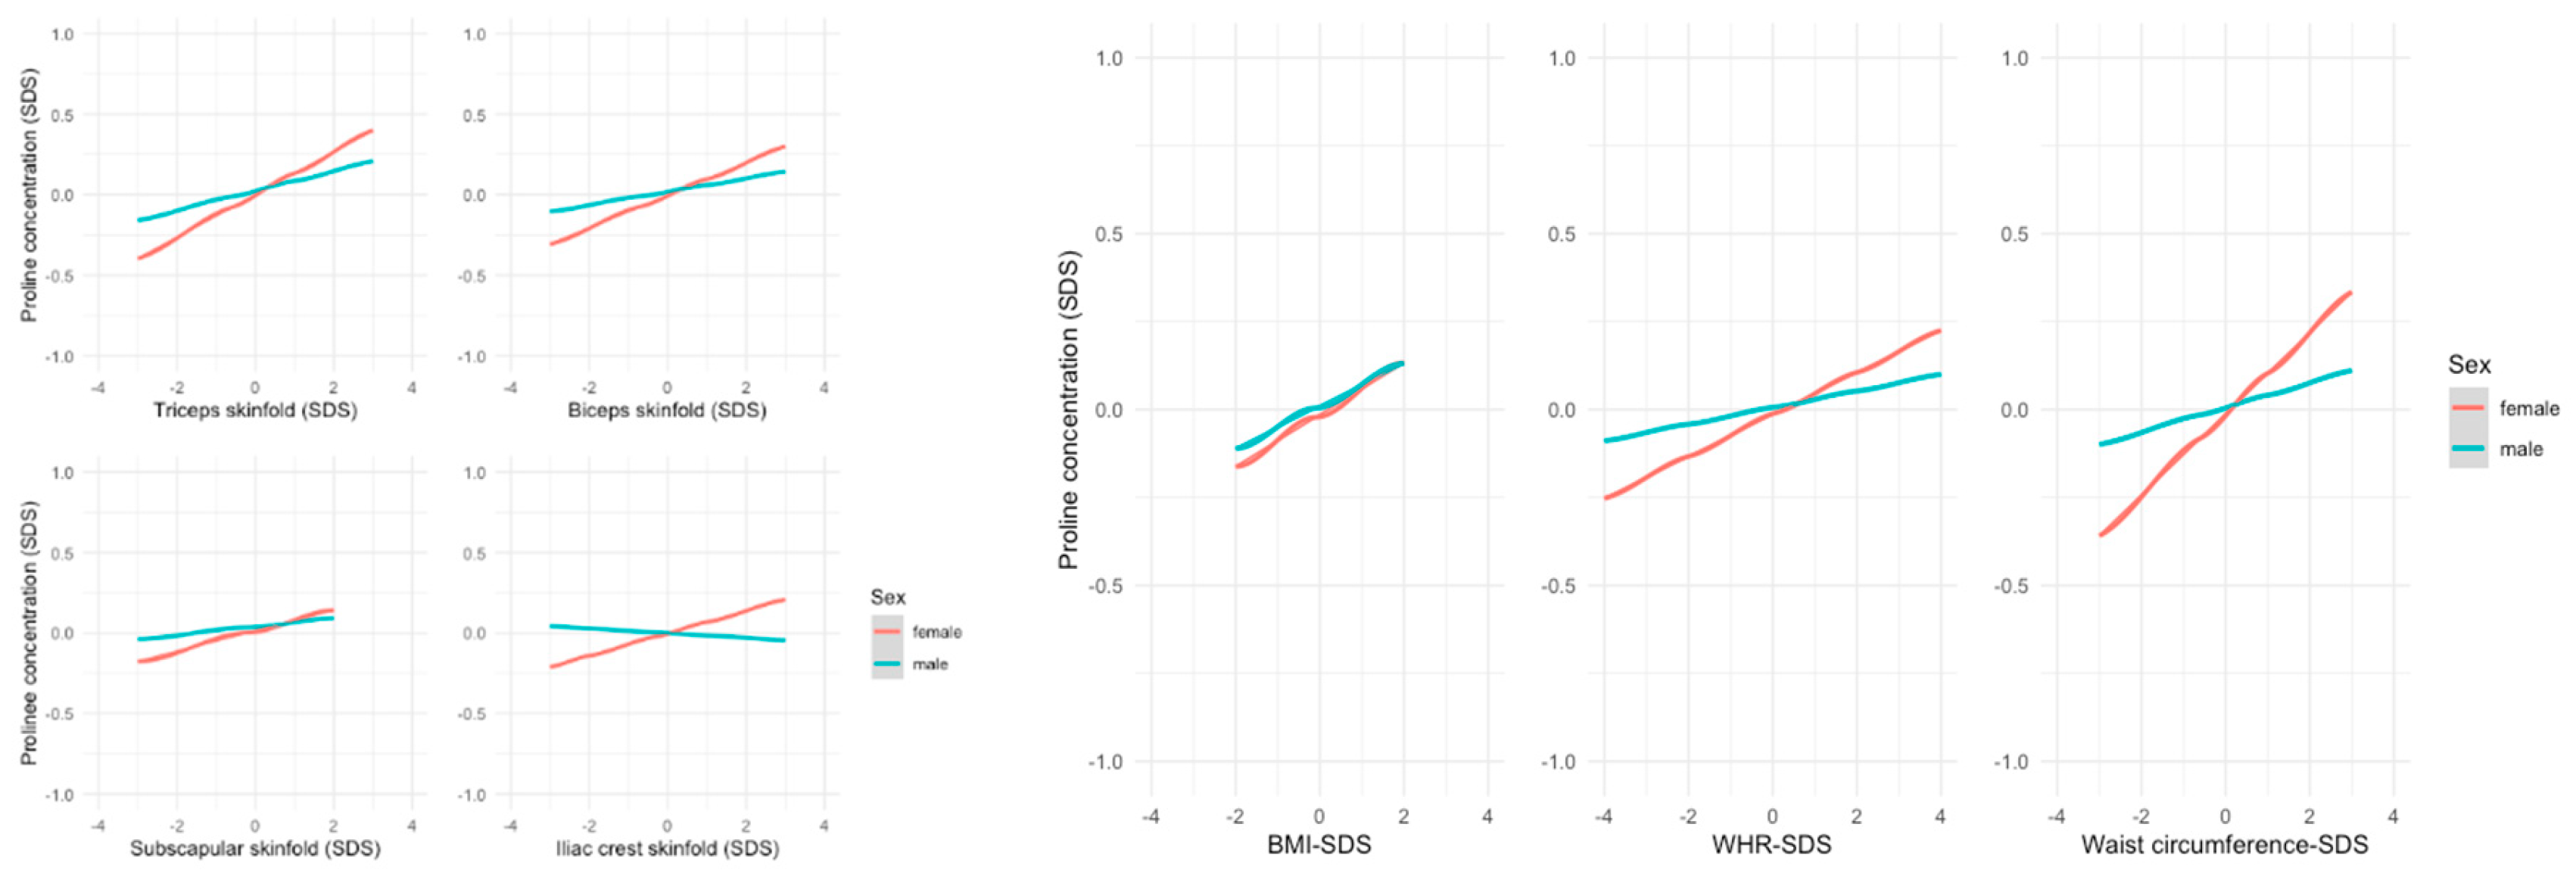
Alanine and proline showed stronger associations with almost all anthropometric measurements in females. The differences were highest for waist circumference (alanine: ß=0.107, p<0.01 in females vs. ß=0.045, p=0.079 in males; proline ß=0.115, p<0.001 in females vs. ß=0.035, p=0.196 in males –
Figure 3).
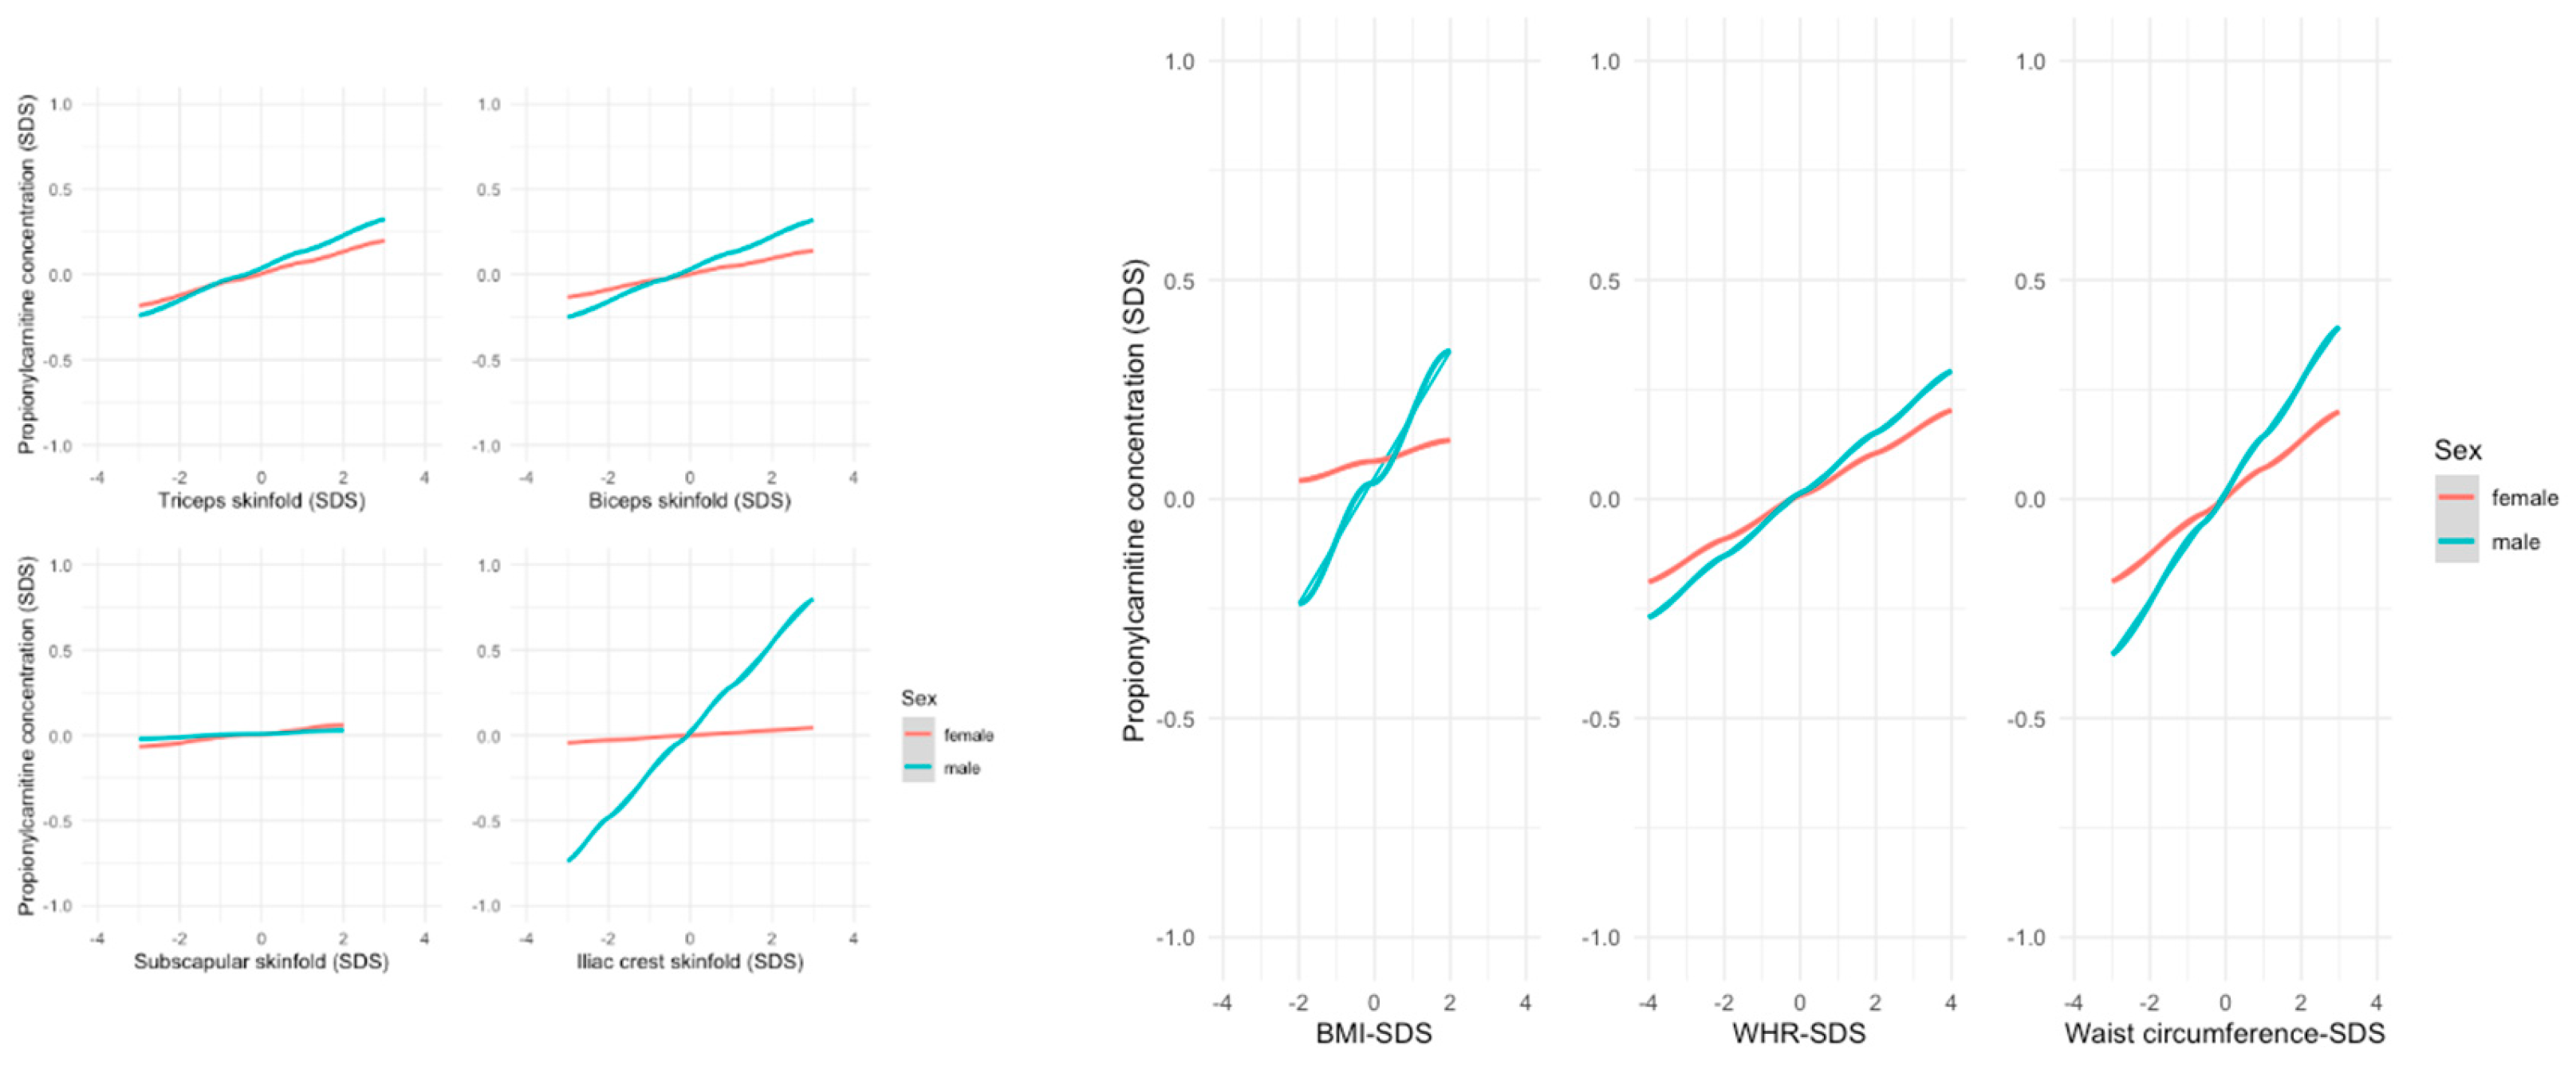
In contrast, the associations between the short-chain ACs acetylcarnitine (C2) resp. propionylcarnitine (C3) and various anthropometric parameters were stronger in males, e.g., biceps skinfold thickness (C2: ß= 0.084, p=0.005 in males vs. ß=-0.004, p=0.884 in females; C3 ß=0.095, p=0.002 in males vs ß=0.045, p=0.904 in females). The associations for C3 measurements are presented in
Figure 4.
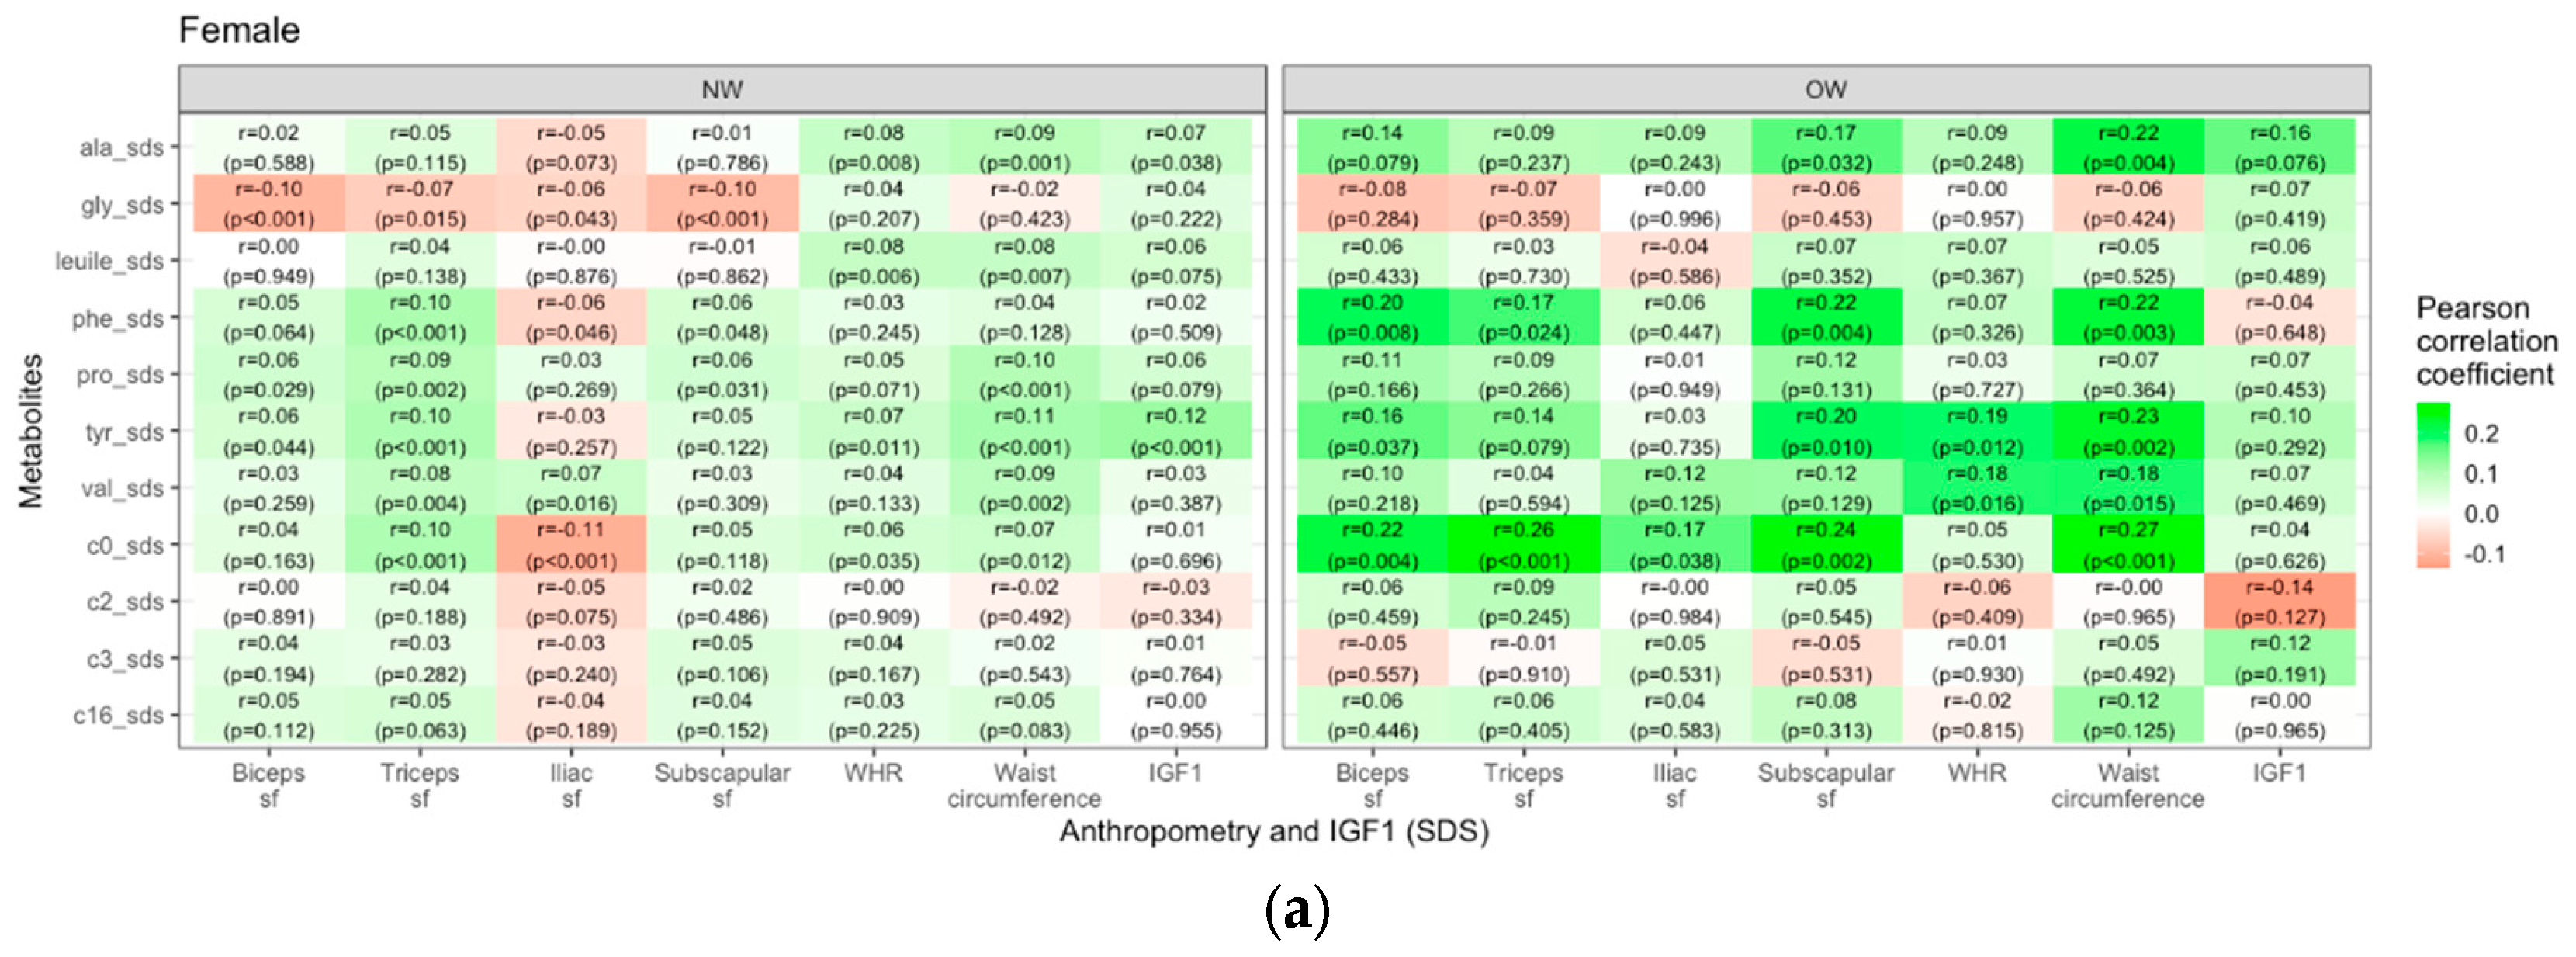
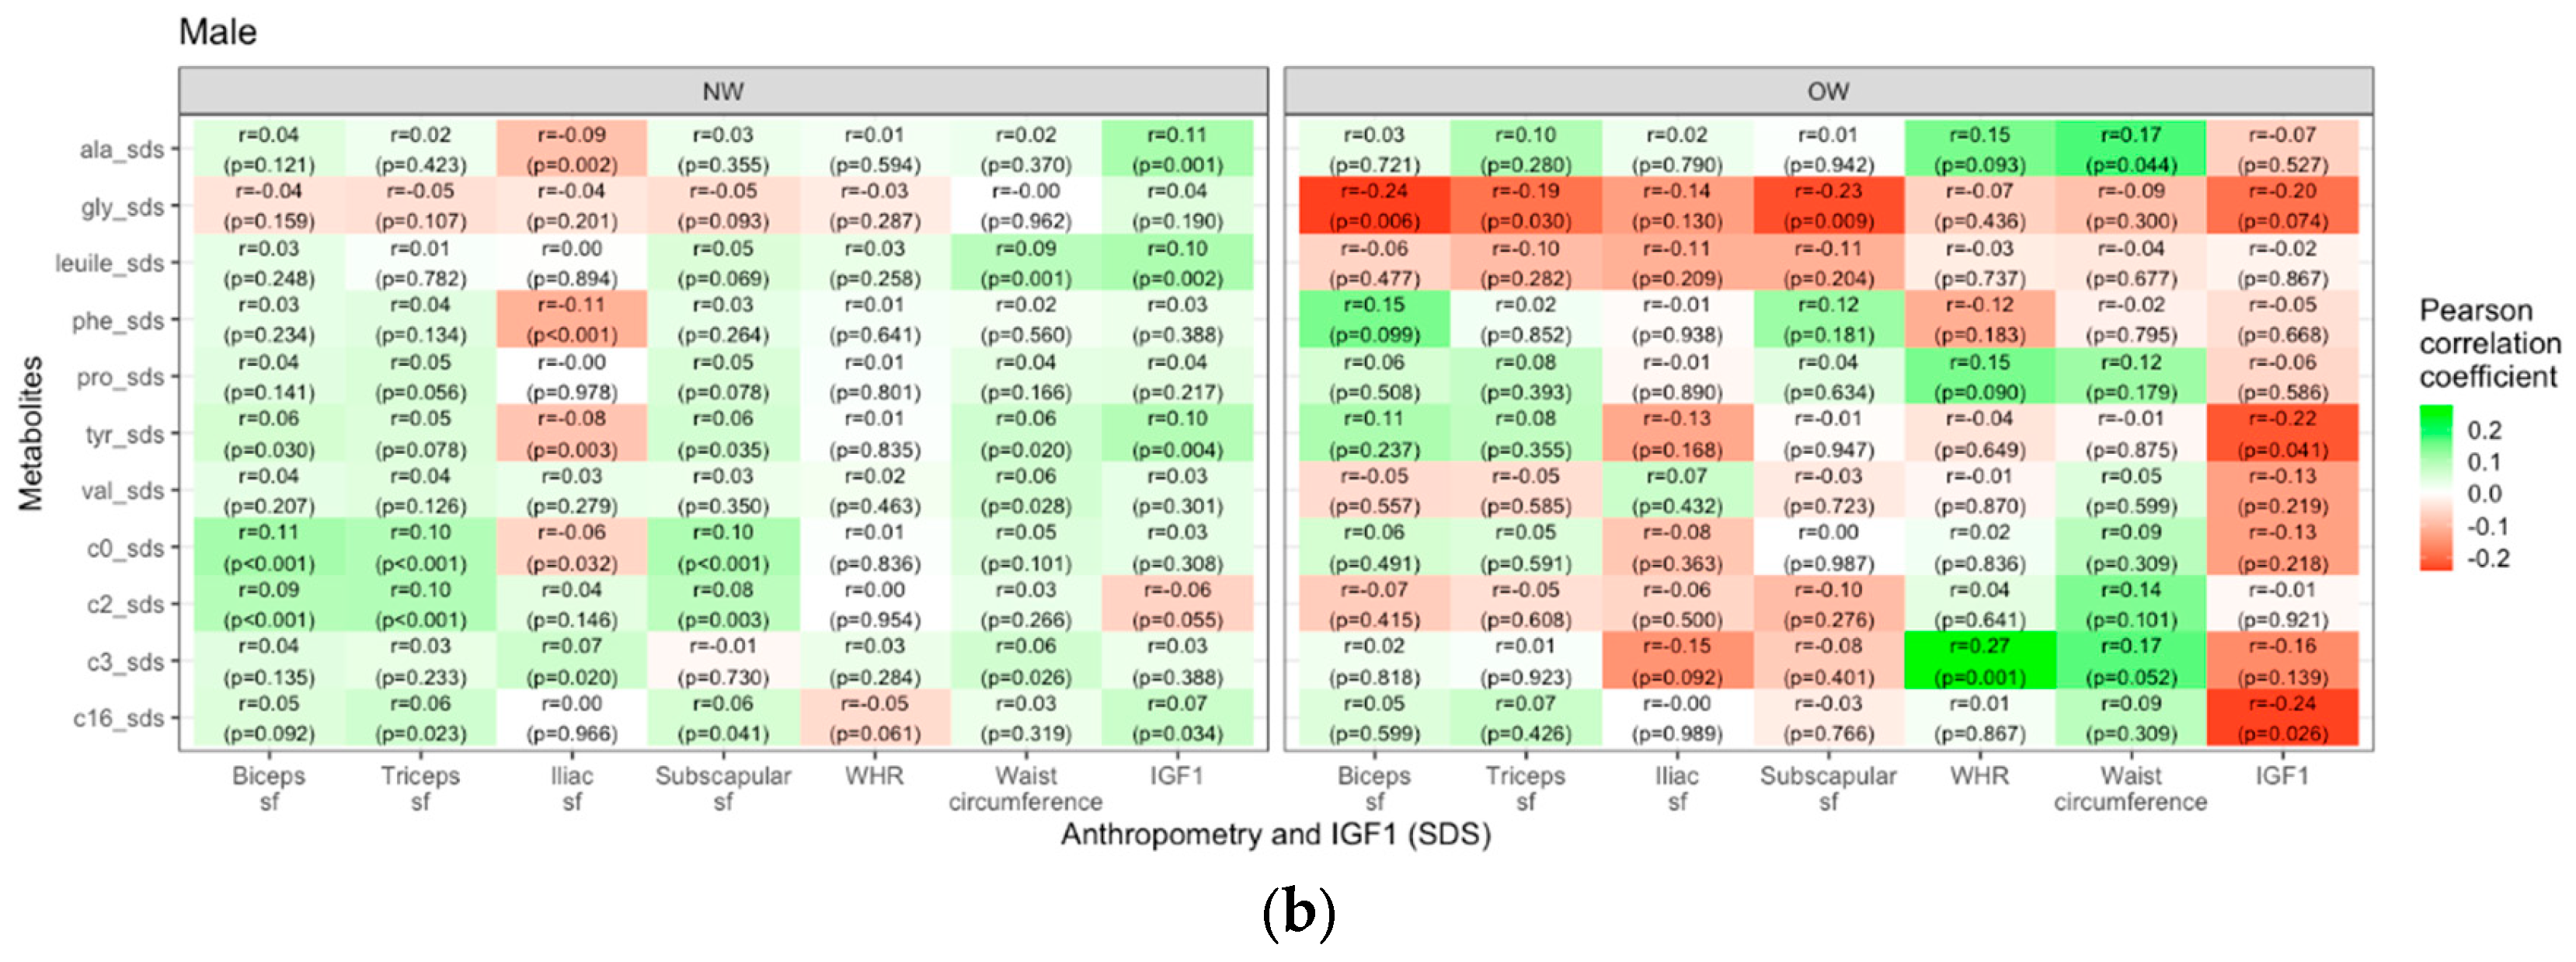
Lastly, we examined the interaction of weight group and puberty status on the relationship between metabolites and anthropometric parameters in boys and girls. Generally, in girls the overweight/obese group showed stronger positive correlations between metabolites and weight- and body-fat-related measures than the normal weight group, most prominently for C0. In contrast, for boys, there were no similar consistent patterns. Most prominently, glycine displayed negative correlations with skinfold thicknesses (r=-0.24, p=0.006 for biceps sf, r=-0.23, p=0.009 for subscapular sf and r=-0.19, p=0.03 for triceps sf). WHR only showed a few strong correlations with different metabolites, primarily in the female overweight/obese group (e.g. valine: r=0.18, p=0.016; tyrosine: r=0.19, p=0.12) and males (e.g. C3: r=0.27, p=0.01). In overweight/obese boys we found negative correlations of IGF1 with tyrosine (r=-0.22, p=0.041) and palmitoylcarnitinine (r=-0.24, p=0.026). The correlations are visualized as heatmaps showing the Pearson correlation coefficients (
Figure 5).
The differences in the associations between pre-pubertal and pubertal status were most prominent for glycine and ACs. The negative association between glycine and the anthropometric measures was stronger during puberty than before puberty in boys, whereas for girls the negative association existed before and during puberty. For ACs, there was a stronger association between metabolite concentrations and anthropometric parameters (except for BMI) during puberty in girls. Here, we found a positive correlation for prepubertal and pubertal girls (
Supplementary Figure S3).
4. Discussion
The investigation of AA and AC concentrations in children and adolescents presents a unique set of challenges due to the inherent complexity of influences during growth and development. Our study shows that metabolite concentrations underlie substantial within-person variations. Despite reducing the impact of confounding factors like age and sex by using SDS values, these changes were still present. This could be explained by the role of metabolites as being both regulated by and acting as a regulation tool for physiological processes, the varying demands of the body during adolescence, as well as changes in hormones and dietary intake, which all impact blood metabolite concentrations. An investigation in adults of the importance of pre-collection factors, such as time of day of blood collection, season, hours of fasting, and physical activity, showed only negligible differences regarding AA and AC concentrations [
20]. Another adult study showed WHR, sex, application of sex hormones, age, and hematocrit to be factors influencing metabolite concentrations [
21].
The influence of overweight and excess body fat on metabolite concentrations was a major topic in our study. A previous study found significant correlations between BMI and branched-chain (leucine/isoleucine, valine) and aromatic (phenylalanine, tyrosine) amino acids [
9] which is in line with our findings. We further assessed the influence of excess body fat and body fat distribution on metabolites by considering body-fat and body-fat-distribution related parameters. The measuring of subcutaneous fat through skinfold thickness measurements provides an estimation of total body fat percentage, whereas waist circumference is an indicator of core body fat and WHR serves a tool for evaluating body fat distribution, higher values suggesting a higher amount of abdominal/visceral fat that is associated with greater health risks [
22,
23]. The increase of many metabolite concentrations (BCAAs, aromatic amino acids, acylcarnitines) with increasing body-fat could be linked to diseases like hypertriglyceridemia and insulin resistance in adults and children [
7,
24,
25]. Our study confirmed these findings, showing that, in general, there were positive correlations between metabolite concentrations and the different skinfold thicknesses, waist circumference and BMI. We detected significant correlations between WHR and metabolite concentrations only for a few metabolites, supporting the hypothesis that in childhood, waist circumference might be a better predictor for high trunk fat mass than WHR [
26].
Glycine was an exception from the general trend of positive associations between metabolite concentrations and parameters of excess body fat in our study. We found glycine negatively associated with the markers of increased body fat. This was especially true for skinfold thicknesses in overweight/obese boys, whereas in girls, the association was found only in the normal weight group. The result is in line with other studies which found decreased glycine concentrations associated with metabolic disorders such as obesity, type 2 diabetes, and non-alcoholic fatty liver disease. Further, the improvement of insulin resistance also led to normalization of glycine concentration.
We found differences in the associations of metabolite concentrations and anthropometric measures between normal weight vs. overweight/obese individuals as well as between boys and girls. The association between higher metabolite concentrations and obesity was stronger in females [
29]. The increase of metabolite concentrations such as ACs and BCAAs and aromatic AAs was also observed in overweight/obese adults [
3,
30]. However, a defective fatty acid or amino acid metabolism , which can lead to incomplete fatty acid oxidation and further metabolic defects associated with obesity and diabetes, as seen in adults, was not seen in children. [
31,
32,
33,
34,
35] How a child’s fatty acid and glucose metabolism differs from those in adults is still not exactly understood. An explanation for the observed discrepancies might be that in children, metabolite concentrations can still be regulated more easily by the body, whereas in adults, these mechanisms are compromised by aging and prolonged co-morbidities, resulting in stronger alterations of metabolite concentrations in overweight adults. For example, higher mitochondrial adaptability and plasticity in young people are hypothesized to play a critical protective role. [
3,
31]
In adults, a negative association between IGF1 and obesity has been described in several studies [
36,
37]. However, there was also a study in which no significant correlation was observed [
38]. Furthermore, differences between men and women in the interplay of IGF1 and metabolite concentrations are described [
39]. In children, we could show that in overweight/obese boys, IGF1 correlated negatively with metabolite concentrations of tyrosine and the long-chain AC palmitoylcarnitine, whereas in overweight/obese girls, we found no significant correlation between metabolite concentrations and IGF1.
One strength of our study is the large sample size and homogeneity of our cohort of healthy children. Data collection and measurement of metabolites followed a standardized protocol, thus achieving a high internal validity and minimizing measurement distortions [
14]. Because most study participants live in Leipzig and are of German origin, there is only minimal influence of different ethnicities and living conditions. On the other hand, this homogeneity might limit the generalizability of our results for other ethnic or social groups. Additionally, although the children are deeply phenotyped and examined for health, there could still be undiagnosed diseases that might impact metabolite concentrations. Another advantage of our study is the availability of different parameters for body fat measurements like WHR, waist circumference and skinfold thicknesses. We can, therefore, provide a detailed and comprehensive analysis of the interplay between metabolite concentrations and excess body fat.
5. Conclusion
Integrating metabolite profiling with anthropometric parameters like skinfold thicknesses and waist circumference helps to support current research regarding body fat distribution, overweight and metabolic diseases. We showed that metabolite concentrations in children undergo significant changes during childhood and adolescence. Additionally, we identified sex-related differences in the associations between metabolite concentrations and anthropometric parameters associated with excess body fat. Future studies may identify pathways regulating metabolite concentrations in the human body. A deeper understanding of the underlying mechanisms can enhance disease prevention, early diagnosis and personalized treatment plans.
Supplementary Materials
The following supporting information can be downloaded at the website of this paper posted on Preprints.org. Table S1: Number of one year follow-up measurements by age; Figure S1: Linear trends of year-to-year correlations of consecutive metabolite concentration SDS across age for uncategorized AAs (a), non-proteinogenic AAs (b) and acidic AAs and BCAAs (c); Figure S3: Heatmap showing the Pearson correlations (green=positive, red=negative) between selected metabolite concentrations and anthropometric parameters in pre-pubertal and pubertal female (a) and male (b) children and adolescents. (sf=skinfold).
Author Contributions
Individual contributions to this manuscript are as follows: conceptualization, W.K., M.V .; methodology, W.K., M.V. (creation of models: R.J., M.V.); formal analysis, R.J., M.V. and A.G.; data curation, W.K., U.C.; writing—original draft preparation, R.J.; writing—review and editing, W.K.,U.C., M.V., A.G., R.J.; data analysis and visualization, R.J., M.V.; supervision, W.K. and M.V..; project administration, W.K.; funding acquisition, W.K.. All authors have read and agreed to the published version of the manuscript.
Funding
This publication is supported by LIFE - Leipzig Research Centre for Civilization Diseases, Leipzig University. LIFE is funded by the European Union, the European Regional Development Fund (ERDF) and the Free State of Saxony within the framework of the excellence initiative. Further, LIFE Child is supported by the BMBF, the Free State of Saxony as per the budget approved by the state parliament and Leipzig University’s Medical Faculty. Leipzig University’s Open-Access Publication Fund supported the publication of this manuscript as an open-access publication.
Institutional Review Board Statement
The study was conducted in accordance with the Declaration of Helsinki and approved by the Ethics Committee of the University of Leipzig (reference number: Reg. No. 264-10-19042010). The study is registered at ClinicalTrials.gov (NCT02550236).
Informed Consent Statement
Informed consent was obtained from all subjects involved in the study.
Data Availability Statement
The dataset presented in this article cannot be shared publicly because of ethical and legal restrictions. The LIFE Child study is a study collecting potentially sensitive information. Publishing data is not covered by the informed consent provided by the study participants. Furthermore, the data protection concept of LIFE requires all (external as well as internal) researchers interested in accessing data to sign a project agreement. Researchers interested in accessing data from the LIFE Child study may contact the study by writing to forschungsdaten@medizin.uni-leipzig.de.
Acknowledgments
We kindly thank all participants and their families, the LIFE study teams, the medical students, and the laboratory team from the Institute of Laboratory Medicine, Clinical Chemistry, and Molecular Diagnostics at Leipzig University for their contributions. We are grateful to Roche Diagnostics Germany and IDS Germany for a grant to analyze samples to determine IGF-I free of charge.
Conflicts of Interest
The authors declare no conflict of interest. The funders had no role in the design of the study; in the collection, analyses, or interpretation of data; in the writing of the manuscript; or in the decision to publish the results.
References
- Spiekerkoetter, U.; Krude, H. Target Diseases for Neonatal Screening in Germany. Dtsch Arztebl Int 2022, 119, 306–316. [CrossRef]
- Mihalik, S.J.; Goodpaster, B.H.; Kelley, D.E.; Chace, D.H.; Vockley, J.; Toledo, F.G.S.; DeLany, J.P. Increased Levels of Plasma Acylcarnitines in Obesity and Type 2 Diabetes and Identification of a Marker of Glucolipotoxicity. Obesity (Silver Spring) 2010, 18, 1695–1700. [CrossRef]
- Newgard, C.B.; An, J.; Bain, J.R.; Muehlbauer, M.J.; Stevens, R.D.; Lien, L.F.; Haqq, A.M.; Shah, S.H.; Arlotto, M.; Slentz, C.A.; et al. A Branched-Chain Amino Acid-Related Metabolic Signature That Differentiates Obese and Lean Humans and Contributes to Insulin Resistance. Cell Metab 2009, 9, 311–326. [CrossRef]
- Wang, T.J.; Larson, M.G.; Vasan, R.S.; Cheng, S.; Rhee, E.P.; McCabe, E.; Lewis, G.D.; Fox, C.S.; Jacques, P.F.; Fernandez, C.; et al. Metabolite Profiles and the Risk of Developing Diabetes. Nat Med 2011, 17, 448–453. [CrossRef]
- Tong, L.; Tian, M.; Ma, X.; Bai, L.; Zhou, J.; Ding, W. Metabolome Profiling and Pathway Analysis in Metabolically Healthy and Unhealthy Obesity among Chinese Adolescents Aged 11-18 Years. Metabolites 2023, 13, 641. [CrossRef]
- Qu, H.-Q.; Glessner, J.; Qu, J.; Gilhool, S.; Mentch, F.; Campbell, I.; Sleiman, P.; Connolly, J.J.; Hakonarson, H.; IHCC consortium Metabolomic Profiling of Samples from Pediatric Patients with Asthma Unveils Deficient Nutrients in African Americans. iScience 2022, 25, 104650. [CrossRef]
- McCormack, S.E.; Shaham, O.; McCarthy, M.A.; Deik, A.A.; Wang, T.J.; Gerszten, R.E.; Clish, C.B.; Mootha, V.K.; Grinspoon, S.K.; Fleischman, A. Circulating Branched-Chain Amino Acid Concentrations Are Associated with Obesity and Future Insulin Resistance in Children and Adolescents: Branched-Chain Amino Acids and IR in Children. Pediatric Obesity 2013, 8, 52–61. [CrossRef]
- Perng, W.; Gillman, M.W.; Fleisch, A.F.; Michalek, R.D.; Watkins, S.M.; Isganaitis, E.; Patti, M.-E.; Oken, E. Metabolomic Profiles and Childhood Obesity. Obesity (Silver Spring) 2014, 22, 2570–2578. [CrossRef]
- Hirschel, J.; Vogel, M.; Baber, R.; Garten, A.; Beuchel, C.; Dietz, Y.; Dittrich, J.; Körner, A.; Kiess, W.; Ceglarek, U. Relation of Whole Blood Amino Acid and Acylcarnitine Metabolome to Age, Sex, BMI, Puberty, and Metabolic Markers in Children and Adolescents. Metabolites 2020, 10, 149. [CrossRef]
- Quante, M.; Hesse, M.; Döhnert, M.; Fuchs, M.; Hirsch, C.; Sergeyev, E.; Casprzig, N.; Geserick, M.; Naumann, S.; Koch, C.; et al. The LIFE Child Study: A Life Course Approach to Disease and Health. BMC Public Health 2012, 12, 1021. [CrossRef]
- the LIFE Child study team; Poulain, T.; Baber, R.; Vogel, M.; Pietzner, D.; Kirsten, T.; Jurkutat, A.; Hiemisch, A.; Hilbert, A.; Kratzsch, J.; et al. The LIFE Child Study: A Population-Based Perinatal and Pediatric Cohort in Germany. Eur J Epidemiol 2017, 32, 145–158. [CrossRef]
- Rönnecke, E.; Vogel, M.; Bussler, S.; Grafe, N.; Jurkutat, A.; Schlingmann, M.; Koerner, A.; Kiess, W. Age- and Sex-Related Percentiles of Skinfold Thickness, Waist and Hip Circumference, Waist-to-Hip Ratio and Waist-to-Height Ratio: Results from a Population-Based Pediatric Cohort in Germany (LIFE Child). Obes Facts 2019, 12, 25–39. [CrossRef]
- Ceglarek, U.; Müller, P.; Stach, B.; Bührdel, P.; Thiery, J.; Kiess, W. Validation of the Phenylalanine/Tyrosine Ratio Determined by Tandem Mass Spectrometry: Sensitive Newborn Screening for Phenylketonuria. Clinical Chemistry and Laboratory Medicine 2002, 40. [CrossRef]
- Hörenz, C.; Vogel, M.; Wirkner, K.; Ceglarek, U.; Thiery, J.; Pfäffle, R.; Kiess, W.; Kratzsch, J. BMI and Contraceptives Affect New Age-, Sex-, and Puberty-Adjusted IGF-I and IGFBP-3 Reference Ranges Across Life Span. The Journal of Clinical Endocrinology & Metabolism 2022, 107, e2991–e3002. [CrossRef]
- Hoerenz C, Vogel M, Wirkner K. BMI and Contraceptives Affect New Age-, Sex-, and Puberty-Adjusted IGF-I and IGFBP-3 Refe.
- Kromeyer-Hauschild, K.; Wabitsch, M.; Kunze, D.; Geller, F.; Geiß, H.C.; Hesse, V.; von Hippel, A.; Jaeger, U.; Johnsen, D.; Korte, W.; et al. Perzentile für den Body-mass-Index für das Kindes- und Jugendalter unter Heranziehung verschiedener deutscher Stichproben. Monatsschr Kinderheilkd 2001, 149, 807–818. [CrossRef]
- Moß, A.; Kunze, D.; Wabitsch, M. Evidenzbasierte Leitlinie der Arbeitsgemeinschaft Adipositas im Kindes- und Jugendalter zur Therapie der Adipositas im Kindes- und Jugendalter. Bundesgesundheitsbl. 2011, 54, 584–590. [CrossRef]
- R Core Team (2022). R: A Language and Environment for Statistical.
- H. Wickham. Ggplot2: Elegant Graphics for Data Analysis. Springer-Verlag New York, 2016.
- Hardikar, S.; Albrechtsen, R.D.; Achaintre, D.; Lin, T.; Pauleck, S.; Playdon, M.; Holowatyj, A.N.; Gigic, B.; Schrotz-King, P.; Boehm, J.; et al. Impact of Pre-Blood Collection Factors on Plasma Metabolomic Profiles. Metabolites 2020, 10, 213. [CrossRef]
- Beuchel, C.; Becker, S.; Dittrich, J.; Kirsten, H.; Toenjes, A.; Stumvoll, M.; Loeffler, M.; Thiele, H.; Beutner, F.; Thiery, J.; et al. Clinical and Lifestyle Related Factors Influencing Whole Blood Metabolite Levels – A Comparative Analysis of Three Large Cohorts. Molecular Metabolism 2019, 29, 76–85. [CrossRef]
- Staiano, A.E.; Katzmarzyk, P.T. Ethnic and Sex Differences in Body Fat and Visceral and Subcutaneous Adiposity in Children and Adolescents. Int J Obes 2012, 36, 1261–1269. [CrossRef]
- Waist Circumference and Waist–Hip Ratio: Report of a WHO Expert Consultation, Geneva, 8–11 December 2008.
- Wahl, S.; Yu, Z.; Kleber, M.; Singmann, P.; Holzapfel, C.; He, Y.; Mittelstrass, K.; Polonikov, A.; Prehn, C.; Römisch-Margl, W.; et al. Childhood Obesity Is Associated with Changes in the Serum Metabolite Profile. Obes Facts 2012, 5, 660–670. [CrossRef]
- Moran-Ramos, S.; Ocampo-Medina, E.; Gutierrez-Aguilar, R.; Macías-Kauffer, L.; Villamil-Ramírez, H.; López-Contreras, B.E.; León-Mimila, P.; Vega-Badillo, J.; Gutierrez-Vidal, R.; Villarruel-Vazquez, R.; et al. An Amino Acid Signature Associated with Obesity Predicts 2-Year Risk of Hypertriglyceridemia in School-Age Children. Sci Rep 2017, 7, 5607. [CrossRef]
- Taylor, R.W.; Jones, I.E.; Williams, S.M.; Goulding, A. Evaluation of Waist Circumference, Waist-to-Hip Ratio, and the Conicity Index as Screening Tools for High Trunk Fat Mass, as Measured by Dual-Energy X-Ray Absorptiometry, in Children Aged 3–19 y. The American Journal of Clinical Nutrition 2000, 72, 490–495. [CrossRef]
- Adeva-Andany, M.; Souto-Adeva, G.; Ameneiros-Rodríguez, E.; Fernández-Fernández, C.; Donapetry-García, C.; Domínguez-Montero, A. Insulin Resistance and Glycine Metabolism in Humans. Amino Acids 2018, 50, 11–27. [CrossRef]
- Alves, A.; Bassot, A.; Bulteau, A.-L.; Pirola, L.; Morio, B. Glycine Metabolism and Its Alterations in Obesity and Metabolic Diseases. Nutrients 2019, 11, 1356. [CrossRef]
- Azab, S.M.; Shanmuganathan, M.; de Souza, R.J.; Kroezen, Z.; Desai, D.; Williams, N.C.; Morrison, K.M.; Atkinson, S.A.; Teo, K.K.; Azad, M.B.; et al. Early Sex-Dependent Differences in Metabolic Profiles of Overweight and Adiposity in Young Children: A Cross-Sectional Analysis. BMC Med 2023, 21, 176. [CrossRef]
- Kim, J.Y.; Park, J.Y.; Kim, O.Y.; Ham, B.M.; Kim, H.-J.; Kwon, D.Y.; Jang, Y.; Lee, J.H. Metabolic Profiling of Plasma in Overweight/Obese and Lean Men Using Ultra Performance Liquid Chromatography and Q-TOF Mass Spectrometry (UPLC−Q-TOF MS). J. Proteome Res. 2010, 9, 4368–4375. [CrossRef]
- Mihalik, S.J.; Michaliszyn, S.F.; de las Heras, J.; Bacha, F.; Lee, S.; Chace, D.H.; DeJesus, V.R.; Vockley, J.; Arslanian, S.A. Metabolomic Profiling of Fatty Acid and Amino Acid Metabolism in Youth with Obesity and Type 2 Diabetes: Evidence for Enhanced Mitochondrial Oxidation. Diabetes Care 2012, 35, 605–611. [CrossRef]
- Adams, S.H.; Hoppel, C.L.; Lok, K.H.; Zhao, L.; Wong, S.W.; Minkler, P.E.; Hwang, D.H.; Newman, J.W.; Garvey, W.T. Plasma Acylcarnitine Profiles Suggest Incomplete Long-Chain Fatty Acid β-Oxidation and Altered Tricarboxylic Acid Cycle Activity in Type 2 Diabetic African-American Women. The Journal of Nutrition 2009, 139, 1073–1081. [CrossRef]
- Maffeis, C.; Pinelli, L.; Schutz, Y. Increased Fat Oxidation in Prepubertal Obese Children: A Metabolic Defense against Further Weight Gain? The Journal of Pediatrics 1995, 126, 15–20. [CrossRef]
- Kelley, D.E.; He, J.; Menshikova, E.V.; Ritov, V.B. Dysfunction of Mitochondria in Human Skeletal Muscle in Type 2 Diabetes. Diabetes 2002, 51, 2944–2950. [CrossRef]
- Butte, N.F.; Liu, Y.; Zakeri, I.F.; Mohney, R.P.; Mehta, N.; Voruganti, V.S.; Göring, H.; Cole, S.A.; Comuzzie, A.G. Global Metabolomic Profiling Targeting Childhood Obesity in the Hispanic Population. The American Journal of Clinical Nutrition 2015, 102, 256–267. [CrossRef]
- Kubo, H.; Sawada, S.; Satoh, M.; Asai, Y.; Kodama, S.; Sato, T.; Tomiyama, S.; Seike, J.; Takahashi, K.; Kaneko, K.; et al. Insulin-like Growth Factor-1 Levels Are Associated with High Comorbidity of Metabolic Disorders in Obese Subjects; a Japanese Single-Center, Retrospective-Study. Sci Rep 2022, 12, 20130. [CrossRef]
- Juiz-Valiña, P.; Pena-Bello, L.; Cordido, M.; Outeiriño-Blanco, E.; Pértega, S.; Varela-Rodriguez, B.; Garcia-Brao, M.J.; Mena, E.; Sangiao-Alvarellos, S.; Cordido, F. Altered GH-IGF-1 Axis in Severe Obese Subjects Is Reversed after Bariatric Surgery-Induced Weight Loss and Related with Low-Grade Chronic Inflammation. JCM 2020, 9, 2614. [CrossRef]
- Nam, S.; Lee, E.; Kim, K.; Cha, B.; Song, Y.; Lim, S.; Lee, H.; Huh, K. Effect of Obesity on Total and Free Insulin-like Growth Factor (IGF)-1, and Their Relationship to IGF-Binding Protein (BP)-1, IGFBP-2, IGFBP-3, Insulin, and Growth Hormone. Int J Obes 1997, 21, 355–359. [CrossRef]
- Knacke, H.; Pietzner, M.; Do, K.T.; Römisch-Margl, W.; Kastenmüller, G.; Völker, U.; Völzke, H.; Krumsiek, J.; Artati, A.; Wallaschofski, H.; et al. Metabolic Fingerprints of Circulating IGF-1 and the IGF-1/IGFBP-3 Ratio: A Multifluid Metabolomics Study. The Journal of Clinical Endocrinology & Metabolism 2016, 101, 4730–4742. [CrossRef]
|
Disclaimer/Publisher’s Note: The statements, opinions and data contained in all publications are solely those of the individual author(s) and contributor(s) and not of MDPI and/or the editor(s). MDPI and/or the editor(s) disclaim responsibility for any injury to people or property resulting from any ideas, methods, instructions or products referred to in the content. |
© 2023 by the authors. Licensee MDPI, Basel, Switzerland. This article is an open access article distributed under the terms and conditions of the Creative Commons Attribution (CC BY) license (http://creativecommons.org/licenses/by/4.0/).
