1. Introduction
Paracetamol or acetaminophen (N-acetyl-para-aminophenol, APAP) is one of the most used drugs worldwide, famous for its analgesic and antipyretic action. Available in a wide variety of pharmaceutical forms, APAP is principally administered for the treatment of cold, fever, acute or chronic sorrow, especially in patients in whom non-steroidal anti-inflammatory drugs (NSAIDs) are contraindicated [
1]. Nonetheless, recent evidence estimates that APAP causes the 6% of poisonings worldwide [
2], due to acute and/or chronic overdose. Acute overdose is a common form of suicide, due to APAP low cost and accessibility; chronic overdose is usually unintentional and happens as a result of therapeutic misuse and prolonged excessive dosing [
3]. The most dangerous outcome of APAP poisoning is severe liver injury, caused by the metabolic conversion to N-acetyl-p-benzoquinone imine, which results in glutathione (GSH) depletion and covalent binding to proteins, subsequently leading to protein nitration and mitochondrial permeability transition; ultimately inducing oxidative stress, cell death and loss of liver function [
4]. APAP overdose also causes alterations in brain functions that have long been considered side effects of liver damage [
5].
In the brain, APAP crosses the blood barrier but its mechanism of action is still under debate [
6]. APAP mainly acts in the central nervous system reducing the active form of cyclooxygenase (COX) 1 and 2, dampening the prostaglandin release and the activation of the inflammatory response [
3]. Unlike other NSAIDs, APAP does not inhibit COX activity in the periphery, which reduces its side effects. Recent evidence shows that APAP efficacy may depend on its transformation into AM404, an active metabolite that activates transient receptor potential vanilloid-1 (TRPV1) and inhibits endocannabinoid anandamide (AEA) reuptake from the synaptic cleft [
7]. However, recent evidence demonstrates that brain alterations occurring after APAP overdose may depend on the on-site APAP metabolism into toxic metabolite and GSH depletion, generation of oxidative stress and dose-dependent increase of cell mortality [
3].
Neurogenesis is a life-long process by which neural progenitor or stem cells proliferate and differentiate into new neurons. The subventricular zone (SVZ) and subgranular zone (SGZ) are the best characterized neurogenic niches in the adult rodent brain; however, adult neurogenesis in rodents is not restricted to these areas, being demonstrated in other brain regions such as the hypothalamus, substantial nigra and amygdala [
8].
A large body of evidence suggests a role of APAP overdose in neurodevelopmental impairment [
9,
10,
11]. Nevertheless, few studies relate adult neurogenesis to paracetamol overdose toxicity. In this sense, it is known that APAP metabolite AM404 is a suppressor of hippocampal cell proliferation [
12] and can affect hippocampal neurogenesis through TRPV-1-dependent mechanisms [
13].
This study aims to evaluate the effect of repeated overdose of APAP on the proliferation of neural stem cells and the survival of mature neurons at different time points (6 hours, 6 days and 15 days), to evaluate its impact on adult neurogenesis in the SGZ of hippocampus and hypothalamus, brain regions related to cognitive processes (learning and memory) and metabolic functions respectively [
8]. Also, we evaluated APAP overdose effect on c-Fos expression in the interested areas, knowing that its activation is required for synaptic plasticity and learning [
14]. Moreover, considering previous evidence obtained in our laboratory which suggests that paracetamol-induced liver injury provokes alterations in inflammatory pathways [
15,
16], we studied the expression of glial fibrillar acidic protein (GFAP), which is a recognized marker of neuroinflammation, as well as an astrocyte precursor in the adult neurogenic niches [
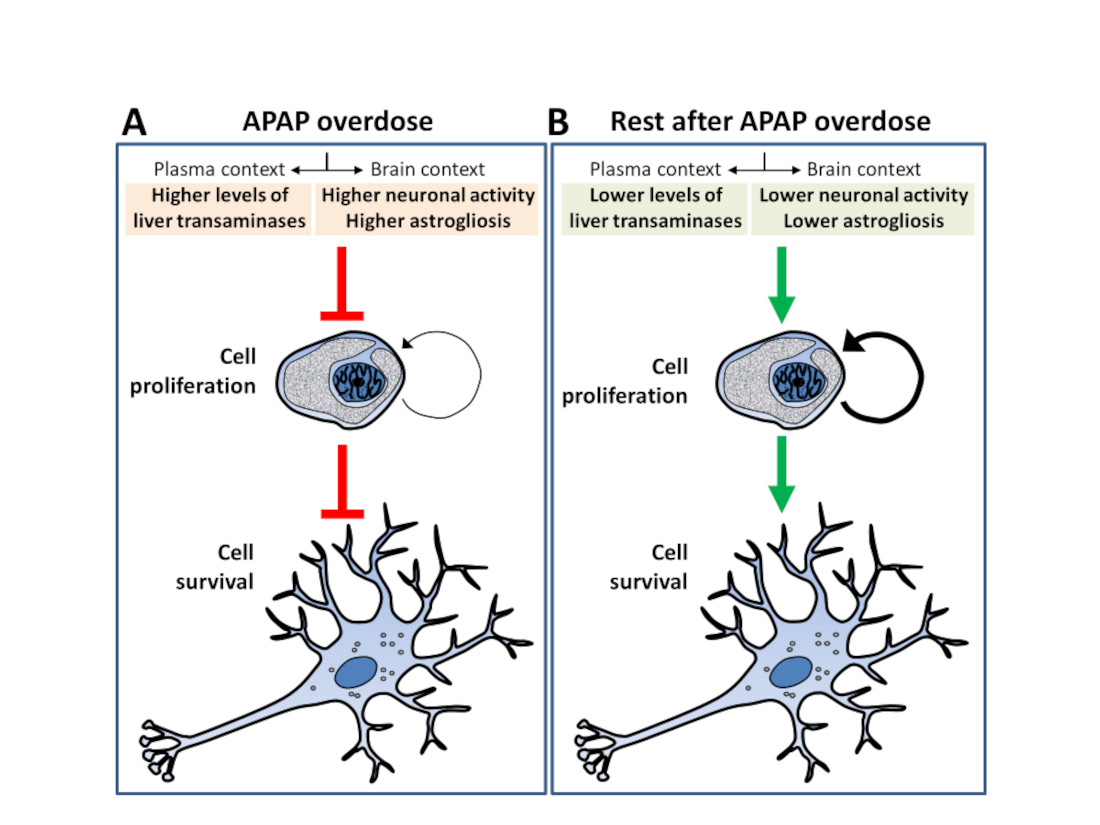
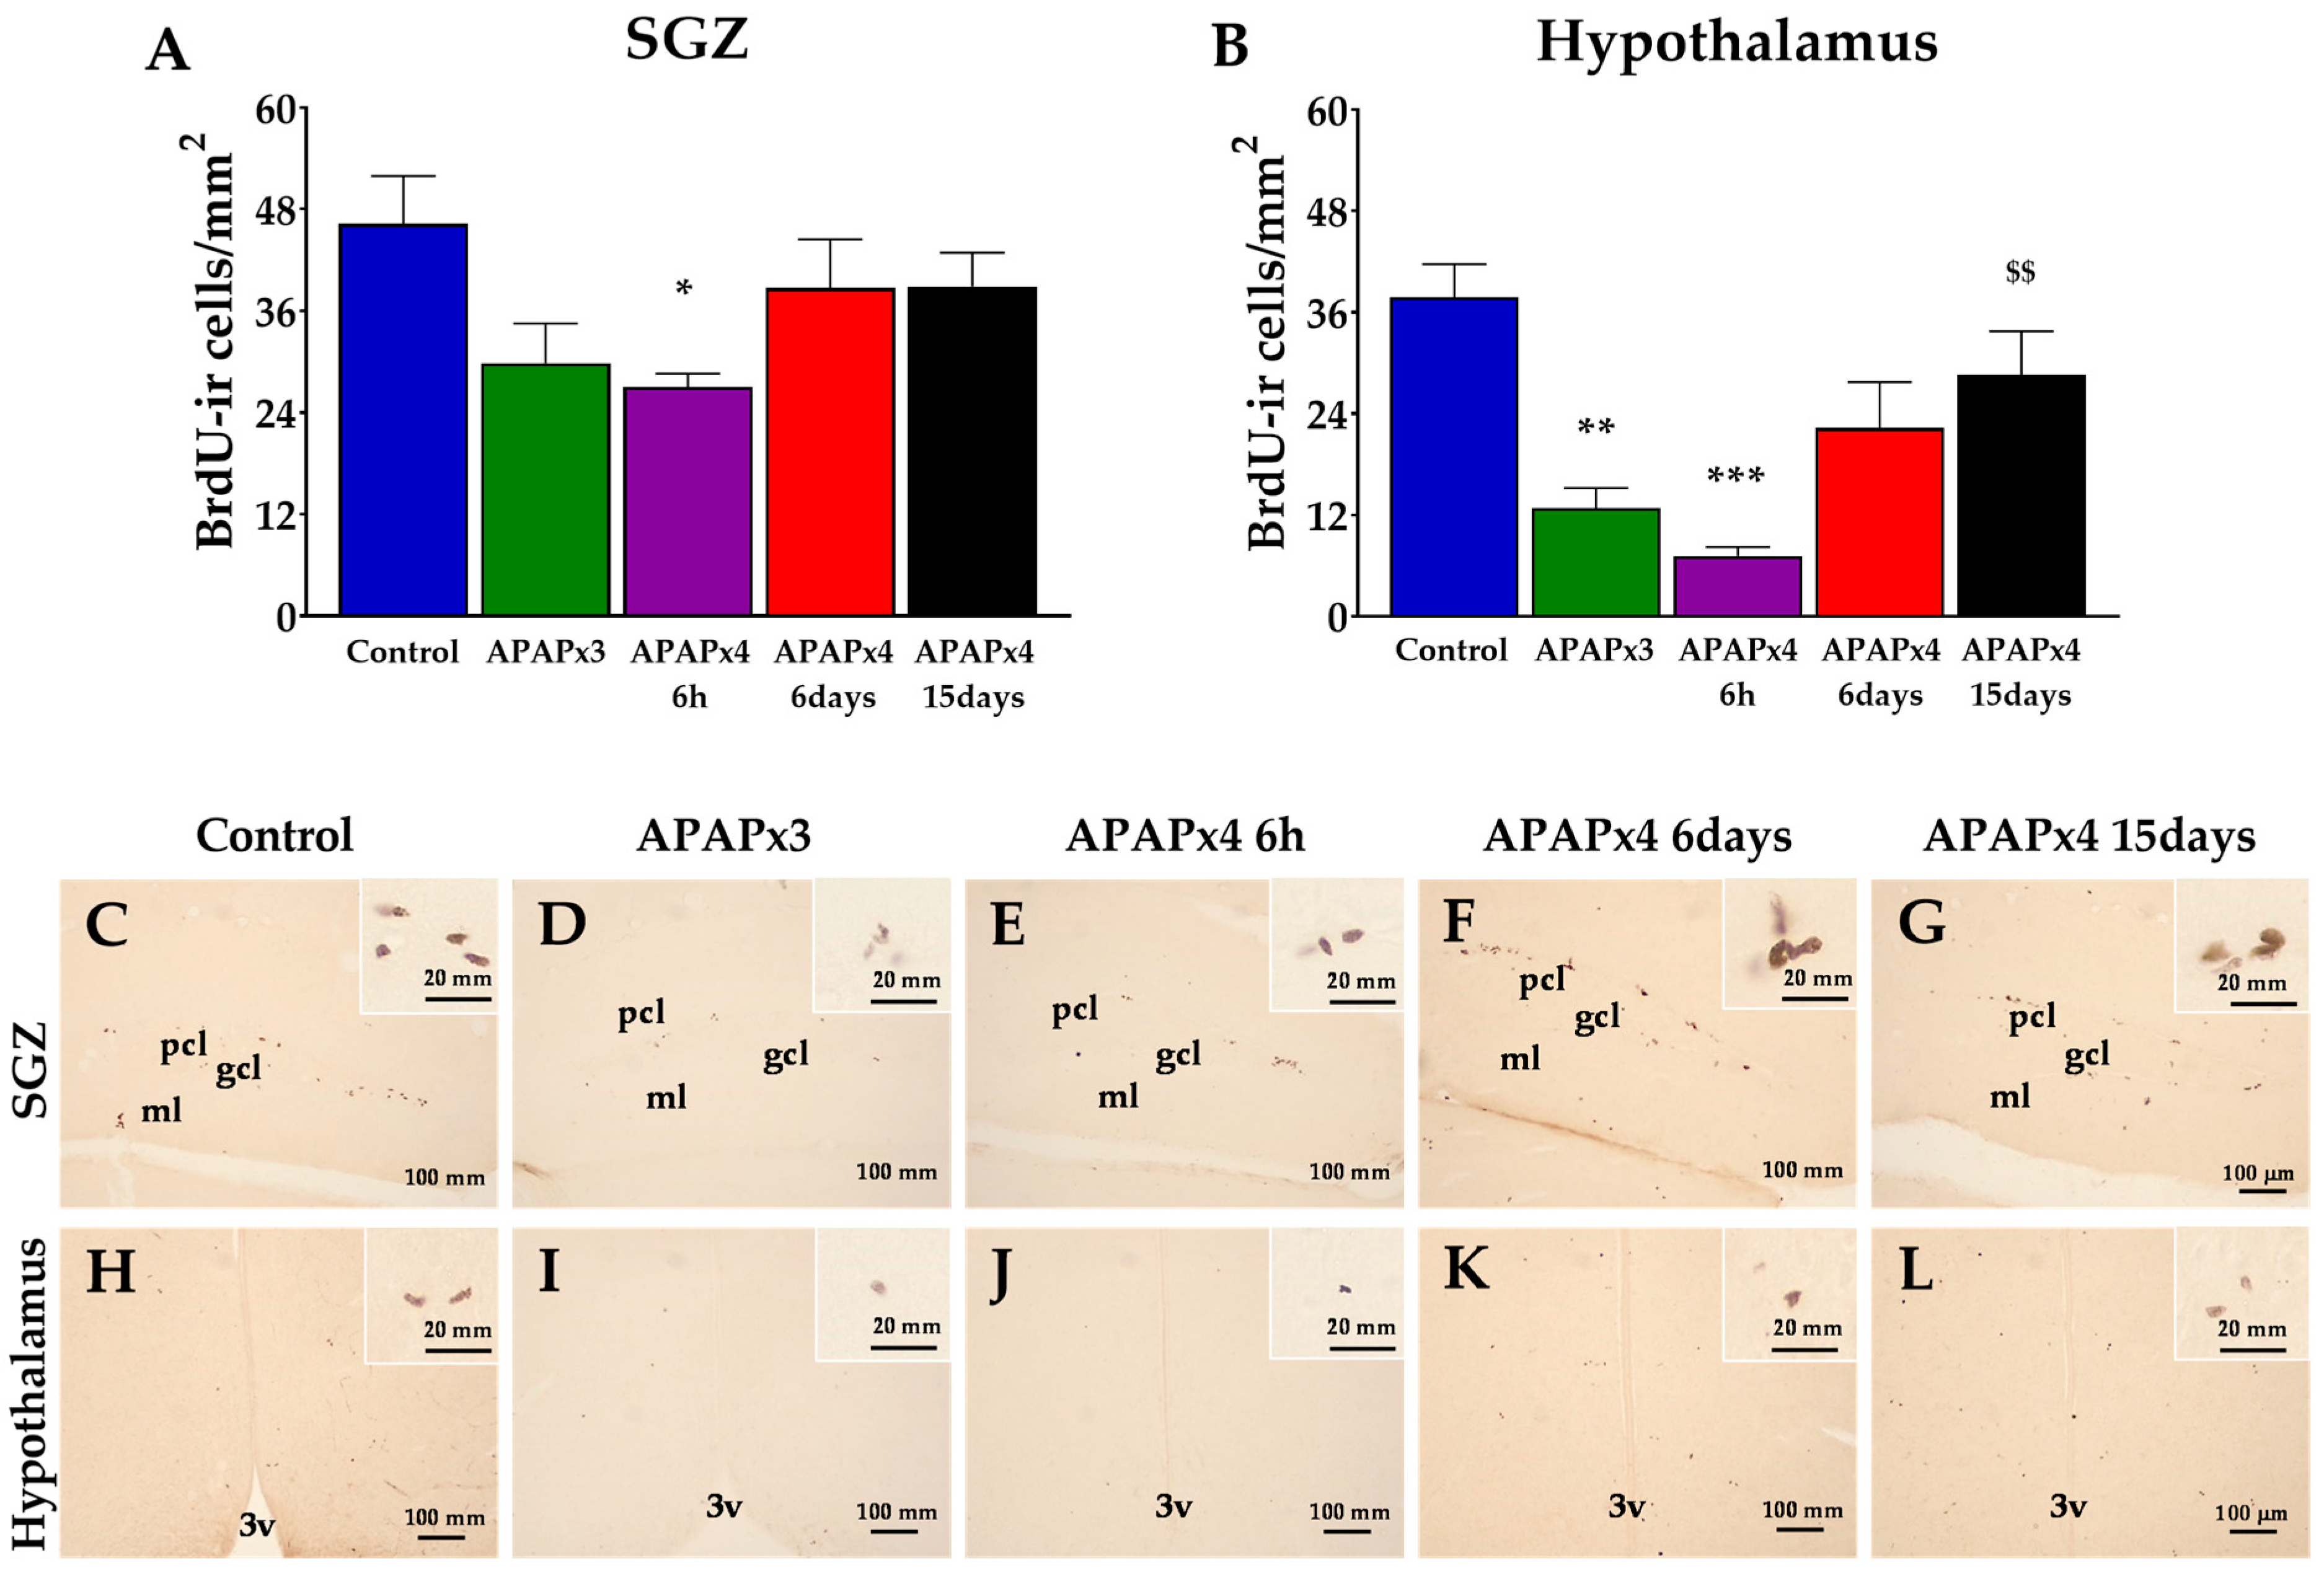
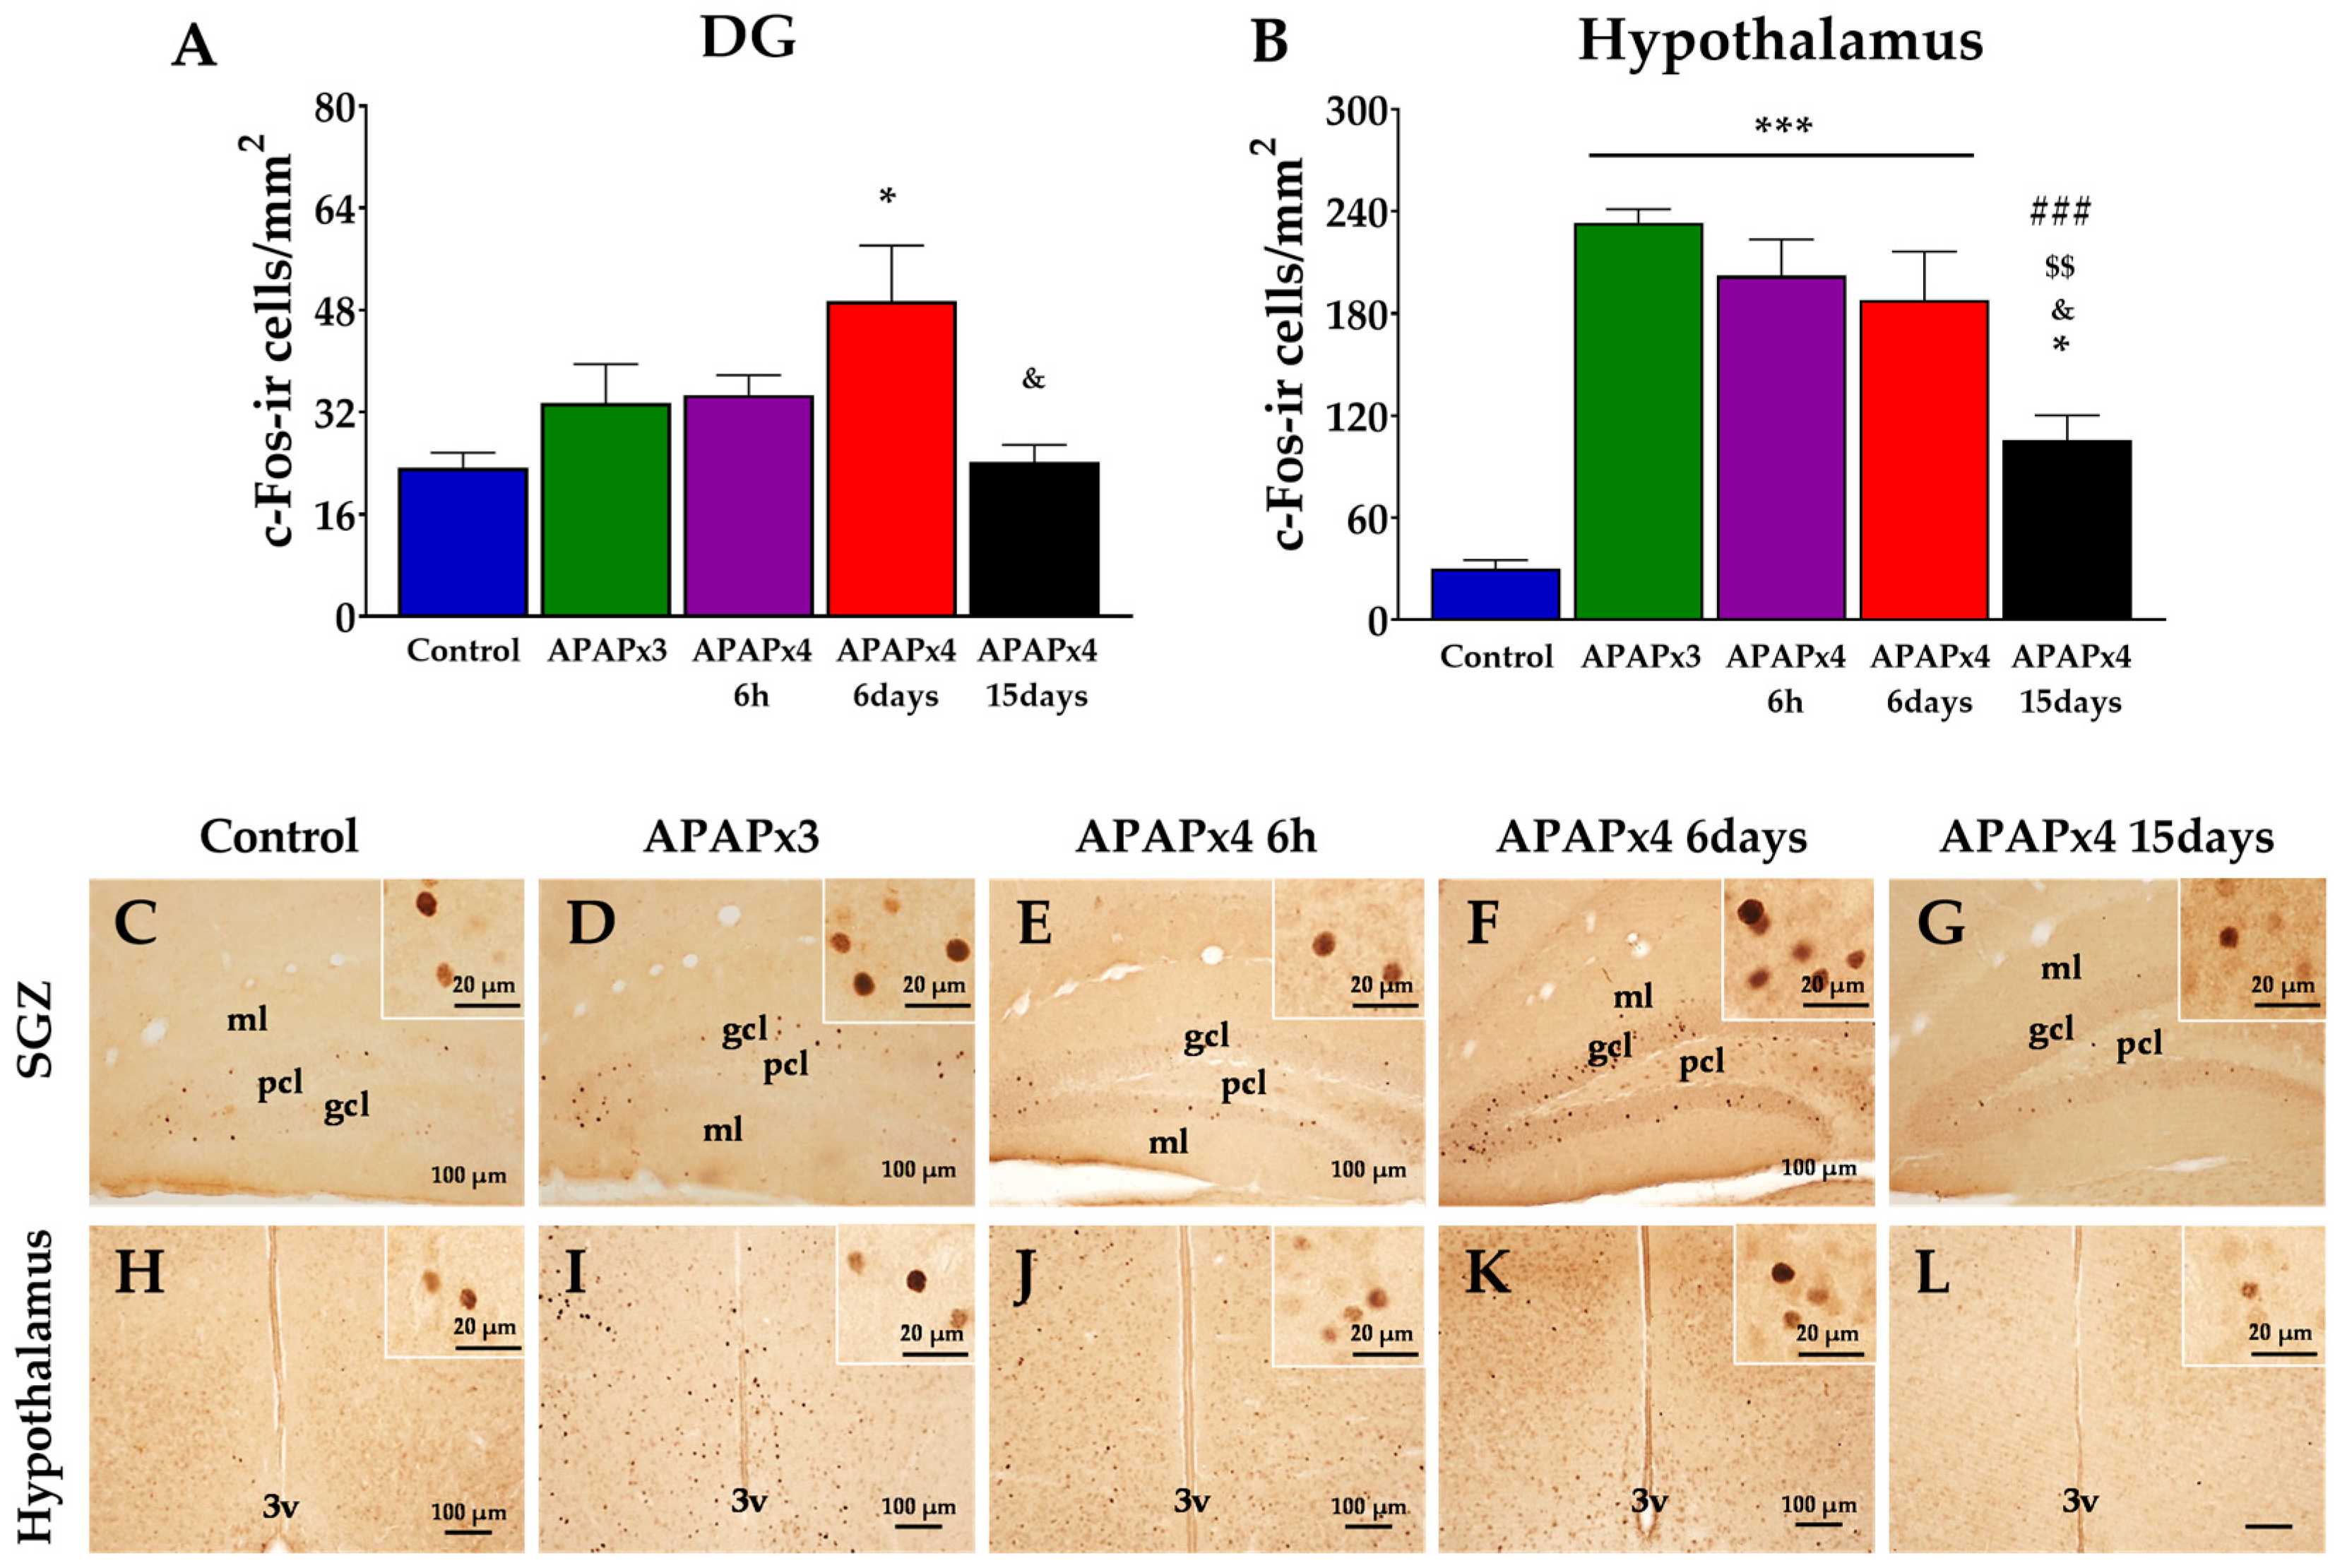
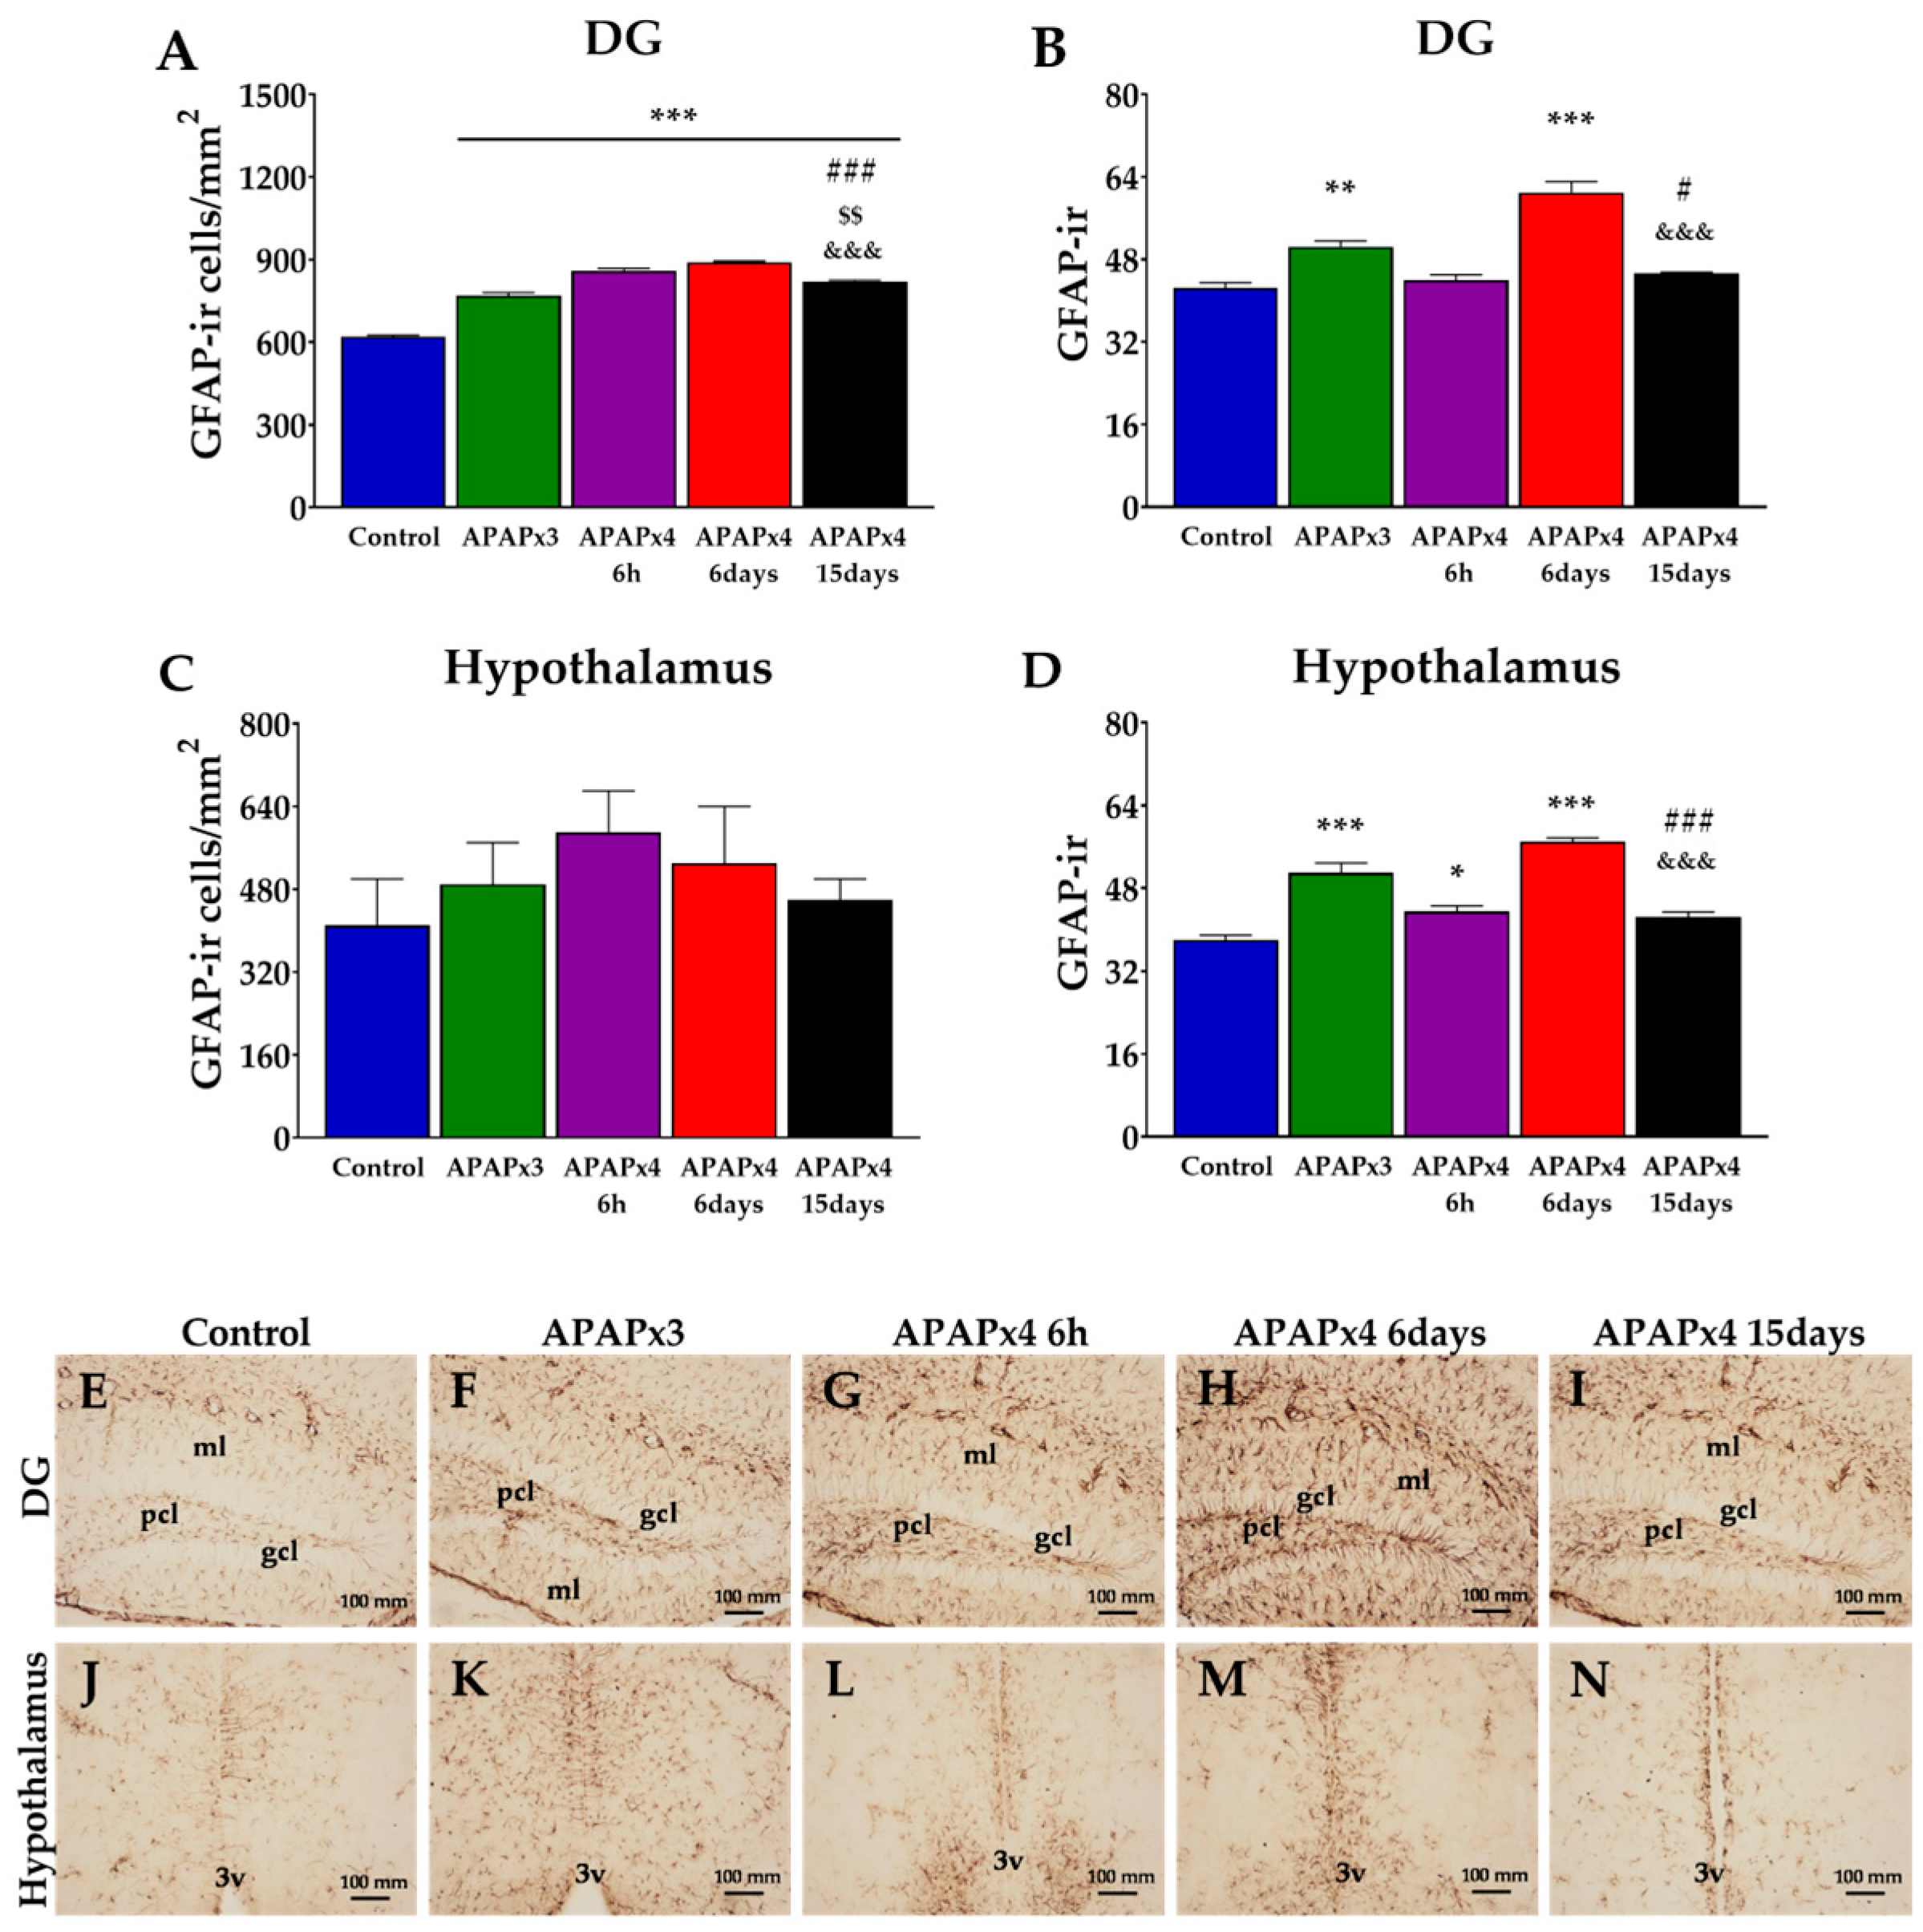
17]. Overall, our results suggested that repeated overdoses of APAP were associated with inhibition of adult neurogenesis in a context of high liver transaminase levels, neuronal hyperactivity and astrogliosis. These effects were most evident in the hypothalamus and were partially reversed after cessation of APAP administration for 6 and 15 days.
3. Discussion
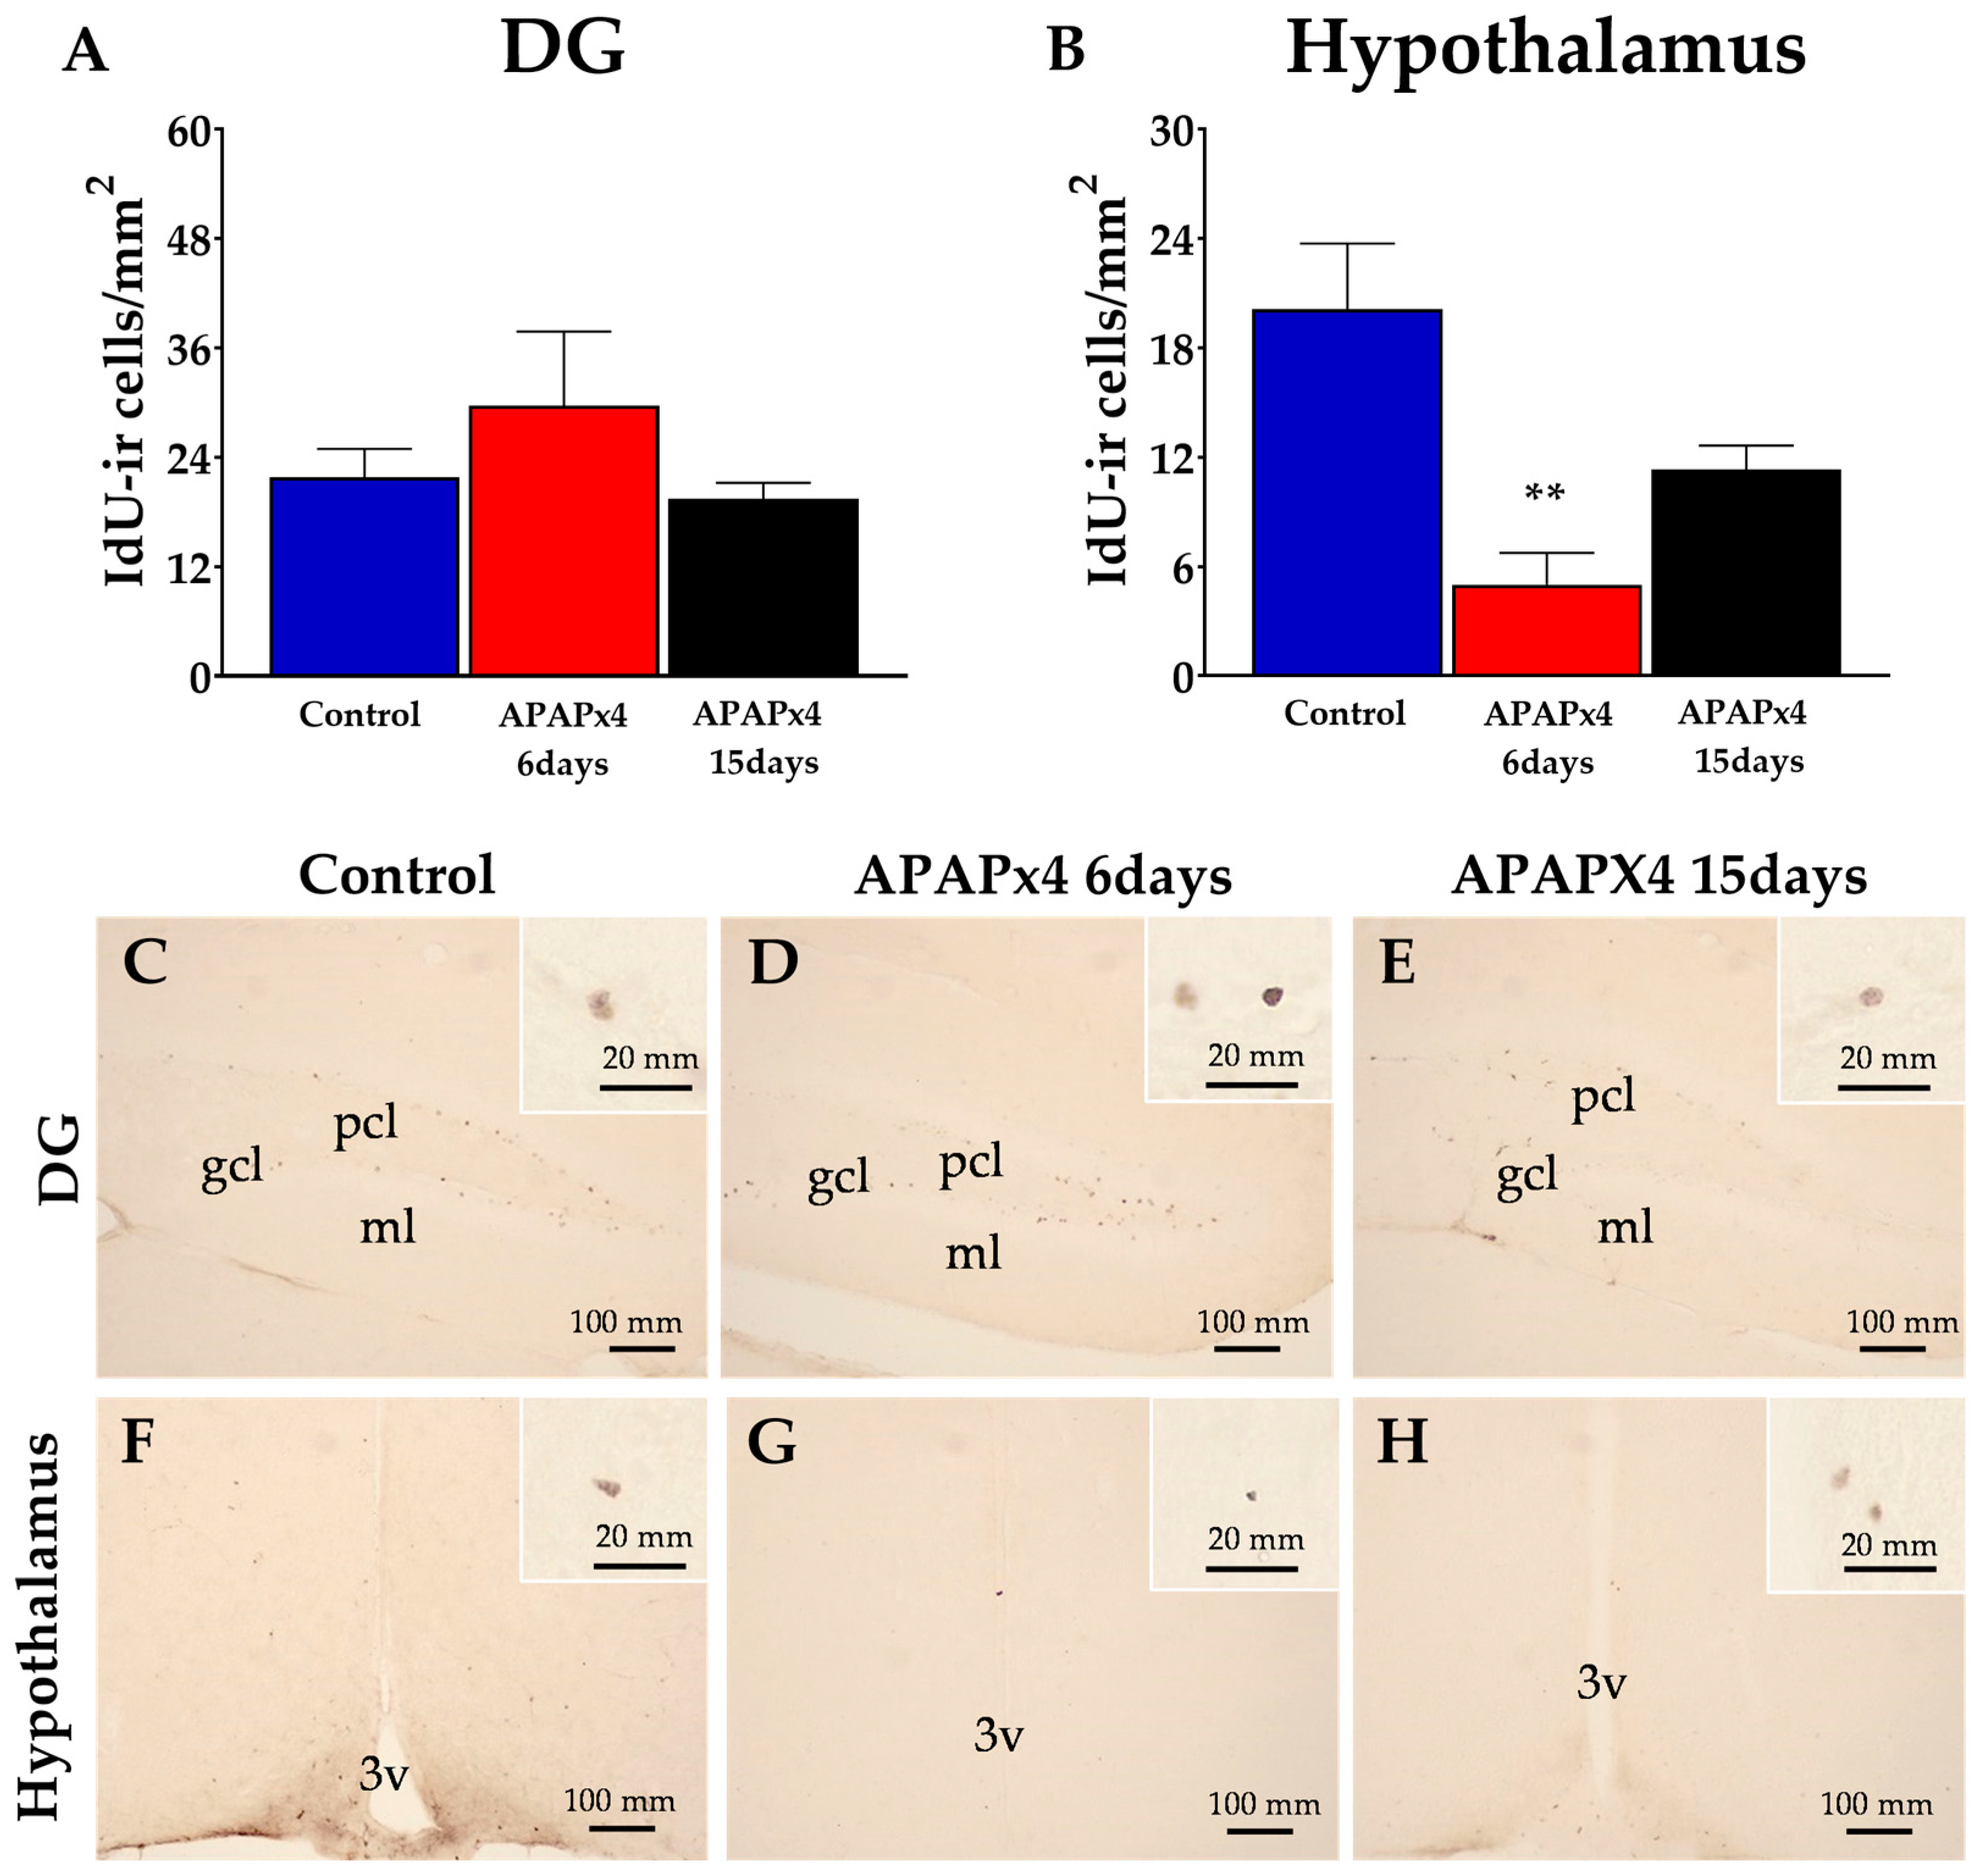
Despite the numerous ways in which APAP can affect brain functionality, its effect on adult neurogenesis, a neuroadaptive process strongly susceptible to numerous intrinsic and environmental factors, has not been fully investigated. The main findings of this study are that APAP administered in overdose (750 mg/kg) for consecutive days decreases cell proliferation in the neurogenic areas SGZ and hypothalamus, also affecting cell survival in the latter area. The reductions in cell proliferation and survival are statistically associated with increases in liver transaminase levels in plasma, as well as astrogliosis (GFAP) and neuronal activity measured by c-Fos. Interestingly, most of the changes found after the repeated administration of APAP were recovered 15 days after the last overdose.
Our main hypothesis is that APAP overdose effect on adult neurogenesis could be due to the direct toxic effect by accumulation of N-acetyl-p-benzoquinone imine (NAPQI) in the brain. APAP readily crosses the blood-brain barrier (BBB) and, because cytochrome P450 2E1 (CYP2E1) is present in brain areas such as the cortex, olfactory bulbs, hippocampus, cerebellum and brainstem, brain cells can directly metabolize APAP, producing the toxic reagent NAPQI [
3]. To date, there are no studies linking NAPQI toxicity to adult neurogenesis; although there is evidence associating early consumption of APAP with mid/long-term neurodevelopment and behavioral defects [
18,
19,
20,
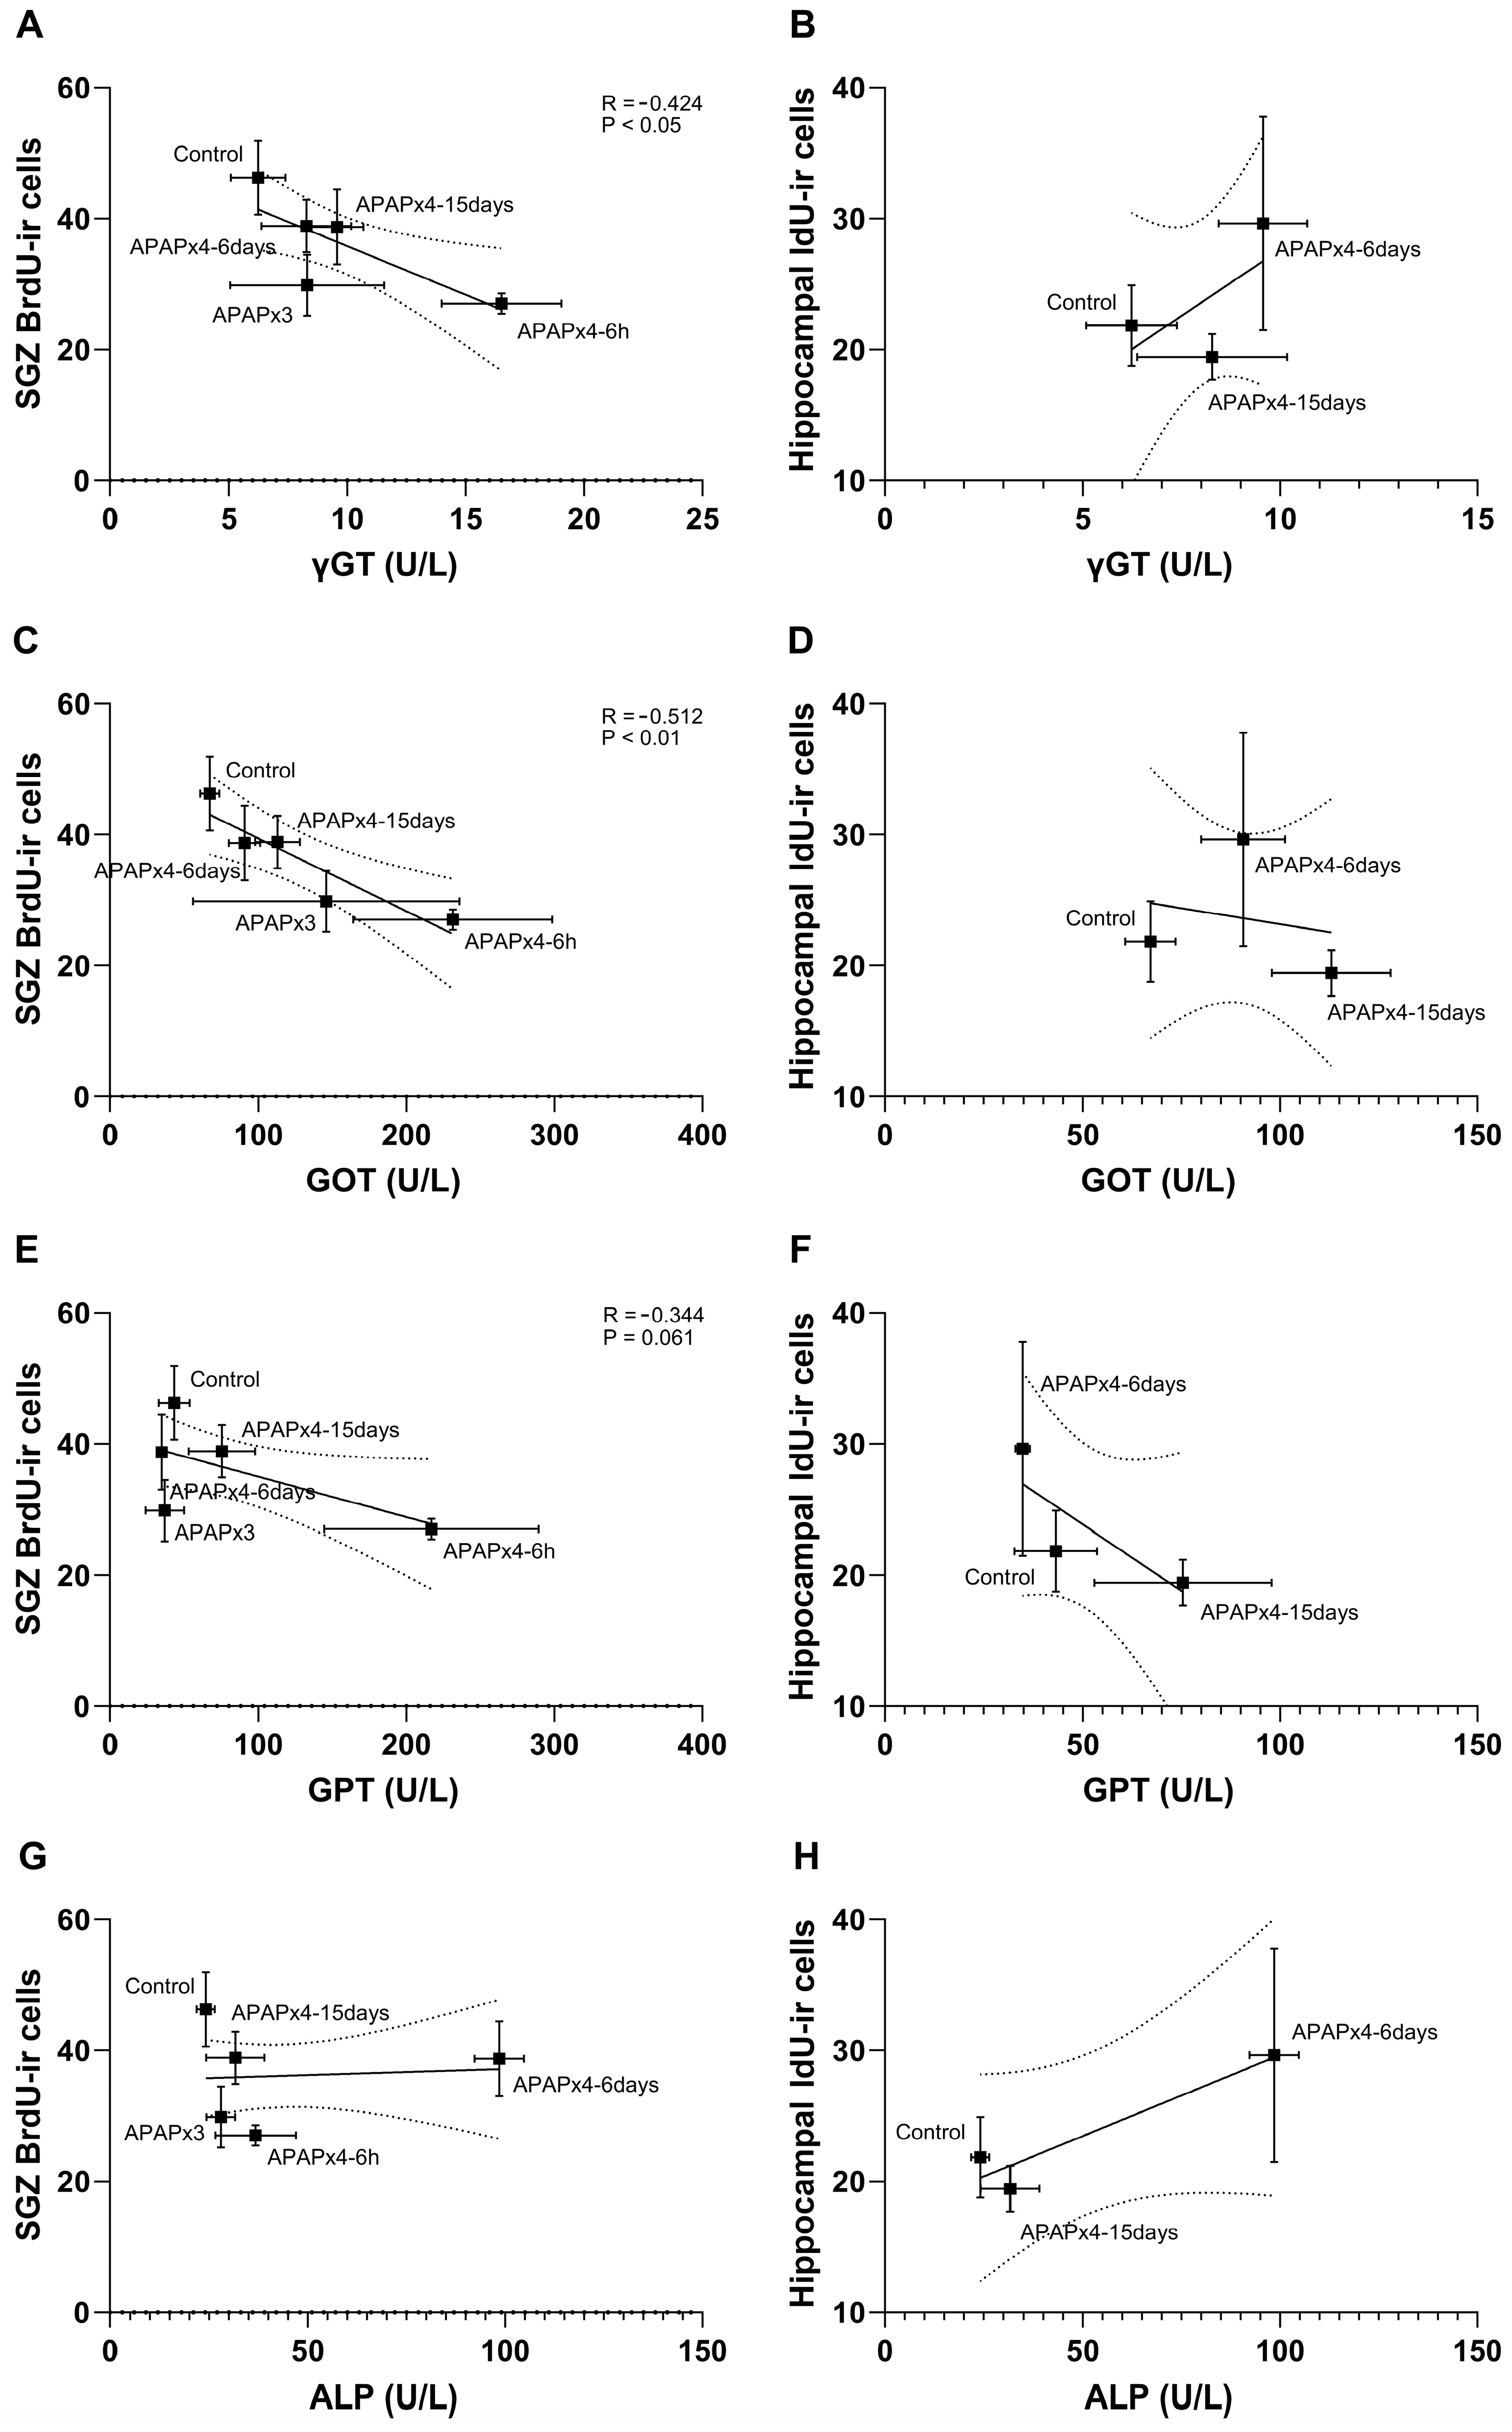
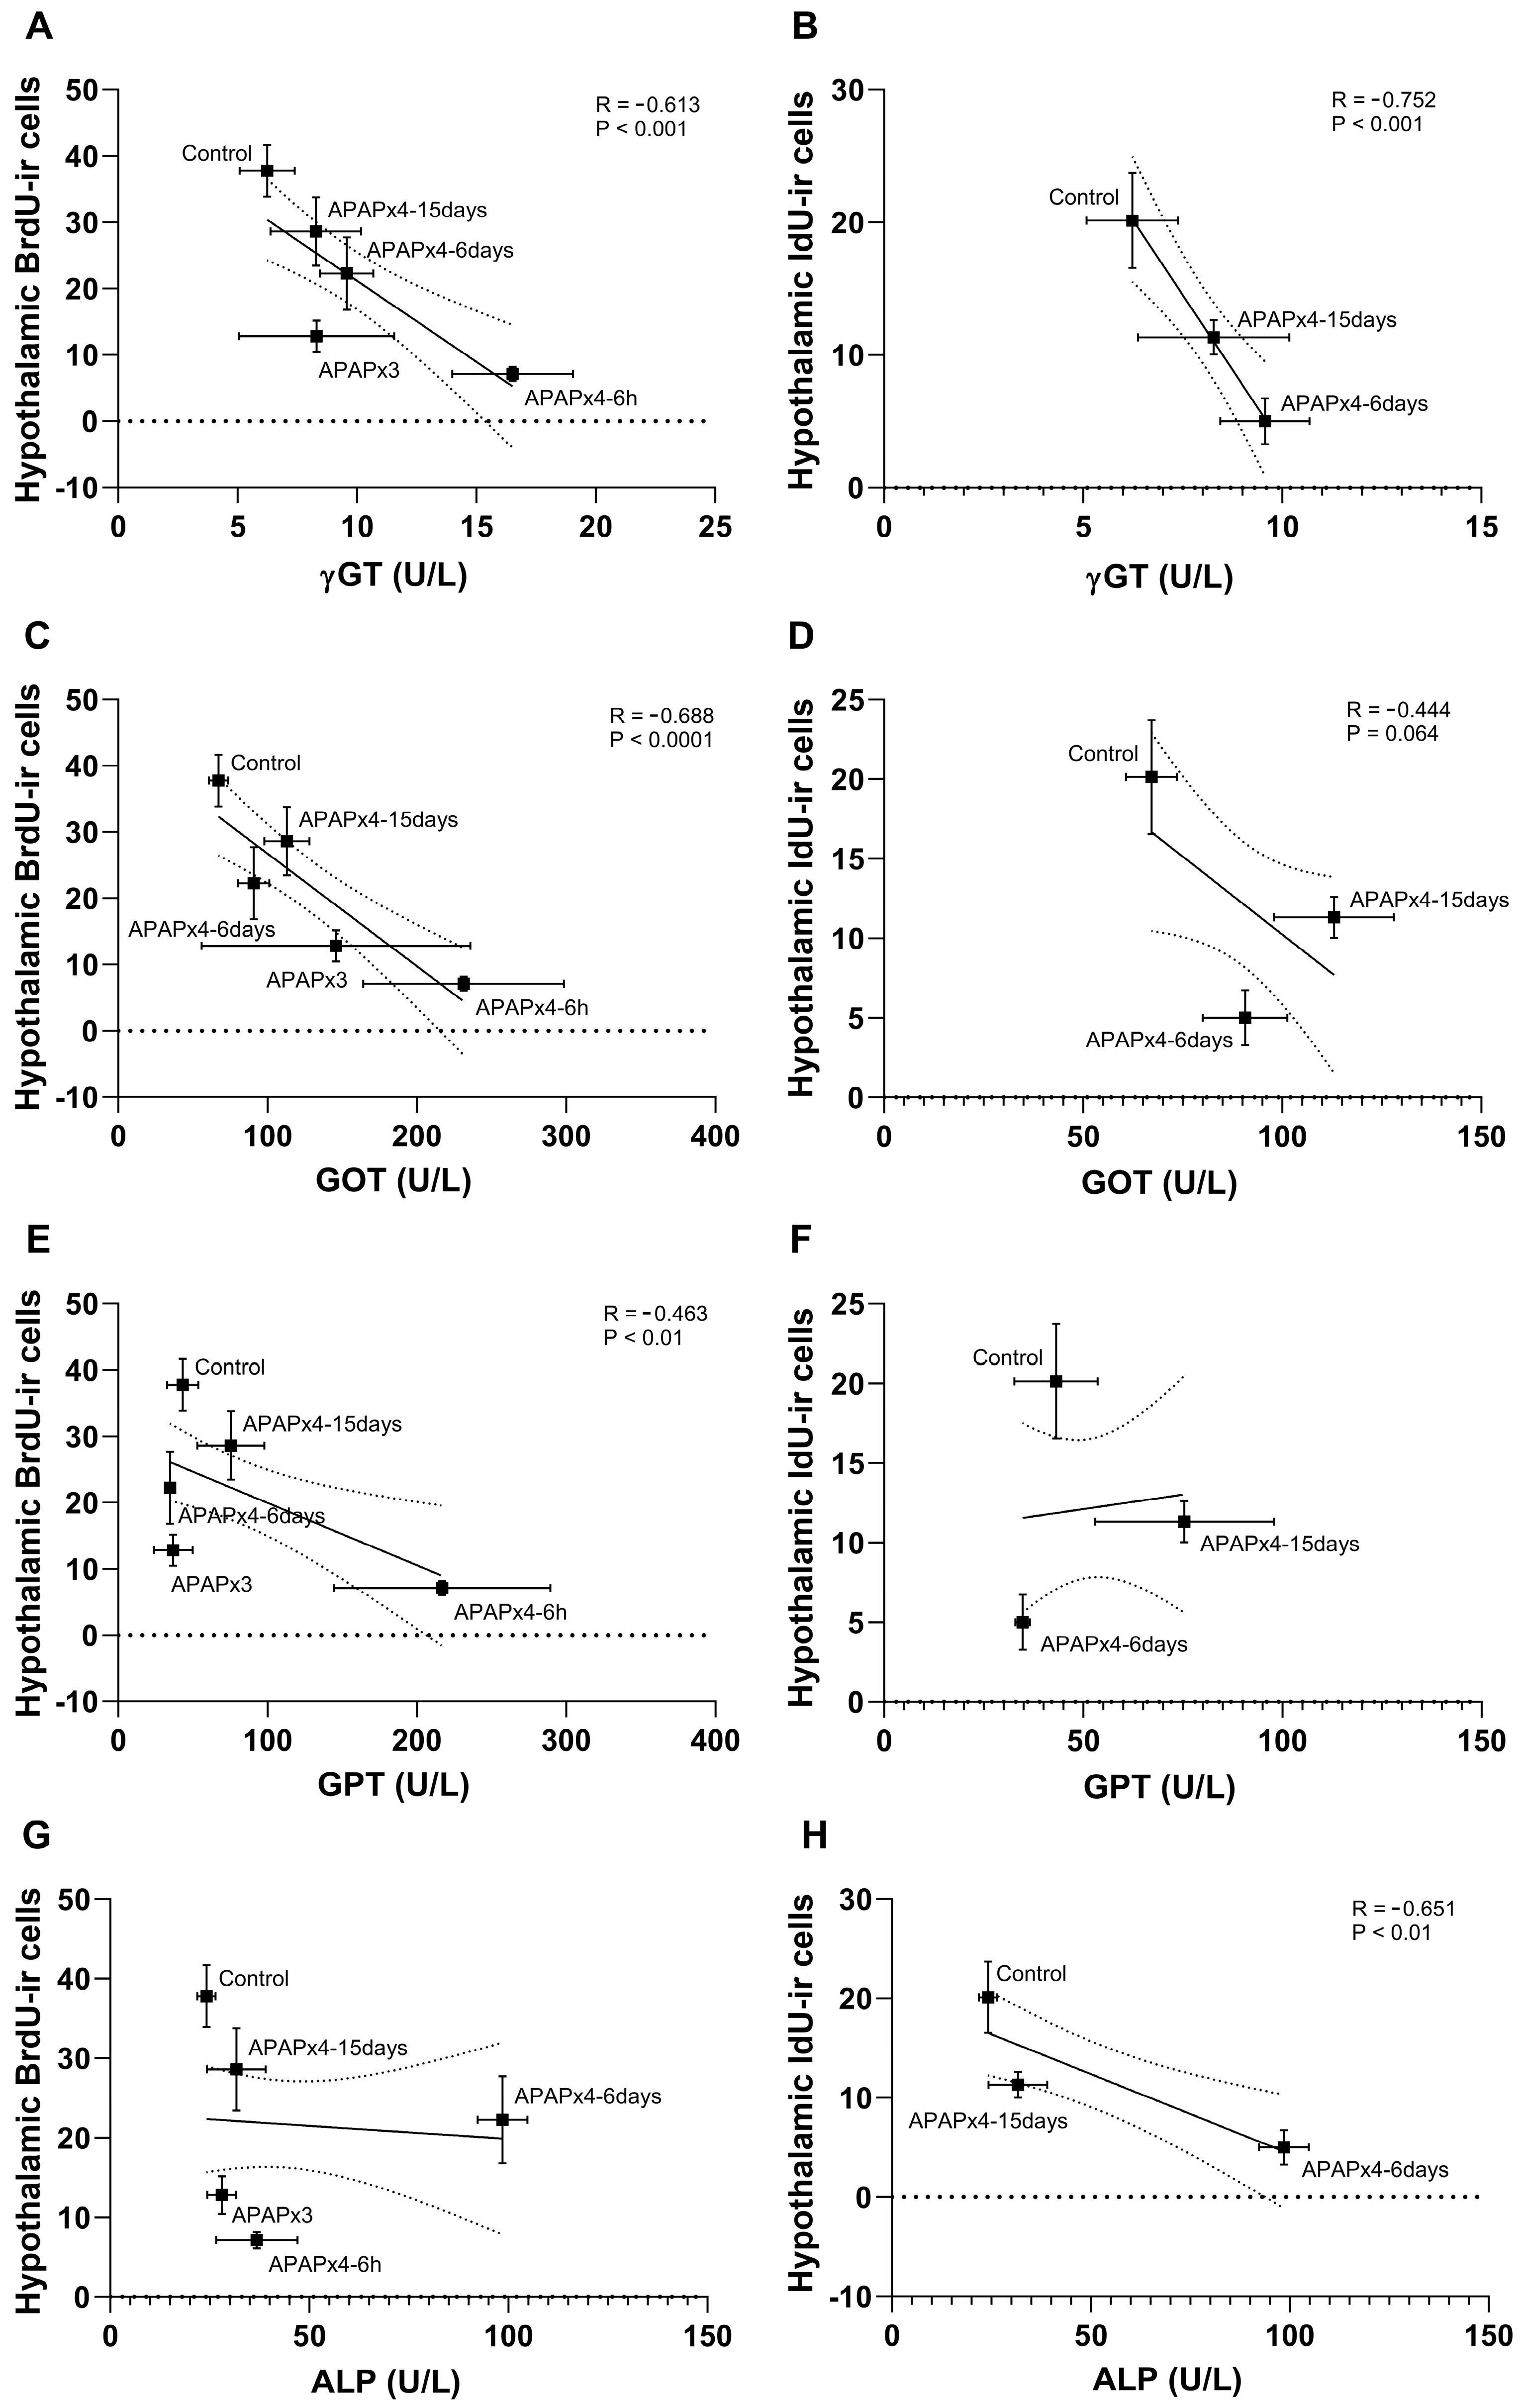
21]. Here, we show for the first time that there is a negative correlation between adult neurogenesis and plasma levels of liver damage markers. Thus, we found negative correlations between SGZ cell proliferation and the transaminases γGT and GOT. Likewise, there is a negative correlation between cell proliferation in the hypothalamus and γGT, GOT and GPT. Furthermore, in the hypothalamus cell survival also negatively correlates with γGT and ALP. A second finding also indicated that decreased cell proliferation and survival in the hippocampus and hypothalamus induced by APAP overdose is also associated with increased neuronal activity and astrogliosis. Indeed, we found a negative correlation between cell proliferation and survival and the number of cells immunoreactive for c-Fos and GFAP in the hypothalamus. A study by Posadas et al. (2010) [
22] showed that rats treated with APAP overdoses had an increased number of TUNNEL positive neurons in culture, confirming a direct toxic effect of APAP in brain function that may include neuronal activity and maintaining.
APAP is a safe drug administered in therapeutic doses. However, APAP overdose is the most common cause of acute liver failure (ALF) in many developed countries. NAPQI, the toxic product derived from APAP metabolism, cause depletion of hepatic GSH producing a mitochondrial dysfunction that ends with the death of hepatocytes. The redox imbalance that occurs within these cells can lead to the excessive production of free radicals capable of crossing the BBB and entering the brain, where they act as neurotoxins. Furthermore, one of the most important consequences of this hepatocellular damage is the cessation of the urea cycle, such that NH4
+ levels in the blood increase radically. This ion is in equilibrium with its non-charged form (NH3) in an aqueous medium such as the bloodstream, so it can cross the BBB and diffuse throughout the CNS. When this molecule reaches the interior of the astrocytes, NH4
+ is used for the synthesis of glutamine [
23,
24], where high concentrations of this compound lead to cytotoxic effects [
25], as we have observed in our study with astrogliosis marked by the high expression of GFAP. This fact is one of the different factors that can lead to hepatic encephalopathy (HE) [
23,
26].
APAP crosses the BBB and is distributed throughout the central nervous system (CNS) where it has an analgesic and anti-inflammatory effect [
27]. As in the liver, the CYP2E1 enzyme is also expressed in the brain [
28], found mainly in old areas of the allocortex, such as the hippocampus [
29], so this toxic intermediate is produced by the brain cells themselves. On the other hand, it has been found that one of the regions of this organ in which GSH levels are most depleted after an overdose of APAP is the hypothalamus [
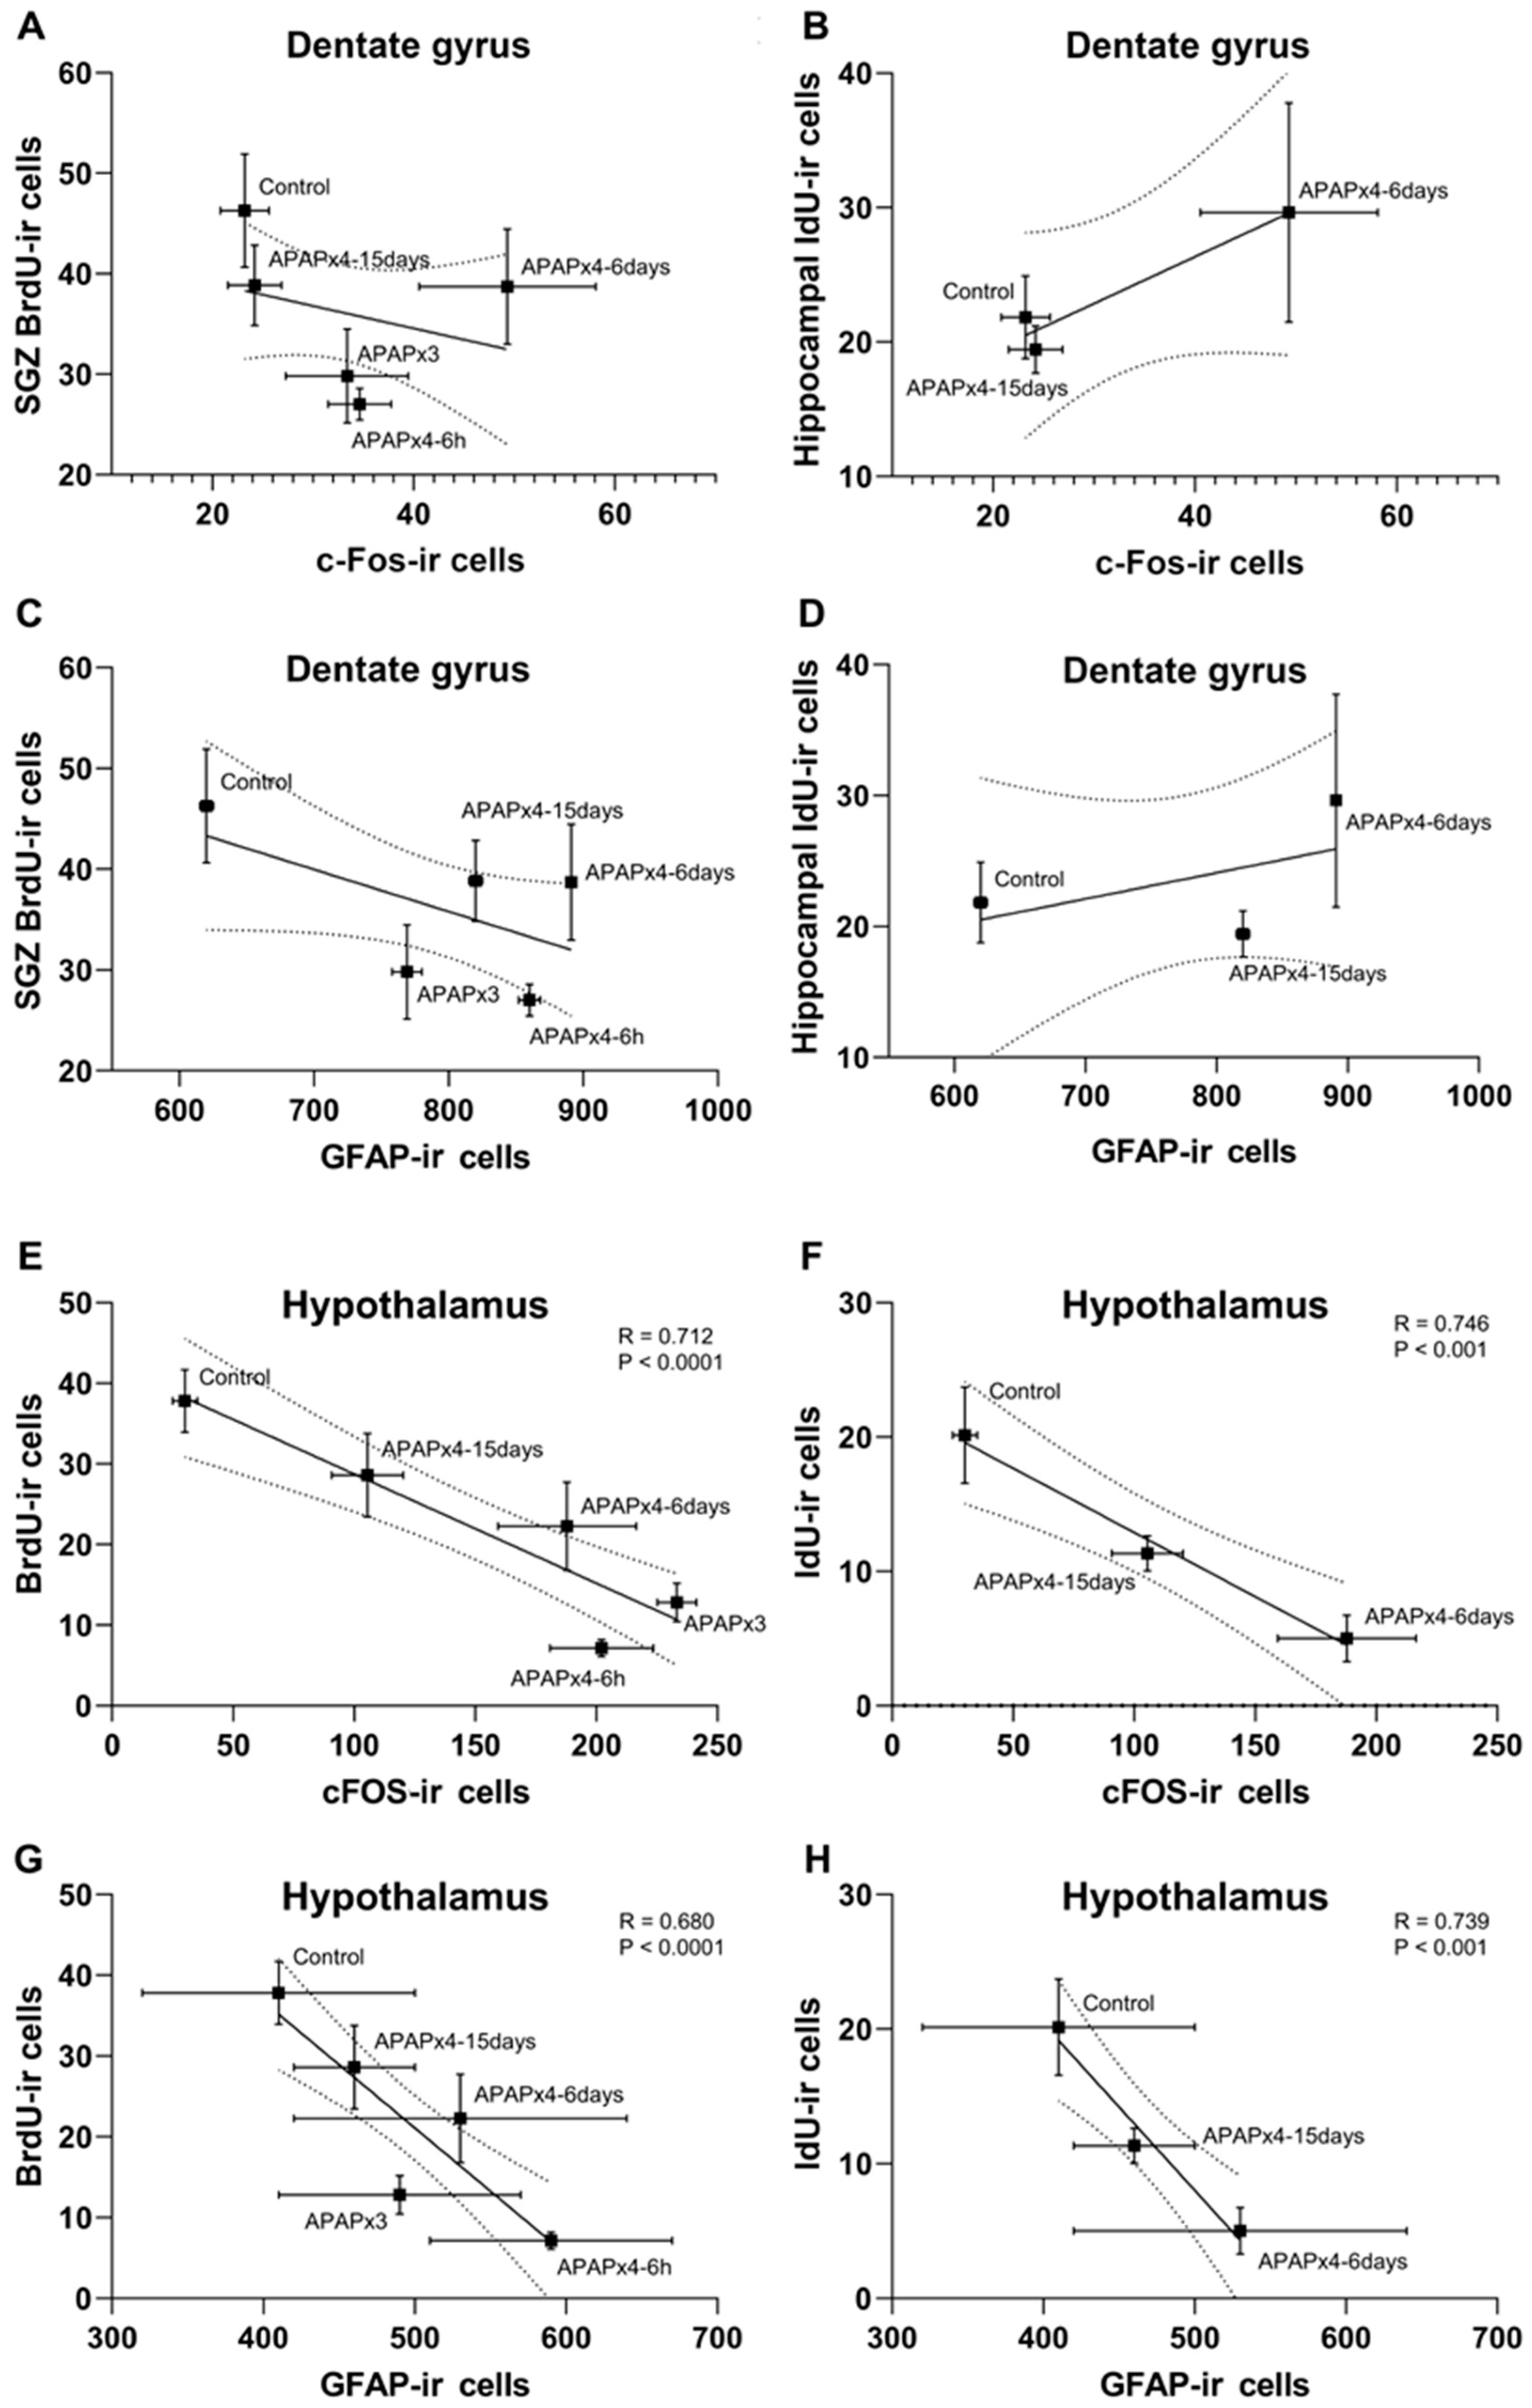
30]. Therefore, the decrease in cell proliferation and survival that we have observed in the hippocampus and hypothalamus induced by excess of this drug is associated with neuronal activity and astrogliosis, and that is why we found a negative correlation between markers of cell proliferation and survival and the number of cells positive for c-Fos and GFAP.
In the brain, APAP produces an inhibition of the COX pathway, having an anti-inflammatory/antipyretic role. However, this process does not occur in the periphery where the analgesic action of APAP was not related to the inhibition of prostaglandin synthesis [
6]. Recently, a COX-independent mechanism of action through cannabinoid/vanilloid signaling has been described that explains the analgesic properties of APAP. Upon crossing the BBB, APAP is deacetylated to become p-aminophenol, which, thanks to the enzyme fatty acid amide hydrolase (FAAH), is conjugated with arachidonic acid to form AM404 [
31,
32].
AM404 is a ligand of cannabinoid receptor 1 (CB1) and an inhibitor of AEA uptake into cells, thereby increasing cannabinoid tone [
3,
31,
33]. Recent studies have implicated the endocannabinoid system in neurogenic processes. Thus, endocannabinoid signaling controls neuronal proliferation and survival as a neuroprotective response to brain insults [
34,
35,
36,
37]. Several studies have shown that activation of CB1 receptors facilitates cell proliferation and survival in the hippocampus and hypothalamus, as well as a direct role of the CB1 receptor in neurogenesis, since the number of BrdU-labeled cells can be significantly reduced in the hippocampal SGZ and SVZ of CB1 knockout mice [
34,
37,
38,
39]. Thus, we can expect that AM404, an AEA re-uptake inhibitor that enhances the effects of AEA
in vivo through the cannabinoid CB1 receptor, should increase cell proliferation and survival after the administration of APAP. However, this hypothesis is not consistent with our results, which demonstrate that excessive and continued consumption of APAP reduces adult neurogenesis (cell proliferation and survival) in the SGZ and hypothalamus. Several factors must be considered to explain our results. First, the inhibitory effect of APAP overdose on adult neurogenesis may be as a consequence of CB1 desensitization in a context of elevated AEA tone. Second, there is a possibility of APAP interactions with independent CB1 pathways, including vanilloid, serotonergic and nitric oxide systems [
32,
40,
41]. Indeed, both anandamide and AM404 are agonists of the capsaicin receptor TRPV1, a vanilloid receptor that mediates decreased cell proliferation [
38,
42].
Given all these premises, we conclude that there is a direct toxic effect of excess paracetamol on the brain, decreasing adult neurogenesis in the hippocampus and hypothalamus and increasing inflammation. These effects do not seem to be mediated by metabolites generated in the transformation of APAP as it crosses the blood-brain barrier and, therefore, would not involve the action of the cannabinoid and vanilloid signaling systems. To confirm the hypothesis based on our results, future studies using antioxidants that prevent the accumulation of NAPQI, the toxic metabolite of acetaminophen, would be necessary.
4. Materials and Methods
4.1. Ethics Statement
The experimental procedures with animals were carried out following the recommendations of the European Communities Directive 2010/63/EU and Spanish legislation (Real Decreto 53/2013, BOE 34/11370-11421, 2013) regulating the care and use of laboratory animals. The protocol was approved by the Animal Ethics Committee of the University of Málaga (Ref. no. 24-2015-A). All efforts were made to minimize animal suffering and to reduce the number of animals used. Animal studies comply with the ARRIVE guidelines.4.2. Animal model
Male Crl:CD1 (ICR) mice (approximately 25-30 g, 3-4 months old) were purchased from Charles Rivers Laboratories (Barcelona, Spain). They were housed in cages maintained in standard conditions (Servicio de Estabulario, Facultad de Medicina, Universidad de Málaga) at 20 ± 2 °C room temperature, 40 ± 5% relative humidity and a 12-h light⁄dark cycle with dawn⁄dusk effect. Water and standard rodent chow (Prolab RMH 2500, 2.9 kcal/g) were available ad libitum.
The animals were daily handled for 10 min and habituated to oral gavage procedure for 1 week before experimentation in order to minimize stress effects.
4.2. Acetaminophen treatment
Acetaminophen (APAP, cat. no. A7085, Sigma-Aldrich, St. Louis, MO, USA) was dissolved in a vehicle containing 0.5% DMSO in sterile 0.9% NaCl solution, just before each experiment. The APAP were orally gavage administrated in a final concentration of 750 mg/kg body weight.
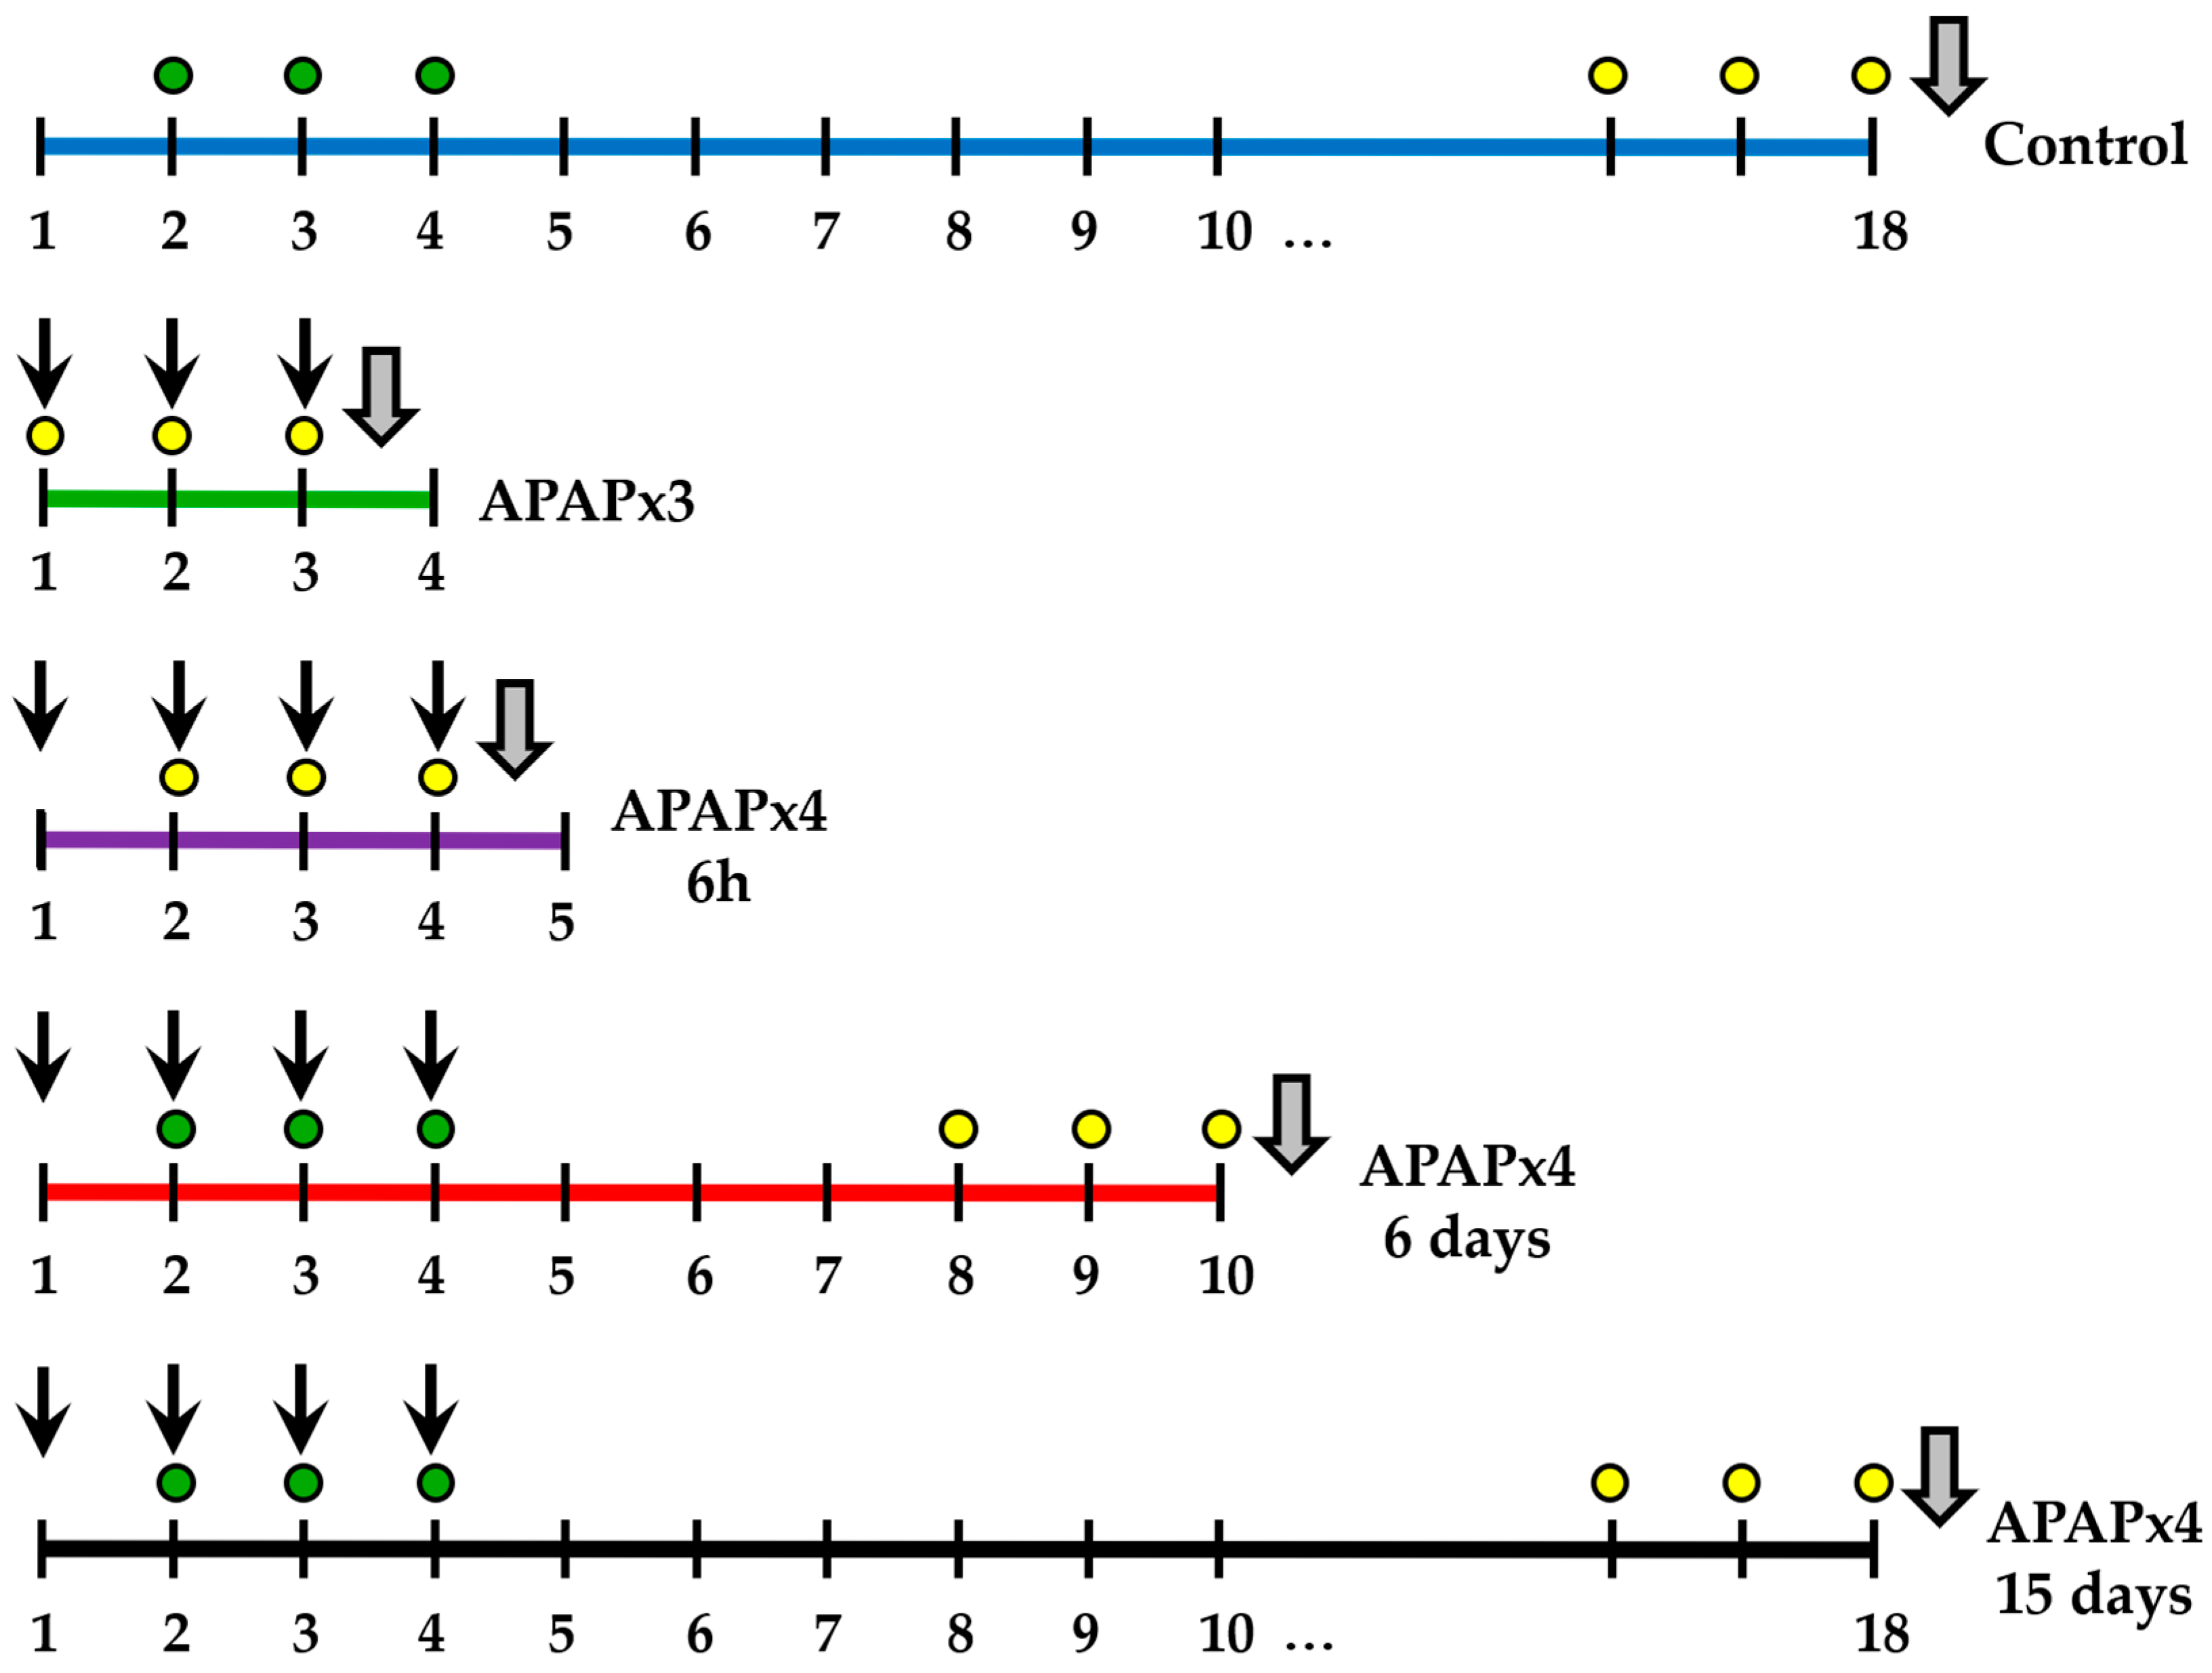
Mice received repeated administration of APAP and sacrificed 6 h, or several days after the last administration to study the recovery. Mice were randomly divided into five group (n=6): (1) repeated vehicle administration for 4 days (control group); (2) repeated APAP administration (750 mg/kg/day) for 3 days and sacrificed 6 h after the last administration (APAPx3); (3) repeated APAP administration (750 mg/kg/day) for 4 days and sacrificed 6 h after the last administration (APAPx4-6h); (4) repeated APAP administration (750 mg/kg/day) for 4 days and sacrificed 6 days after the last administration (APAPx4-6days); and (5) repeated APAP administration (750 mg/kg/day) for 4 days and sacrificed 15 days after the last administration (APAPx4-15days).
Figure 9 shows the administration scheme and the experimental groups used in this study.
4.3. IdU and BrdU administration
To analyze cell proliferation and survival, 5’-bromo-2’-deoxyuridine (BrdU, cat. no. B5002, Sigma-Aldrich, St. Louis, MO, USA) and 5’-iodo-2’-deoxyuridine (IdU, cat. no. I7125, Sigma-Aldrich) were administered intraperitoneally (i.p.) in a sterile 0.9% NaCl solution at a dose of 50 mg/kg/day and 42.75 mg/kg/day respectively.
BrdU was administered in all experimental groups. BrdU was injected i.p. twice per day at 10-h intervals for 3 consecutive days before sacrifice. Thus, BrdU was used as a cell proliferation marker. IdU was injected i.p. twice per day at 10-h intervals for 3 consecutive days on days 2-4 of the experiment. Using this regimen of administration, IdU was administered in the control, APAPx4-6 days and APAPx4-15 days groups only. Thus, IdU was used as a cell survival marker (
Figure 9).
4.4. Sample Collection
Animals were fasted for 12 h before sacrifice. Previous to sacrifice all animals were anaesthetized (sodium pentobarbital, 50 mg/kg body weight, i.p.) in a room separate from the other experimental animals. The blood samples were transcardially collected into tubes containing heparin and centrifuged (1600g for 10 min, 4°C), and the plasma was stored at -80°C for biochemical analysis. Another batch of animals were transcardially perfused with 4% formaldehyde in 0.1M phosphate buffer (PB). Brains were dissected out and kept in the same fixative solution overnight at 4°C.
The brains were then cut into 30-μm-thick coronal sections by using a sliding microtome (Leica VT1000S) and divided in 6 parallel series. Sections were stored at 4°C in PB with 0.002% (w/v) sodium azide until they were used for immunostaining.
4.5. Biochemical analysis
ALP and the hepatic enzymes ALT or GPT, AST or GOT and γGT) were analyzed using commercial kits according to the manufacturer´s instructions in a Hitachi 737 Automatic Analyzer (Hitachi Ltd., Tokyo, Japan). In all cases, a calibration curve and internal controls were included in each assay.
4.6. Immunohistochemistry
Free-floating coronal sections from −2.16 to −4.20 Bregma levels (hippocampus and hypothalamus) were selected from one of the six parallel series obtained from each brain of the five experimental groups [
43].
Brain floating sections were incubated overnight at 4 °C with rat anti-BrdU (1:2,000; Accurate Chemical & Scientific; OBT0030 F), mouse anti-IdU (1:500; Sigma-Aldrich), rabbit anti-c-Fos antibody (Calbiochem, PC38; 1:10,000), and mouse anti-glial fibrillaric acidic protein (GFAP) (1:500, Sigma, cat. no. G3893) antibody [
37].
The following day the sections were incubated in the respective secondary antibody for 90 min: biotinylated donkey anti-rat IgG (1:500, Novex by Life Technologies, USA, cat. no. A18743), biotinylated goat anti-mouse IgG (1:500, Sigma; cat. no. B7264) or biotinylated donkey anti-rabbit IgG (1:500, Amersham, Little Chalfont, England; cat. no. RPN 1004). The sections were then incubated in ExtrAvidin peroxidase (Sigma) diluted 1:2,000 in darkness at room temperature for 1 h. Finally, immunolabeling was revealed with 0.05% diaminobenzidine (DAB; Sigma), 0.05% nickel ammonium sulphate and 0.03% H2O2 in PBS.
4.7. Cell Counting
BrdU, IdU, c-Fos and GFAP-ir nuclei and cells that came into focus were manually counted from Bregma −2.16 to −4.20 mm at hippocampal and hypothalamic levels (Paxinos & Watson, 2007); using a standard optical microscope with the 40 × objective (Nikon Instruments Europe B.V., Amstelveen, Netherlands) coupled to the NIS-Elements Imaging Software 3.00 (Nikon).
Focusing in the hippocampus, BrdU-ir nuclei were counted in the SGZ of the DG, while IdU-ir nuclei and c-Fos and GFAP-ir cells were counted in the whole hippocampus (DG, CA3 and CA1 areas). Focusing in the hypothalamus, counting was performed in the paraventricular (PVH), ventromedial (VMH) and arcuate (ARC) nuclei and median eminence.
Immunostained cells located in the uppermost side that came into focus while moving down through the thickness of the section were counted. Overall, quantification was expressed as the average number of cells per area (mm2) in each experimental group.
4.8. Quantification of immunoreactivity
Densitometric analysis of the GFAP immunoreactivity was evaluated in the three hippocampal areas (DG, CA3 and CA1) and hypothalamus from Bregma −2.16 to −4.20 mm [
43]. Digital high-resolution microphotographs of representative areas were taken with a 10× objective under the same conditions of light and brightness/contrast with an Olympus BX41 microscope equipped with an Olympus DP70 digital camera. Quantification was determined using the analysis software ImageJ 1.38X (NIH, USA).
4.9. Statistical analysis
GraphPad Prism 9 software was used. All data are expressed as mean ± SEM (n = 6 per experimental group). Animal model data were analyzed by one-way ANOVA. Subsequent multiple comparisons between groups were carried out using Tukey adjustments. To analyze whether repeated APAP administration induced changes in the association between parameters, Pearson’s correlation analysis was performed and Rho values (goodness-of-fit) were calculated. A P value less than 0.05 indicates statistical significance.
Author Contributions
Conceptualization, J.S., J.D. and P.R.; methodology, M.d.C., M.R.P., A.V. and P.R.; formal analysis, J.S., I.S., S.M.L., A.C.Z., E.C.O., F.R.d.F., J.D. and P.R.; investigation, J.S., M.d.C., F.R.d.F., J.D. and P.R.; resources, J.S. F.R.d.F. and P.R.; writing—original draft preparation, J.S., M.d.C., J.D. and P.R.; writing—review and editing, J.S., M.d.C., M.R.P., I.S., S.M.L., A.C.Z., E.C.O., F.R.d.F., J.D. and P.R.; funding acquisition, J.S., F.R.d.F. and P.R. All authors have read and agreed to the published version of the manuscript.
Figure 1.
Effect of repeated administration of APAP at a dose of 750 mg/kg/day on cell proliferation analyzed by BrdU immunohistochemistry in the subgranular zone (SGZ) of the dentate gyrus (A) and hypothalamus (B) of male mice. The histogram represents the means ± standard error of the mean (SEM) per section of BrdU-ir nuclei (n = 6 samples per group). Representative micrographs show magnification views of the typical clustering of newborn cells at the inner border of the SGZ (C-G) and hypothalamus (H-L). One-way ANOVA: (*) P < 0.05, (**) P < 0.01, and (***) P < 0.001 vs Control group. ($$) P < 0.01 vs APAPx4-6h group.
Figure 2.
Effect of repeated administration of APAP at a dose of 750 mg/kg/day on cell survival analyzed by IdU immunohistochemistry in the dentate gyrus (DG) of hippocampus (A) and hypothalamus (B) in male mice. The histogram represents the means ± standard error of the mean (SEM) per section of IdU-ir nuclei (n = 6 samples per group). Representative micrographs show magnification views of the typical clustering of survival cells at the inner border of the SGZ (C-E) and hypothalamus (F-H). One-way ANOVA: (**) P < 0.01 vs Control group.
Figure 3.
Effect of repeated administration of APAP at a dose of 750 mg/kg/day on neuronal activity analyzed by c-Fos immunohistochemistry in the dentate gyrus (DG) of hippocampus (A) and hypothalamus (B) of male mice. The histogram represents the means ± standard error of the mean (SEM) per section of c-Fos-ir cells (n = 6 samples per group). Representative micrographs show magnification views of c-Fos-ir cells in the hippocampus (C-G) and hypothalamus (H-L). One-way ANOVA: (*) P < 0.05 and (***) P < 0.001 vs Control group. (###) P < 0.001 vs APAPx3 group. ($$) P < 0.01 vs APAPx4-6h group. (&) P < 0.05 vs APAPx4-6 days group.
Figure 4.
Effect of repeated administration of APAP at a dose of 750 mg/kg/day on astrogliosis analyzed by GFAP immunohistochemistry in the dentate gyrus (DG) of hippocampus (A, B) and hypothalamus (C, D) of male mice. The histogram represents the means ± standard error of the mean (SEM) per section of GFAP-ir cells and GFAP-ir intensity (n = 6 samples per group). Representative micrographs show magnification views of GFAP-ir cells and GFAP-ir intensity in the DG (E-I) and hypothalamus (J-N). One-way ANOVA: (*) P < 0.05, (**) P < 0.01 and (***) P < 0.001 vs Control group. (#) P < 0.05 and (###) P < 0.001 vs APAPx3 group. ($$) P < 0.01 vs APAPx4-6h group. (&&&) P < 0.001 vs APAPx4-6 days group.
Figure 5.
Correlation analysis between plasma levels of the liver transaminases γGT (A, B), GOT (C, D), GPT (E, F) and ALP (G, H), and cell proliferation in the SGZ, assessed by the number of BrdU-ir cells, and cell survival in the hippocampus, assessed by the number IdU-ir cells, in mice that received vehicle (control group) or APAP at a dose of 750 mg/kg for 3 and 4 consecutive days and were sacrificed 6h (APAPx3 and APAPx4-6h groups), 6 days (APAPx4-6days group) and 15 days (APAPx4-15days group) after the last administration. The scatter (XY) plots represent the means ± SEM (n=6 per experimental group). Plotted lines between mean points represent the correlative changes between the two variables represented. Rho values (goodness-of-fit) were calculated. A P value less than 0.05 indicates statistical significance of correlation.
Figure 6.
Correlation analysis between plasma levels of the liver transaminases γGT (A, B), GOT (C, D), GPT (E, F) and ALP (G, H), and cell proliferation, assessed by the number of BrdU-ir cells, and cell survival, assessed by the number IdU-ir cells, in the hypothalamus of mice that received saline (control group) or APAP at a dose of 750 mg/kg for 3 and 4 consecutive days and were sacrificed 6 h (APAPx3 and APAPx4-6h groups), 6 days (APAPx4-6days group) and 15 days (APAPx4-15days group) after the last administration. The scatter (XY) plots represent the means ± SEM (n=6 per experimental group). Plotted lines between mean points represent the correlative changes between the two variables represented. Rho values (goodness-of-fit) were calculated. A P value less than 0.05 indicates statistical significance of correlation.
Figure 7.
Correlation analysis between cell proliferation, assessed by the number of BrdU-ir cells, cell survival, assessed by the number IdU-ir cells, neuronal activity, assessed by the number of c-Fos-ir cells, and astroglia, assessed by the number GFAP-ir cells, in the hippocampus (A-D) and hypothalamus (E-H) of mice that received saline (control group) or APAP at a dose of 750 mg/kg for 3 and 4 consecutive days and were sacrificed 6 h (APAPx3 and APAPx4-6h groups), 6 days (APAPx4-6 days group) and 15 days (APAPx4-15 days group) after the last administration. The scatter (XY) plots represent the means ± SEM (n = 6 per experimental group). Plotted lines between mean points represent the correlative changes between the two variables represented. Rho values (goodness-of-fit) were calculated. A P value less than 0.05 indicates statistical significance of correlation.
Figure 8.
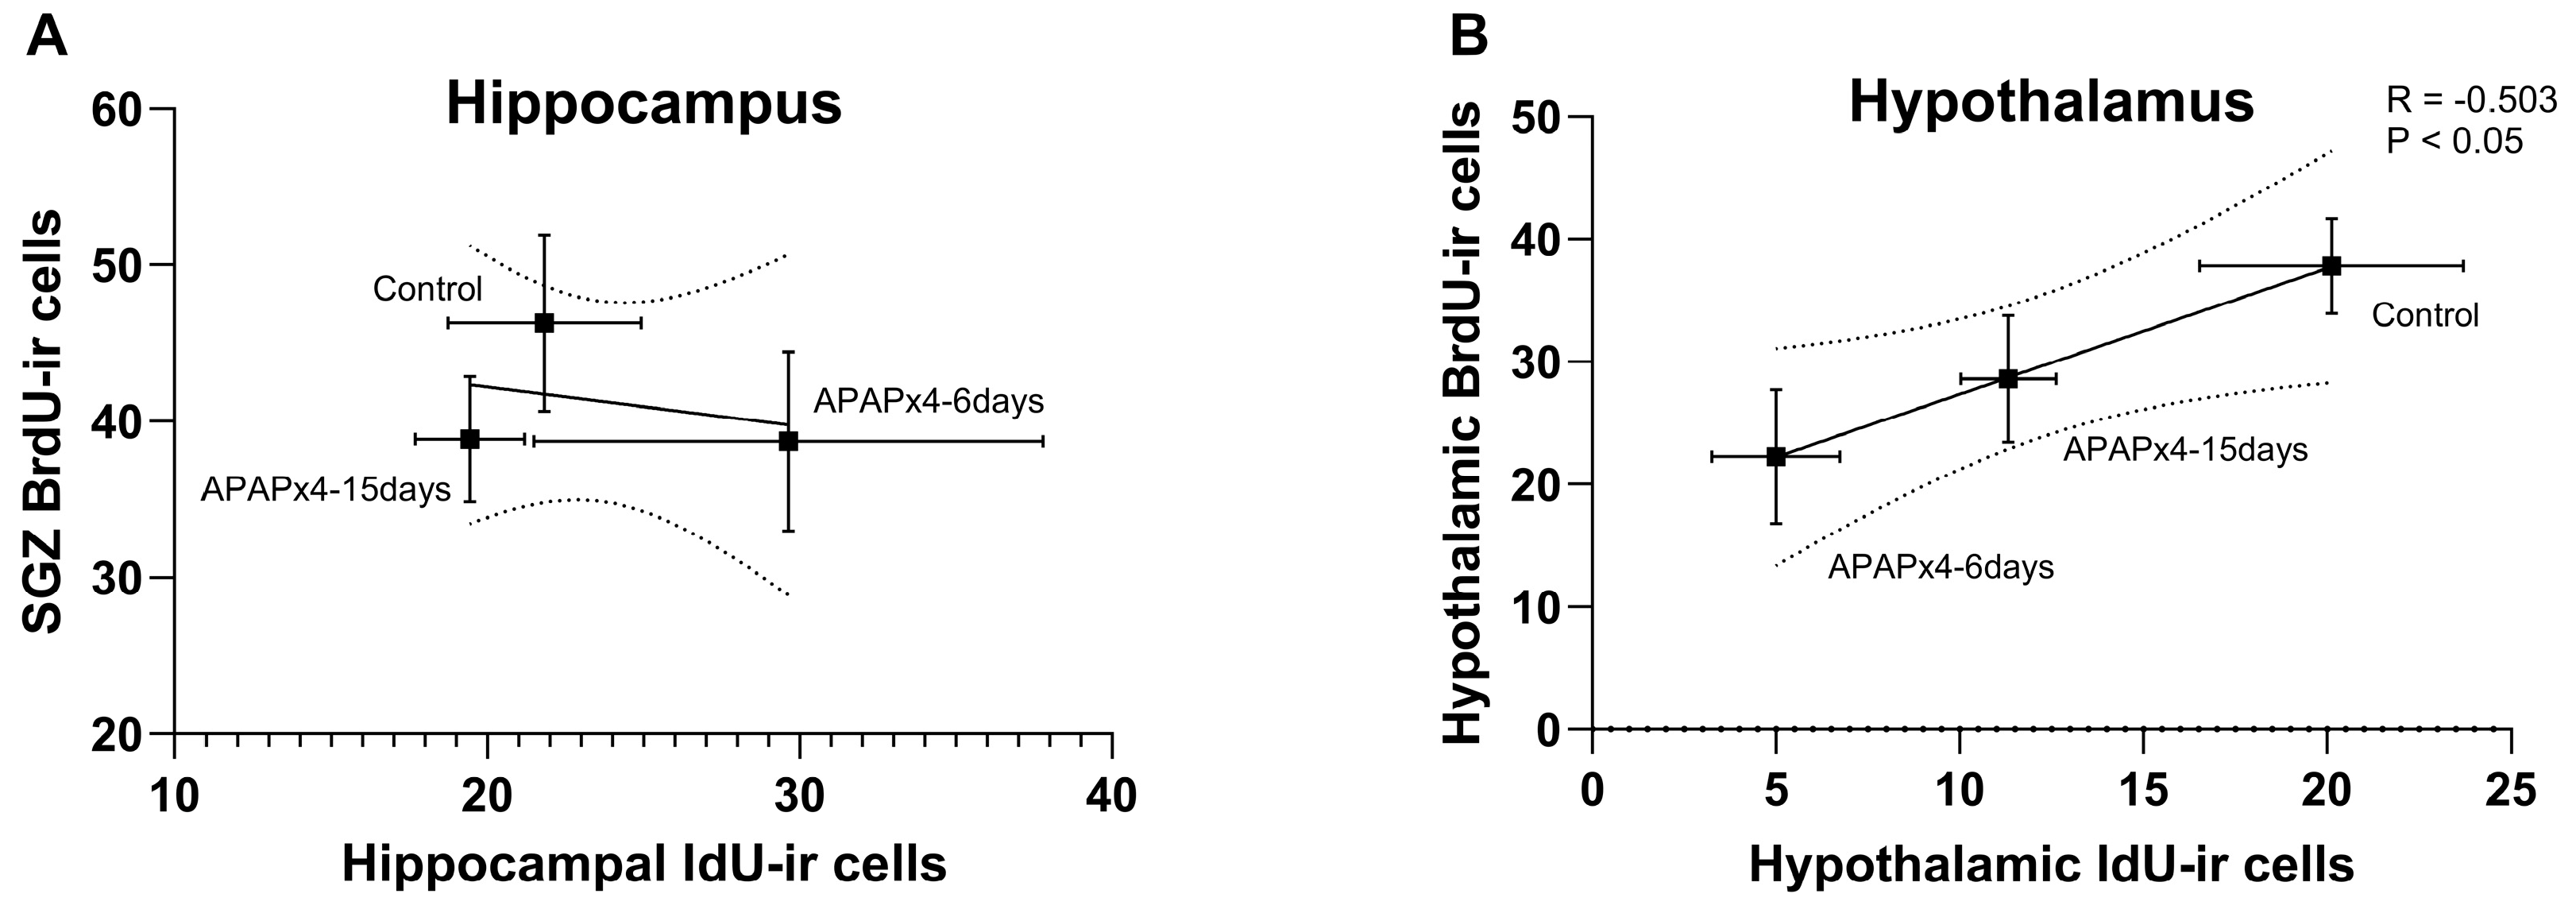
Correlation analysis between cell proliferation, assessed by the number of BrdU-ir cells, and cell survival, assessed by the number IdU-ir cells, in the hippocampus (A) and hypothalamus (B) of mice that received saline (control group) or APAP at a dose of 750 mg/kg for 4 consecutive days and were sacrificed 6 days (APAPx4-6days group) and 15 days (APAPx4-15days group) after the last administration. The scatter (XY) plots represent the means ± SEM (n = 6 per experimental group). Plotted lines between mean points represent the correlative changes between the two variables represented. Rho values (goodness-of-fit) were calculated. A P value less than 0.05 indicates statistical significance of correlation.
Figure 9.
Schematic timeline and experimental groups of repeated administration of APAP at a dose of 750 mg/kg/day for 3 (green line) or 4 (purple line) consecutive days, and cessation of APAP administration for 6 (red line) or 15 (black line) consecutive days. Black arrow: APAP administration; Grey arrow: sacrifice; yellow circle: BrdU administration (50 mg/kg/day); and green circle: IdU administration (42.75 mg/kg/day).
