1. Introduction
Internal parasites cause major constraints to small ruminant production and efficiency levels [
1,
2]. Parasite resistance to commercial anthelmintics limits the ability to control them by this method alone [
3]. Goats, unlike other ruminants, are more selective feeders but are still prone to infection by internal parasites [
4,
5,
6]. The host microbiome has been shown to become altered due to successful or unsuccessful infection [
7]. It was also shown that the parasite-associated microbiome is distinct from its host [
7]. Current diagnostic methods of study to identify selection for resistance rely on conventional means whereby fecal egg counts (FEC) and larval cultures (LC) are used [
2,
8]. Assessing infection, or lack thereof, requires time and experienced personnel [
2]. More immediate means of field-based diagnostics to determine infection or resistance appear to be forthcoming slowly [
2,
9] and would be beneficial means of identifying helminth genetic variants in goats using species-specific targeting methods.
Here, we examine two helminth control methods, zoledronic acid (ZA), an activator of γ δ T cells [
10], and a neutralizing antibody (AB) against γ δ T cells. We conducted a design investigating the effects of
Haemonchus contortus (
H. contortus) infection on Alpine wethers.
H. contortus, otherwise known as the barber pole worm, is a parasite that uses a feeding strategy through the formation of necrotic tissue. The formation of these types of tissues are hypothesized to strongly modify available environmental niches within the host causing localized and remote changes in diversity and composition of the microbiome [
11]. A microbiome is a community in an environment. We examined the relative proportion of microbial community members in these environments, the richness of the microbial communities, and the evenness of distribution of the microbial community members.
We conducted investigations of the microbiomes in blood, mesentery lymph nodes, abomasum lymph nodes, abomasum, abomasum fluid, fecal, and rumen fluid to identify significant differences. It is hypothesized that numerous parameters that include additional data points will provide a more precise means to identify infection or health based on similarity to uninfected control data parameters. Thereby providing a method towards the identification of resistance or susceptibility in wethers when it includes H. contortus. This study is specifically targeting the identification of H. contortus effects on wethers. The underlying hypotheses are that among other helminths H. contortus down-regulate their host’s protective immunity and this parasitic regulation can be reversed by certain immune modulators. We use the microbiome to identify what specifies this relationship in terms of microbial composition using 16S rRNA.
Specifically, this microbiome study investigates the time course of immune responses based on the microbiome of wethers after infection with
H. contortus. Zoledronic acid (ZA), an activator of γ δ T cells [
10], and a neutralizing antibody (AB) against γ δ T cells were applied to goats that were inoculated with L3
H. contortus. Zoledronic acid was used in this study due to its effects on the immune system. It was compared to identify whether its use as a treatment would alter microbial composition of hosts infected by
H. contortus. Similarly, the activator of γ δ T cells, and a neutralizing antibody (AB) against γ δ T cells were applied to goats for the same reason to identify if there would be an identifiable change in microbial composition after effecting the immune system of the animals in the study. The importance of γ δ T cells are that they are active independently of CD4 proteins that also seem to be involved in parasite control [
12,
13,
14,
15,
17]. The effects of the treatments were estimated by changes in OTUs defined as expressed microbial phyla in blood, mesentery lymph nodes, abomasum lymph nodes, abomasum, abomasum fluid, fecal, and rumen fluid samples.
2. Materials and Methods
2.1. Animals and Treatments
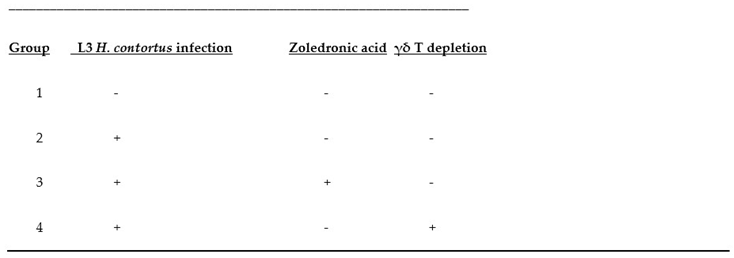
Three-month old Alpine wethers (castrated young male goats) raised in indoor pens were checked for fecal egg counts (FEC) and drenched with Cydectin to remove any existing parasites. The wethers were allocated randomly to four groups of 10 animals each, and two or three animals from each group assigned to one of the four pens. Treatment groups and types are shown in
Table 3. All wethers were allowed to acclimatize to pens and feeders for one week. They were fed 500 g of ground grass (50%) and alfalfa (50%) hays and 200 g of low protein concentrate pellet per animal were supplied daily.
Samples from five wethers in the four groups highlighted above were obtained at 7 and 21 dpi (days post inoculation). From each individual goat and time point, samples were obtained from blood, mesentery lymph node, abomasum fluid, abomasum, abomasum lymph node, fecal, and rumen fluid samples. Collectively this brings the total of samples to 240. Samples are labeled by type (e.g., blood) goat name e.g., AB713, and sampling time. (e.g., 7). Therefore, sample blood-AB-713-7 is a blood sample form a goat labeled 713 taken at 7 dpi.
Forty Alpine wethers (114.2±0.92 d of age and 19.4±0.33 kg body weight (BW) at the initiation of the study) that had been raised in indoor pens at the Langston University AIGR farm were used. Wethers were checked for fecal egg counts (FECs) and confirmed to be nematode-parasite free. Wethers were placed in pens by BW and then randomly in each pen. A small number of treatment assignments followed, changed to achieve more similar mean and variation in BW with no exclusions. All animals were allowed to acclimatize to pens and feeders for daily supplies of 200g concentrate pellet per animal composed of 500 g of grass (50%) and alfalfa (50%) hays. Experimental design. The experimental design is shown in table 1.
Four different treatment groups were collected and examined at the American Institute for Goat Research of Langston University (Langston, OK USA). Forty wethers (10 per treatment) were used as non-infected controls (NI), others infected with H. contortus only (IO), a treatment group infected and with injection of zoledronic acid (Sigma, MO; 75 /kg BW: ZA) or anti- γ δ T cells antibody (GB21A (IgG2b), Washington State University, WA; 3 mg/goat: AB). Under controlled conditions wethers were evaluated following the introduction of infections (different treatments NI, IO, ZA, and AB) at 7dpi and 21 dpi. Vitals were examined through weight check, whole blood evaluation through complete blood count (CBC) with Differential Count if indicated, and fecal egg counts (FEC) tested. Cross comparisons were made between NI samples and ZA, NI samples to AB, IO samples to ZA, IO to AB, and ZA to AB to identify correlating patterns.
On the first (1) day prior to the H. contortus infective larvae infection (L3; hatched and isolated from feces being collected from LU goats), the AB injection was administered intravenously. ZA was administered intravenously 7 days prior to and on 0,7, and 14 dpi. Initially all wethers except those in Group I were given 10,000 H. contortus L3 by gavage. Five animals from each group were euthanized on 7 dpi for sampling and other five animals were euthanized 21 dpi.
2.2. Sampling collection and processing
Abomasum (Abo), abomasum lymph nodes (ALN), mesentery lymph nodes (MLN), abomasum fluids (AF), rumen fluids (RF), feacal (Fec) and blood (Blood) samples were collected from 5 goats in 4 treatment groups 7 dpi and 21 dpi. Samples were placed immediately in liquid nitrogen, and then into labeled bags (ID, name of tissue, and date) and a – 80 degree freezer. Tissue samples were sheared using a sonic dismembrator (Fisher Scientific Sonic Dismembrator Model 100, Pittsburgh, PA 15275). Nucleic acid isolations were conducted on dismembered tissue using a modified version of the Microbiome DNA Isolation kit from Norgen Biotek Corp. Nucleic acid isolation were conducted from fecal and blood also using a modified version of the Microbiome DNA Isolation kit from Norgen Biotek Corp.
The Abo, ALN, MLN, AF, RF, Fec and Blood sample collections had parameters (QA/QC) that resulted in samples from 20 prepared libraries that were used from samples collected 7 dpi and 20 prepared libraries from samples collected 21 dpi. The prepared libraries were sequenced on a Swift Biosciences 16S rRNA NGS Illumina MiSeq instrument. Sequences (raw fastq) were filtered and normalized for microbiome analysis using Mothur. Additionally, the default Burrows-Wheeler alignment tool (BWA) parameters on Partek Flow suites were used with Kraken as validation following Mothur [25;27;30].
2.3. DNA extraction, library preparation, sequencing, and sequence processing
DNA libraries were prepared for bar-code placement, and third-party 16S rRNA sequencing. Briefly, DNA extraction was conducted using Microbiome DNA Isolation Kits (Norgen Biotek Corp. (Thorold, ON, Canada). Prepared libraries were constructed and later sequenced using the services of a commercial provider (Swift Biosciences: Ann Arbor, Michigan, USA) on Illumina MiSeq instruments. Raw sample sequence datasets were obtained through sequencing using 16S rRNA NGS Illumina MiSeq instruments. Quality assurance and quality control (QC/QA) analyses were used for 7dpi (n=19) and 21 dpi (n=20) samples that underwent microbiome analyses using Mothur MiSeq manual protocol (v1.45.3) [
19]. For further validation, analysis was completed through default Partek Flow software suites for the microbiome using Kraken [
17,
18].
2.4. Phylogenetic and diversity assessment of microbial communities
Mothur (v1.45.3) was used for assigning sequencing to OTUs, phylogenetic classification of OTUs obtained, and calculation of alpha and beta diversity and Kraken (Shannon and Simpson) [
17,
18] diversity indices. Default Burrows-Wheeler Alignment (BWA) parameters on a proprietary software suite (Partek Flow: St. Louis, Missouri, USA) were used with Kraken [
17,
18] being used for validation. The MiSeq SOP(Standard operating procedure) was followed to process the sequences. In total we had 117 samples collected from 7 dpi and 125 samples from 21 dpi and this summed up to 18.2 million reads. These reads were subjected to quality filtering, removing low-quality reads, chimeric sequences, and any potential artifacts which resulted in removal of 22 samples. The final number of good sequences (5.9 millions) were clustered into Operational taxonomic Units (OTUs) using the cutoff of 0.03 and they were classified into taxonomic rank up to genus level using the reference bacterial alignment obtained from SILVA [
21]. Kraken[
17,
18] , through the default Partek Flow software was used to validate the mothur result and also calculate more diversity indices such as Shannon and Simpson. Default Burrows-Wheeler Alignment (BWA) parameters on a proprietary software suite (Partek Flow: St. Louis, Missouri, USA) were used with Kraken [
17,
18] being used for validation. The raw sequence data were uploaded to the National Institute for Biotechnology Information (NCBI) and have been released to the public since September 2020.
2.5. Operational Taxonomic Unit assessments
After classifying the sequences into OTUs and performing their taxonomic classification, there were 446,225 OTUs at the species level from 217 samples with . Firmicutes (31.7%), Bacteroidetes (22%) and unclassified rank (16%). Alpha diversity were calculated with subsampling (using 100) and beta diversity was calculated to make PCoA plots.
3. Results
3.1. Microbial community composition
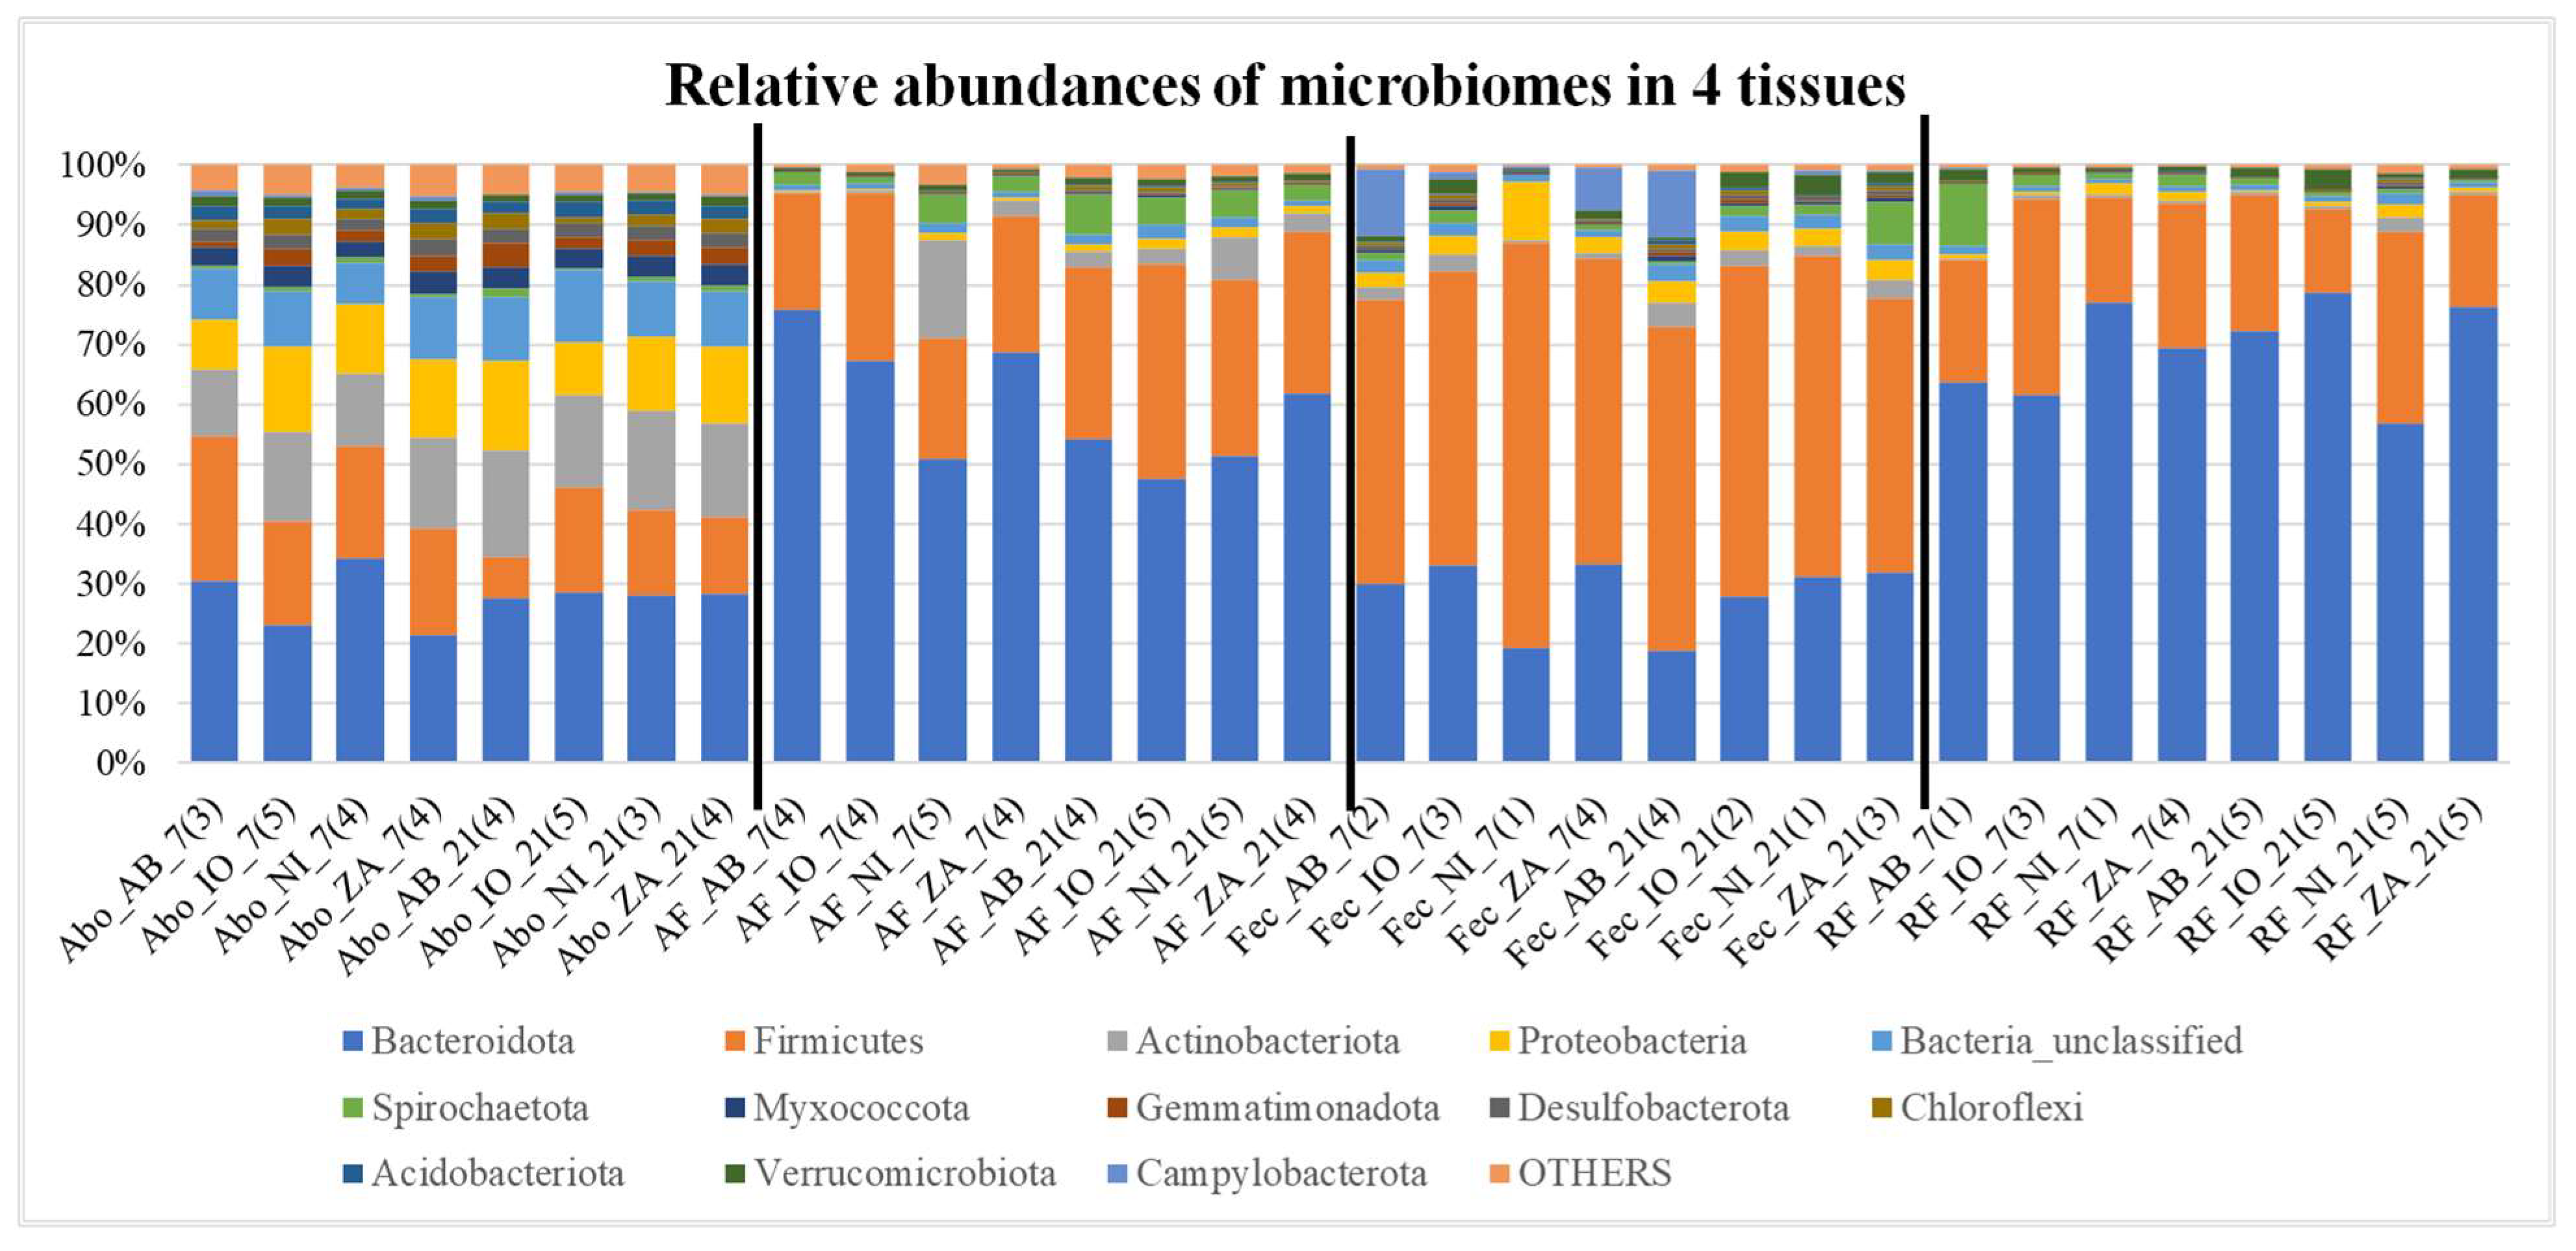
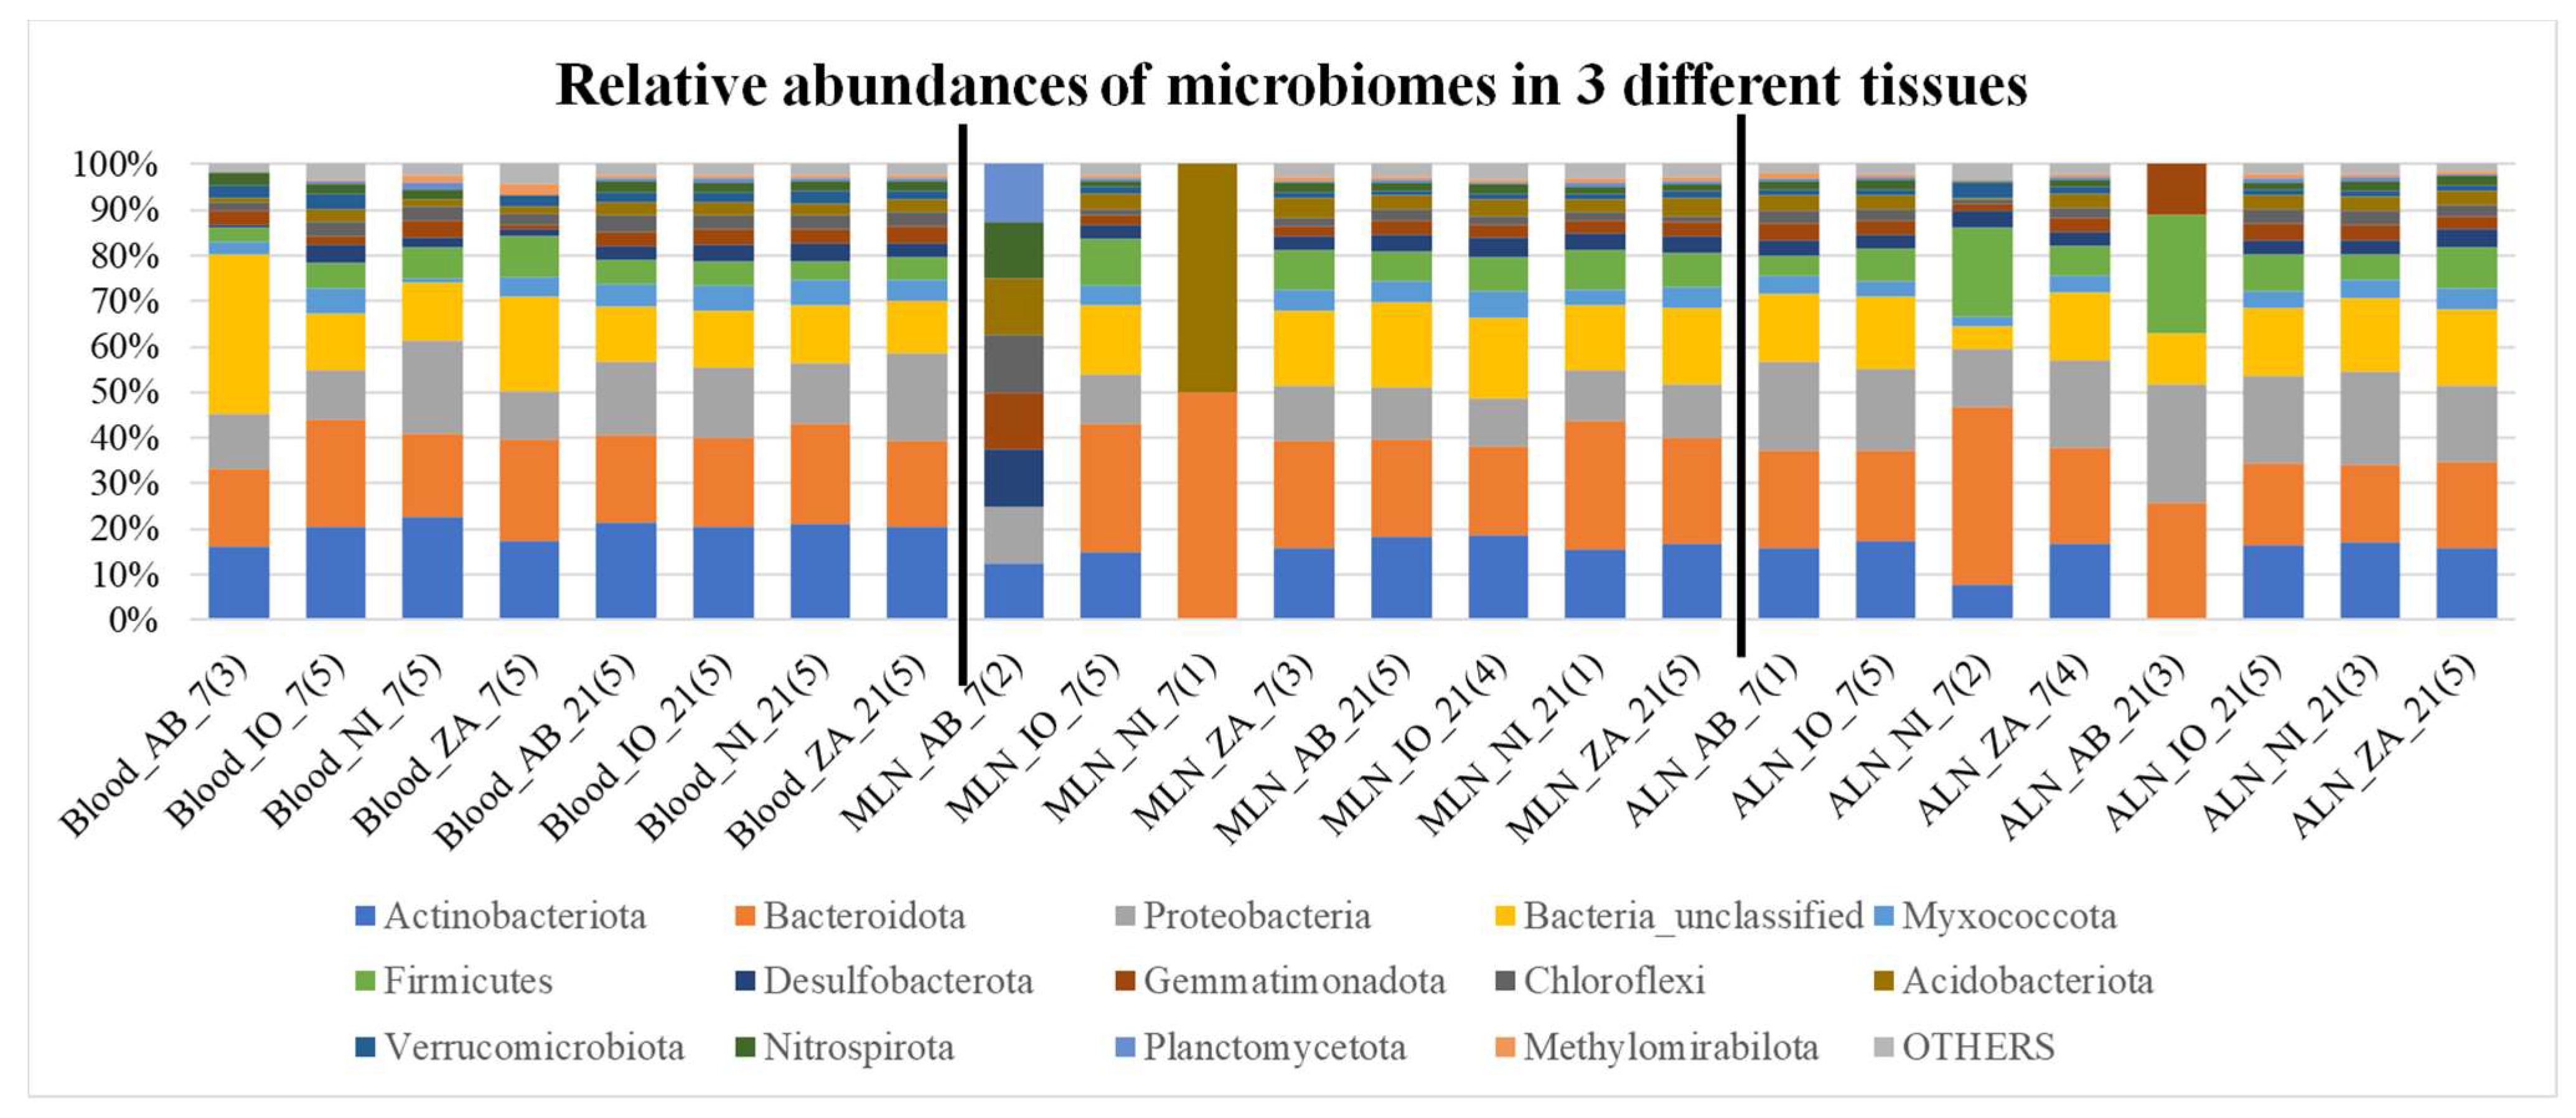
Overall microbial community compositions in all samples are shown in
Figure 2 and
Figure 3. In these graphs there is inherent differences of community as well as ratio of Bacteriodetes and Firmicutes among different samples. It also appears that there are differences such as fecal samples having more Firmicutes than Bacteroidetes, when compared to other samples (
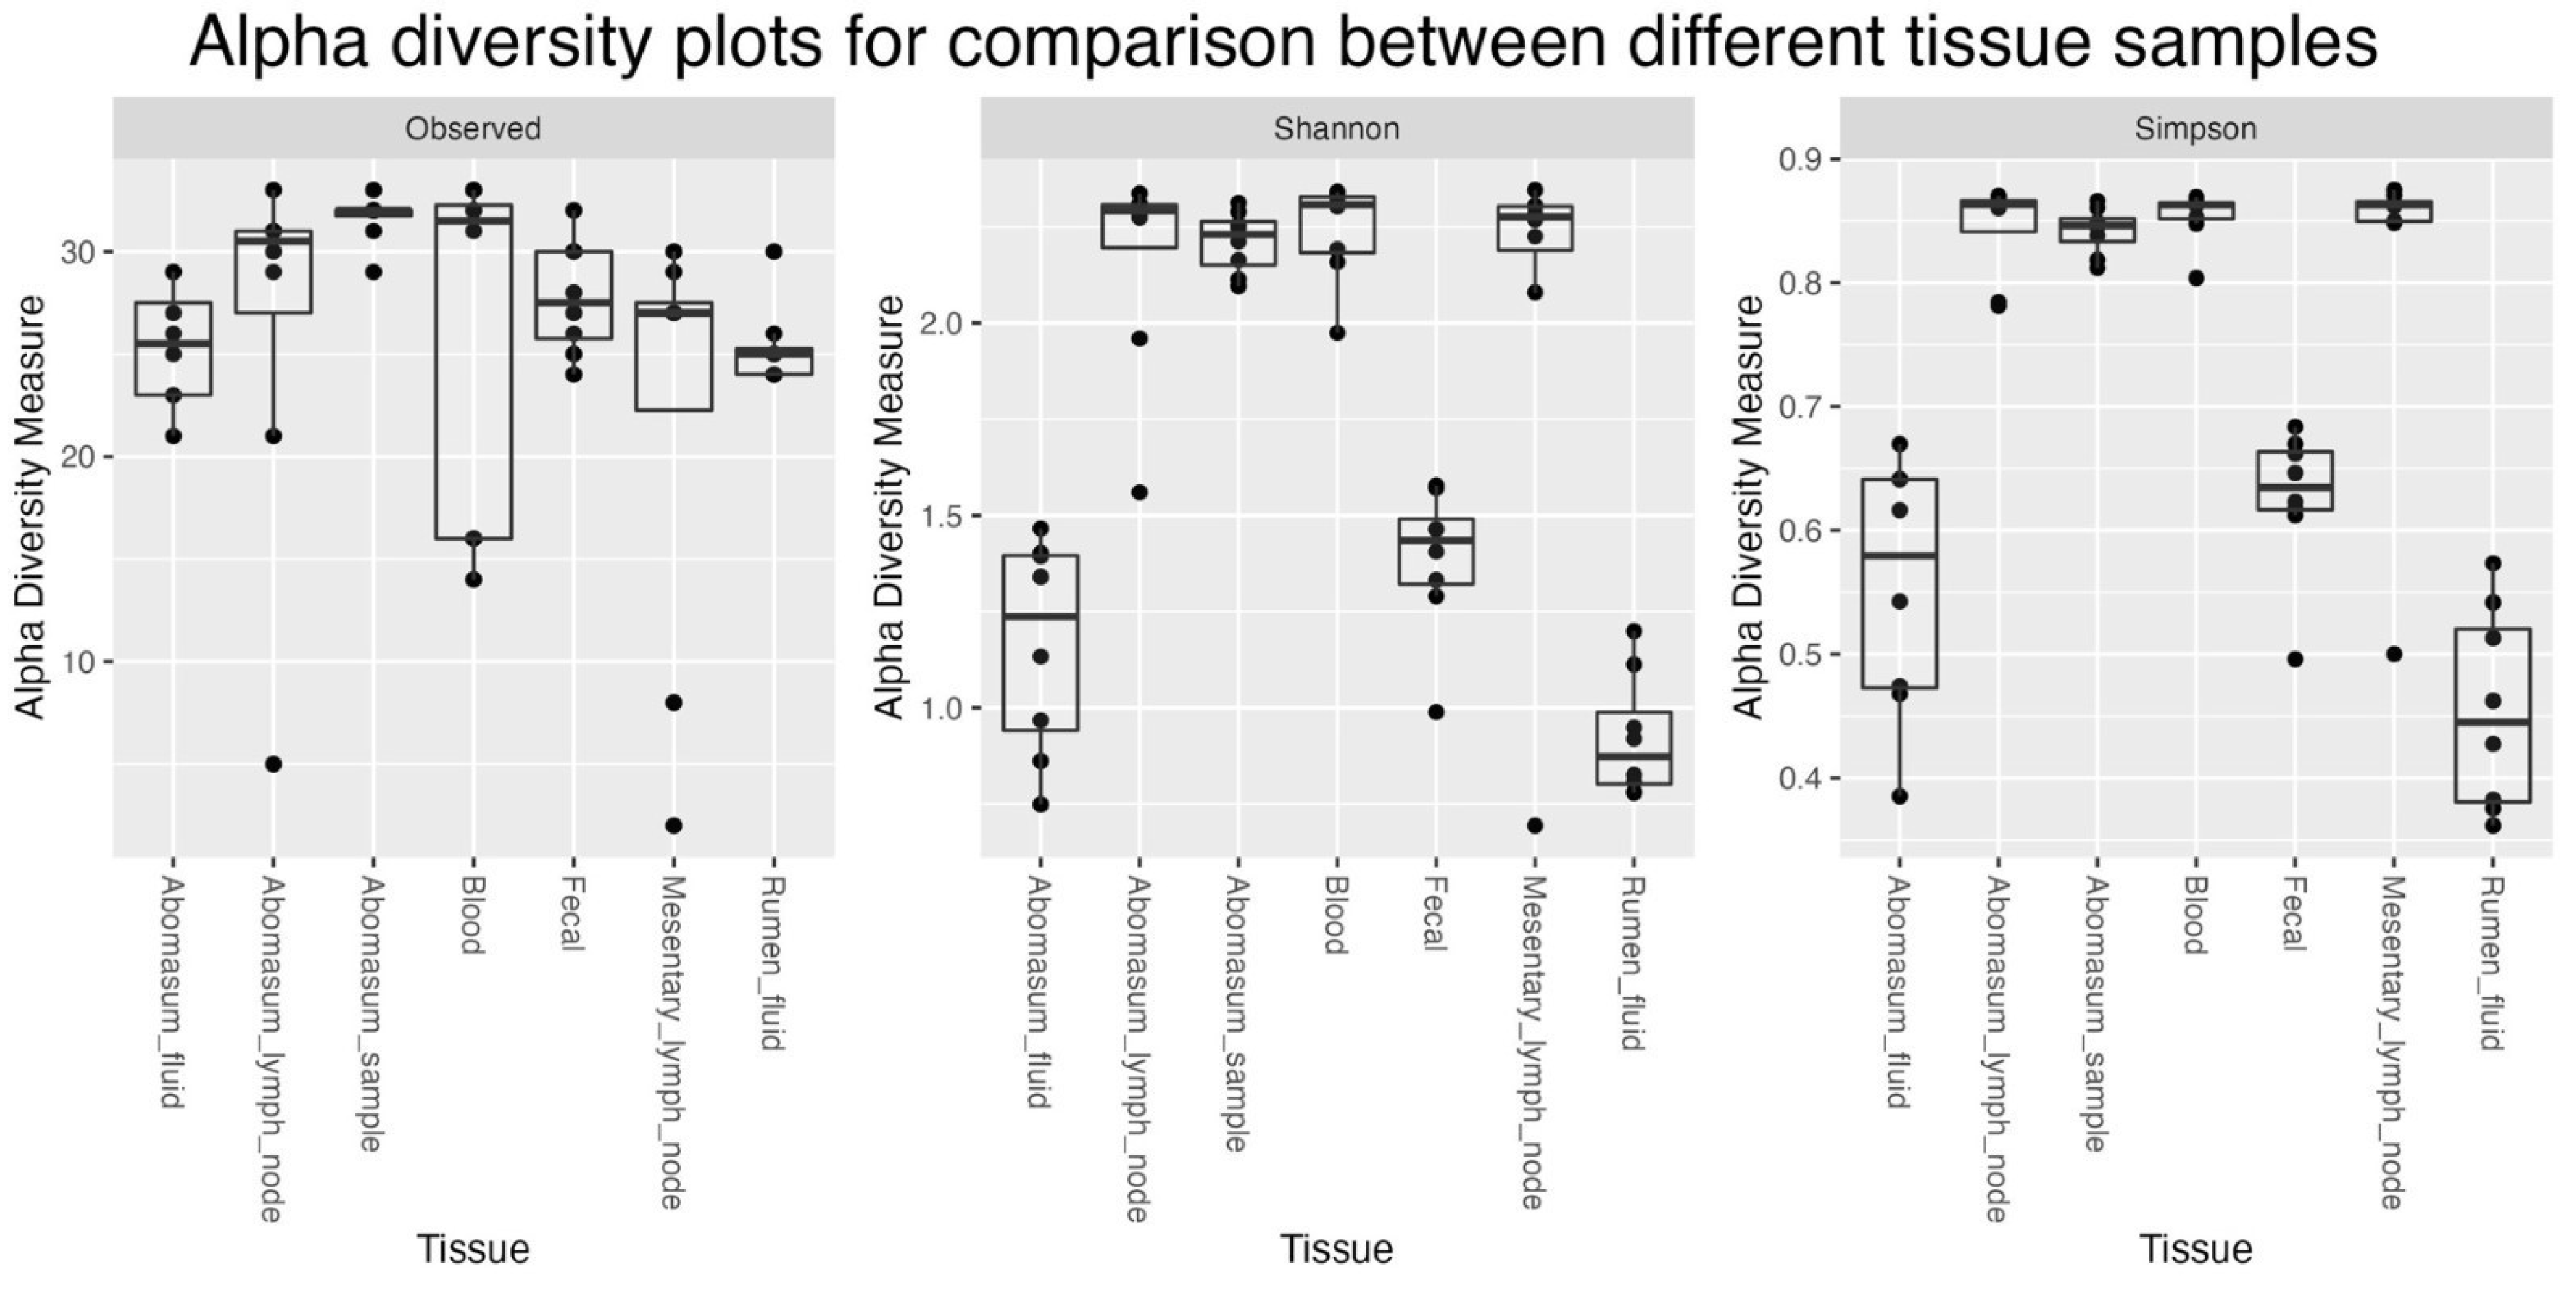
Figure 2 and 3). Besides, it seems like the Bacteroidetes and Firmicutes forms the majority of the microbiome in Fec, AF, and RF samples when compared to all others. Different indices of alpha diversity within different samples are shown in Supplementary Table AAA and the box plots are shown in
Figure 1.
Firmicutes/Bacteroidetes ratio (The F and B ratio) for all samples where an “average” was calculated on the spreadsheet to identify any correlation. The figure (line graph:
Figure 4) was arranged according to samples, dpi, and treatment. The graph indicates that fecal samples have very high F/B ratios compared to all others. There is no clear visible difference when they are grouped according to dpi or treatment (
Figure 4).
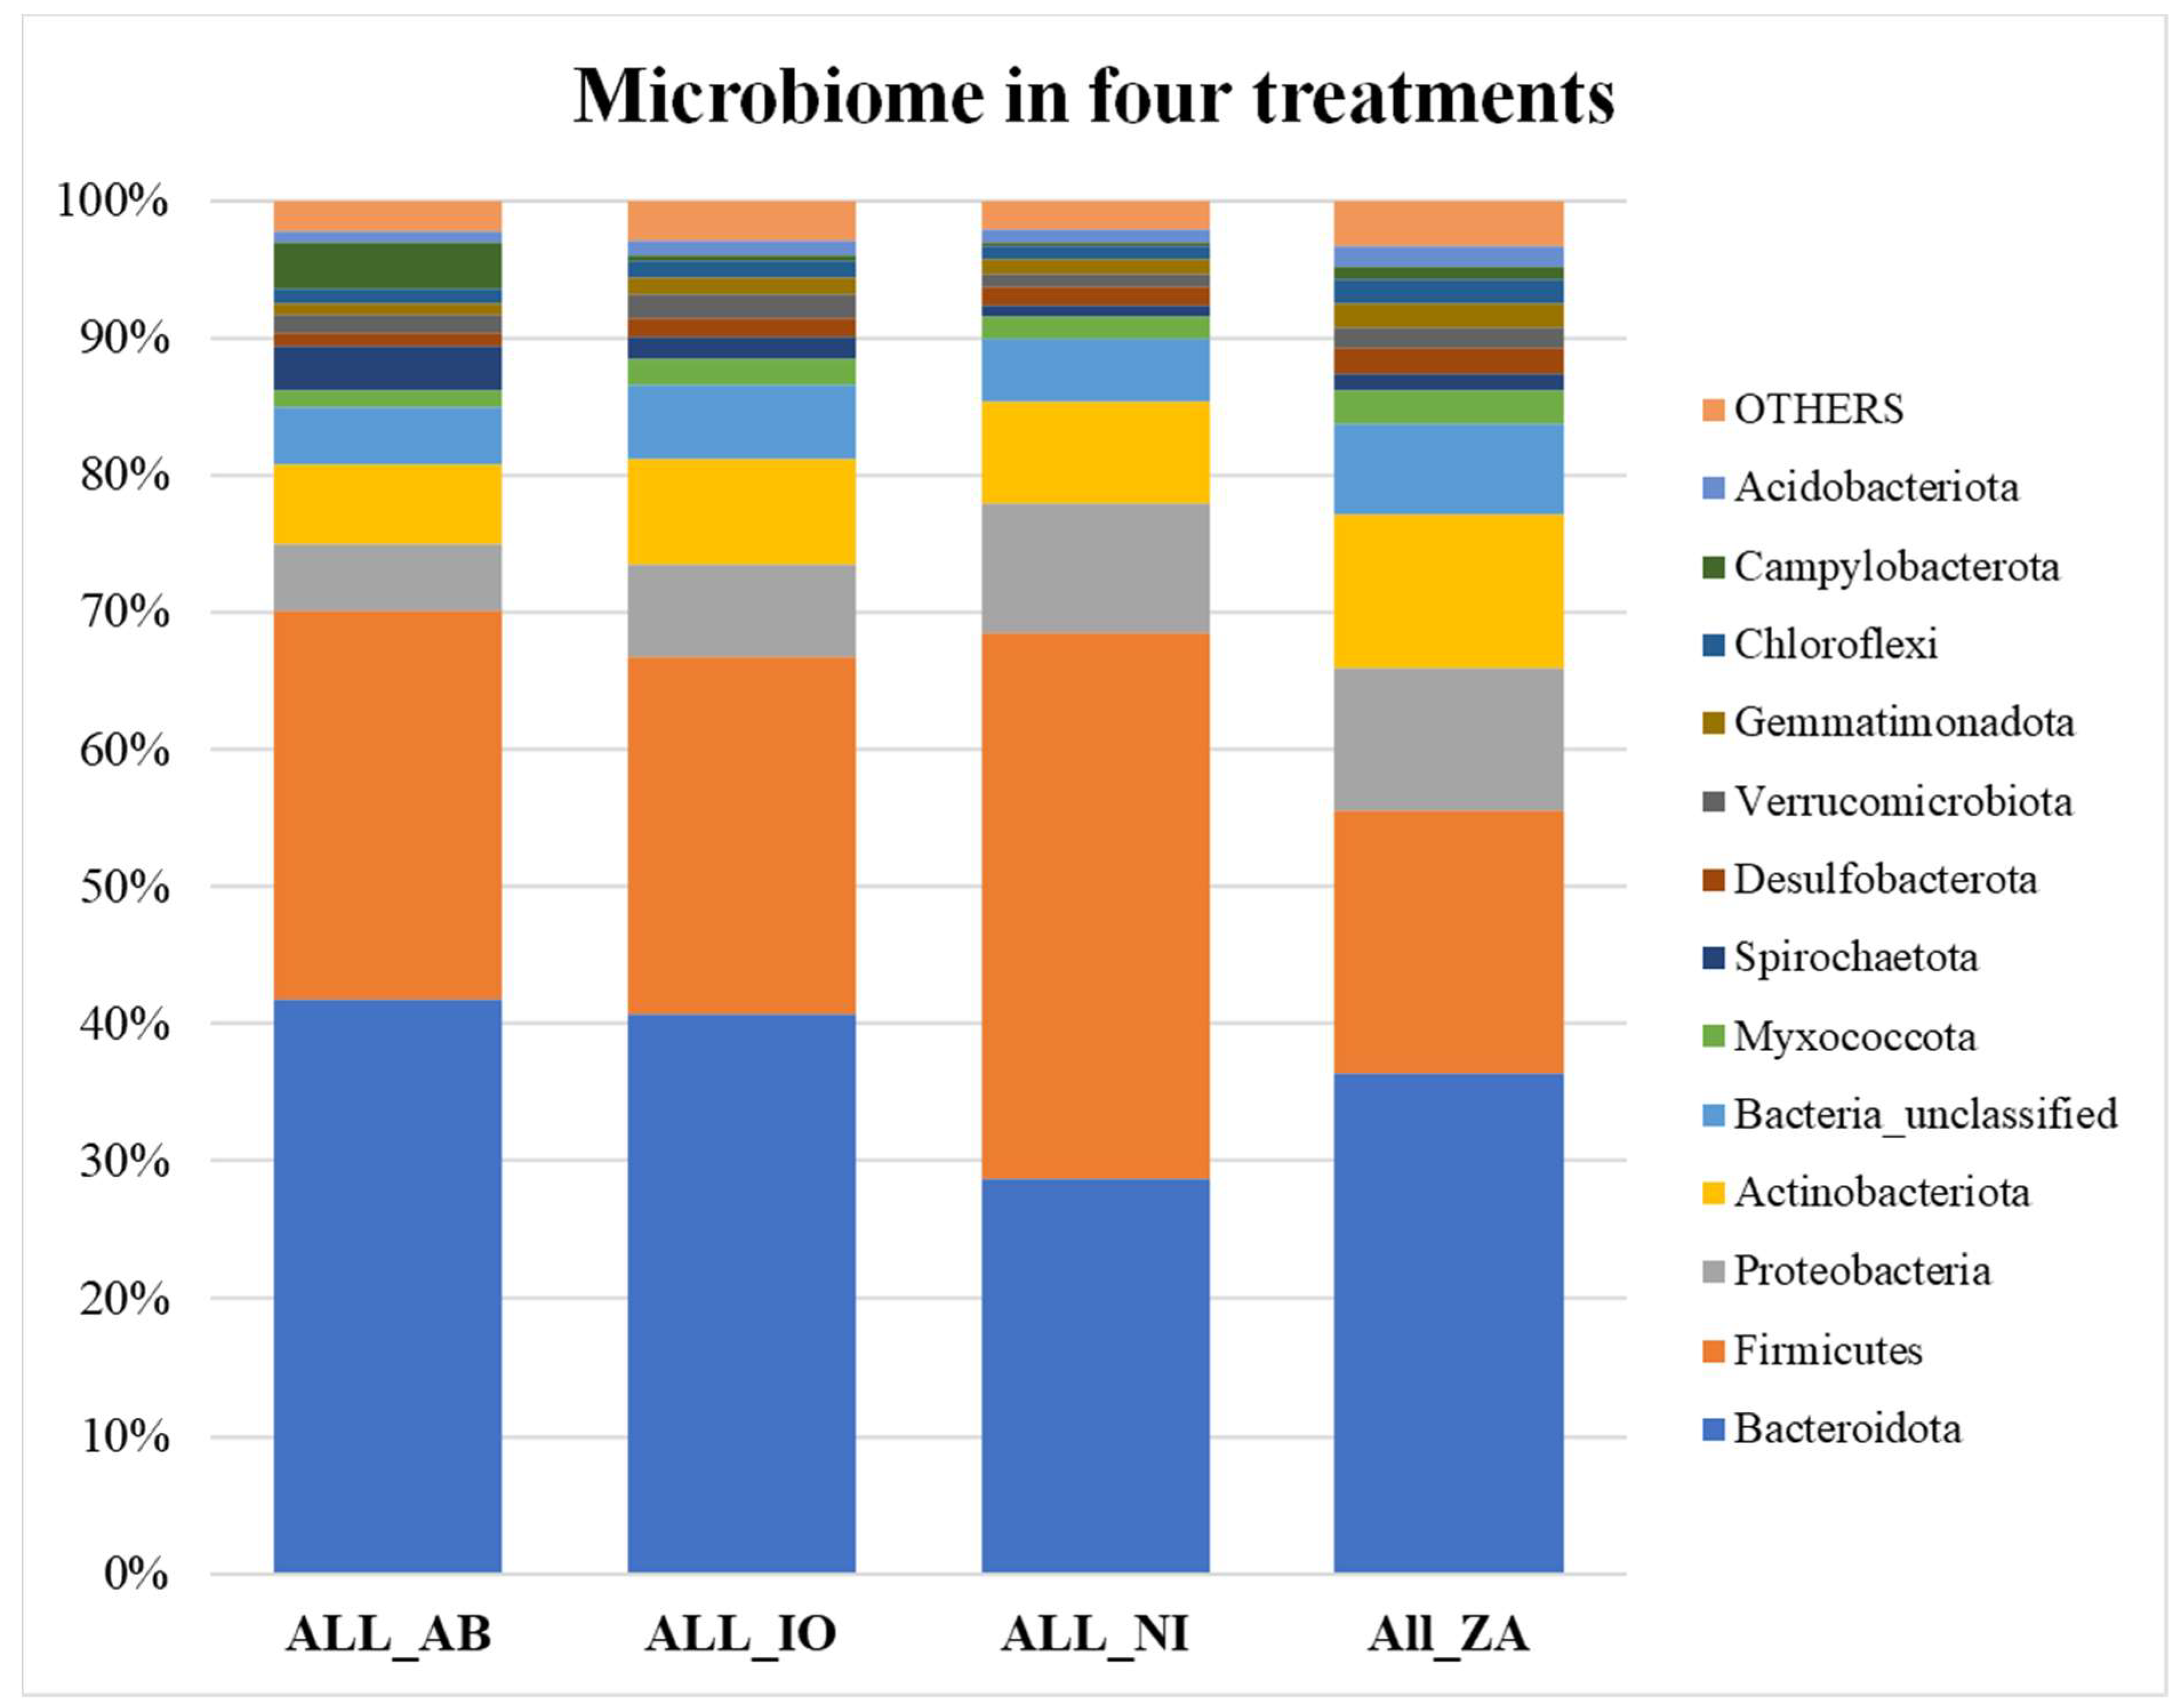
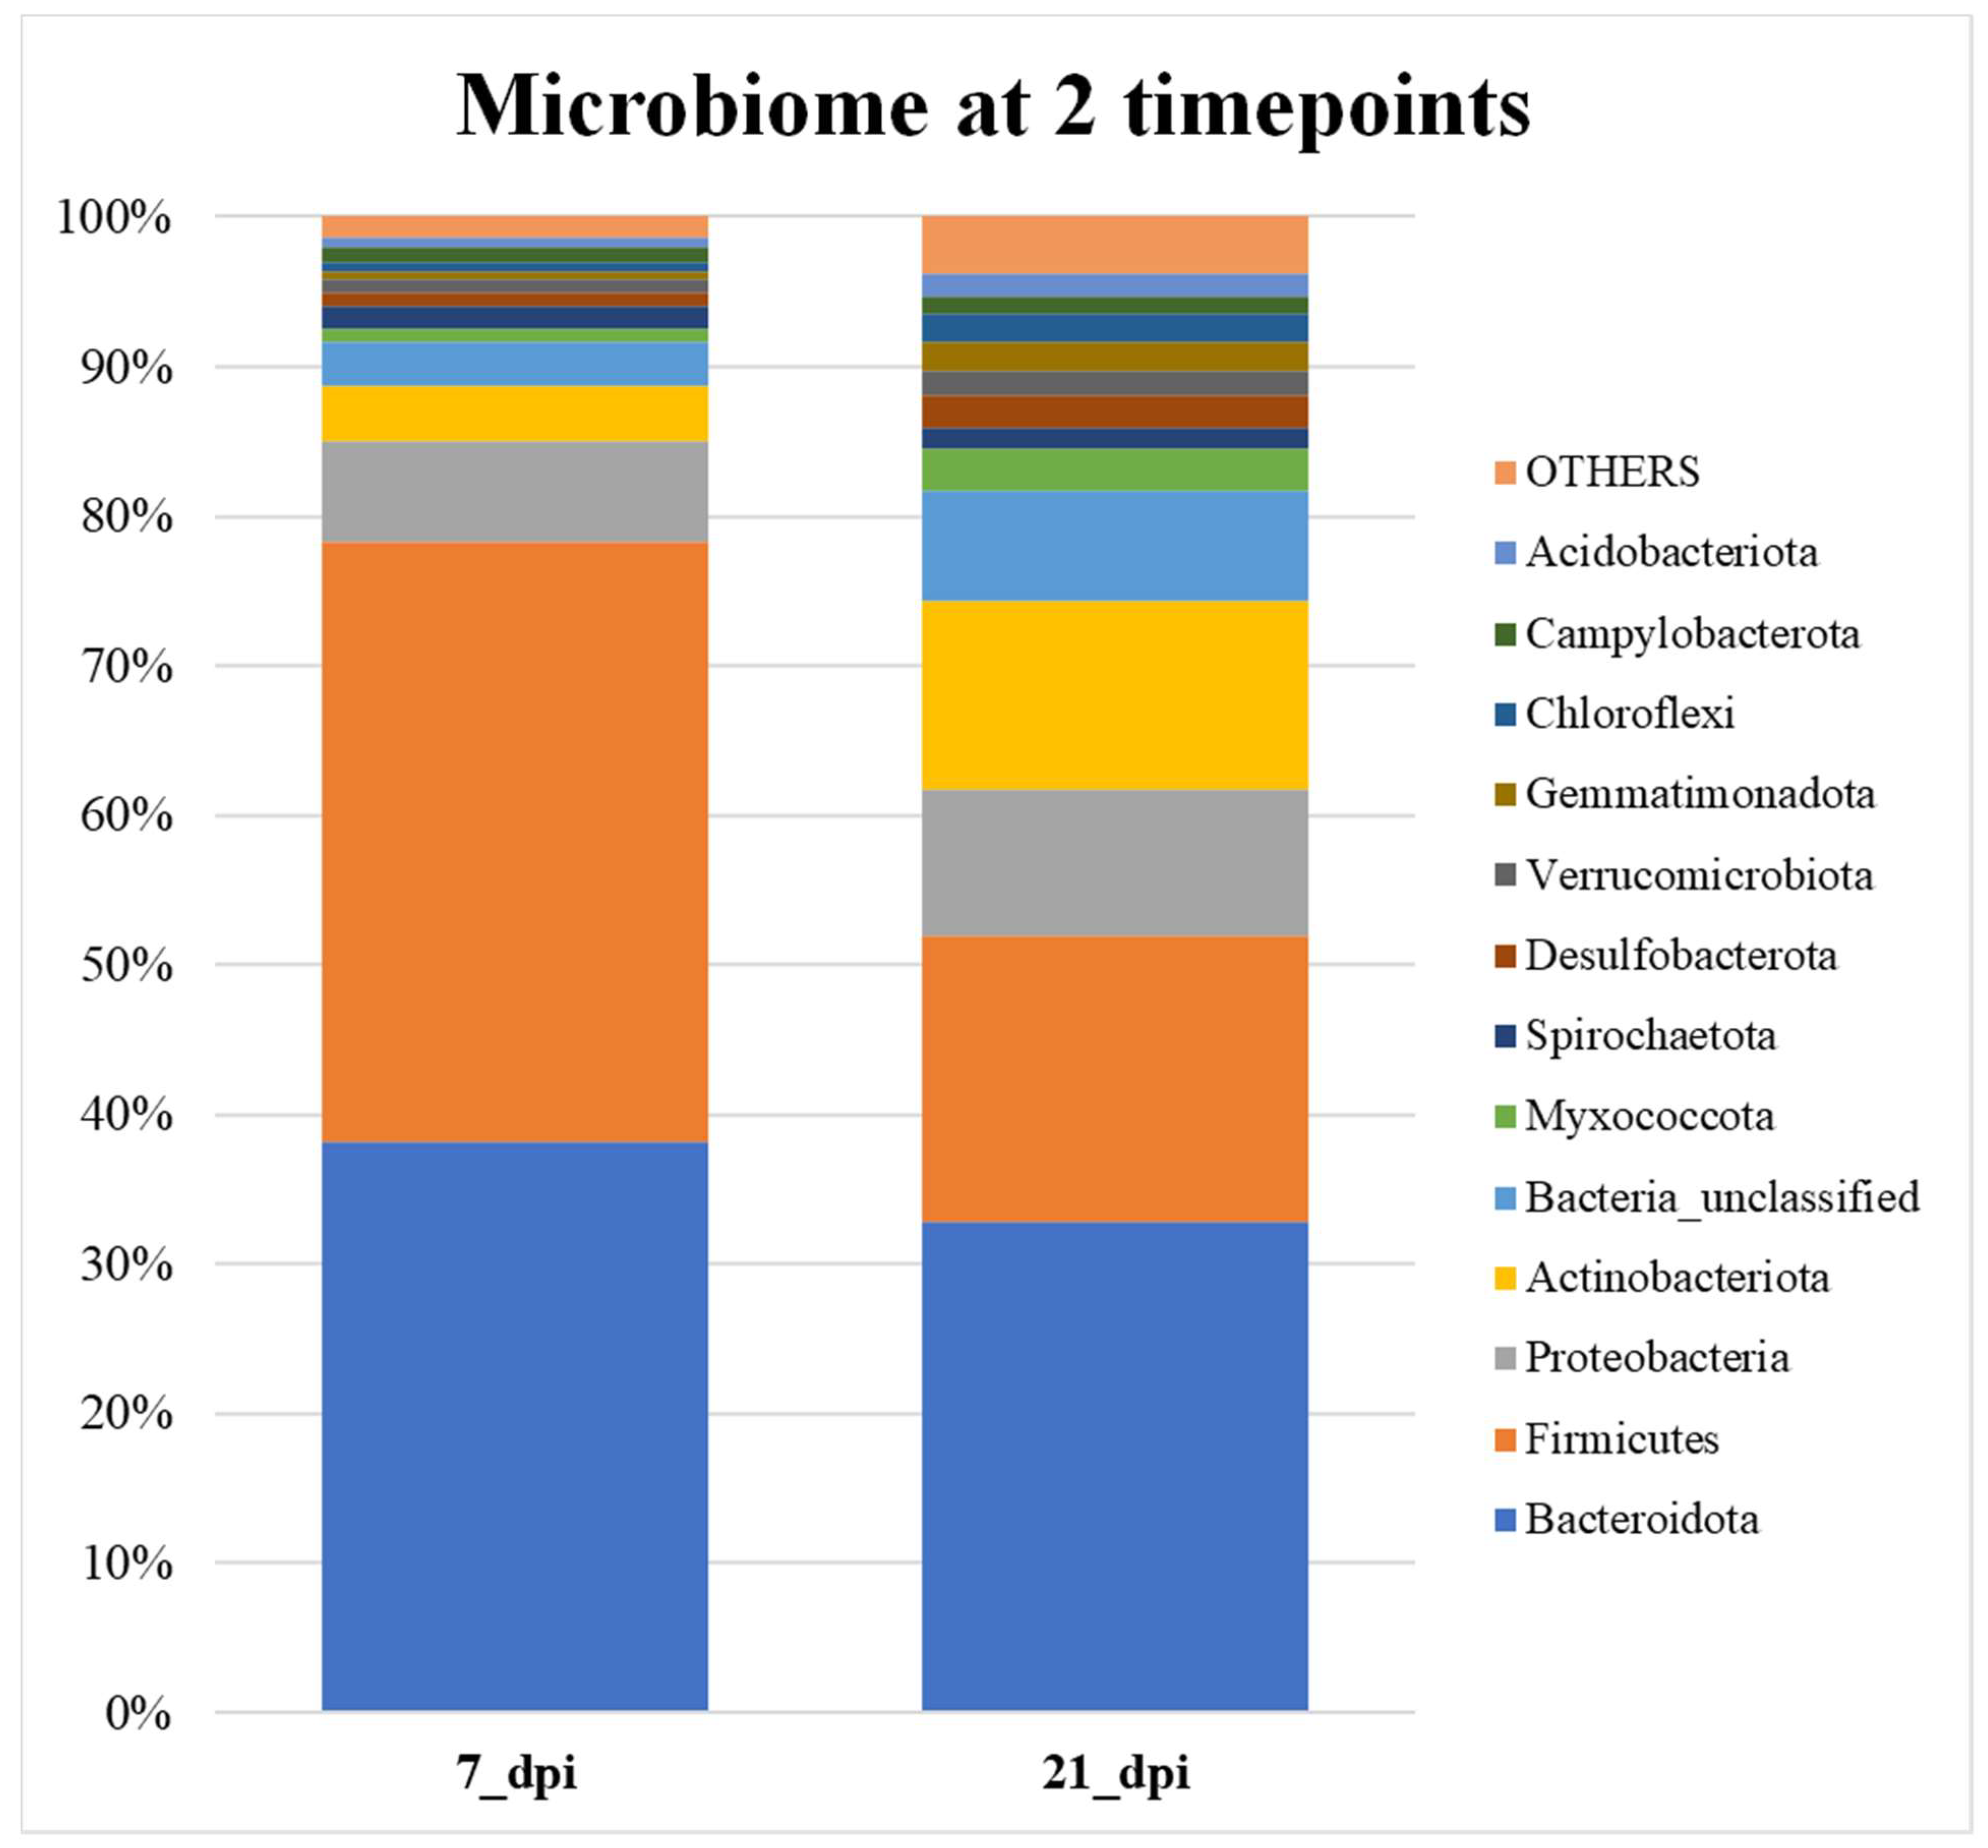
All samples were averaged in each treatment category and then graphed. The bar graph in figure 5a shows that overall, the no infection (NI) samples have more Firmicutes than Bacteroidetes, therefore, less F/B ratio whereas others are reverse. Figure 5b shows that overall, the Firmicutes and Bacteroidetes make up the higher percentage of total microbial communities at 7 days when compared to the 21 days. At 21 days the abundance of Firmicutes decreases very significantly.
Analysis of molecular variance (AMOVA) analysis showed that there is a significant difference with different tissues (for fecal and rumen fluid pairwise sequences).
Table 1 below shows the metastats value and the significant p-values for the beta diversity comparison between different pairwise treatments. The OTUs belonging to either Bacteroidetes or the Firmicutes or Myxococcota are the causes for significant (p-value<0.05) level of differences between the listed temperature. There were no OTUs that were contributing for the differences between ZA versus IO.
Figure 5.
a. The relative abundance bar graph showing the percentage abundance of different microbial groups averaged over 4 different treatments (NI, IO, ZA, and AB) across all samples. Here, the groups that were present in percentage lower than 1% were lumped into the group “others”.
Figure 5.
a. The relative abundance bar graph showing the percentage abundance of different microbial groups averaged over 4 different treatments (NI, IO, ZA, and AB) across all samples. Here, the groups that were present in percentage lower than 1% were lumped into the group “others”.
Table 1.
The metastats value and the significant p-values for the beta diversity comparison between different pairwise treatments. The OTUs belonging to either Bacteroidetes or the Firmicutes or Myxococcota are the causes for significant (p-value<0.05) level of differences between the listed temperature. There were no OTUs that were contributing for the differences between ZA versus IO.
| OTU taxonomy |
p-value |
mean(group1) |
variance(group1) |
stderr(group1) |
mean(group2) |
variance(group2) |
stderr(group2) |
| NI vs AB |
|
|
|
|
|
|
|
| Bacteria (100); Bacteroidota(100);Bacteroidia(100);Bacteroidales(100);Muribaculaceae(100);Muribaculaceae_ge(100); |
0.000999 |
0.010968 |
0.003302 |
0.010321 |
0 |
0 |
0 |
| Bacteria (100); Bacteroidota(100);Bacteroidia(100);Bacteroidales(100);F082(100);F082_ge(100); |
0.03996 |
0.000968 |
0.000009 |
0.00054 |
0.015455 |
0.003319 |
0.010029 |
| Bacteria(100);Bacteroidota(100);Bacteroidia(100);Bacteroidales(100);Prevotellaceae(100);Prevotella(100); |
0.04995 |
0.003226 |
0.000049 |
0.00126 |
0.016667 |
0.001685 |
0.007147 |
| NI vs IO |
|
|
|
|
|
|
|
| Bacteria(100);Bacteroidota(100);Bacteroidia(100);Bacteroidales(100);Muribaculaceae(100);Muribaculaceae_ge(100); |
0.000999 |
0.010968 |
0.003302 |
0.010321 |
0 |
0 |
0 |
| Bacteria(100);Bacteroidota(100);Bacteroidia(100);Bacteroidales(100);Prevotellaceae(100);Prevotellaceae_unclassified(100); |
0.008991 |
0.00871 |
0.000185 |
0.002443 |
0.037308 |
0.005224 |
0.010023 |
| ZA vs AB |
|
|
|
|
|
|
|
| Bacteria(100);Firmicutes(100);Clostridia(100);Oscillospirales(100);Oscillospiraceae(100);UCG-002(100); |
0.048951 |
0.002653 |
0.000037 |
0.000864 |
0.01 |
0.000394 |
0.003454 |
| ZA vs NI |
|
|
|
|
|
|
|
| Bacteria(100);Bacteroidota(100);Bacteroidia(100);Bacteroidales(100);Prevotellaceae(100);Prevotellaceae_unclassified(100); |
0.008991 |
0.029796 |
0.002815 |
0.007579 |
0.00871 |
0.000185 |
0.002443 |
| Bacteria(100);Myxococcota(100);Polyangia(100);Polyangiales(100);BIrii41(100);BIrii41_ge(100); |
0.031417 |
0.009388 |
0.000143 |
0.001711 |
0.007742 |
0.000238 |
0.002771 |
| Bacteria(100);Bacteroidota(100);Bacteroidia(100);Bacteroidales(100);Muribaculaceae(100);Muribaculaceae_ge(100); |
0.033276 |
0.009592 |
0.001021 |
0.004564 |
0.000323 |
0.000003 |
0.000323 |
| Bacteria(100);Bacteroidota(100);Bacteroidia(100);Bacteroidales(100);Prevotellaceae(100);Prevotella(100); |
0.044955 |
0.000816 |
0.00002 |
0.000641 |
0.010323 |
0.000603 |
0.004411 |
| IO vs AB |
|
|
|
|
|
|
|
| Bacteria(100);Myxococcota(100);Polyangia(100);Polyangiales(100);BIrii41(100);BIrii41_ge(100); |
0.042677 |
0.008077 |
0.000279 |
0.002315 |
0.00697 |
0.000128 |
0.00197 |
| Bacteria(100);Bacteroidota(100);Bacteroidia(100);Chitinophagales(100);Chitinophagaceae(100);Ferruginibacter(100); |
0.047613 |
0.0075 |
0.000145 |
0.001668 |
0.00697 |
0.000134 |
0.002017 |
| ZA vs IO |
|
|
|
|
|
|
|
| None significant |
|
|
|
|
|
|
|
Figure 5.
b. The relative abundance bar graph showing the percentage abundance of different microbial groups averaged over 2 timepoints (7 and 21 dpi across all samples. Firmicutes/Bacteroidetes (F/B) ratio for the average of each treatment group. Here, the groups that were present in percentage lower than 1% were lumped into the group “others”.
Table 2 shows the metastats value and 5 significant p-values for the beta diversity comparison between 7 dpi and 21 dpi. There are 5 OTUs that is causing the significant differences between 7 and 21 dpi samples. All these OTUs belong to either Bacteroidetes or the Firmicutes signifying that the levels of these groups are significantly changing between these two timepoints. .
In
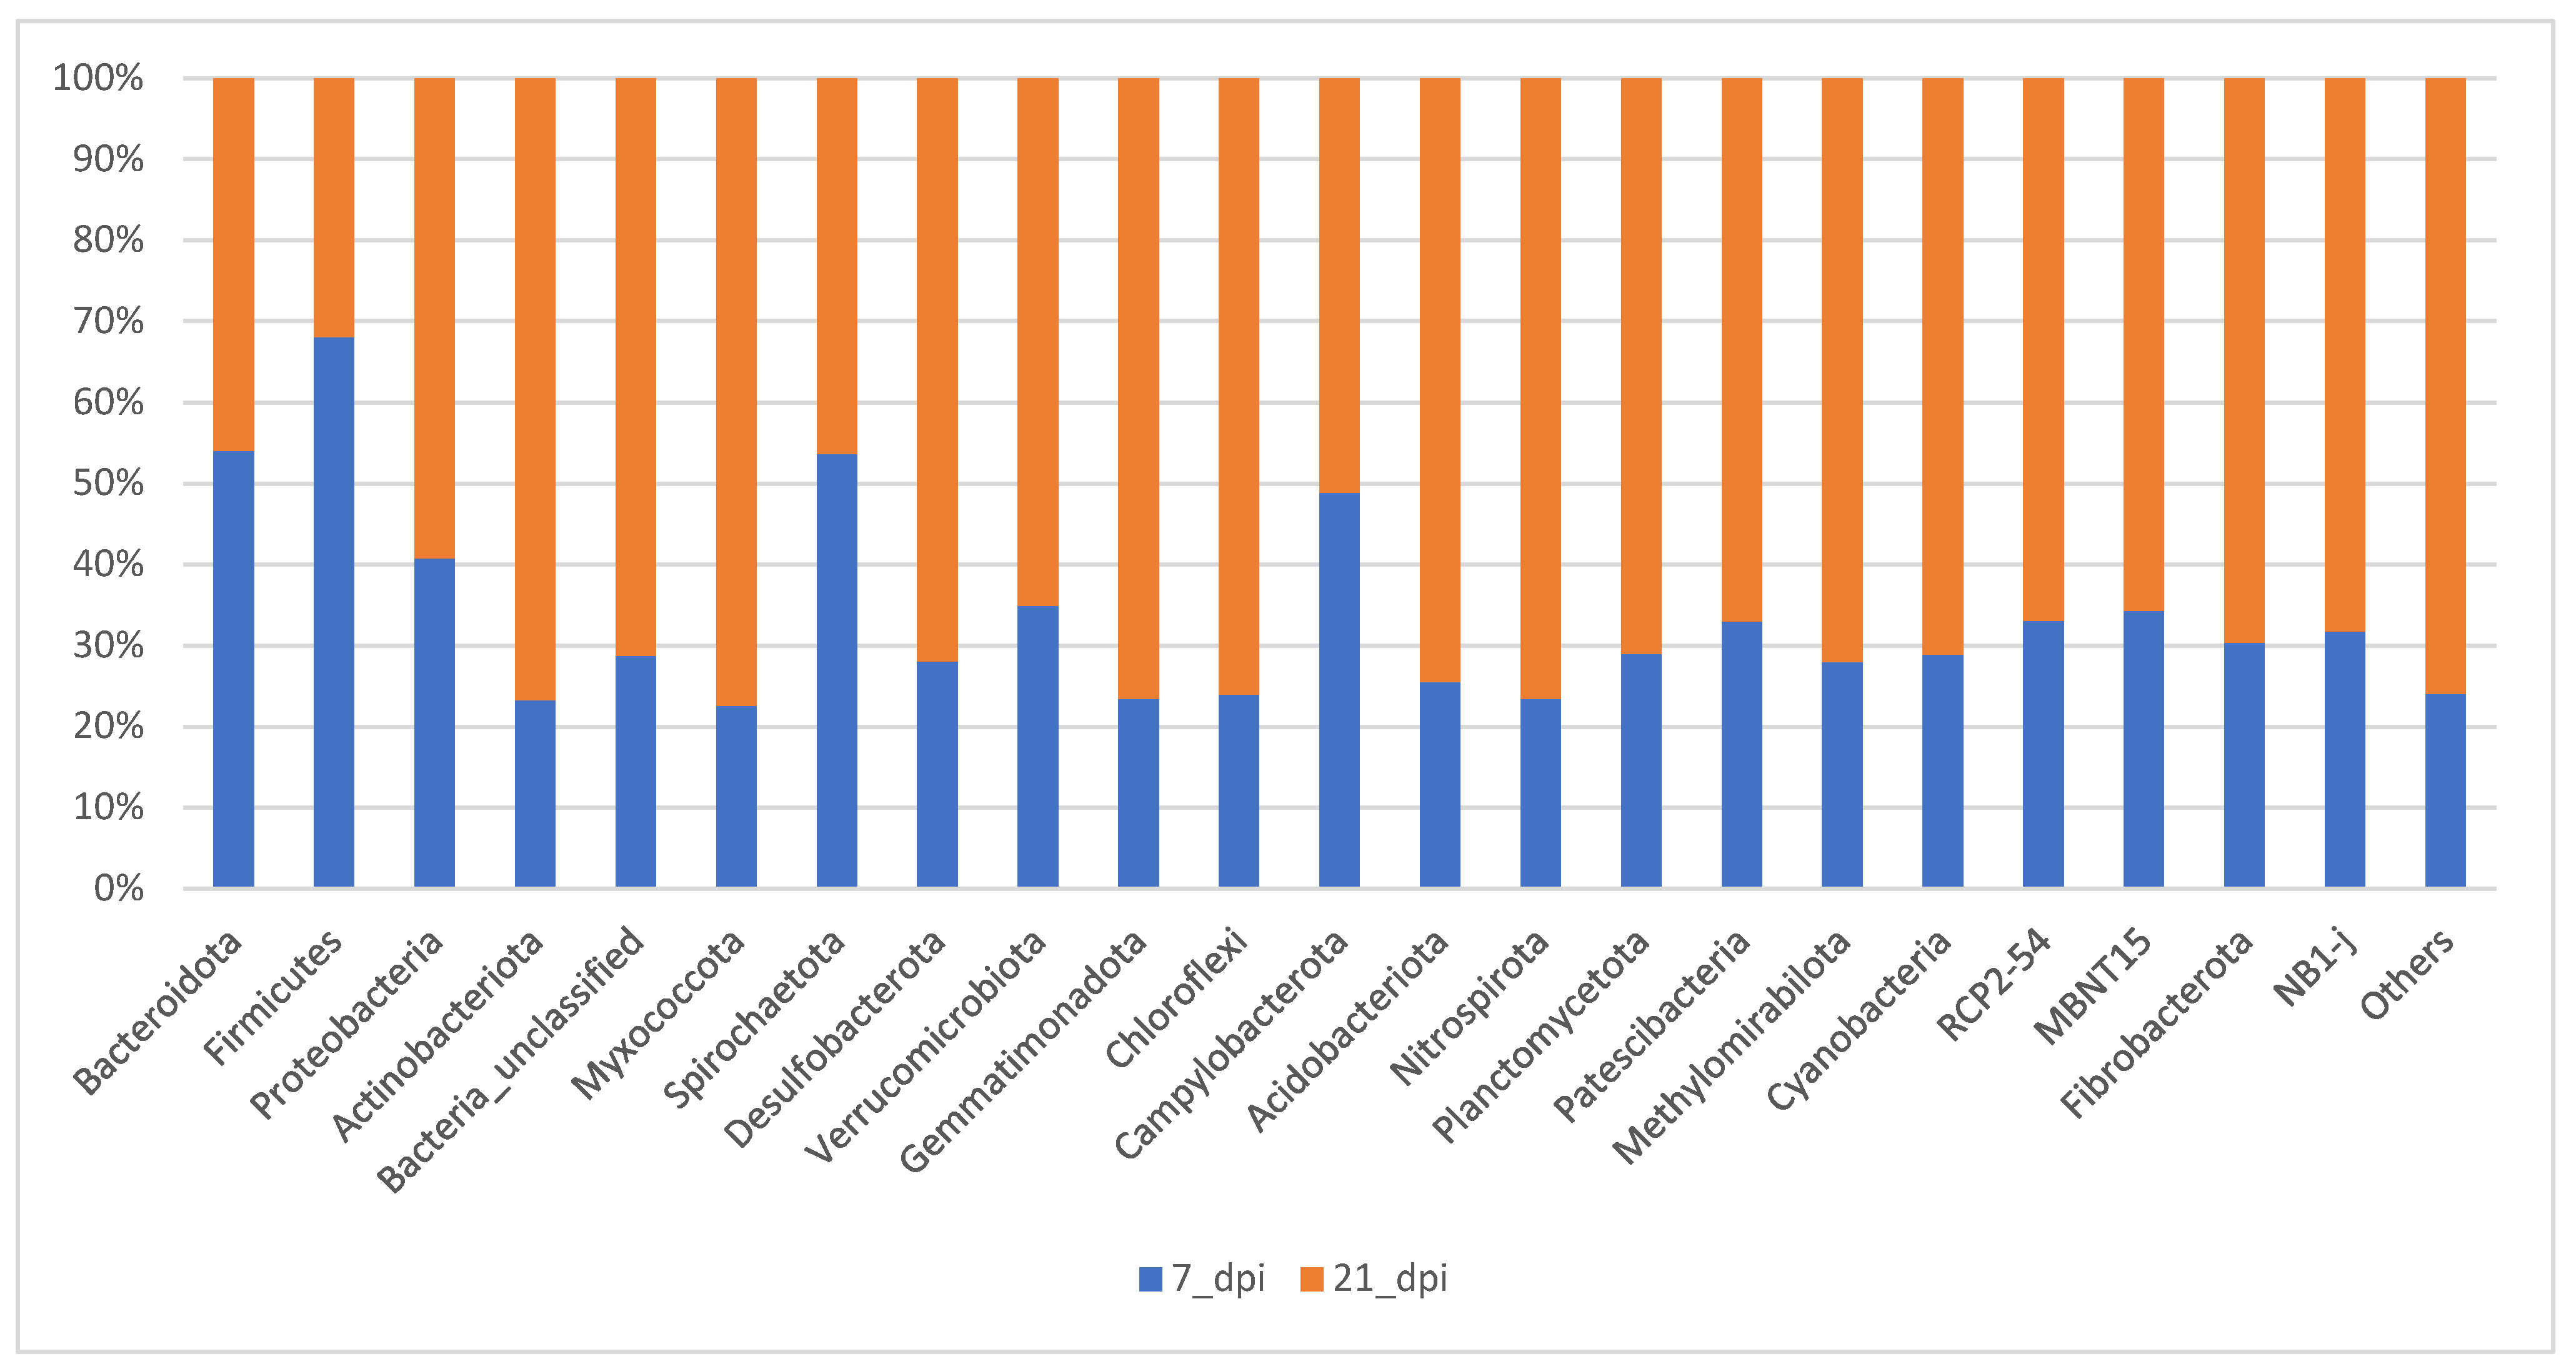
Figure 6 the samples compared of all the treatments on either 7 dpi or 21 dpi was examined. The composition of different phylum become more evenly distributed at 21 dpi when compared to 7 dpi. About 80% of total bacteria are covered by Bacteroidetes and Firmicutes at 7 dpi whereas at 21 dpi it is 50% of total bacterial community. The percentage composition of other phyla such as Proteobacteria, Unclassified, and Actinobacteria increase at 21 dpi (
Figure 6).
RF and Fec tissue appear to have apparently higher F/B ratios than other tissue samples,
Figure 7.
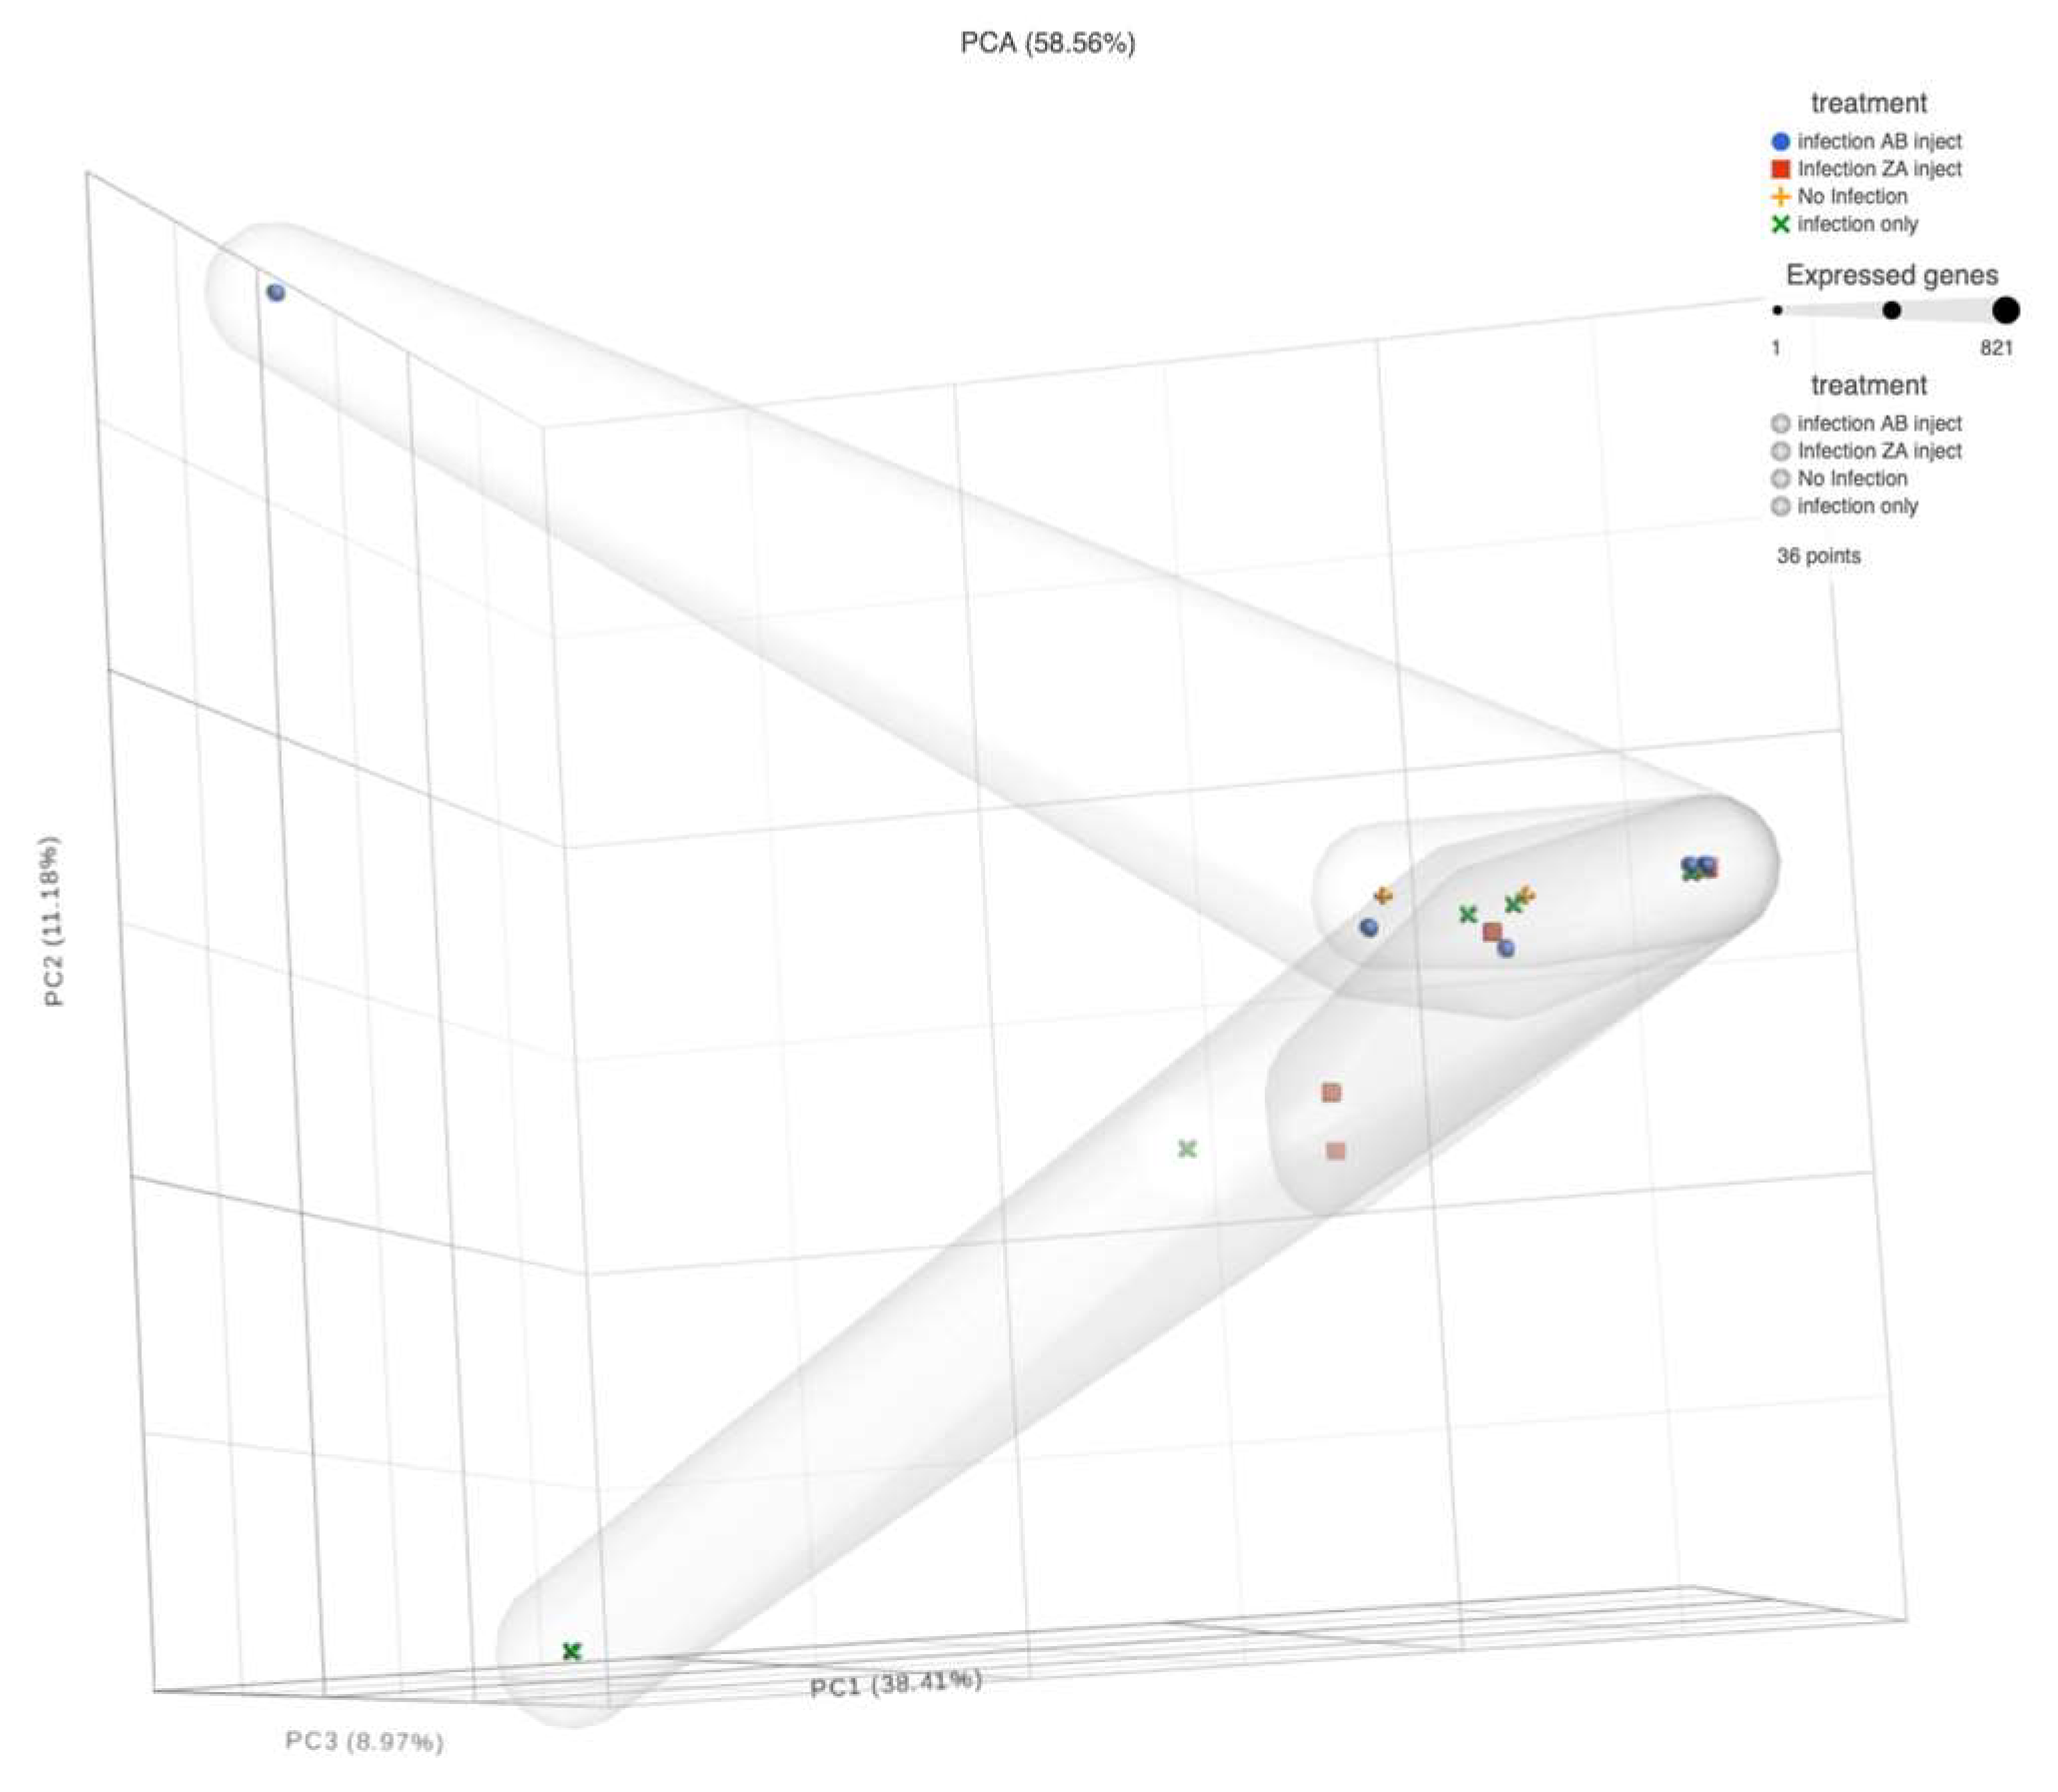
When analyzing sequences, apparent patterns become available via a PCA chart. In
Figure 7 the PCA, where dpi are compared to tissues reveal that the Blood, Fec, AF, and ALN appear to have outliers, especially on 21 dpi for blood samples. On both dpi Fec, AF and ALN share outliers. Otherwise, there are no distinct difference among the tissues. The remaining tissues do not appear to vary greatly in their correlation.
Comparisons of dpi and treatments showed significant and substantial significance in p-value of operational taxonomic units present (
Figure 4). However, the largest number of significant and substantial values were when comparisons of tissues were made (Figure 5).
Here we examined different immune modulators in conjunction with different treatment types (NI, IO, ZA, and AB) to decipher differences in indicative infection by the parasite
H.contortus. The presence of resistant characteristics can be placed in accordance to aligned correlation to non-infected (NI) sample results as can be observed in blood samples alone (
Figure 8).
4. Discussion
The microbiome is known to constantly change as compared to the genome [
23]. An earlier study, identified transcripts and the blood-microbiome of Alpine goats in host response to infection with internal parasites,
H. contortus. In the study blood was examined, the data obtained is included among this manuscript following patterns indicative of days post inoculation with
H.contortus and different types of treatments such as described here. In addition to many genes being identified that were up-and-down regulated in blood, after 7 days post inoculation (dpi) the study showed that there were changes with the complexity and richness of microbial flora at varying degrees in certain goats. Further analysis (unpublished) showed that certain patterns identifying similarity with non-infected subjects indicate possible resistance in goats. Features known to differ across individuals include taxonomic composition and structure, abundance, and rate at which the composition and structure change over time [
10,
23]
Several recent studies have identified the impact that microbiota have on the immune system [
24,
25,
26,
27] Microbiome analysis approaches could serve as a one-for-all approach for pathogen identification, including bacteria, viruses, and parasites. Furthermore, studies show that it is not only economical, but more effective to approach disease or parasitic infection by host immunity enhancement using microbial flora from healthy individuals to enhance tolerance/resistance in susceptible hosts.
5. Conclusions
There are limitations in this presented study and associated methods. There are potential biases that may be influencing the findings whether they be residual unmeasured confounding influences, bias related to compositional analysis, measurement bias or selection bias. All of which could affect the interpretation of the results of the study. The results indicate the amount of bias present in the study by extreme deviations that occur in the data, or even unusual amounts of uniformity.
The presence of H. contortus has been said to effectively change microbial habitat and composition in caprine abomasum [28]. We found in this study that there was no significant difference among tissue including the abomasum, abomasum fluid, abomasum lymph nodes, and mesentery lymph nodes but only with blood, fecal, and rumen fluid samples when compared between or as they relate to H. contortus infected versus non infected wethers. The treatment types with the days post inoculation showed a significant difference only with those three tissue sample types.
Our study also shows that there may be bias or confounding effects that are leading to taxonomic numbers that may be too low to fairly define significance of OTUs in the tissue samples at the phylum or species level. The premise as to the results of this reasoning points to the possibility of preferential sequencing of microbial samples in multiplex assays. Coverage of sequencing which was thirty million (30 x) reads per sample may be required to be greater than fifty million (50 x) reads per sample for 16S rRNA sequencing methods. It is also reasoned that low concentration libraries do not sequence well, when multiplexed with high concentration libraries. Nonetheless, if there is a more homogenous high concentration in a multiplexed library, this would more likely ensure the accuracy of identifying the microbes at much lower sample populations, especially at the species level. This method would provide a comprehensive, clear method of identifying large and low abundance members of a population in a sample [
25,
26].
Spatial Impact
The spatial impact graphs were determined using default measures for Principal Component analyses comparing days post inoculation to tissue type on the proprietary Partek Flow software suites (Partek Flow: St. Louis, Missouri, USA) (
Figure 8).
Author Contributions
Y. T., J. Q.-P., and Z. W. conceived and planned the experiments. Y. T., J. Q.-P, and Z. W. carried out the experiments. Y. T., F. J., and J. Q.-P contributed to sample preparation. Y. T., J. Q.-P., T. G., A. Y., and Z. W. contributed to the interpretation of the results. Y. T. J. Q. -P., A. Y., and M. M. were involved in writing the manuscript. All authors including K. S. and M. M. provided critical feedback and helped shape the research analysis and manuscript. All authors have approved the manuscript.
Acknowledgments and Funding
The authors are thankful to the Director and many other colleagues at the American Institute for Goat research (AIGR), School of Agriculture and Applied Sciences, Langston University, Langston, Oklahoma, USA. The Relationship Between the Microbiome and Internal Parasitism in Goats is supported by the Evans Allen Program Grant at the Agricultural Research and Extension Center at Langston University.
Conflicts of Interest
The authors declare no competing interests.
Ethical Approval and Consent to Participate
The treatment of animals is abided by the guidelines of the Langston University. Institutional Animal Care and Use Committee (LUACUC) Approval # 2018-14. All experiments were performed in accordance with relevant guidelines and regulations. Furthermore, the reporting in this manuscript is in accordance with ARRIVE guidelines.
References
- Charlier, J., Van der Voort, M., Kenyon, F., Skuce, P., and Vercruysse, J. Chasing helminths and their economic impact on farmed ruminants. Trends in Parasitology 2014, 30, 361–367. [CrossRef] [PubMed]
- Roeber, F., Morrison, A., Casaert, S., Smith, L., Claerebout, E., and Skuce, P. Multiplexed-tandem PCR for the specific diagnosis of gastrointestinal nematode infections in sheep: a European validation study. Parasites & Vectors, Volume 10:226; (2007). [CrossRef]
- Cai, K. et al. In vitro predatory activity of Arthrobotrys oligospora and after passing through gastrointestinal tract of small ruminants on infective larvae of trichostrongylides. Exp. Parasitol. 177:104-111; (2017). [CrossRef]
- Fthenakis G.C. and Menzies P.I. Preface: Therapeutics and control of sheep and goat diseases. Veteranary Clinic of North American Food and Animal Practices, 27(1): xiii-xiv; PMID: 21215885 (2011). [CrossRef]
- Mathews, J.B., Geldof, P., Tzelos, T. and Claerebout, E. Progress in the development of subunit vaccines for gastrointestinal nematodes of ruminants. Parasite Immunology, 38:744-753; (2016). [CrossRef]
- Ayaz, M.M. et al. Parasitism in Goats:Husbandry Management, Range Management, Gut Immunity and Therapeutics, Goat Science,Sándor Kukovics, IntechOpen, (2018). [CrossRef]
- Hahn, M. A., Piecyk, A., Jorge, F., Cerrato, R., Kalbe, M., and Dheilly, N. M. Host phenotype and microbiome vary with infection status, parasite genotype, and parasite microbiome composition. Molecular Ecology, 31(5):1577-1594; Epub 2022 Jan 27 (2022). [CrossRef]
- Elsheikha, H. Endoparasites in cattle: studies and diagnostics. Veterinary Times, VT47.31 (2017).
- Tilahun, Y. et al. Transcript and blood-microbiome analysis towards a blood diagnostic tool for goats affected by Haemonchus contortus. Scientific Reports, 12:5362; (2022). [CrossRef]
- Clézardin, P. Mechanisms of action of bisphosphonates in oncology: a scientific concept evolving from antiresorptive to anticancer activities. BoneKEy Reports, 267; (2013). [CrossRef]
- O’Keeffe, K. R., Halliday, F. W., Jones, C. D., Carbone, I., and Mitchell, C. E. 2021. Parasite, niche modification and the host microbiome: A field survey of multiple parasites. Molecular Ecology, 30(10):2404-2416; [CrossRef]
- Maizels, R. M. and M. Yazdanbakhsh. 2003 Immune Regulation by Helminth Parasites:Cellular and Molecular Mechanisms. Nature Reviews Immunology, 3:733-744. [CrossRef]
- Ingham, A., A. Reverter, R. Windon.,, P. Hunt., and M. Menzies. 2008. Gastrointestinal nematode challenge induces some consevered gene expression change in the gut mucosa of genetically resistant sheep. International Journal of Parasitology, 38:431-442. [CrossRef]
- Silva, M. V. B., T. S. Sonste1 1124gard, O. Hanotte, J. M. Mugambi, J. F. Garcia, S. Nagda, J. P. Gibson, F.A. Iraqi, A.E. McClintock, S. J. Kemp, P.J. Boettcher, Malek, C.P. Van Tassell, and R. L. Baker. 2011. Identification of quantitative trait loci affecting resistance to gastrointestinal parasites in a double backcross population of Red Maasai and Dorper sheep. Animal Genetics, 43:63-71. [CrossRef]
- Balic A., V. W. Bowles, and E. N. T. Meewsen. 2002.Mechanisms of immunity to Haemonchus contortus populations in sheep. Parasite Immunology, 24:39-46. [CrossRef]
- Inagaki-Ohara K., Y. Sakamoto, T. Dohi, and A. L. Smith. 2011. Γδ T cells play a protective role during infection with Nippostrongylus brasiliensis by promoting goblet cell function in the small intestine. Immunology, 134:448-458. [CrossRef]
- Quince, C., Walker, A. W., Simpson, J. T., Loman, N. J., and Segata, N. 2017. Shotgun metagenomics, from sampling to analysis. Nature Biotechnology, 35:833-844. [CrossRef]
- D. E. Wood and Salzberg, S. L. 2014. Kraken: ultrafast metagenomic sequence classification using exact alignments. Genome Biology 15, R46. [CrossRef]
- Schloss, P.D., et al. 2009. Introducing mothur:open-source, platform-independent, community-supported software for describing and comparing microbial communities. Applied Environmental Microbiology, 75(23):7537-41; Epub 2009 Oct 2. PMID: 19801464; PMCID: PMC2786419. [CrossRef]
- Li, H. and Durbin, R. 2009. Fast and accurate short read alignment with Burrows-Wheeler transform. Bioinformatics, 25(14):1754-60. [CrossRef]
- Quast C, Pruesse E, Yilmaz P, Gerken J, Schweer T, Yarza P, Peplies J, Glöckner FO (2013) The SILVA ribosomal RNA gene database project: improved data processing and web-based tools. Nucleic Acids Research, 41(D1):D590-D596. [CrossRef]
- Milanese, A., et al. 2019. Microbial abundance, activity and population genomic profiling with mOTUs2. Nature communications, 10:1014. [CrossRef]
- Califf, K., Gonzalez, A., Knight, R., and Caporaso, J. G. 2014. The Human Microbiome: Getting Personal:Each of us harbors a unique microbiome, and its characteristics play an important role in differentiating us from one another. Microbe, 9(10):410-415.
- Garrett, W. S., et al. 2014. Enterobacteriaceae Act in Concert with the Gut Microbiota to Induce Spontaneous and Maternally Transmitted Colitis. Cell Host & Microbe, 8(3):292-300; ISSN 1931-3128. [CrossRef]
- Wieland Brown, L.C., et al. 2013. Production of α-Galactosylceramide by a Prominent Member of the Human Gut Microbiota. PLoS Biology,11(7):e1001610. [CrossRef]
- Huttenhower, C., Kostic, A. D., and Xavier, R. J. 2014. Inflammatory Bowel Disease as a Model for Translating the Microbiome. Immunity, 40(6):843-854. [CrossRef]
- Broderick, N. A. A common origin for immunity and digestion. Frontiers in Immunology, 6. (2015). [CrossRef]
- Li, R. W., Li, W., Sun, J., Yu, P., Baldwin, R. L., and Urban, J. F. 2016. The effect of helminth infection on the microbial composition and structure of the caprine abomasal microbiome. Scientific Reports, 6:20606. [CrossRef]
Figure 1.
Alpha diversity plots for comparison between different tissue samples.
Figure 1.
Alpha diversity plots for comparison between different tissue samples.
Figure 2.
The relative abundance plots showing the percentage abundance of operational taxonomic units (OTUs) in 4 different tissues i.e., abomasum (Abo), abomasum fluid (AF), fecal (Fec), and rumen fluid (RF). The numbers of OTUs in the samples in each category i.e., NI, IO, AB and ZA are averaged for this figure and the number in the bracket shows the number of samples averaged. Different colors in each bars represent different phyla mentioned in the index and the phylum “OTHERS” represents all the other phyla that are presented in less than 0.5% of total abundance when summed up for all samples. The black vertical lines separate each tissue for easy visualization.
Figure 3.
The relative abundance plots showing percentage abundance of operational taxonomic units (OTUs) in 3 different tissues i.e., blood, mesentery lymph node (MLN), and abomasum lymph node (ALN), that are part of the lymphatic system and are associated with the digestive tract. The numbers of OTUs in the samples in each category i.e., NI, IO, AB and ZA are averaged for this figure and the number in the bracket shows the number of samples averaged. Different colors in each bars represent different phyla mentioned in the index and the phylum “OTHERS” represents all the other phyla that are presented in less than 0.5% of total abundance when summed up for all samples. The black vertical lines separate each tissue for easy visualization.
Figure 4.
Line graph of Firmicutes/Bacteroidetes (F/B) ratio for all samples. The numbers in the bracket for each sample is the number of samples that were averaged to get the F/B ratio. Overall microbial community structure.
Figure 4.
Line graph of Firmicutes/Bacteroidetes (F/B) ratio for all samples. The numbers in the bracket for each sample is the number of samples that were averaged to get the F/B ratio. Overall microbial community structure.
Figure 6.
The relative abundance bar graph (100%) of the average of the top 24 OTUs at 7 dpi (acute) and 21 dpi (chronic).
Figure 6.
The relative abundance bar graph (100%) of the average of the top 24 OTUs at 7 dpi (acute) and 21 dpi (chronic).
Figure 7.
Firmicutes/Bacteroidetes ratio in all samples (AF, ALN, Abo, Blood, Fec, MLN, and RF).
Figure 7.
Firmicutes/Bacteroidetes ratio in all samples (AF, ALN, Abo, Blood, Fec, MLN, and RF).
Figure 8.
Principal Component Analysis Chart. The different shaped and colored objects identify different treatments. Their sizes indicate the number of expressed microbial organisms (expressed genes) of that treatment at that location. The threshold for “health” is the area predominated by the control (No Infection: yellow crosses). Any other objects in the area predominated by the yellow crosses indicate the possible presence of resistance or no infection in those subjects.
Table 3.
Treatment groups. Groups composed of 20 subjects each (1-4): Here, + means positive /present and – means negative/not-present for the respective columns. Acronyms: NI: No infection, IO:Infection only, AB:Infected and treated with AB, and ZA:Infected and treated with ZA.
Table 3.
Treatment groups. Groups composed of 20 subjects each (1-4): Here, + means positive /present and – means negative/not-present for the respective columns. Acronyms: NI: No infection, IO:Infection only, AB:Infected and treated with AB, and ZA:Infected and treated with ZA.
Table 2.
The metastats value and 5 significant p-values for the beta diversity comparison between 7 dpi and 21 dpi. There are 5 OTUs that is causing the significant differences between 7 and 21 dpi samples. All these OTUs belong to either Bacteroidetes or the Firmicutes signifying that the levels of these groups are significantly changing between these two timepoints.
| OTU taxonomy |
p-value |
mean(group1) |
variance(group1) |
stderr(group1) |
mean(group2) |
variance(group2) |
stderr(group2) |
| Bacteria(100);Bacteroidota(100);Bacteroidia(100);Bacteroidales(100);Prevotellaceae(100);Prevotellaceae_unclassified(100); |
0.0070 |
0.0481 |
0.0073 |
0.0104 |
0.0174 |
0.0022 |
0.0048 |
| Bacteria(100);Bacteroidota(100);Bacteroidia(100);Bacteroidales(100);F082(100);F082_ge(100); |
0.0180 |
0.0127 |
0.0021 |
0.0055 |
0.0013 |
0.0000 |
0.0005 |
| Bacteria(100);Bacteroidota(100);Bacteroidia(100);Bacteroidales(100);Prevotellaceae(100);Prevotella(100); |
0.0340 |
0.0101 |
0.0005 |
0.0026 |
0.0040 |
0.0001 |
0.0011 |
| Bacteria(100);Bacteroidota(100);Bacteroidia(100);Bacteroidales(100);Rikenellaceae(100);Rikenellaceae_RC9_gut_group(100); |
0.0384 |
0.0088 |
0.0006 |
0.0030 |
0.0019 |
0.0000 |
0.0006 |
| Bacteria(100);Firmicutes(100);Clostridia(100);Oscillospirales(100);Oscillospiraceae(100);UCG-005(100); |
0.0440 |
0.0128 |
0.0006 |
0.0031 |
0.0057 |
0.0004 |
0.0020 |
|
Disclaimer/Publisher’s Note: The statements, opinions and data contained in all publications are solely those of the individual author(s) and contributor(s) and not of MDPI and/or the editor(s). MDPI and/or the editor(s) disclaim responsibility for any injury to people or property resulting from any ideas, methods, instructions or products referred to in the content. |
© 2023 by the authors. Licensee MDPI, Basel, Switzerland. This article is an open access article distributed under the terms and conditions of the Creative Commons Attribution (CC BY) license (http://creativecommons.org/licenses/by/4.0/).
