Preprint
Article

Quantifying Stormwater Pollutants and Porous Surface Infiltration on a Midwestern University Campus

Altmetrics

Downloads

91

Views

16

Comments

0

This version is not peer-reviewed

Submitted:

25 December 2023

Posted:

25 December 2023

You are already at the latest version

Alerts
Abstract
Stormwater management is especially critical for urbanized landscapes that border surface waters and therefore must be monitored accurately to meet permitting requirements and mitigate environmental impact. To assess the impact of stormwater pollutants from the university grounds of a large midwestern campus, we pursued the following two objectives. First, to empirically quantify the concentration of four pollutants in campus stormwater (total suspended solids (TSS), total phosphorus (TP), total Kjeldahl nitrogen (TKN), and chlorides (Cl-)) and compare these observations to international averages and modeled values from the Source Loading and Management Model for Windows (WinSLAMM v10.5.0), used by the university for stormwater monitoring. And second, we sought to quantify the steady state infiltration rate of two porous pavements (concrete and asphalt), and two concrete porous paver surfaces (with interlocking aggregates and without) constructed by the university to mitigate environmental impact. Results showed low TSS concentrations relative to other municipalities and modeled results. The discrepancy between modeled and empirical values is argued to arise from spatial and temporal constraints of sampling. Conversely, concentrations of TP, TKN, and Cl-, were at similar levels to reference areas and WinSLAMM, with TP and TKN likely sourced from mainly organic, non-particulate sources (e.g. leaf litter). Of the four mitigation systems, the porous pavers with aggregates had the highest infiltration rate compared to the other three porous pavements, although compounding factors such as age and landcover may have influenced performance differences.
Keywords: 
Subject: Environmental and Earth Sciences  -   Water Science and Technology

1. Introduction

Regulated stormwater management aims to improve the ecological function of urbanized watersheds. To protect threatened watersheds in Wisconsin, the Wisconsin Pollutant Elimination System (WPDES) determines standards for stormwater management through a permitting process that sets total maximum daily loads (TMDL) for targeted pollutants such as total suspended solids (TSS) and total phosphorus (TP). It was recently reported that as of 2022, 1,526 bodies of water in the state were considered impaired [1]. Nestled in the heart of Wisconsin, the University of Wisconsin-Madison campus borders more than a fifth of Lake Mendota, its largest water body in the county that provides critical ecosystem services to the surrounding watershed. Thus, any pollutant discharge from the campus compromises the integrity of the lake and surrounding terrestrial environments (e.g., Lakeshore Nature Preserve) [2]. To mitigate these potential effects, the university works to meet pollutant reduction goals as dictated by the YaharaWins project, a collaborative effort to meet WPDES permit regulations [3,4]. Specifically, the university seeks to reduce TSS pollution by 40% and TP pollution by 27% partially through the use of stormwater control measures [3]. In 2021, progress toward meeting these goals was estimated at 32.76% and 25.3% reduction in TSS and TP, respectively [5].
As a critical part of this effort, UW-Madison has incorporated green and gray infrastructure in its landscape design to help mitigate the impacts of stormwater [3]. One such method includes the use of porous surfaces such as porous concrete, asphalt, or interlocking impervious pavers to promote infiltration and reduce runoff that would otherwise carry pollutants into surrounding water bodies [6,7,8]. The Wisconsin Department of Natural Resources (WDNR) sets performance standards for porous pavements to infiltrate a minimum of 25 cm hr-1 [9]. This standard is tested using the Source Loading and Management Model for Windows (WinSLAMM) that estimates pollutant concentrations and runoff volumes from user-defined landscape parameters; the model can incorporate green and gray infrastructure, a particularly useful feature for stormwater monitoring over complex landscapes [10,11]. While the model provides a useful tool to evaluate stormwater pollution, it is rarely validated empirically as it is not required by the state government in many cases (e.g. Wisc. Admin. Code Ch. NR 152) [11,12]. Moreover, the model estimates are only as good as the validity of the input parameters (e.g., existing landcover), which are especially challenging to quantify in heterogeneous urbanized landscapes exemplified by Madison, Wisconsin [13,14]. Thus, the long-term fidelity of these mitigation practices is at best unsystematically monitored and, at worst, unknown, a discrepancy that can compromise estimates of stormwater impact to surface waters and the surrounding terrestrial environments.
To test whether pollutant reduction values are being accurately modeled on the UW-Madison campus, we conducted a case study with two primary objectives. Our first objective was to empirically quantify total suspended solids (TSS), total phosphorus (TP), total Kjeldahl nitrogen (TKN), and chloride (Cl-) concentrations in stormwater runoff from the UW-Madison campus to compare these observations to modeled values from WinSLAMM and international averages. These pollutants were chosen for their well-documented adverse effects on surface water health [15,16,17,18]. Excess TSS can diminish water quality via increased turbidity and increase the transport of pollutants such as phosphorus that can bind to the suspended sediment [15]. Similarly, phosphorus and nitrogen loading can result in eutrophication and harmful algal blooms of surface waters [16]. In addition, excess chlorides derived from road salts can impact aquatic organisms by disrupting their ability to osmotically regulate water [18]. Our second objective was to quantify the infiltration capacity of four differently engineered porous surfaces used on campus. We expected the modeled results to deviate from field estimates for each pollutant measured due to temporal limitations of the model. We also expected that the infiltration capacity of all porous surfaces (asphalt, concrete, pavers with aggregates, and pavers without aggregates) would not meet WDNR infiltration standards and thus be overestimated by the WinSLAMM model.

2. Materials and Methods

2.1. Site Description

The area of study included the west side of the University of Wisconsin-Madison campus bordering Lake Mendota and within the larger Mendota Watershed also known as the Six Mile and Pheasant Branch Creeks Watershed (Figure 1). This watershed is a reach of the larger Rock River Basin, which is subject to TSS and TP TMDL restrictions. This area is further divided into catchment areas as defined and reported by the University of Wisconsin-Madison (Figure 1). A network of concrete storm drains with outlets along the shoreline of the Lakeshore Nature Preserve conveys stormwater from these catchments directly into Lake Mendota. The catchments are composed mainly of impervious areas comprised of institutional buildings, paved surfaces, and some pervious surfaces in the form of lawns and common areas (Table 1). The predominant soil types across these catchments vary from fine-loamy, mixed, active Typic Endoaquolls to fine-silty, mixed, superactive Typic or Mollic Hapludolfs in either hydrologic class B or C/D [19,20], modified by urbanization.

2.2. Stormwater Sampling

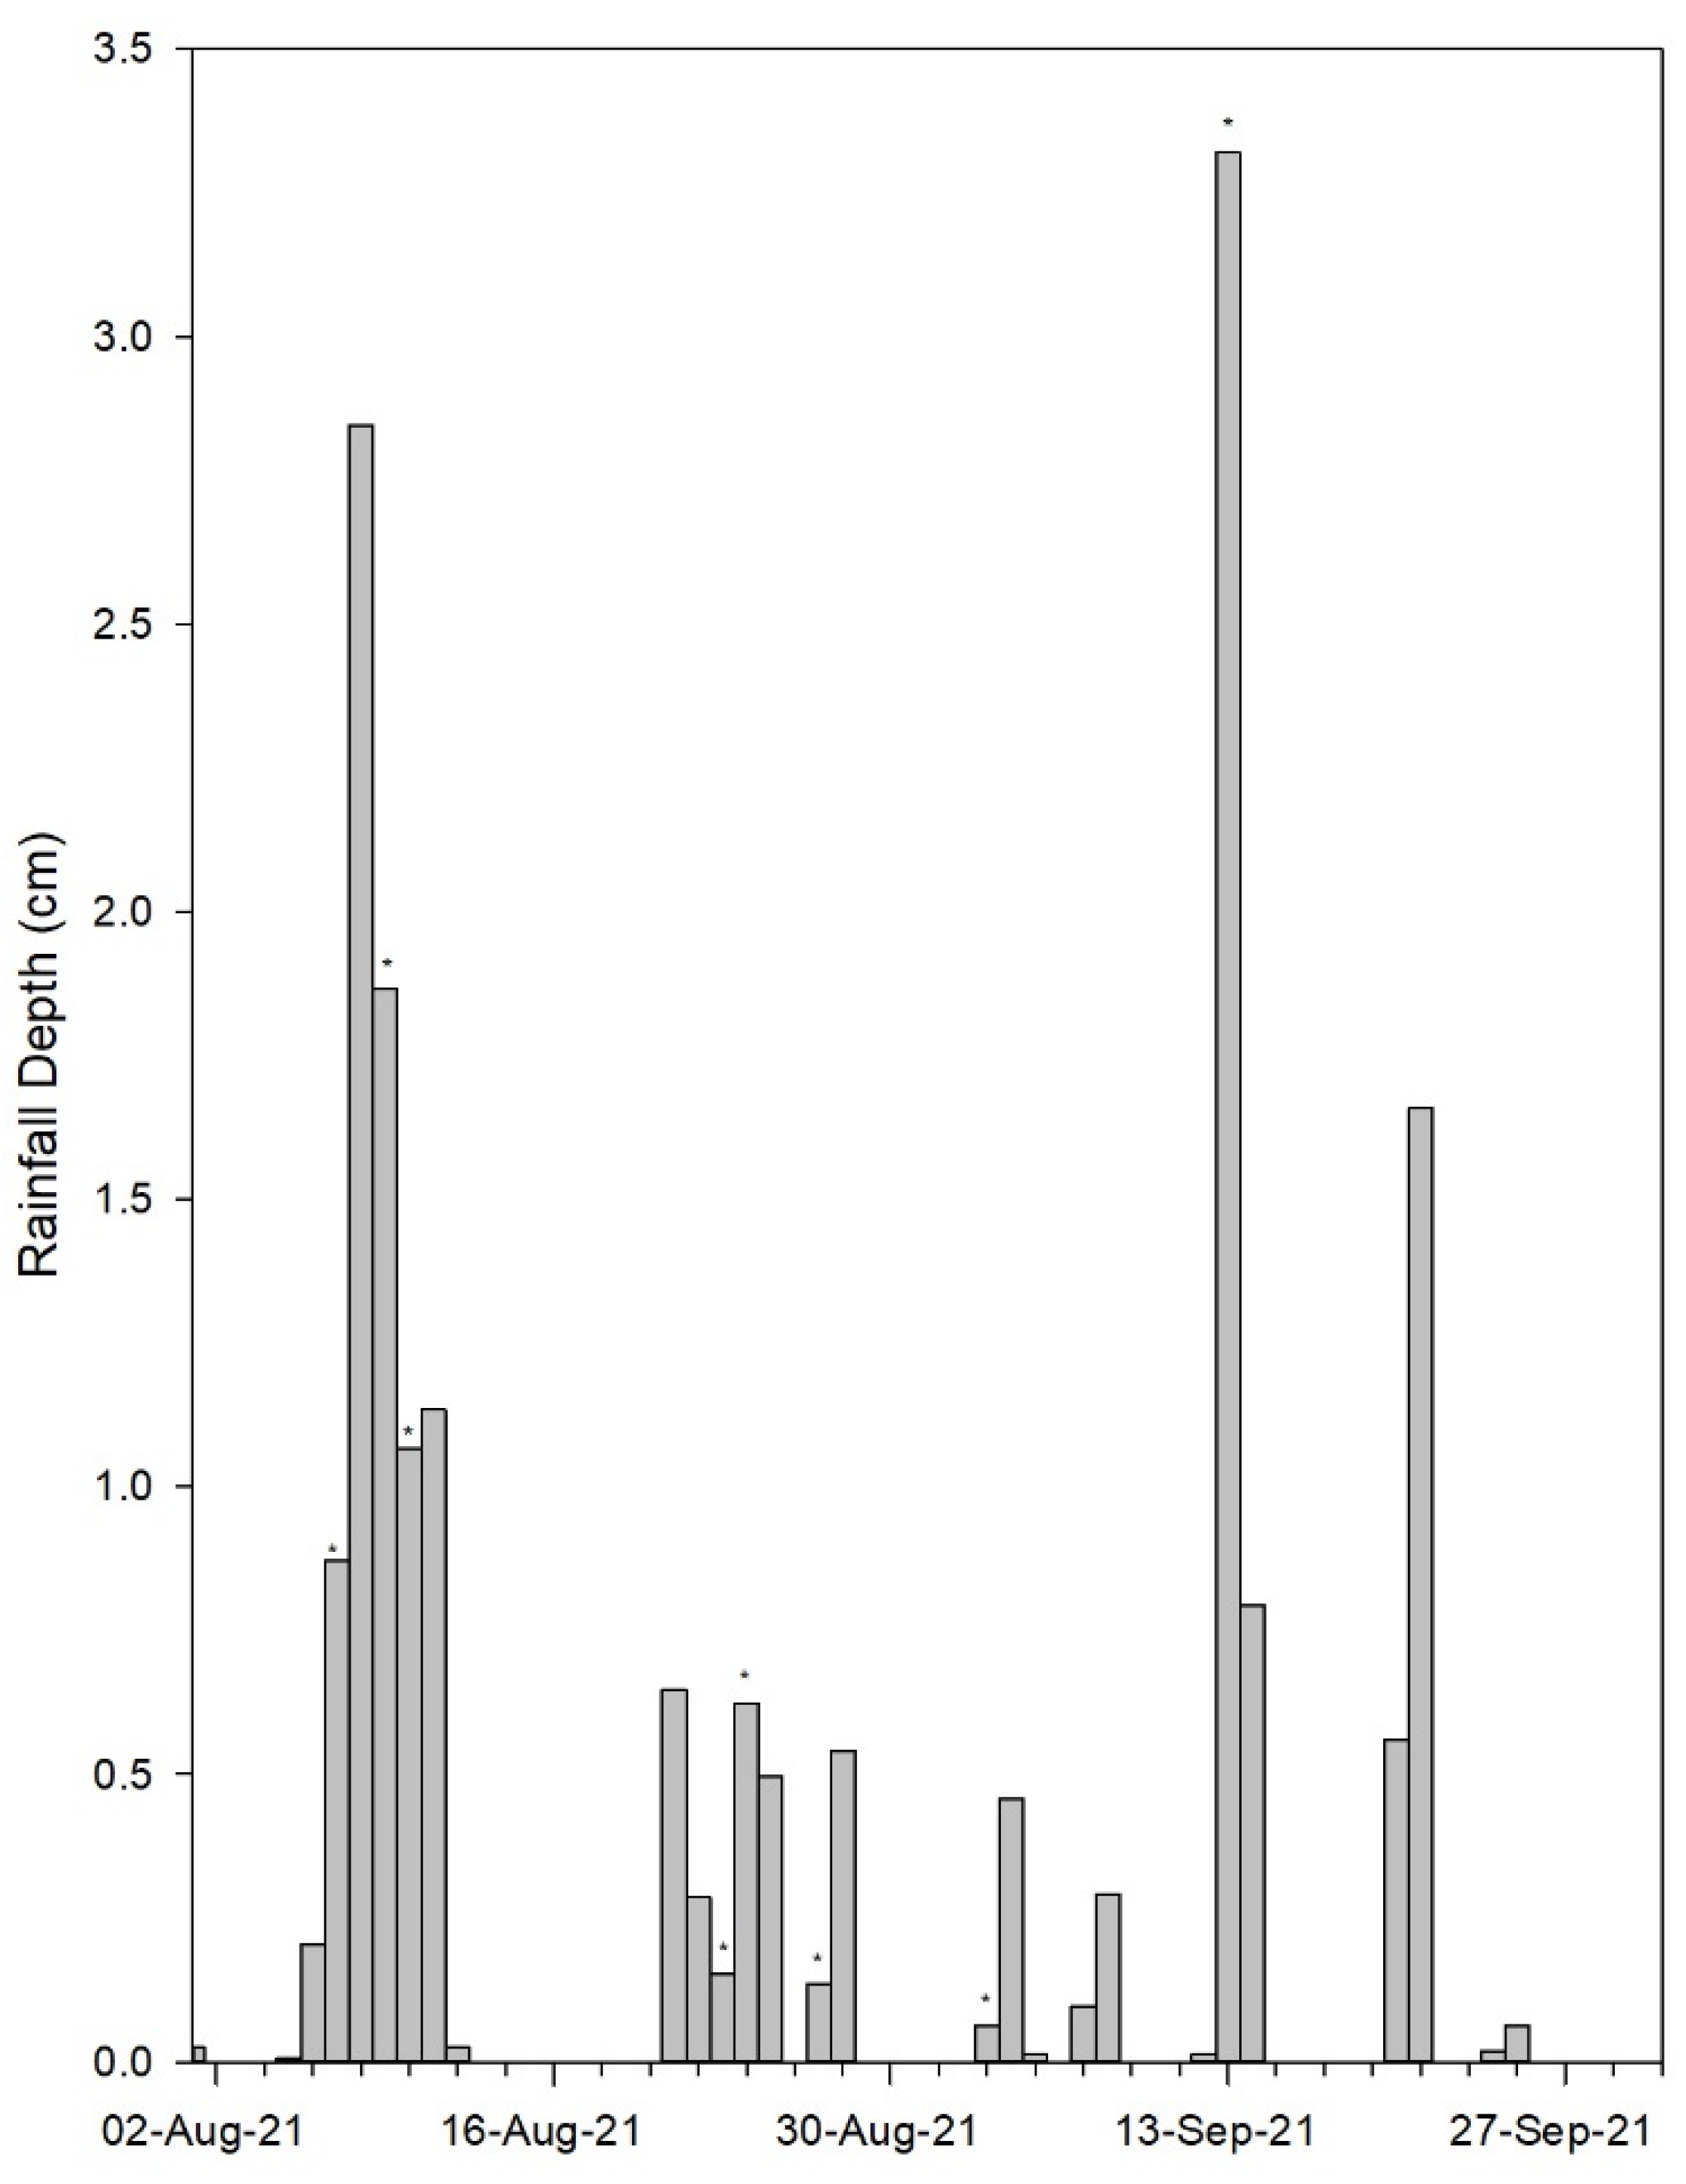
Catchment areas sampled in this study were chosen based on two criteria: (1) in a rainfall event they would reliably produce enough stormwater that could be quickly collected from stormwater drains and (2), the stormwater samples would represent the heterogeneous landcover within the area chosen on campus (Table 1). A total of eight rainfall events were sampled from August to September of 2021; the brief sampling period was attributed to an extended drought beginning in late spring and extending into early summer of that year (Figure 2). To record total rainfall during the sampling period, the arithmetic mean of four nearby rainfall stations surrounding Madison, WI was derived in the absence of any reliable daily sensor in each catchment area.
The objective was to sample outlets from each catchment area immediately preceding a stormwater event. However, due to the temporal irregularity of rainfall during our study and a lack of automation in sampling, not all outlets could be physically sampled before stormwater drainage ceased. At a minimum, four sets of samples were taken per outlet over each sampling period. At the beginning of a qualified rainfall event, defined as consistent rainfall beyond 15 minutes from the start of the event, stormwater samples were collected by hand starting at drain EC-26 and then sequentially heading west (Figure 1). The first collection at each drain was discarded to help reduce contamination of one drain outlet to another. Then, three different stormwater samples were taken using a two-meter metal sampling stick with an aluminum tipping bucket to collect stormwater safely. One sample was poured into a 250 ml polyethylene bottle for TSS testing, another was collected in a 125ml polyethylene bottle for chloride testing, and the final sample was poured into a 125ml polyethylene bottle preserved with dilute sulfuric acid for TKN and TP testing. After each sampling event, the water samples were stored at a consistent 3o C until analyzed. All samples except for the 250ml bottles were then sent to the UW-Stevens Point Water and Environmental Analysis Lab where the TKN, TP, and chloride samples were assessed.
Total suspended solid concentrations were determined in the Balster Lab via the Standard Operating Procedure for TSS using pre-filtered glass microfiber Millipore AP4004700 filters with a pore size of 0.7μm [21]. TSS samples observed to have significant amounts of large debris (leaves, pebbles, etc.) were discarded from the analysis. The two 125mL bottles sent to UW-Stevens Point were analyzed for TP via flow injection analysis from EPA procedure 365.4 [22], TKN via flow injection analysis from EPA procedure 351.2 [23], and chloride concentrations via colorimetry according to Standard Methods 4500 for the Examination of Water and Wastewater [24]. Some chloride tests were under the limit of detection and as such, these values were treated as 0 in the analysis [21]. TSS, TP, and TKN were compared to an international average of residential pollutant concentrations for TSS, TP, and TN, respectively, as reported by Shahzad et al. (2022) [25]. Chloride concentrations were compared to EPA and WDNR chronic thresholds for surface waters in the absence of any other available benchmark (EPA, 2014, Wis. Admin. Code Sec. NR 105.03(15), 2010) [26,27].
Utilizing the most current version of WinSLAMM (v 10.5.0) parameterized for the UW-Madison portion of the Mendota Watershed, average concentrations for TSS, TP, and TKN were modeled for each catchment area. Chloride concentrations were excluded because the model is not suited for determining chloride concentrations. The model was run over five years of the most recent available precipitation input file (Madison rainfile 1980-1985 [28]) with the standard parameter files as provided by the US Geological Service [29]. The output of each catchment area and for each pollutant (mg L-1) were then compared to empirically determined values for the same areas over the sampling period. To make these comparisons, the concentrations for a catchment area were assumed to be the mean of the concentrations observed in the connected outlets. Similarly, when multiple catchments drain to one outlet, that outlet was used to represent the grouping of those catchment areas. These adjustments to the data resulted in empirical stormwater pollutant concentrations representing a catchment area or group of catchment areas that could be compared with the output data of WinSLAMM.

2.3. Infiltration Sampling

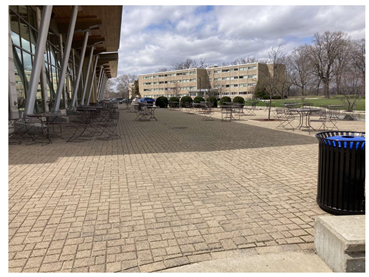
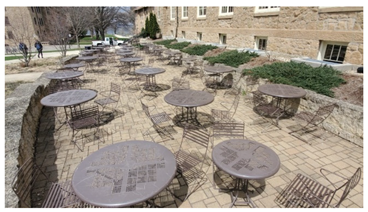
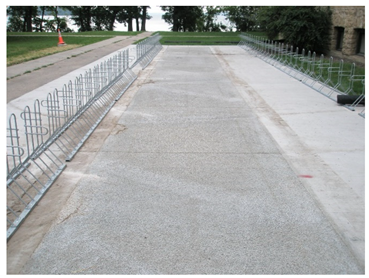
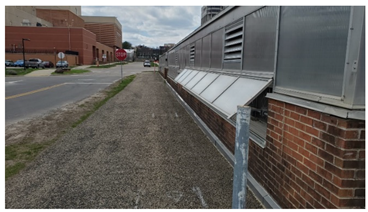
Four different porous surfaces installed on the UW-Madison campus were chosen for their variability in design and location on the university grounds; their names and characteristics are displayed in Figure 1 and Table 2. Five infiltration samples were taken for the Dejope and Carson sites, one in the center, and four in roughly each cardinal direction halfway between the center and the end of the surfaced area. For the Tripp site, four samples were taken in a linear design from east to west along the center of the area, spaced evenly apart. This sampling method was used because the Tripp site was relatively small compared to the other sites. Given the linear nature of the Biotron site, its length was divided into five evenly spaced sections, and the center of each section was then measured. All subsamples within a site were averaged to produce one composite sample per porous surface.
All infiltration measurements were conducted using an aluminum double-ring infiltrometer with an outer ring radius of 25.0 cm and an inner ring with a radius of 22.8 cm. A standard falling head method for determining the infiltration capacity of the porous surface and underlying substrate was followed with one exception [30]. Since the infiltrometer could not be driven into the solid components of these surfaces, the rings were married to the top of the surface using plumbers’ putty to seal the inside edge of each concentric ring, which prevented lateral surface leakage from under the rings. Madison groundwater was used in each infiltration measurement, and the effect of the changing hydraulic head during the measurement was assumed negligible because the porous surface mainly consists of homogenized macropores [31,32]. Measurements of water height within each ring were taken every minute except at the Carson site where measurements were taken every 30 seconds due to the rapid infiltration rate at this site. Height measurements were recorded to the nearest millimeter. Infiltration rate at saturation was determined to be the change in water height once steady state was achieved or, if there were minor fluctuations for an excessive amount of time, the average of the last eight measurements.

3. Results

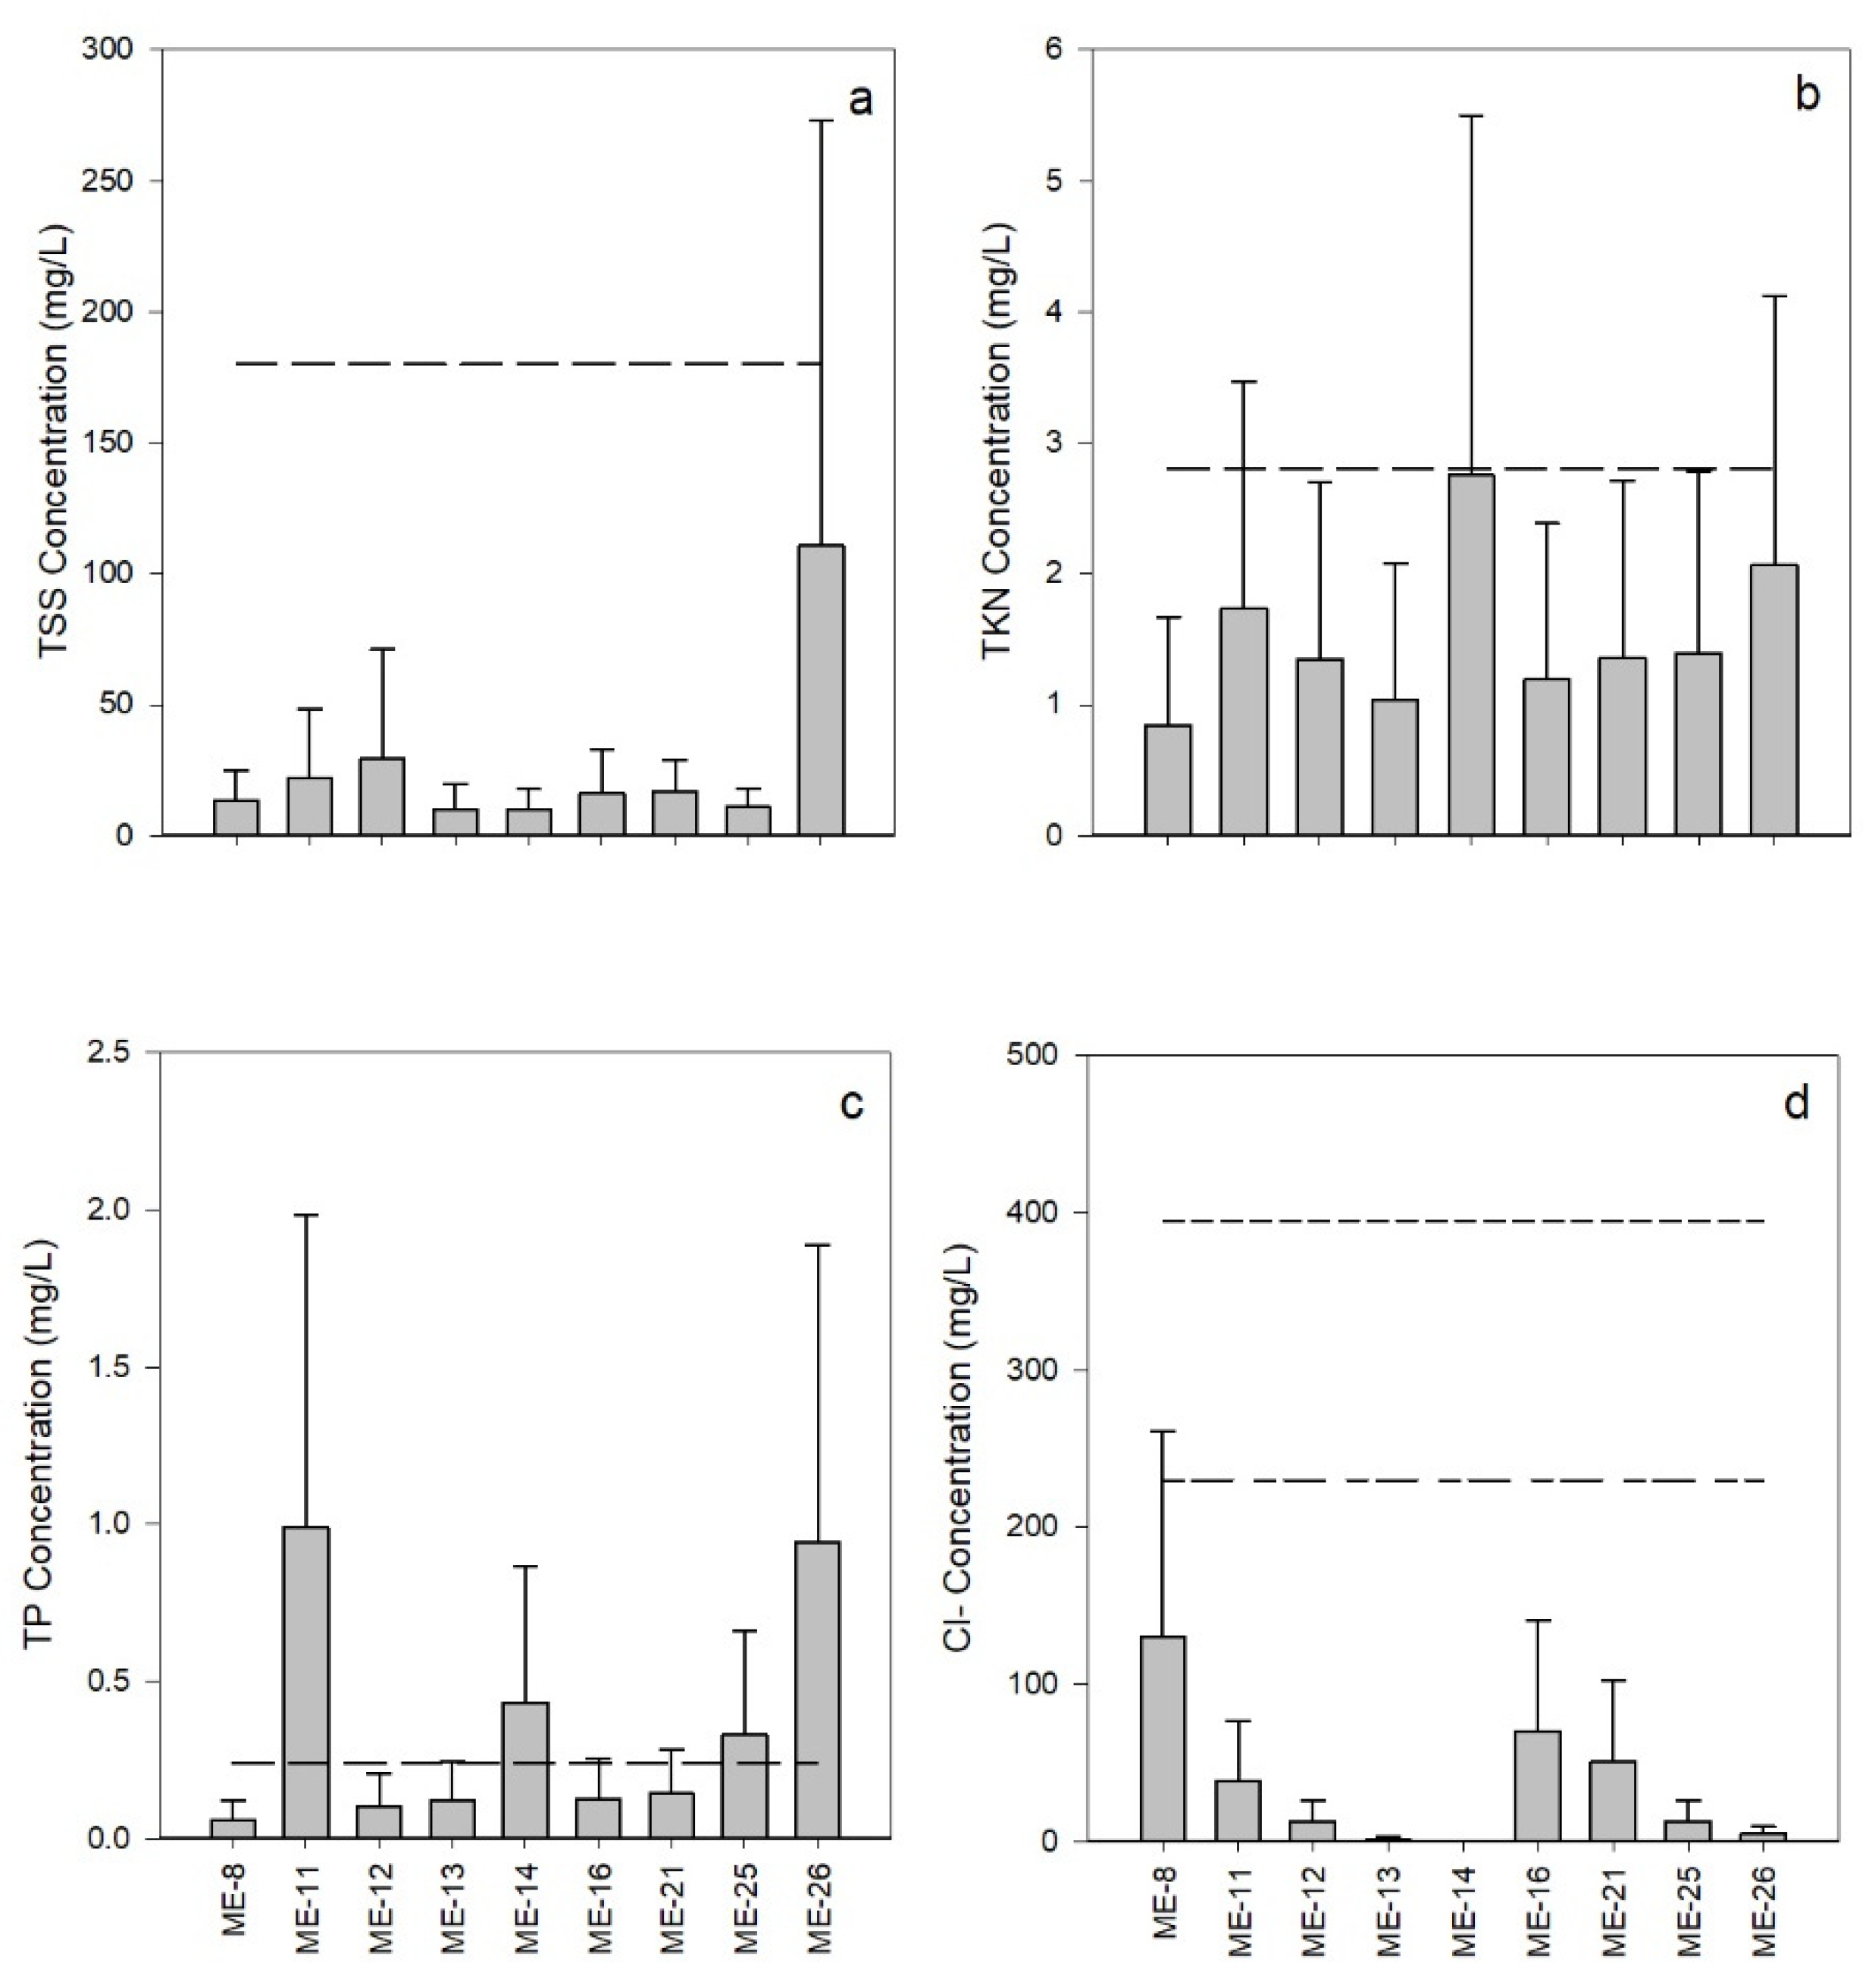
Stormwater samples were collected during eight rainfall events from August to September. The average precipitation event during that time averaged 1.02 cm and ranged from 0.15 cm to 3.33 cm during the time of sampling (Figure 2). Over the entire sampling period, the concentration of TSS did not exceed international averages as reported by Shahzad et al. (2022) (Figure 3a) [25]. In contrast, TP concentrations did exceed international averages in four locations, most notably ME-11, and ME-26, which doubled this benchmark (Figure 3c). Because international averages for TKN do not exist (to the best of our knowledge), the international average for TN as reported by Shahzad et al. (2022) was used for comparison; no TKN concentrations sampled in this study exceeded this benchmark (Figure 3b) [25]. Likewise, none of the outlets sampled for chlorides over the course of this study exceeded the benchmark concentrations for surface water toxicity as reported by the EPA and WDNR (Figure 3d) [26,27].
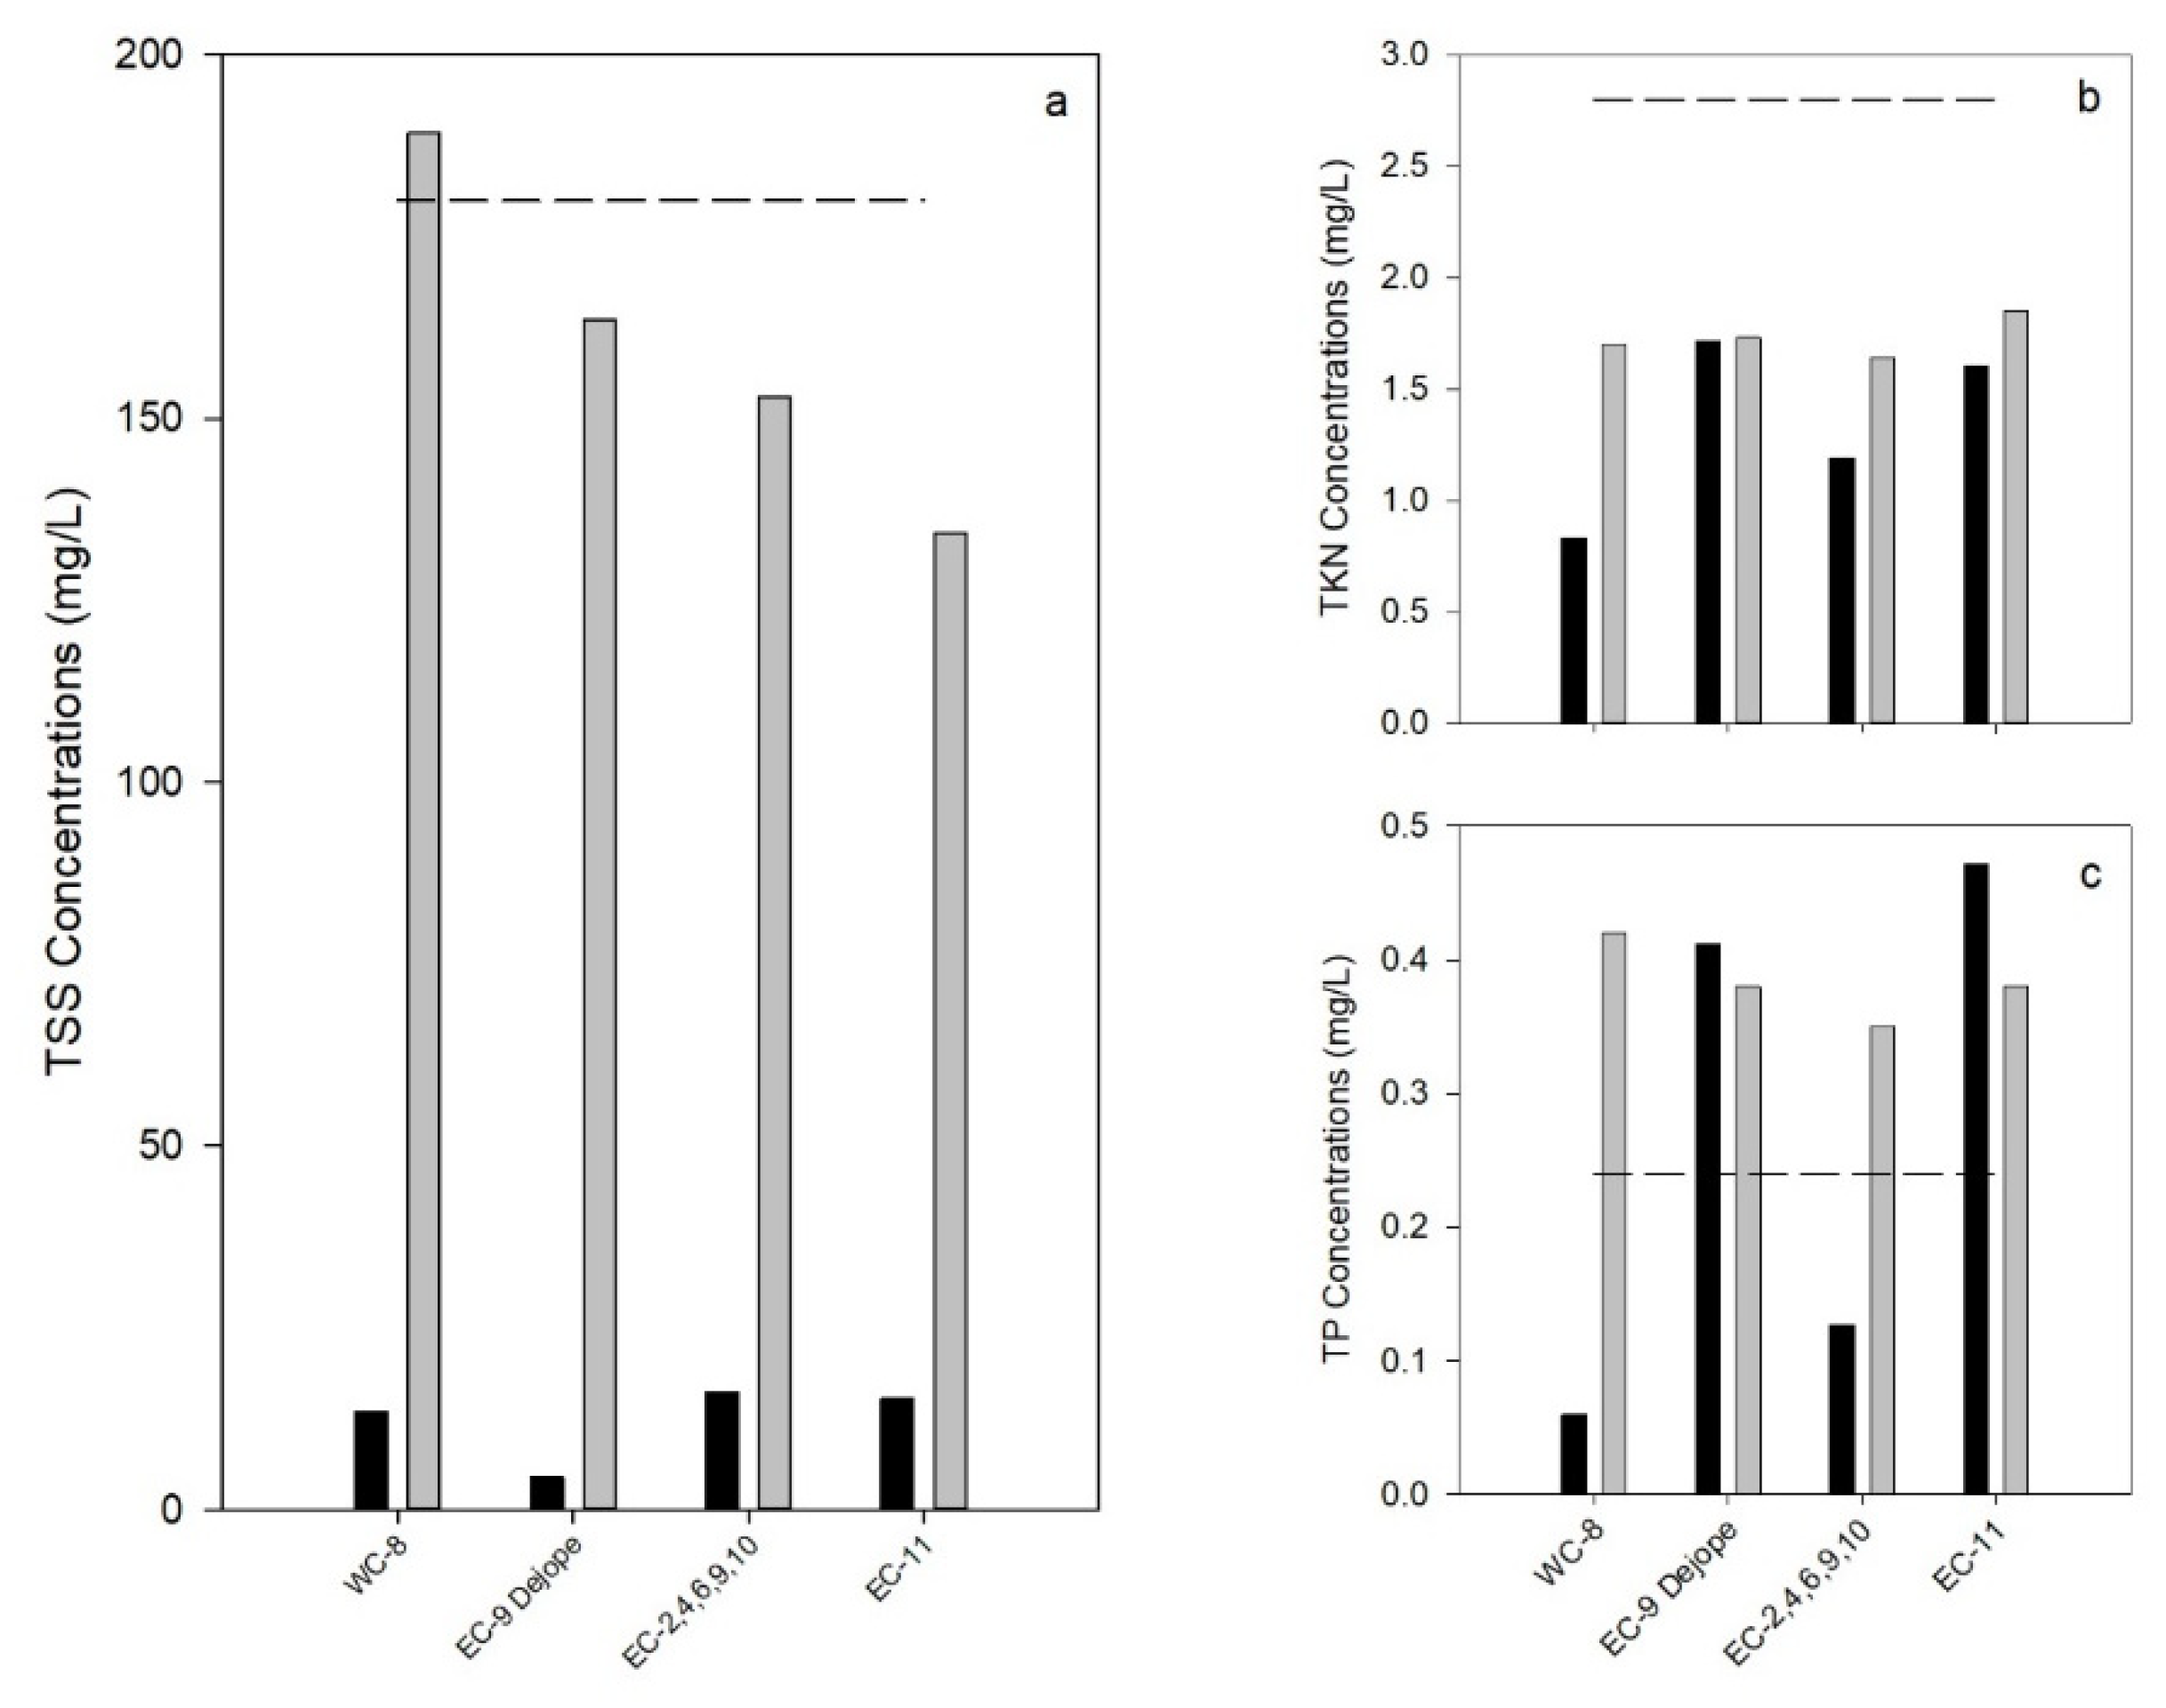
The WinSLAMM-modeled averages of TSS, TP, and TKN were greater than the observed concentrations from the stormwater outlets sampled in this study. Observed TSS concentrations for every catchment area or group of catchment areas were less than modeled predictions. On average, observed TSS concentrations were 148 mg L-1 lower than modeled concentrations with a standard deviation of 24.9 mg L-1. Observed and modeled TP values were on average 0.0280 mg L-1 apart with high variability; all modeled values exceeded the TP international average (Figure 4c). The measured TP concentrations for WC-8 and the EC-9 catchment group were over 0.200 mg L-1 less than their modeled concentrations. Similarly, the average measured TKN concentration for WC-8 was 0.700 mg L-1 of its modeled concentration. Otherwise, observed TKN values were on average 0.394 mg L-1 below modeled values (Figure 4b).
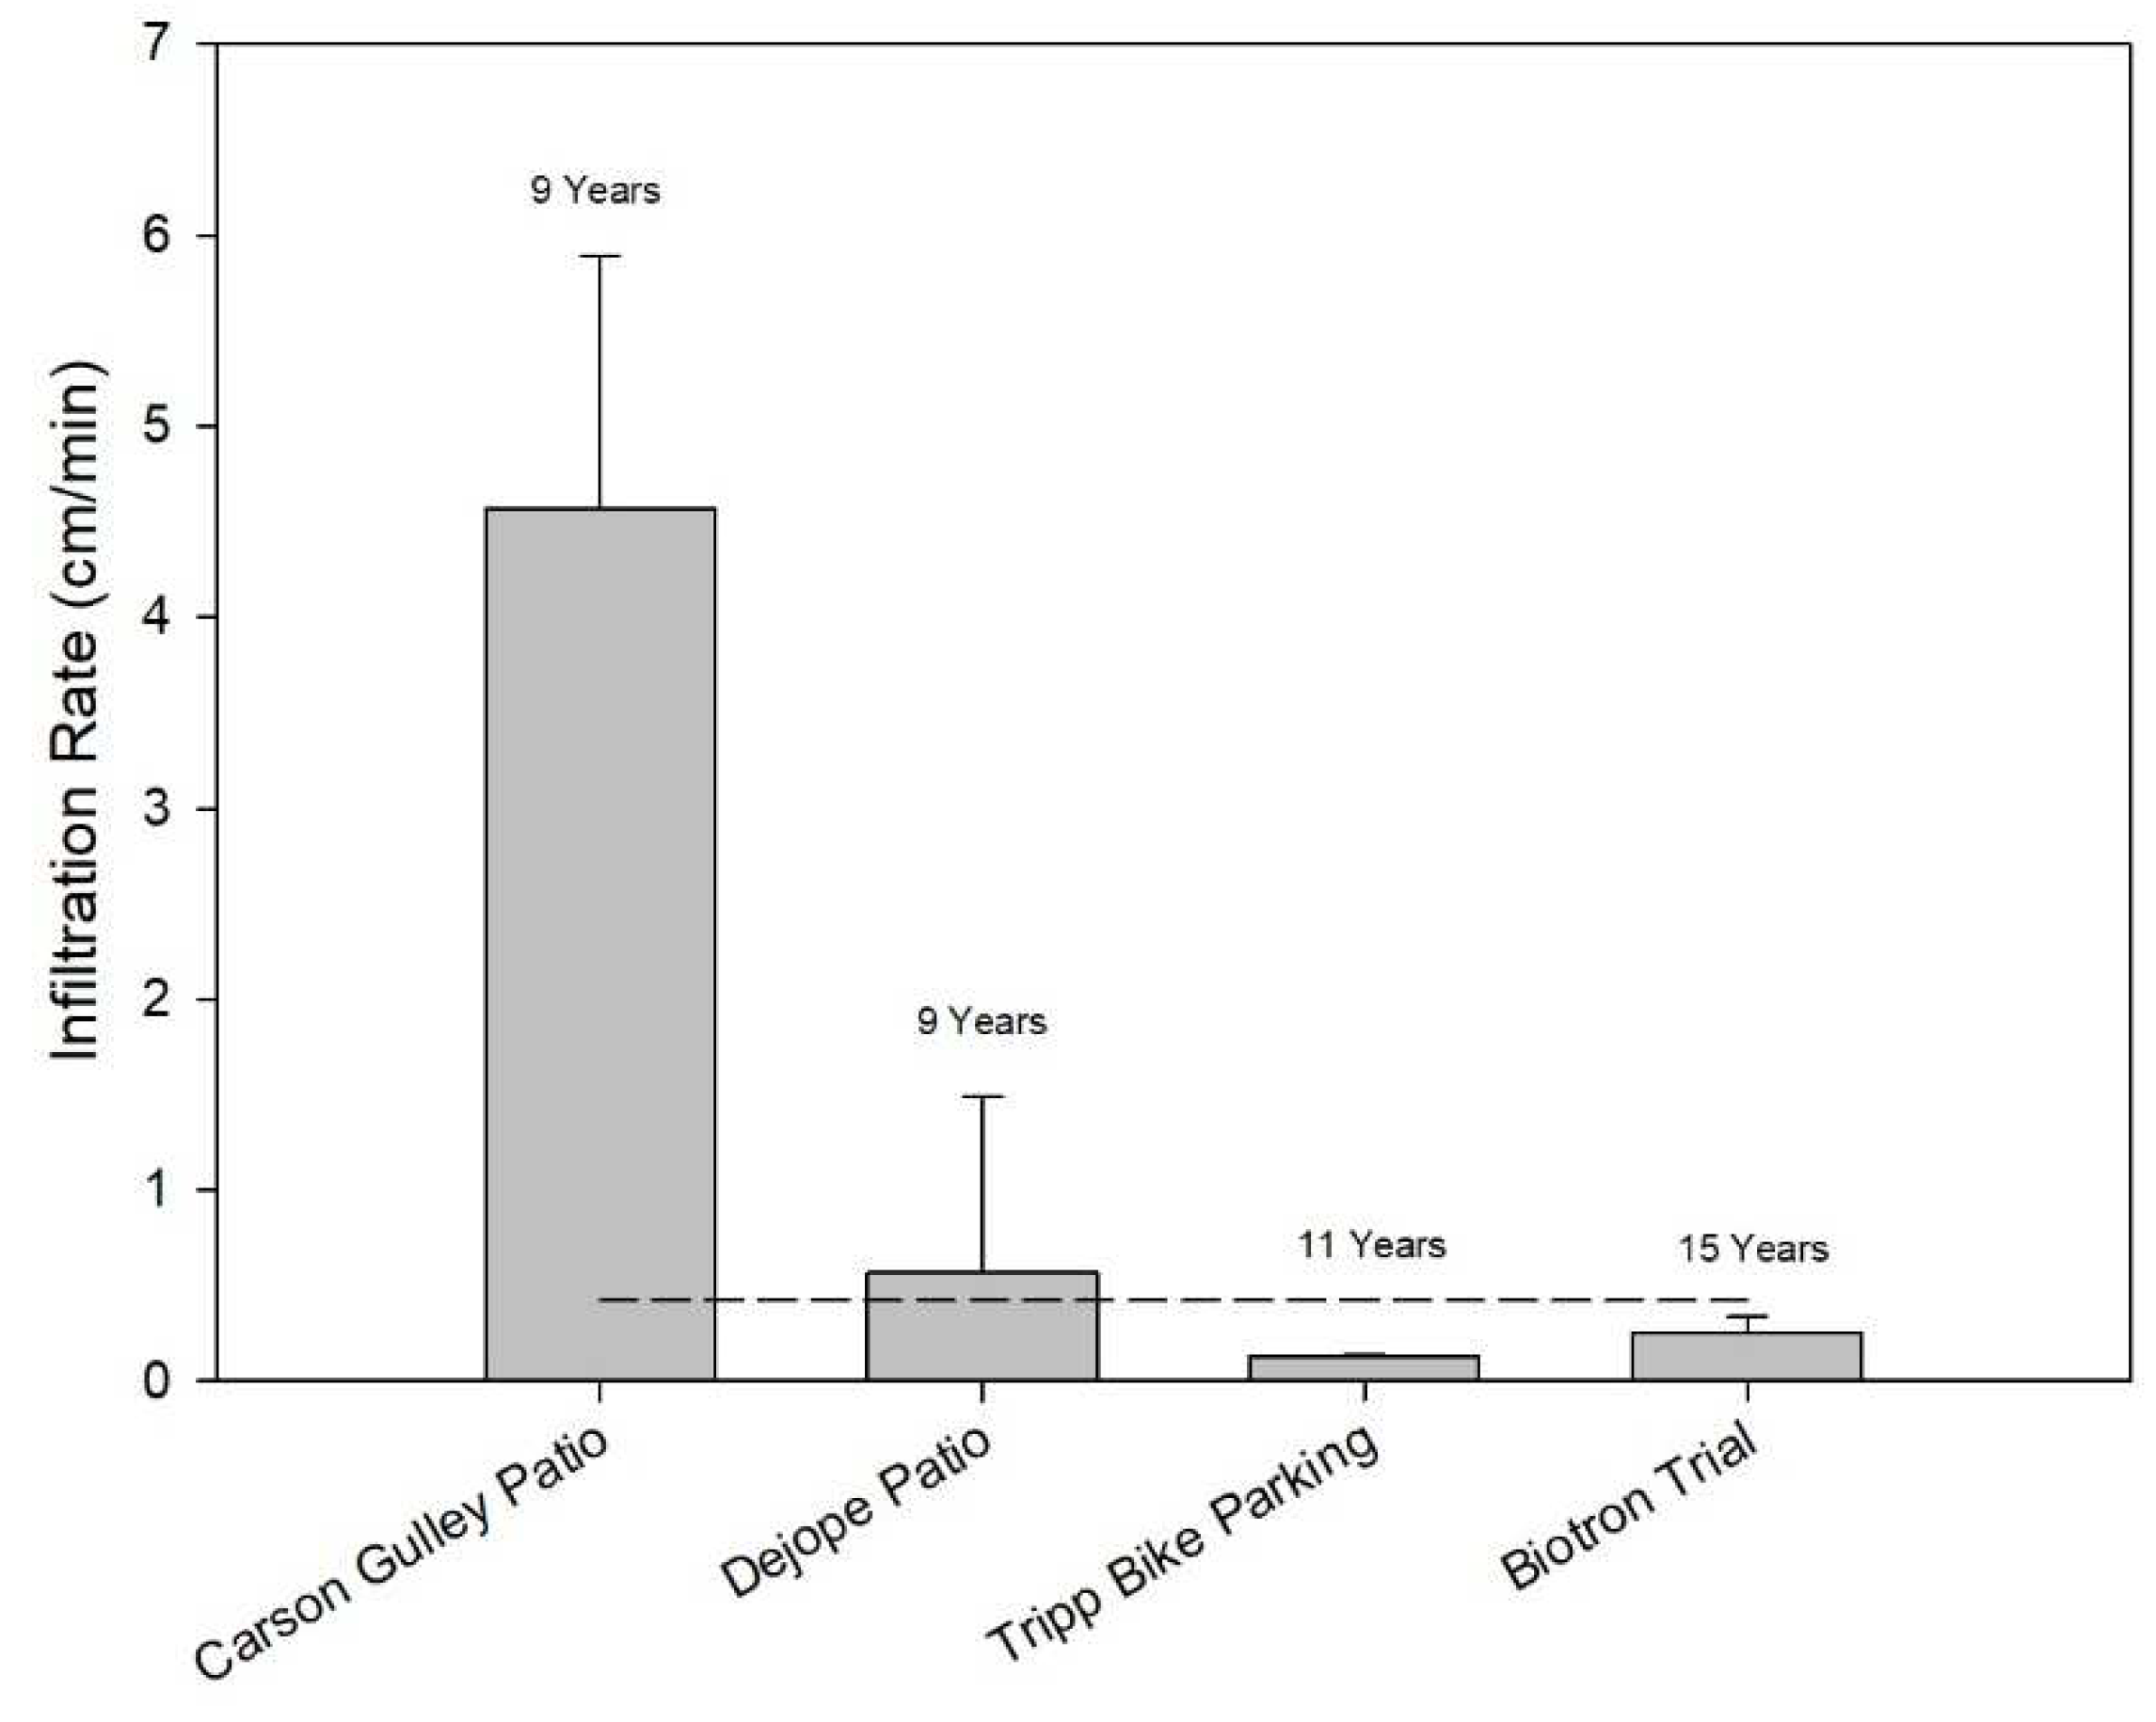
Infiltration rates varied between the four porous pavement and paver sites measured in this study (Figure 5). The infiltration rate for both porous pavers exceeded WDNR requirements for a porous pavement (0.42 cm min-1) [9]. The Carson Gulley porous pavers with aggregates exceeded this requirement with an average infiltration rate of 4.57 cm min-1, as did the Dejope porous pavers without aggregates, but by a lesser amount (0.57 cm min-1.) There was higher variability in the Dejope site with a standard deviation that exceeded the mean (0.92 cm min-1). Neither porous pavement (porous asphalt or porous concrete) met WDNR requirements, although the porous asphalt did have a slightly higher infiltration rate than the porous concrete (0.25 and 0.13 cm min-1, respectively).

4. Discussion

Our results suggest that TSS concentrations in stormwater runoff may be less of a concern compared to TP for the university within the area and for the period sampled here. The TP of several catchments exceeded the international benchmark, which is noteworthy in an already phosphorus-impaired watershed [4]. However, the TKN and Cl- concentrations were similar to other cold-climate municipalities and, although potentially detrimental to the watershed, were not at levels of concern over the period assessed in this study [33]. The WinSLAMM model yielded similar TP and TKN concentrations compared to empirical values in this study, however it yielded TSS concentrations almost fourfold higher than empirical data. The porous pavers measured in this study were more effective at infiltrating stormwater compared to the porous pavements, which did not meet WDNR infiltration requirements.
The TSS concentrations observed here were well below the international average [25] and nearly half of those from similar catchments around Madison, Wisconsin [34,35]. These differences may be explained from the lower proportion of impervious surfaces that characterize the university grounds sampled in this study compared to the city of Madison [34,35]. It was demonstrated with the use of geotextiles that urban areas with greater extent of pervious ground showed reductions in TSS concentrations specifically when that pervious ground is managed to prevent erosion [36]. Because most pervious areas in the sampled catchments were comprised of well-maintained lawns or forested areas which can stabilize soil macroaggregates, we hypothesize that erosion was likely minimized overall reducing the potential TSS concentrations in these catchments [37]. Alternately, we may have underestimated mean annual concentrations of TSS by the limited two-month sampling period, which may not capture the seasonal variability of this pollutant [38,39]. For example, concentrations of TSS have been shown to increase significantly at the beginning of the stormwater season (early May in our region), appearing as a “first-flush” effect, followed by a decrease as the summer progresses [38,39]. Adding to this potential error, samples taken in this study immediately after the rainfall events may not represent the mean TSS concentrations of the entire event. Research has demonstrated how rainfall characteristics can lead to differing TSS concentrations over the course of a stormwater event [40]. Whether this disparity is the result of differences in land cover, the sampling methods used in this study, or both, the implication these data have for TSS loading warrants further investigation.
Both TP concentrations and its variability between catchments were greater for the area studied compared to international averages, exceeding those averages during many rainfall events. This variability may be attributed to differences in land use. Typically, higher phosphorus concentrations are associated with effluent water sourced from pervious areas receiving phosphorus fertilizer (e.g., lawns) or areas where organic litter can be eroded in stormwater events (e.g., disturbed construction areas) [16,41,42]. Consistent with these drivers, the outlets in this study that drained more pervious catchment areas supporting lawn and urban trees displayed elevated levels of TP compared to outlets draining more impervious areas. Similarly, our measurements of TP were within the range of low-density residential areas encompassing lawns and gardens and commercial areas that incorporate green and gray infrastructure [35,41,43]. Despite the observed elevated TP concentrations from the more pervious catchments, overall, TP concentrations from all land uses were similar to other studied urban areas [35,41,43].
Both TKN and chloride concentrations measured in this study corresponded with concentrations in similar landscapes. The concentrations of TKN approached TN values of the more urbanized area of Madison, Wisconsin and an urbanized catchment of Columbus, Ohio (e.g. Smith et al. 2020). Research in Australia demonstrated that TKN represents a high percentage of TN, nearly 84% in some cases, which would make the TKN levels in this study comparable to the TN international benchmark and other research (e.g. Lucke et al., 2018) reasonable [44,45]. As demonstrated in an urban catchment in Florida, a likely source of organic nitrogen was leaf litter and grass clippings, detritus was likewise observed in our samples [44]. These comparisons suggest that campus management of vegetative detritus may be critical in mitigating stormwater TKN. Similarly, the chloride concentrations measured in this study were consistent with levels found in watersheds within cold climates requiring road salts [39,46]. As with TSS, a seasonal bias in sampling may explain these results, as chloride concentrations in runoff typically fall to their lowest levels in late summer and fall months, as documented in a study of urban stormwater in Helinski, Finland [39]. Thus, we hypothesize that chloride concentrations would increase dramatically following snowmelt, a hypothesis worth testing specifically on large university campuses within temperate climates that feed large water bodies (such as the one here) that require ice abatement [47,48].
In this study, observed TSS concentrations were four times lower than the modeled values generated by WinSLAMM. These differences may be explained by three possible sources of error. First the aforementioned bias in sampling may have contributed to the discrepancy between modeled and observed values. Second, WinSLAMM modeled an average TSS concentrations over five years using parametrized precipitation values from a rainfile spanning 1980-1985, which likely varies from the two-month sampling average used in this study. Third, the overestimations of the WinSLAMM modeled TSS concentrations may be due to the model’s lack of appropriate parameters to represent an increasingly complex landscape that integrates stormwater management infrastructures [34,49]. For example, a study reviewing the role of particle size distribution in stormwater modeling found that particle size distribution can have a significant effect on modeled outputs of loading [49,50,51], a physical aspect of the soil influenced by stormwater mitigation and not quantified in our study. Uncalibrated particle sizes coupled with inaccurate landcover data and parameterization for the modeled area may have synergistically combined to produce overestimated concentrations of solids present in effluent water observed in this study.
In contrast with TSS, the WinSLAMM model more closely characterized empirical estimates of stormwater TP and TKN concentrations in the university catchments. This alignment is somewhat counterintuitive given runoff with phosphorus and nitrogen is often sourced from suspended particles, which the WinSLAMM model utilizes in part to estimate TP and TKN concentrations [16,43,49]. If TP and TKN were indeed accurately modeled, this suggests that TSS was likewise correctly modeled. Alternately, we hypothesize that the discrepancy between TSS and TKN and TP could be due to higher contributions of non-particulate bound sources of TP and TKN from litter or from the dissolved sources of these two pollutants. Studies have found that the non-particulate and dissolved fractions of nitrogen and phosphorus were significant contributors to their overall concentration in stormwater [44,52,53]. This disparity supports investigation into sources of phosphorus and nitrogen and their relative contribution to stormwater generated from this setting.
As referenced earlier in the discussion, the differences between the modeled and field-measured results in this study may solely be explained by a temporal discontinuity [38,39] between the sampling period of this study relative to the five-year averages based on the 1980-1985 rainfile for Madison, WI used in the current WinSLAMM model. Because it was recommended that the WinSLAMM model is only suited for periods over a year [54], we decided to test if modeled values of TSS would more closely align with our empirical estimates if the sampling period was constrained to the two-month sampling period used in this study (August – September). This comparison yielded TSS concentrations that were similar to the values generated by the five-year model; seasonally-modeled values for TSS exceeded the five-year model by an average of 16.1 mg L-1 with a standard deviation of 7.59 mg L-1. The seasonal model also exceeded empirical measurements of TSS concentrations by an average of 164 mg L-1 with a standard deviation of 14.1 mg L-1.
The infiltration rate of the porous pavers with aggregates outperformed the WDNR standard by over four cm min-1, as well as the other three porous surfaces measured in this study, which did not meet this standard. We hypothesize that this difference may be explained by an interaction between the landcover type producing the influent stormwater, the age of the system, and the type of porous material used, all of which affect clogging between aggregates. In a study testing the change in infiltration and flow rate on a lab-simulated porous pavement, variable clogging was observed with changes in influent suspended particles changed used as a proxy for different landcover [55]. This effect of the surrounding landcover may be enhanced as the porous system ages. Case studies have also shown porous pavers, porous concrete, and porous asphalt to clog at significantly different rates in as little as three years post instillation, although regular maintenance of these systems can minimize these differences [55,56]. An age difference may explain the higher infiltration rate of the porous pavers, the youngest systems by two years, however it is not sufficient to explain the differences between the other two, similar-aged paver systems or the higher infiltration rate of the older porous asphalt relative to the porous concrete. We speculate that the fourfold increase in infiltration rate between the two porous pavers of the same age may either be attributed to the inclusion of the aggregates in the interlocking gaps of the paver system. Assuming minimal differences in their immediate environments, the aggregates could have contributed to decreased rates of clogging leading to sustained infiltration rates relative to the other systems [57]. Relative to our finding of porous asphalt, a recent study of porous pavements demonstrated that porous asphalt retains its infiltration rate more effectively than porous concrete [56]. Although this study only assessed data over three years, we surmise that the porous asphalt either retained its pore connectivity since installation or its surrounding environment did not produce the solids necessary to clog its pores at a comparable rate to the porous concrete. Although strong inference cannot be generated from our case study, these results do suggest that the matching of the porous surface type to its site is essential to the long-term maintenance plan and mitigating effectiveness of these systems.

Author Contributions

C.K and N.B were involved in study design and draft writing. Execution, analysis, and graphing was conducted by C.K. under the supervision of N.B. Both authors have read and agreed to the published version of the manuscript.

Funding

Funded by the University of Wisconsin-Madison Lakeshore Nature Preserve Student Engagement Grant

Data Availability Statement

The data presented in this study are available upon request from the corresponding author.

Acknowledgments

We would like to thank the UW-Madison Lakeshore Nature Preserve board and staff for providing us with the funding, access, and additional resources necessary for conducting this study.

Conflicts of Interest

The authors declare no conflicts of interest. The funders had no role in the design of the study; in the collection, analyses, or interpretation of data; in the writing of the manuscript; or in the decision to publish the results.

References

  1. WDNR 2022 Water Quality Lists. 2022.
  2. Weng, W.; Boyle, K.J.; Farrell, K.J.; Carey, C.C.; Cobourn, K.M.; Dugan, H.A.; Hanson, P.C.; Ward, N.K.; Weathers, K.C. Coupling Natural and Human Models in the Context of a Lake Ecosystem: Lake Mendota, Wisconsin, USA. Ecological Economics 2020, 169.
  3. UW-Madison Green Infrastructure and Stormwater Management Master Plan: 2015 Update; Madison, Wisconsin, 2015.
  4. YaharaWINS Madison Metropolitan Sewerage District Adaptive Management Plan; 2017.
  5. UW-Madison Stormwater Management Plan Campus – March 2021; Madison, Wisconsin, 2021.
  6. Lucke, T.; Beecham, S. An Investigation into the Differences in Infiltration Capacity between Porous and Permeable Concrete Pavers Installed on Sloping Sub-Catchments Analyse Des Différences de Capacité d ’ Infiltration Entre Des Pavés de Béton Poreux et Perméables Installés Su. Novatech 2013, 1–9.
  7. Ferguson, B.K. Stormwater Management and Stormwater Restoration. Handbook of water sensitive planning and design 2002, 11–28.
  8. Davies, J.W.; Pratt, C.J.; Scott, M.A. Laboratory Study of Permeable Pavement Systems to Support Hydraulic Modeling. Global Solutions for Urban Drainage 2002, 1–9. [CrossRef]
  9. WDNR Wisconsin Department of Natural Resources Technical Standard Permeable Pavement; 2021.
  10. Young, B.N.; Hathaway, J.M.; Lisenbee, W.A.; He, Q. Assessing the Runoff Reduction Potential of Highway Swales and WinSLAMM as a Predictive Tool. Sustainability (Switzerland) 2018, 10. [CrossRef]
  11. Wisc. Sate Legislature Chapter NR 216 Storm Water Discharge Permits; https://docs.legis.wisconsin.gov/code/admin_code/nr/200/216: Wisconsin, 2022.
  12. Wisc. State Legislature Wisconsin Legislature: Chapter NR 152; Wisconsin.
  13. BENT, G.C.; GRAY, J.R.; SMITH, K.P.; GLYSSON, G.D. A Synopsis of Technical Issues for Urban Runoff A Synopsis of Technical Issues for Urban Runoff; Northborough, 2001.
  14. Lee, J.G.; Heaney, J.P.; Pack, C.A. Frequency Methodology for Evaluating Urban and Highway Storm-Water Quality Control Infiltration BMPs. J Water Resour Plan Manag 2010, 136, 237–247. [CrossRef]
  15. Bilotta, G.S.; Brazier, R.E. Understanding the Influence of Suspended Solids on Water Quality and Aquatic Biota. Water Res 2008, 42, 2849–2861. [CrossRef]
  16. Yang, Y.Y.; Toor, G.S. Stormwater Runoff Driven Phosphorus Transport in an Urban Residential Catchment: Implications for Protecting Water Quality in Urban Watersheds. Sci Rep 2018, 8, 1–10. [CrossRef]
  17. Wall, D. A2. Nitrogen in Waters: Forms and Concerns; 2013.
  18. Elphick, J.R.F.; Bergh, K.D.; Bailey, H.C. Chronic Toxicity of Chloride to Freshwater Species: Effects of Hardness and Implications for Water Quality Guidelines. Environ Toxicol Chem 2011, 30, 239–246. [CrossRef]
  19. ESRI Team; Soil Survey Staff US Soil_Survey 2010.
  20. Soil Survey Staff Web Soil Survey.
  21. WDNR Basic Labratory Study Guide. Wisconsin Department of Natural Resources Wastewater Operator Certification 2015.
  22. USEPA Method 365.4: Phosphorous, Total (Colorimetric, Automated, Block Digester AA II); 1974.
  23. USEPA Method 351.2, Revision 2.0: Determination of Total Kjeldahl Nitrogen by Semi-Automated Colorimetry; 1993.
  24. Standard Methods 4500-Cl− CHLORIDE - Standard Methods For the Examination of Water and Wastewater. Standard Methods For the Examination of Water and Wastewater, 23rd 2018. [CrossRef]
  25. Shahzad, H.; Myers, B.; Hewa, G.; Johnson, T.; Boland, J.; Mujtaba, H. Characterizing the Stormwater Runoff Quality and Evaluating the Performance of Curbside Infiltration Systems to Improve Stormwater Quality of an Urban Catchment. Water (Switzerland) 2022, 14. [CrossRef]
  26. Wisc. Admin Code Wis. Admin. Code NR § 105.06 - Chronic Toxicity Criteria and Secondary Chronic Values for Fish and Aquatic Life; Wisconsin, 2023.
  27. USEPA Ambient Water Quality for Chloride-1988; Duluth, MN, 1988.
  28. PV & Associates WisReg - Madison WI Five 1981-1984.Ran 2016.
  29. USGS WinSLAMM (Source Loading And Management Model): An Urban Area Nonpoint Source Water-Quality Model for Wisconsin Available online: https://www.usgs.gov/centers/upper-midwest-water-science-center/science/winslamm-source-loading-and-management-model.
  30. Reynolds, W.D.; Elrick, D.E.; Youngs, E.G. Single-Ring and Double- or Concentric-Ring Infiltrometers. In Methods of Soil Analysis Part 4: Physical Methods; Dick, W.A., Ed.; Soil Science Society of America. Inc., 2002; pp. 821–826.
  31. Martin, W.D.; Putman, B.J.; Kaye, N.B. Using Image Analysis to Measure the Porosity Distribution of a Porous Pavement. Constr Build Mater 2013, 48, 210–217. [CrossRef]
  32. Neithalath, N.; Sumanasooriya, M.S.; Deo, O. Characterizing Pore Volume, Sizes, and Connectivity in Pervious Concretes for Permeability Prediction. Mater Charact 2010, 61, 802–813. [CrossRef]
  33. Correll, D.L. Phosphorus: A Rate Limiting Nutrient in Surface Waters. 1999, 674–682. [CrossRef]
  34. Buer, N.H.; Selbig, W.R. Evaluation of Stormwater Treatment Vault with Coanda-Effect Screen for Removal of Solids and Phosphorus in Urban Runoff. J Sustain Water Built Environ 2020, 6, 1–10. [CrossRef]
  35. Smith, J.S.; Winston, R.J.; Tirpak, R.A.; Wituszynski, D.M.; Boening, K.M.; Martin, J.F. The Seasonality of Nutrients and Sediment in Residential Stormwater Runoff: Implications for Nutrient-Sensitive Waters. J Environ Manage 2020, 276. [CrossRef]
  36. Ramli, S.; Wahhit, M.R.F. The Effectiveness of Non-Woven Geotextiles as a Filter Media for Total Suspended Solid Removal. Lecture Notes in Civil Engineering 2022, 214, 329–338. [CrossRef]
  37. Monteiro, J.A. Ecosystem Services from Turfgrass Landscapes. Urban For Urban Green 2017, 26, 151–157. [CrossRef]
  38. Tiefenthaler, L.L.; Schiff, K.C.; Leecaster, M.K. Temporal Variability Patterns of Stormwater Concentrations in Urban Stormwater Runoff; 2000.
  39. Taka, M.; Kokkonen, T.; Kuoppamäki, K.; Niemi, T.; Sillanpää, N.; Valtanen, M.; Warsta, L.; Setälä, H. Spatio-Temporal Patterns of Major Ions in Urban Stormwater under Cold Climate. Hydrol Process 2017, 31, 1564–1577. [CrossRef]
  40. Gong, Y.; Liang, X.; Li, X.; Li, J.; Fang, X.; Song, R. Influence of Rainfall Characteristics on Total Suspended Solids in Urban Runoff: A Case Study in Beijing, China. Water (Basel) 2016, 8. [CrossRef]
  41. Wang, Y.; Thompson, A.M.; Selbig, W.R. Predictive Models of Phosphorus Concentration and Load in Stormwater Runoff from Small Urban Residential Watersheds in Fall Season. J Environ Manage 2022, 315. [CrossRef]
  42. Deletic, A.; Orr, D.W. Pollution Buildup on Road Surfaces. Journal of Environmental Engineering 2005, 131, 49–59. [CrossRef]
  43. Nayeb Yazdi, M.; David J.; Scott, D.; Wang, X.; Ketabchy, M. The Effects of Land Use Characteristics on Urban Stormwater Quality and Watershed Pollutant Loads. Science of the Total Environment 2021, 773. [CrossRef]
  44. Lusk, M.G.; Toor, G.S.; Inglett, P.W. Organic Nitrogen in Residential Stormwater Runoff: Implications for Stormwater Management in Urban Watersheds. Science of the Total Environment 2020, 707, 135962. [CrossRef]
  45. Lucke, T.; Drapper, D.; Hornbuckle, A. Urban Stormwater Characterization and Nitrogen Composition from Lot-Scale Catchments — New Management Implications. Science of the Total Environment 2018, 619–620, 65–71. [CrossRef]
  46. Fitzpatrick, M.L.; Long, D.T.; Pijanowski, B.C. Exploring the Effects of Urban and Agricultural Land Use on Surface Water Chemistry, across a Regional Watershed, Using Multivariate Statistics. Applied Geo-chemistry 2007, 22, 1825–1840.
  47. Dugan, H.A.; Skaff, N.K.; Doubek, J.P.; Bartlett, S.L.; Burke, S.M.; Krivak-Tetley, F.E.; Summers, J.C.; Hanson, P.C.; Weathers, K.C. Lakes at Risk of Chloride Contamination. Environ Sci Technol 2020, 54, 6639–6650. [CrossRef]
  48. Magnuson, J. Winter Chloride Concentrations in Urban Wetlands and Streams around Lake Mendota - North Temperate Lakes; 2015.
  49. Yuan, L.; Sinshaw, T.; Forshay, K.J. Review of Watershed-Scale Water Quality and Nonpoint Source Pollution Models. Geosciences 2020, Vol. 10, Page 25 2020, 10, 25. [CrossRef]
  50. Selbig, W.R. Characterizing the Distribution of Particles in Urban Stormwater: Advancements through Improved Sampling Technology. Urban Water J 2015, 12, 111–119. [CrossRef]
  51. Selbig, W.R.; Fienen, M.N.; Horwatich, J.A.; Bannerman, R.T. The Effect of Particle Size Distribution on the Design of Urban Stormwater Control Measures. Water 2016, Vol. 8, Page 17 2016, 8, 17. [CrossRef]
  52. Ma, J.; Ying, G.; Sansalone, J.J. Transport and Distribution of Particulate Matter Phosphorus Fractions in Rainfall-Runoff from Roadway Source Areas. Journal of Environmental Engineering 2010, 136, 1189–1319. [CrossRef]
  53. Berretta, C.; Sansalone, J. Hydrologic Transport and Partitioning of Phosphorus Fractions. J Hydrol (Amst) 2011, 403, 25–36. [CrossRef]
  54. Doug Joachim Personal Communication 2021.
  55. Zhang, J.; She, R.; Dai, Z.; Ming, R.; Ma, G.; Cui, X.; Li, L. Experimental Simulation Study on Pore Clogging Mechanism of Porous Pavement. Constr Build Mater 2018, 187, 803–818. [CrossRef]
  56. Brown, R.A.; Borst, M. Evaluation of Surface Infiltration Testing Procedures in Permeable Pavement Systems. Journal of Environmental Engineering 2014, 140, 1–12. [CrossRef]
  57. Chen, X.; Zhao, J.; Chen, L. Experimental and Numerical Investigation of Preferential Flow in Fractured Network with Clogging Process. Math Probl Eng 2014. [CrossRef]
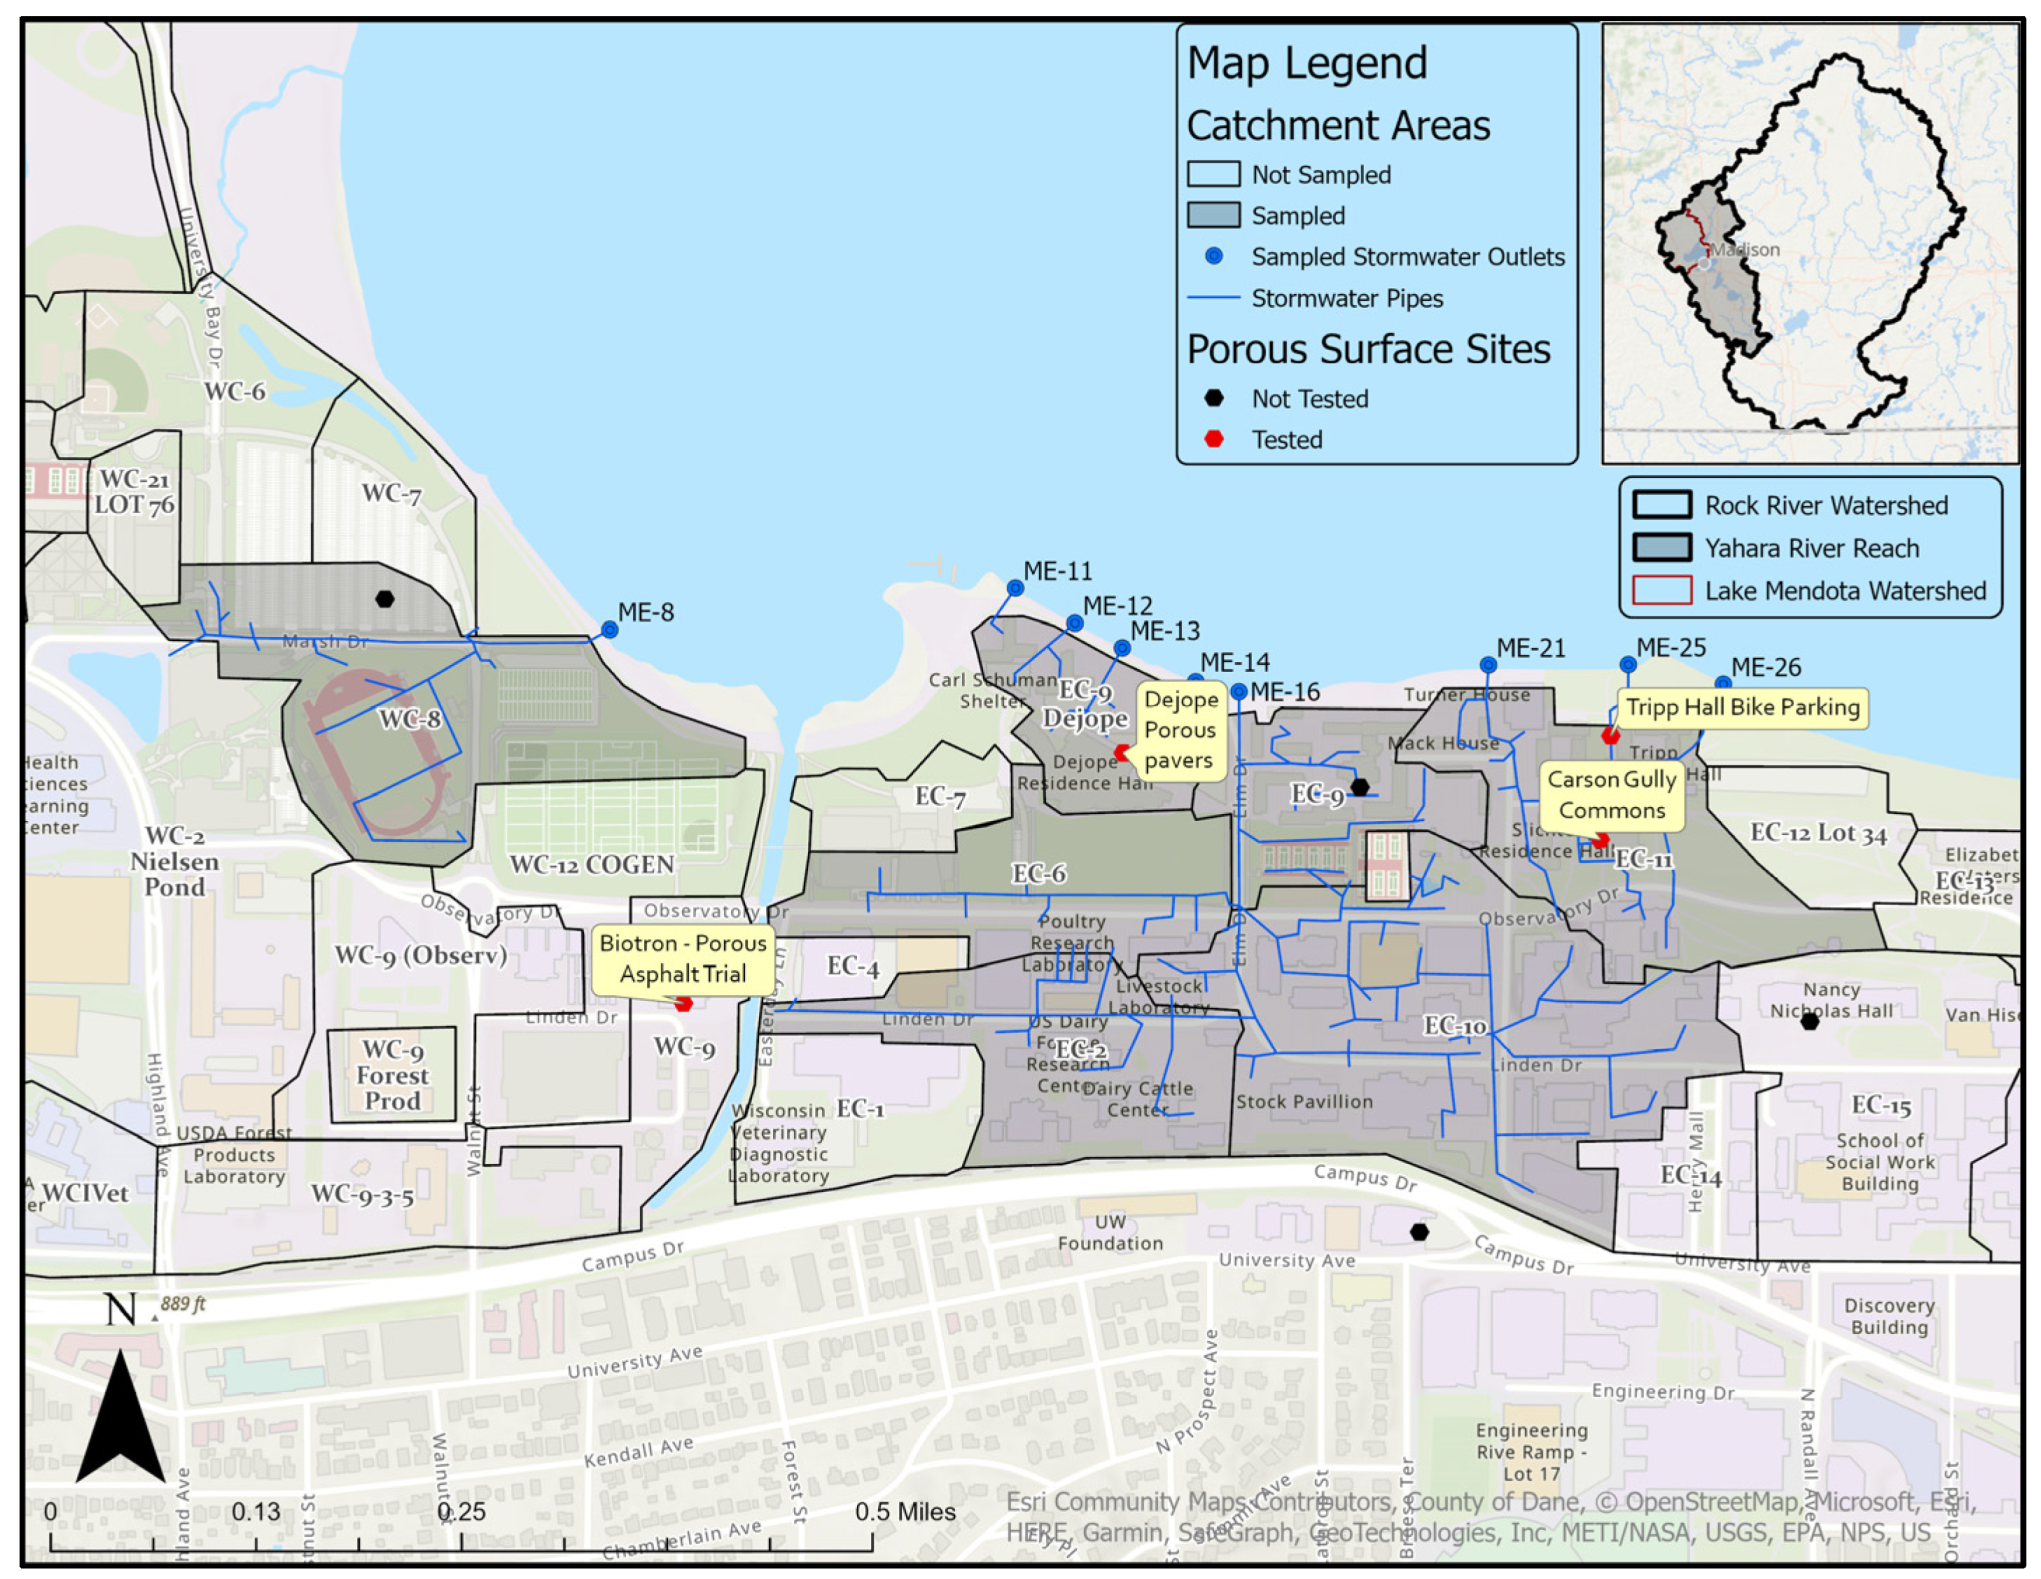
Figure 1. Study area. A map displaying the study area on the University of Wisconsin-Madison campus with delineated catchment areas. Catchments including sampled storm drains are represented in the grey shaded areas and pertinent stormwater pipes are delineated in blue. Locations of tested porous surfaces are also represented by the red dots.
Preprints 94359 g001
Figure 2. Rainfall over sampling period. The arithmetic mean of rainfall depths during the sampling window (August to September, 2021) derived from four weather stations surrounding Madison, WI. Sampled rainfall events are denoted with an asterix (*) above the relevant bar.
Preprints 94359 g002
Figure 3. Empirical stormwater pollutant concentrations. Bar plots displaying the arithmetic mean concentrations of a) total suspended solids (TSS), b) total Kjeldahl nitrogen (TKN), c) total phosphorus (TP), and d) chlorides (Cl-) for every stormwater outlet in mg L-1. The dashed lines in figures a, b, and c represent the international average concentration as reported by Shahzad et al. (2022) for that pollutant, except figure c has a benchmark of total nitrogen (TN) in lieu of no known benchmark for TKN [25]. In figure d, the short-long dashed line represents the chronic toxicity threshold for Cl- as reported by the US Environmental Protection Agency [27] and the short dash represents the Wisconsin Department of Natural Resources (WDNR) chronic toxicity level for Cl-. [26].
Preprints 94359 g003
Figure 4. Empirical and WinSLAMM stormwater pollutant concentrations. Bar plots displaying mean pollutant concentrations (mg L-1) for the pollutant in a catchment area (gray bars) and WinSLAMM (v10.5.0) average modeled pollutant concentrations for that same catchment. The mean pollutant concentrations graphed are a) TSS, b) TKN, c) TP. The same international stormwater averages are also shown for each respective pollutant in the dashed lines as in Figure 3 [25].
Preprints 94359 g004
Figure 5. Infiltration measurements. Infiltration rates for each porous pavement or paver in cm min-1 measured to the nearest millimeter. The Wisconsin Department of Natural Resources (WDNR) requirement for a porous pavement (0.42cm min-1) is represented by a dashed line [9]. Each porous pavement or paver site is referred to in Figure 1 and described in Table 2.
Preprints 94359 g005
Table 1. Catchment area inventory. Details regarding each catchment area including its substituent stormwater outlets, its total area, and the percent landcover devoted to permeable and imperviable surfaces.
Catchment Area Associated Stormwater Outlet(s) Total Area (Acres) % Impervious Area % Permeable Area
WC-8 ME-8 21.398 60% 40%
EC-2 ME-16 13.739 77% 23%
EC-4 ME-16 2.416 94% 6%
EC-6 ME-16 12.654 41% 59%
EC-9 ME-16 7.366 57% 43%
EC-9 Dejope ME-11. ME-12, ME-13, ME-14 6.778 61% 39%
EC-10 ME-16 30.01 70% 30%
EC-11 ME-25, ME-26 16.133 53% 47%
Table 2. Porus surfaces in study. Information regarding each porous pavement and porous paver site sampled in the study. Each site is accompanied by the type of porous surface, the rough dimensions of the system, and an image of each location.
Site Name Surface Material Approximate Dimensions Image of Porous Surface
Dejope Hall Patio Porous pavers without aggregates 28.6 x 10.7 m Preprints 94359 i001
Carson Gulley Patio Porous pavers with aggregates 22.1 x 9.3 m Preprints 94359 i002
Tripp Hall Bike Parking Porous concrete 19.7 x 1.8 m Preprints 94359 i003
Biotron Porous Asphalt Trial Porous asphalt 21.6 x 2.4 m Preprints 94359 i004
Disclaimer/Publisher’s Note: The statements, opinions and data contained in all publications are solely those of the individual author(s) and contributor(s) and not of MDPI and/or the editor(s). MDPI and/or the editor(s) disclaim responsibility for any injury to people or property resulting from any ideas, methods, instructions or products referred to in the content.
Copyright: This open access article is published under a Creative Commons CC BY 4.0 license, which permit the free download, distribution, and reuse, provided that the author and preprint are cited in any reuse.
Prerpints.org logo

Preprints.org is a free preprint server supported by MDPI in Basel, Switzerland.

Subscribe

© 2024 MDPI (Basel, Switzerland) unless otherwise stated