Preprint
Article

An Evolutionary Theory on Virus Mutation in COVID-19

Altmetrics

Downloads

184

Views

69

Comments

0

A peer-reviewed article of this preprint also exists.

Liaofu Luo  *
,
Jun Lv  *

This version is not peer-reviewed

Submitted:

23 March 2024

Posted:

26 March 2024

You are already at the latest version

Alerts
Abstract
With the rapid evolution of SARS-CoV-2, the emergence of new strains is an intriguing question. This paper presents an evolutionary theory to analyze the mutations of the virus and identify the conditions that lead to the generation of new strains. We represent the virus variants using a 4-letter sequence based on amino acid mutations on the spike protein and employ an n-distance algorithm to derive a variant phylogenetic tree. We show that the theoretically-derived tree aligns with experimental data on virus evolution. Additionally, we propose an A-X model, utilizing the set of existing mutation sites (A) and a set of randomly generated sites (X), to calculate the emergence of new strains. Our findings demonstrate that a sufficient number of random iterations can predict the generation of new macro-lineages when the number of sites in X is large enough. These results provide a crucial theoretical basis for understanding the evolution of SARS-CoV-2.
Keywords: 
Subject: Biology and Life Sciences  -   Ecology, Evolution, Behavior and Systematics

1. Introduction

The novel coronavirus, SARS-CoV-2, has been continuously mutating for over three years, giving rise to different variants such as alpha, beta, gamma, delta, and omicron. The complex relationship between virus antigenicity, transmission, and virulence makes the future trajectory of COVID-19 unpredictable (Carabelli et al., 2023; Markov et al., 2023; Cao et al., 2023; Mallapaty, 2022; Callaway, 2021; Wang et al., 2023). Recent research has identified two primary forces controlling virus evolution: intrinsic transmissibility, determined by the ACE2 binding affinity of SARS-CoV-2, and immune evasion, achieved through a reduction in susceptibility to neutralizing antibodies (Ma et al., 2023). Studies have also examined the relationship between the spike protein charge and viral infectivity and transmissibility (Božič and Podgornik, 2023; Cotton and Phan, 2023).
In a prior study (Luo and Lv, 2023), we introduced a mathematical model for analyzing the dynamics of COVID-19 spread, with a specific focus on the competitive dissemination of two viruses within a given region. Building upon this work, the present article puts forth an evolutionary theory concerning virus mutation in the context of COVID-19. Our approach involves deducing an evolutionary tree based on sound assumptions regarding mutant representation, alongside the application of a well-established tree construction algorithm. Importantly, we illustrate that the theoretical tree effectively mirrors the observed evolutionary patterns of existing virus strains. Moreover, leveraging a statistical method developed in our study, we extend the utility of the evolutionary tree to predict the emergence of novel macro-lineages of viruses. These findings supply a critical theoretical framework for comprehending the evolution of SARS-CoV-2.

2. Material and Method

2.1. SARS-CoV-2 Variants

We obtained a total of 25 variants from the mutation reports provided by outbreak.info (https://outbreak.info/) (Gangavarapu et al., 2023). These variants belong to the SARS-CoV-2 Pango lineages. Our analysis focused solely on mutations that occurred in the spike protein of the virus. Additionally, we only included mutations that were found in at least 75% of the sequenced SARS-CoV-2 lineages. Table 1 provides a comprehensive list of all 25 variants and their corresponding mutation sites.

2.2. ACE2 Binding Affinity of a Single Mutation

We obtained the data for single-point mutations affecting the interaction between the receptor-binding domain (RBD) (amino acid residues 331 to 531 on the spike protein) and the ACE2 receptor from reference (Starr et al., 2020). The mean and standard deviation of the affinity for the 19 mutations occurring at the i-th residue are denoted as bi and si, respectively. If the affinity value mi for the i-th residue is greater than bi+si, the mutation is classified as an affinity-enhancing type. If mi<bi-si, the mutation is classified as an affinity-weakening type. If bi-si≤mi≤bi+si, the mutation is considered to have little effect on the binding affinity.

2.3. The n-Distance between Two Sequences

The evolutionary tree provides a detailed description of the relationships between different viral strains. Consistency with the tree of life is a stringent requirement for any proposed evolutionary model, making it a sensitive test for such models. Let pa represent the probability of a letter “a” (where a can be 0, 1, 2, or 3) occurring in a sequence, and let pab represent the joint probability of letters “a” and “b” appearing sequentially in the sequence. In general, let σ=abc... represent an n-letter segment, and let pσ denote the joint probabilities of the bases in σ occurring in the sequence. In the calculation of joint probabilities, all sequences are assumed to be circular. For any given n, the sum of the joint probabilities over all segments σ of length n is always equal to 1. This can be written as σ p σ = 1 , where the summation is over the set of all 4n segments of length n. Given two sequences Σ and Σ with sets of joint probabilities {pσ} and {p’σ} respectively, we define a distance, called an n-distance, between the two sequences based on the difference in joint probabilities as follows:
E n ( Σ , Σ ) = σ | p σ p σ | ,   n = 1 , 2 , ... .
In the following, when there is no confusion, the arguments of En will be omitted. An n-distance is well-defined for sequences of different lengths that are not aligned. By repeatedly applying relations such as equation (2) below:
| p σ p σ | = | a ( p σ a p σ a ) | a | p σ a p σ a | ,
where σ is any n-letter segment and σa is an (n+1)-letter segment, it can be deduced that:
E n + 1 E n , n = 1 , 2 , ... .

2.4. The Construction Method of the Evolutionary Tree

To infer the phylogenetic tree, three main algorithms are commonly used in the literature, based on the evolutionary information contained in the sequences: distance matrix treeing, maximum parsimony analysis, and maximum likelihood method (Li, 1997). In the distance matrix method, evolutionary distances are initially computed for all pairs of taxa. Subsequently, a phylogenetic tree is constructed using an algorithm (such as the unweighted pair-group method with arithmetic mean or UPGMA, the neighbor-joining method or NJ, etc) that relies on functional relationships among the distance values. The maximum likelihood method involves studying the relationship between each sequence and the common ancestor in all possible trees. In this article, we utilized the UPGMA (Nei and Kumar, 2000) distance matrix method for constructing the phylogenetic tree. We attempted to use alternative algorithms to reconstruct the evolutionary tree of 25 virus strains but found that the UPGMA tree was superior to others (such as the NJ tree, etc.).

3. Results

3.1. Four-Letter Representation of the Mutants

The surfaces of coronaviruses are decorated with a spike protein, about 1273 amino acids for SARS-COV2. We propose representing any SARS-CoV-2 virus strain by a 1273-long sequence of four letters: 0, 1, 2, and 3. Here, 0 represents no mutation relative to the wild type, 1 represents a mutation having little effect on the ACE2 binding affinity, 2 represents a mutation of affinity-enhancing type, and 3 represents a mutation of affinity-weakening type.
We categorize the old SARS-CoV-2 mutants (alpha, beta, gamma, delta, etc.) as the N-lineage, while the recent mutants (omicron BA.2, BA.5, etc.) are classified as the O-lineage. We consider 12 main mutants in the N-lineage and 13 mutants in the O-lineage. Figure 1 presents the representation of 25 mutants in the receptor-binding domain (RBD) of the spike protein, from site 331 to site 531. For example, the RBD of the Delta mutant is represented by (0,0,0,0,0,0,0,0,0,0,0,0,0,0,1,0,0,0,2,0,0,0,0,0,0,0,0), and the RBD of the BA.1 mutant is represented by (2,0,0,1,1,3,0,0,0,0,0,0,0,0,0,0,0,1,2,1,0,0,1,2,1,1,2). The sequences are 27 long, corresponding to 27 mutated sites. When considering all conservative sites denoted by 0 and inserting them in the sequence, we obtain 201-long sequences to describe the RBD. The 27-long sequence is the reduced sequence of the 201-long sequence.
The above representation for the RBD domain (201 sites) can be generalized to the full spike protein (1273 sites). Outside the RBD (sites 1 to 330 and sites 532 to 1273), only two letters, 0 and 1, occur since ACE2 binding does not occur in these domains. Thus, the full-spike representation of a SARS-CoV-2 mutant is a 1273-long sequence of four letters. Among the twenty-five known mutants, there are 104 mutated sites. Therefore, the reduced sequence of the full spike protein is a 104-long sequence. Table 1 lists the 25 selected mutants and their 104 mutated sites on the spike protein.

3.2. Evolutionary Tree of Virus Mutation Deduced by UPGMA Method
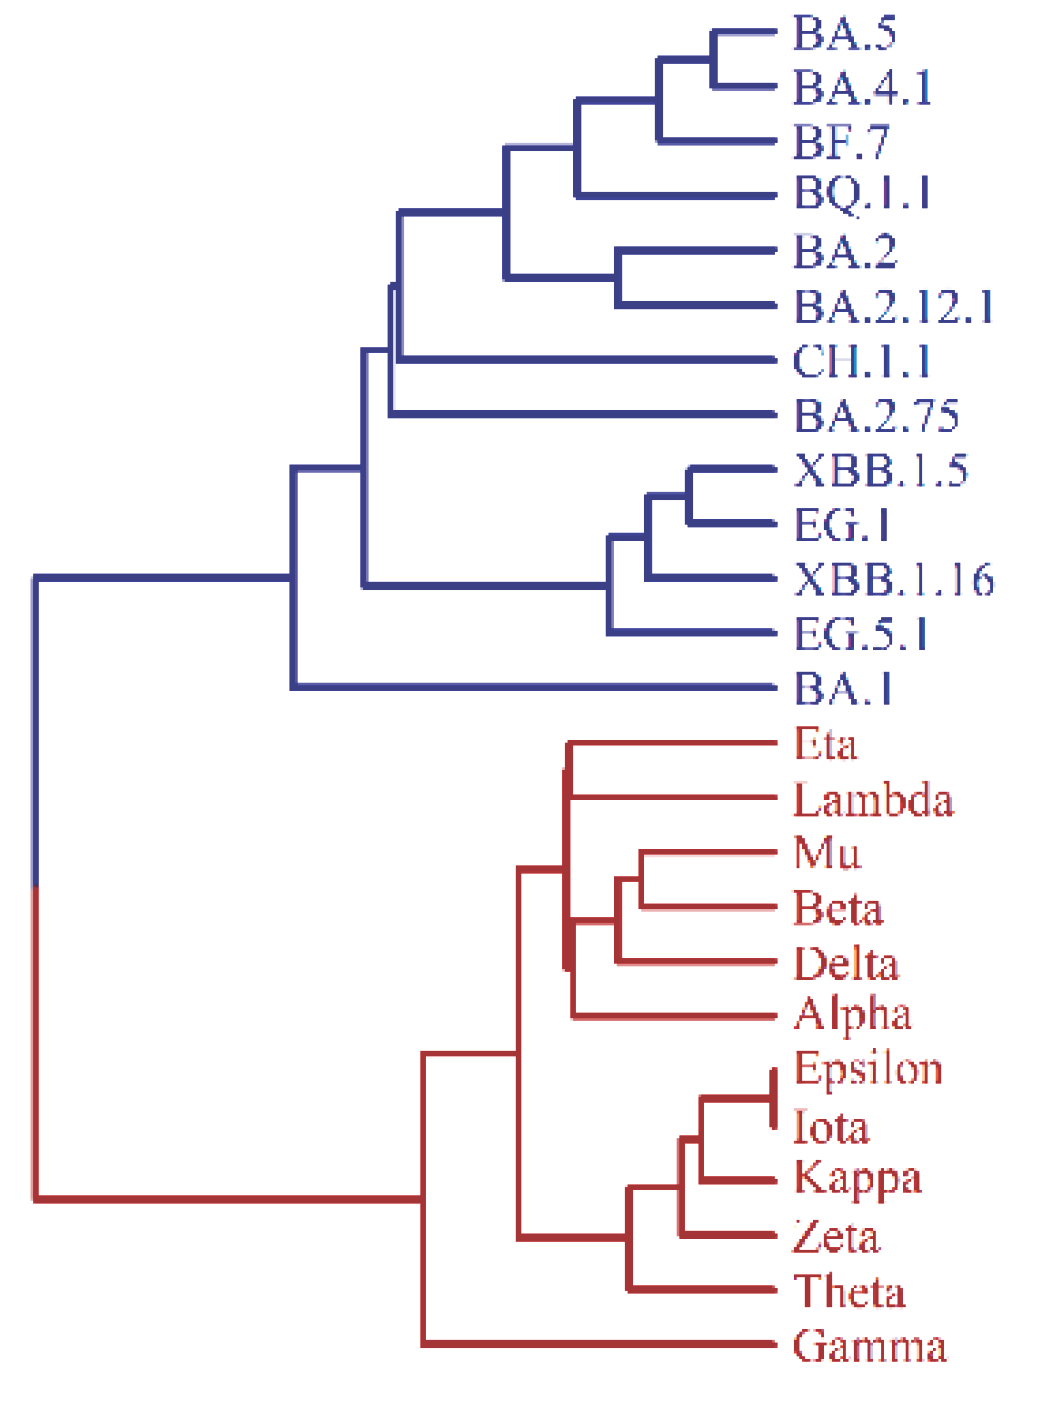
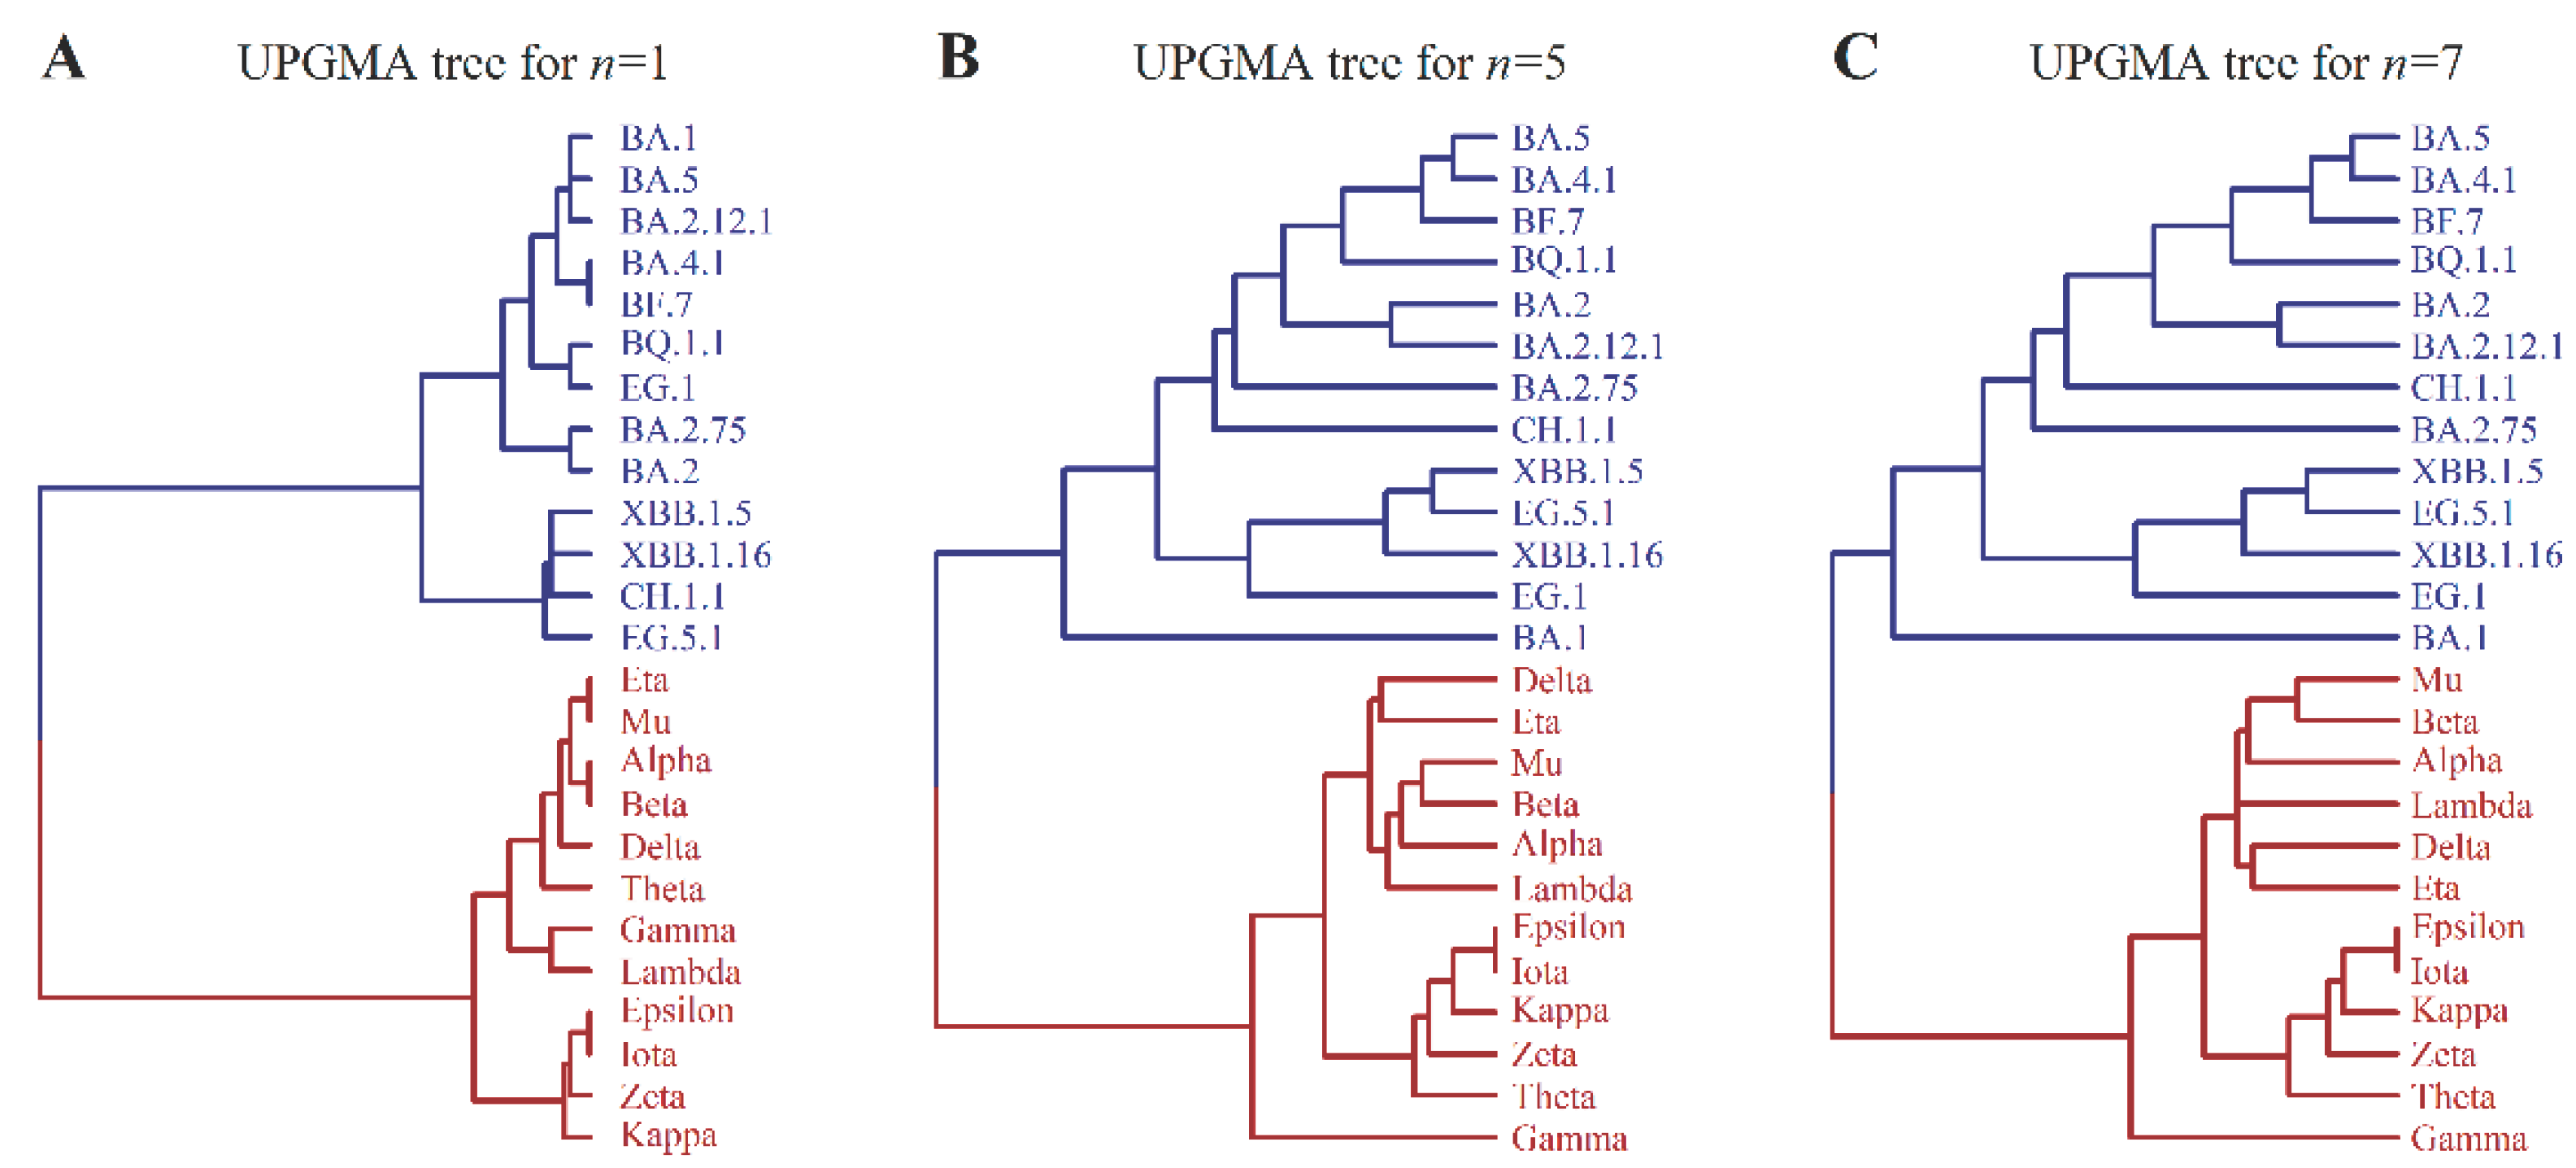
Using the n-distance, we can construct a distance matrix D for a set of mutants labeled by i, j, k, ..., where the matrix element Dij is equal to the n-distance between Σi and Σj, with Σi being the sequence representing mutant i. Then, by applying the UPGMA algorithm, we reconstruct the evolutionary tree of 25 mutants for a given value of n. We observed that the structure of the tree changes with increasing n and becomes stable after a few steps. Partial results are shown in Figure 2. Specifically, when n≥5, the tree topology of the branch corresponding to macro-lineage O achieves stability. However, the structure of branch N slightly adjusts with increasing n. When n≥7, both branches O and N achieve stability as given in Figure 2C.
Figure 2C presents a UPGMA tree of 25 virus strains, displaying two distinct large branches corresponding to the macro-lineages N and O of existing virus strains. Notably, in macro-lineage O, the sub-branch accurately reflects the bifurcation of the earliest BA.1 strain and the subsequent BA.2, BA.4, BA.5 strains, as well as the correct classification of XBB as a recombination of two BA.2 strains. In macro-lineage N, the sub-branch of the tree shows four VOCs (variants of concern) - alpha, beta, delta, and gamma, belonging to independent sub-lineages. These observations highlight the highly consistent nature of the theoretical tree with all the evolutionary peculiarities of existing virus strains. This work presents a logically simple theory of virus mutation, whereby the tree is deduced from a single basic assumption - the four-letter representation of mutants and the n-distance algorithm for tree reconstruction. It is surprising that the theory aligns so well with experimental data.
Comment on the reconstruction of the evolutionary tree: If six mutated sites 679,681,764,796,954 and 969 in the tail of the spike protein of the variant EG.1 (see Table 1) are taken into account in the reconstruction of the evolutionary tree then there are minor changes in Figure 2. Figure 2C should be changed to Figure 2C(add) as follows
Preprints 102103 i001
Figure 2C(add). UPGMA tree for n=7.
The minor change between Fig 2C and Fig 2C(add) indicates from another point of view that the UPGMA and n-distance algorithm is reliable.
The four-letter representation involves choosing between 0 and 1 for 104 mutational sites on the spike protein, while allowing for additional choices (i.e., choices 2 and 3 in addition to 0 and 1) for 27 sites on the RBD. The first part provides 104 bits of information, while the second part contributes only log(27×19)/log2=9 bits of information. Therefore, to simplify calculations, one can approximate the four-letter representation as a two-letter representation that neglects choices 2 and 3. The validity of this approximation can be seen from the fact that the tree topology in Figure 2 remains unchanged when the two-letter approximation is used.

3.3. Generation of New Strain on the Tree by Stochastic Method

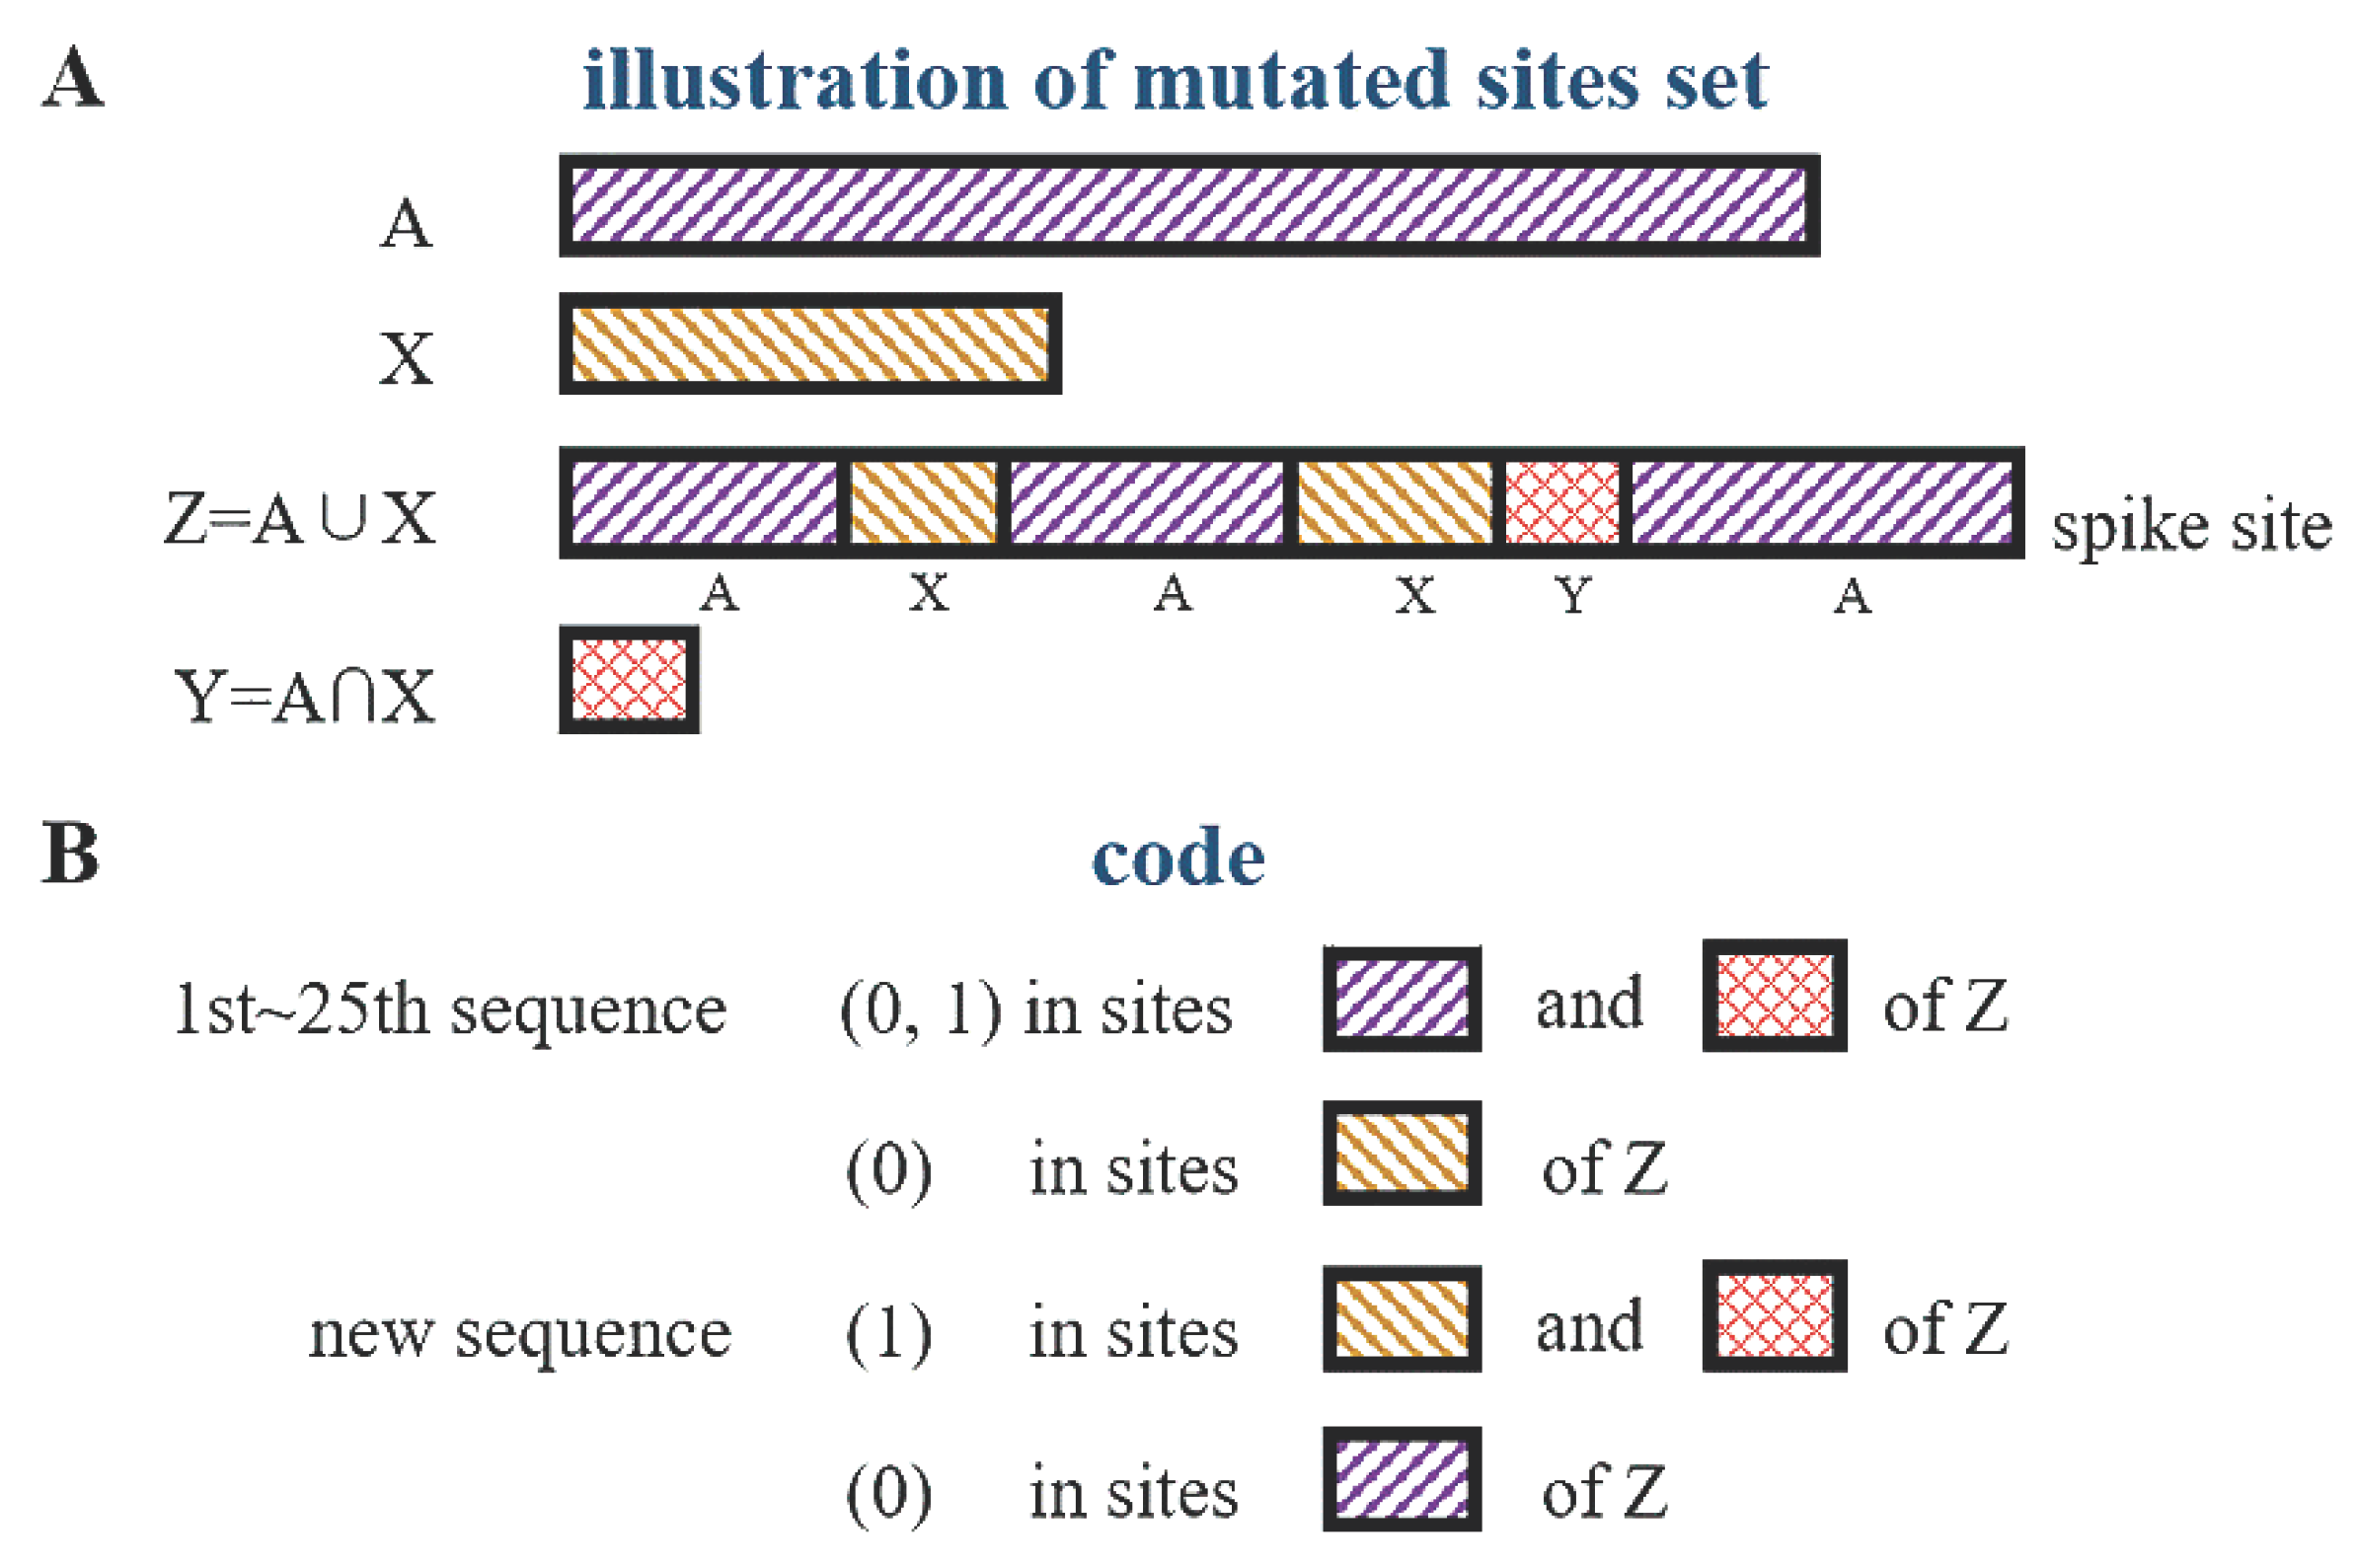
Once the evolutionary tree is reconstructed based on known lineages of virus mutants, the generation of new strains on the tree can be examined. In this section, we propose a stochastic approach to address this problem. Let A be the set of all mutated sites in the updated virus strains, with the symbol a representing the number of sites. Each strain is represented by a two-letter sequence from the set A(a). Considering stochastic mutation on the spike protein, we define the set X (including x sites) as the set of sites participating in the stochastic sampling. The union of sets A(a) and X(x) is denoted as Z, with Z=A∪X. The intersection of sets A and X is denoted as Y, which contains y sites and is represented as Y(y). Assuming that the new strain is generated by stochastic sampling in set Z, we discuss the new strain represented by a two-letter sequence from the union set Z(len), where len=a+x-y. Since the UPGMA tree provides a good description of the evolutionary peculiarities of virus mutation, we use the UPGMA method (for n=7) to reconstruct the evolutionary tree of the 25+1 mutants, where the additional strain is the predicted new strain. This approach is referred to as the A-X model.
Notice that no matter how the sets A and X are grouped along the sequence and how the set Y is inserted the new strain can always be predicted. The model ensures the correct prediction in case of continuous incorporation of new experimental data.
In the A-X model, the new strain is represented by a two-letter sequence in the union set Z. Figure 3A illustrates the schematic representation of the union set Z=A∪X and its relationship with sets A, X, and Y. Figure 3B presents the coding rules for the 25 mutants and 1 new strain.
Now we aim to demonstrate the feasibility of the A-X model in predicting new strains of SARS-CoV-2.
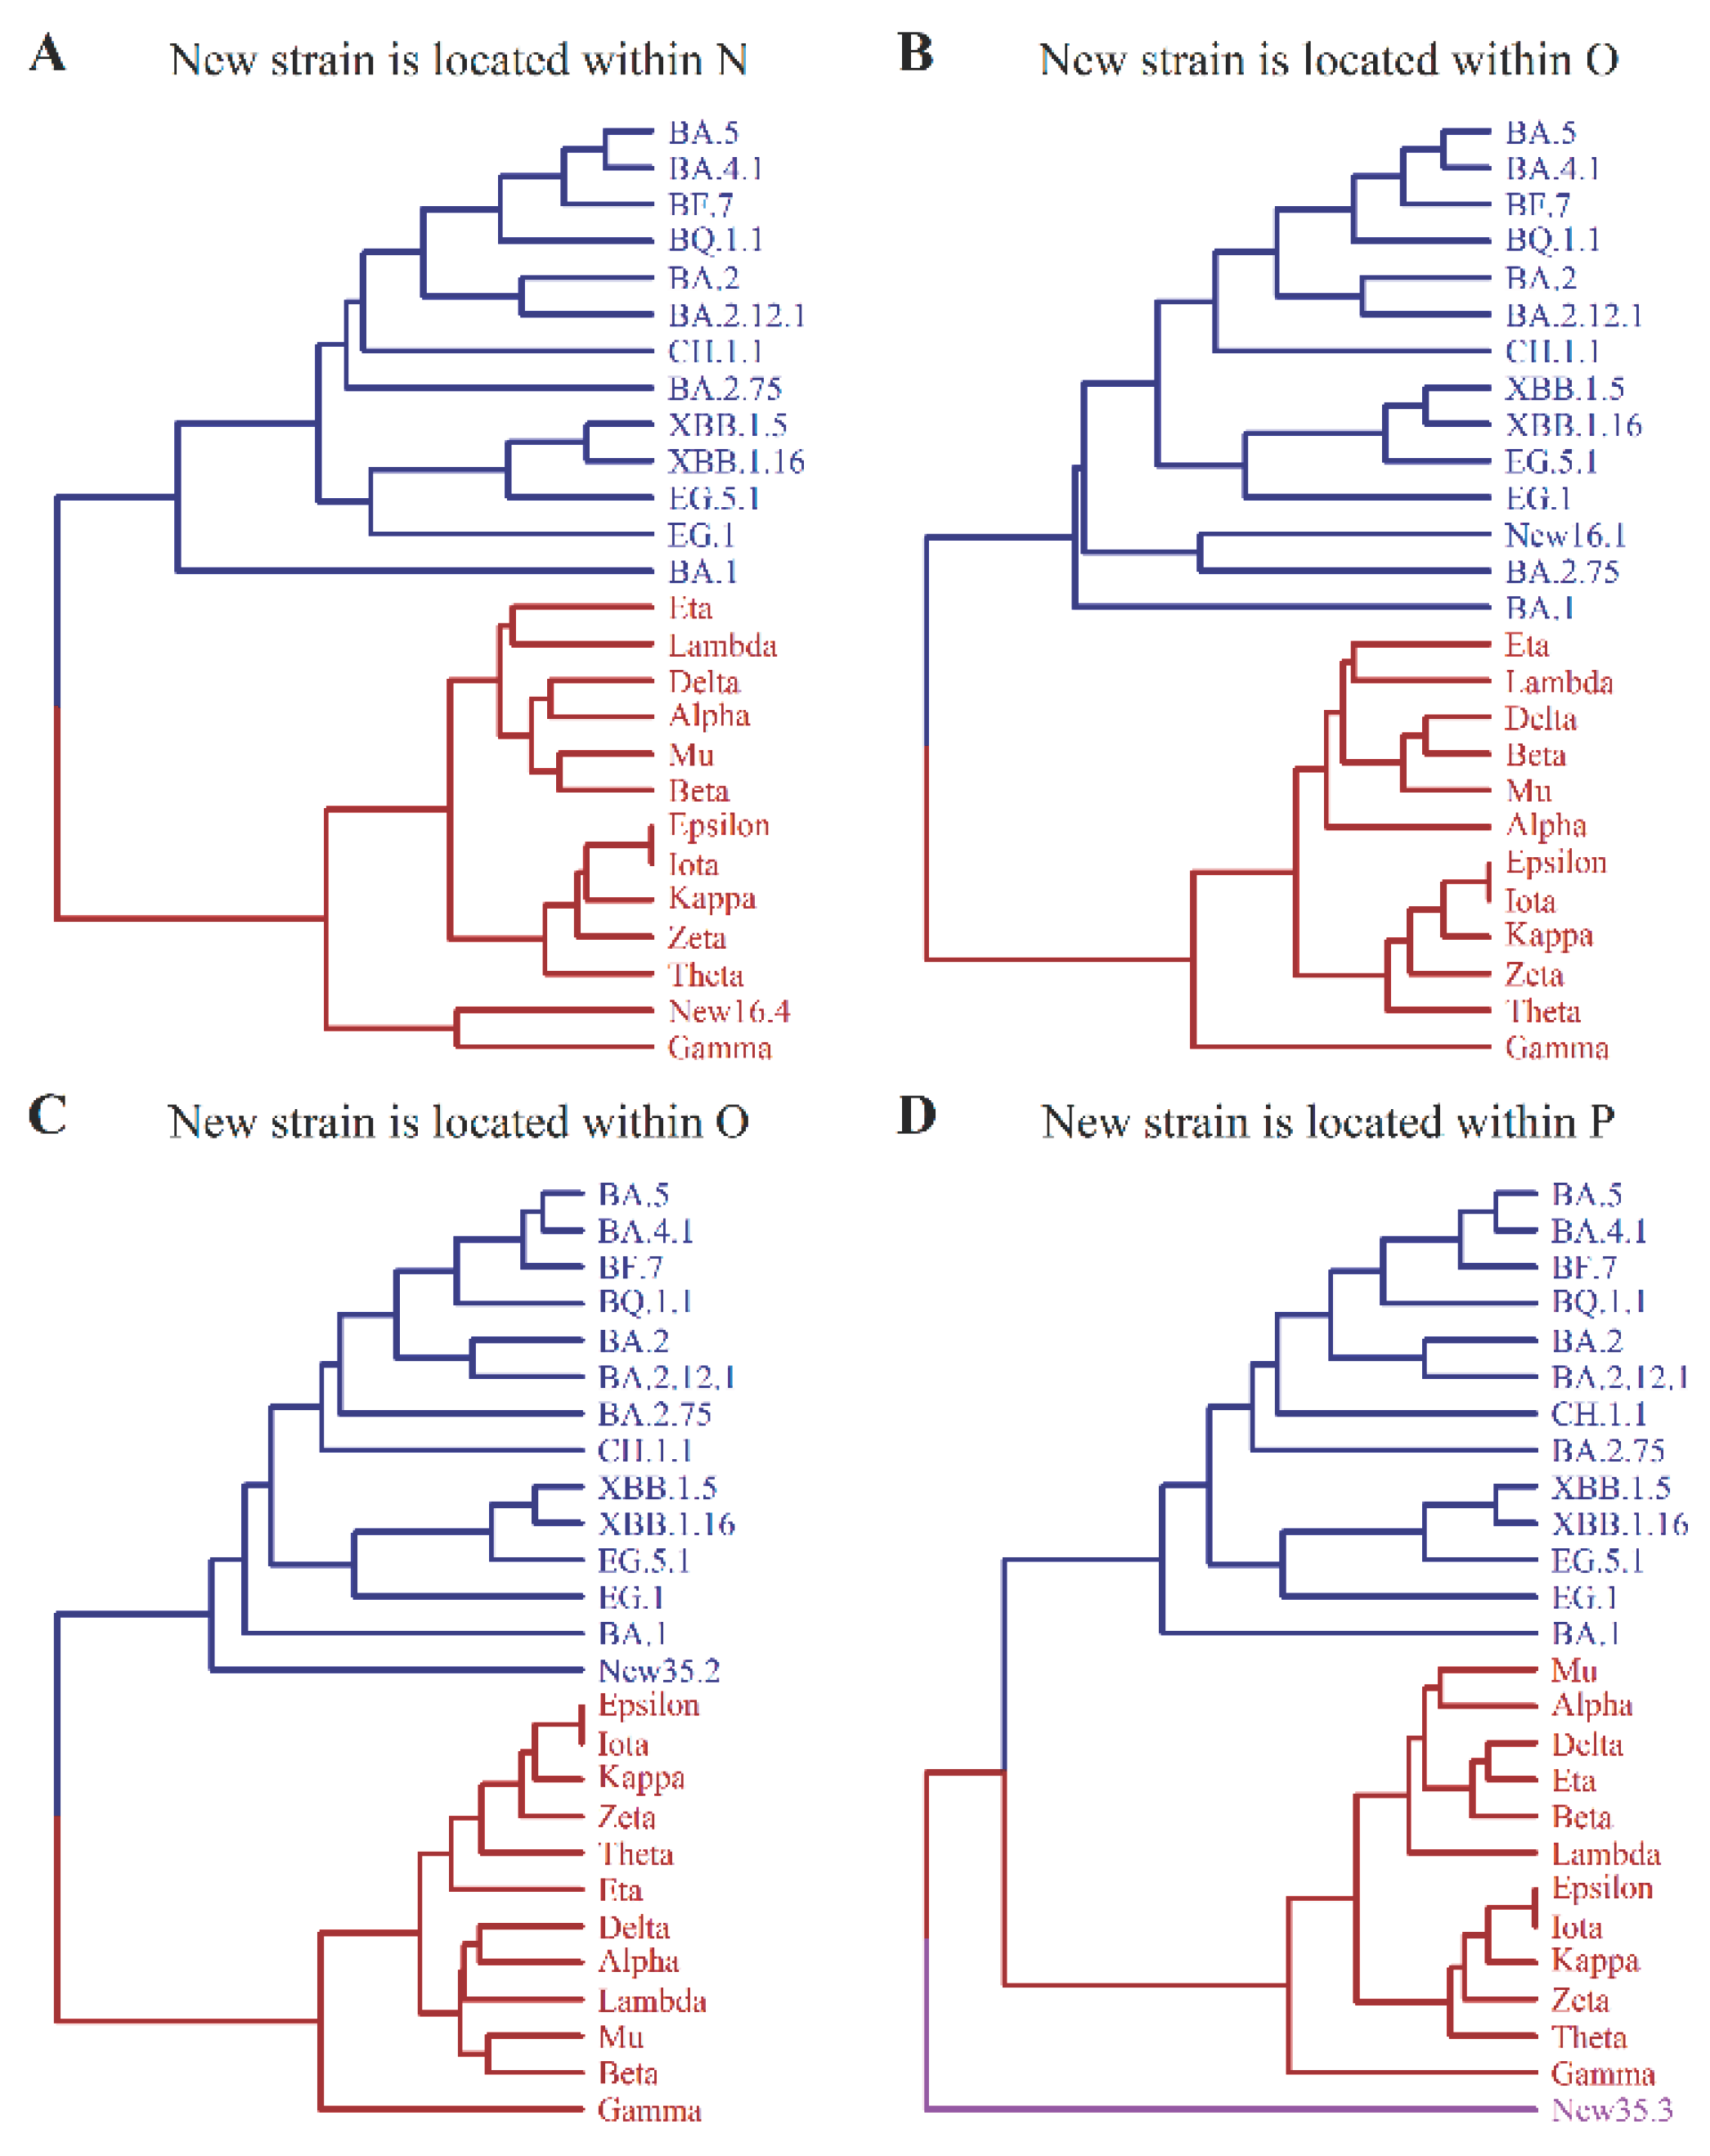
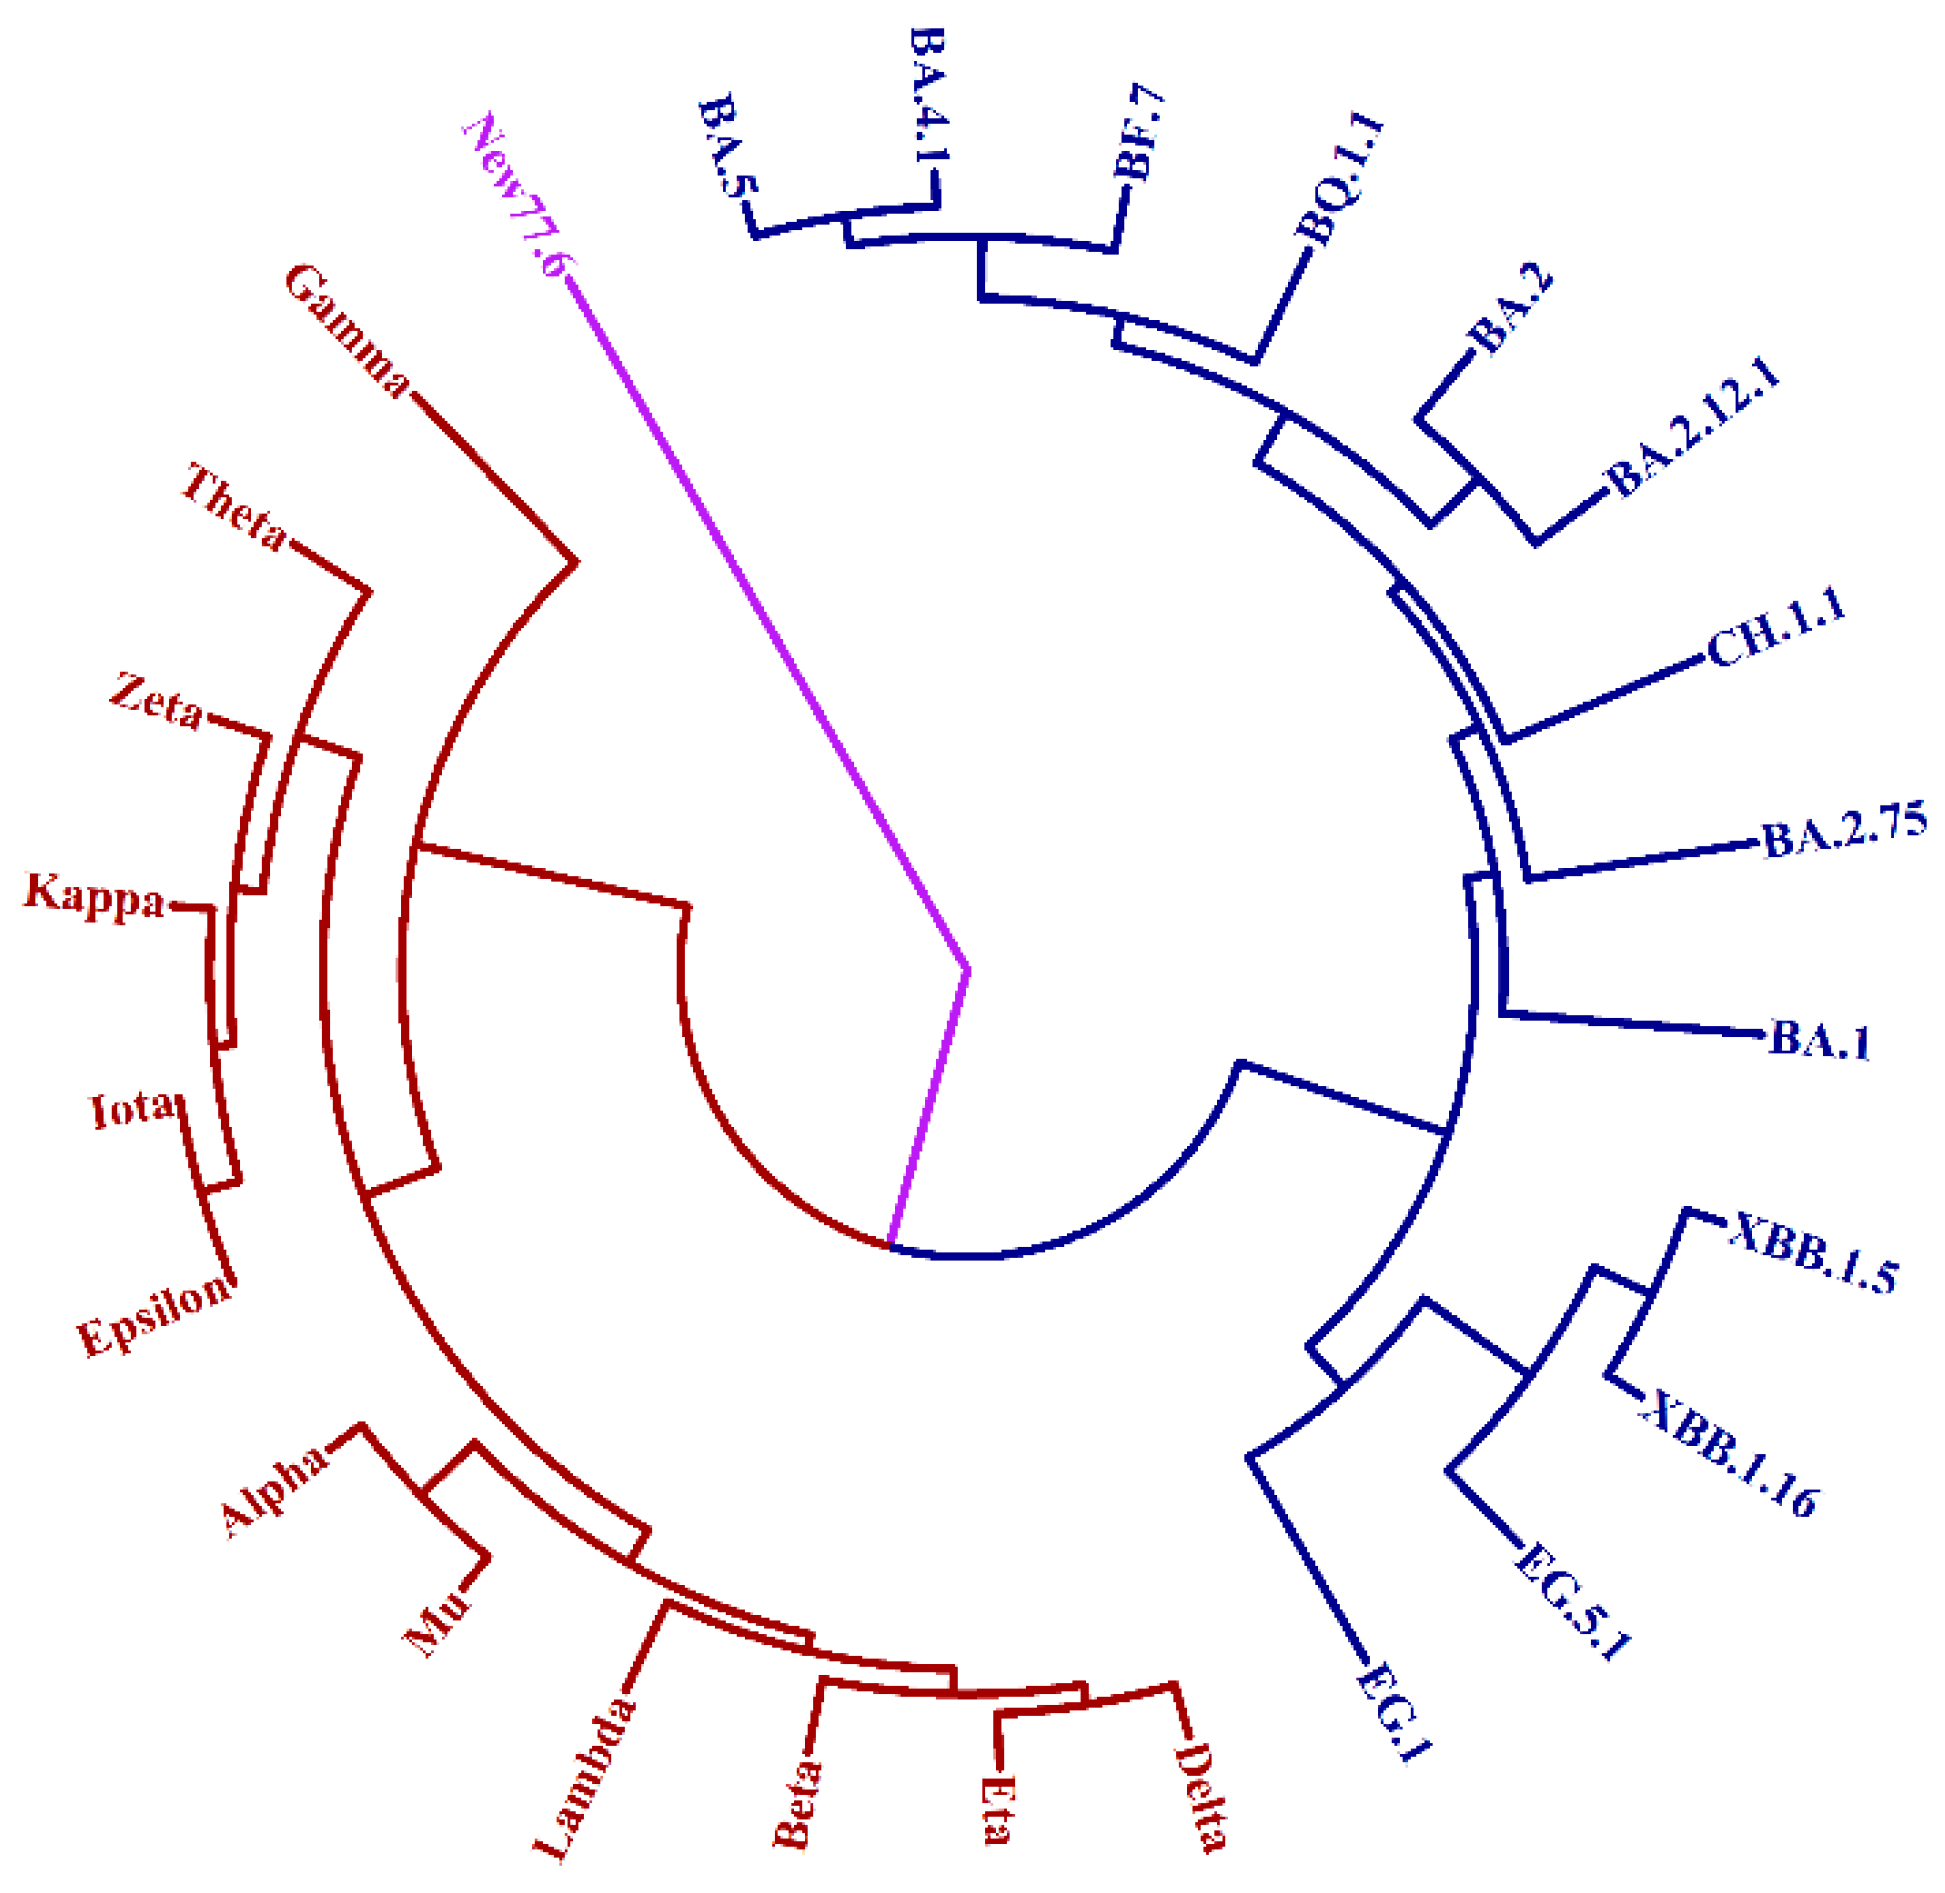
By performing stochastic sampling M=105 times, we obtained 105 predictions of new strains. Interestingly, when x<17, the predicted new strain always falls within one of the two major branches, N and O, as shown in Figure 2. This indicates that the new strain belongs to either macro-lineage N or O. However, when x>17, an anomaly occurs, suggesting that the new strain may occur outside the branches N and O. In other words, the new strain does not belong to either lineage N or O for large values of M. We designate this new macro-lineage as P. Based on a typical stochastic sampling the generation of the new strain within the tree is illustrated in Figure 4. For a given pair x and y the predicted new strain is represented as Newx.y. In Figure 4A, x=16 and y=4, the new strain is located within macro-lineage N; in Figure 4B, x=16 and y=1, the new strain is located within macro-lineage O; in Figure 4C, x=35 and y=2, the new strain is located within macro-lineage O; and in Figure 4D, x=35 and y=3, the new strain is located within macro-lineage P.
Therefore, the new strain can be predicted successfully through only two parameters x and y. This is the advantage of the A-X model.

3.4. The Stochastic Property of the Intersection Set

Since M=100,000 corresponds to 16.6 bits of information, which is only 1.3% of the 1273 bits for the entire spike protein, we employ a supplementary method to expand the range of stochastic sampling by randomizing the parameter y. This means that both the intersection set Y(y) and the union set Z(a+x-y) are altered. In Figure 4, we discovered that the change in the parameter y for a given x significantly affects the tree topology. Therefore, randomizing the parameter y is expected to be an efficient approach to enhance the stochastic information. To gain further insights into y-randomization, we performed six randomizations and treated y as a fluctuating quantity in each group of given x, calculating the statistical distribution of y. The resulting distributions are presented in Table 2.
Upon examining Table 2, we observe that the mean value of y remains constant within each group, specifically y=(a/1273)x, where a represents the number of sites in set A(a=104). This constancy arises from the fact that the probability of a stochastic-produced site occurring in set A is a/1273, and the total occurrence is given by (a/1273)x for x sites. Additionally, the skew value remains approximately constant for a given x and decreases as x increases. Consequently, the parameter y tends towards a normal distribution as x becomes larger. It is worth noting that extending the randomization of y from six times to a greater number of times does not alter the aforementioned conclusion. Thus, randomizing y for a given x to expand the range of stochastic sampling is a viable approach. This technique effectively increases stochastic information and demonstrates the reliability of the stochastic method in the A-X model.

3.5. The Prediction of Macro-Lineage of SARS-CoV-2

By employing the A-X model, we can make predictions regarding the emergence of a new macro-lineage P, along with the already known macro-lineages N and O, when the number of sites (x) in X is sufficiently large. In Figure 4, we have illustrated how this new macro-lineage can arise through stochastic sampling under the condition of large x. To further investigate this phenomenon, let us consider the following example: a=104 for set A, x=77 and y=6 for set X. The resulting UPGMA tree is presented in Figure 5. Our analysis reveals that the newly identified strain, New77.6, is not classified under macro-lineages N or O, but instead falls into a distinct macro-lineage, P. Furthermore, by conducting 105 rounds of stochastic sampling for x and 6 rounds of randomization for y, we consistently observe the inevitable generation of the novel macro-lineage P when x is greater than or equal to 77. Additionally, the tree structure exhibits similarities to that depicted in Figure 5 across various samplings and randomizations for such large values of x.
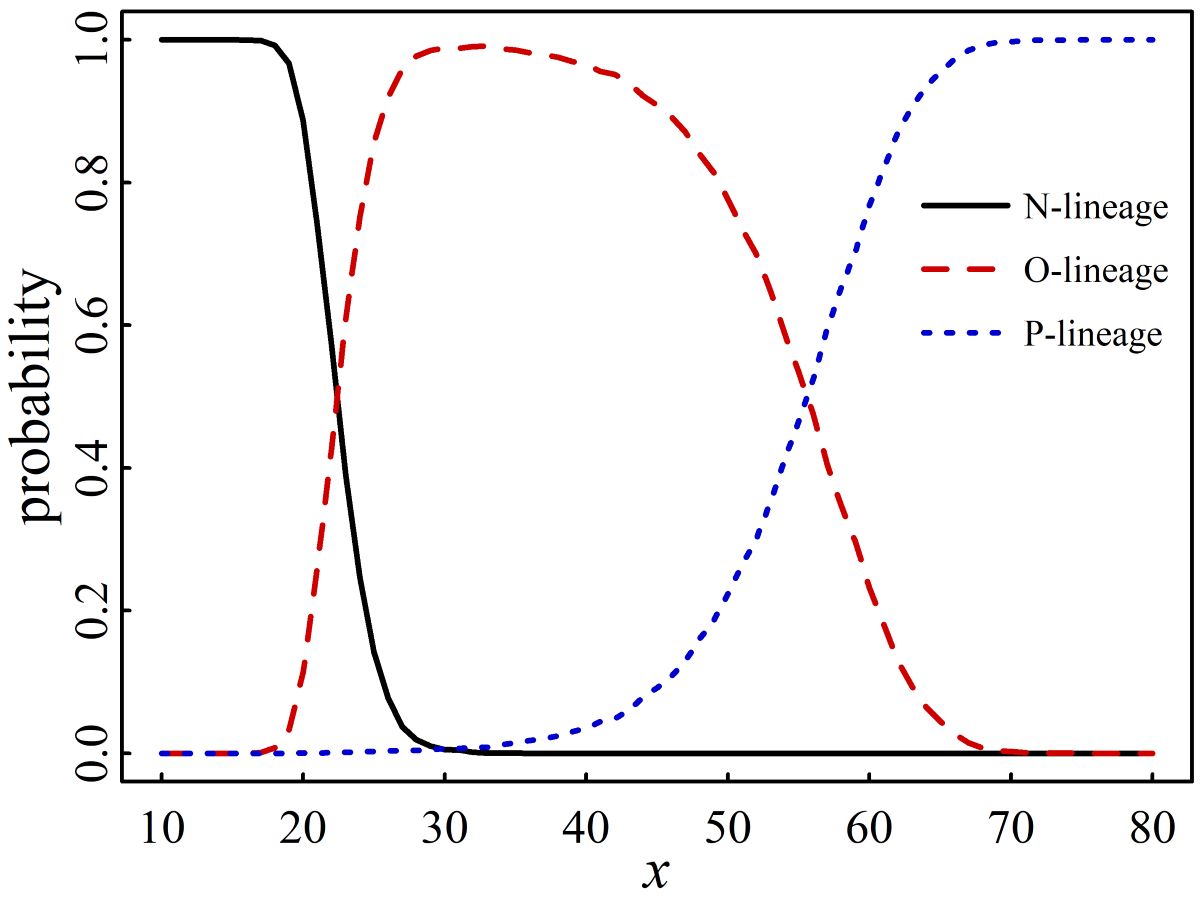
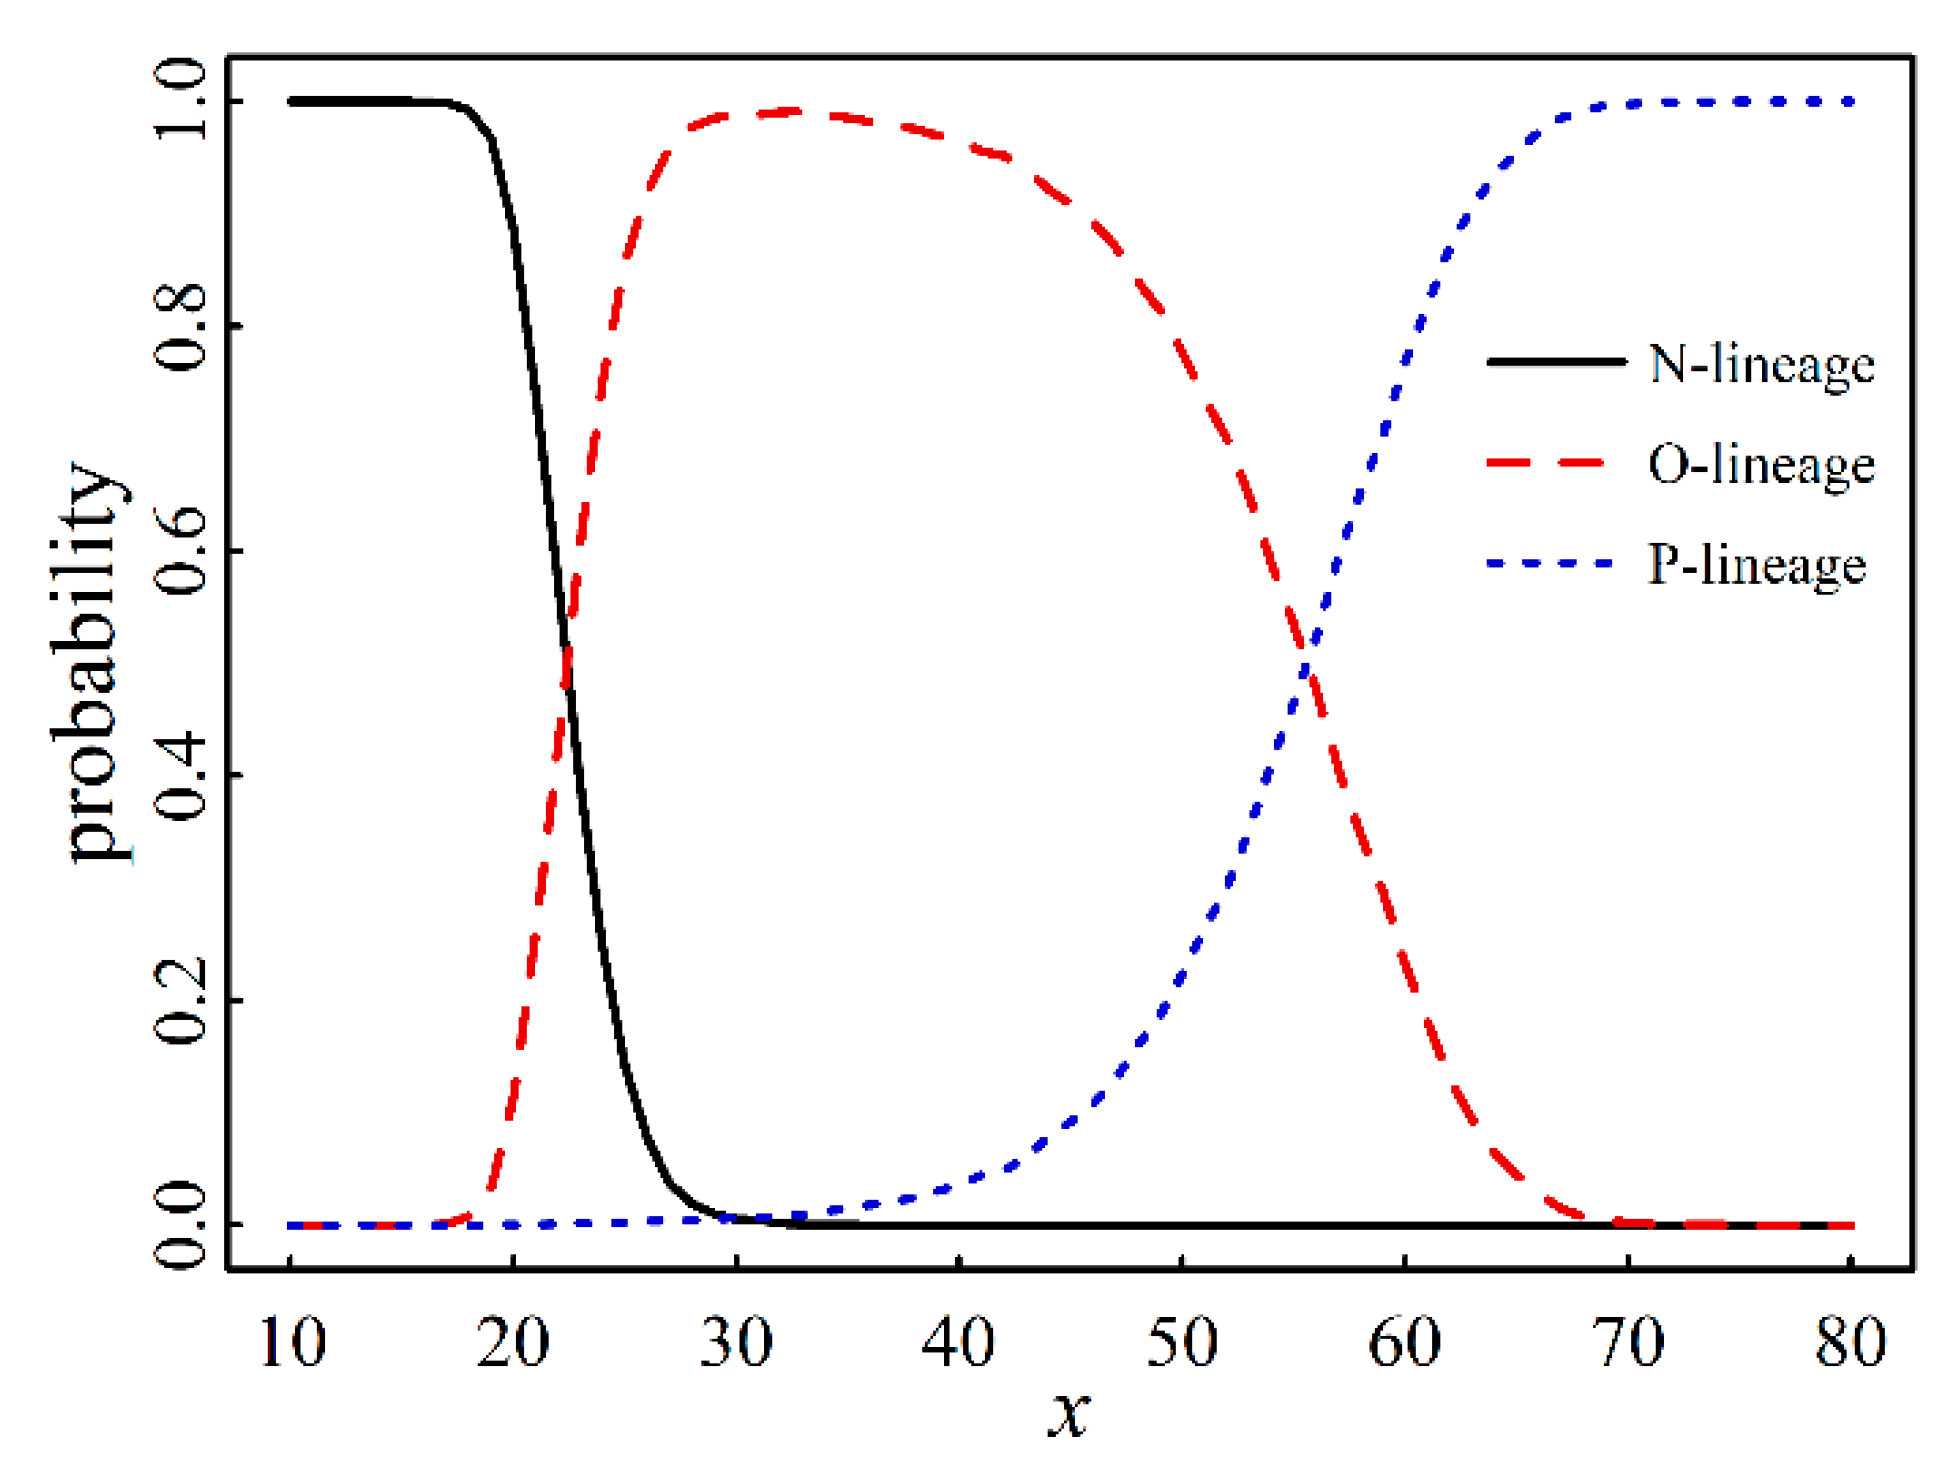
To delve into the formation of the new macro-lineage P, let us examine the generation of 105 new variants for each specific x value. The probability of the N, O, or P-lineage at a given x is determined by dividing its occurrence count by the total number of variants, which is 105. The findings of this calculation are succinctly presented in Figure 6, where the probability of the j-lineage (j=N, O, or P) is plotted against x.
In our A-X model, the selection of set X is stochastic, resulting in the stochastic occurrence of new variants on the tree. Nonetheless, we have demonstrated that the generation of multiple macro-lineages and the subsequent tree topology bifurcation into several major branches are both certain and unavoidable. Furthermore, we have proved that the assignment of a macro-lineage to a new variant is statistically dependent on x, as shown in Fig 6, and there are specific demarcation values of x that differentiate between different macro-lineages. By performing 105 iterations of stochastic production of the x-long sequence and randomizing the parameter y six times, we discovered that the demarcation values of x are as follows:
Newx.y∈N when x≤13; Newx.y∈N or O when 13<x≤ 16; Newx.y∈N or O or P when 16<x≤ 39; Newx.y∈O or P when 39<x≤ 76; and Newx.y∈P when x>76.
The demarcation values of x provide a more detailed classification of the occurrence of the three macro-lineages.
Comment on the prediction of new macro-lineage:The appearance of the new macro-lineage P is dependent upon the number ‘a’ of sites within set A. In the present work, a value of a =104 is assumed based on data from 25 mutants sourced from outbreak.info (https://outbreak.info/, accessed on 15 October 2023). If two prevalent mutants, HV.1 and JN.1, are incorporated into set A, the value of a increases from 104 to 121. As a subset of variants has transitioned from set X to set A, the emergence of P is expected to be more rigorously constrained. Our further calculation shows that the demarcation values of x should be changed from
Newx.yN when x≤13; Newx.yN or O when 13<x≤ 16; Newx.yN or O or P when 16<x≤ 39; Newx.yO or P when 39<x≤ 76; and Newx.yP when x>76.
to:
Newx.yN when x≤16; Newx.yN or O when 16<x≤ 21; Newx.yN or O or P when 21<x≤ 38; Newx.yO or P when 38<x≤ 110; and Newx.yP when x>110.
By comparing two sets of demarcation values, one can discern the developmental trend of virus mutation. Two possibilities arise. The first involves the continuous expansion of set A, which includes only two older macro-lineages, N and O, with the demarcation values of x (i.e., xdem) steadily increasing. The second possibility is that both the halt in increases in the total number ‘a’ of sites within set A and in the demarcation value xdem occurred at a specific point in time. In the latter case, the new macro-lineage P would emerge after x surpasses xdem. In the context of SARS-CoV-2 mutation history, we observed the emergence of the new Omicron lineage in winter 2021, along with a sudden cessation in the increase of total mutational sites within the old N lineage (a≤58) at the beginning of 2021. This observation indicates the occurrence of the second possibility in history. It is essential to monitor the potential emergence of the P lineage in the future.
The detailed discussions have been published in Virus Research 344 (2024) 199358.

4. Discussions

4.1. On Mutational Robustness

A genotype is represented by a four-letter (two-letter) sequence. The evolutionary phenotype refers to the evolution of a sequence that exhibits two or more macro-lineages. A group of mutants is assigned to a specific branch on the tree, such as the alpha-beta-gamma-delta branch (macro-lineage N) or the omicron branch (macro-lineage O). The clear distinction between the two branches of the tree signifies the existence of mutational robustness and the occurrence of the evolutionary phenotype. The occurrence of the evolutionary phenotype depends on the effective organization of different genotypes. What is the principle behind the organization of genotypes? We observed that the number of mutated sites in the sequence is a crucial factor. Mutants in the N branch exhibit 58 mutated sites, whereas those in a part of the O branch have more than 87 sites. The evolution from an earlier branch to a later branch occurs through an increase in the number of mutated sites. Thus, the evolutionary theoretical study provides evidence for the presence of mutational robustness in virus evolution. Furthermore, our calculations indicate that when the number of mutated sites is sufficiently large, there is a nonzero probability of generating a new macro-lineage (macro-branch P on the tree). The concept of mutational robustness, which maps genotypes to a specific phenotype, was proposed in (Mohanty et al., 2023), where the organization of genotypes was also discussed. This study provides an additional example of mutational robustness in virus evolution.

4.2. Electric Charge Dependence of Virus Mutation

Apart from immune evasion, it is generally believed that the primary force driving virus mutation is intrinsic transmissibility, which is mainly determined by the ACE2 binding affinity. However, the ACE2 binding affinity only affects the receptor-binding domain (RBD). Are there any other physical forces that influence the entire spike protein domain? The literature has highlighted the significant role of electrostatic interaction in biological systems (Zhou and Pang, 2018). The population of conformational states can be determined by examining the free energy change during conformational transitions of the spike protein. Electrostatic interaction plays a crucial role in determining this free energy change (Luo and Lv, 2023). As commonly known, the twenty amino acids (AAs) can be classified into three types: D, E, and Y are acidic residues (negatively charged), H, K, and R are basic residues (positively charged), and the remaining amino acids are classified as neutral residues. The viewpoint presented above regarding the relationship between conformational change and electrostatic interaction suggests that variations in amino acid charge may potentially trigger mutations in the spike structure. Therefore, changes in amino acid charge represent structural potential in virus mutations, similar to the ACE2 binding affinity but affecting the entire spike protein. To evaluate the influence of electric charge on virus mutation, we calculated and presented the results in Table 3 (only two mutants for omicron are listed since the cases for other mutants in macro-lineage O are similar).
Analysis of Table 3 reveals that, for the majority of mutants, there is a tendency towards a positive charge in the alteration of amino acid charge during mutation. Previous works (Cotton and Phan, 2023; Pawłowski, 2021) indicate that positively charged amino acid types are generally observed during mutations. However, our calculations indicate that this trend is more pronounced in macro-lineages O. In macro-lineages N, the trend is less apparent, and there are counterexamples. The fundamental principle of virus mutation is the presence of electric charge dependence, which exhibits distinct characteristics in different lineages and macro-lineages.

4.3. Conclusions Drawn from the Current Study

1. We propose representing the SARS-CoV-2 virus strain with a 4-letter sequence, based on amino acid mutations within the spike protein.
2. The application of an n-distance algorithm in UPGMA effectively yields a variant phylogenetic tree that closely aligns with experimental data on virus evolution.
3. We introduce the A-X model for generating new strains on the phylogenetic tree. By combining set A (comprising existing mutated sites) and set X (including x randomly generated sites), detailed studies on the emergence of new strains can be conducted.
4. Expanding the scope of stochastic sampling can be achieved through two means: increasing the size of x and randomizing the parameter y within the intersection set Y=A∩X.
5. When x reaches a sufficient scale, a new macro-lineage of SARS-CoV-2 is predicted, alongside existing lineages. We have derived demarcation values of x that differentiate between various macro-lineages.
6. Therefore, we have proposed a logically simple theory of virus mutation to enhance our understanding of the evolution of SARS-CoV-2.

Author Contributions

Liaofu Luo: Conceptualization, Methodology, Investigation, Writing – original draft, Writing – review & editing. Jun Lv: Methodology, Validation, Data curation, Investigation, Visualization, Writing – original draft, Writing – review & editing.

Funding

This research did not receive any specific grant from funding agencies in the public, commercial, or not-for-profit sectors.

Acknowledgments

We express our gratitude to Dr Ying Zhang for her assistance with data collection, valuable discussions, and insightful suggestions. We also acknowledge the data on 25 SARS-CoV-2 variants obtained from outbreak.info.

Conflicts of Interest

The authors declare no conflict of interest

References

  1. Božič, A.; Podgornik, R. Evolutionary changes in the number of dissociable amino acids on spike proteins and nucleoproteins of SARS-CoV-2 variants. Virus. Evol. 2023, 9, vead040. [Google Scholar] [CrossRef]
  2. Callaway, E. Beyond Omicron: what’s next for COVID’s viral evolution. Nature 2021, 600, 204–207. [Google Scholar] [CrossRef]
  3. Cao, Y.; Jian, F.; Wang, J.; Yu, Y.; Song, W.; Yisimayi, A.; Wang, J.; An, R.; Chen, X.; Zhang, N.; Wang, Y.; Wang, P.; Zhao, L.; Sun, H.; Yu, L.; Yang, S.; Niu, X.; Xiao, T.; Gu, Q.; Shao, F.; Hao, X.; Xu, Y.; Jin, R.; Shen, Z.; Wang, Y.; Xie, X. S. Imprinted SARS-CoV-2 humoral immunity induces convergent Omicron RBD evolution. Nature 2023, 614, 521–529. [Google Scholar] [CrossRef]
  4. Carabelli, A. M.; Peacock, T. P.; Thorne, L. G.; Harvey, W. T.; Hughes, J.; COVID-19 Genomics UK Consortium, Peacock, S. J.; Barclay, W. S.; de Silva, T. I.; Towers, G. J.; Robertson, D. L. SARS-CoV-2 variant biology: immune escape, transmission and fitness. Nat. Rev. Microbiol. 2023, 21, 162–177. [Google Scholar] [CrossRef]
  5. Cotten, M.; Phan, M. V. T. Evolution of increased positive charge on the SARS-CoV-2 spike protein may be adaptation to human transmission. iScience 2023, 26, 106230. [Google Scholar] [CrossRef]
  6. Gangavarapu, K.; Latif, A. A.; Mullen, J. L.; Alkuzweny, M.; Hufbauer, E.; Tsueng, G.; Haag, E.; Zeller, M.; Aceves, C. M.; Zaiets, K.; Cano, M.; Zhou, X.; Qian, Z.; Sattler, R.; Matteson, N. L.; Levy, J. I.; Lee, R. T. C.; Freitas, L.; Maurer-Stroh, S.; GISAID Core and Curation Team, Suchard, M. A.; Wu, C.; Su, A. I.; Andersen, K. G.; Hughes, L. D. Outbreak.info genomic reports: scalable and dynamic surveillance of SARS-CoV-2 variants and mutations. Nat. methods 2023, 20, 512–522. [Google Scholar] [CrossRef]
  7. Li, W. H. Molecular evolution; Sinauer Associates Inc.: Sunderland, MA, 1997. [Google Scholar]
  8. Luo, L.; Lv, J. Mathematical modelling of virus spreading in COVID-19. Viruses 2023, 15, 1788. [Google Scholar] [CrossRef]
  9. Ma, W.; Fu, H.; Jian, F.; Cao, Y.; Li, M. Immune evasion and ACE2 binding affinity contribute to SARS-CoV-2 evolution. Nat. Ecol. Evol. 2023, 7, 1457–1466. [Google Scholar] [CrossRef] [PubMed]
  10. Mallapaty, S. Where did Omicron come from? Three key theories. Nature 2022, 602, 26–28. [Google Scholar] [CrossRef]
  11. Markov, P. V.; Ghafari, M.; Beer, M.; Lythgoe, K.; Simmonds, P.; Stilianakis, N. I.; Katzourakis, A. The evolution of SARS-CoV-2. Nat. Rev. Microbiol. 2023, 21, 361–379. [Google Scholar] [CrossRef]
  12. Mohanty, V.; Greenbury, S. F.; Sarkany, T.; Narayanan, S.; Dingle, K.; Ahnert, S. E.; Louis, A. A. Maximum mutational robustness in genotype-phenotype maps follows a self-similar blancmange-like curve. J. R. Soc. Interface. 2023, 20, 20230169. [Google Scholar] [CrossRef]
  13. Nei, M.; Kumar, S. Molecular evolution and phylogenetics; Oxford University Press: New York, 2000. [Google Scholar]
  14. Paw&#x142;owski, P. H. Additional Positive Electric Residues in the Crucial Spike Glycoprotein S Regions of the New SARS-CoV-2 Variants. Infect. Drug Resist. 2021, 14, 5099–5105. [Google Scholar] [CrossRef]
  15. Starr, T. N.; Greaney, A. J.; Hilton, S. K.; Ellis, D.; Crawford, K. H. D.; Dingens, A. S.; Navarro, M. J.; Bowen, J. E.; Tortorici, M. A.; Walls, A. C.; King, N. P.; Veesler, D.; Bloom, J. D. Deep Mutational Scanning of SARS-CoV-2 Receptor Binding Domain Reveals Constraints on Folding and ACE2 Binding. Cell 2020, 182, 1295–1310.e20. [Google Scholar] [CrossRef] [PubMed]
  16. Wang, Q.; Iketani, S.; Li, Z.; Liu, L.; Guo, Y.; Huang, Y.; Bowen, A. D.; Liu, M.; Wang, M.; Yu, J.; Valdez, R.; Lauring, A. S.; Sheng, Z.; Wang, H. H.; Gordon, A.; Liu, L.; Ho, D. D. Alarming antibody evasion properties of rising SARS-CoV-2 BQ and XBB subvariants. Cell 2023, 186, 279–286.e8. [Google Scholar] [CrossRef] [PubMed]
  17. Zhou, H. X.; Pang, X. Electrostatic Interactions in Protein Structure, Folding, Binding, and Condensation. Chem. Rev. 2018, 118, 1691–1741. [Google Scholar] [CrossRef] [PubMed]
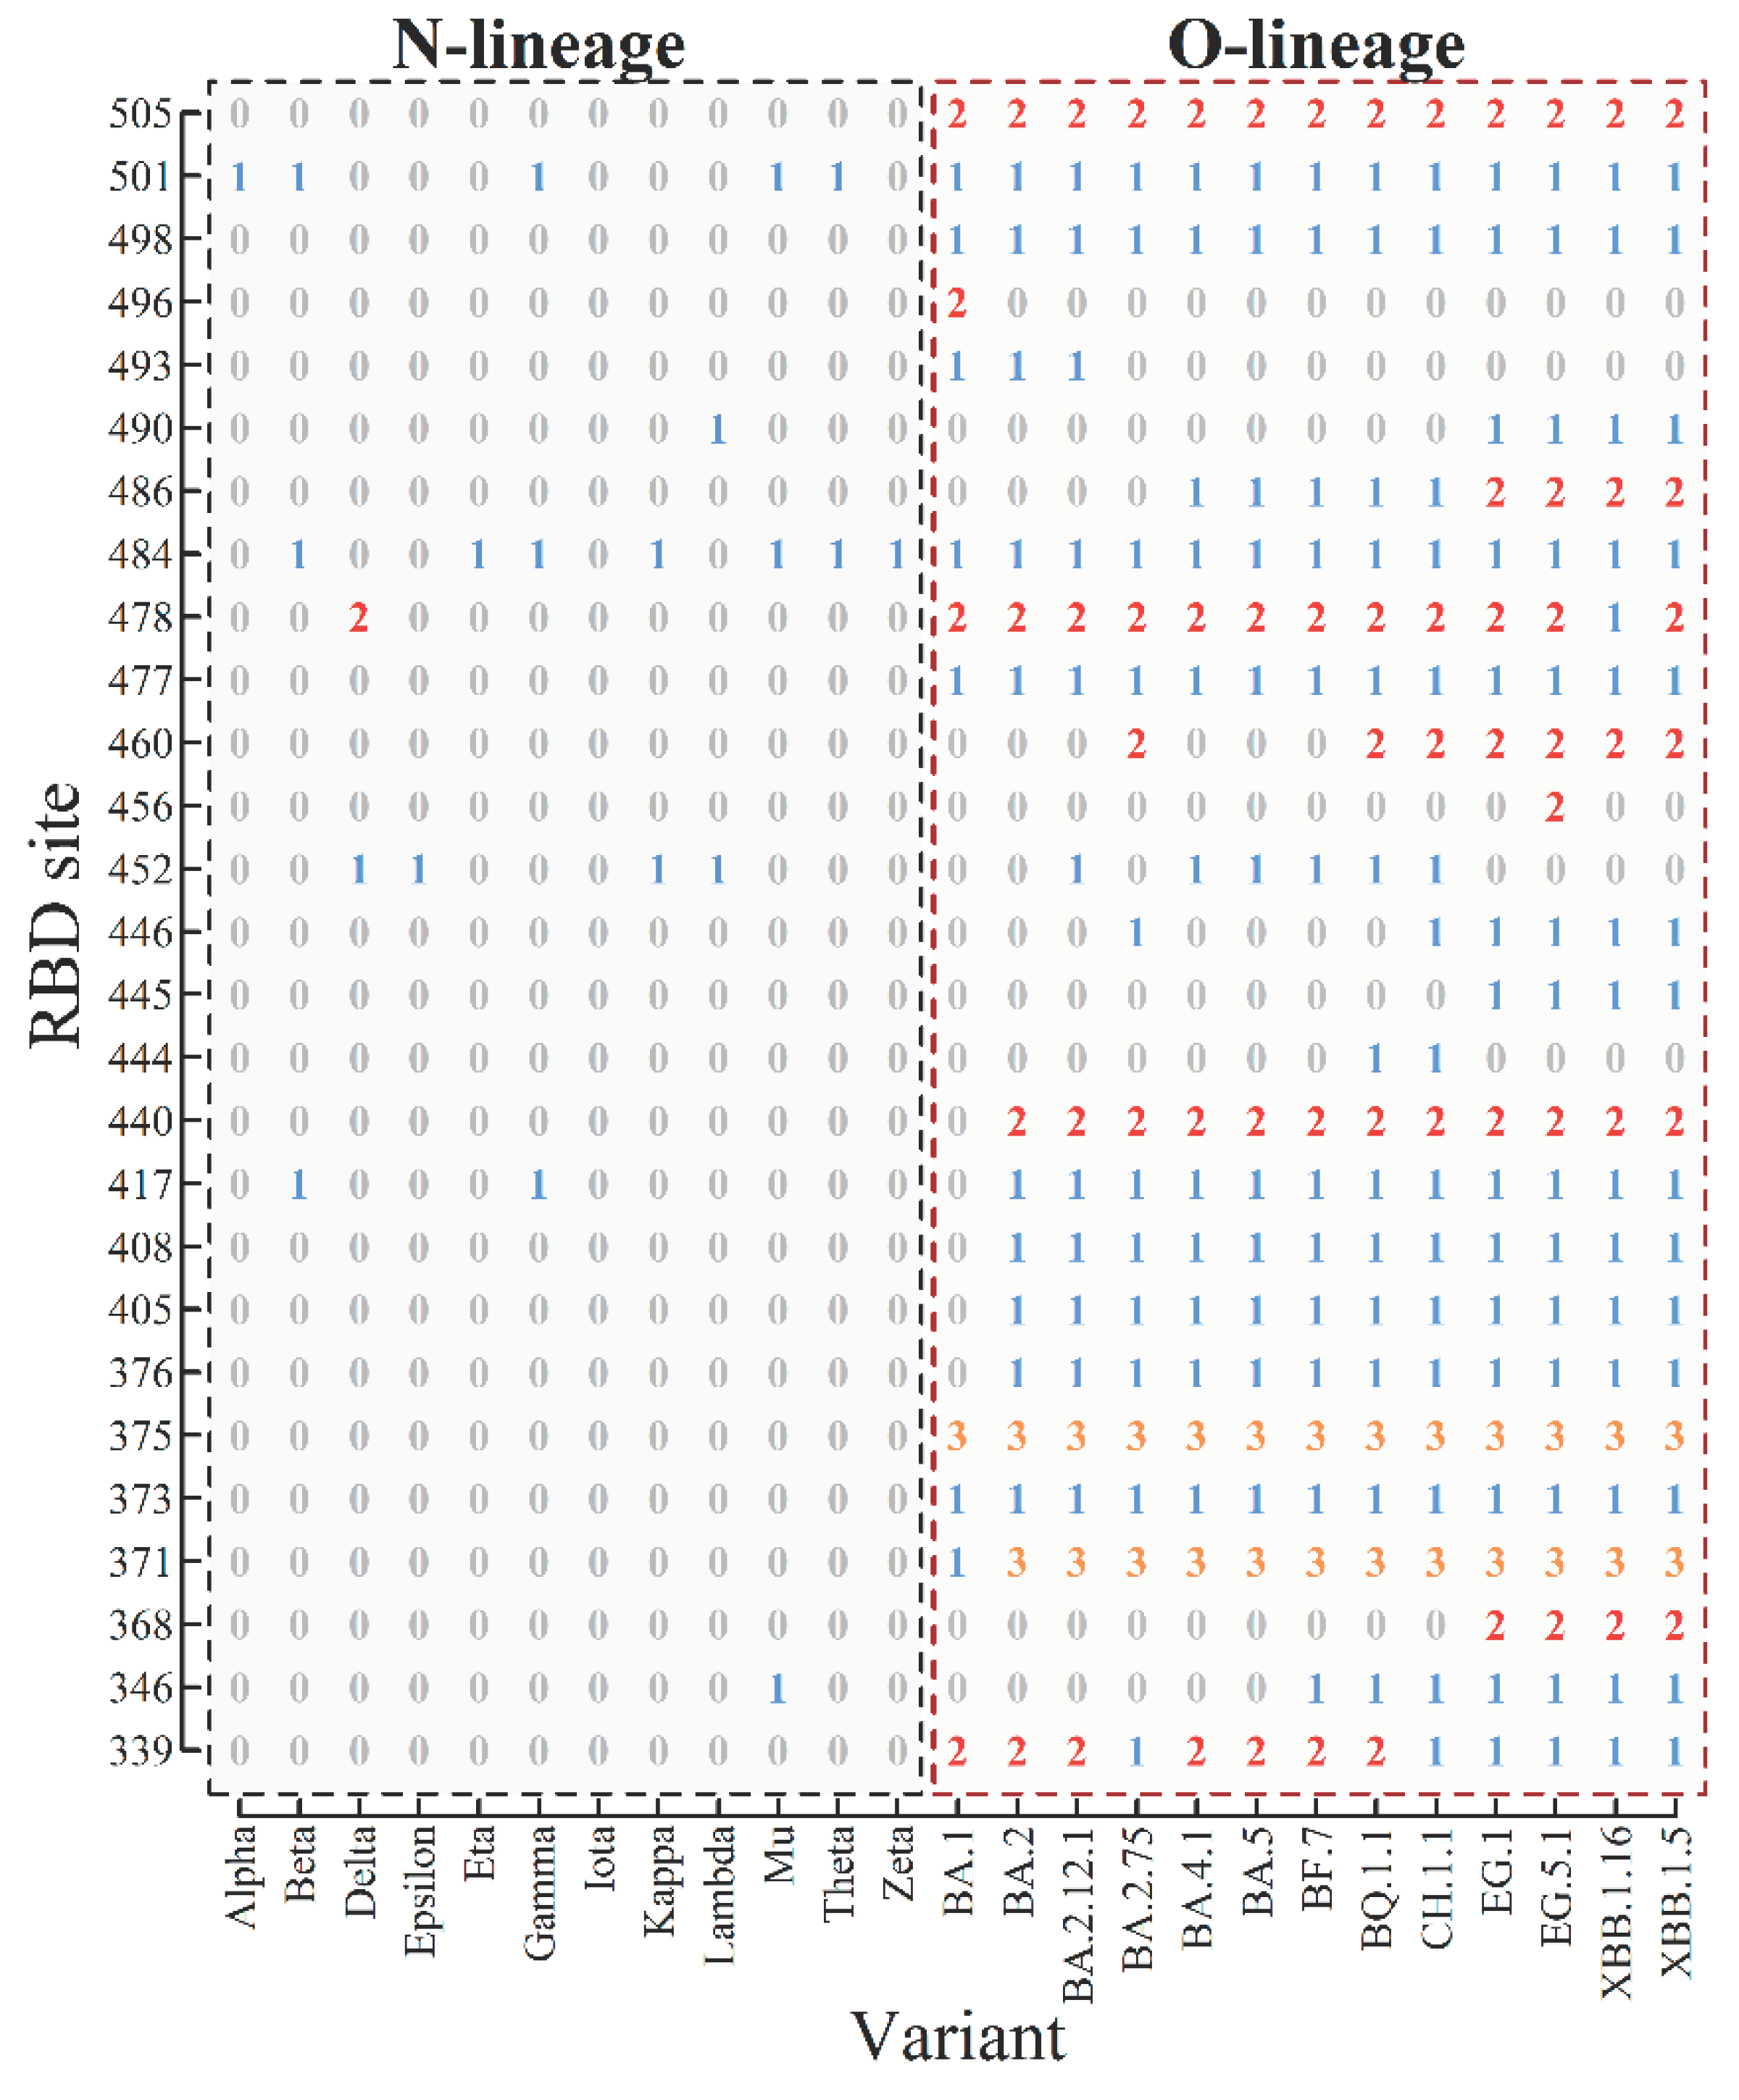
Figure 1. Four-letter representation of mutant strains in the RBD. From the scale of the coordinate one can find 27 mutated sites on RBD from site 331 to 531 (referring to Table 1). The 4-letter representation of each strain is given in the column of the table.
Preprints 102103 g001
Figure 2. Evolutionary tree describing virus mutation.
Preprints 102103 g002
Figure 3. Sketch map of mutated-site sets and coding rules.
Preprints 102103 g003
Figure 4. Generation of new strain on the tree by use of the A-X model. The UPGMA tree for n=7: (A) x=16, y=4; (B) x=16, y=1; (C) x=35, y=2; (D) x=35, y=3.
Preprints 102103 g004
Figure 5. The generation of new macro-lineage P – an example.
Preprints 102103 g005
Figure 6. The generation of three macro-lineages with respect to parameter x.
Preprints 102103 g006
Table 1. Mutated sites on spike protein of 25 selected SARS-CoV-2 mutants.
macro-lineage variant number of mutated sites mutated sites 1)
N-lineage Alpha 10 69, 70, 144, 501, 570, 614, 681, 716, 982, 1118
Beta 10 80, 215, 241, 242, 243, 417, 484, 501, 614, 701
Gamma 12 18, 20, 26, 138, 190, 417, 484, 501, 614, 655, 1027, 1176
Delta 9 19, 156, 157, 158, 452, 478, 614, 681, 950
Epsilon 4 13, 152, 452, 614
Zeta 3 484, 614, 1176
Eta 9 52, 67, 69, 70, 144, 484, 614, 677, 888
Theta 7 484, 501, 614, 681, 1092, 1101, 1176
Iota 4 5, 95, 253, 614
Kappa 5 452, 484, 614, 681, 1071
Lambda 14 75, 76, 246, 247, 248, 249, 250, 251, 252, 253, 452, 490, 614, 859
Mu 9 95, 144, 145, 346, 484, 501, 614, 681, 950
O-lineage BA.1 33 67, 69, 70, 95, 142, 143, 144, 145, 211, 212, 339, 371, 373, 375, 477, 478, 484, 493, 496, 498, 501, 505, 547, 614, 655, 679, 681, 764, 796, 856, 954, 969, 981
BA.2 31 19, 24, 25, 26, 27, 142, 213, 339, 371, 373, 375, 376, 405, 408, 417, 440, 477, 478, 484, 493, 498, 501, 505, 614, 655, 679, 681, 764, 796, 954, 969
BA.2.12.1 33 19, 24, 25, 26, 27, 142, 213, 339, 371, 373, 375, 376, 405, 408, 417, 440, 452, 477, 478, 484, 493, 498, 501, 505, 614, 655, 679, 681, 704, 764, 796, 954, 969
BA.2.75 30 19, 24, 210, 213, 257, 339, 371, 373, 375, 376, 405, 408, 417, 440, 446, 460, 477, 478, 484, 498, 501, 505, 614, 655, 679, 681, 764, 796, 954, 969
BA.4.1 35 3, 19, 24, 25, 26, 27, 69, 70, 142, 213, 339, 371, 373, 375, 376, 405, 408, 417, 440, 452, 477, 478, 484, 486, 498, 501, 505, 614, 655, 679, 681, 764, 796, 954, 969
BA.5 34 19, 24, 25, 26, 27, 69, 70, 142, 213, 339, 371, 373, 375, 376, 405, 408, 417, 440, 452, 477, 478, 484, 486, 498, 501, 505, 614, 655, 679, 681, 764, 796, 954, 969
BF.7 35 19, 24, 25, 26, 27, 69, 70, 142, 213, 339, 346, 371, 373, 375, 376, 405, 408, 417, 440, 452, 477, 478, 484, 486, 498, 501, 505, 614, 655, 679, 681, 764, 796, 954, 969
BQ.1.1 37 19, 24, 25, 26, 27, 69, 70, 142, 213, 339, 346, 371, 373, 375, 376, 405, 408, 417, 440, 444, 452, 460, 477, 478, 484, 486, 498, 501, 505, 614, 655, 679, 681, 764, 796, 954, 969
CH.1.1 41 19, 24, 25, 26, 27, 142, 147, 152, 157, 210, 213, 257, 339, 346, 371, 373, 375, 376, 405, 408, 417, 440, 444, 446, 452, 460, 477, 478, 484, 486, 498, 501, 505, 614, 655, 679, 681, 764, 796, 954, 969
XBB.1.5 42 19, 24, 25, 26, 27, 83, 142, 144, 146, 183, 213, 252, 339, 346, 368, 371, 373, 375, 376, 405, 408, 417, 440, 445, 446, 460, 477, 478, 484, 486, 490, 498, 501, 505, 614, 655, 679, 681, 764, 796, 954, 969
XBB.1.16 43 19, 24, 25, 26, 27, 83, 142, 144, 146, 180, 183, 213, 252, 339, 346, 368, 371, 373, 375, 376, 405, 408, 417, 440, 445, 446, 460, 477, 478, 484, 486, 490, 498, 501, 505, 614, 655, 679, 681, 764, 796, 954, 969
EG.1 37 19, 24, 25, 26, 27, 83, 142, 144, 146, 183, 213, 252, 339, 346, 368, 371, 373, 375, 376, 405, 408, 417, 440, 445, 446, 460, 477, 478, 484, 486, 490, 498, 501, 505, 613, 614, 655
EG.5.1 44 19, 24, 25, 26, 27, 52, 83, 142, 144, 146, 183, 213, 252, 339, 346, 368, 371, 373, 375, 376, 405, 408, 417, 440, 445, 446, 456, 460, 477, 478, 484, 486, 490, 498, 501, 505, 614, 655, 679, 681, 764, 796, 954, 969
total 25 variants 104 mutation sits 3, 5, 13, 18, 19, 20, 24, 25, 26, 27, 52, 67, 69, 70, 75, 76, 80, 83, 95, 138, 142, 143, 144, 145, 146, 147, 152, 156, 157, 158, 180, 183, 190, 210, 211, 212, 213, 215, 241, 242, 243, 246, 247, 248, 249, 250, 251, 252, 253, 257, 339, 346, 368, 371, 373, 375, 376, 405, 408, 417, 440, 444, 445, 446, 452, 456, 460, 477, 478, 484, 486, 490, 493, 496, 498, 501, 505, 547, 570, 613, 614, 655, 677, 679, 681, 701, 704, 716, 764, 796, 856, 859, 888, 950, 954, 969, 981, 982, 1027, 1071, 1092, 1101, 1118, 1176
1) Mutated sites are considered when they occur in at least 75% of the SARS-CoV-2 lineage sequences. Mutations in the receptor-binding domain (RBD) of the spike protein are indicated in bold. The mutated sites of variant EG.1 in Table 1 do not include six sites in the tail of the spike protein (679,681,764,796,954,969) due to discrepancies in the sources of information.
Table 2. Statistical distribution of y in six-times randomization.
x distribution of y 1)
mean sd median max skew kurtosis
13 1.06 0.98 1 7 0.84 0.54
13 1.06 0.98 1 7 0.84 0.55
13 1.06 0.98 1 7 0.83 0.52
13 1.06 0.98 1 7 0.82 0.46
13 1.06 0.98 1 7 0.83 0.51
13 1.07 0.99 1 7 0.84 0.53
16 1.31 1.09 1 7 0.75 0.42
16 1.31 1.09 1 8 0.77 0.49
16 1.30 1.09 1 9 0.75 0.41
16 1.30 1.09 1 8 0.74 0.42
16 1.31 1.10 1 7 0.77 0.45
16 1.31 1.09 1 8 0.75 0.40
39 3.19 1.68 3 13 0.46 0.12
39 3.20 1.69 3 13 0.48 0.17
39 3.19 1.69 3 14 0.47 0.18
39 3.18 1.69 3 13 0.47 0.19
39 3.18 1.68 3 13 0.46 0.15
39 3.18 1.69 3 12 0.47 0.16
76 6.22 2.32 6 18 0.32 0.03
76 6.21 2.32 6 17 0.32 0.07
76 6.21 2.31 6 19 0.33 0.08
76 6.20 2.33 6 17 0.31 0.05
76 6.21 2.32 6 18 0.32 0.06
76 6.21 2.31 6 18 0.31 0.03
1)The statistical distributions of y (including mean, standard deviation, median, maximum value, skew, and kurtosis) for given x are obtained from 100,000 random samples and listed in the columns 2-7 of the table. Skew is defined by the ratio of the third-order moment to (standard deviation)3. Kurtosis is defined by the ratio of the fourth-order moment to (variance)2 minus 3.
Table 3. Electric charge dependence of virus mutation1).
Macro-lineages Mutant Number of AA sites Positively charged Negatively charged Neutrally charged
N-lineage Lambda 14 3 1 10
Gamma 12 3 5 6
Beta 10 5 2 4
Alpha 10 5 3 3
Mu 9 7 1 2
Eta 9 6 1 3
Delta 9 7 1 1
Theta 7 6 3 1
Kappa 5 5 0 0
Iota 4 2 0 2
Epsilon 4 2 0 2
Zeta 3 3 0 1
O-lineage BA.1 33 16 6 13
BA.5 34 14 8 14
1) The basic residue is assigned a charge of +1, the acidic residue a charge of -1, and all others are assigned a charge of 0. The increase in charge is determined by the algebraic difference between the mutated residue and the wild type. The positive (negative) values in the table represent the sum of charge increases for residues with positive (negative) charge. The neutral values in the table correspond to the total number of residues with no change in charge.
Disclaimer/Publisher’s Note: The statements, opinions and data contained in all publications are solely those of the individual author(s) and contributor(s) and not of MDPI and/or the editor(s). MDPI and/or the editor(s) disclaim responsibility for any injury to people or property resulting from any ideas, methods, instructions or products referred to in the content.
Copyright: This open access article is published under a Creative Commons CC BY 4.0 license, which permit the free download, distribution, and reuse, provided that the author and preprint are cited in any reuse.
Prerpints.org logo

Preprints.org is a free preprint server supported by MDPI in Basel, Switzerland.

Subscribe

© 2024 MDPI (Basel, Switzerland) unless otherwise stated