Submitted:
25 December 2023
Posted:
26 December 2023
You are already at the latest version
Abstract
Keywords:
1. Introduction
1.1. Solar activity and the subsequent Space Weather as agents of variations in Earth’s atmopshere
1.2. Coronal Mass Ejection activity
1.3. Solar Energetic Particles and tropospheric variations.
1.4. CME related Geomagnetically Induced Electric fields and Currents on the Ground
1.5. Vertical atmospheric electric field Ez near ground during magnetic storms
2. Instruments and Data
3. Data analysis results
3.1. March 2012 extreme events
3.2. Extreme Meteorological Events in Thrace, northeast Greece, in March 2012.
3.3. Perturbations in the High Voltage electric power grid in Τhrace, Greece, in March 2012.
4. Summary of Observations and Discussion
- (1)
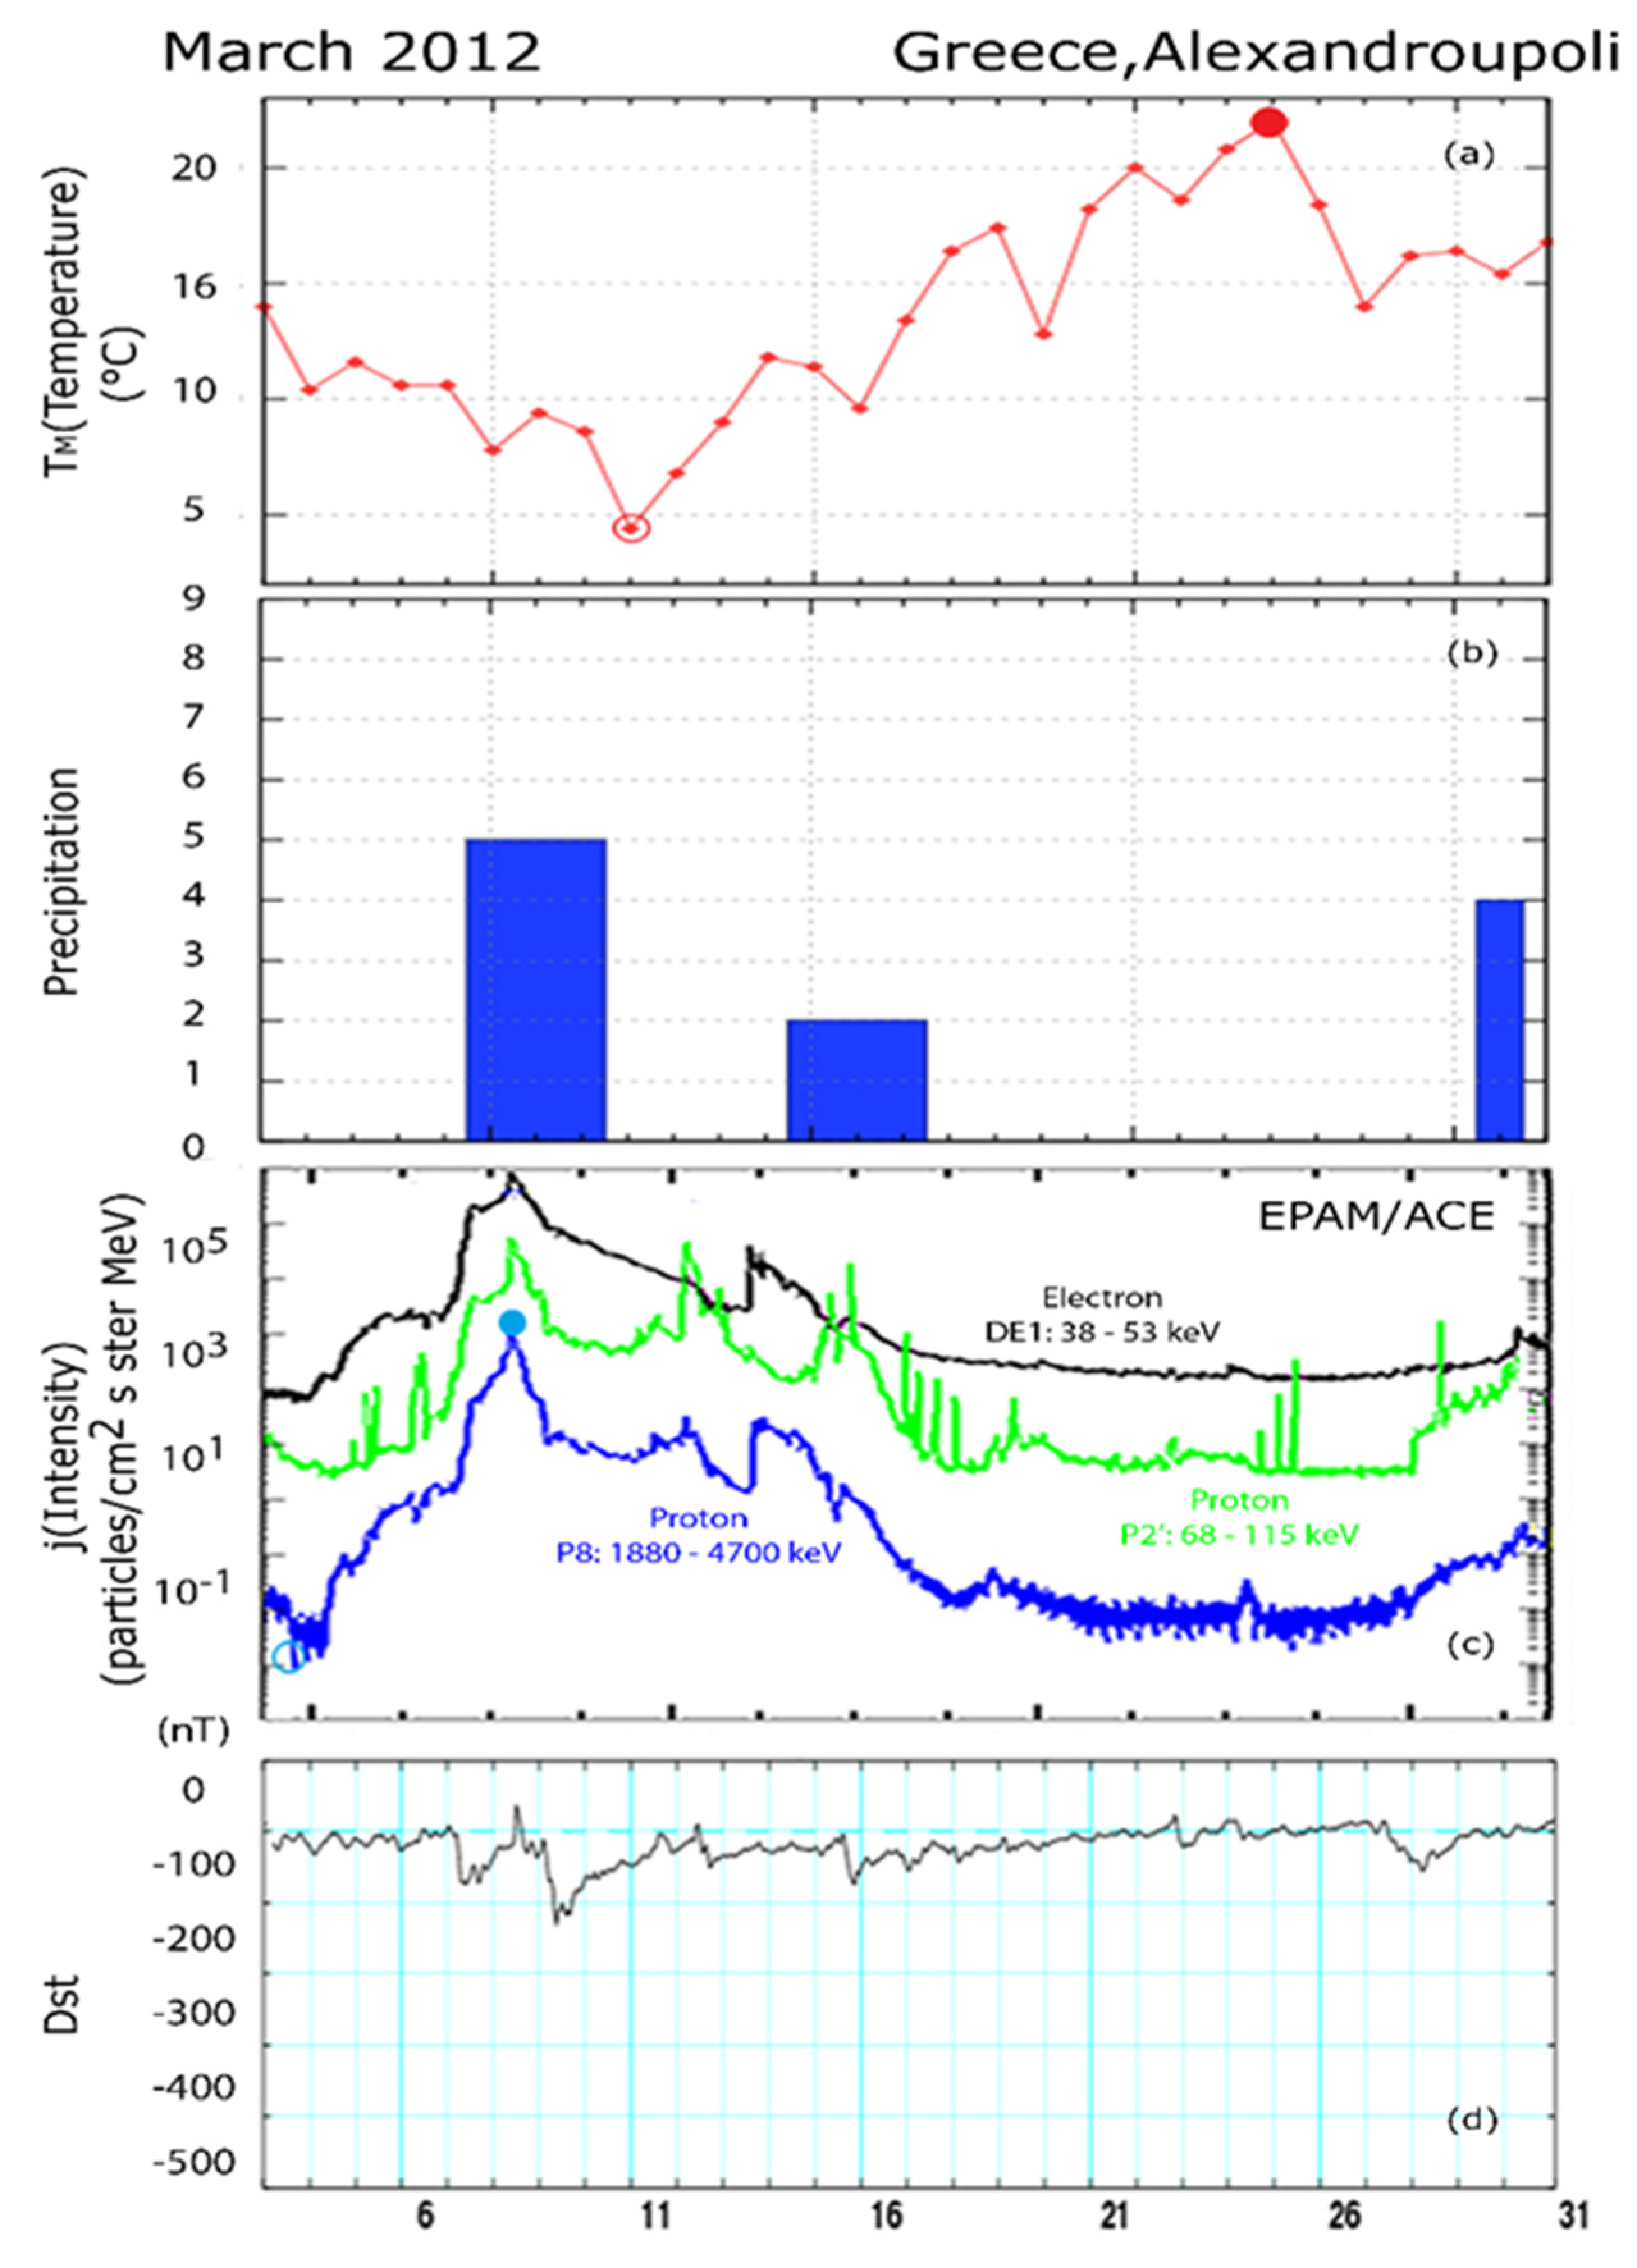
- Unusual bad weather occurred in Thrace, Greece, which started on 6.3. 2012 and lasted until ~15.3. 2012: low temperatures, fast winds and intense precipitation occurred during most of this time period (Figures 3a, 3b, 6–10).
- (2)
- (3)
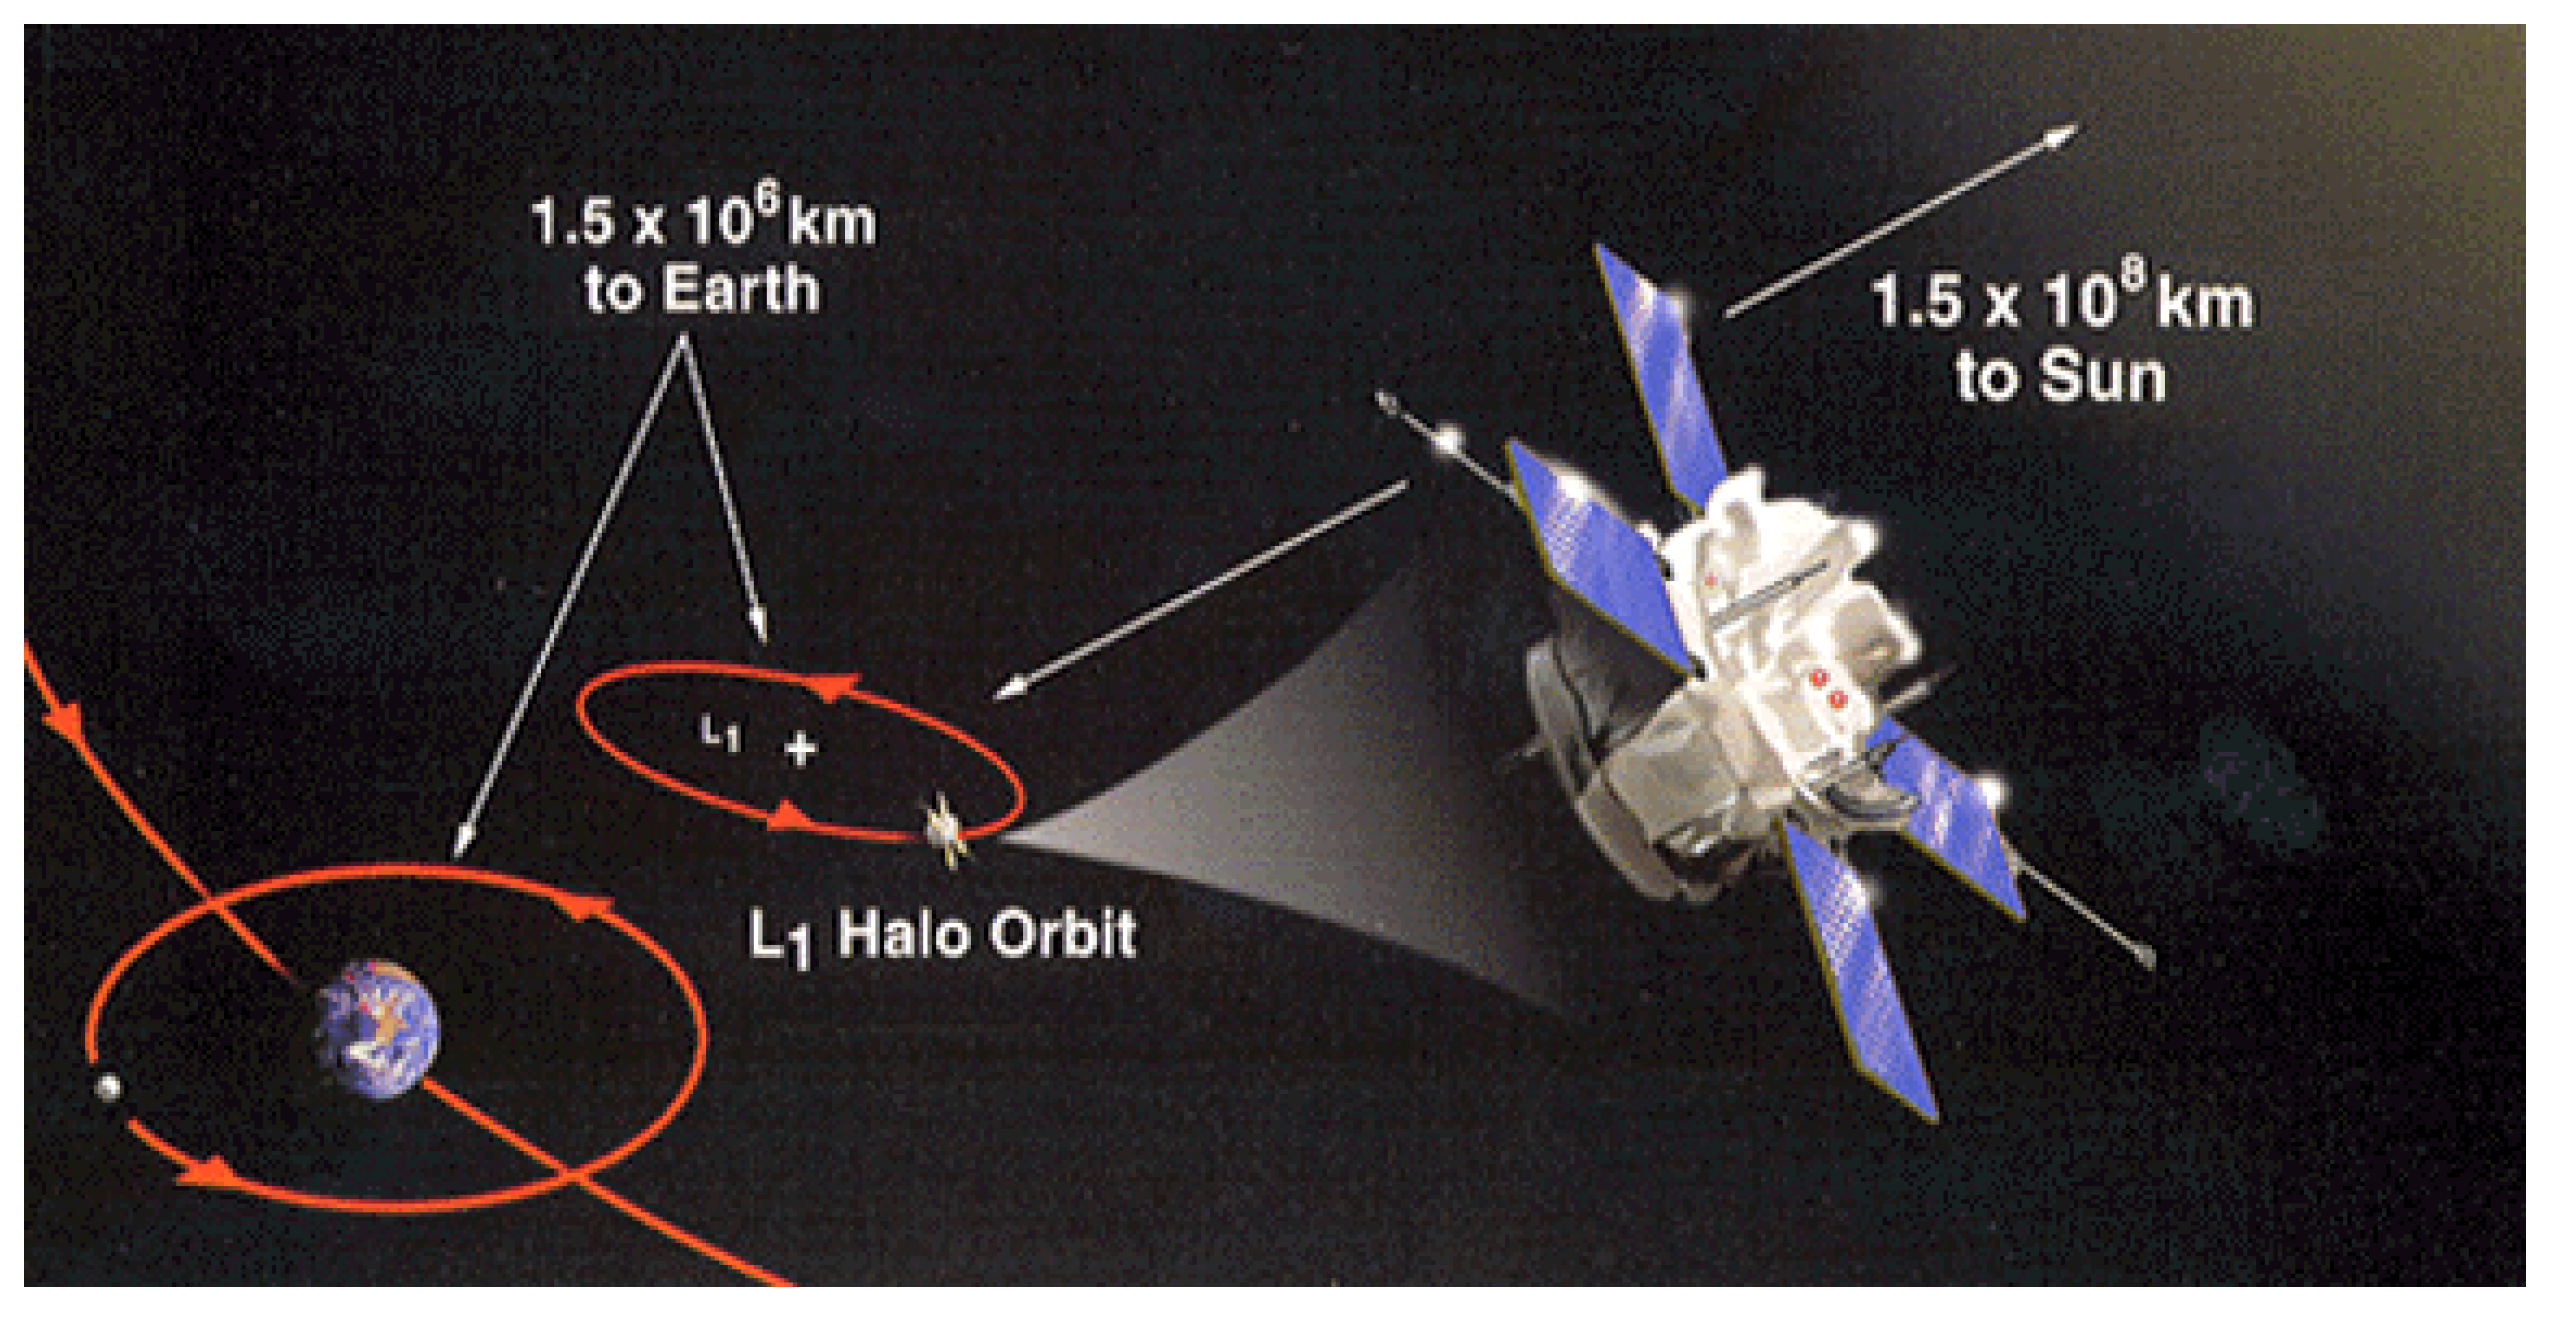
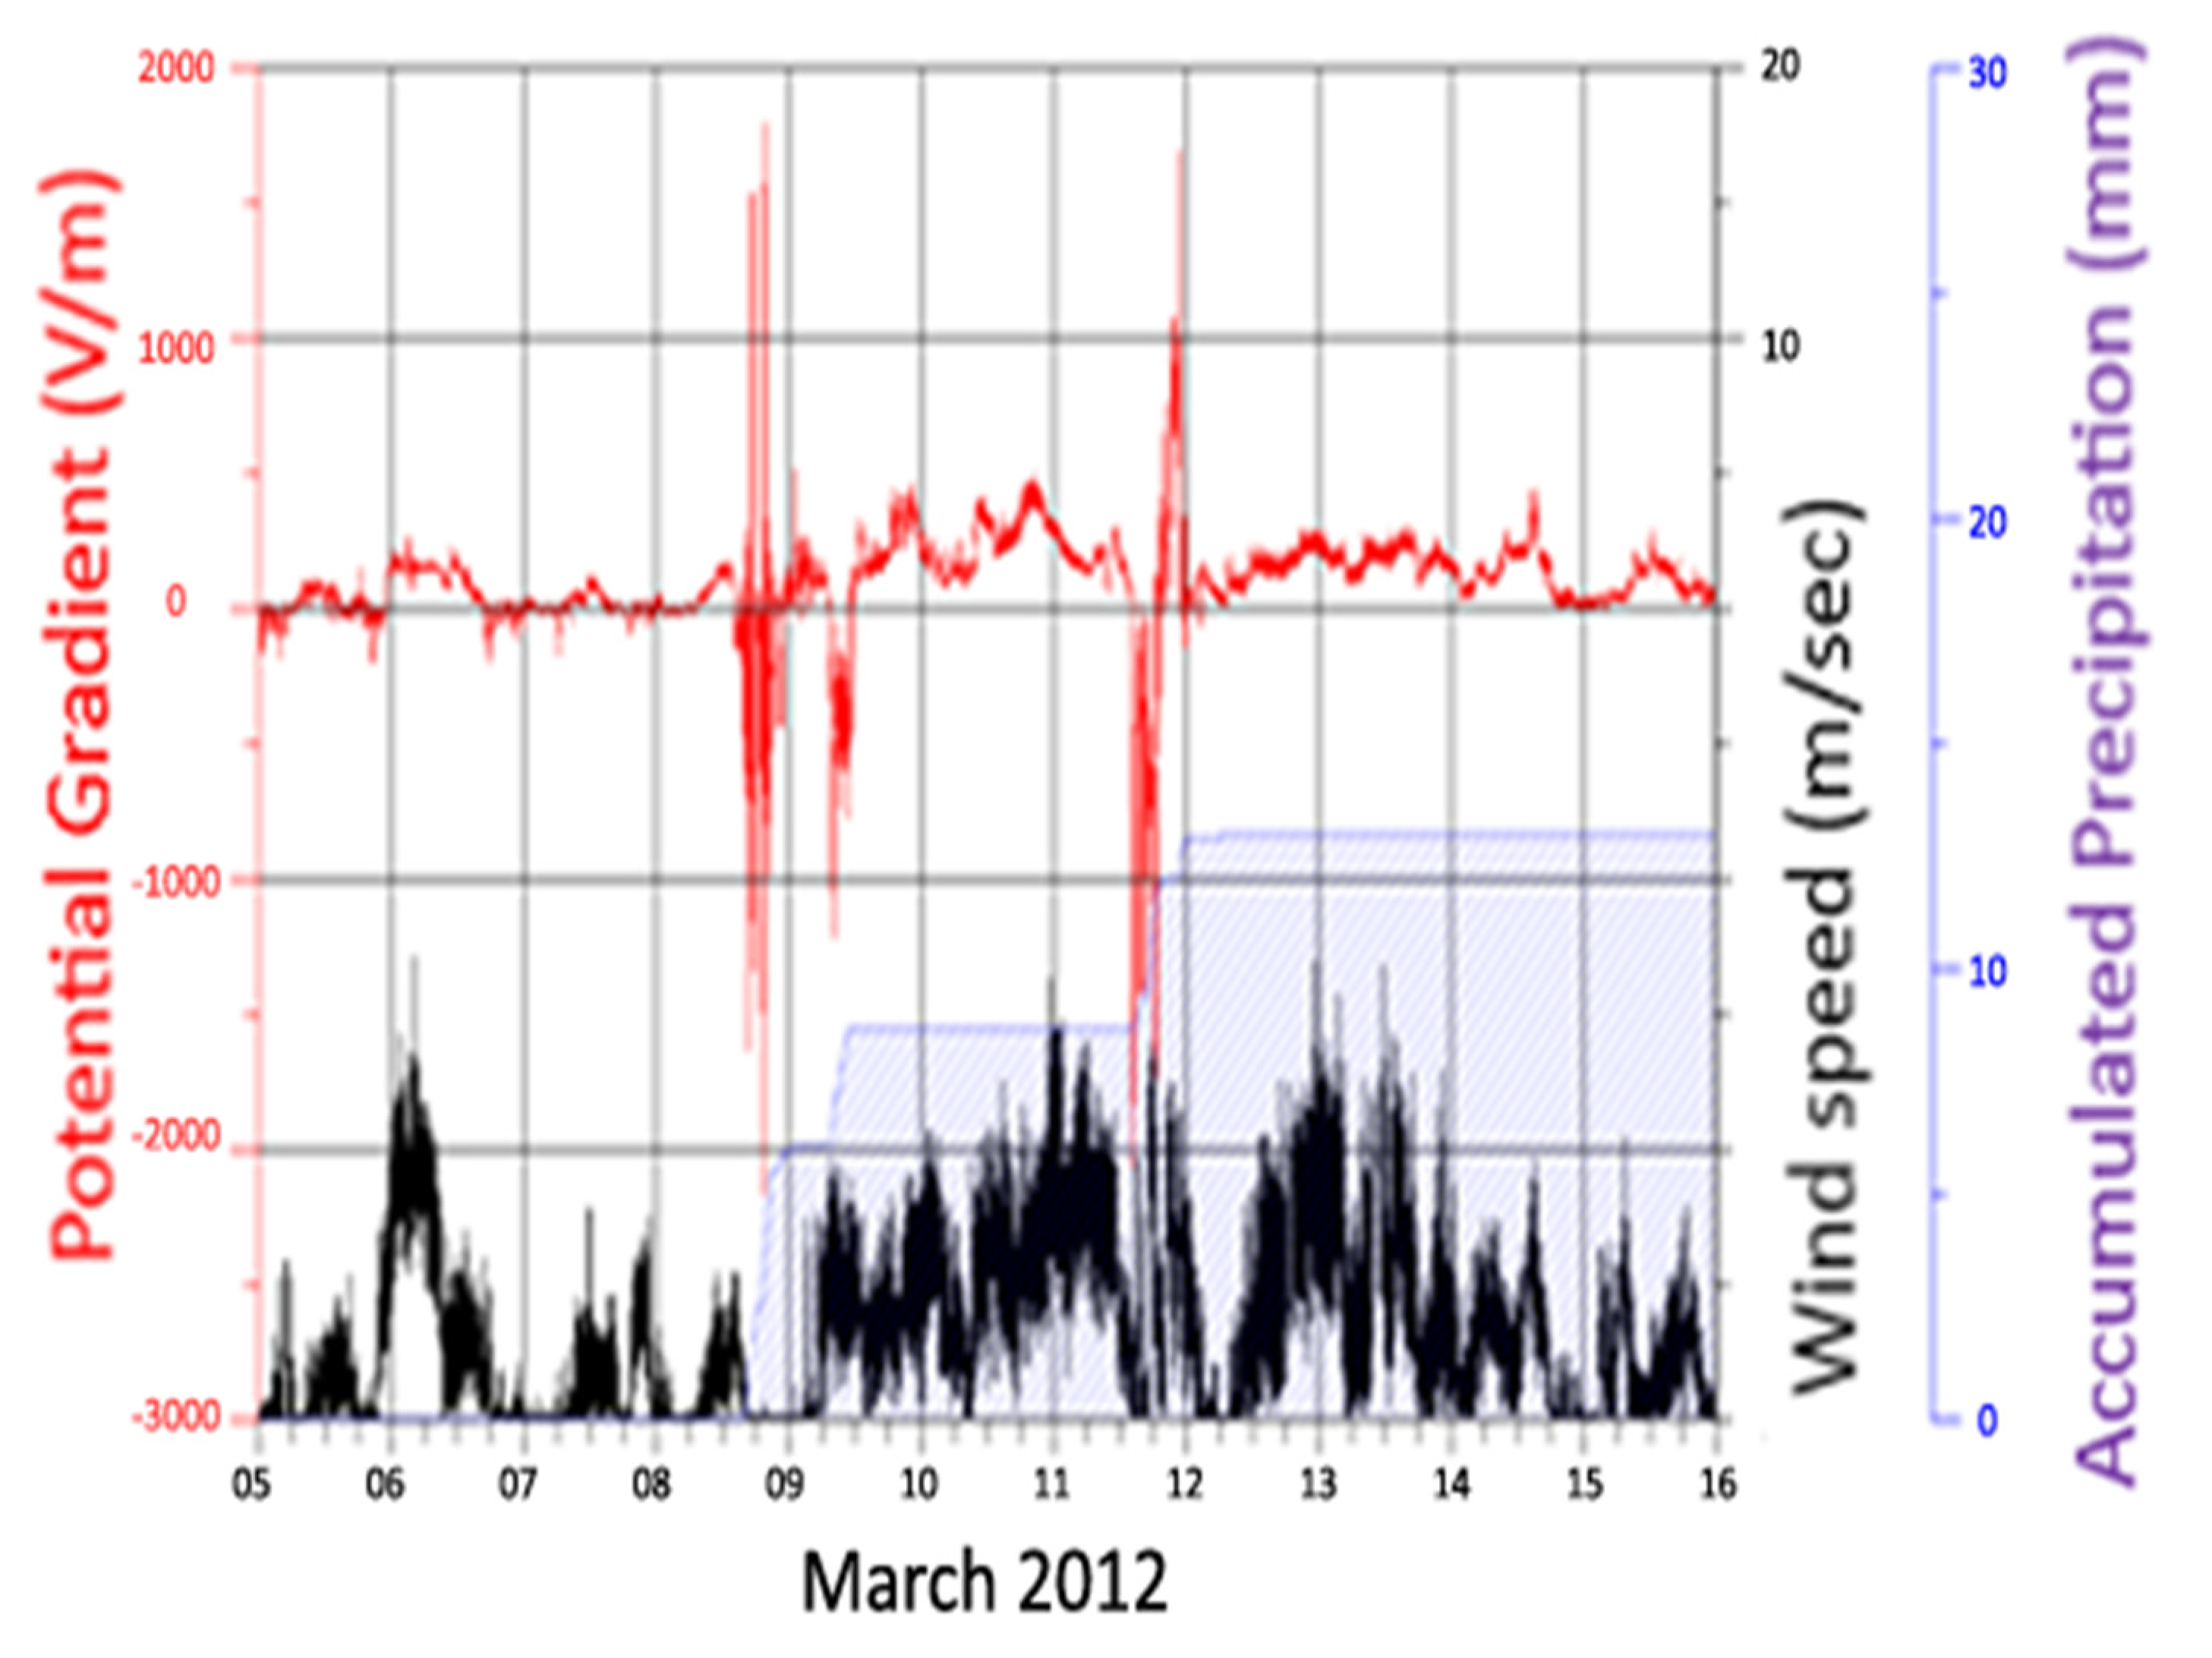
- Local measurements in Demokritos University of Thrace, in Xanthi, revealed unusual large amplitude atmospheric electric field Ez fluctuations, after the arrival of two interplanetary shock waves at ACE, on March 8 and March 11, respectively. Both times of anomalous Ez were followed by storms with intense rainfall and fast winds (Figure 6 and Figure 8).
- (4)
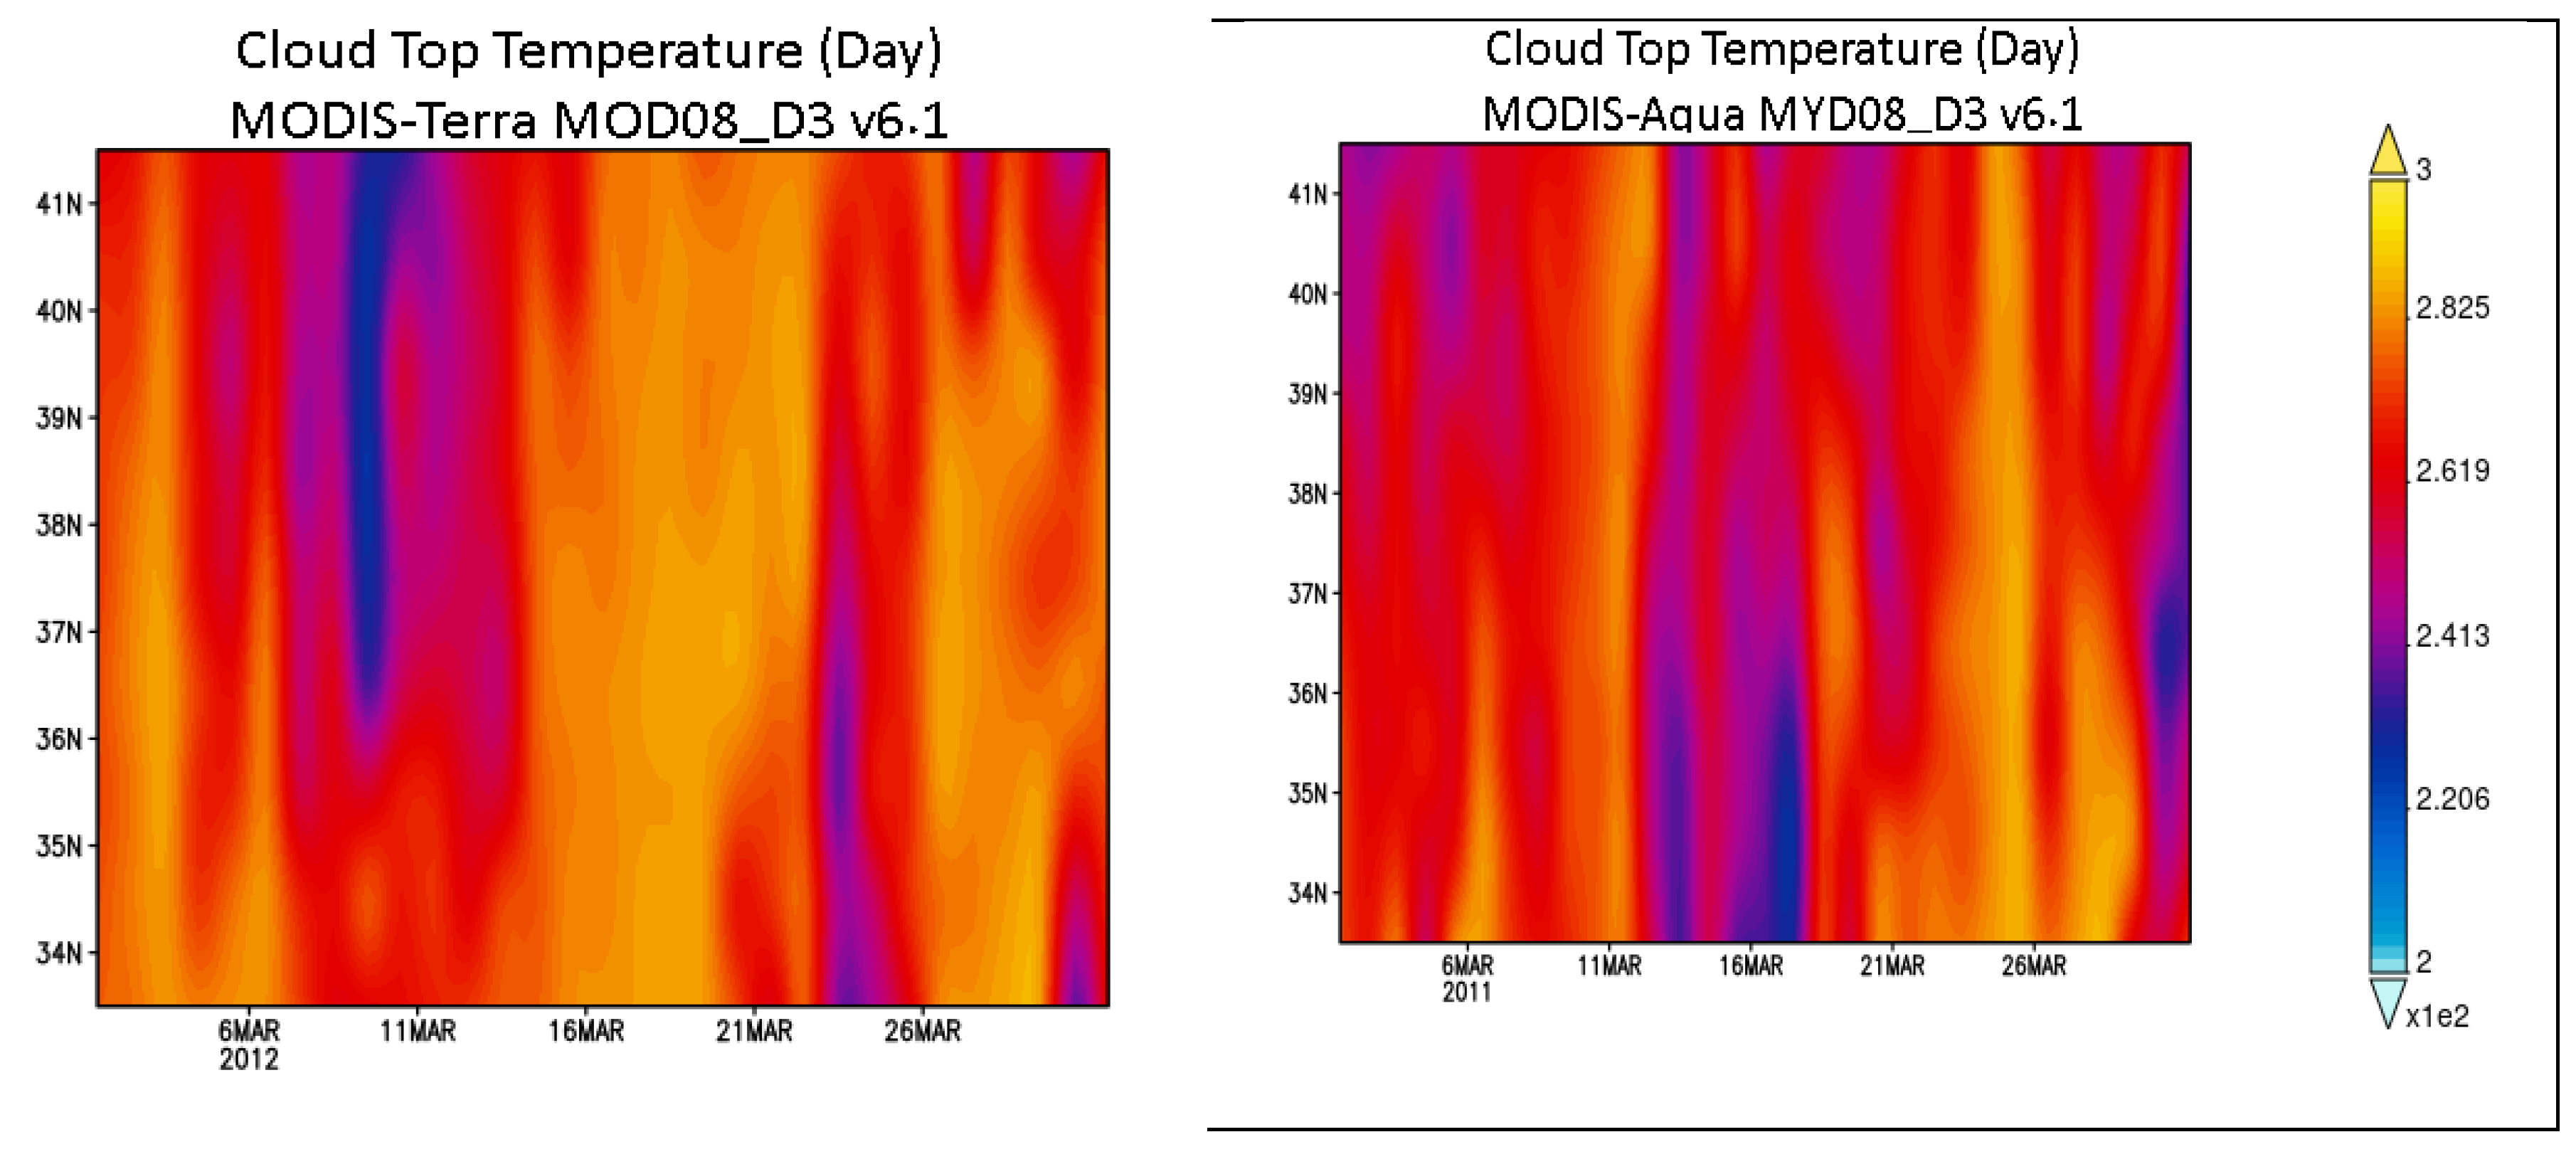
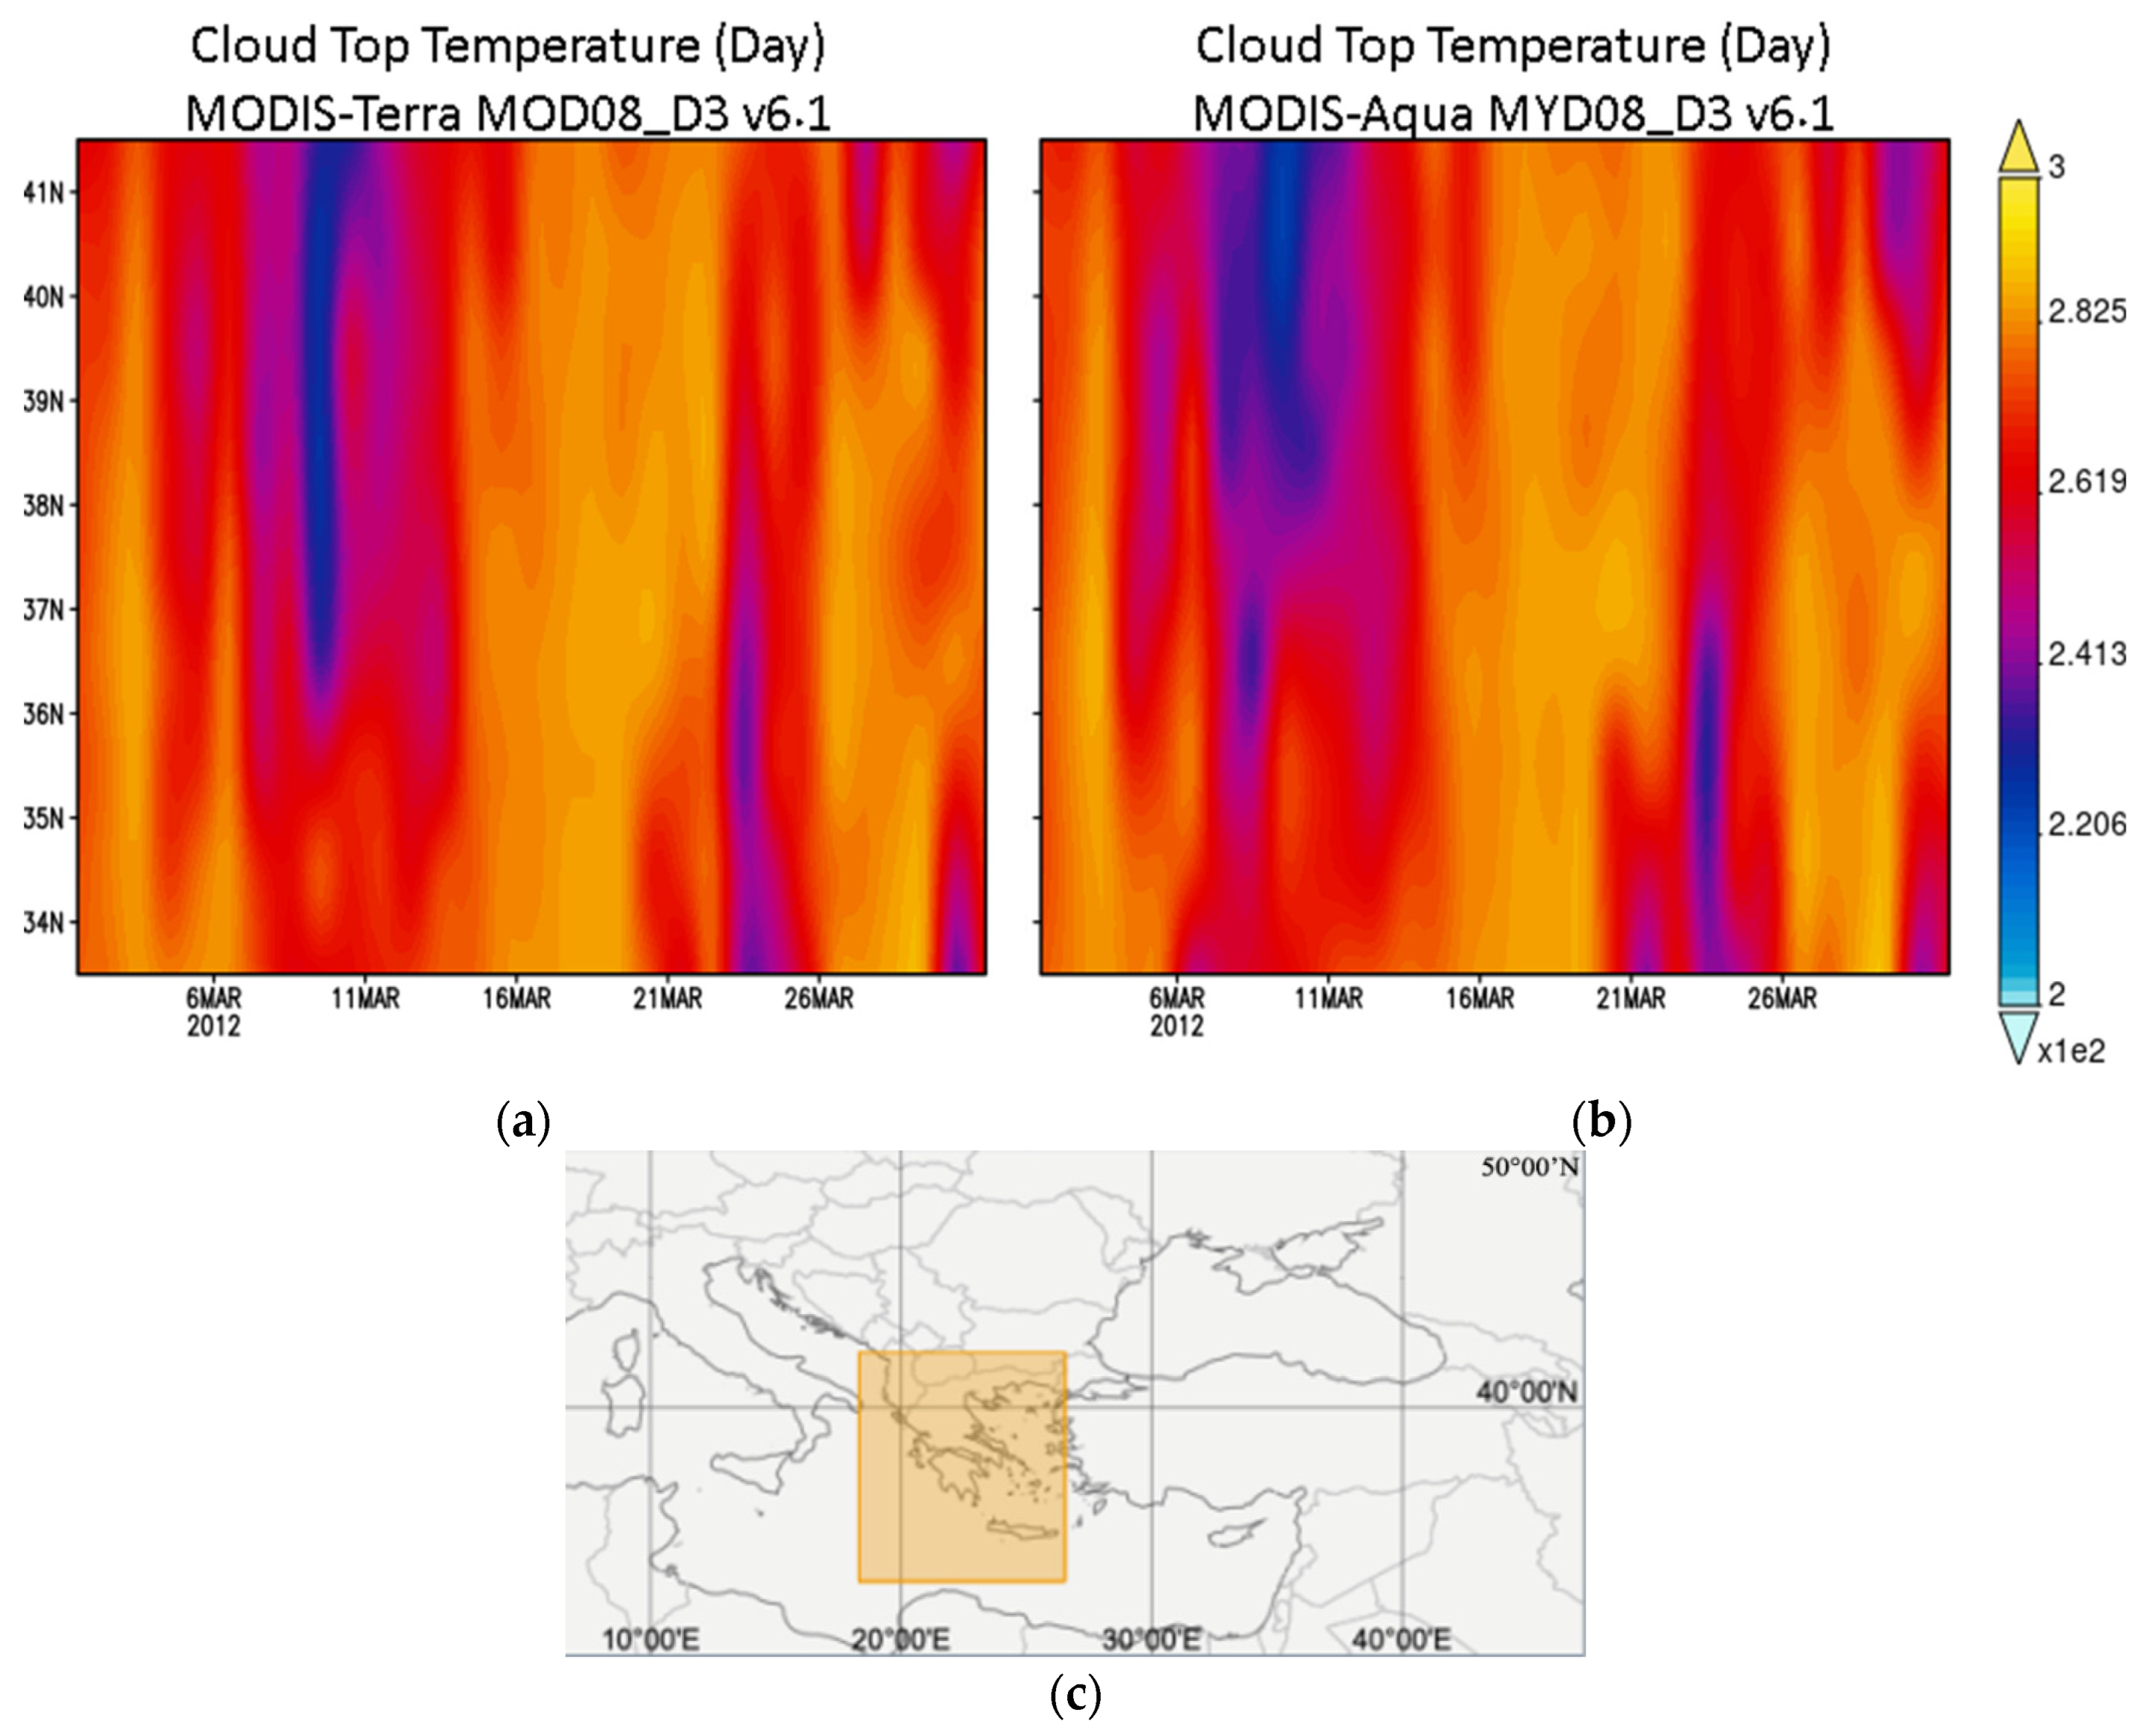
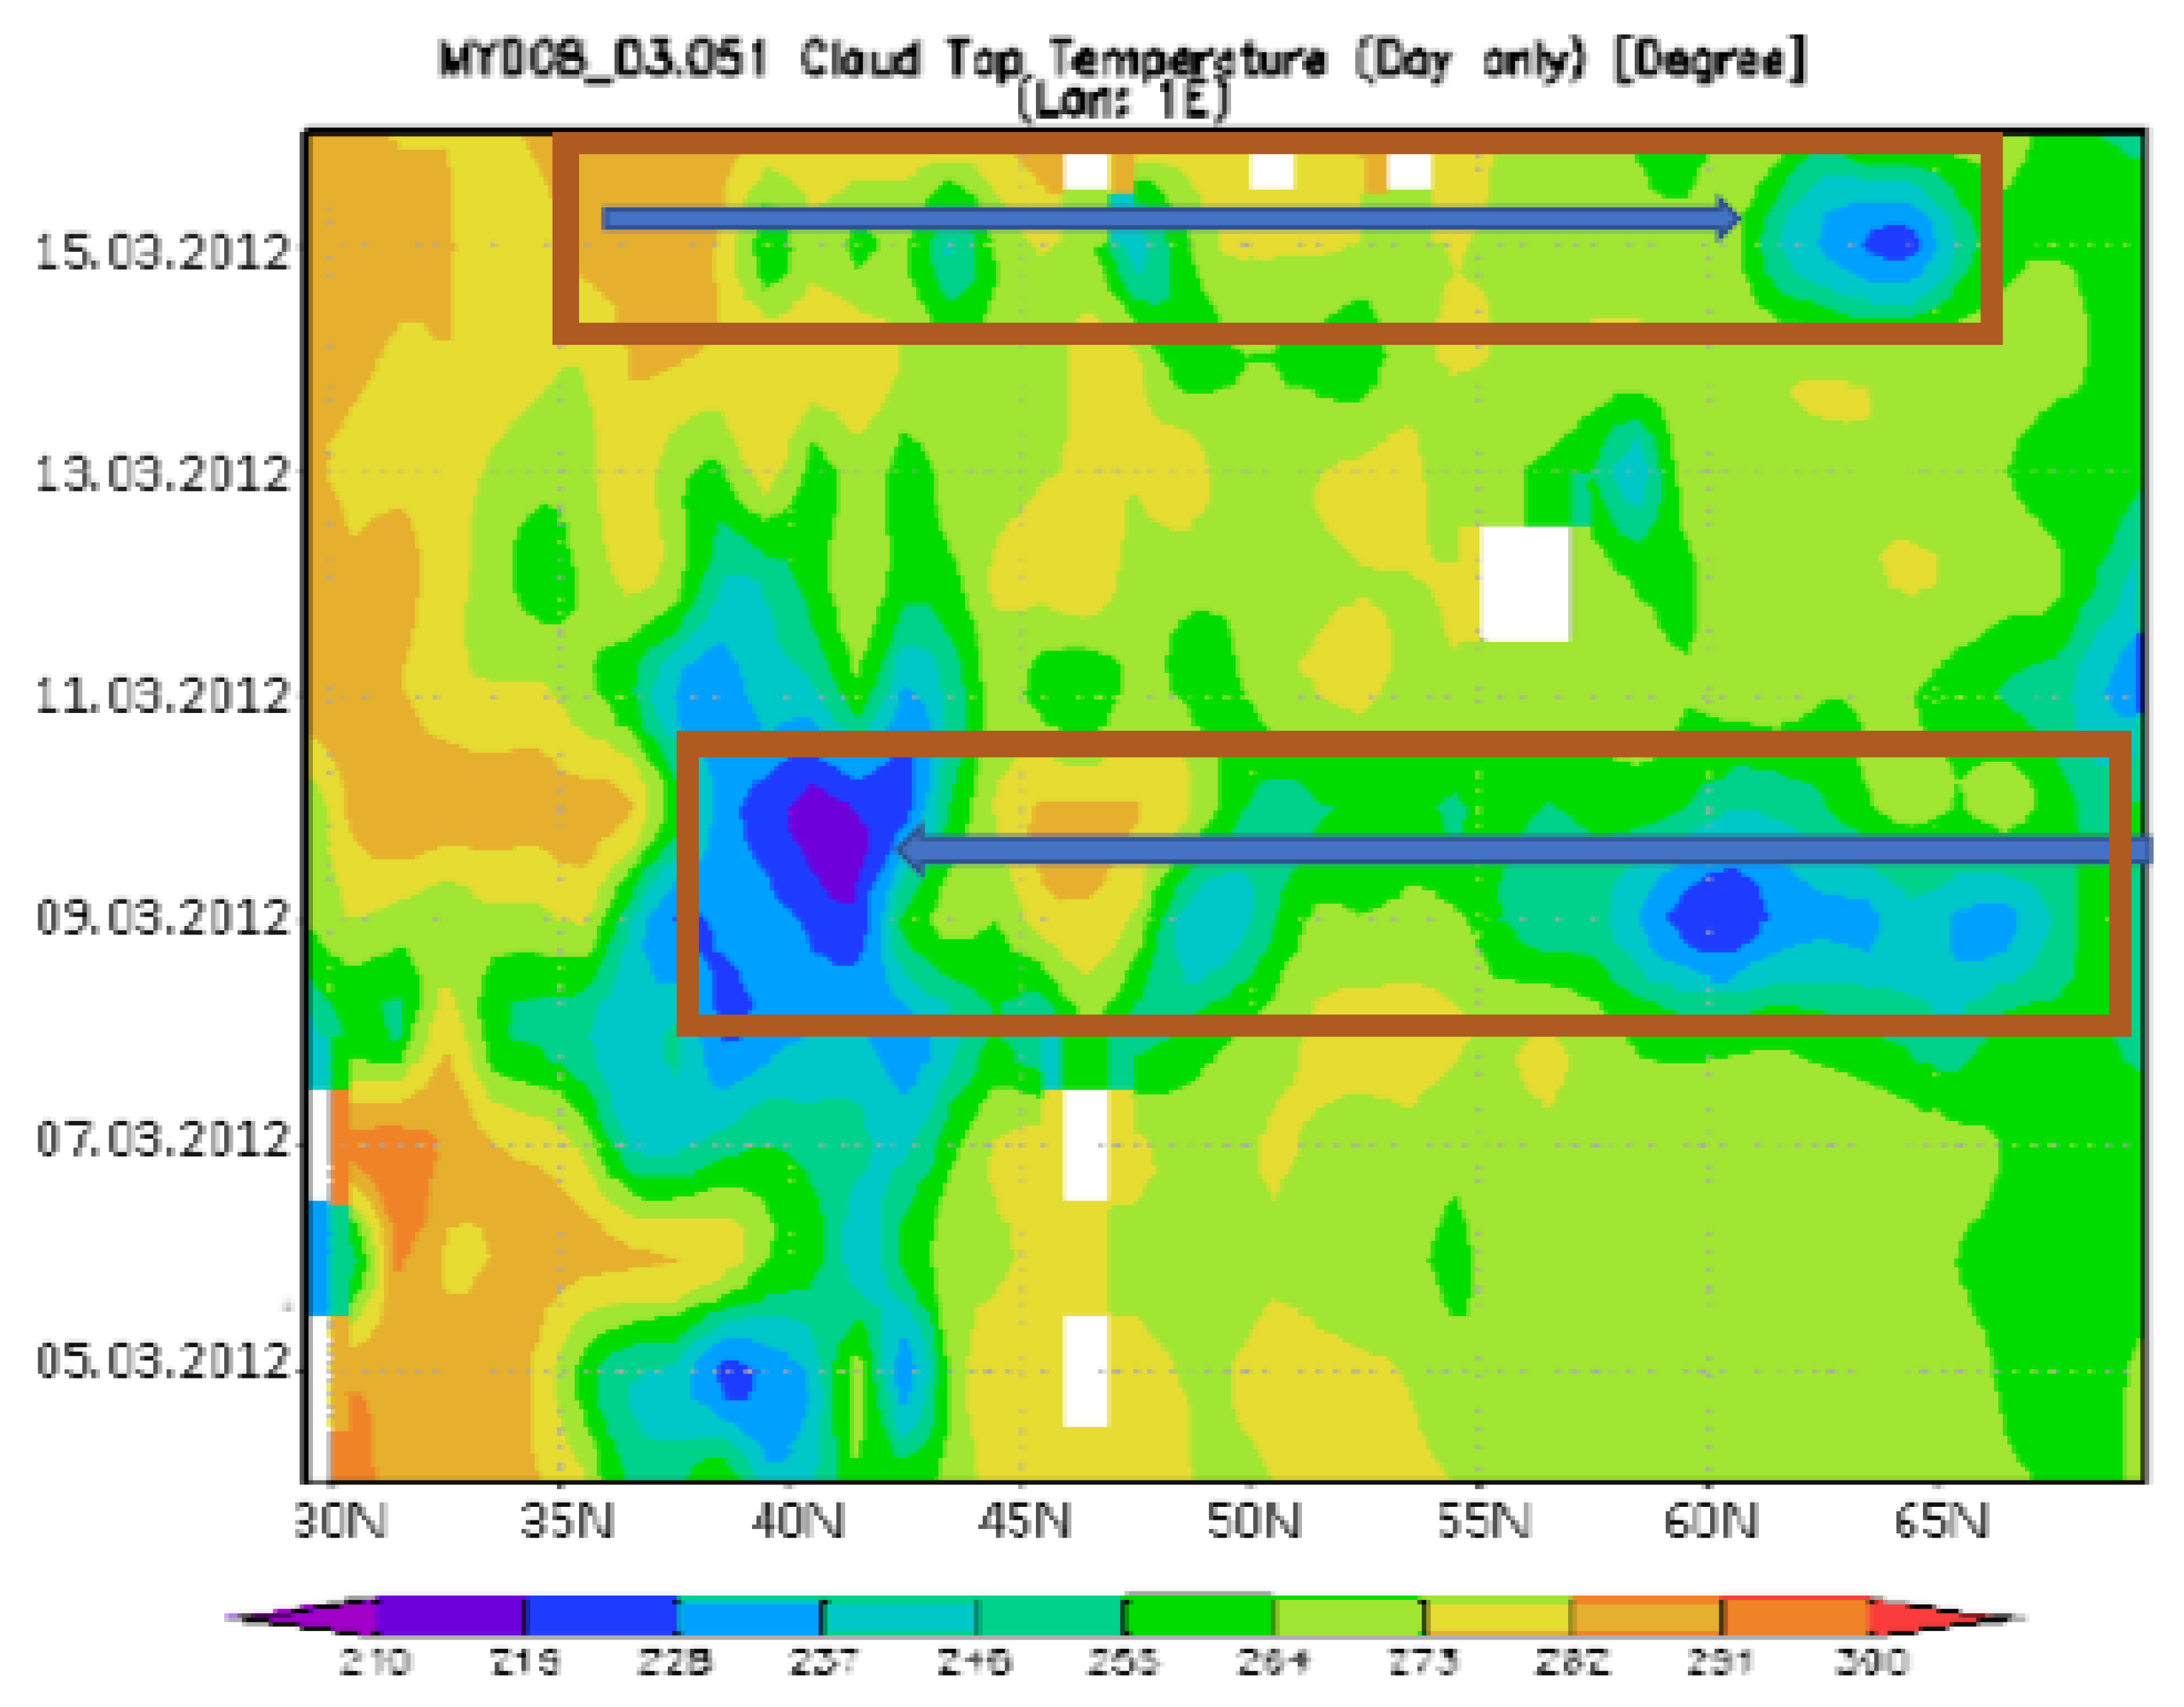
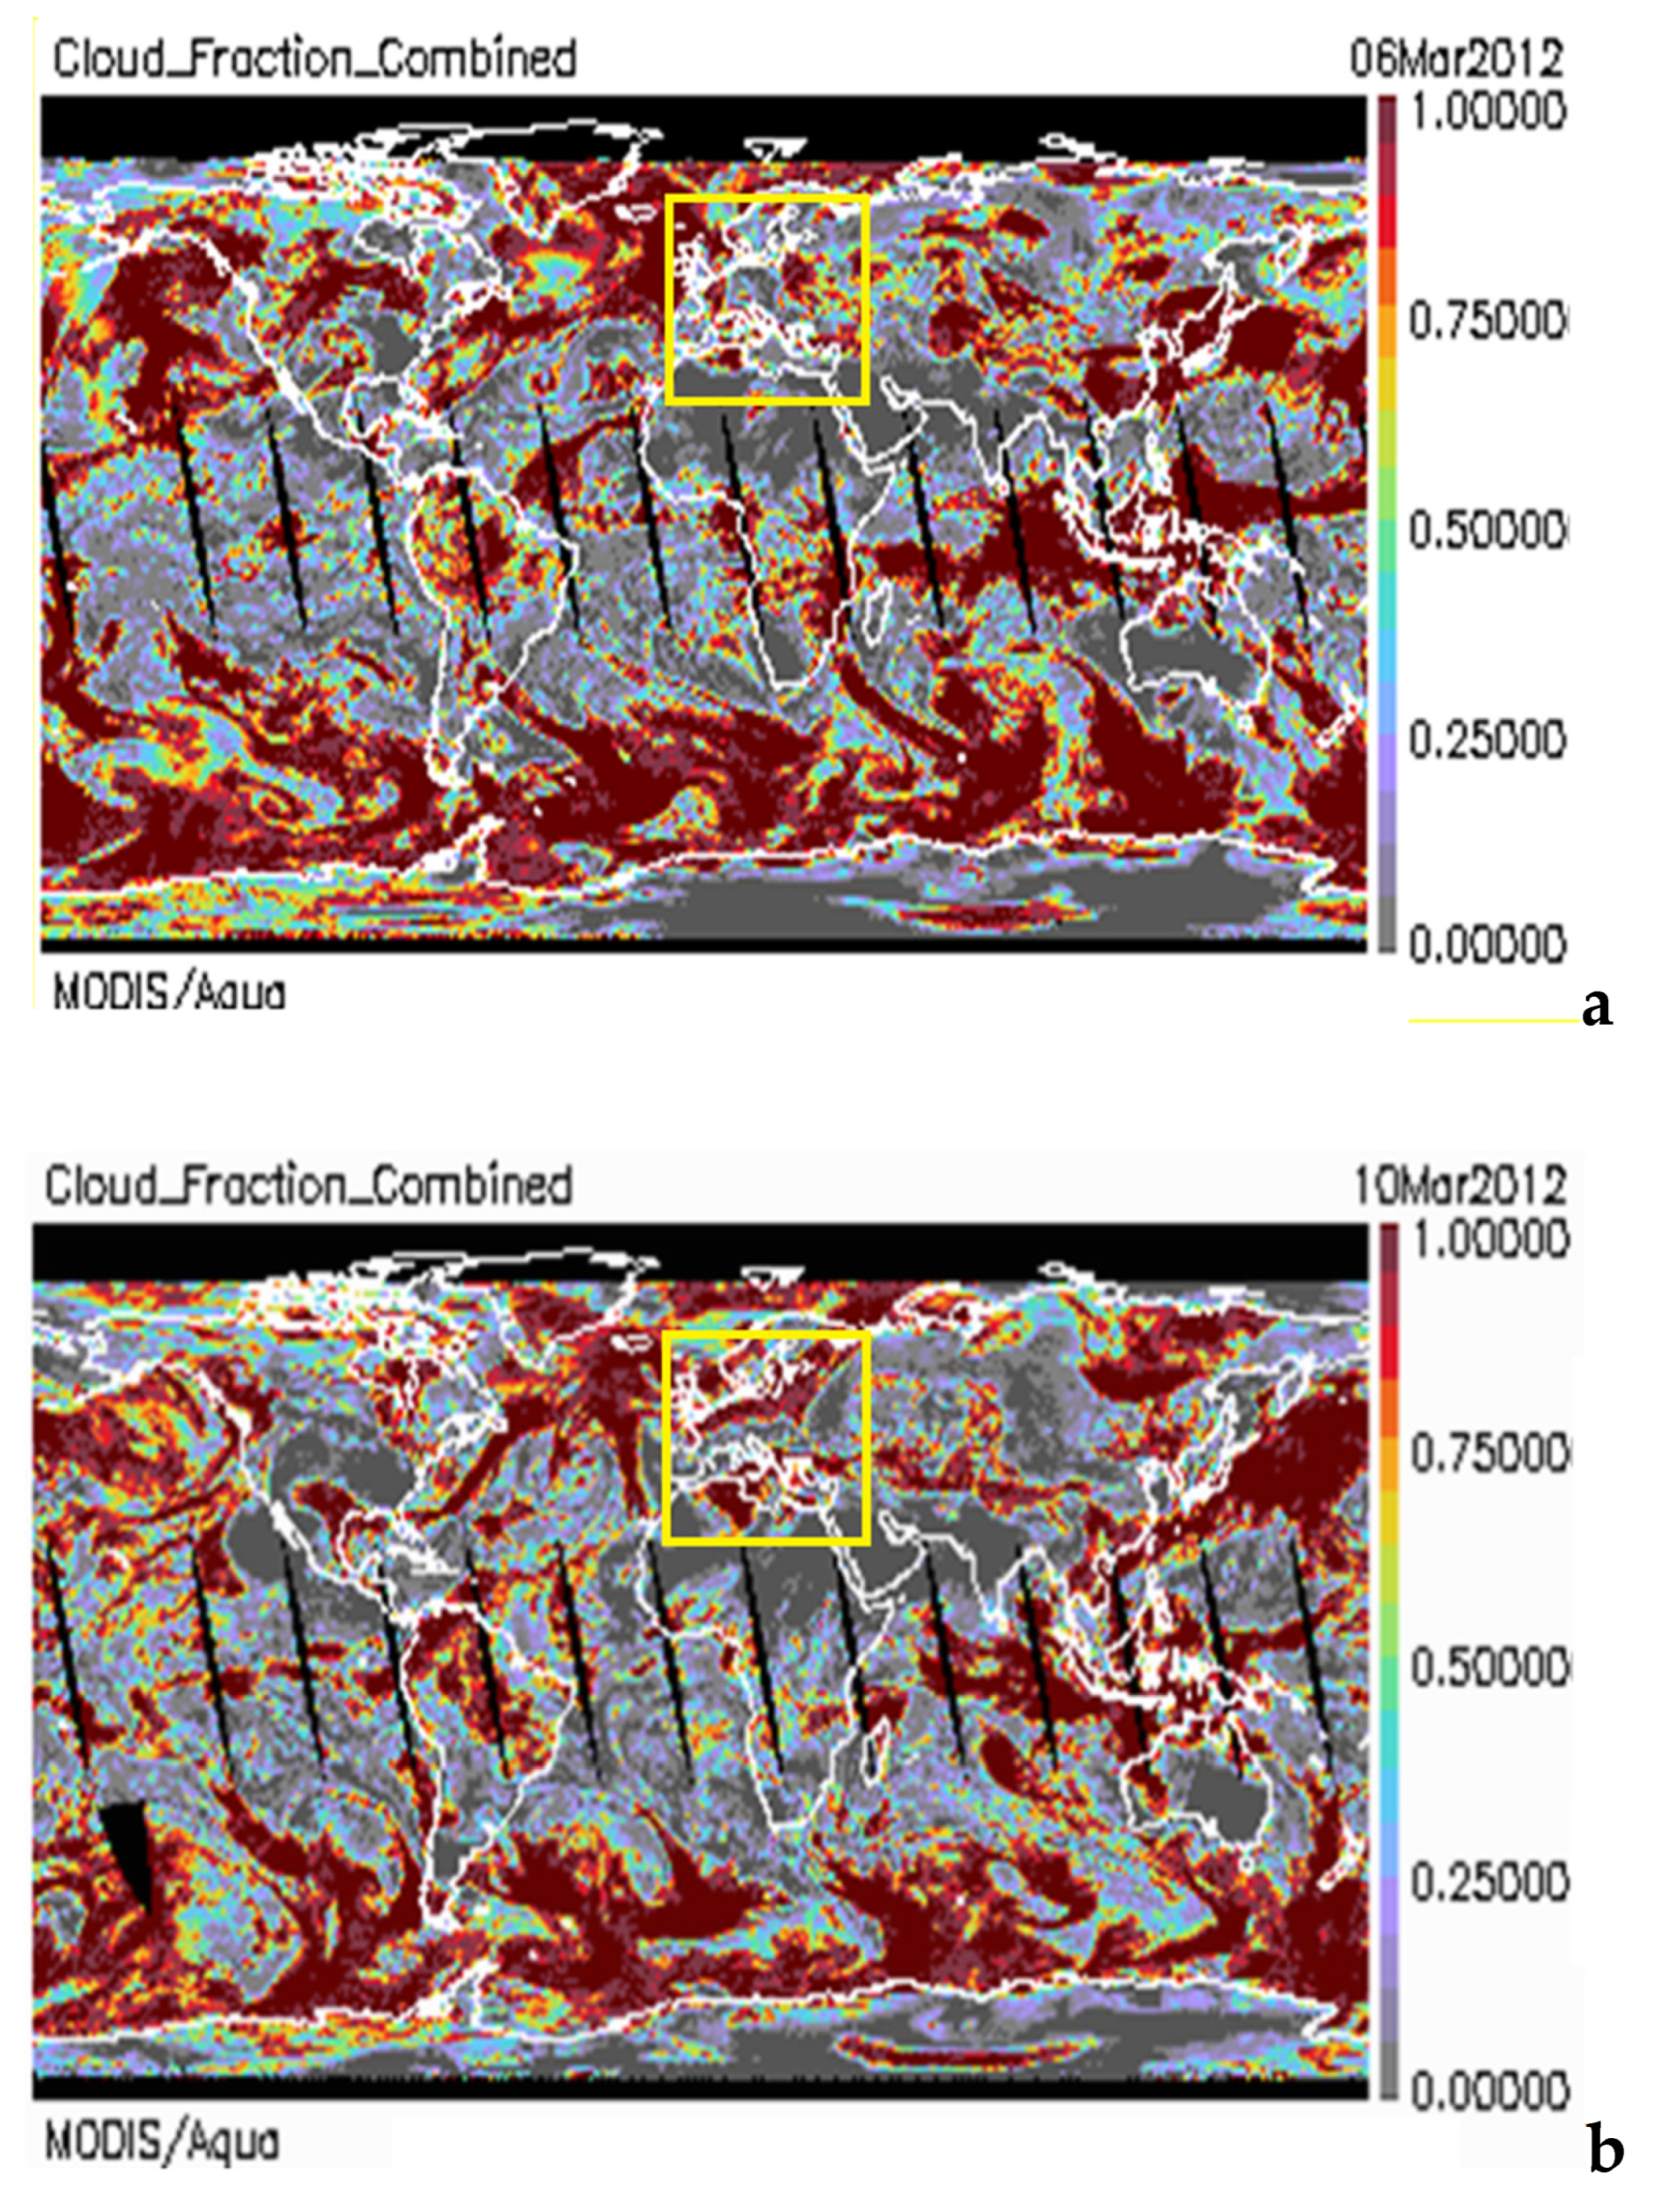
- The first electric field Ez disturbance on March 8 was the major one, ranging between ~-2000V/m - ~1800V/m (Figure 10); the related storm, which lasted in Xanthi from 8 to 11 March 2012, was accompanied by a deep drop in the cloud top temperature as measured by MODIS/TERRA and MODIS/AQUA.
- (5)
- (6)
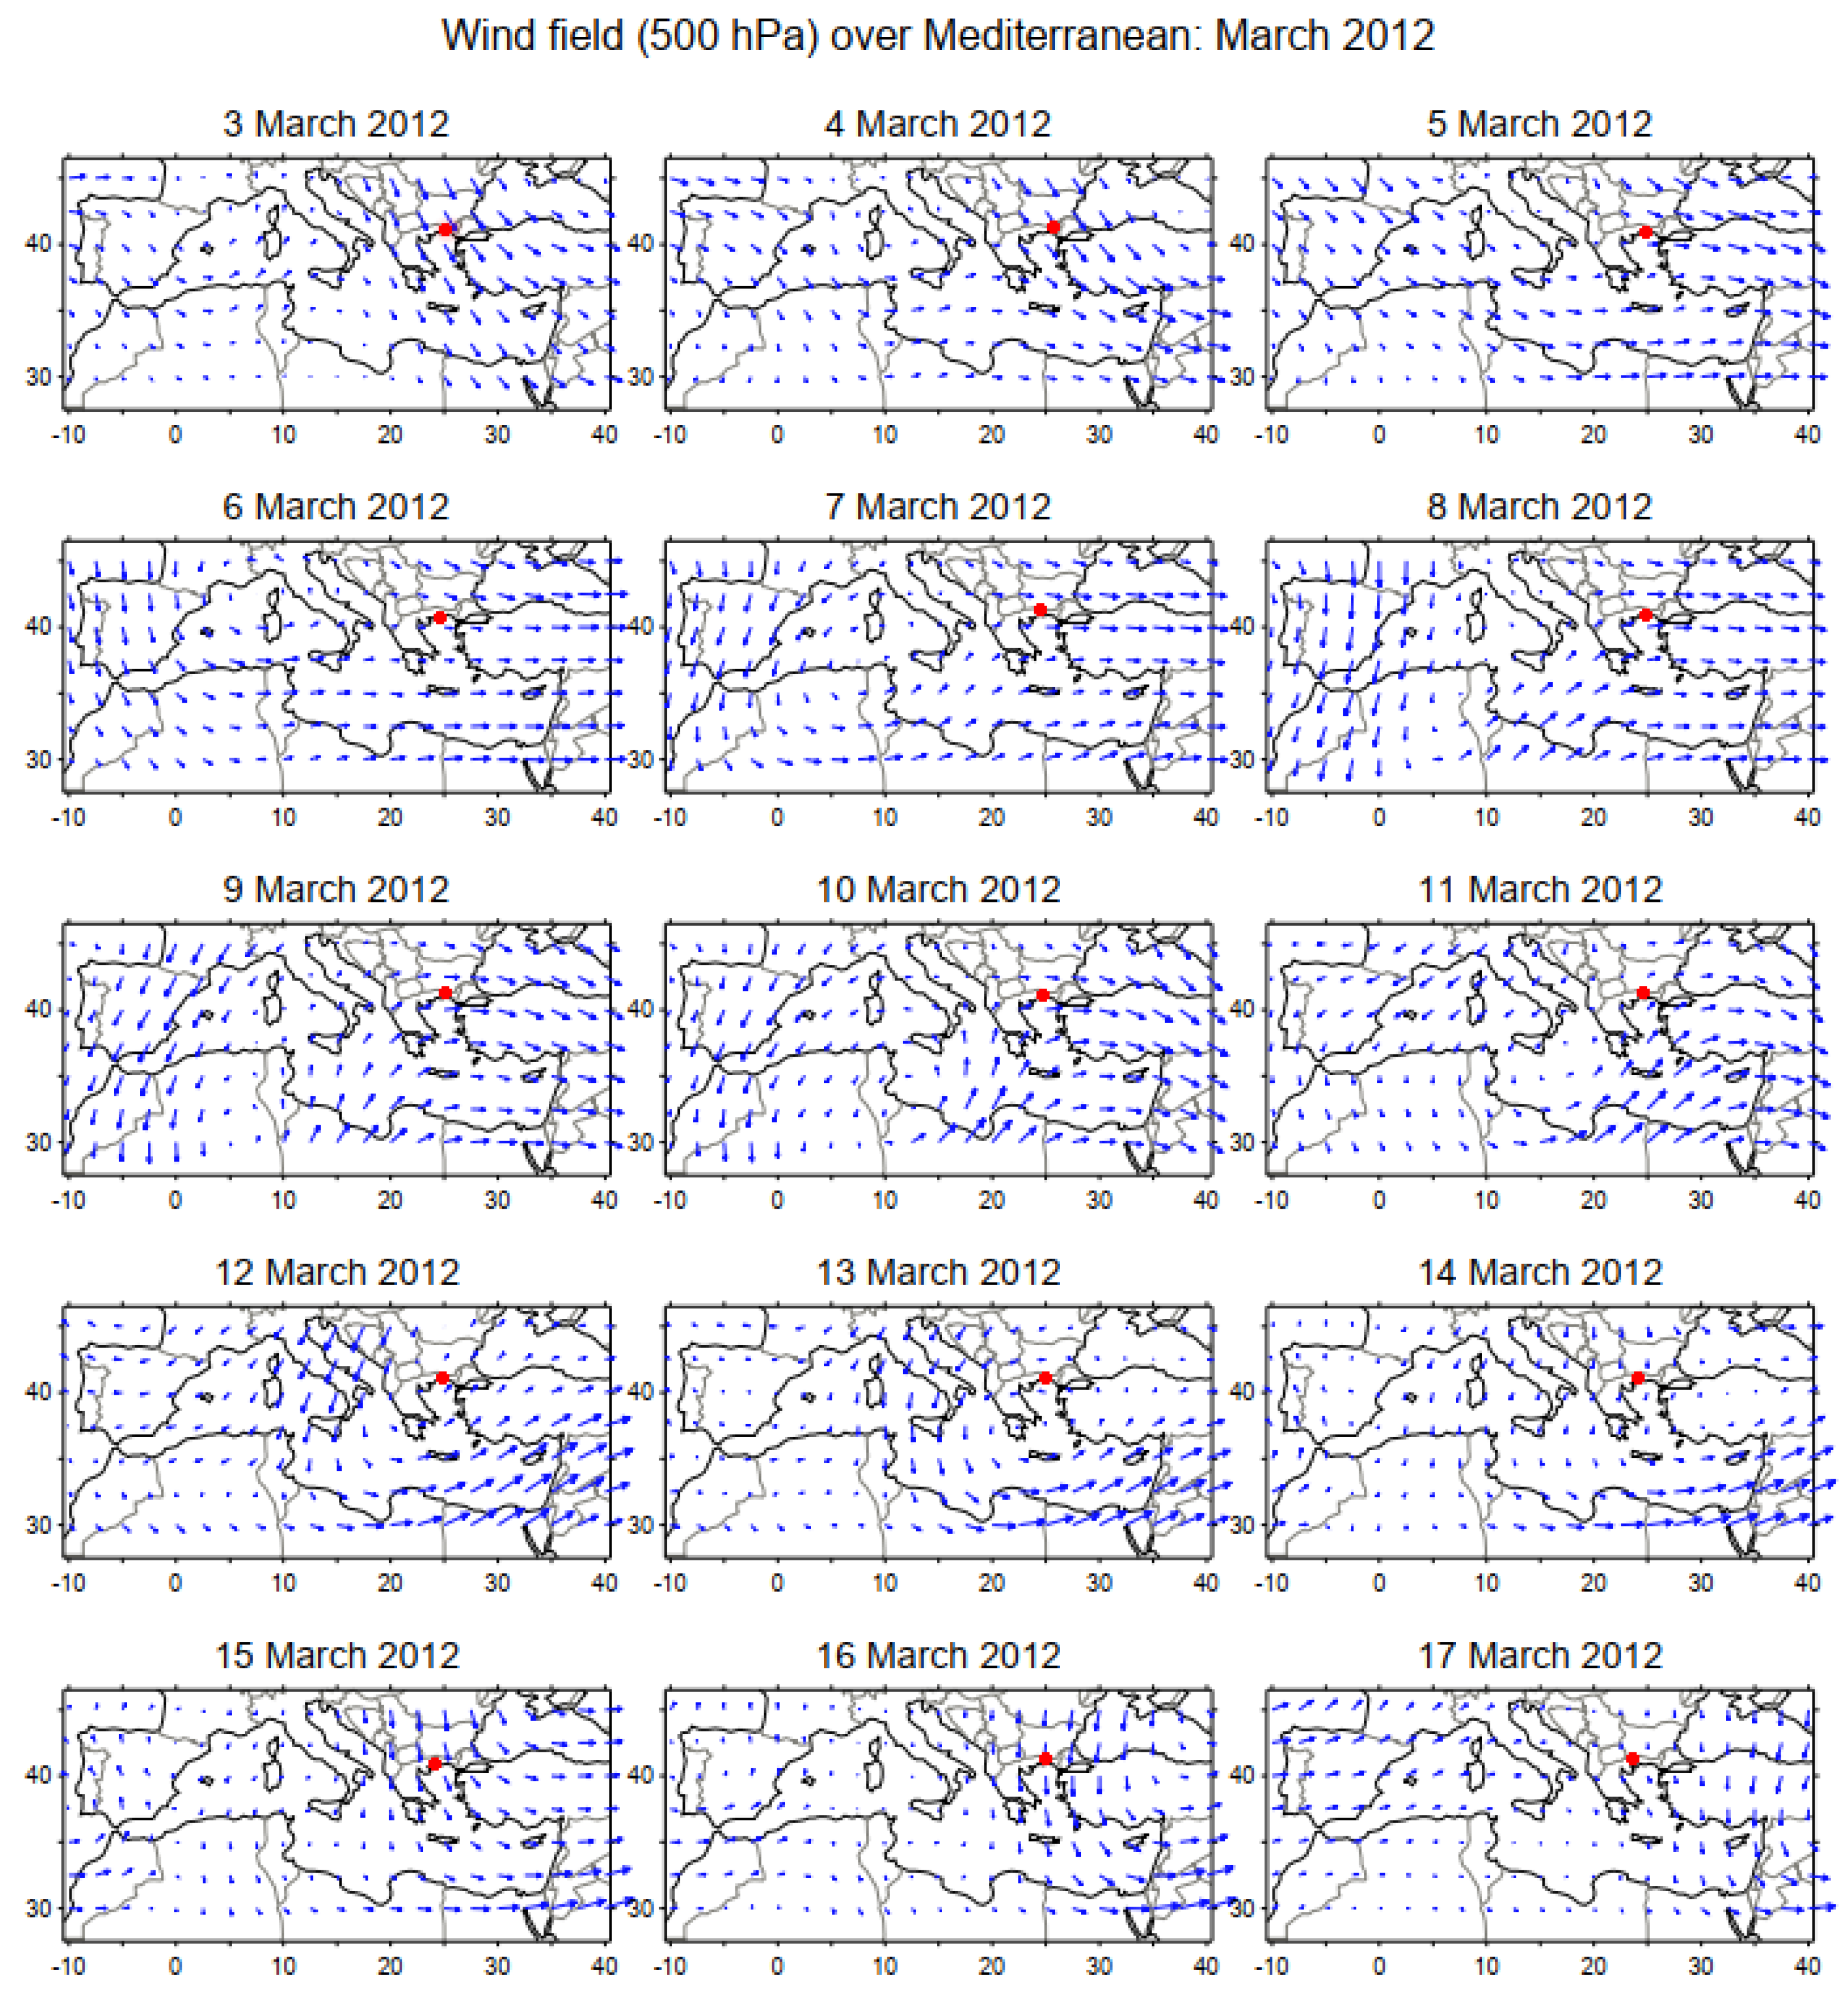
- During the 8 - 10 March 2012 atmospheric event the front of a cyclone appeared in Thrace as a northward jet stream flow, in the direction from the Mediterranean / Agean Sea to land (Figure 7). MODIS/TERRA measurements suggest that during this period the cloud top temperature drop effect extended to a large range of latitudes, from ~350Nup to at least ~700N, with a decreasing effect towards higher latitudes.
- (7)
- The winter-like 12 – 13 March 2012 jet flow was streaming from the northward direction (higher European latitudes) and it produced highest speeds, but it left no great signal of cloud top temperature drop in MODIS/TERRA and MODIS/AQUA records (Figure 6 and Figure 8). MODIS/TERRA measurements suggest that during this period the cloud top temperature drop effect is more evident at latitudes northward of Xanthi.
- (8)
- Daily wind fields in south Europe and Mediterranean Sea, including Xanthi, Greece (Figure 6) at mid-tropospheric heights (500 hPa) show that the speed of wind intensifies during two phases (8 – 10.3.2012 and 12 – 13.3.2012) of the continuous course of an eastward moving cyclone appeared on March 6th in east Atlantic / west Mediterranean Sea and left the east Mediterranean / Middle East on March 17th; these two phases of intensified wind speed coincides with periods following the interplanetary shocks of 8 and 11 March.
- (9)
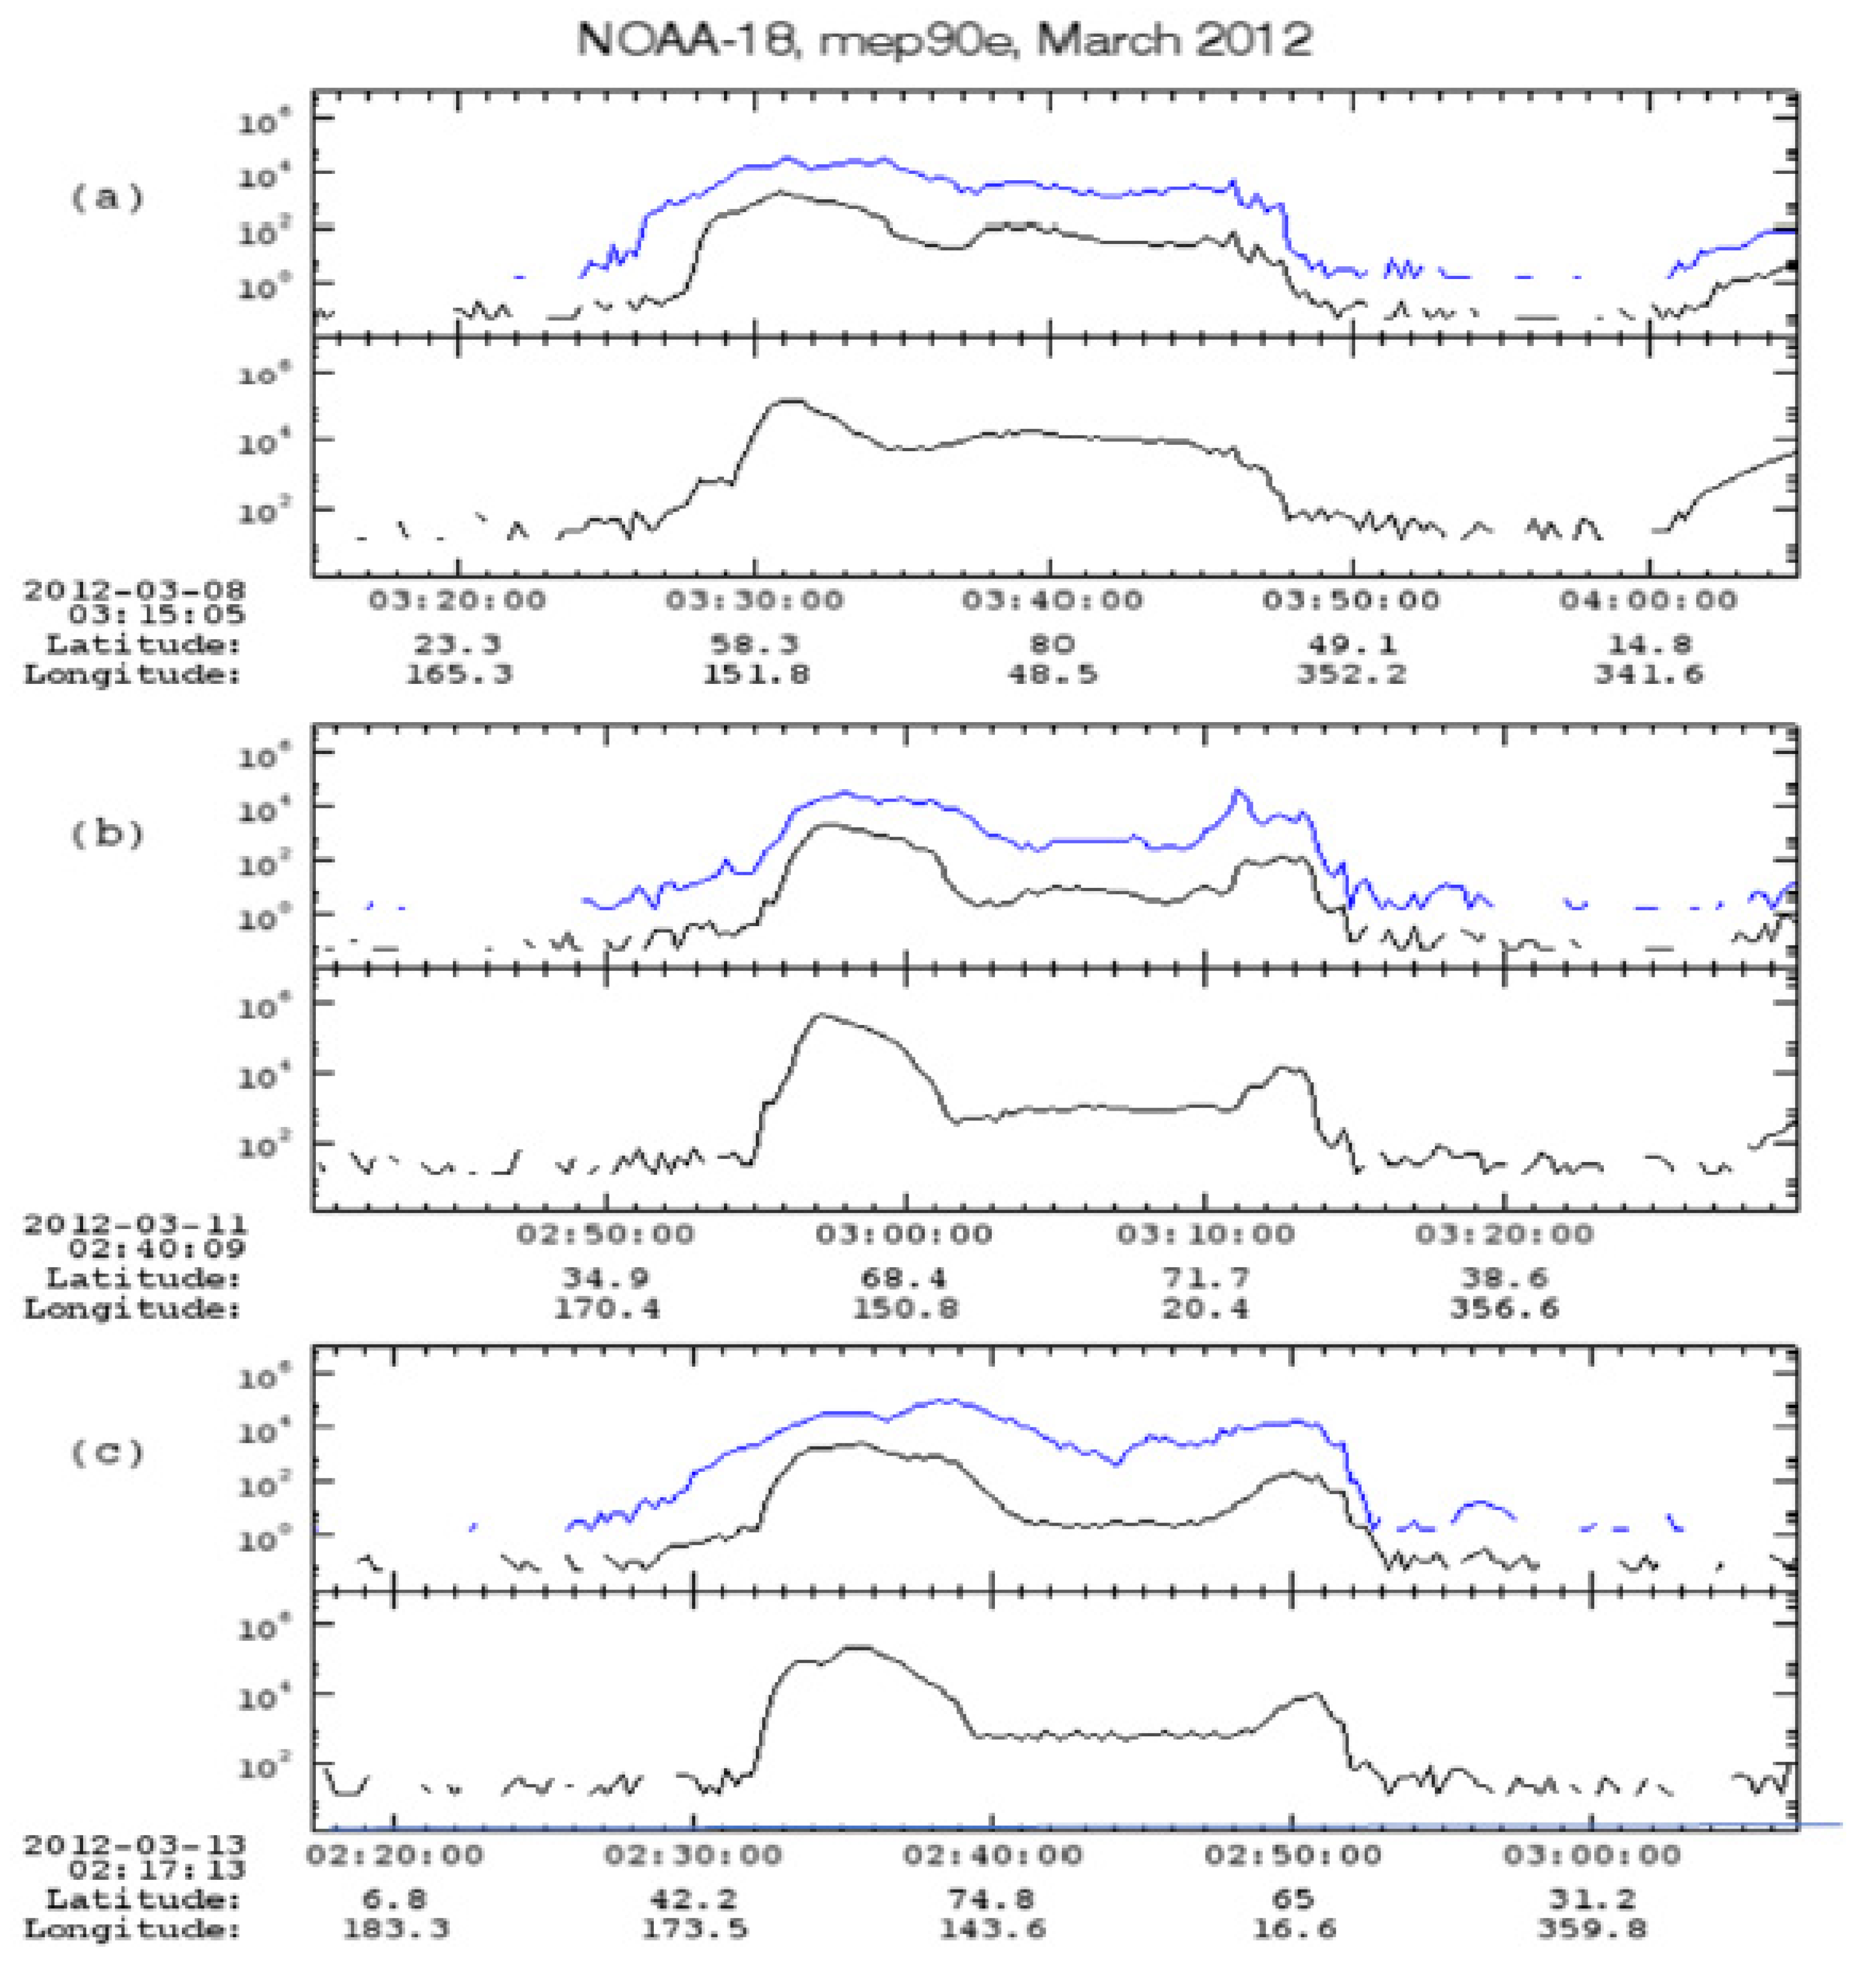
- During March 2012 precipitation in Alexandroupoli, east Thrace, was recorded during three periods with solar proton flux enhancements at ACE (Figures 3b and 3c).
- (10)
- (11)
-
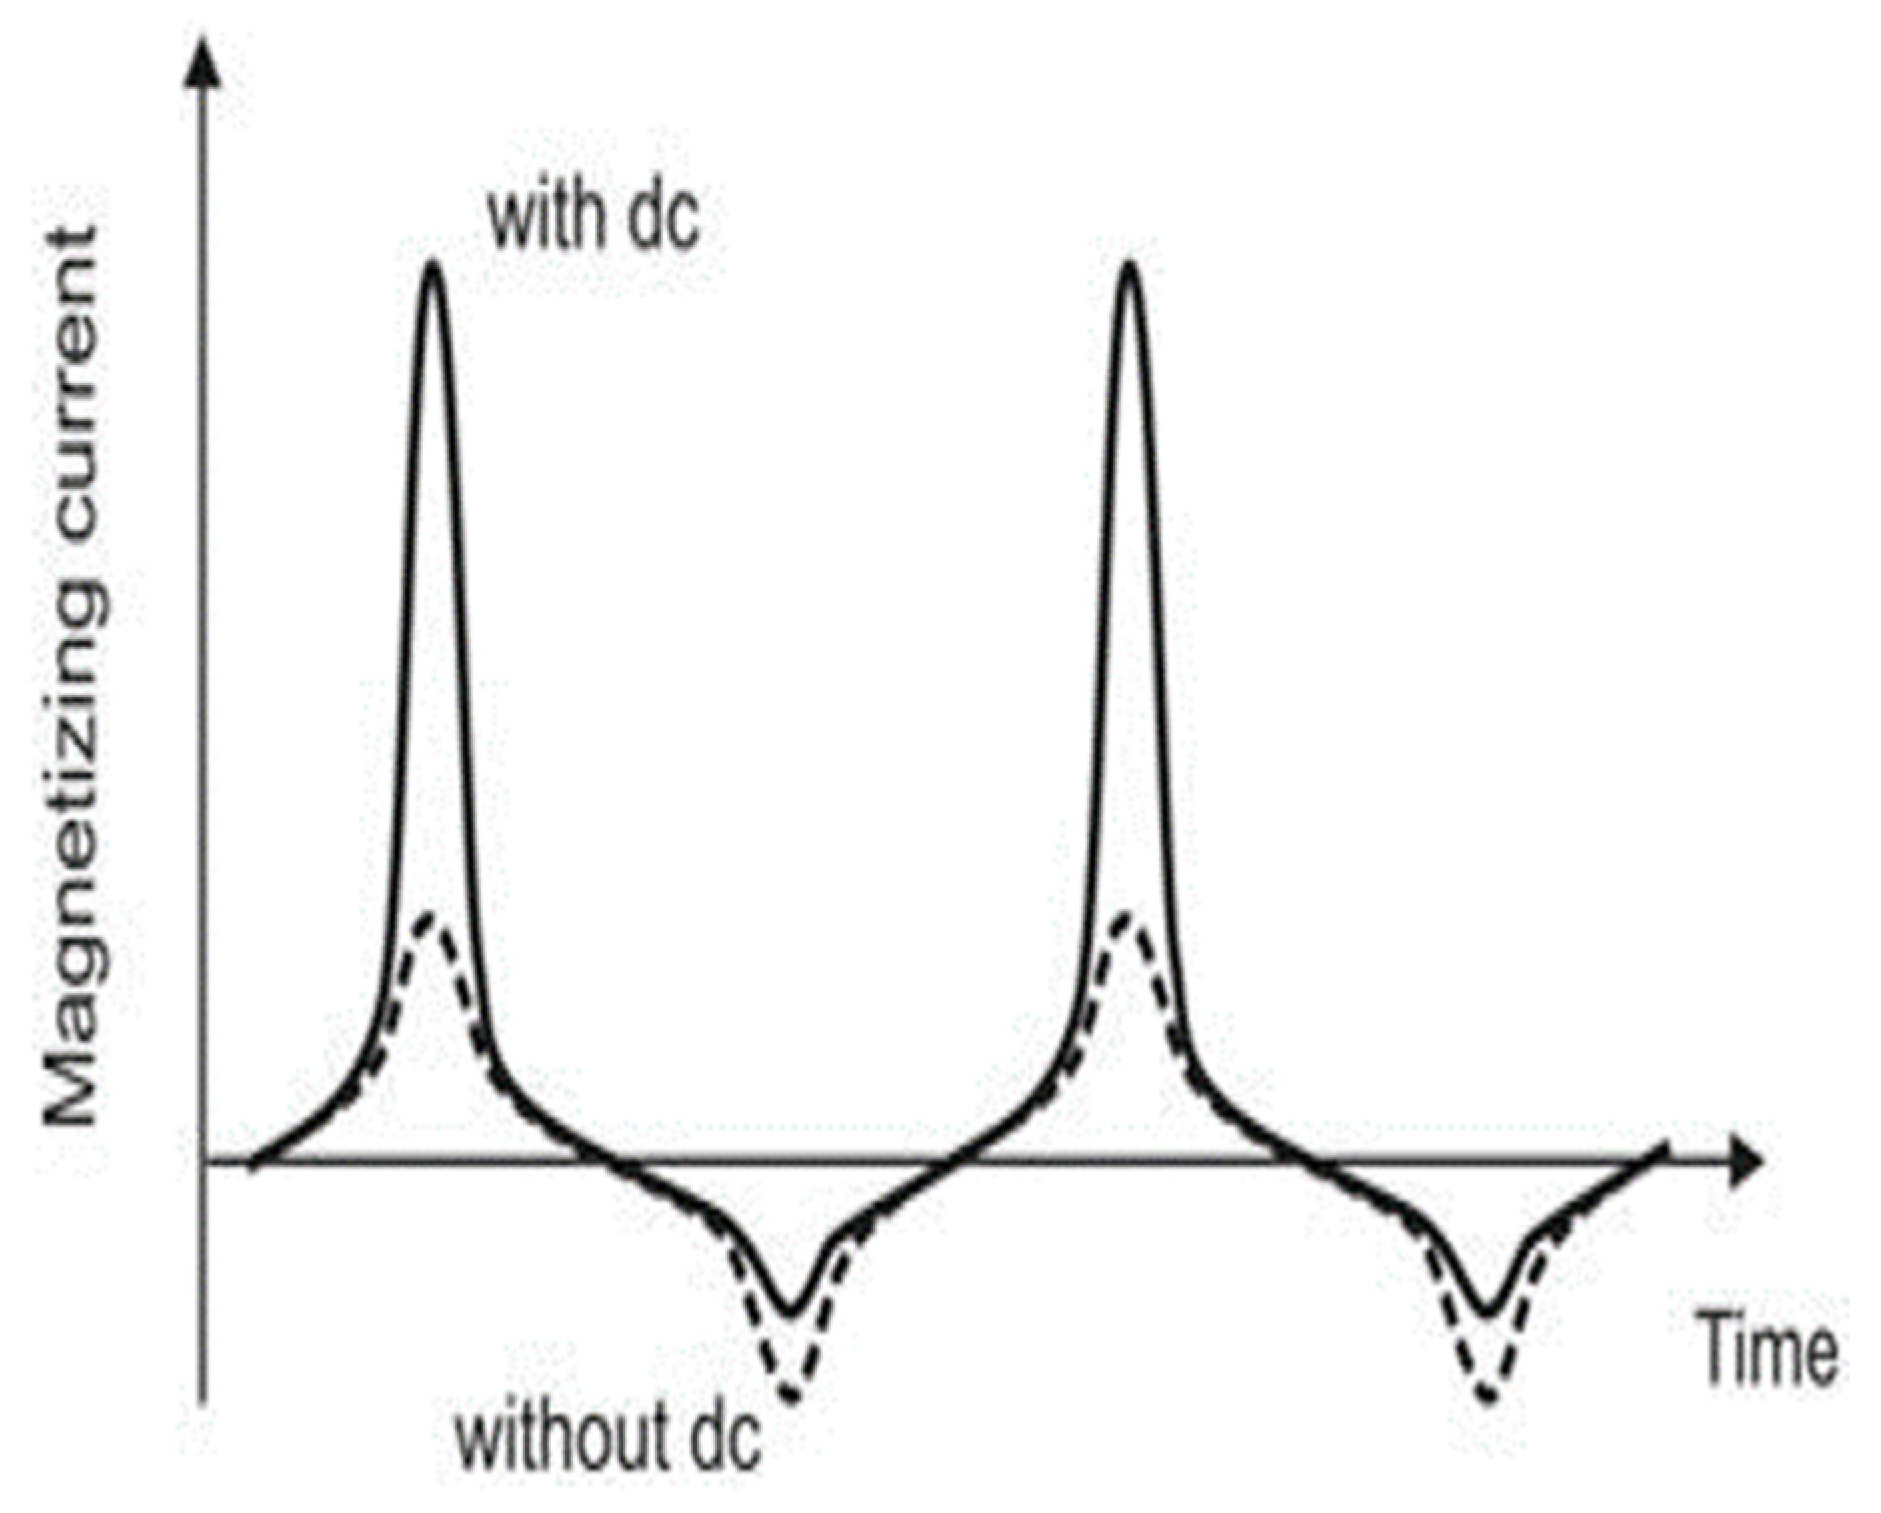
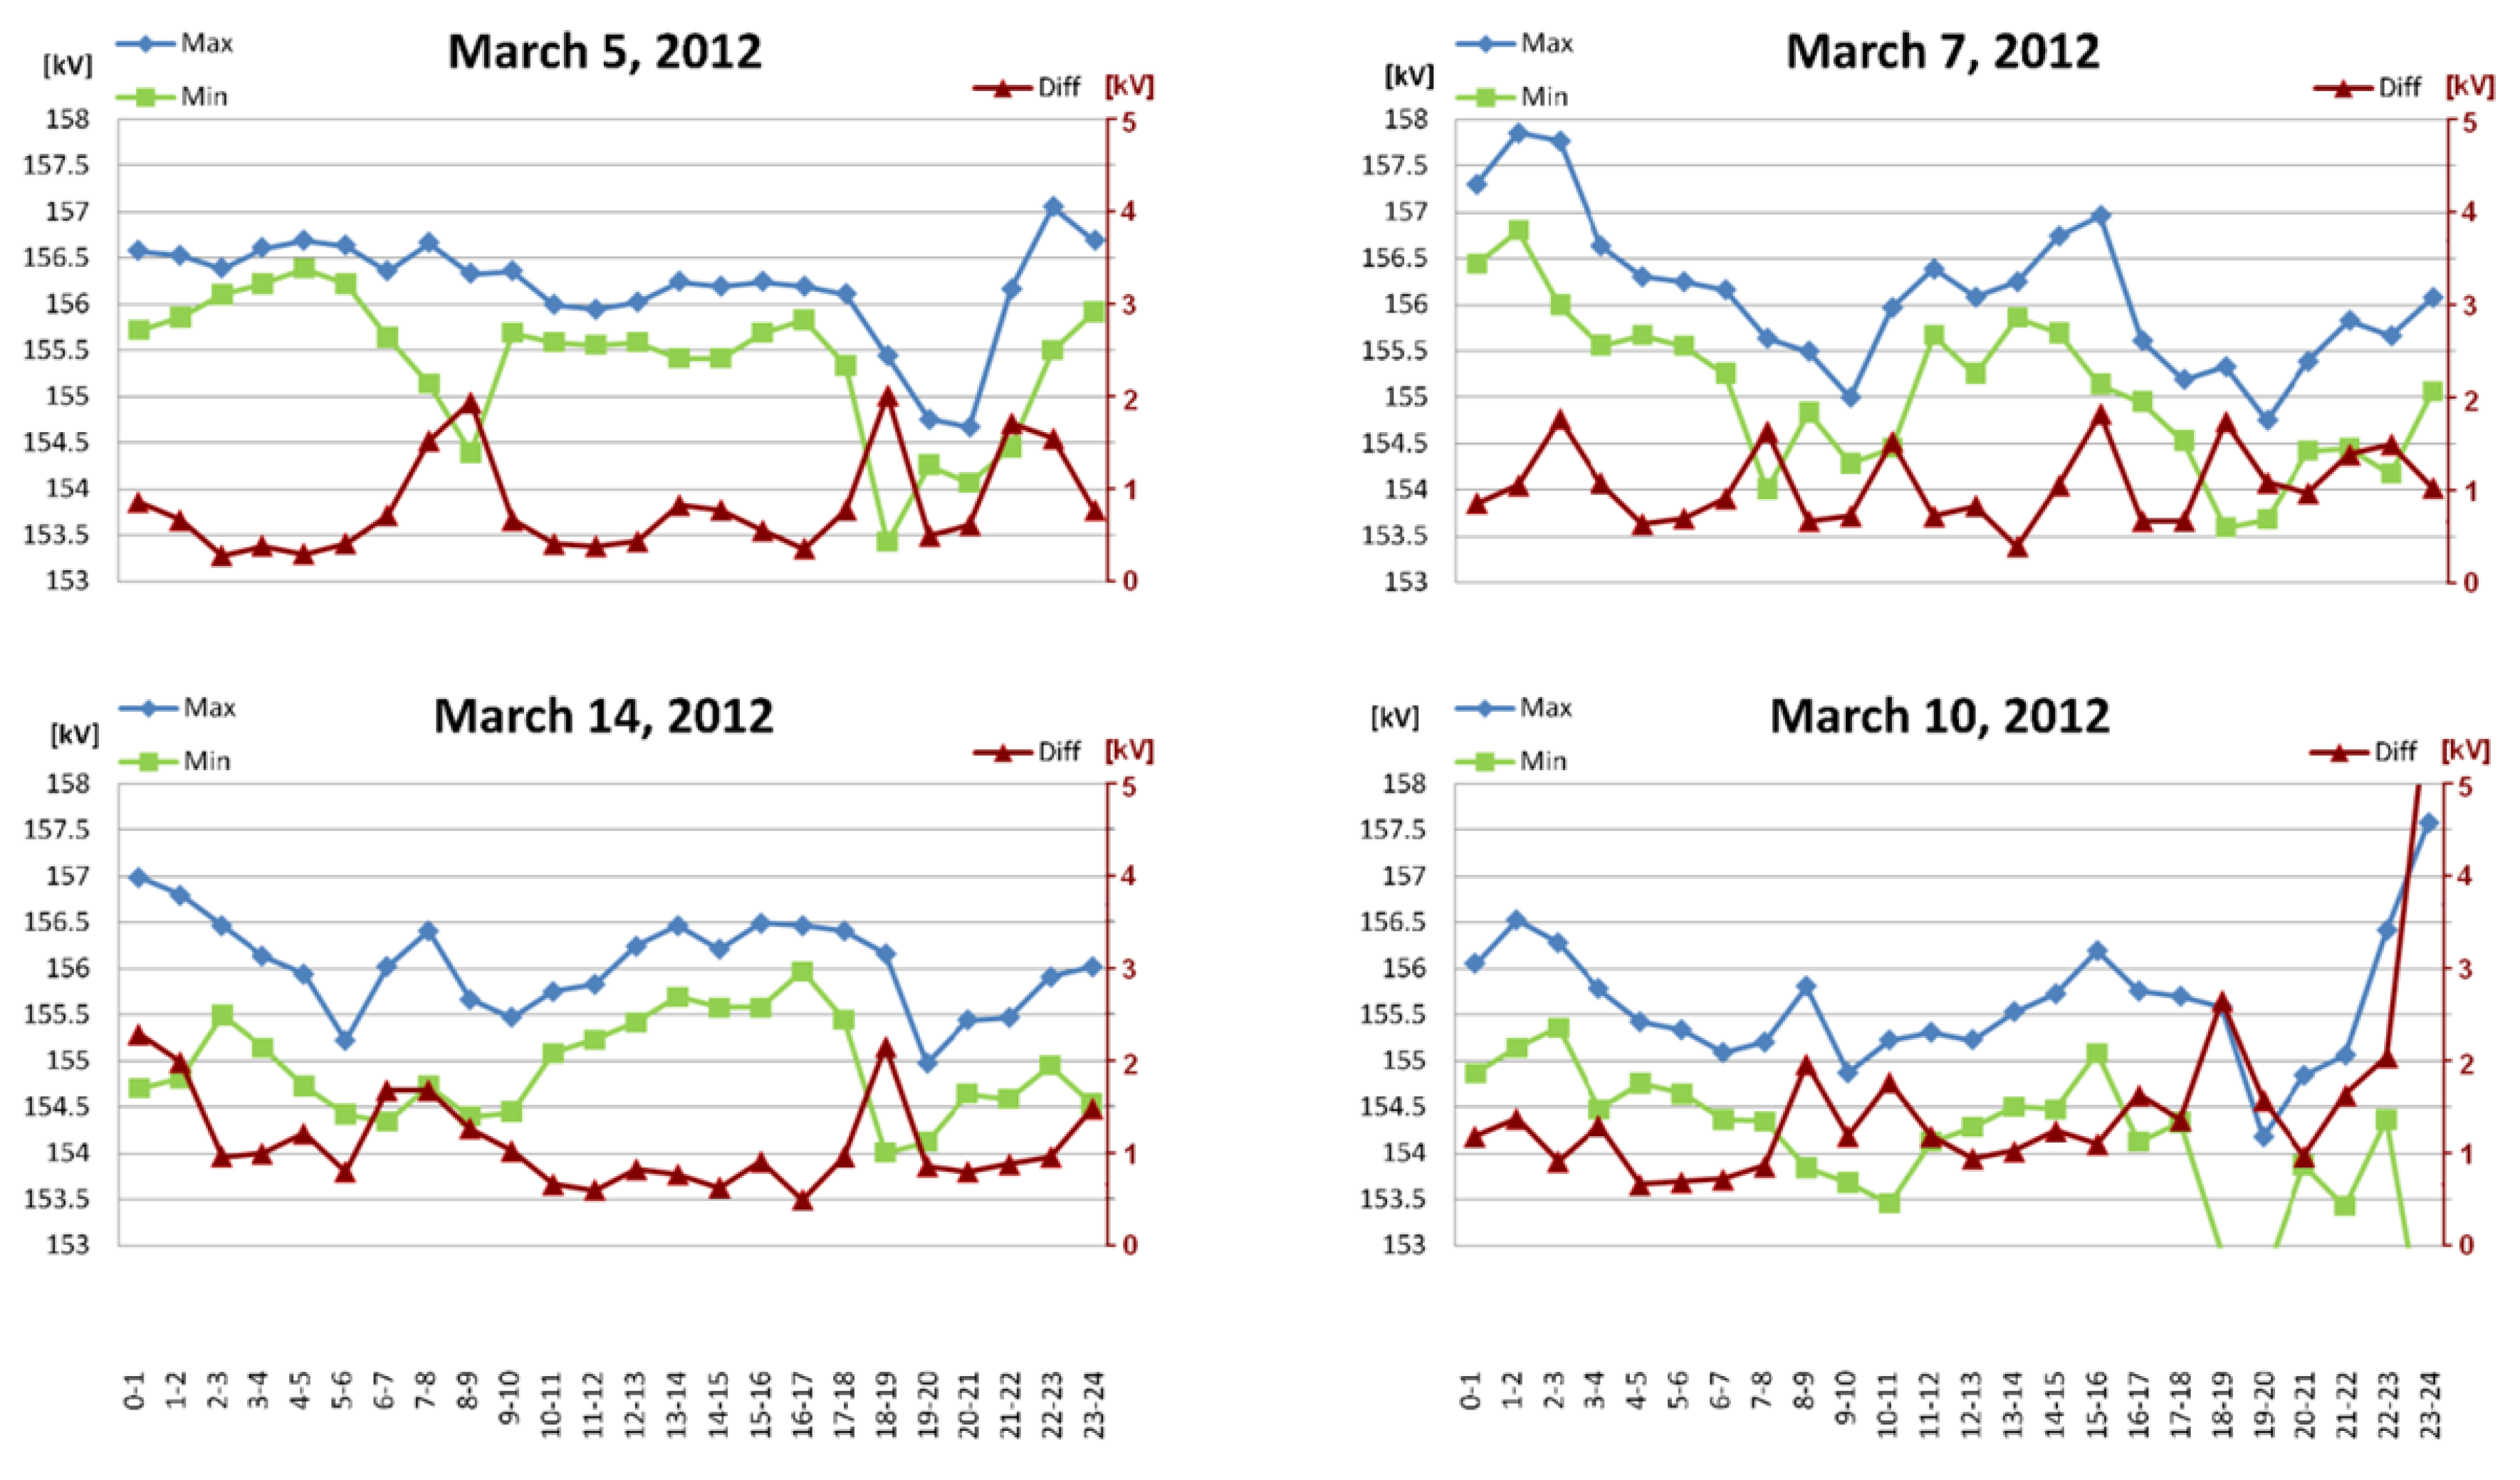
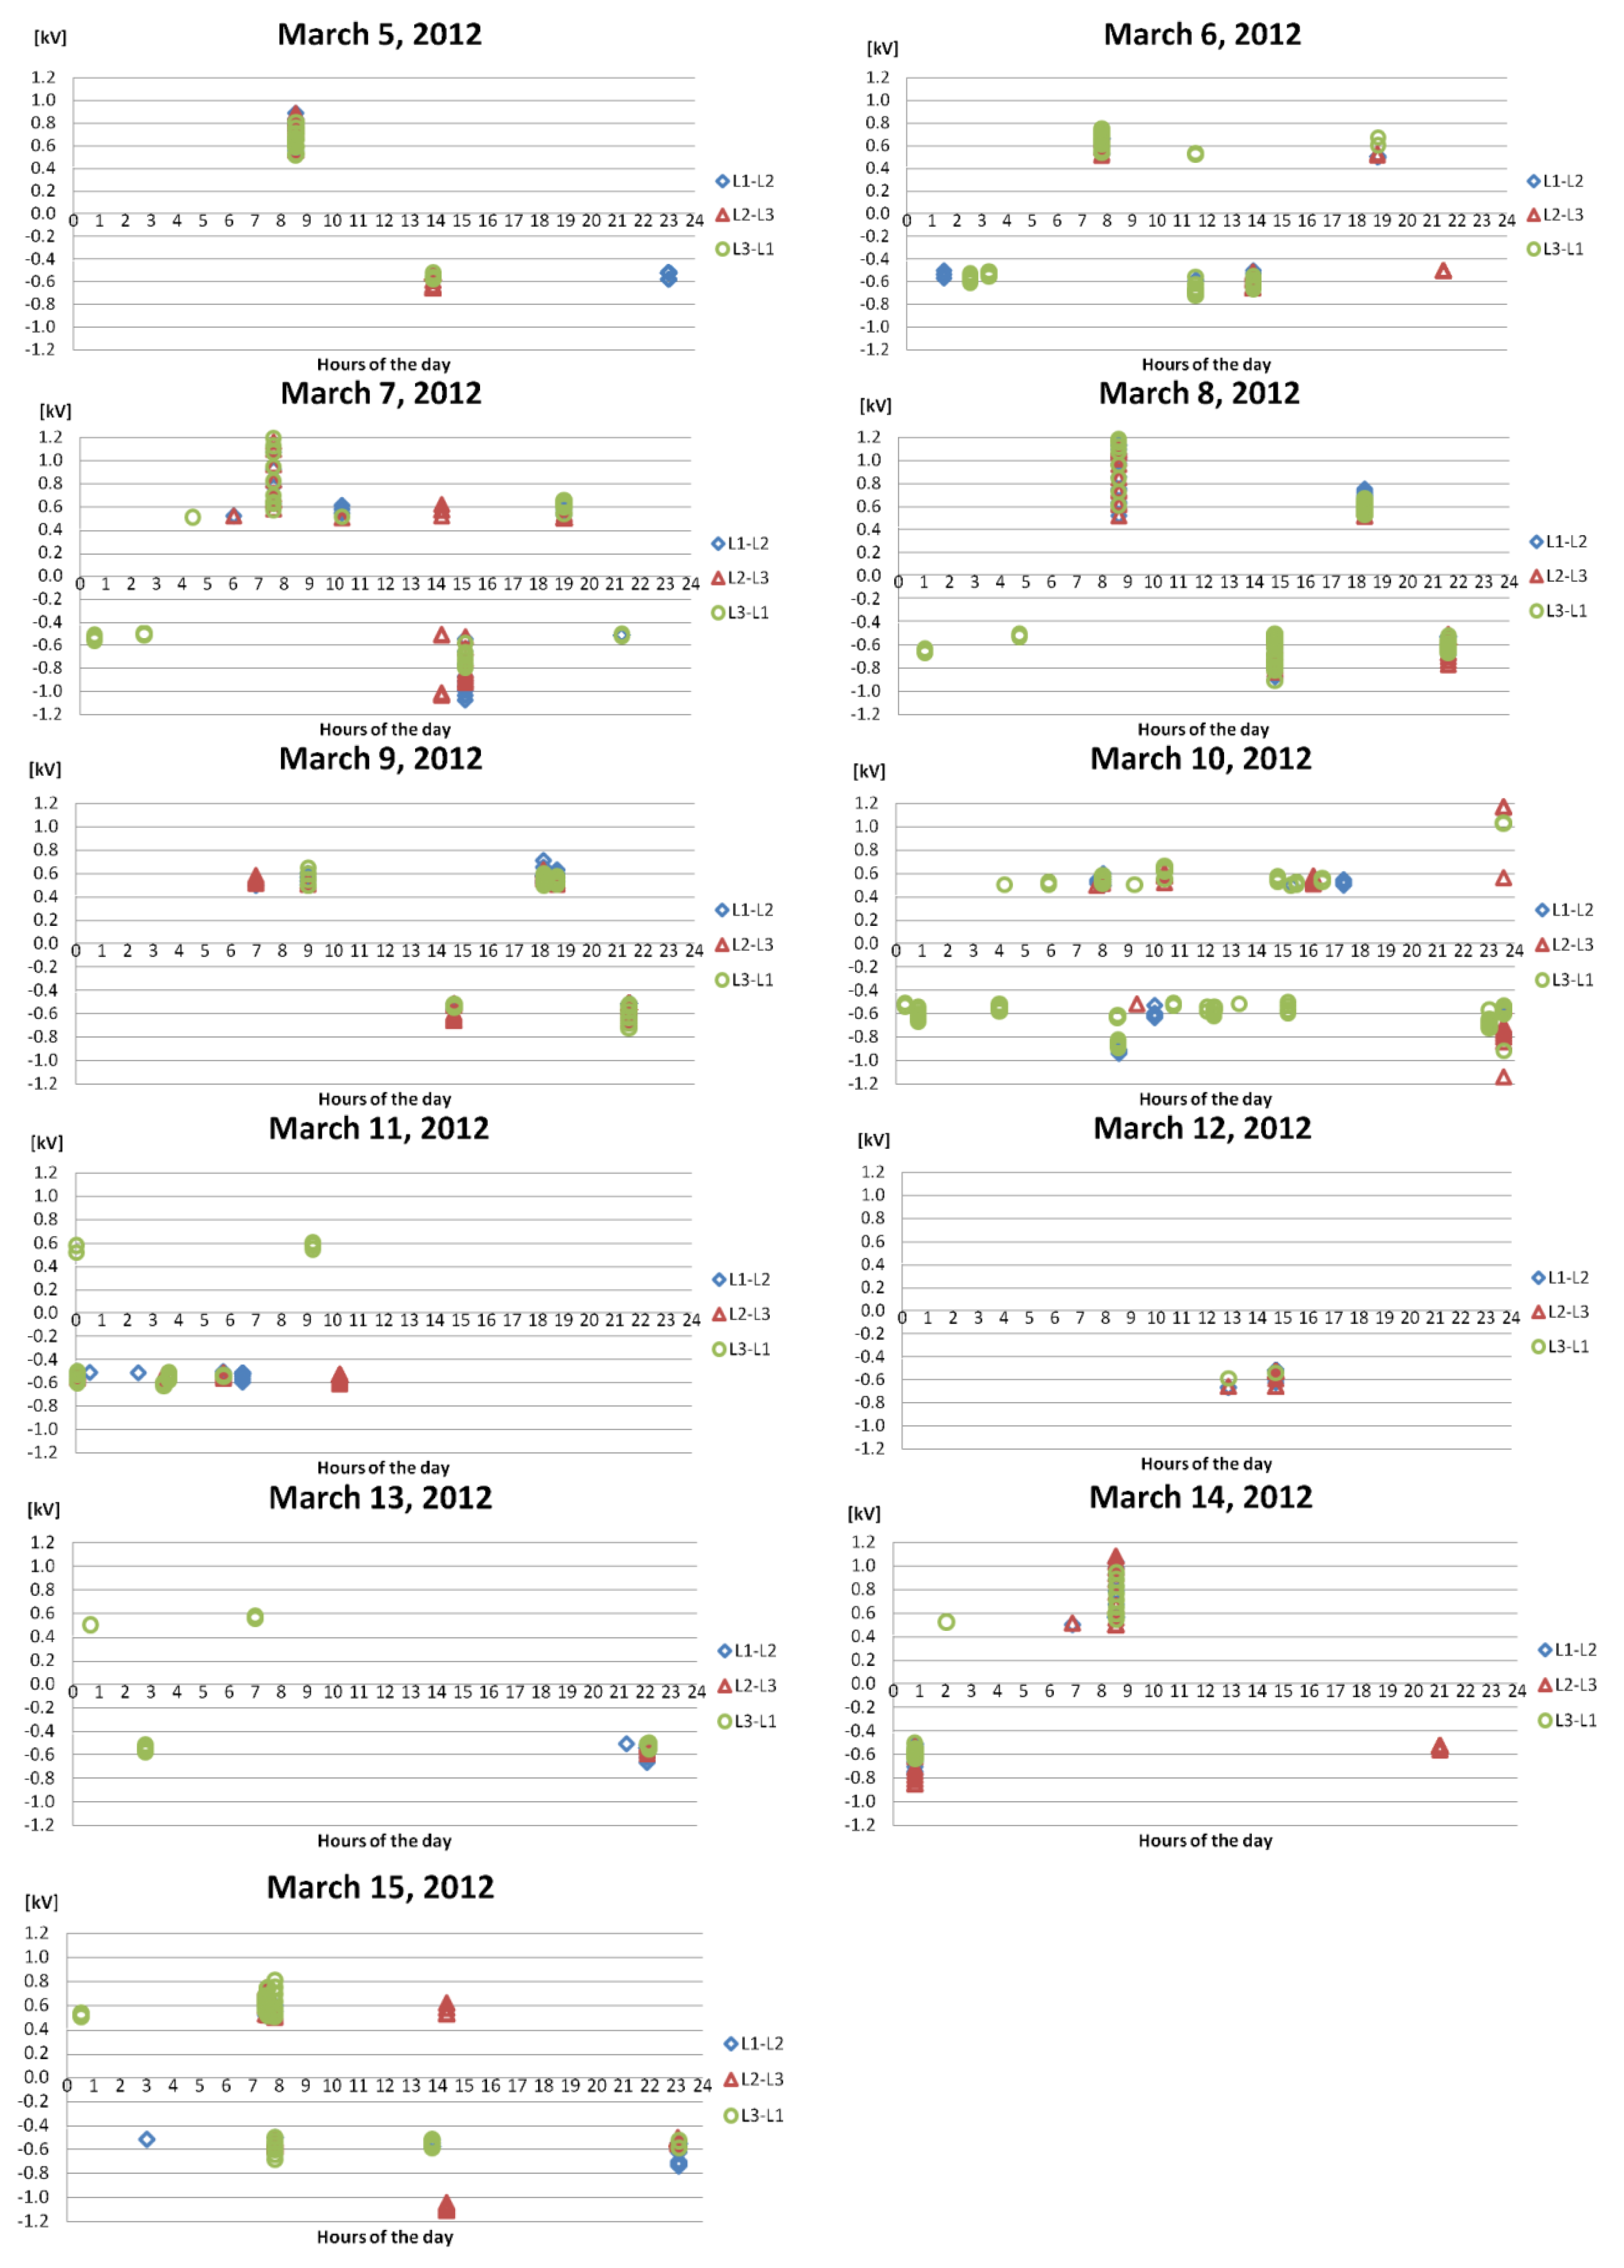
Many more sudden voltage disturbances occurred in the electric grid in Thrace on March 10 than on March 9 indicating a preference for the recovery phase of the storm (Figure 12 and Figure 13).In the following we will refer to the above conclusions 1 - 12 as Points #1 -12.
4.1. March 2012 space weather and atmospheric extremes in Thrace, Greece,
4.2. Sudden Voltage Changes on the electric power grid in Thrace, Greece, in March 2012
5. Conclusions
Author Contributions
Funding
Acknowledgments
Conflicts of Interest
Appendix A
Appendix B
| Date | # Sudden Voltage Change Events Nsvc |
Maximum Surges Creation (kV) |
Maximum Voltage Drop (kV) |
|---|---|---|---|
| 5/3/2012 | 7 | 0.89 | -0.66 |
| 6/3/2012 | 22 | 0.75 | -0.73 |
| 7/3/2012 | 22 | 1.47 | -1.08 |
| 8/3/2012 | 25 | 1.19 | -0.91 |
| 9/3/2012 | 24 | 0.71 | -0.72 |
| 10/3/2012 | 37 | 3.61 | -3.32 |
| 11/3/2012 | 16 | 0.61 | -0.63 |
| 12/3/2012 | 6 | 0.00 | -0.67 |
| 13/3/2012 | 9 | 0.58 | -0.67 |
| 14/3/2012 | 12 | 1.08 | -0.85 |
| 15/3/2012 | 23 | 0.80 | -1.11 |
Appendix C
Appendix D
References
- Shindell, D.T.; Schmidt, G.A.; Mann, M.E.; Rind, D.; Waple, A. Solar Forcing of Regional Climate Change during the Maunder Minimum. Science 2001, 294, 2149–2152. [Google Scholar] [CrossRef] [PubMed]
- Easterbrook, D. The Solar Magnetic Cause of Climate Changes and Origin of the Ice Ages; 3rd ed. Independently Publisher: Washington, DC, USA, 2019.
- Avakyan, S.V.; Voronin, N.A.; Nikol’sky, G.A. Response of Atmospheric Pressure and Air Temperature to the Solar Events in October 2003. Geomagn. Aeron. 2015, 55, 1180–1185. [Google Scholar] [CrossRef]
- Anagnostopoulos, G.C.; Menesidou, S.-A.I.; Efthymiadis, D.A. The March 2012 HeatWave in Northeast America as a Possible Effect of Strong Solar Activity and Unusual Space Plasma Interactions. MDPI Atmosphere. 2022, 13, 6, 926. [Google Scholar] [CrossRef]
- Coumou, D.; Rahmstorf, S. A Decade of Weather Extremes. Nat. Clim. Chang. 2012, 2, 491–496. [Google Scholar] [CrossRef]
- Robine, J.-M.; Cheung, S.L.K.; Roy, S.L.; Oyen, H.V.; Griffiths, C.; Michel, J.-P.; Herrmann, F.R. Death Toll Exceeded 70,000 in Europe during the Summer of 2003. Comptes Rendus Biol. 2008, 331, 171–178. [Google Scholar] [CrossRef] [PubMed]
- CarbonBrief, Attributing Extreme Weather to Climate Change. Available online: https://www.carbonbrief.org/mapped-howclimate-change-affects-extreme-weather-around-the-world (accessed on 1 March 2022).
- Dole, R.; Hoerling, M.; Perlwitz, J.; Eischeid, J.; Pegion, P.; Zhang, T.; Quan, X.-W.; Xu, T.; Murray, D. Was There a Basis for Anticipating the 2010 Russian HeatWave? Geophys. Res. Lett. 2011, 38, L06702. [Google Scholar] [CrossRef]
- Kumar, A.S.; Chen, M.; Hoerling, M.; Eischeid, J. Do Extreme Climate Events Require Extreme Forcings. Geophys. Res. Lett. 2013, 40, 3440–3445. [Google Scholar] [CrossRef]
- Love, J.; Hayakawa, H.; Cliver, E. On the Intensity of the Magnetic Superstorm of September 1909. Space Weather. 2019, 17, 37–45. [Google Scholar] [CrossRef]
- Connolly, R.; Soon, W.; Connolly, M.; Baliunas, S.; Berglund, J.; Butler, C.J.; Cionco, R.G.; Elias, A.G.; Fedorov, V.M.; Harde, H.; et al. How Much Has the Sun Influenced Northern Hemisphere Temperature Trends? An Ongoing Debate. Res. Astron. Astrophys. 2021, 21, 131. [Google Scholar] [CrossRef]
- Hundhausen, A.J. Coronal Expansion and Solar Wind; Springer-Verlag Berlin Heidelberg New York, 1972.
- Richardson, I.G. Solar wind stream interaction regions throughout the heliosphere. Liv. Rev. Sol. Phys. 2018, 1, 15. [Google Scholar] [CrossRef]
- Patsourakos, S.; Georgoulis, M.K.; Vourlidas, A.; Nindos, A.; Sarris, T.; Anagnostopoulos, G.C.; Anastasiadis, A.; Chintzoglou, G.; Daglis, I.A.; Gontikakis, C.; et al. The major geoeffectiveSolar eruptions of 2012 March 7: Comprehensive Sun-to-Earth analysis. Astrophys. J. 2016, 817, 14. [Google Scholar] [CrossRef]
- Barnes, A. Solar-Terrestrial Physics: Principles and Theoretical Foundations; edited by R.L. Carovillano, and J.M. Forbes (D. Reidel Publishing Company, Dordrecht, 1983), 155-199.
- Kumar, A.; Badruddin, B. Study of the evolution of the geomagnetic disturbances during the passage of high-speed streams from coronal holes in solar cycle 2009-2016. Astrophys. and Space Sci. 2021, 366(2). [Google Scholar] [CrossRef]
- Abdu, M. A.; de Souza, J. R.; Sobral, J. H. A.; Batista, I. S. Magnetic Storms Associated Disturbance Dynamo Effects in the Low and Equatorial Latitude Ionosphere. Geophys. Res. Ser. 2006, 167, Recurrent Magnetic Streams, Washington, DC, AGU 2006, 283–304. [CrossRef]
- Prikryl, P.; Ghoddousi-Fard, R.; Thomas, E.G.; Ruohoniemi, J.M.; Shepherd, S.G.; Jayachandran, P.T.; Danskin, D.W.; Spanswick, E.; Zhang, Y.; Jiao, Y.; Morton, Y.T. GPS phase scintillation at high latitudes during geomagnetic storms of 7–17 March 2012 – Part 1: The North American sector. Ann. Geophys. 2015, 33, 637–656. [Google Scholar] [CrossRef]
- Gray, L.J.; Beer, J.; Geller, M.; Haigh, J.D.; Lockwood, M.; Matthes, K.; Cubasch, U.; Fleitmann, D.; Harrison, G.; Hood, L.; et al. Solar Influence on Climate. Rev. Geophys. 2010, 48, RG4001. [Google Scholar] [CrossRef]
- Herman, J.R.; Goldberg, R.A. Sun Weather and Climate; Dover Pub Inc., New York, 1978.
- Anagnostopoulos, G.C.; Spyroglou, I.; Rigas, A.; Preka-Papadema, P.; Mavromichalaki, H.; Kiosses, I. The sun as a significant agent provoking earthquakes. European Phys. J. Special Topics. 2021, 230, 287–333. [Google Scholar] [CrossRef]
- Anagnostopoulos, G.C.; Papandreou, A. Space conditions during a month of a sequence of six M > 6.8 earthquakes ending with the tsunami of 26 December 2004. Nat. Hazards Earth Syst. Sci. 2012, 12, 1551–1559. [Google Scholar] [CrossRef]
- Duma, G.; Ruzhin, Y. Diurnal changes of earthquake activity and geomagnetic Sq-variations. Nat. Hazards Earth Syst. Sci. 2003, 3, 171–177. [Google Scholar] [CrossRef]
- Zenchenko, T.A.; Breus, T.K. The Possible Effect of Space Weather Factors on Various Physiological Systems of the Human Organism. Atmosphere. 2021, 12, 346. [Google Scholar] [CrossRef]
- Vencloviene, J.; Babarskiene, R.; Slapikas, R. The association between solar particle events, geomagnetic storms, and hospital admissions for myocardial infarction. Nat. Hazards. 2013, 65, 1–12. [Google Scholar] [CrossRef]
- Noula, M.; Preka-Papadema, P.; Moussas, X.; Vassiliou, Ch.; Tsaliki, S.-M.; Kontogeorgou, E.; Katsavrias, Ch.; Theodoropoulou, A. Recorded Cases at the Emergency Department of the General Hospital of Lamia Town during the Year 2005 in Association with Helio-geomagnetic Activity. Hellenic J. of Nursing Sci. 2010, 3, 53–62. [Google Scholar]
- Palmer, S.J.; Rycroft, M.J.; Cermack, M. Solar and geomagnetic activity, extremely low frequency magnetic and electric fields and human health at the Earth’s surface. Surveys in Geophysics. 2006, 27, 557–595. [Google Scholar] [CrossRef]
- Lanzerotti, L.J. Space Weather: Historical and Contemporary Perspectives. Space Sci Rev. 2017, 212, 1253–1270. [Google Scholar] [CrossRef]
- Marhavilas, P.K. The Space Environment and its Impact on Human Activity. CSEG RECORDER. Canadian Soc. of Explor. Geophys. 2004, 41–50. [Google Scholar]
- Kirkham, H.; Makarov, Y.V.; Dagle, J.E.; DeSteese, J.G.; Elizondo, M.A.; Diao, R. Geomagnetic Storms and Long-Term Impacts on Power Systems. Pacific Northwest National Laboratory, Richland, Washington 99352, 2011. [CrossRef]
- Labitzke, K.; Kunze, M.; Brönnimann, S. Sunspots, the QBO and the Stratosphere in the North Polar Region 20 Years Later. Meteorol. Z. 2006, 15, 355–363. [Google Scholar] [CrossRef] [PubMed]
- Raspopov, O.; Veretenenko, S. Solar Activity and Cosmic Rays: Influence on Cloudiness and Processes in the Lower Atmosphere (in Memory and on the 75th Anniversary of M.I. Pudovkin). Geomagnet. and Aeronomy. 2009, 49, 137–145. [Google Scholar] [CrossRef]
- Schuurmans, C.J.E. Tropospheric Effects of Variable Solar Activity. Sol. Phys. 1981, 74, 417–419. [Google Scholar] [CrossRef]
- Pudovkin, M.I. Influence of Solar Activity on the Lower Atmosphere State. Int. J. Geomagn. Aeron. 2004, 5, GI2007. [Google Scholar] [CrossRef]
- Siingh, D.; Singh, R.P.; Singh, A.K.; Kulkarni, M.N.; Gautam, A.S.; Singh, A.K. Solar Activity, Lightning and Climate. Surv. Geophys. 2011, 32, 659–703. [Google Scholar] [CrossRef]
- Le Mouël, J.-L.; Lopes, F.; Courtillot, V.A. Solar Signature in Many Climate Indices. J. Geophys. Res. Atmos. 2019, 124, 2600–2619. [Google Scholar] [CrossRef]
- Kossobokov, V.; Mouël, J.L.; Courtillot, V. On the Diversity of Long-Term Temperature Responses to Varying Levels of Solar Activity at Ten European Observatories. Atmosph. and Climate Sci. 2019, 9, 498–526. [Google Scholar] [CrossRef]
- Pudovkin, M.I.; Raspopov, O.M. A mechanism of solar activity influence on the state of the lower atmosphere and meteoparameters. Geomagn. Aeron. 1992, 32, 1–9. [Google Scholar]
- Pudovkin, M.I.; Babushkina, S.V. Influence of Solar Flares and Disturbances of the Interplanetary Medium on the Atmospheric Circulation. J. Atmos. Terr. Phys. 1992, 54, 841–846. [Google Scholar] [CrossRef]
- Smirnov, S.E.; Mikhailova, G.A.; Kapustina, O.V. Variations in Electric and Meteorological Parameters in the Near-Earth’s Atmosphere at Kamchatka during the Solar Events in October 2003. Geomagn. Aeron. 2014, 54, 240–247. [Google Scholar] [CrossRef]
- Mironova, I.A.; Usoskin, I.G. Possible Effect of Strong Solar Energetic Particle Events on Polar Stratospheric Aerosol: A Summary of Observational Results. Environ. Res. Lett. 2014, 9, 015002. [Google Scholar] [CrossRef]
- Tinsley, B.A.; Deen, G.W. Apparent Tropospheric Response to MeV-GeV Particle Flux Variations: A Connection via Electrofreezing of Supercooled Water in High-Level Clouds? J. Geophys. Res. 1991, 96, 22283–22296. [Google Scholar] [CrossRef]
- Marsh, N.; Svensmark, H. Cosmic Rays, Clouds, and Climate. Space Sci. Rev. 2000, 94, 215–230. [Google Scholar] [CrossRef]
- Roldugin, V.; Tinsley, B.A. Atmospheric Transparency Changes Associated with SolarWind-Induced Atmospheric Electricity Variations. J. Atmos. Sol.-Terr. Phys. 2004, 66, 1143–1149. [Google Scholar] [CrossRef]
- Bazilevskaya, G.A.; Usoskin, I.G.; Flückiger, E.O.; Harrison, R.G.; Desorgher, L.; Bütikofer, R.; Krainev, M.B.; Makhmutov, V.S.; Stozhkov, Y.I.; Svirzhevskaya, A.K.; Svirzhevsky, N.S.; Kovaltsov, G.A. Cosmic Ray Induced Ion Production in the Atmosphere. Space Sci. Rev. 2008, 137, 149–173. [Google Scholar] [CrossRef]
- Boteler, D.H. Space Weather Effects on Power Systems. Space Weather Geophys. Monogr. Ser. 2001, 125, edited by P. Song, H. J. Singer, and G. L. Siscoe, 347–352, AGU, Washington, D.C.
- Kappenman, J. Geomagnetic Storms and Their Impacts on the U.S. Power Grid. Metatech Corporation, Goleta, Calif 93117, January 2010. Available online: http://web.ornl.gov/sci/ees/etsd/pes/pubs/ferc_Meta-R-319.pdf (accessed on 26 July 2015).
- Kappenman, J.G.nThe Evolving Vulnerability of Electric Power Grids, Space Weather. 2004, 2, 1. [CrossRef]
- Kappenman, J.G.; Albertson, V.D. Bracing for the geomagnetic storms. IEEE Spectrum 1990, 27, 27–33. [Google Scholar] [CrossRef]
- Kappenman, J.G. Advanced geomagnetic storm forecasting for the electric power industry. Space Weather, Geophys. Monogr. Ser. 125, edited by P. Song, H. J. Singer, and G. L. Siscoe, 353–358, AGU, Washington, D.C., 2001. [CrossRef]
- Thomson, A. Space weather and power grids. Earthwise 2010, 26, British Geological Survey, NERC, https://geomag.bgs.ac.uk/documents/Earthwise_26_powergrids.pdf.
- Liu, J.; Wang, C.B.; Liu, L.; Sun, W.-H. The response of local power grid at low-latitude to geomagnetic storm: An application of the Hilbert Huang transform. Space Weather. 2016, 14, 300–312. [Google Scholar] [CrossRef]
- Nicoll, K.A. Space weather influences on atmospheric electricity. Weather 2014, 69, 238–241, ISSN 1477-8696. [Google Scholar] [CrossRef]
- American Meteorological Society, Glossary of Meteorology, https://glossary.ametsoc.org/wiki/Atmospheric_electric_field.
- Bennett, A.J.; Harrison, R.G. Variability in surface atmospheric electric field measurements. J. Phys.: Conf. Ser. 2008, 142 012046. [CrossRef]
- Li, L.; Chen, T.; Ti, S.; Wang, S.-H.; Song, J.-J.; Cai, C.-L.; Liu, Y.-H.; Li, W.; Luo, J. Fair-Weather Near-Surface Atmospheric Electric Field Measurements at the Zhongshan Chinese Station in Antarctica. Appl. Sci. 2022, 12, 9248. [Google Scholar] [CrossRef]
- Troshichev, O.A.; Frank-Kamenetsky, A.; Burns, G.; Fuellekrug, M.; Rodger, A.; Morozov, V. The relationship between variations of the atmospheric electric field in the southern polar region and thunderstorm activity. Adv. Space Res. 2004, 34, 1801–1805. [Google Scholar] [CrossRef]
- Whipple, F.J.W. Modern views on atmospheric electricity. Q.J. R. Meteorol. Soc. 2007, 64, 199–222. [Google Scholar] [CrossRef]
- Liu, C.; Williams, E.R.; Zipser, E.J.; Burns, G. Diurnal Variations of Global Thunderstorms and Electrified Shower Clouds and Their Contribution to the Global Electrical Circuit. J. Atmos. Sci. 2010, 67, 309–323. [Google Scholar] [CrossRef]
- Tinsley, B.A.; Burns, G.B.; Zhou, L. The role of the global electric circuit in solar and internal forcing of clouds and climate. Adv. Space Res. 2007, 40, 1126–1139. [Google Scholar] [CrossRef]
- Telang, A.V.R. The influence of rain on the atmospheric-electric field. J. Geophys. Res. 1930, 35, 125–131. [Google Scholar] [CrossRef]
- Yan, M.; Shen, Q.; Zhou, C. Atmospheric electric field at ground in partial region in China. Plateau Meteorol. 1988, 2, 156–165. [Google Scholar]
- Tacza, J.; Raulin, J.P.; Mendonça, R.; Makhmutov, V.; Marun, A.; Fernandez, G. Solar Effects on the Atmospheric Electric Field During 2010–2015 at Low Latitudes. J. Geophys. Res. Atmos. 2018, 123, 11–970. [Google Scholar] [CrossRef]
- Zhang, H.; Zhang, Y.; Yang, S. Characteristics of atmospheric electric field in Taiyuan and its relationship with atmospheric pollutants. Environ. Sci. Technol. 2013, 36, 66–69. [Google Scholar]
- Li, J.; Chen, X.; Cheng, Y.; Li, R.; Dong, F. Preliminary Study on the Relationship between Atmospheric Electric Field and Air Pollutants in Beijing. Plateau Weather. 2021, 40, 209–218. [Google Scholar]
- Huang, Y.; Wu, A.; Zhang, S. Influence of environmental features on the atmospheric electric field and correction. Electron. Meas. Technol. 2018, 41, 35–38. [Google Scholar]
- Gurmani, S.F.; Ahmad, N.; Tacza, J.; Iqbal, T. First seasonal and annual variations of atmospheric electric field at a subtropical station in Islamabad, Pakistan. J. Atmos. Sol.-Terr. Phys. 2018, 179, 441–449. [Google Scholar] [CrossRef]
- Zhou, Y.; Chen, C.P.; Liu, L.P.; Chu, R.Z.; Feng, J.M.; Zhang, T.; Song, X.M.; Kajikawa, M.; Fujii, H.Y.; Aoi, T.; et al. Atmospheric electric field in hail weather system in Naqu area of Qinghai-Tibet Plateau. Plateau Weather. 2000, 3, 339–347. [Google Scholar]
- Zhang, Y.; Meng, Q. Atmospheric Electricity Characteristics in the Eastern Qinghai-Tibet Plateau. Plateau Weather. 1998, 17, 135–141. [Google Scholar]
- Yan, M.; Xiao, Q. Analysis of the characteristics of the atmospheric electric field in the western Pacific Ocean from September to November in 1988. Plateau Weather. 1990, 9, 395–404. [Google Scholar]
- Choudhury, A.; Guha, A.; De, B.K.; Roy, R. A statistical study on precursory effects of earthquakes observed through the atmospheric vertical electric field in northeast India. Ann. Geophys. 2013, 56, R0331. [Google Scholar] [CrossRef]
- Smirnov, S. Association of the negative anomalies of the quasistatic electric field in atmosphere with Kamchatka seismicity. Nat. Hazards Earth Syst. Sci. 2008, 8, 745–749. [Google Scholar] [CrossRef]
- Chen, T.; Zhang, X.X.; Zhang, X.M.; Jin, X.B.; Wu, H.; Ti, S.; Li, R.K.; Li, L.; Wang, S.H. Imminent estimation of earthquake hazard by regional network monitoring the near surface vertical atmospheric electrostatic field. Chin. J. Geophys. 2021, 64, 1145–1154. [Google Scholar] [CrossRef]
- Pulinets, S.; Boyarchuk, K. Ionospheric Precursors of Earthquakes. Springer, ISBN3-540-20839-9, 2004.
- Kleimenova, N.G.; Gromova, L.I.; Gromov, S.V.; Malysheva, L.M. Large Magnetic Storm on September 7–8, 2017: High-Latitude Geomagnetic Variations and Geomagnetic Pc5 Pulsations. Geomagn. Aeron. 2018, 58, 597–606. [Google Scholar] [CrossRef]
- Michnowski, S.; Odzimek, A.; Kleimenova, N.G.; Kozyreva, O.V.; Kubicki, M.; Klos, Z.; Israelsson, S.; Nikiforova, N.N. Review of Relationships Between Solar Wind and Ground-Level Atmospheric Electricity: Case Studies from Hornsund, Spitsbergen, and Swider, Poland. Surv. Geophys. 2021, 42, 757–801. [Google Scholar] [CrossRef]
- Pesnell, W.D.; Thompson, B.J.; Chamberlin, P.C. The Solar Dynamics Observatory (SDO). Sol. Phys. 2012, 275, 3–15. [Google Scholar] [CrossRef]
- Stone, E.C.; Burlaga, L.F.; Cummings, A.C.; Feldman, W.C.; Frain, W.E.; Geiss, J.; Gloeckler, G.; Gold, R.E.; Hovestadt, D.; Krimigis, S.M.; Mason, G.M.; McComas, D.; Mewaldt, R.A.; Simpson, J.A.; von Rosenvinge, T.T.; Wiedenbeck, M. The Advanced Composition Explorer. AIP Conf. Proc. 1990, 203, 48–57. [Google Scholar]
- EOS, NASA’ Earth Observing System, Terra, https://eospso.nasa.gov/missions/terra. (29.11. 2023).
- NASA, Aqua Project Science, https://aqua.nasa.gov/content/about-aqua (29.11. 2023).
- NASA, MODIS (Moderate Resolution Imaging Spectroradiometer). https://modis.gsfc.nasa.gov/(30.11.2023).
- NS ENERGY, Komotini Combined-Cycle Power Plant, https://www.nsenergybusiness.com/projects/komotini-combined-cycle-power-plant/# (30.11.2023).
- World Data Center for Geomagnetism, Geomagnetic Equatorial Dst index Home Page, Kyoto, https://wdc.kugi.kyoto-u.ac.jp/dstdir/ (30.11.2023).
- Tsurutani, B.T.; Echer, E.; Shibata, K.; Verkhoglyadova, O.P.; Mannucci, A.J.; Gonzalez, W.D.; Kozyra, J.; Pätzold, M. The Interplanetary Causes of Geomagnetic Activity during the 7–17 March 2012 Interval: A Cawses II overview. J. Space Weather Space Clim. 2014, 4, 8. [Google Scholar] [CrossRef]
- Maragkakis, M.G.; Anagnostopoulos, G.C.; Vassiliadis, E.S. Upstream Ion Events with Hard Energy Spectra: Lessons for Their Origin from a Comparative Statistical Study (ACE/Geotail). Planet. Space Sci. 2013, 85, 1–12. [Google Scholar] [CrossRef]
- Kühl, P.; Dresing, N.; Heber, B.; Klassen, A. Solar Energetic Particle Events with Protons Above 500 MeV Between 1995 and 2015 Measured with SOHO/EPHIN. Sol. Phys. 2017, 292, 10. [Google Scholar] [CrossRef]
- Papaioannou, A.; Souvatzoglou, G.; Paschalis, P.; Gerontidou, M.; Mavromichalaki, H. The First Ground-Level Enhancement of Solar Cycle 24 on 17 May 2012 and Its Real-Time Detection. Sol. Phys. 2014, 289, 423–436. [Google Scholar] [CrossRef]
- Gurnett, D.A.; Kurth, W.S.; Burlaga, L.F.; Ness, N.F. In Situ Observations of Interstellar Plasma with Voyager 1. Science. 2013, 341, 1489–1492. [Google Scholar] [CrossRef]
- Zeitlin, C.; Hassler, D.M.; Cucinotta, F.A.; Ehresmann, B.; Wimmer-Schweingruber, R.F.; Brinza, D.E.; Kang, S.; Weigle, G.; Böttcher, S.; Böhm, E.; Burmeister, S.; Guo, J.; Köhler, J.; Martin, C.; Posner, A.; Rafkin, S.; Reitz, G. Measurements of Energetic Particle Radiation in Transit to Mars on the Mars Science Laboratory. Science. 2013, 340, 1080–1084. [Google Scholar] [CrossRef]
- Tsurutani, B.T.; McPherron, R.L.; Gonzalez, W.D.; Lu, G.; Gopalswamy, N.; Guarnieri, F.L. Magnetic Storms Caused by Corotating Solar Wind Streams, in Recurrent Magnetic Storms: Corotating Solar Wind. Geophysical Monographs. AGU 2006, 167. [Google Scholar] [CrossRef]
- Dole, R.; Hoerling, M.; Kumar, A.; Eischeid, J.; Perlwitz, J.; Quan, X.-W.; Kiladis, G.; Webb, R.; Murray, D.; Chen, M.; et al. The making of an extreme event: Putting the Pieces Together. Bull. Am. Meteorol. Soc. 2014, 95, ES57–ES60. [Google Scholar] [CrossRef]
- Hanna, J.; Schultz, D; Irving, A. Cloud-Top Temperatures for Precipitating Winter Clouds. J. Applied Meteor. Climat. 2008, 47(1), 351-359. [CrossRef]
- Kastelis, N.; Kourtidis, K. Characteristics of the atmospheric electric field and correlation with CO2 at a rural site in southern Balkans. Earth Planets and Space. 2016, 68, 3. [Google Scholar] [CrossRef]
- Nicoll, K.; Harrison, R.G.; Bor, J.; Barta, V.; Brugge, R.; Chillingarian, A.; Chum, J.; Georgoulias, A.; Guha, A.; Kourtidis, K.; Kubicki, M.; Mareev, E.; Matthews, J.; Mkrtchyan, H.; Odzimek, A.; Raulin, J.-P.; Robert, D.; Silva, H.G.; Tacza, J.; Yair, Y.; Yaniv, R. A global atmosphereic electricity monitoring network for climate and geophysical research. J. Atmosph. Solar-Terr. Physics 2019, 184, 18–29. [Google Scholar] [CrossRef]
- Mikhailova, G.A.; Kapustina, O.V.; Smirnov, S.E. Effects of solar and geomagnetic activities in variations of power spectra of electrical and meteorological parameters in the near-Earth atmosphere in Kamchatka during October 2003 solar events. Geomagn. Aeron. 2014, 54, 645–654. [Google Scholar] [CrossRef]
- Bazilevskaya, G.A.; Mayorov, A.G.; Mikhailov, V.V. Comparison of Solar Energetic Particle Events Observed by PAMELA Experiment and by Other Instruments in 2006–2012. In Proceedings of the Internat. Cosmic Ray Conf., Rio de Janeiro, Brazil 2013, 33, 1392.
- Woollings, T.; Lockwood, M.; Masato, G.; Bell, C.; Gray, L. Enhanced signature of solar variability in Eurasian winter climate. Geophys. Res. Lett. 2010, 37, L20805. [Google Scholar] [CrossRef]
- Visbeck, M.H.; Hurrell, J.W.; Polvani, L.; Cullens, H.M. The North Atlantic Oscillation: Past, present, and future. Proceedings of the National Academy of Sciences 2001, 98, 12876–12877. [Google Scholar] [CrossRef]
- Marshall, R.A.; Kelly, A.; Van Der Walt, T.; Honecker, A.; Ong, C.; Mikkelsen, D.; Spierings, A.; Ivanovich, G.; Yoshikawa, A. Modeling geomagnetic induced currents in Australian power networks. Space Weather. 2017, 15, 7. [Google Scholar] [CrossRef]
- Cabinet Office; National Risk Register of Civil Emergencies. 2015 [Available at: https://assets.publishing.service.gov.uk/government/uploads/system/uploads/attachment_data/file/419549/20150331_2015-NRR-WA_Final.pdf].
- Divett, T.; Richardson, G.S.; Beggan, C.D.; Rodger, C.J.; Boteler, D.H.; Ingham, M.; MacManus, D.H.; Thomson, A.W.P.; Dalzell, M. Transformer-level modeling of geomagnetically induced currents in New Zealand’s South Island. Space Weather. 2018, 16, 718–735. [Google Scholar] [CrossRef]
- Koen, J.; Gaunt, T. Geomagnetically induced currents in the Southern African electricity transmission. Proc. IEEE Bologna Power Tech. Conf. 2003, 7.
- Gaunt, C.T.; Coetzee, G. Transformer failures in regions incorrectly considered to have low GIC-risk. IEEE Lausanne Power Tech. Proceedings, 2007, Lausanne, Switzerland, 1–5 July 2007, 807–812.
- Torta, J. M.; Marsal, S.; Quintana, M. Assessing the hazard from geomagnetically induced currents to the entire high-voltage power network in Spain. Earth Planets and Space 2014, 66, 1–17. [Google Scholar] [CrossRef]
- Liu, C.M.; Liu, L.G.; Pirjola, R.; Wang, Z.Z. Calculation of geomagnetically induced currents in mid- to low-latitude power grids based on the plane wave method: A prelimi-nary case study. Space Weather 2009, 7, S04005. [Google Scholar] [CrossRef]
- Zheng, K.; Liu, L.G.; Ge, H.Y.; Li, W.X. Comparative study of the GIC amplitudes and characteristics in different power grids in China. CIGRE 2012, C3–206. [Google Scholar]
- Trivedi, N. B.; et al. Geomagnetically induced currents in an electric power transmission system at low latitudes in Brazil: A case study, Space Weather 2007, 5, S04004. [CrossRef]
- Zawawi, A.A.; Ab Aziz, N.F.; AbKadir, M.Z.A.; Hashim, H.; Mohammed, Z. Evaluation of Geomagnetic Induced Current on 275 kV Power Transformer for a Reliable and Sustaina-ble Power System Operation in Malaysia. Sustainability 2020, 12, 9225. [Google Scholar] [CrossRef]
- Caraballo, R.; SánchezBettucci, L.; Tancredi, G. Geomagnetically induced currents in the Uruguayan high-voltage power grid. Geophys. J. International 2013, 195, 844–853. [Google Scholar] [CrossRef]
- Caraballo, R.; González-Esparza, J.A.; Sergeeva, M.; Pacheco, C.R. First GIC estimates for the Mexican power grid. Space Weather 2020, 18, 2. [Google Scholar] [CrossRef]
- Torta, J.M.; Marsal, S.; Quintana, M. Assessing the hazard from geomagnetically induced currents to the entire high-voltage power network in Spain. Earth Planets and Space. 2014, 66(1), 1–17. [Google Scholar] [CrossRef]
- Ribeiro, J.A.; Pinheiro, F.J.G.; Pais, M.A.; Santos, R.; Cardoso, J.; Baltazar-Soares, P.; Monteiro Santos, F.A. Toward more accurate GIC estimations in the Portuguese power network. Space Weather. 2023, 21, e2022SW003397. [Google Scholar] [CrossRef]
- Abraha, G.; Yemane, T.; Kassa, T. Geomagnetic storms and their impacts on Ethiopian power grid. Advances in Astronomy and Space Physics 2020, 10, 55–64. [Google Scholar] [CrossRef]
- Molinski, T.S. Why utilities respect geomagnetically induced currents. J. Atmos. Sol.-Terr. Phys. 2002, 64, 1765. [Google Scholar] [CrossRef]
- Hughes, J.; Mcgranaghan, R.; Kellerman, A.C.; Bortnik, J.; Arrit, R.F.; Venkataramani, K.; Perry, C.H.; McCormick, J.; Ngwira, C.M.; Cohen, M. Revealing novel connections between space weather and the power grid: Net-work analysis of ground-based magnetometer and Geomagnetically Induced Currents (GIC) measurements. Space Weather. 2022, 20, e2021SW002727. [Google Scholar] [CrossRef]
- Gleisner, H.; Thjll, P. Patterns of tropospheric response to solar variability. Geophys. Res. Lett. 2003, 30, 44-1–44-4. [Google Scholar] [CrossRef]
- Gray, G.; Scaife, A.; Mitchell, D.; Osprey, S.; Ineson, I.; Hardiman, S.; Butchart, N.; Knight, J.; Sutton, R.; Kodera, K. A lagged response to the 11 year solar cycle in observed winter Atlantic/European weather patterns. J. Geophys. Res. 2013, 118, 13,405–13,420. [Google Scholar] [CrossRef]
- Echer, S.; Echer, E.; Rigozo, N; Brum, C., Nordeman, D.; Gonzalez, W. The relationship between global, hemispheric and latitudinal averaged air surface temperature (GISS time series) and solar activity, J. of Atmosph. and Solar-Terr. Phys. 2012, 74, 87–93. [CrossRef]
- Maliniemi, V., T. Asikainen, K. Mursula, and A. Seppälä, QBO-dependent relation between electron precipitation and wintertime surface temperature. J. Geophys. Res. Atmos., 2013, 118, 6302–6310. [CrossRef]
- Bober. F.; Lundstedt, H. and Winoft, P. Influence of Solar Activity Cycles on Earth’s Climate. ESA ITT AO/1-4618/NL/AR, 2005.
- Ouzounov, D.; Anagnostopoulos, G.C.; Menesidou, S.-A.I.; Karkanis, A.; Efthymiadis, D.A.; Kampatagis, A.; Marhavilas, P.; Danikas, M. Side of a global weather extreme in March 2012, the heat wave in North-East America and the extreme cold weather in South-East Europe as possible effects of intense solar activity. AGU Meeting, 2022, NH14C-05. https://agu.confex.com/agu/fm22/meetingapp.cgi/Paper/1139675.
Disclaimer/Publisher’s Note: The statements, opinions and data contained in all publications are solely those of the individual author(s) and contributor(s) and not of MDPI and/or the editor(s). MDPI and/or the editor(s) disclaim responsibility for any injury to people or property resulting from any ideas, methods, instructions or products referred to in the content. |
© 2023 by the authors. Licensee MDPI, Basel, Switzerland. This article is an open access article distributed under the terms and conditions of the Creative Commons Attribution (CC BY) license (http://creativecommons.org/licenses/by/4.0/).


