Submitted:
25 December 2023
Posted:
26 December 2023
You are already at the latest version
Abstract
Keywords:
1. Introduction
2. Materials and Methods
2.1. Chemicals and Reagents
2.2. Cells Culture and MTT Assay
2.3. Total RNA Extraction and Quantitative Real-Time PCR
2.4. Experimental Animals
2.5. Establishment of 5-FU-Induced Intestinal Mucositis
2.6. Histopathological Evaluation
2.7. Immunohistochemical Staining
2.8. ELISA Analysis
2.9. Western Blotting Experiments
2.10. Gut Microbiota Analysis
2.11. Data Analysis
3. Reaults
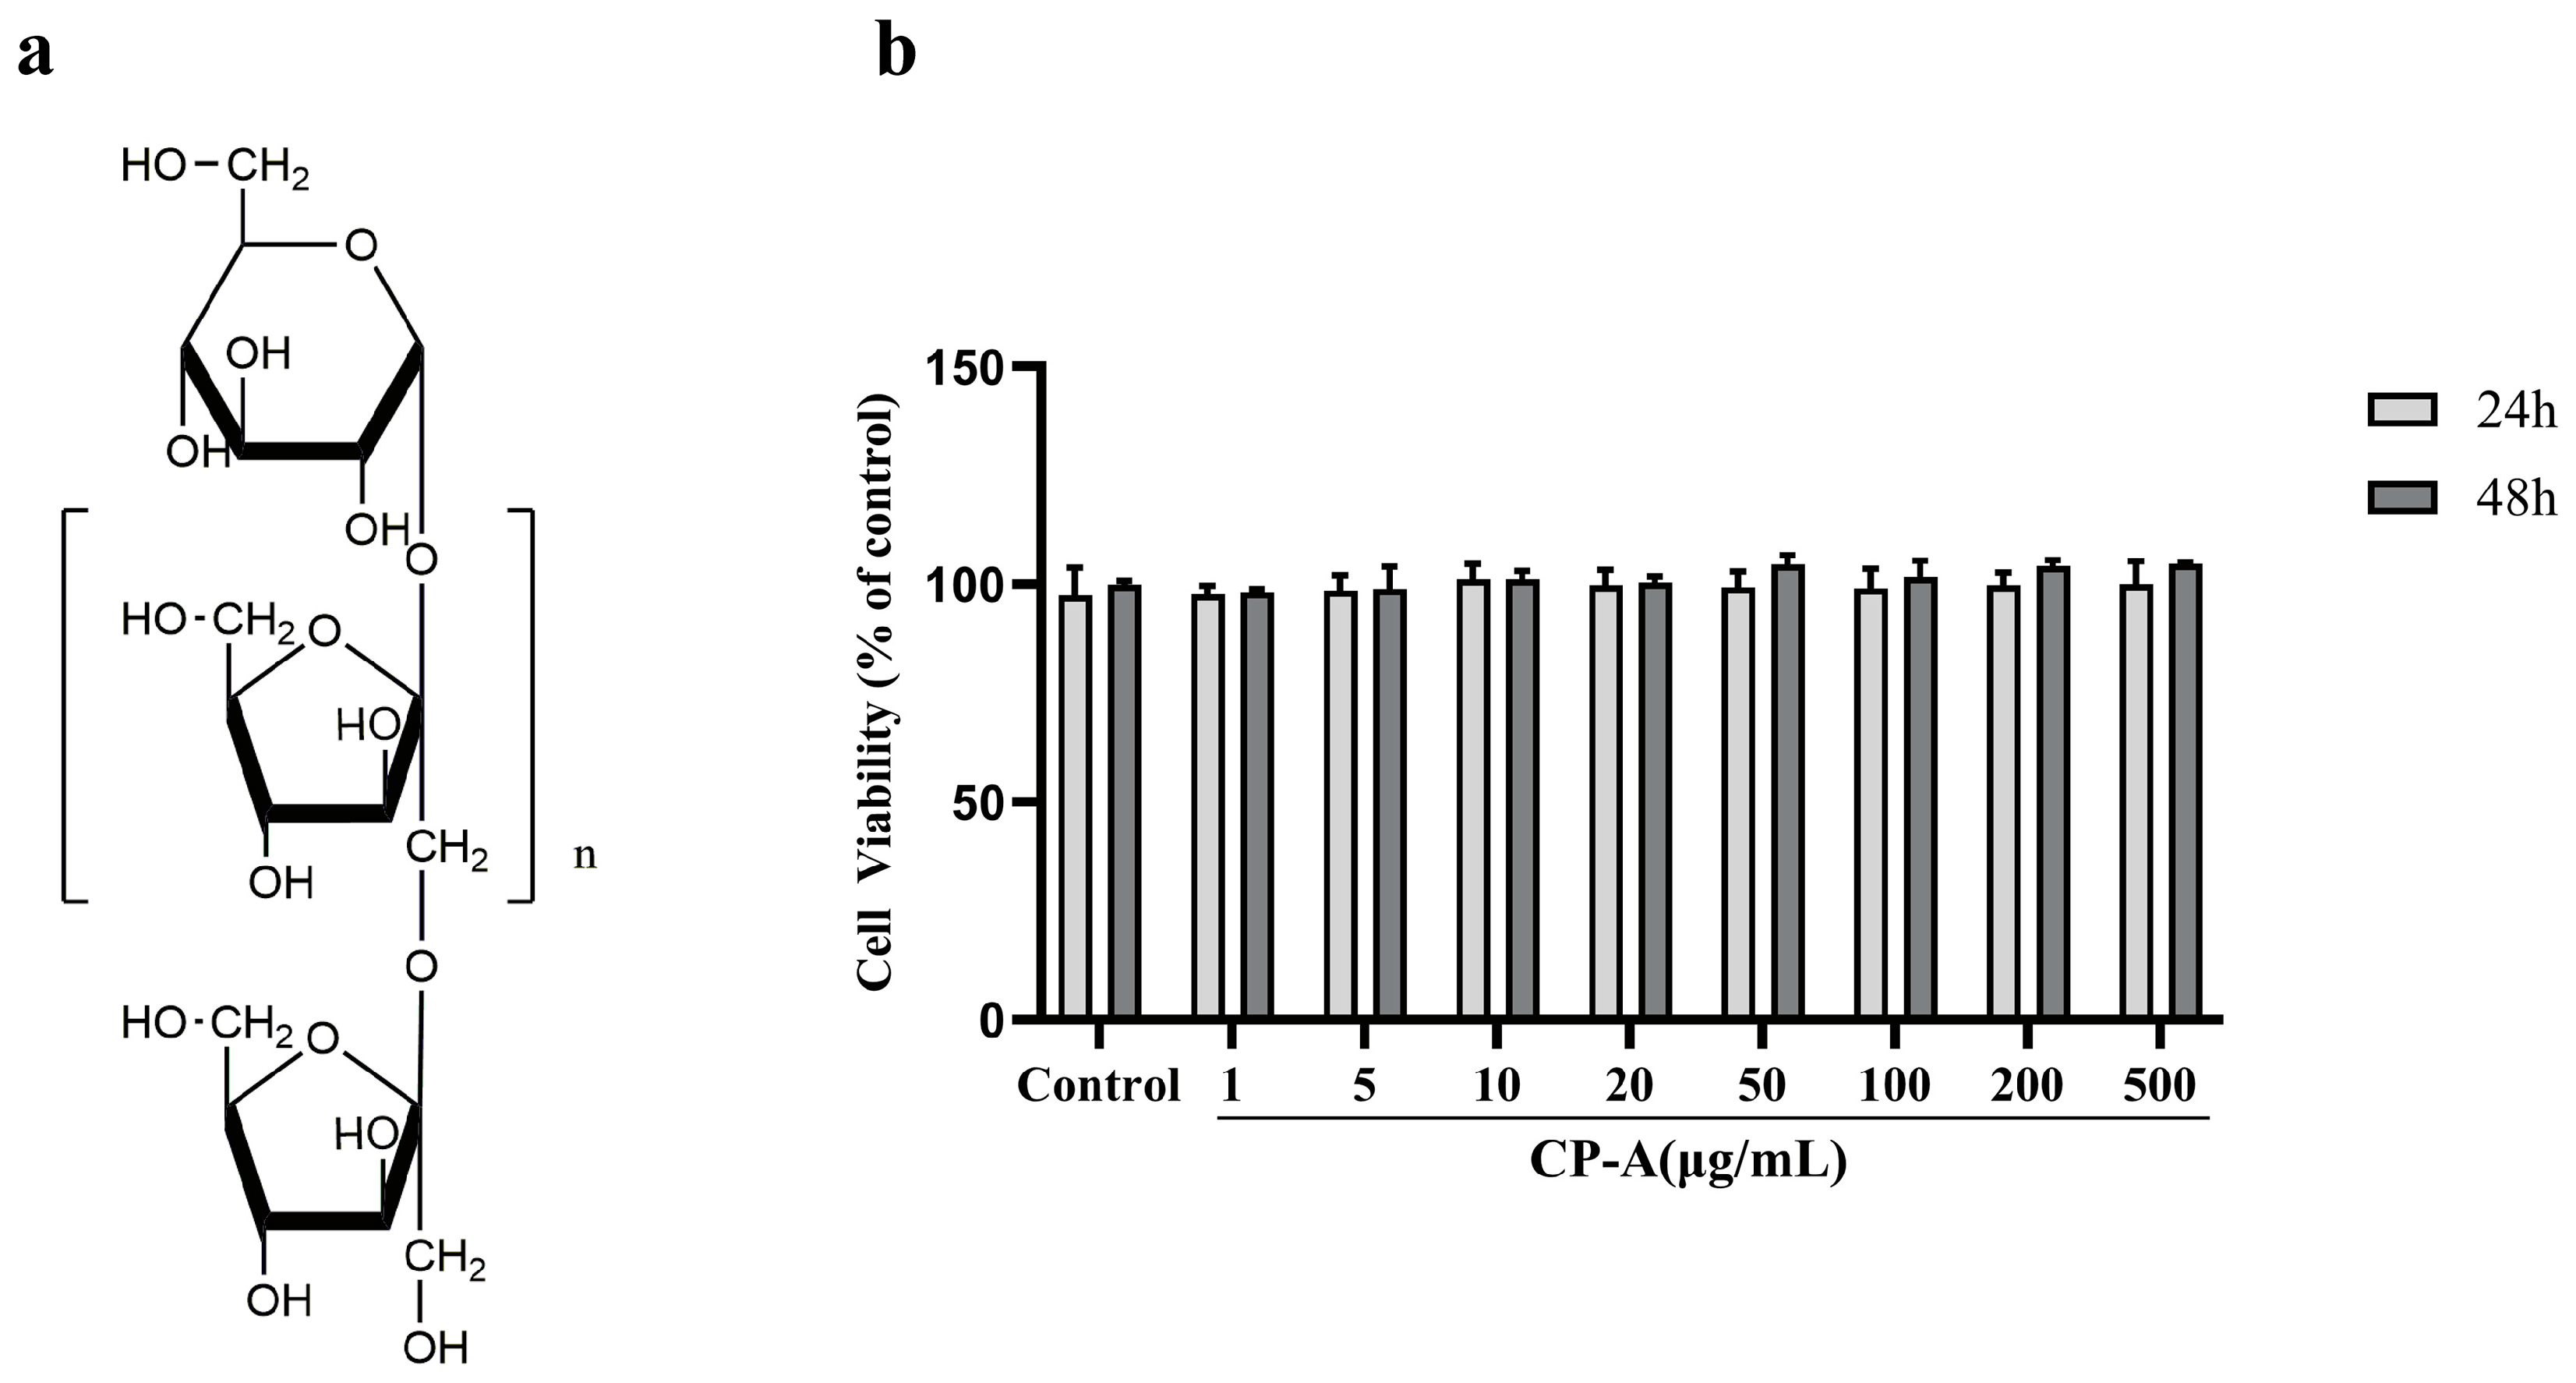
3.1. Cytotoxic Effects of CP-A on IEC-6 Cells
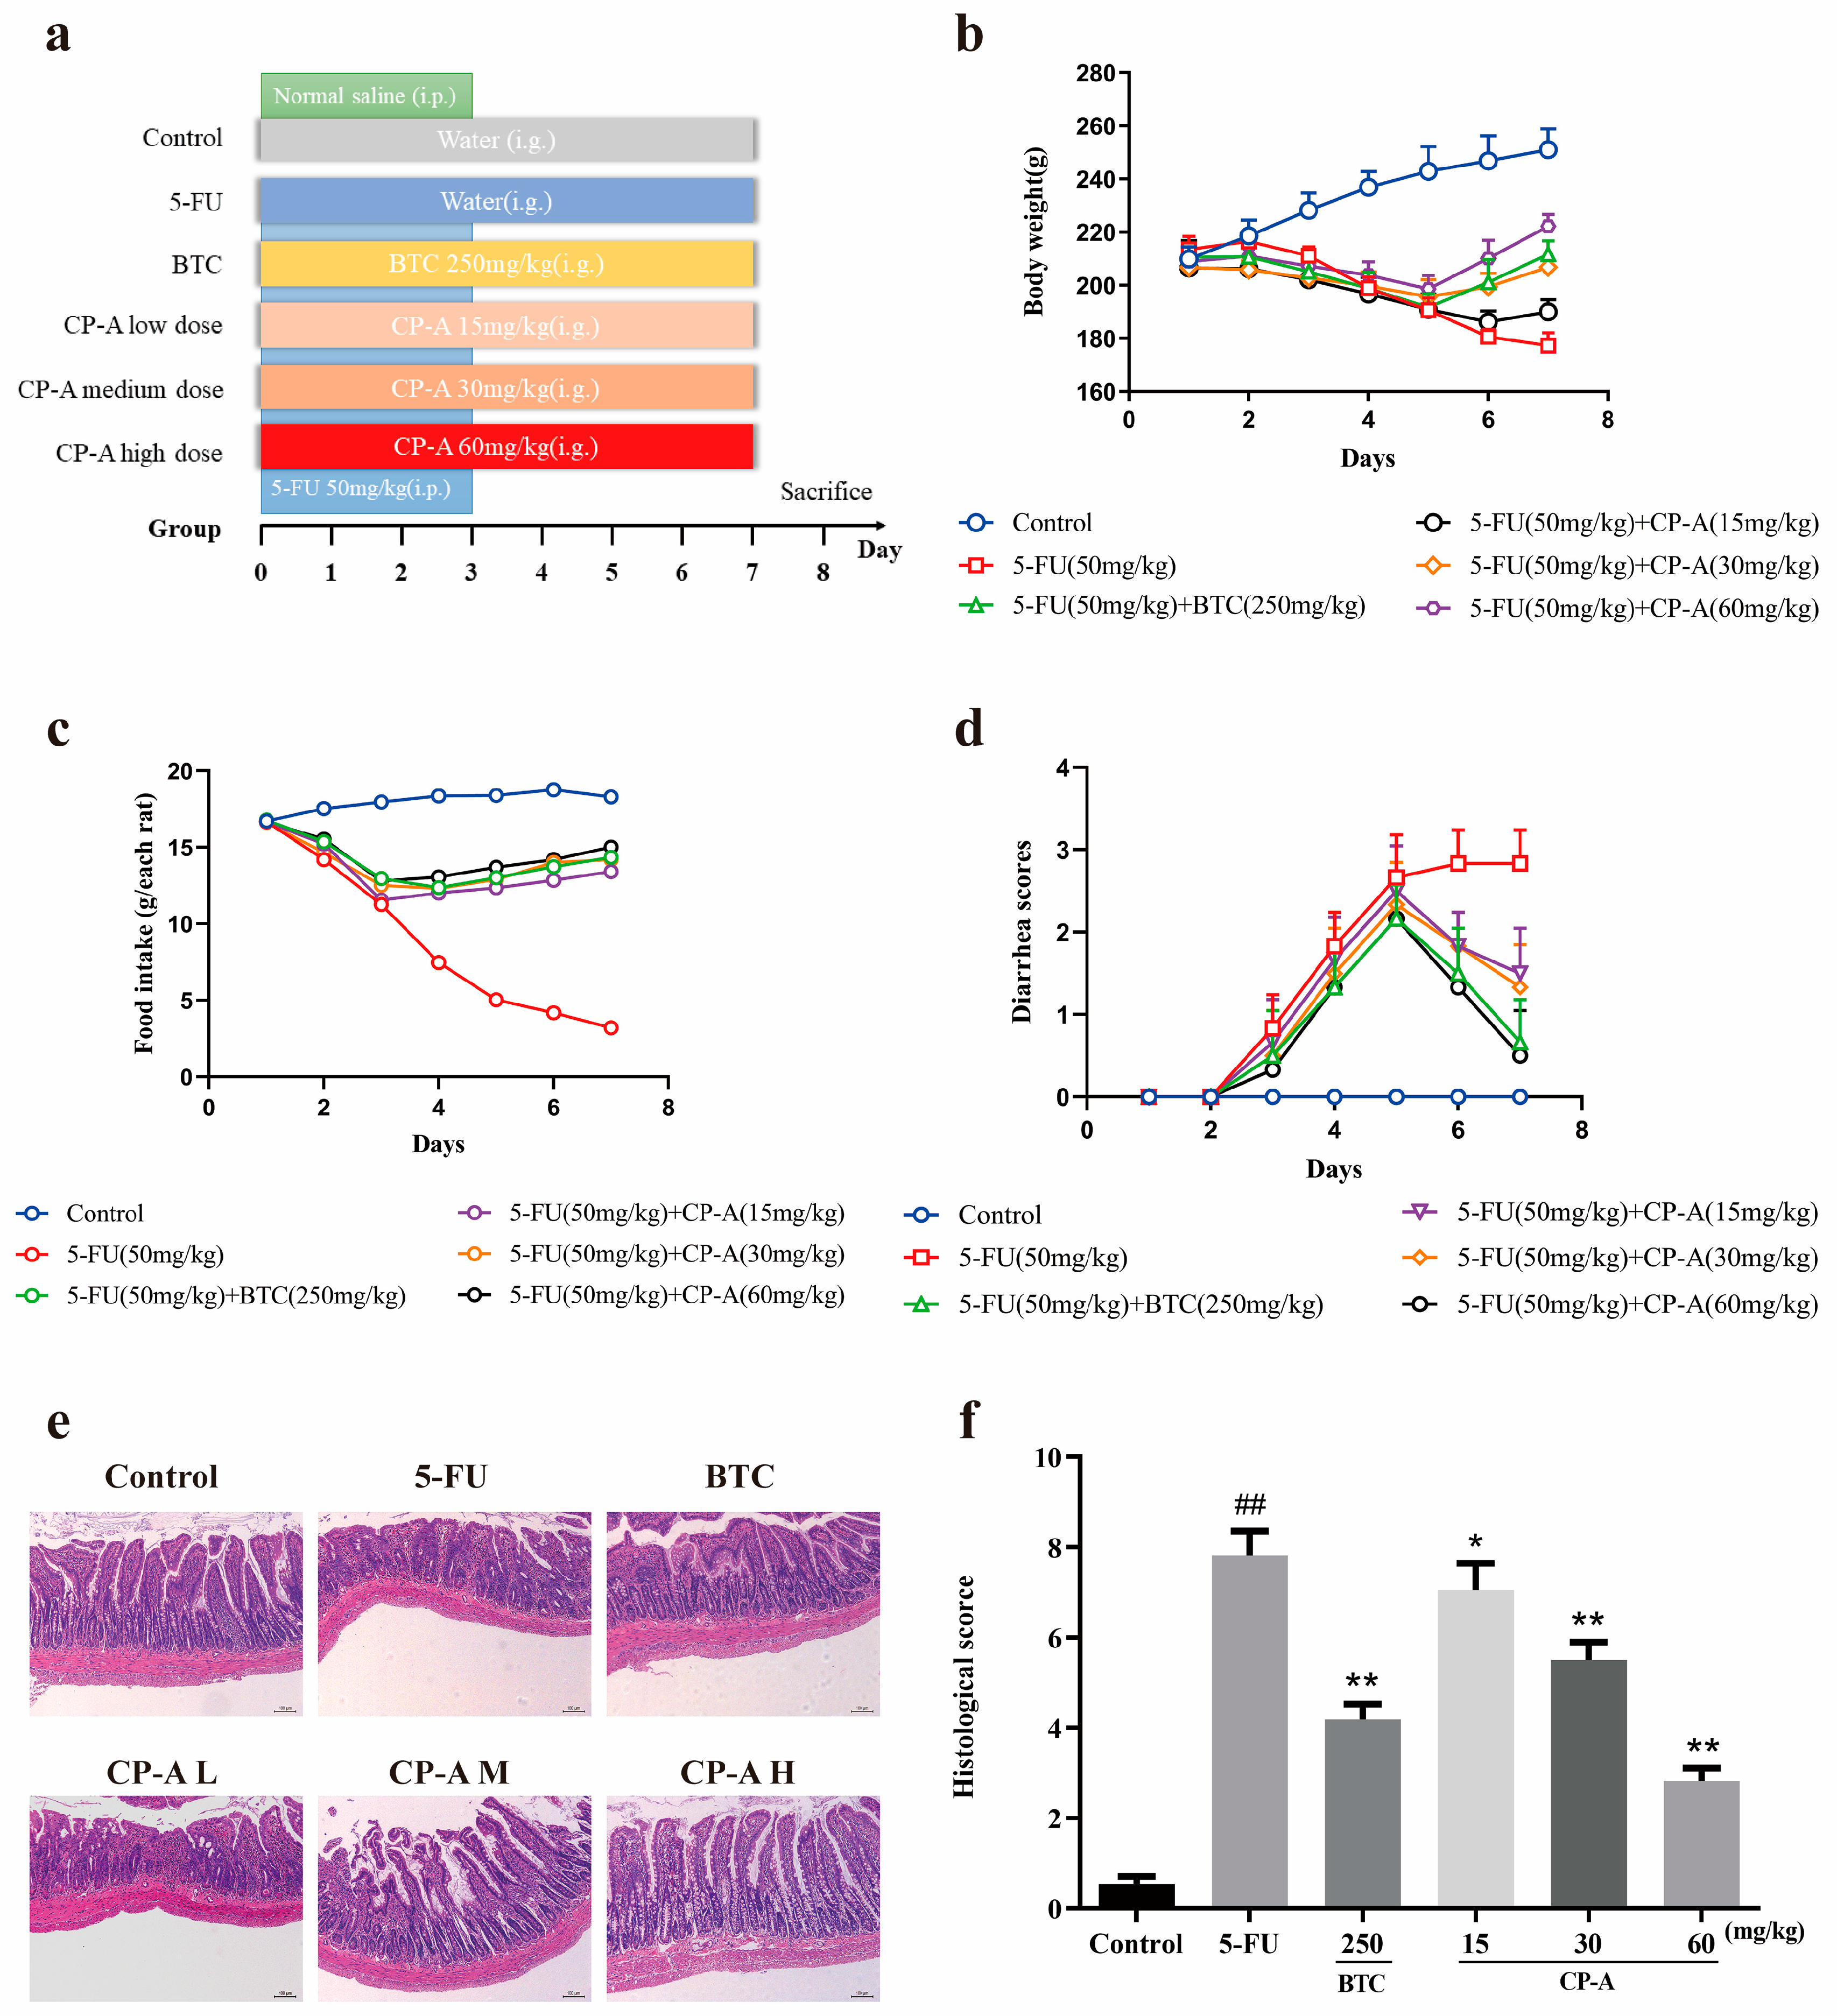
3.2. Protective Effects of CP-A on 5-FU-Induced Intestinal Mucositis in Rats
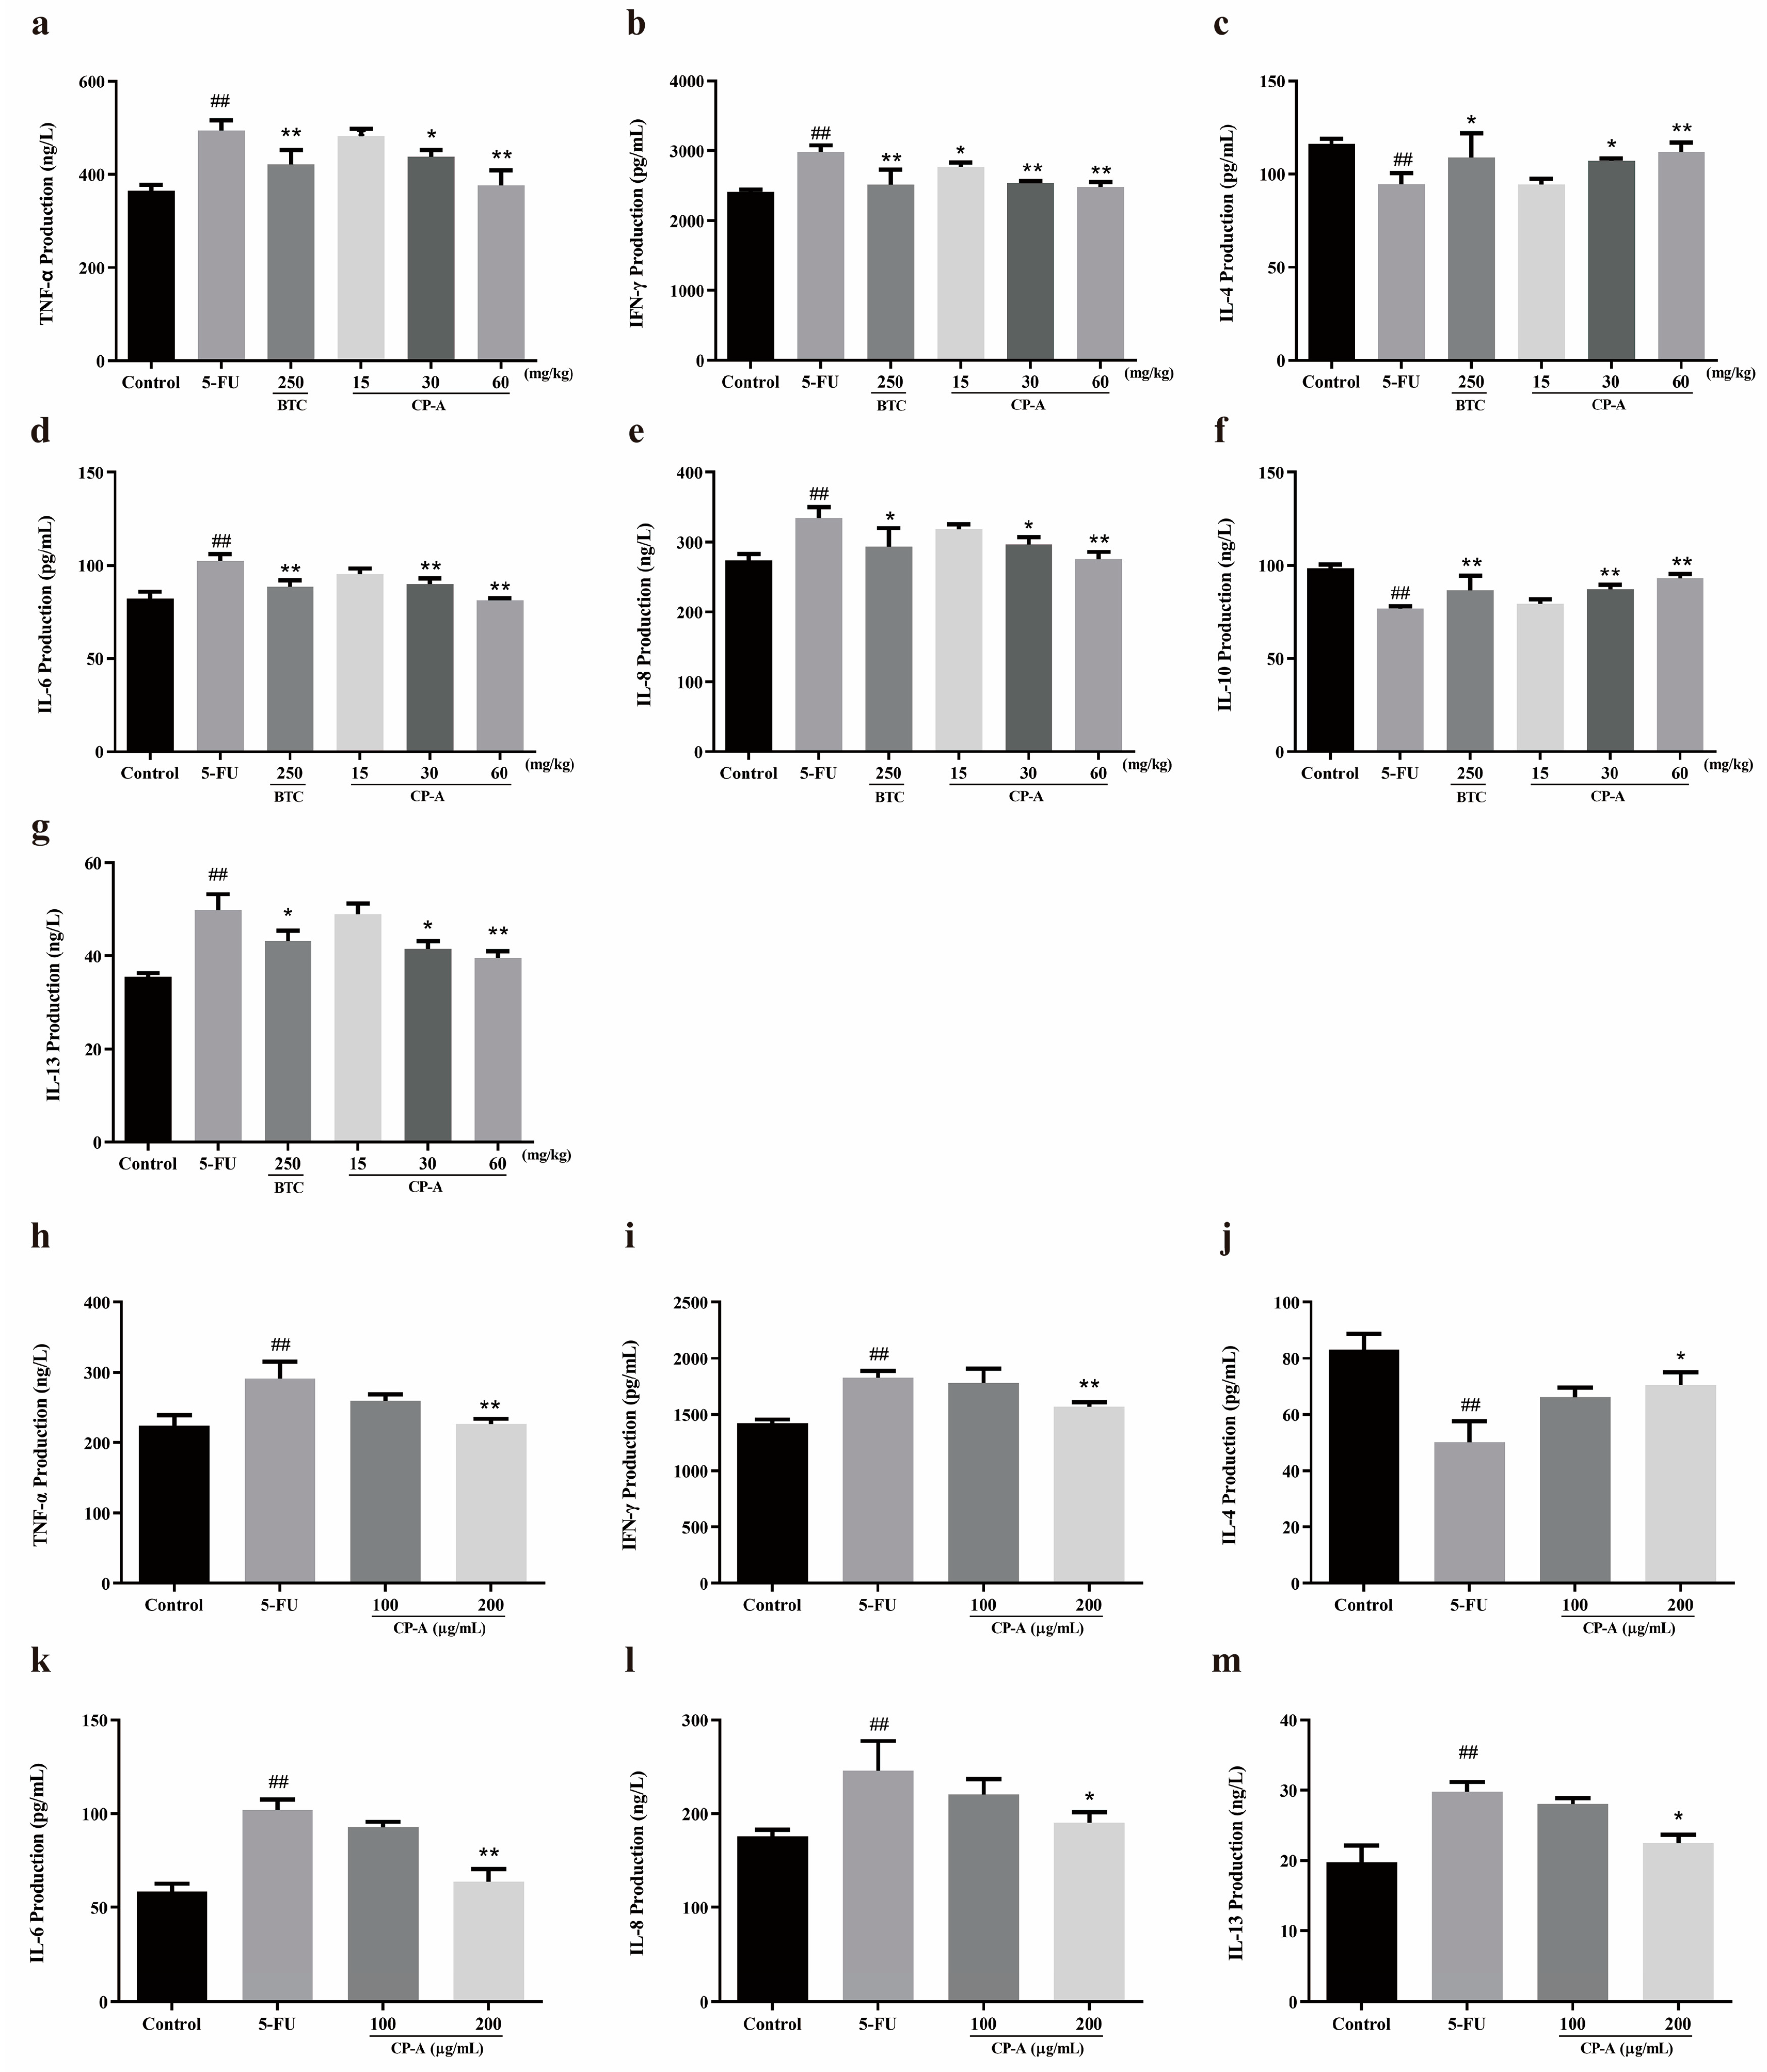
3.3. Effect of CP-A on Inflammatory Cytokines
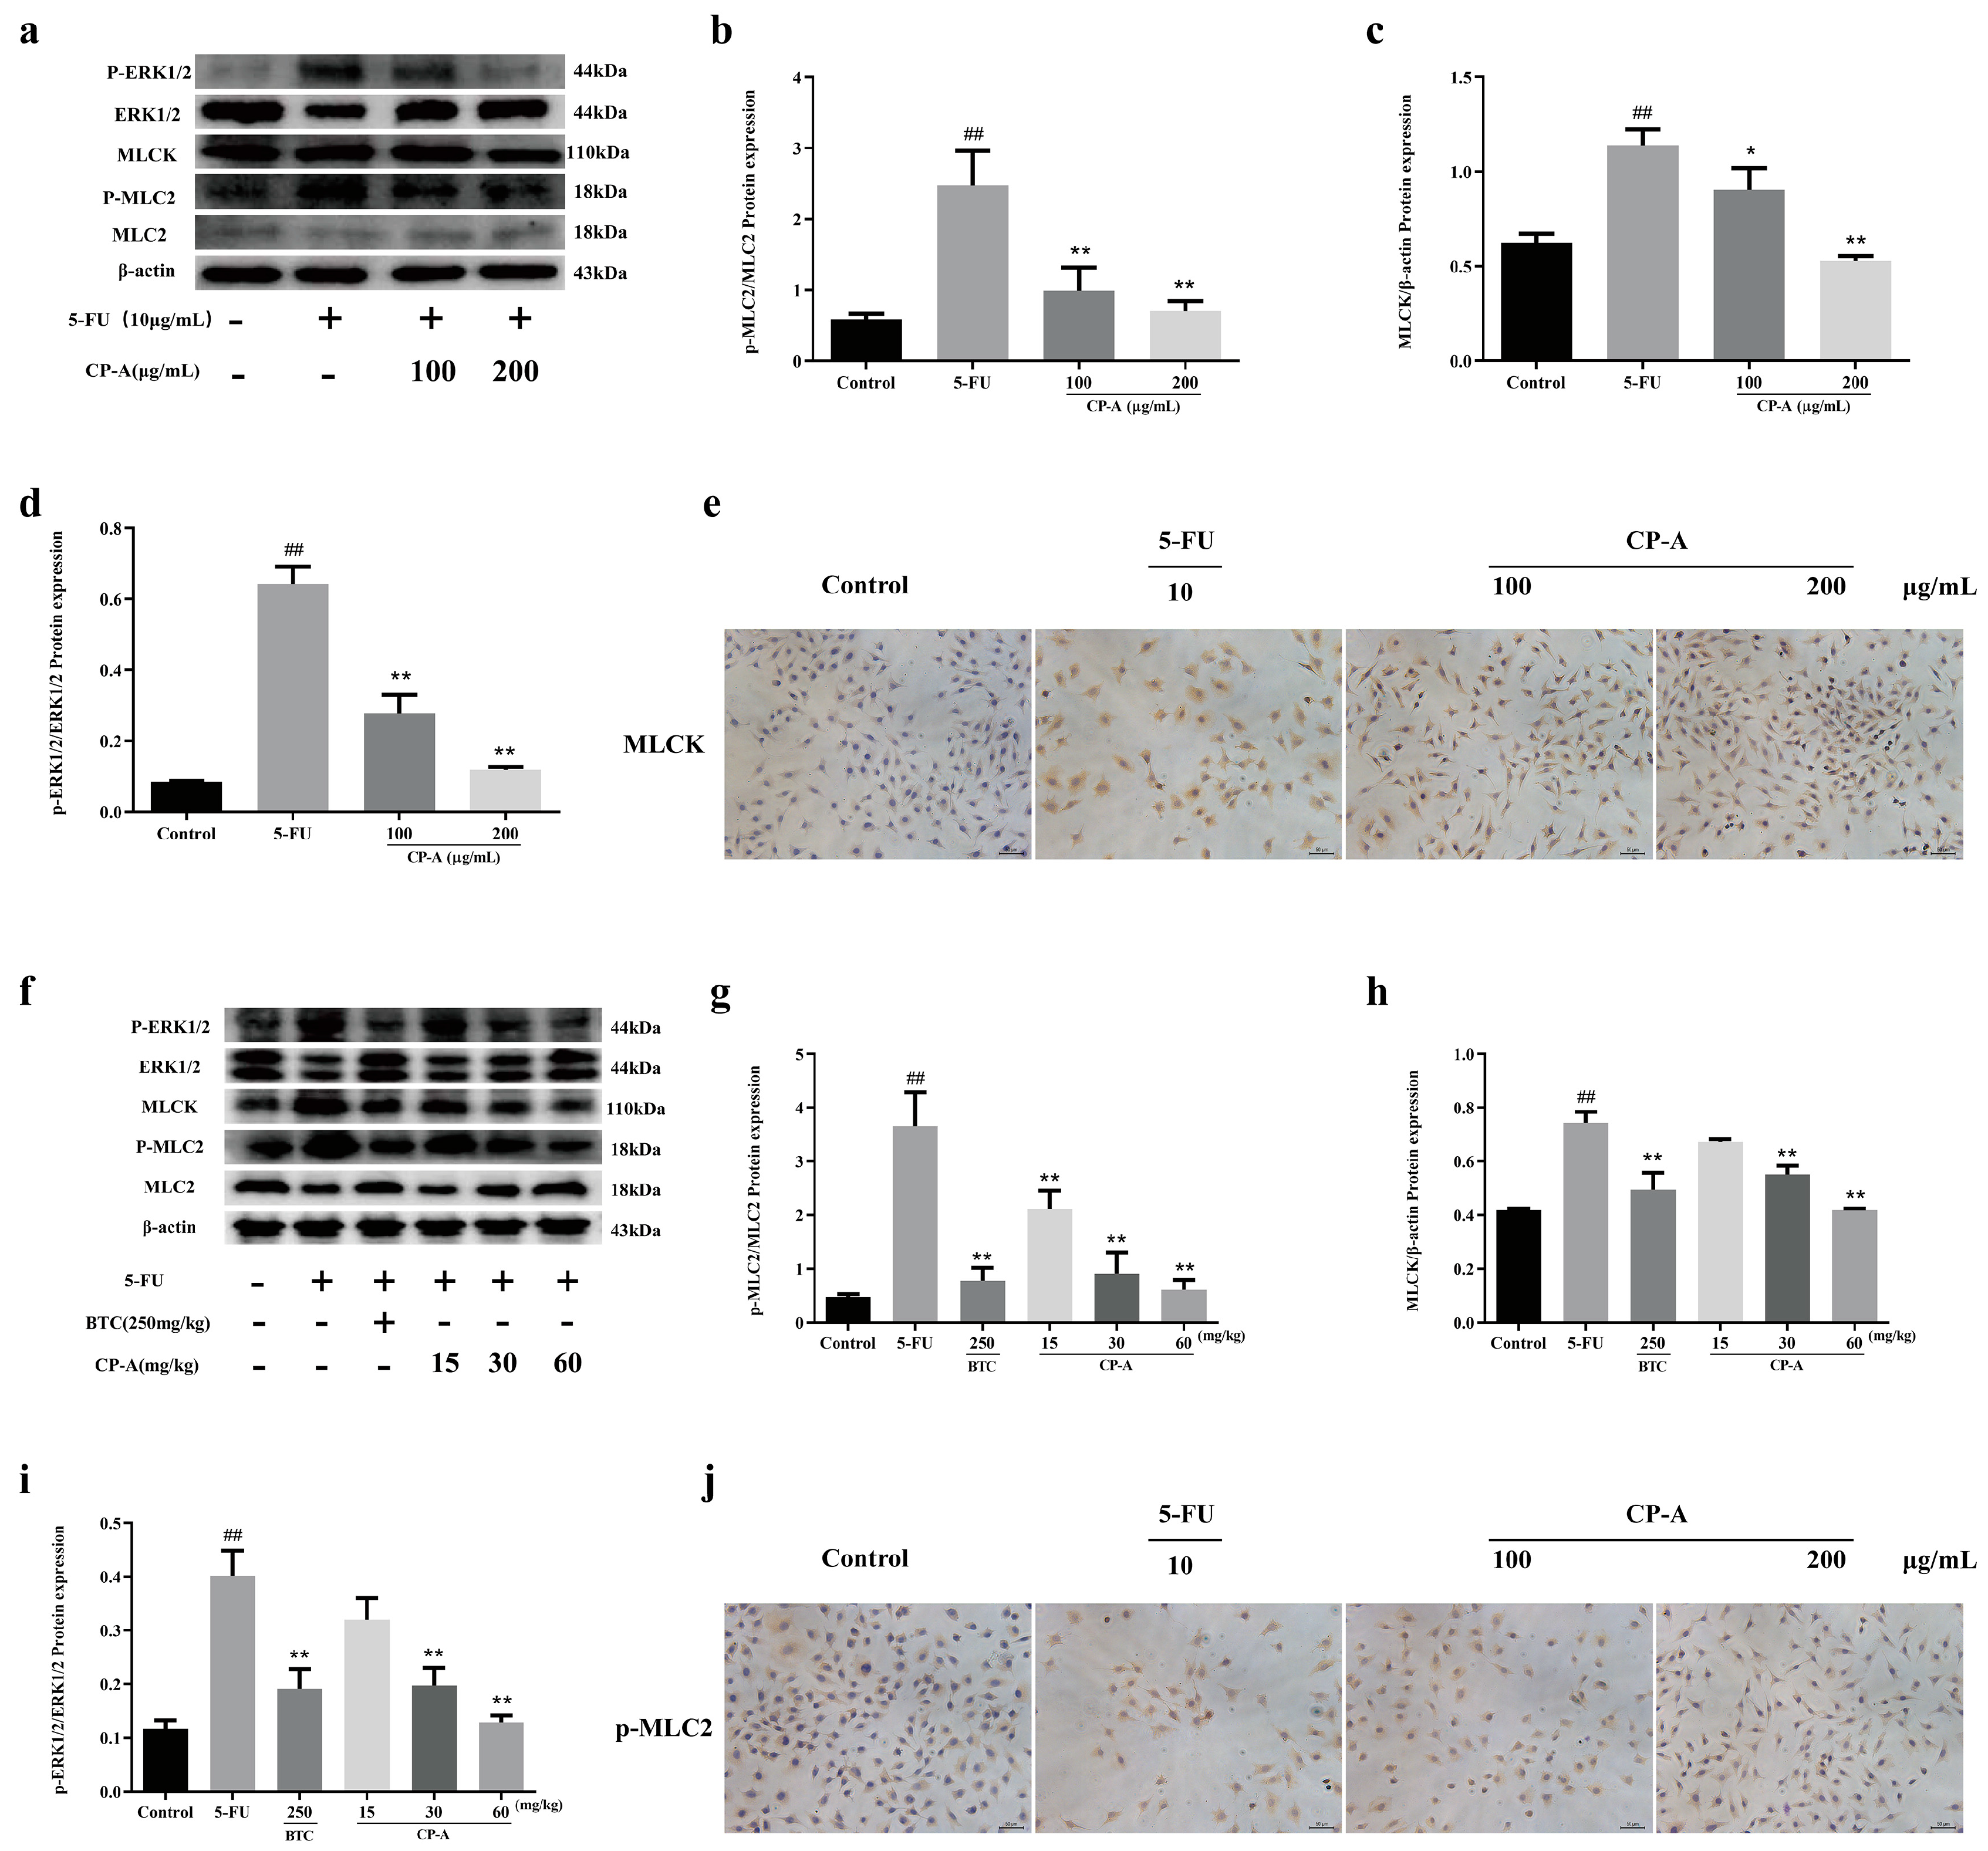
3.4. Effect of CP-A on ERK/MLCK/MLC2 Signaling Pathway
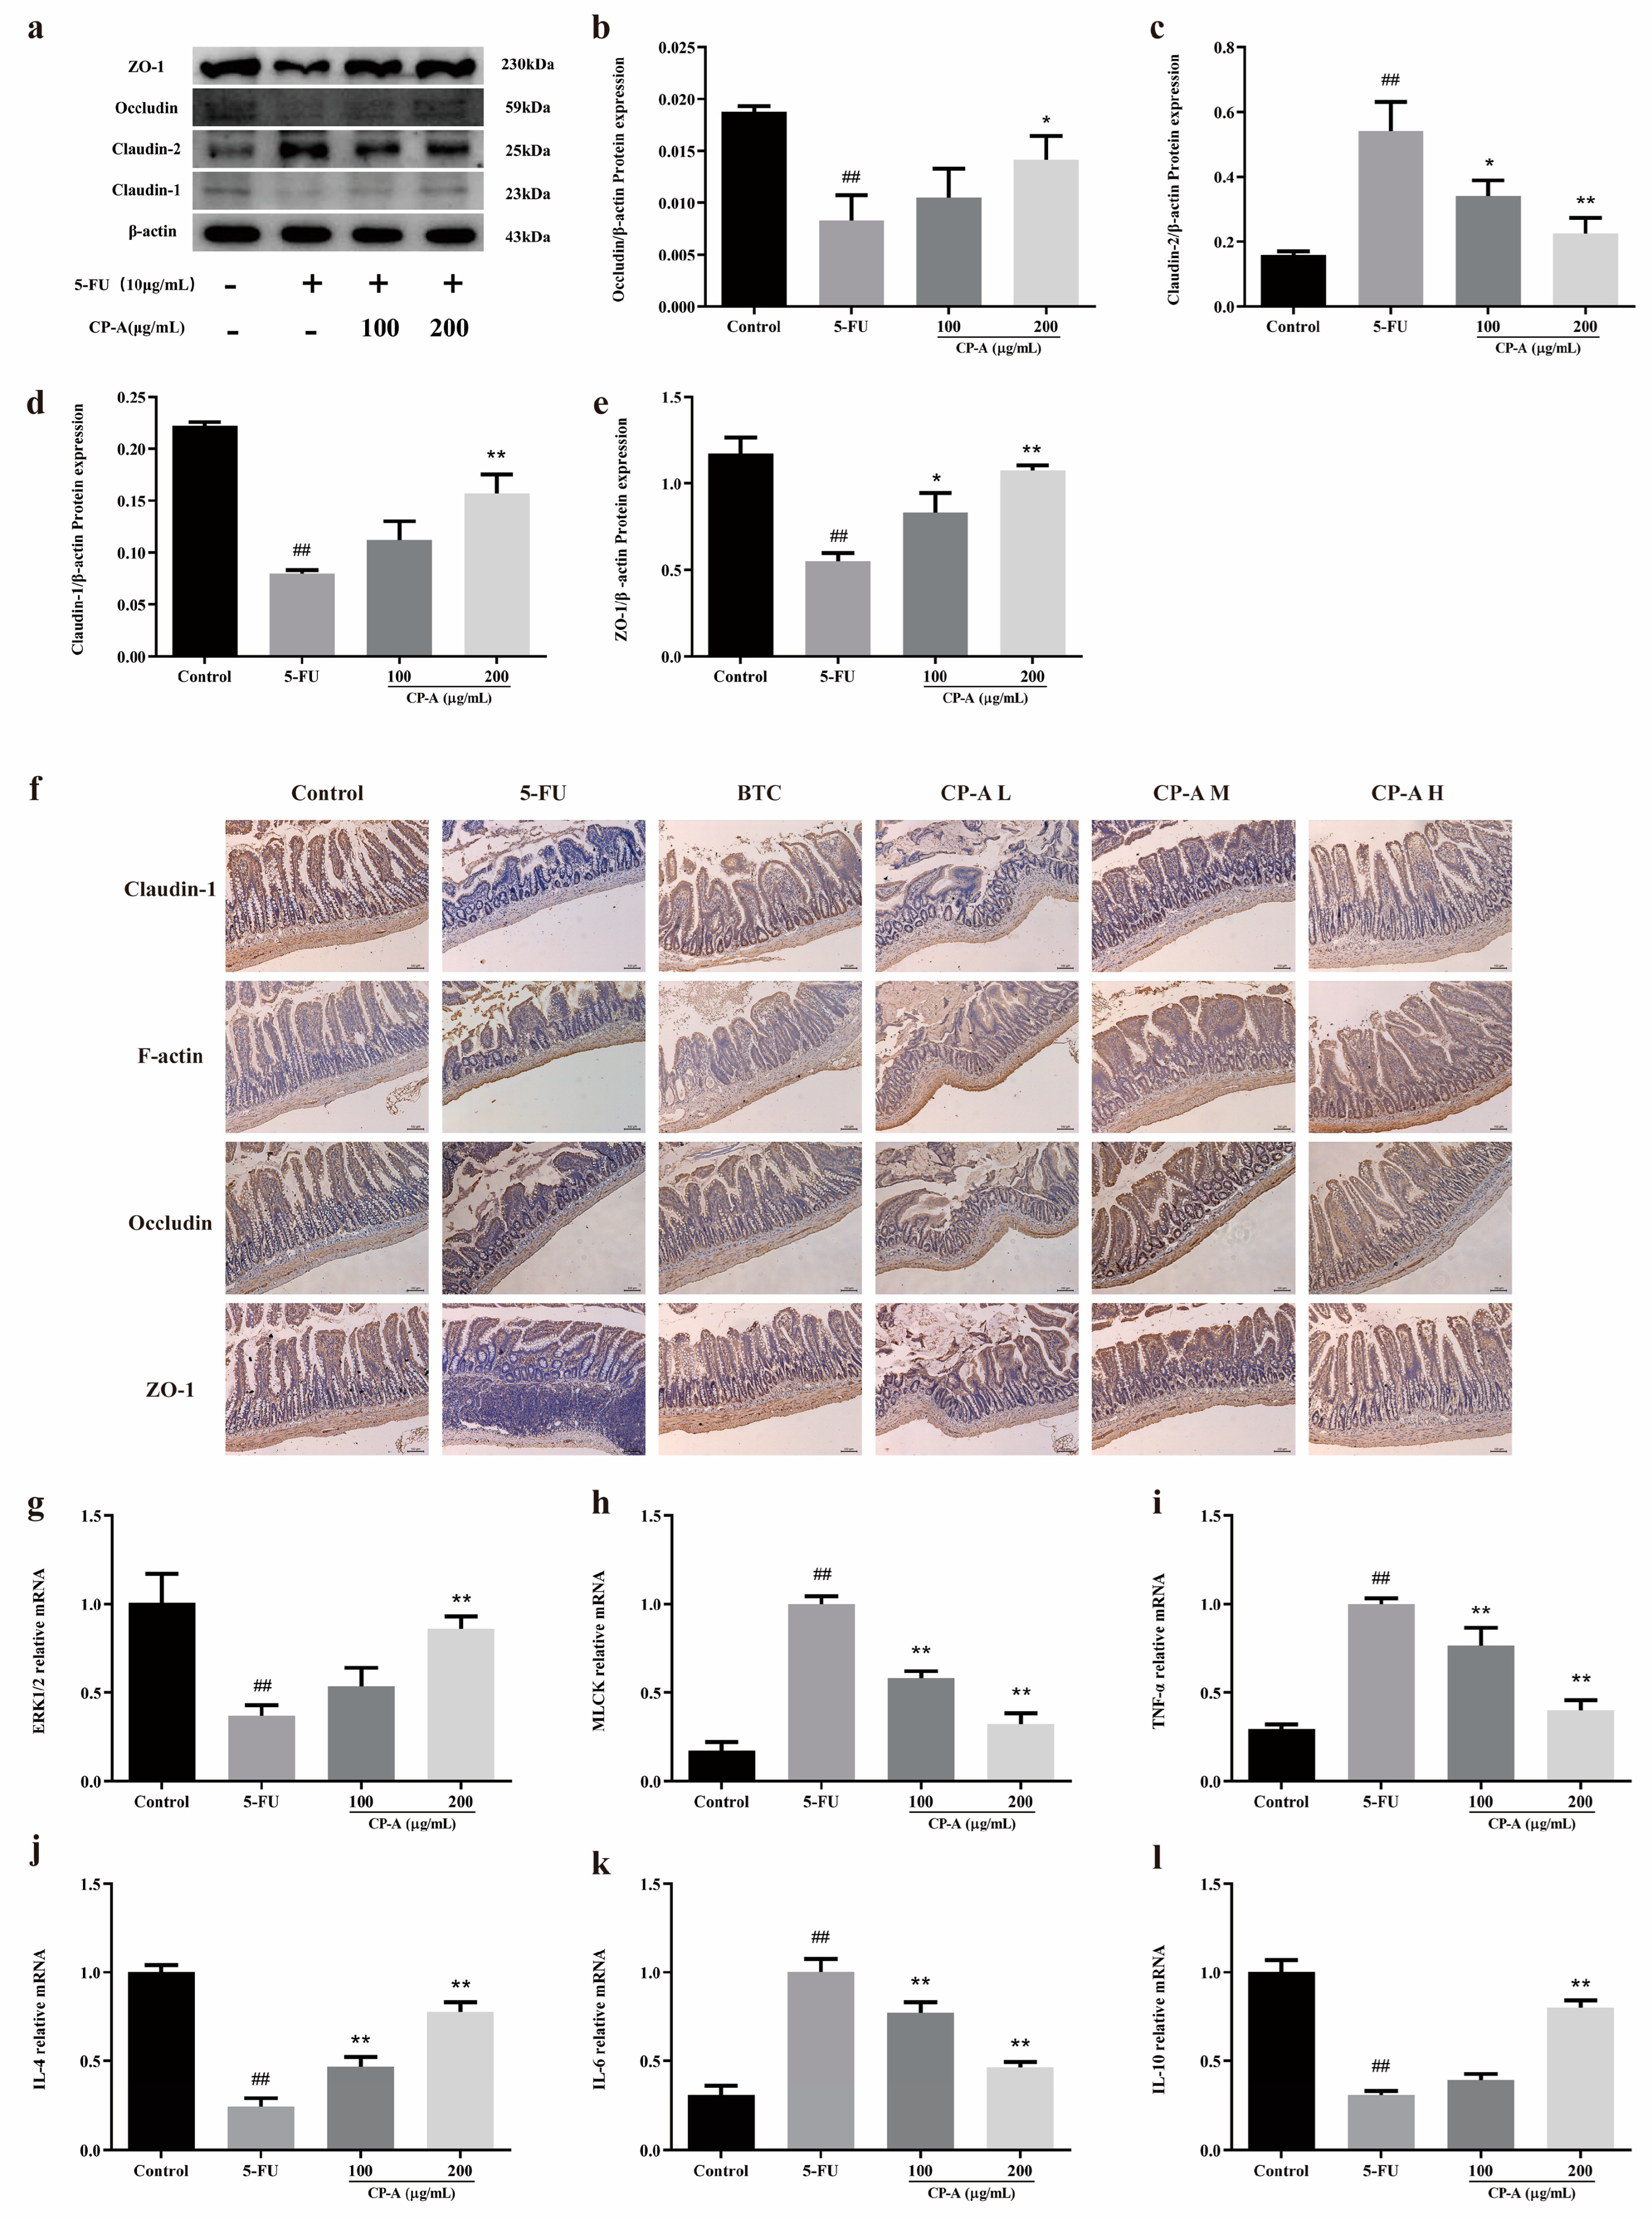
3.5. Effect of CP-A on Intestinal Mucosal Barrier Proteins
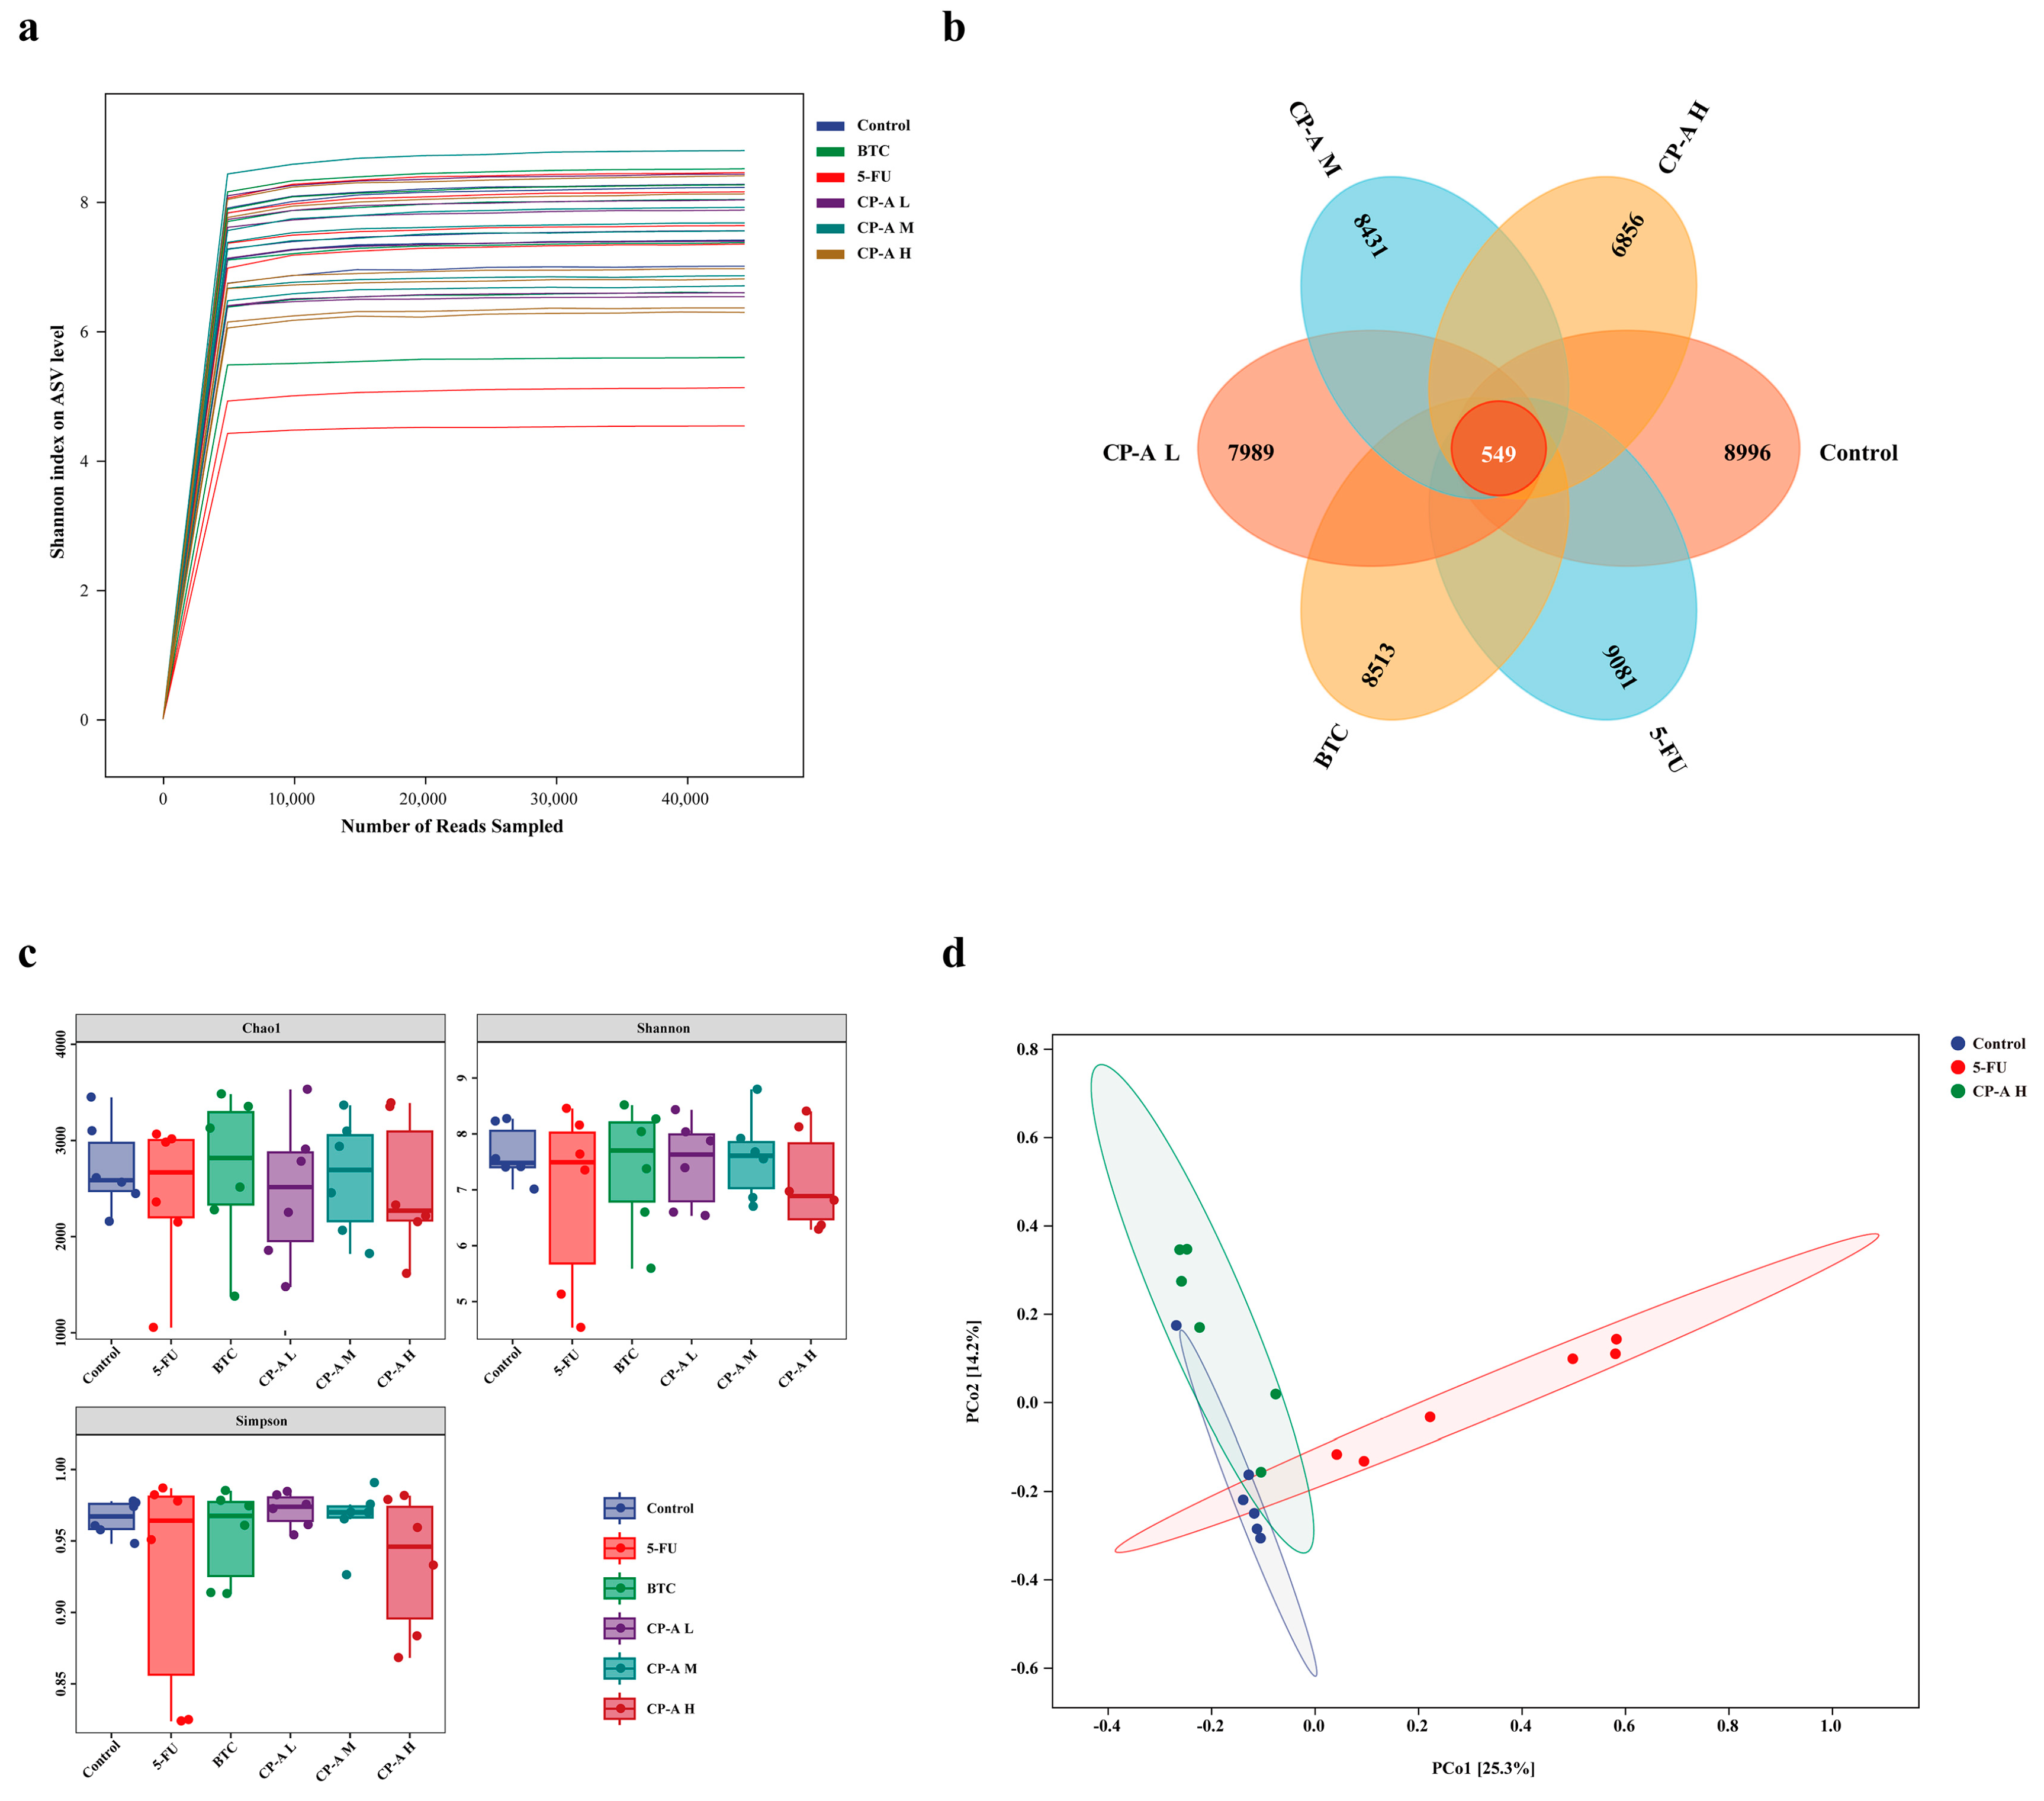
3.6. Effect of CP-A on Microbial Diversity
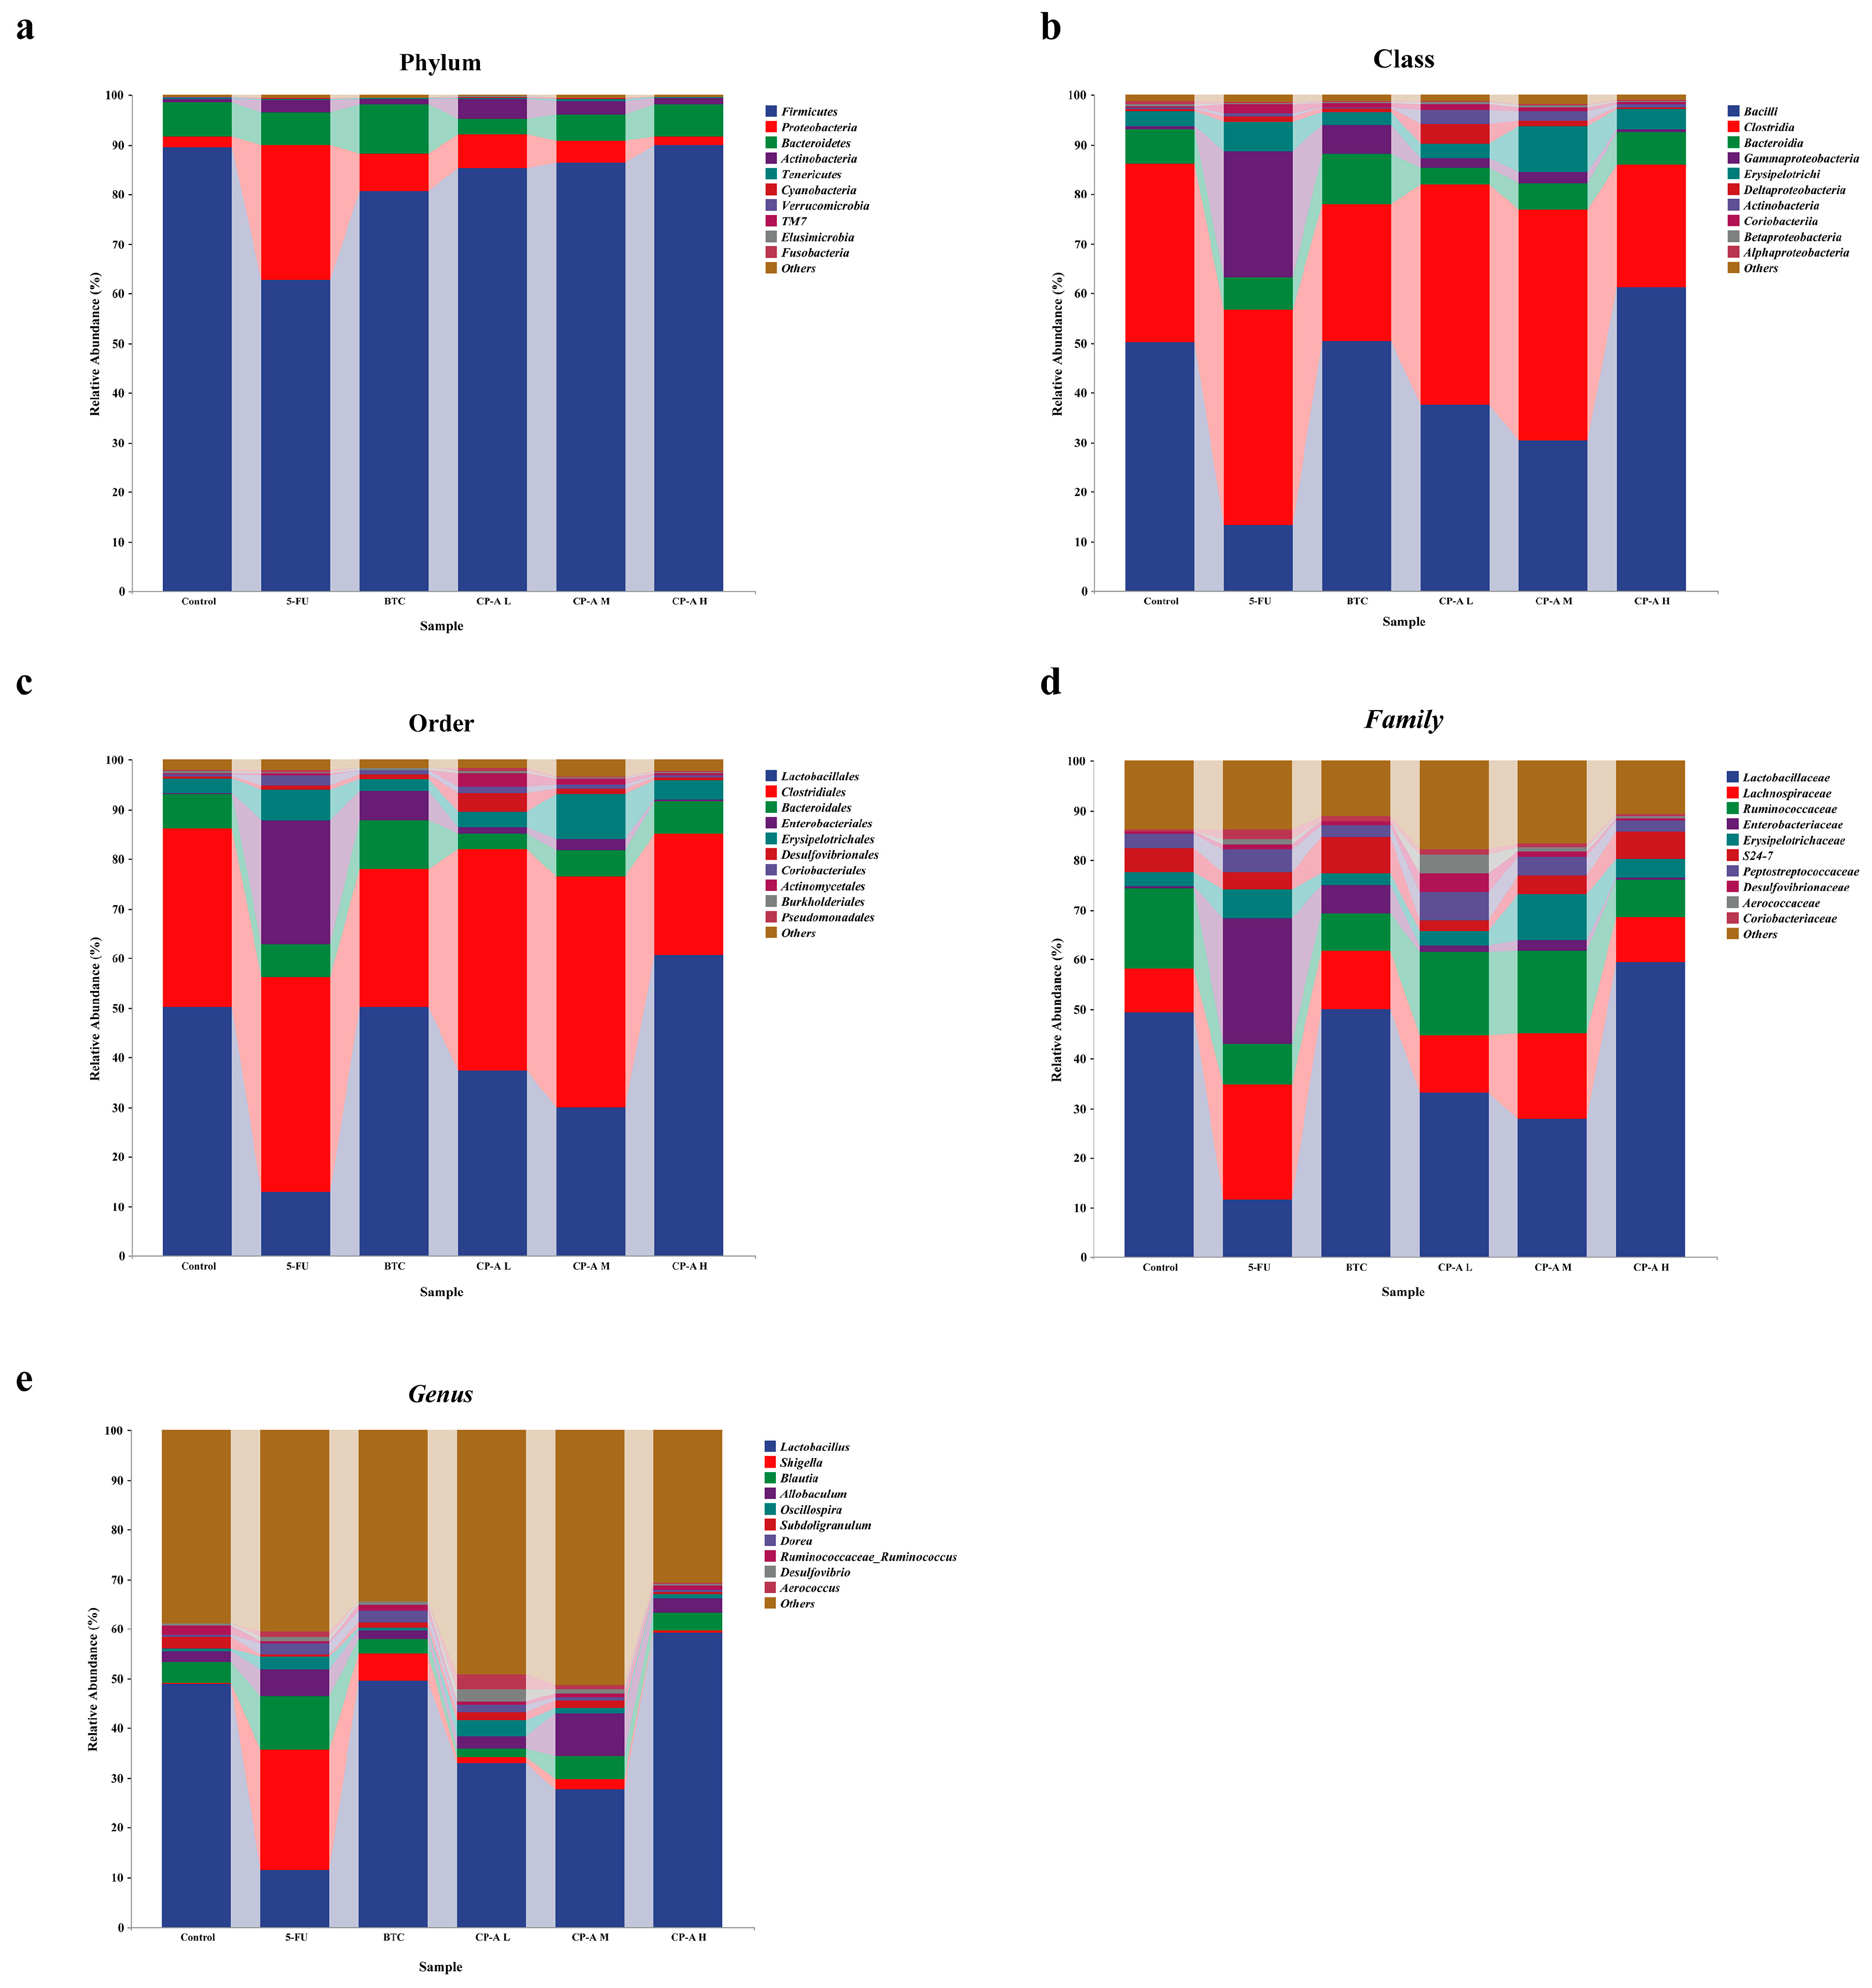
3.7. Taxonomic Composition Analysis of Microbial Community
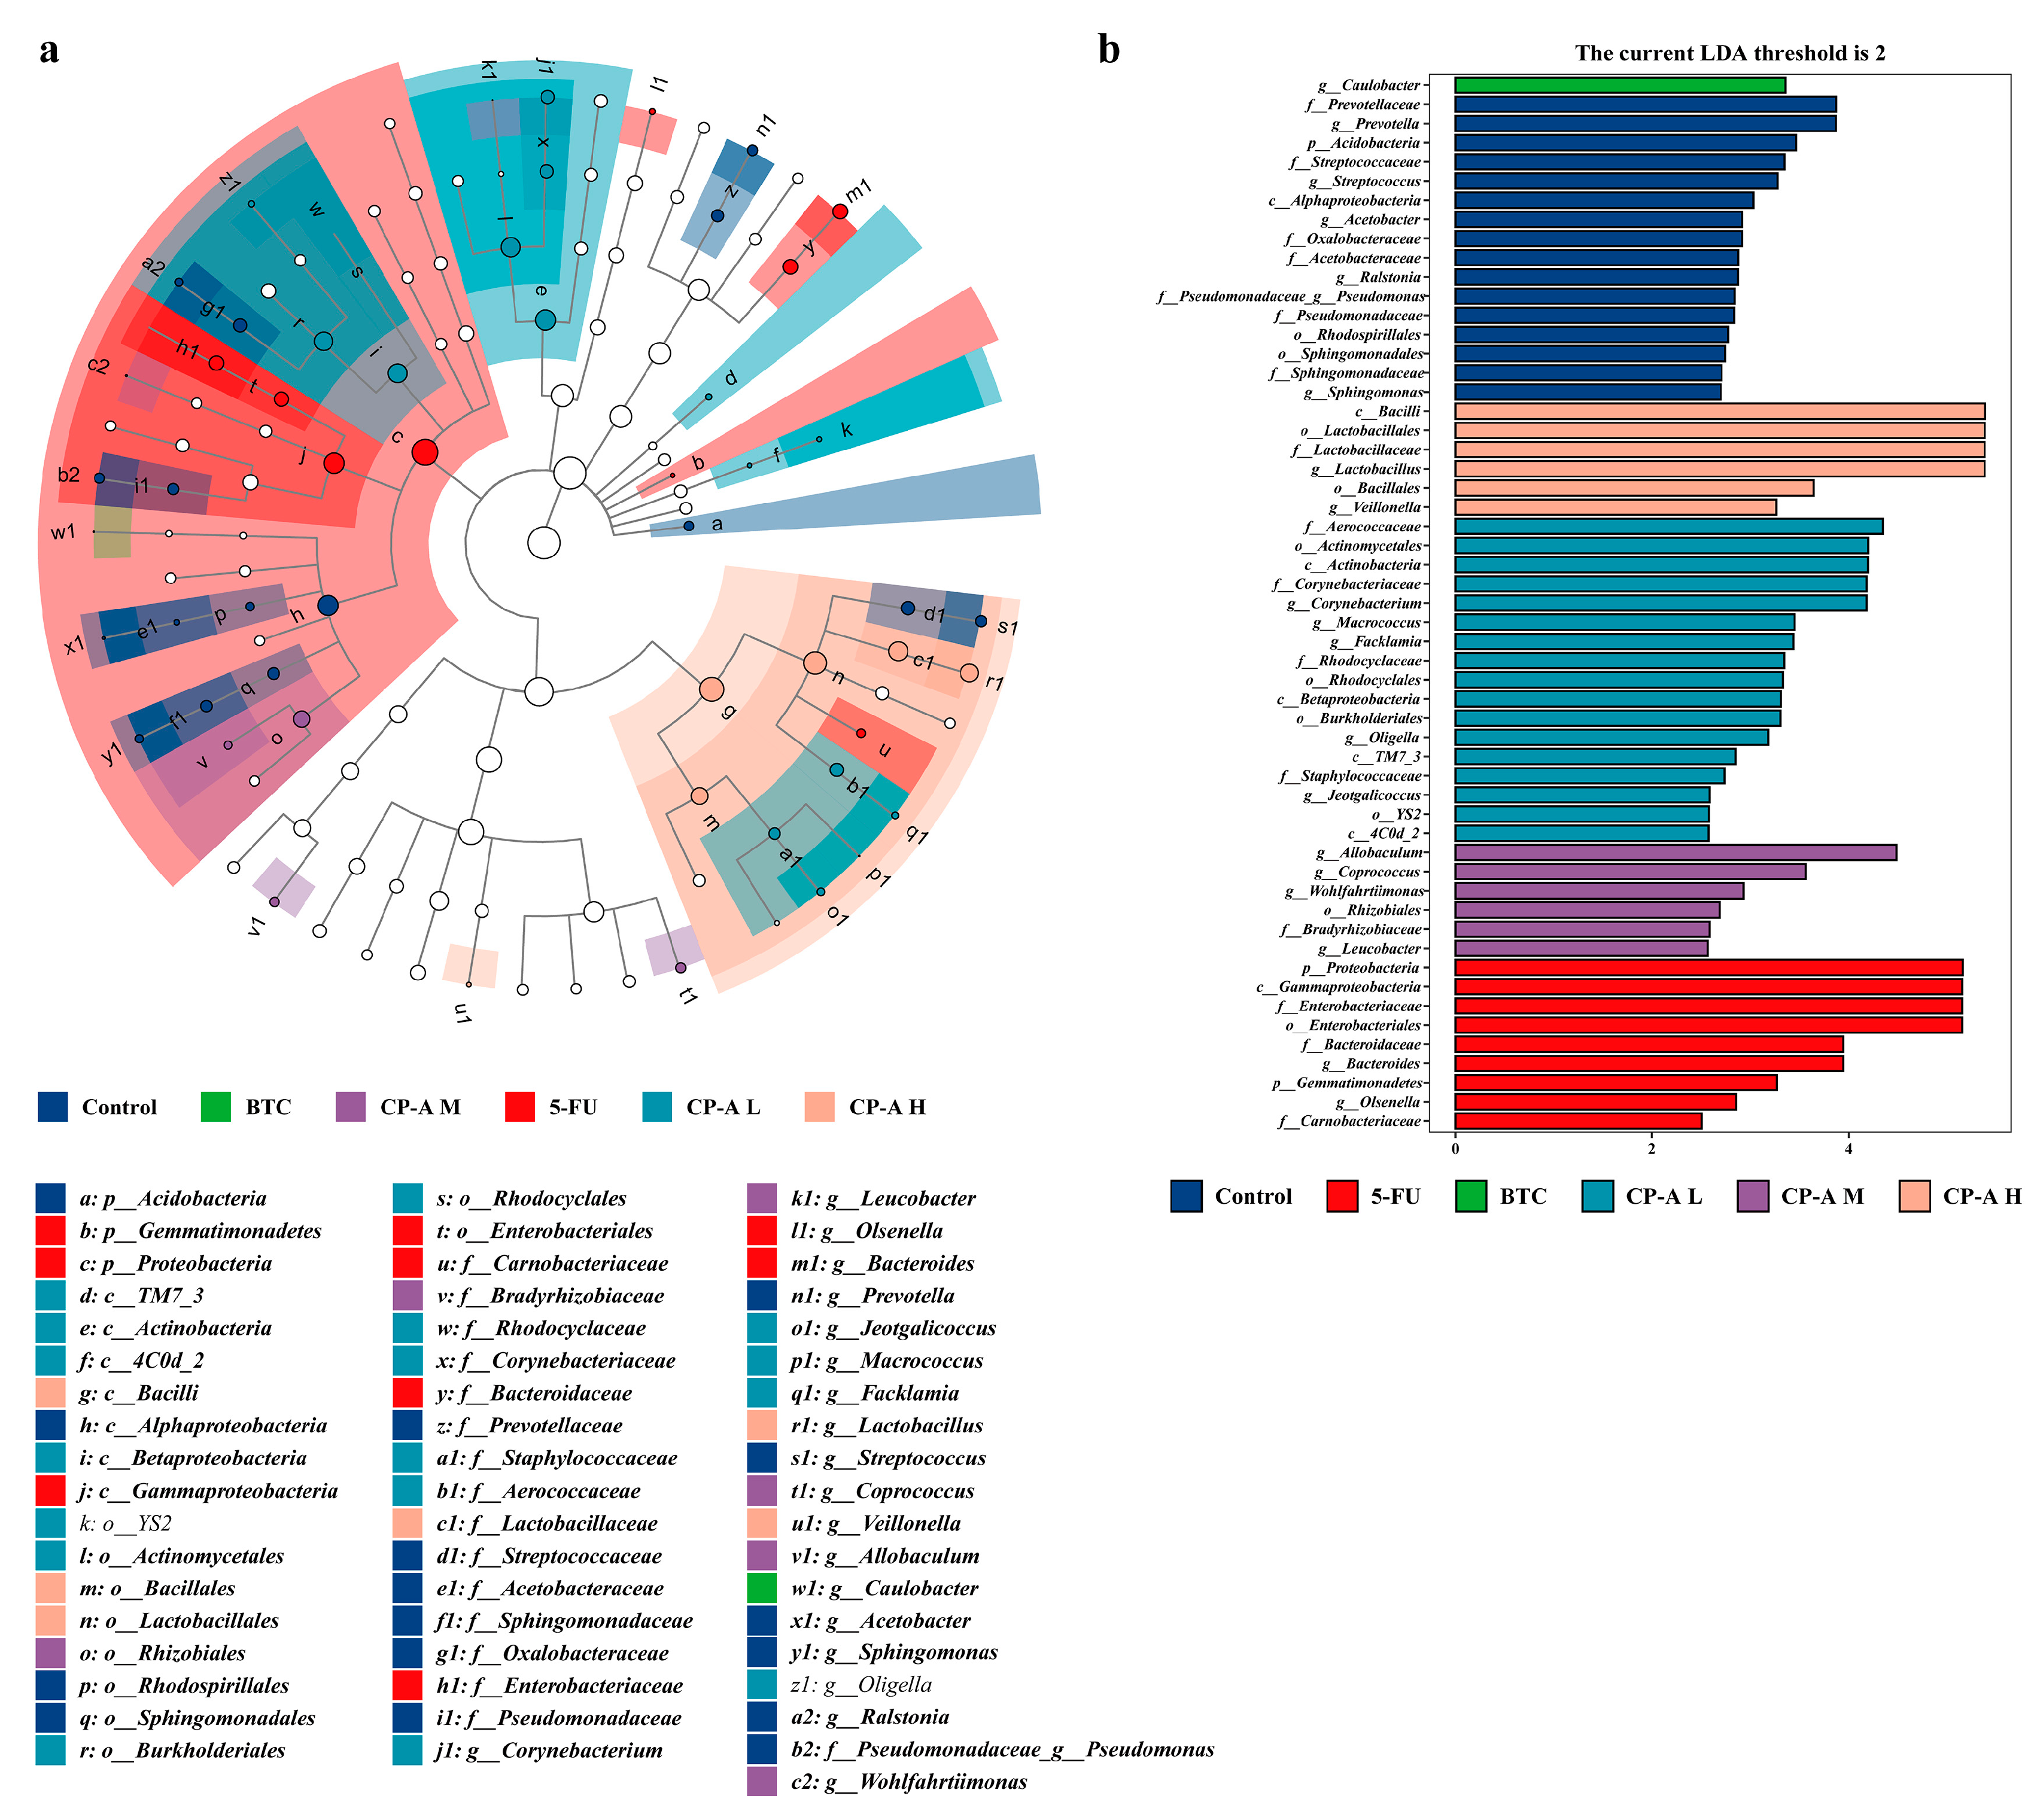
3.8. Effect of CP-A on Intestinal Mucosal Barrier Proteins
4. Discussion
5. Conclusions
Supplementary Materials
Author Contributions
Funding
Institutional Review Board Statement
Data Availability Statement
Conflicts of Interest
Abbreviations
| IM | Intestinal mucositis |
| 5-FU | 5-fluorouracil |
| IHC | Immunohistochemical |
| RT-PCR | Real-time PCR |
| ERK | Extracellular-regulated protein kinases |
| MLCK | Myosin light chain kinase |
| MLC2 | Myosin light chain 2 |
| ELISA | Enzyme-linked immunosorbent assay |
| TNF-α | Tumor necrosis factor-alpha |
| IFN-γ | Interferon gamma |
| ZO-1 | Zonula occludens-1 |
| IL | Interleukin |
| BTC | Bifid. Triple Viable Capsules Dissolving at Intestines |
| MTT | 3-(4,5-dimethylthiazol-2-yl)-2,5-diphenyltetrazolium bromide |
| DMSO | Dimethyl sulfoxide |
| PBS | Phosphate-buffered saline |
| H&E | Hematoxylin and eosin |
| PCoA | Principal coordinate analysis |
| LEfSe | LDA Effect Size |
| FBS | Fetal bovine serum |
| BSA | Bovine serum albumin |
| SPF | Specific pathogen-free |
| SD | Sprague–Dawley |
| TCM | Traditional Chinese Medicine |
| IEC-6 | Rat intestinal epithelial cell line-6 |
| PVDF | polyvinylidene difluoride |
| ECL | Electro-Chemi-Luminescence |
References
- D. B. Longley, D. P. Harkin and P. G. Johnston, 5-fluorouracil: mechanisms of action and clinical strategies. Nat. Rev. Cancer 2003, 3, 330–338. [Google Scholar] [CrossRef] [PubMed]
- R. A. Ribeiro, C. W. Wanderley, D. V. Wong, J. M. Mota, C. A. Leite, M. H. Souza, F. Q. Cunha and R. C. Lima-Junior, Irinotecan- and 5-fluorouracil-induced intestinal mucositis: insights into pathogenesis and therapeutic perspectives. Cancer Chemother. Pharmacol. 2016, 78, 881–893. [Google Scholar] [CrossRef] [PubMed]
- J. Y. Douillard, D. Cunningham, A. D. Roth, M. Navarro, R. D. James, P. Karasek, P. Jandik, T. Iveson, J. Carmichael, M. Alakl, G. Gruia, L. Awad and P. Rougier, Irinotecan combined with fluorouracil compared with fluorouracil alone as first-line treatment for metastatic colorectal cancer: a multicentre randomised trial. Lancet 2000, 355, 1041–1047. [Google Scholar]
- J. Wang, W. Feng, S. Zhang, L. Chen, Y. Sheng, F. Tang, J. He, X. Xu, H. Ao and C. Peng, Ameliorative effect of Atractylodes macrocephala essential oil combined with Panax ginseng total saponins on 5-fluorouracil induced diarrhea is associated with gut microbial modulation. J. Ethnopharmacol. 2019, 238, 111887. [Google Scholar]
- R. V. Lalla, M. M. Schubert, R. J. Bensadoun and D. Keefe, Anti-inflammatory agents in the management of alimentary mucositis. Support. Care Cancer 2006, 14, 558–565. [Google Scholar] [CrossRef] [PubMed]
- D. M. Keefe, Intestinal mucositis: mechanisms and management. Curr. Opin. Oncol. 2007, 19, 323–327. [Google Scholar] [CrossRef]
- R. Sharma, P. Tobin and S. J. Clarke, Management of chemotherapy-induced nausea, vomiting, oral mucositis, and diarrhoea. Lancet Oncol. 2005, 6, 93–102. [Google Scholar] [CrossRef] [PubMed]
- B. Cai, J. Pan, H. Chen, X. Chen, Z. Ye, H. Yuan, H. Sun and P. Wan, Oyster polysaccharides ameliorate intestinal mucositis and improve metabolism in 5-fluorouracil-treated S180 tumour-bearing mice. Carbohydr. Polym. 2021, 256, 117545. [Google Scholar] [CrossRef] [PubMed]
- J. Wu, Y. Gan, M. Li, L. Chen, J. Liang, J. Zhuo, H. Luo, N. Xu, X. Wu, Q. Wu, Z. Lin, Z. Su and Y. Liu, Patchouli alcohol attenuates 5-fluorouracil-induced intestinal mucositis via TLR2/MyD88/NF-kB pathway and regulation of microbiota. Biomed. Pharmacother. 2020, 124, 109883. [Google Scholar]
- M. B. Zeisel, P. Dhawan and T. F. Baumert, Tight junction proteins in gastrointestinal and liver disease. Gut 2019, 68, 547–561. [Google Scholar] [CrossRef]
- H. Chen, F. Zhang, R. Li, Y. Liu, X. Wang, X. Zhang, C. Xu, Y. Li, Y. Guo and Q. Yao, Berberine regulates fecal metabolites to ameliorate 5-fluorouracil induced intestinal mucositis through modulating gut microbiota. Biomed. Pharmacother. 2020, 124, 109829. [Google Scholar]
- H. L. Li, L. Lu, X. S. Wang, L. Y. Qin, P. Wang, S. P. Qiu, H. Wu, F. Huang, B. B. Zhang, H. L. Shi and X. J. Wu, Alteration of Gut Microbiota and Inflammatory Cytokine/Chemokine Profiles in 5-Fluorouracil Induced Intestinal Mucositis. Front. Cell Infect. Microbiol. 2017, 7, 455. [Google Scholar]
- S. Deng, D. Wu, L. Li, J. Li and Y. Xu, TBHQ attenuates ferroptosis against 5-fluorouracil-induced intestinal epithelial cell injury and intestinal mucositis via activation of Nrf2. Cell Mol. Biol. Lett. 2021, 26, 48. [Google Scholar]
- S. Kato, S. Hayashi, Y. Kitahara, K. Nagasawa, H. Aono, J. Shibata, D. Utsumi, K. Amagase and M. Kadowaki, Saireito (TJ-114), a Japanese traditional herbal medicine, reduces 5-fluorouracil-induced intestinal mucositis in mice by inhibiting cytokine-mediated apoptosis in intestinal crypt cells. PLoS ONE 2015, 10, e0116213. [Google Scholar]
- Atiq, B. Shal, M. Naveed, A. Khan, J. Ali, S. Zeeshan, S. D. Al-Sharari, Y. S. Kim and S. Khan, Diadzein ameliorates 5-fluorouracil-induced intestinal mucositis by suppressing oxidative stress and inflammatory mediators in rodents. Eur. J. Pharmacol. 2019, 843, 292–306. [Google Scholar] [CrossRef] [PubMed]
- J. Su, C. Li, X. Yu, G. Yang, J. Deng, Z. Su, H. Zeng, J. Chen, X. Zhang and X. Lai, Protective Effect of Pogostone on 2,4,6-Trinitrobenzenesulfonic Acid-Induced Experimental Colitis via Inhibition of T Helper Cell. Front. Pharmacol. 2017, 8, 829. [Google Scholar] [CrossRef] [PubMed]
- J. Sui, C. Zhang, X. Fang, J. Wang, Y. Li, J. Wang, L. Wang, J. Dong, Z. Zhou, C. Li, J. Chen, T. Ma and D. Chen, Dual role of Ca(2+)-activated Cl(-) channel transmembrane member 16A in lipopolysaccharide-induced intestinal epithelial barrier dysfunction in vitro. Cell Death Dis. 2020, 11, 404. [Google Scholar]
- L. Du, J. J. Kim, J. Shen and N. Dai, Crosstalk between Inflammation and ROCK/MLCK Signaling Pathways in Gastrointestinal Disorders with Intestinal Hyperpermeability. Gastroenterol. Res. Pract. 2016, 2016, 7374197. [Google Scholar]
- R. Al-Sadi, S. Guo, D. Ye and T. Y. Ma, TNF-alpha modulation of intestinal epithelial tight junction barrier is regulated by ERK1/2 activation of Elk-1. Am. J. Pathol. 2013, 183, 1871–1884. [Google Scholar] [CrossRef]
- C. R. Weber, D. R. Raleigh, L. Su, L. Shen, E. A. Sullivan, Y. Wang and J. R. Turner, Epithelial myosin light chain kinase activation induces mucosal interleukin-13 expression to alter tight junction ion selectivity. J. Biol. Chem. 2010, 285, 12037–12046. [Google Scholar] [CrossRef]
- S. Chen, K. Qian, G. Zhang and M. Zhang, Akkermansia muciniphila and its outer membrane protein Amuc_1100 prophylactically attenuate 5-fluorouracil-induced intestinal mucositis. Biochem. Biophys. Res. Commun. 2022, 614, 34–40. [Google Scholar] [CrossRef] [PubMed]
- T. Zhang, S. H. Lu, Q. Bi, L. Liang, Y. F. Wang, X. X. Yang, W. Gu and J. Yu, Volatile Oil from Amomi Fructus Attenuates 5-Fluorouracil-Induced Intestinal Mucositis. Front. Pharmacol. 2017, 8, 786. [Google Scholar] [CrossRef] [PubMed]
- X. Chu, X. J. Liu, J. M. Qiu, X. L. Zeng, H. R. Bao and J. Shu, Effects of Astragalus and Codonopsis pilosula polysaccharides on alveolar macrophage phagocytosis and inflammation in chronic obstructive pulmonary disease mice exposed to PM2.5. Environ. Toxicol. Pharmacol. 2016, 48, 76–84. [Google Scholar] [CrossRef]
- Y. Meng, Y. Xu, C. Chang, Z. Qiu, J. Hu, Y. Wu, B. Zhang and G. Zheng, Extraction, characterization and anti-inflammatory activities of an inulin-type fructan from Codonopsis pilosula. Int. J. Biol. Macromol. 2020, 163, 1677–1686. [Google Scholar] [CrossRef]
- S. M. Gao, J. S. Liu, M. Wang, T. T. Cao, Y. D. Qi, B. G. Zhang, X. B. Sun, H. T. Liu and P. G. Xiao, Traditional uses, phytochemistry, pharmacology and toxicology of Codonopsis: A review. J. Ethnopharmacol. 2018, 219, 50–70. [Google Scholar]
- Y. Zou, H. Yan, C. Li, F. Wen, X. Jize, C. Zhang, S. Liu, Y. Zhao, Y. Fu, L. Li, F. Liu, J. Chen, R. Li, X. Chen and M. Tian, A Pectic Polysaccharide from Codonopsis pilosula Alleviates Inflammatory Response and Oxidative Stress of Aging Mice via Modulating Intestinal Microbiota-Related Gut–Liver Axis. Antioxidants 2023, 12. [Google Scholar]
- J. Li, T. Wang, Z. Zhu, F. Yang, L. Cao and J. Gao, Structure Features and Anti-Gastric Ulcer Effects of Inulin-Type Fructan CP-A from the Roots of Codonopsis pilosula (Franch.) Nannf. Molecules 2017, 22. [Google Scholar]
- G. Pepe, S. F. Rapa, E. Salviati, A. Bertamino, G. Auriemma, S. Cascioferro, G. Autore, A. Quaroni, P. Campiglia and S. Marzocco, Bioactive Polyphenols from Pomegranate Juice Reduce 5-Fluorouracil-Induced Intestinal Mucositis in Intestinal Epithelial Cells. Antioxidants 2020, 9. [Google Scholar]
- J. H. Liu, C. H. Hsieh, C. Y. Liu, C. W. Chang, Y. J. Chen and T. H. Tsai, Anti-inflammatory effects of Radix Aucklandiae herbal preparation ameliorate intestinal mucositis induced by 5-fluorouracil in mice. J. Ethnopharmacol. 2021, 271, 113912. [Google Scholar] [CrossRef]
- D. Korenaga, M. Honda, M. Yasuda, S. Inutsuka, T. Nozoe and H. Tashiro, Increased intestinal permeability correlates with gastrointestinal toxicity among formulations of the fluorouracil analogue tegafur in rats. Eur. Surg. Res. 2002, 34, 351–356. [Google Scholar] [CrossRef]
- C. Tefas, L. Ciobanu, C. Berce, A. Mester, S. Onica, C. Toma, M. Tantau and M. Taulescu, Beneficial effect of oral administration of zinc sulfate on 5-fluorouracil-induced gastrointestinal mucositis in rats. Eur. Rev. Med. Pharmacol. Sci. 2020, 24, 11365–11373. [Google Scholar]
- X. Y. Wang, B. Zhang, Y. Lu, L. Xu, Y. J. Wang, B. Y. Cai and Q. H. Yao, RNA-seq and In Vitro Experiments Reveal the Protective Effect of Curcumin against 5-Fluorouracil-Induced Intestinal Mucositis via IL-6/STAT3 Signaling Pathway. J. Immunol. Res. 2021, 2021, 8286189. [Google Scholar]
- D. C. Xiang, J. Y. Yang, Y. J. Xu, S. Zhang, M. Li, C. Zhu, C. L. Zhang and D. Liu, Protective effect of Andrographolide on 5-Fu induced intestinal mucositis by regulating p38 MAPK signaling pathway. Life Sci. 2020, 252, 117612. [Google Scholar] [CrossRef]
- X. Li, Q. Li, B. Xiong, H. Chen, X. Wang and D. Zhang, Discoidin domain receptor 1(DDR1) promote intestinal barrier disruption in Ulcerative Colitis through tight junction proteins degradation and epithelium apoptosis. Pharmacol. Res. 2022, 183, 106368. [Google Scholar] [CrossRef] [PubMed]
- H. T. Idriss and J. H. Naismith, TNF? and the TNF receptor superfamily: Structure-function relationship(s). Microsc. Res. Tech. 2000, 50, 184–195. [Google Scholar] [CrossRef]
- S. Huang, Y. Fu, B. Xu, C. Liu, Q. Wang, S. Luo, F. Nong, X. Wang, S. Huang, J. Chen, L. Zhou and X. Luo, Wogonoside alleviates colitis by improving intestinal epithelial barrier function via the MLCK/pMLC2 pathway. Phytomedicine 2020, 68, 153179. [Google Scholar] [CrossRef] [PubMed]
- J. Wu, Y. Gan, H. Luo, N. Xu, L. Chen, M. Li, F. Guan, Z. Su, Z. Lin, J. Xie and Y. Liu, beta-Patchoulene Ameliorates Water Transport and the Mucus Barrier in 5-Fluorouracil-Induced Intestinal Mucositis Rats via the cAMP/PKA/CREB Signaling Pathway. Front. Pharmacol. 2021, 12, 689491. [Google Scholar] [CrossRef] [PubMed]
- J. M. Cavaillon, Exotoxins and endotoxins: Inducers of inflammatory cytokines. Toxicon 2018, 149, 45–53. [Google Scholar] [CrossRef]
- P. C. Heinrich, I. Behrmann, S. Haan, H. M. Hermanns, G. Muller-Newen and F. Schaper, Principles of interleukin (IL)-6-type cytokine signalling and its regulation. Biochem. J. 2003, 374, 1–20. [Google Scholar] [CrossRef]
- N. Nishimoto and T. Kishimoto, Inhibition of IL-6 for the treatment of inflammatory diseases. Curr. Opin. Pharmacol. 2004, 4, 386–391. [Google Scholar] [CrossRef]
- T. Kucharzik, N. Lugering, H. G. Pauels, W. Domschke and R. Stoll, IL-4, IL-10 and IL-13 down-regulate monocyte-chemoattracting protein-1 (MCP-1) production in activated intestinal epithelial cells. Clin. Exp. Immunol. 1998, 111, 152–157. [Google Scholar]
- X. Liu, J. Xu, Q. Mei, L. Han and J. Huang, Myosin Light Chain Kinase Inhibitor Inhibits Dextran Sulfate Sodium-Induced Colitis in Mice. Dig. Dis. Sci. 2012, 58, 107–114. [Google Scholar]
- Y. Y. Shao, Y. N. Zhao, Y. F. Sun, Y. Guo, X. Zhang, Z. P. Chang, R. G. Hou and J. Gao, Investigation of the internalization and transport mechanism of Codonopsis Radix polysaccharide both in mice and Caco-2 cells. Int. J. Biol. Macromol. 2022, 215, 23–35. [Google Scholar] [CrossRef] [PubMed]
- J. -h. Chen, C.-l. Zhao, Y.-s. Li, Y.-b. Yang, J.-g. Luo, C. Zhang and L. Wang, Moutai Distiller's grains Polyphenol extracts and rutin alleviate DSS-induced colitis in mice: Modulation of gut microbiota and intestinal barrier function (R2). Heliyon 2023, 9. [Google Scholar]
- Adak and M., R. Khan, An insight into gut microbiota and its functionalities. Cell Mol. Life Sci. 2019, 76, 473–493. [Google Scholar] [CrossRef] [PubMed]
- Kong, R. Gao, X. Yan, L. Huang, J. He, H. Li, J. You and H. Qin, Alterations in intestinal microbiota of colorectal cancer patients receiving radical surgery combined with adjuvant CapeOx therapy. Sci. China Life Sci. 2019, 62, 1178–1193. [Google Scholar] [CrossRef] [PubMed]
- E. Kim, D. B. Kim and J. Y. Park, Changes of Mouse Gut Microbiota Diversity and Composition by Modulating Dietary Protein and Carbohydrate Contents: A Pilot Study. Prev. Nutr. Food Sci. 2016, 21, 57–61. [Google Scholar] [CrossRef]
- M. Qasim, M. Wrage, B. Nuse and J. Mattner, Shigella Outer Membrane Vesicles as Promising Targets for Vaccination. Int. J. Mol. Sci. 2022, 23. [Google Scholar]
Disclaimer/Publisher’s Note: The statements, opinions and data contained in all publications are solely those of the individual author(s) and contributor(s) and not of MDPI and/or the editor(s). MDPI and/or the editor(s) disclaim responsibility for any injury to people or property resulting from any ideas, methods, instructions or products referred to in the content. |
© 2023 by the authors. Licensee MDPI, Basel, Switzerland. This article is an open access article distributed under the terms and conditions of the Creative Commons Attribution (CC BY) license (http://creativecommons.org/licenses/by/4.0/).


