1. Introduction
As wireless communication technology rapidly develops, spectrum resources cannot meet the growing number of internet of thing (IoT) devices and their applications. However, the frequency spectrum by primary users (PUs) still lies in insufficient state in the time or space domain. To address this concern, cognitive radio (CR) is regarded as a prospective technology to identify available spectrum resources and allow IoT devices to opportunistically access it [
1,
2], without causing harmful interference to PUs [
3]. But spectrum sensing behaviors of the single IoT device is susceptible to inherent factors of wireless propagations. Consequently, cooperative spectrum sensing (CSS) paradigm is formulated to exploit spatial diversity and then improve the sensing accuracy of the PU signal through the observations of spatially positioning IoT devices. However, IoT architectures differ from traditional network architectures, which imply a high degree of reconfigurability, adaptability, mobility, and heterogeneity, and present some insurmountable challenges to spectrum sensing. Traditional spectrum sensing techniques must be carefully redesigned for use in complex and scalable IoT systems [
4].
In the past, there are some researchers to investigate spectrum sensing for IoT systems. An energy-efficient reliable decision transmission in Zhu et al. to was proposed to decrease packet error and packet loss in industrial IoT [
5]. At a low signal-to-noise ratio (SNR) environment, to minimize the energy consumption and sensing time, Ansere et al. proposed a dynamic spectrum sensing algorithm [
6]. Wan et al. proposed an energy-efficient CSS scheme to reduce the negative impact of spatial correlation [
7]. Since the previous energy detector is usually limited by the noise-uncertain, Miah et al. also proposed an energy efficient CSS in based CR-enabled IoTs network under the interference constraint [
8]. Considering that battery-limited IoT devices are densely interconnected, Dao et al. optimized the sensing efficiency to leverage a lightweight but effective adaptive medium learning method [
9]. Long et al. developed a harvesting-sensing-transmission tradeoff problem based cognitive IoT to take the diversity of energy harvesting efficiency, spectrum sensing performance and quality-of-service (QoS) of data transmission into consideration [
10]. In order to enhance spectrum utilization in a 5G-based IoT, Abbas et al. proposed a hybrid mode of underlay and interweave enabled scheme [
11]. Gharib et al. proposed a heterogeneous multi-band multi-user CSS scheme to realize secondary users’ scheduling to sense a subset of channel in heterogeneous distributed CR networks [
12]. Ejaz et al. presented multiband CSS and resource allocation framework in a CR-enabled IoT 5G network to minimize the energy consumption under the performance requirement [
13]. To maximize the effective throughput, Zhang et al. jointly optimized the sensing time and packet error rate in cognitive IoT [
14]. Miah et al. presented a CSS technique in a noise-uncertain environment to comprise the use of the Kullback-Leibler divergence in CR-based IoT [
15]. To encourage the spectrum sharing among unlicensed IoT devises, Lu et al. integrated the incentive mechanism into orthogonal frequency division multiplexing (OFDM)-based cognitive IoT network with multiple unlicensed IoT devises in the context of incomplete information [
16]. In the CSS of high real-time scene of IoTs, Gao et al. considered an improved CSS scheme to decrease the latency and increase low throughput, where each cognitive node performs truncated sequential probability ratio test (SPRT) over each observation vector [
17]. Wu et al. achieved CSS between micro-sensing slots in cognitive unmanned aerial vehicle networks and approximated the error probability and the stopping time [
18].
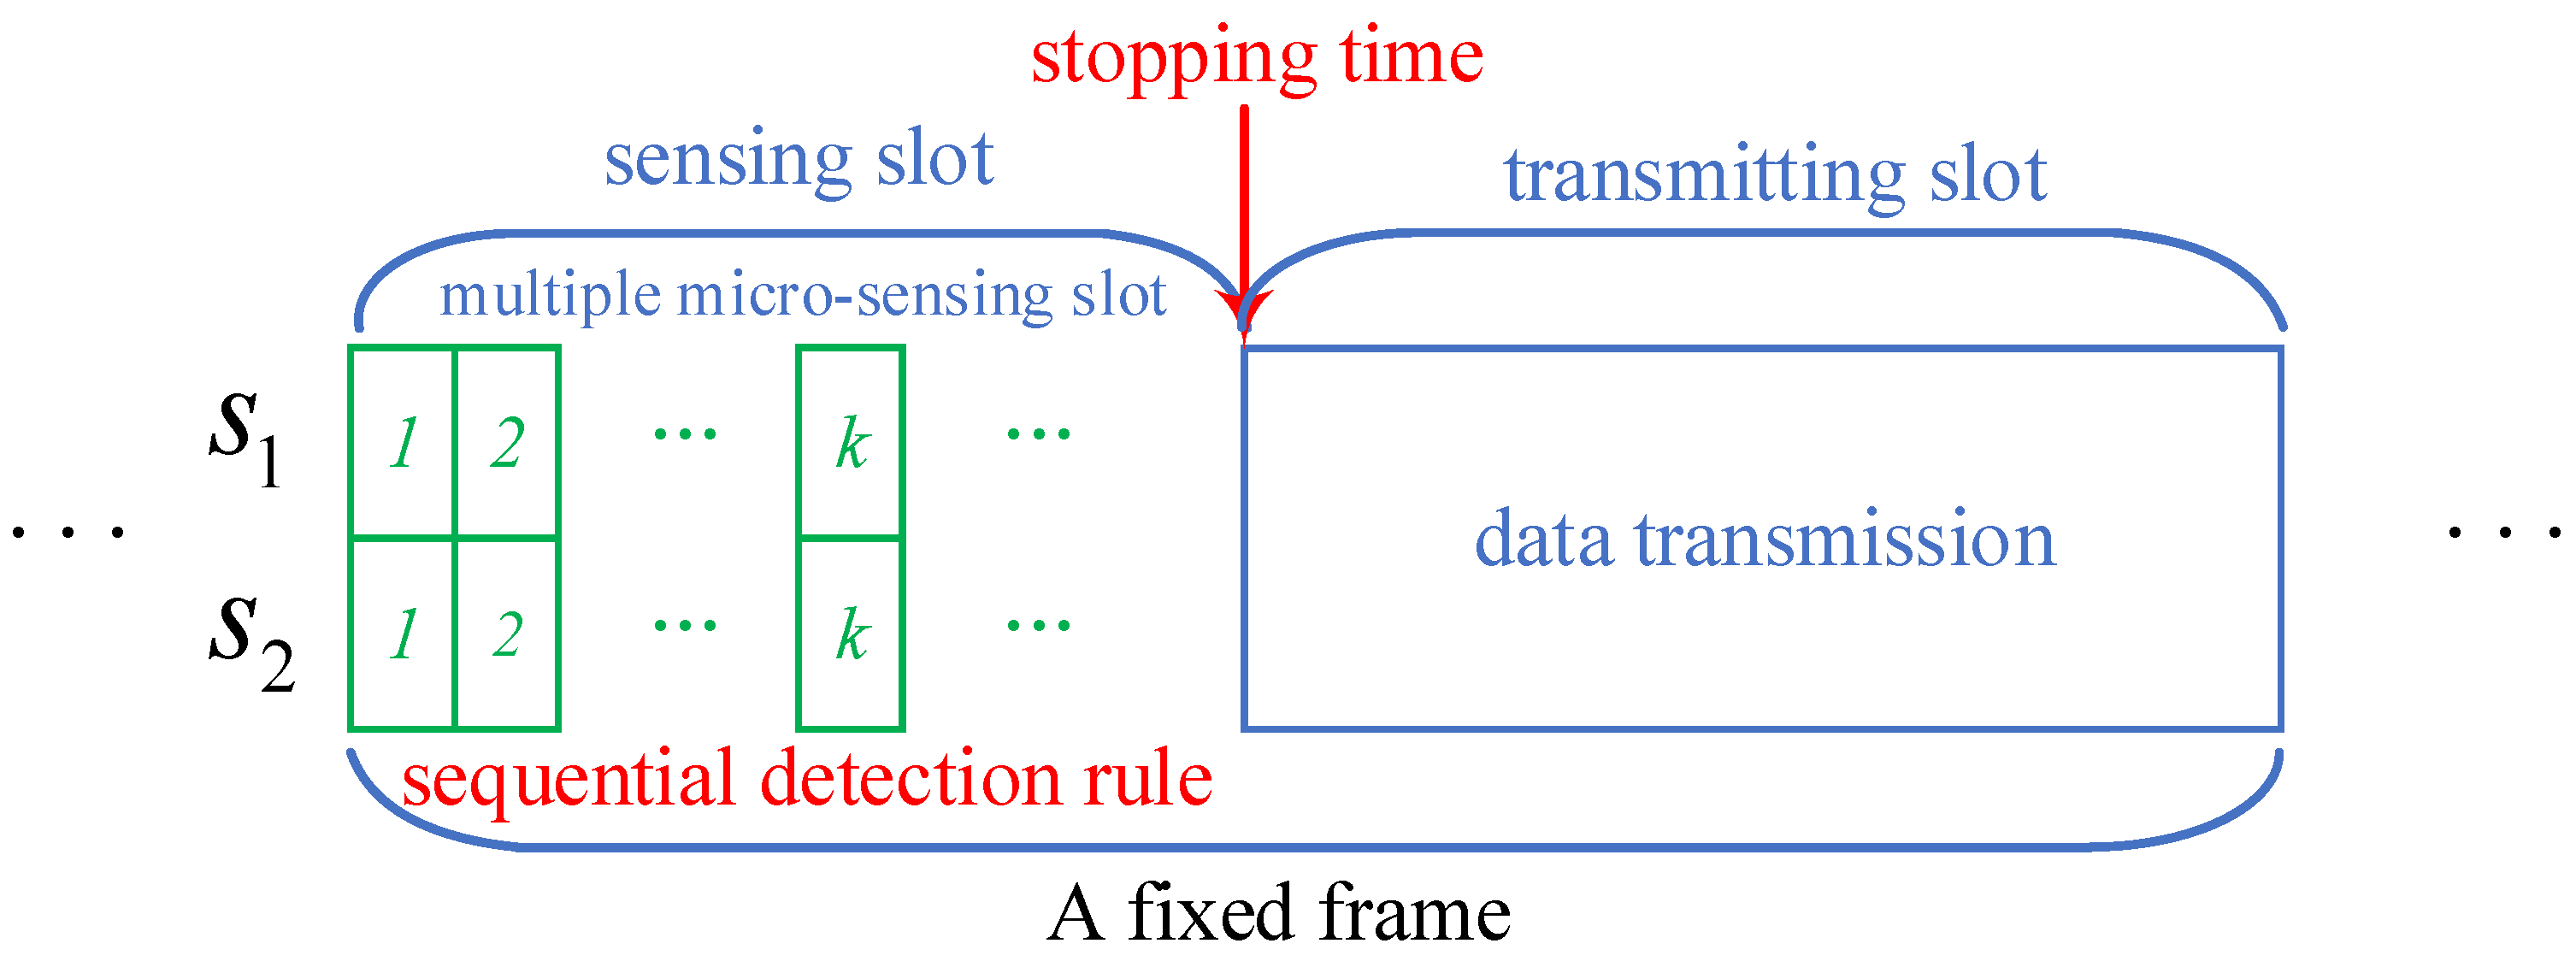
Most of these efforts are focused on CR-enabled IoT, considering issues such as the achievable throughput, energy efficiency, frequency efficiency, or joint optimization with spectrum resource allocation algorithm. These issues are also common in traditional CR networks. However, they did not take into account the cost issues in cognitive IoT, such as the sensing/stopping time cost, the cost of incorrect decisions, especially when considering CSS among multiple IoT devices. Because only by achieving low-cost detection of the PU while ensuring spectrum sensing performance) can efficient spectrum sensing and resource allocation be achieved. Therefore, this article considers the optimal decision rule in cognitive IoT from the perspective of cost. To this end, a distributed cognitive IoT model is first established, including a pair of IoT devices for CSS and sequential detection, on the basis of which the stopping time and decision cost are defined, and the joint optimization problem between them is proposed. The optimal stopping time and threshold are analyzed by dynamic programming to obtain the optimal decision rule.
The remainder of this article is organized as follows. The local spectrum sensing model and sequential detection for CSS in a cognitive IoT are presented in
Section 2. The optimal stopping time and decision rule based on distributed sequential detection is proposed and analyzed in
Section 3. Comprehensive simulation result analyses and discussions are discussed in
Section 4, and
Section 5 draws a conclusion about this article.
3. Disributed Sequential Detection
According to the above model, we delve into the distributed sequential detection for a cognitive IoT in this section, including the optimal stopping time and the optimal sequential detection.
3.1. Problem Formulation
To study the cost problem of a distributed sequential detection, we define a cost function
indicates the cost of error decision in any one or both of the decisions made by a pair of IoT devices. To be specific,
,
,
, and
. Similarly, the inequalities apply to
. From these inequalities, each additional sample of an IoT device also incurs a cost of
. Combining the time of stopping sampling and the cost function, there is a following decision problem, such as,
3.2. Preliminary Analysis
Since a positive cost
correlates with each additional time step taken by IoT devices in (8), the person-by-person optimization (PBPO) approach is applied to distributed sequential detection to address the problem of (8) [
21]. Fixing
, a stochastic optimization problem is described as
In (9), there is a special case, i.e., , which is a classical sequential detection problem. Additionally, the cost function may be coupled between the two IoT devices.
Before solving (9), a sufficient statistic is preset as
and the recursion result from Bayes’ formula can be expressed as
with
. Obviously,
forms a Markov process about the filtration
.
Considering the finite horizon problem, IoT device discontinues sampling and derives a decision not later than time . Let denote the minimal expected cost at the -th micro-sensing slot, a dynamic programming equation
- (1)
- (2)
When
,
, we have
where
.
Since is the minimal expected cost of the finite horizon problem, (12) and (13) provide the dependence of the minimal expected cost on the sufficient statistic . It can be clearly seen from the right-hand side of unfolding (12), according to , , and using (8). The same holds true for (13), then we have .
In addition, we define a function with respect to
as
, for all
, there are inequalities about
and
which follow their respective definitions, i.e.,
and
Moreover, the monotonicity results of
can be given by
and
since each of the left-hand quantities is a hypo-mundum, on a larger set of stopping times than the corresponding right-hand quantity.
3.3. Optimal Stopping Time
To solve problem (9), we consider the limit
, the pointwise limit of
exists and is independent of
. More specifically, we have
Theorem 1. The minimal expected cost on
satisfies the Bellman equation
where
.
The optimal stopping time is
where a pair of thresholds
are described as
and
Proof of Theorem 1. Taking the limit of (13) and using (18), (19) follows. The concavity of derives from the limit of concave functions. Inequalities like (14) and (15) also hold. Utilizing these inequalities, the concavity of , and , the optimal stopping time is the threshold type, as shown in (20), where the threshold is determined by □
This establishes the proposition.
3.4. Optimal Decision Rule
Similar to an argument used in the proof of Proposition 7.4 [
20], the uniqueness of the limit value function for (9) follows. Moreover, since the optimal thresholds
and
are coupled from (14) and (15), two simultaneous dynamic programming equations should be solved.
Given a value of , the optimal local decision rule of the IoT device is derived, vice versa. That is to say, when two IoT devices achieve their respective optimal decisions for each other’s optimal decision rule. As a result, the global optimal decision rules can be iteratively implemented by continuously fixing the threshold of one IoT device and optimizing the threshold of the other by Theorem 1.
Finally, there are following process at the optimal decision rule of the IoT devices
,
, such as, (1) if
, the decision rule accepts
; (2) if
, the decision rule accepts accept
; (3) if
, the decision rule continues sampling, where a pair of thresholds
at the per-IoT device are obtained by
and
where
and
are the tolerable miss detection probability and the tolerable false alarm probability, respectively.
A similar method can be utilised for the quickest detection problem. In such a problem, each of the IoT devices
sequentially receives observations
, then there exists a change point
following a geometric distribution with a mass at 0, and correspondingly there is a known marginal density
for
and
for
. Given the change point, IoT device observations are assumed to be conditionally independent and it is valid within IoT devices and across IoT devices. Now, in order to quickly detect the change point and control the false alarm probability, each IoT device needs to optimally select stopping times
(each measurable with respect to their own filtrations
) with aim of minimizing
, where
. Therefore, the optimal solution can be given by
and
where a pair of optimal thresholds
and
are coupled via a system of two dynamic programming equations. The term
appears in the cost function that couples the solution.
4. Simulation results
In this section, simulation results are introduced to corroborate the correctness and effectiveness of our proposal with respect to the global performance and the average cost from a IoT device. To this end, in 106 spectrum sensing frames, unless otherwise specified, some parameter settings are considered as follows: the number of micro-sensing slots is 20, the probability of the hypothesis is 0.5, the local detection probability and the local false alarm probability are set to be 0.6 and 0.4, respectively. Both of the tolerable false alarm probability and the tolerable false alarm probability varies from 0.01 to 0.3 within an interval of 0.01.
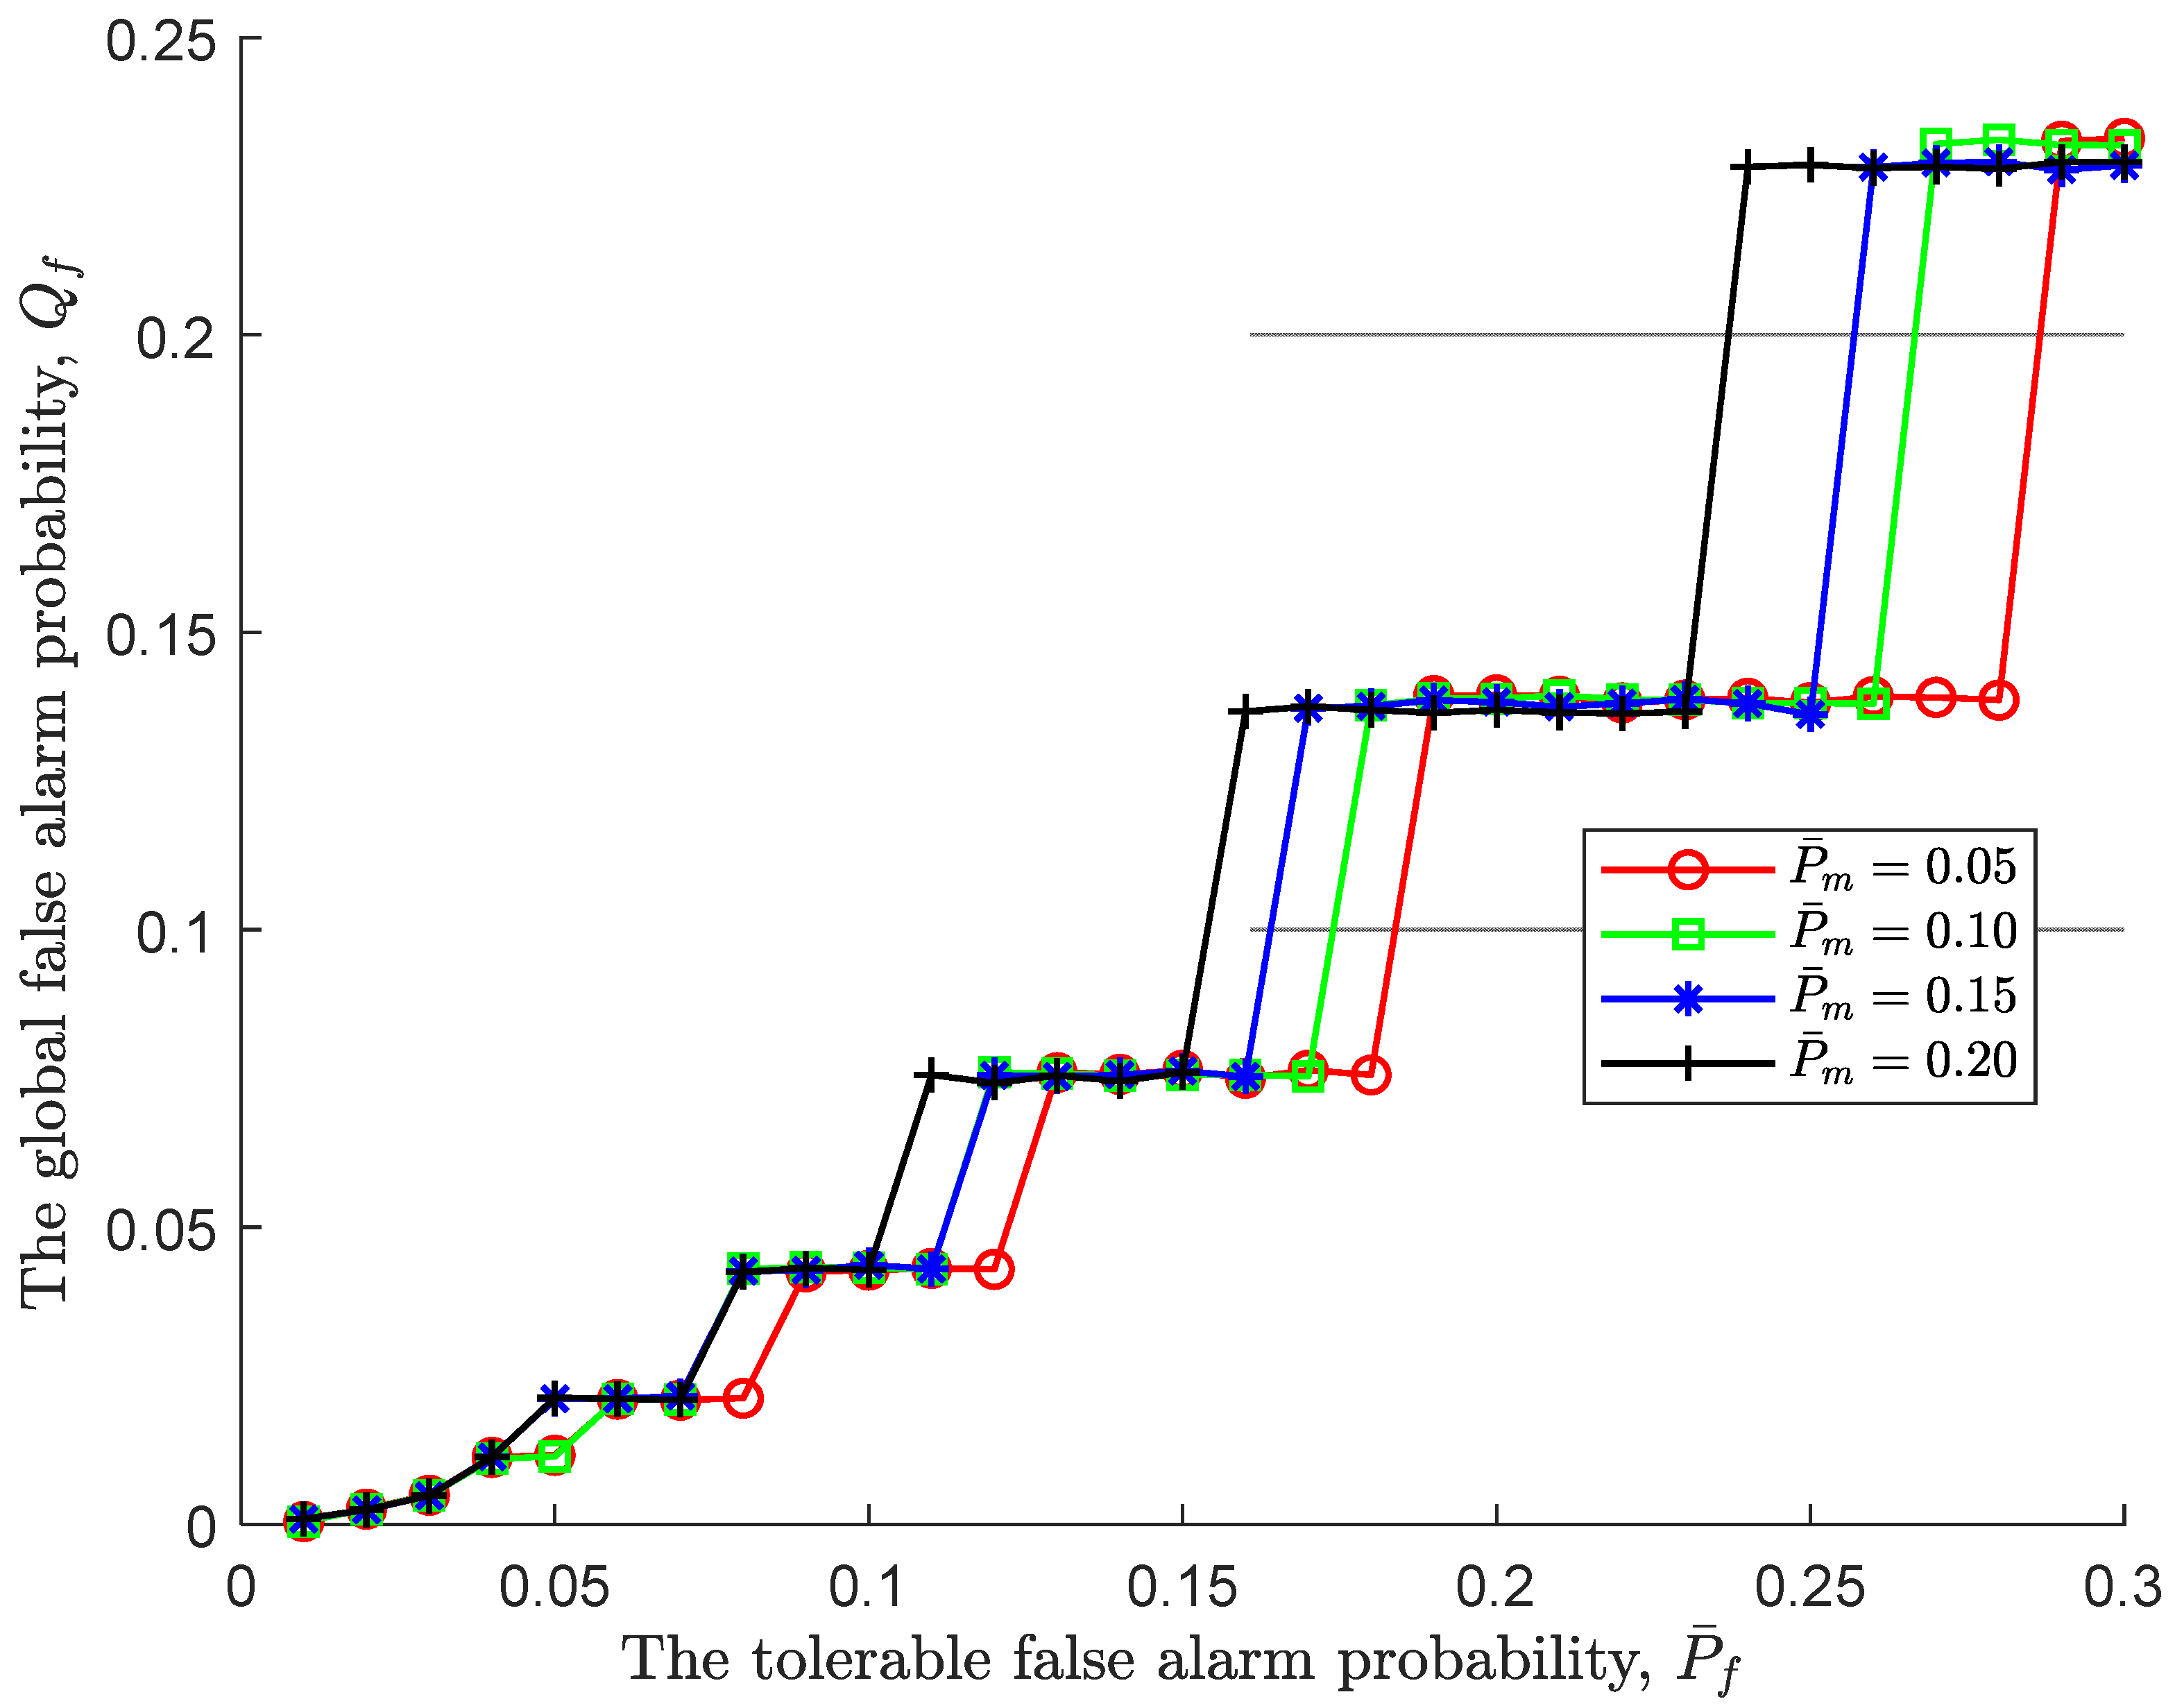
Figure 2 illustrates the relationship of the global false alarm probability
and the tolerable false alarm probability
under various tolerable miss detection probabilities. First of all, it can be seen that as the tolerable false alarm probability becomes more relaxed, the global false alarm probability shows a stepwise increase, and the larger the tolerable false alarm probability, the larger the gradient of the step. This is because for a fixed probability, an increase in the tolerable false alarm probability leads to a decrease in the upper threshold
, and the sequential detection rule is easier to accept
, which in turn results in an increase in the global false alarm probability. Meanwhile, it is worth noting that on the steps before the global false alarm probability jumps, although the tolerable false alarm probability continues to increase, the global false alarm probability remains unchanged. At this point, an increase in the initial stopping time does not bring about a change in the global false alarm probability, that is, an increase in observation does not bring about a change in the global false alarm probability, and the initial stopping time is the optimal stopping time.
Moreover, the impact of the tolerable miss detection probability on the global false alarm probability can be neglectable at the beginning. That is to say, the thresholds of the sequential detection rule is still not satisfied. But as the tolerable false alarm probability increases, the impact of the tolerable miss detection probability is becoming more and more obvious. To be specific, the larger the tolerable miss detection probability, the faster the global false alarm probability jumps. Apparently, the large the tolerable miss detection probability, the larger the upper threshold , resulting in a more acceptable .
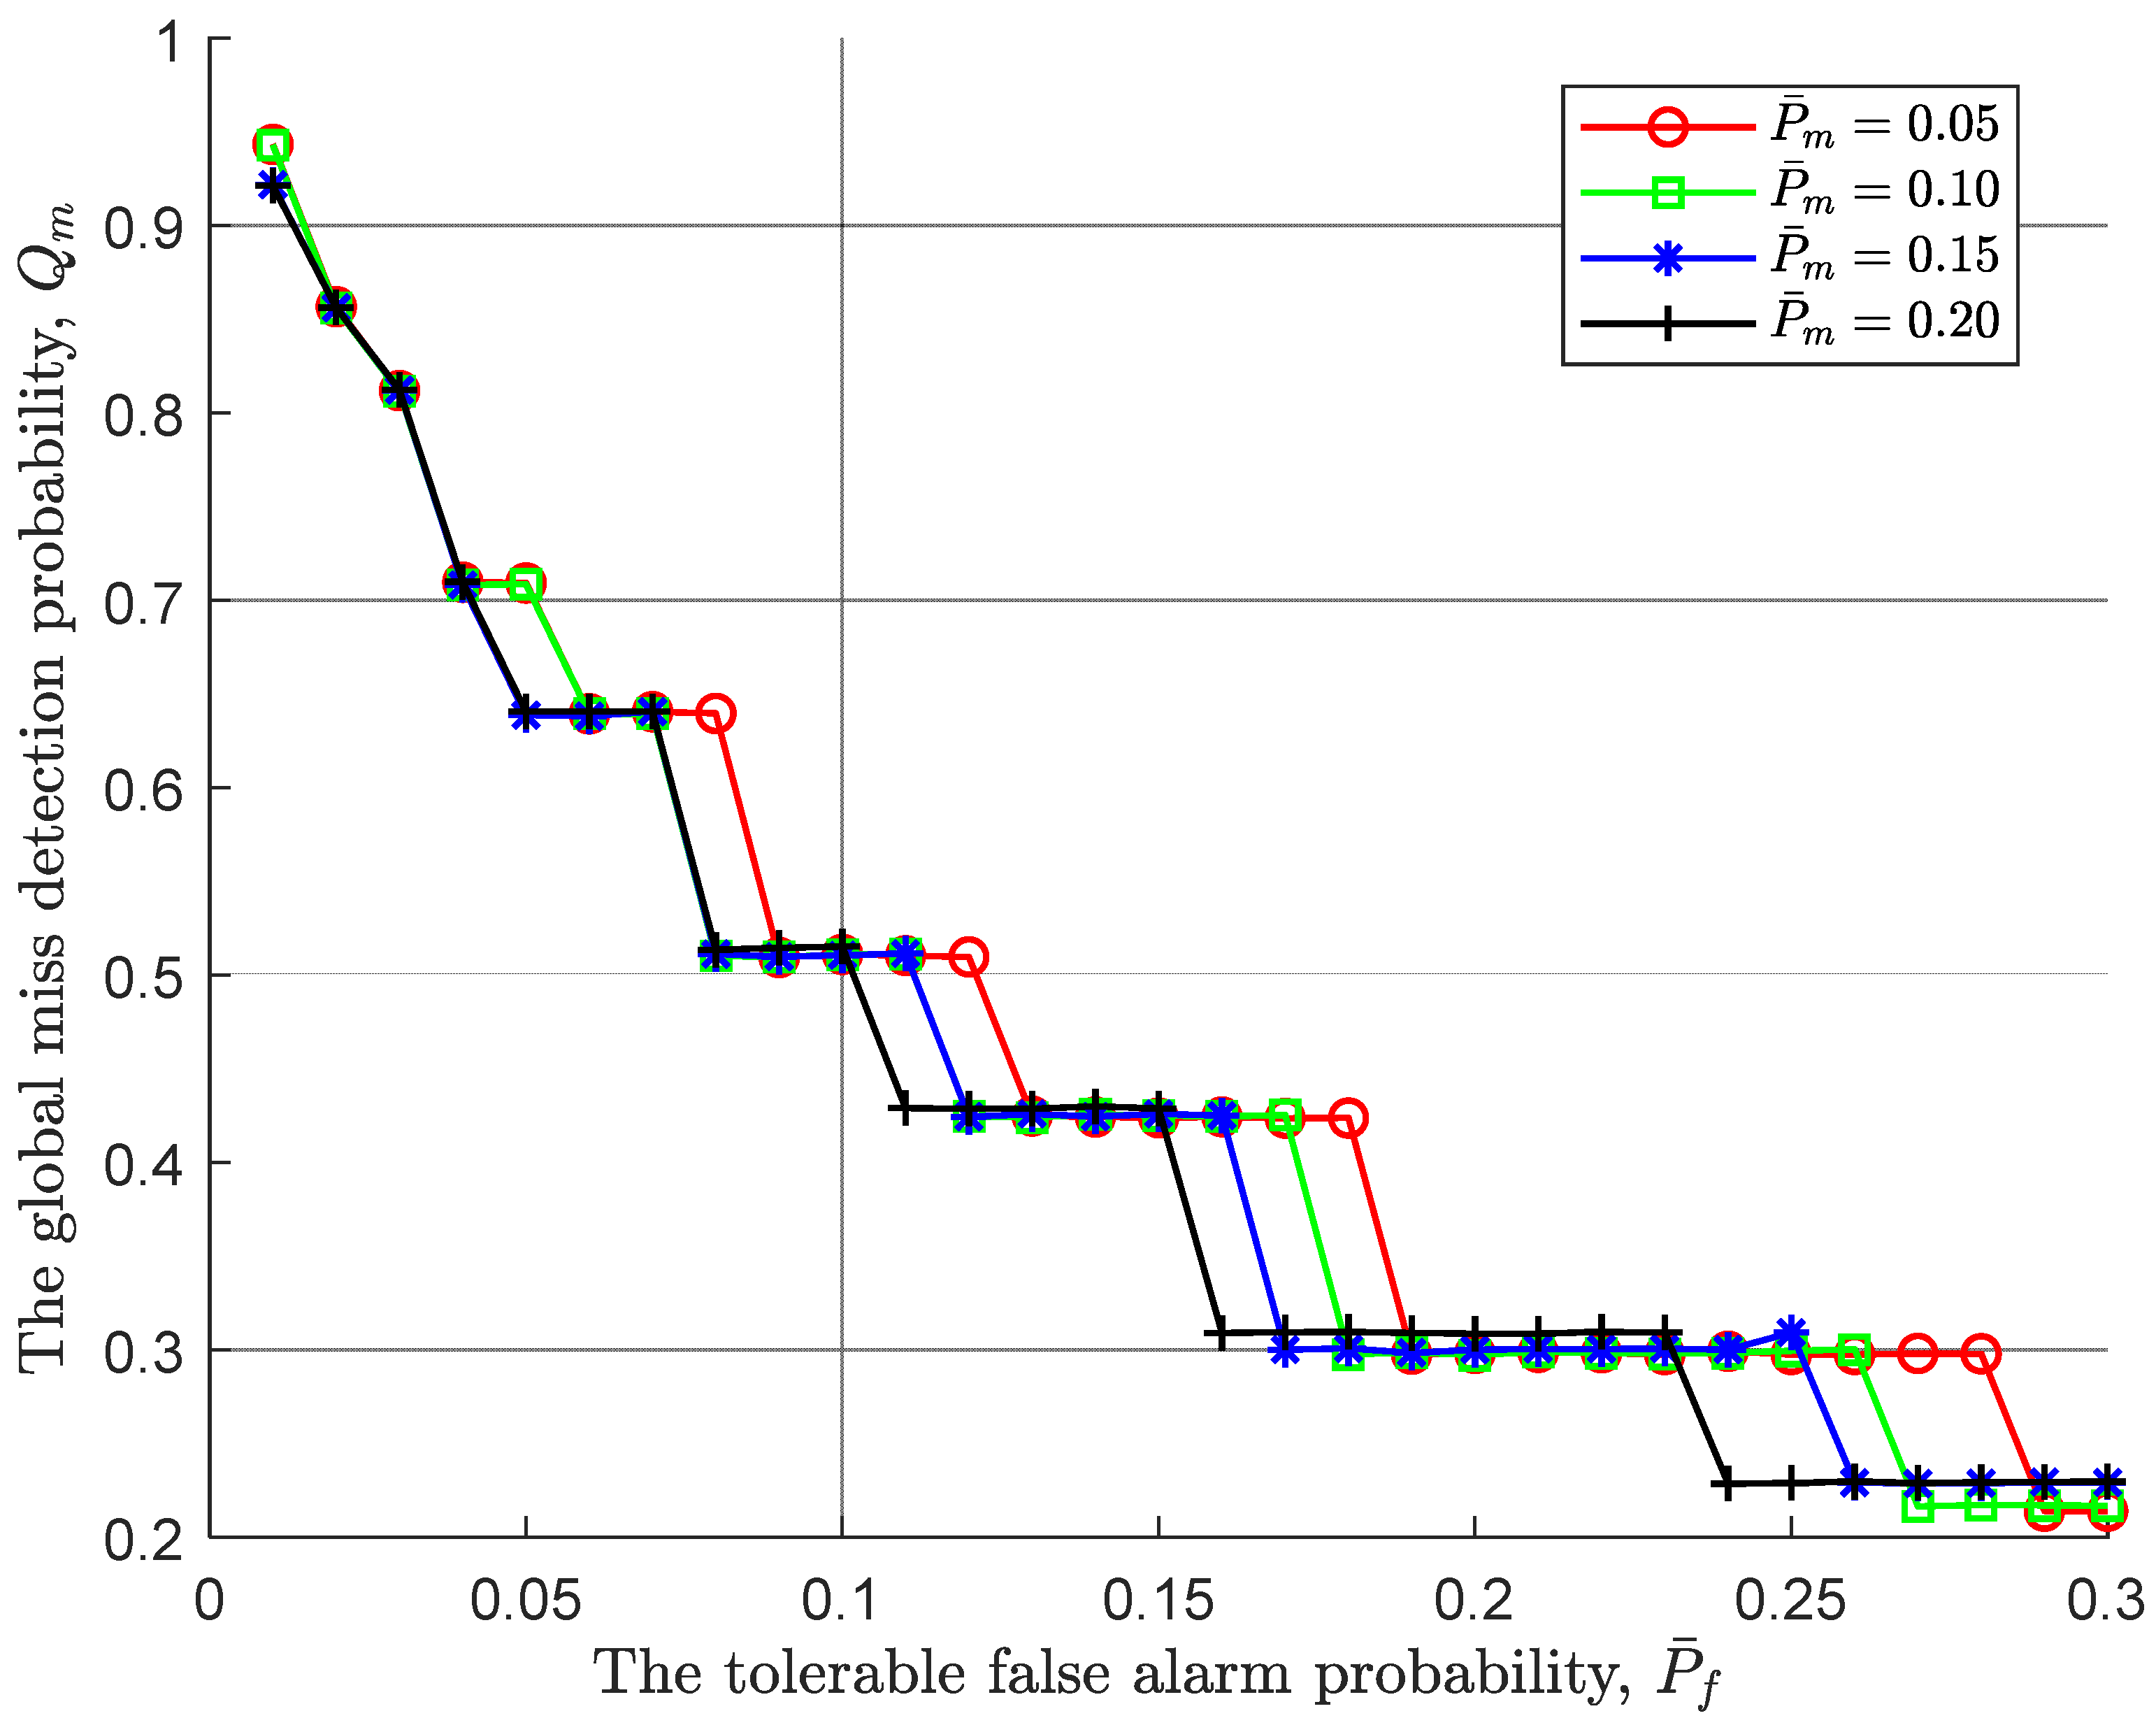
Under various tolerable miss detection probabilities, the relationship of the global miss detection probability
and the tolerable false alarm probability
is shown in
Figure 3. In contrast to
Figure 2, the tolerable false alarm probability has a greater effect on the global miss detection probability than the global false alarm probability and the effect is positive. In details, when the tolerable false alarm probability increases from 0.01 to 0.3, correspondingly, the global miss detection probability basically goes down from 0.95 to 0.22. Since the lower threshold
increases as the tolerable false alarm probability increases according to (25), the sequential detection rule is prone to accept
, resulting in a decrease of the global miss detection probability. Furthermore, in such an environment, the global miss detection probability of a large tolerable miss detection probability decreases first because it increases the lower threshold
, i.e.,
.
Figure 2.
The global false alarm probability vs the tolerable false alarm probability.
Figure 2.
The global false alarm probability vs the tolerable false alarm probability.
Figure 3.
The global miss detection probability vs the tolerable false alarm probability.
Figure 3.
The global miss detection probability vs the tolerable false alarm probability.
In addition, similar to
Figure 2, the steps before the global miss detection probability jumps, although the tolerable false alarm probability continues to increase, the global false alarm probability remains unchanged. At this point, an increase in the initial stopping time does not bring about a change in the global miss detection probability, that is, an increase in observation does not bring about a change in the global miss detection probability, and the initial stopping time is the optimal stopping time.
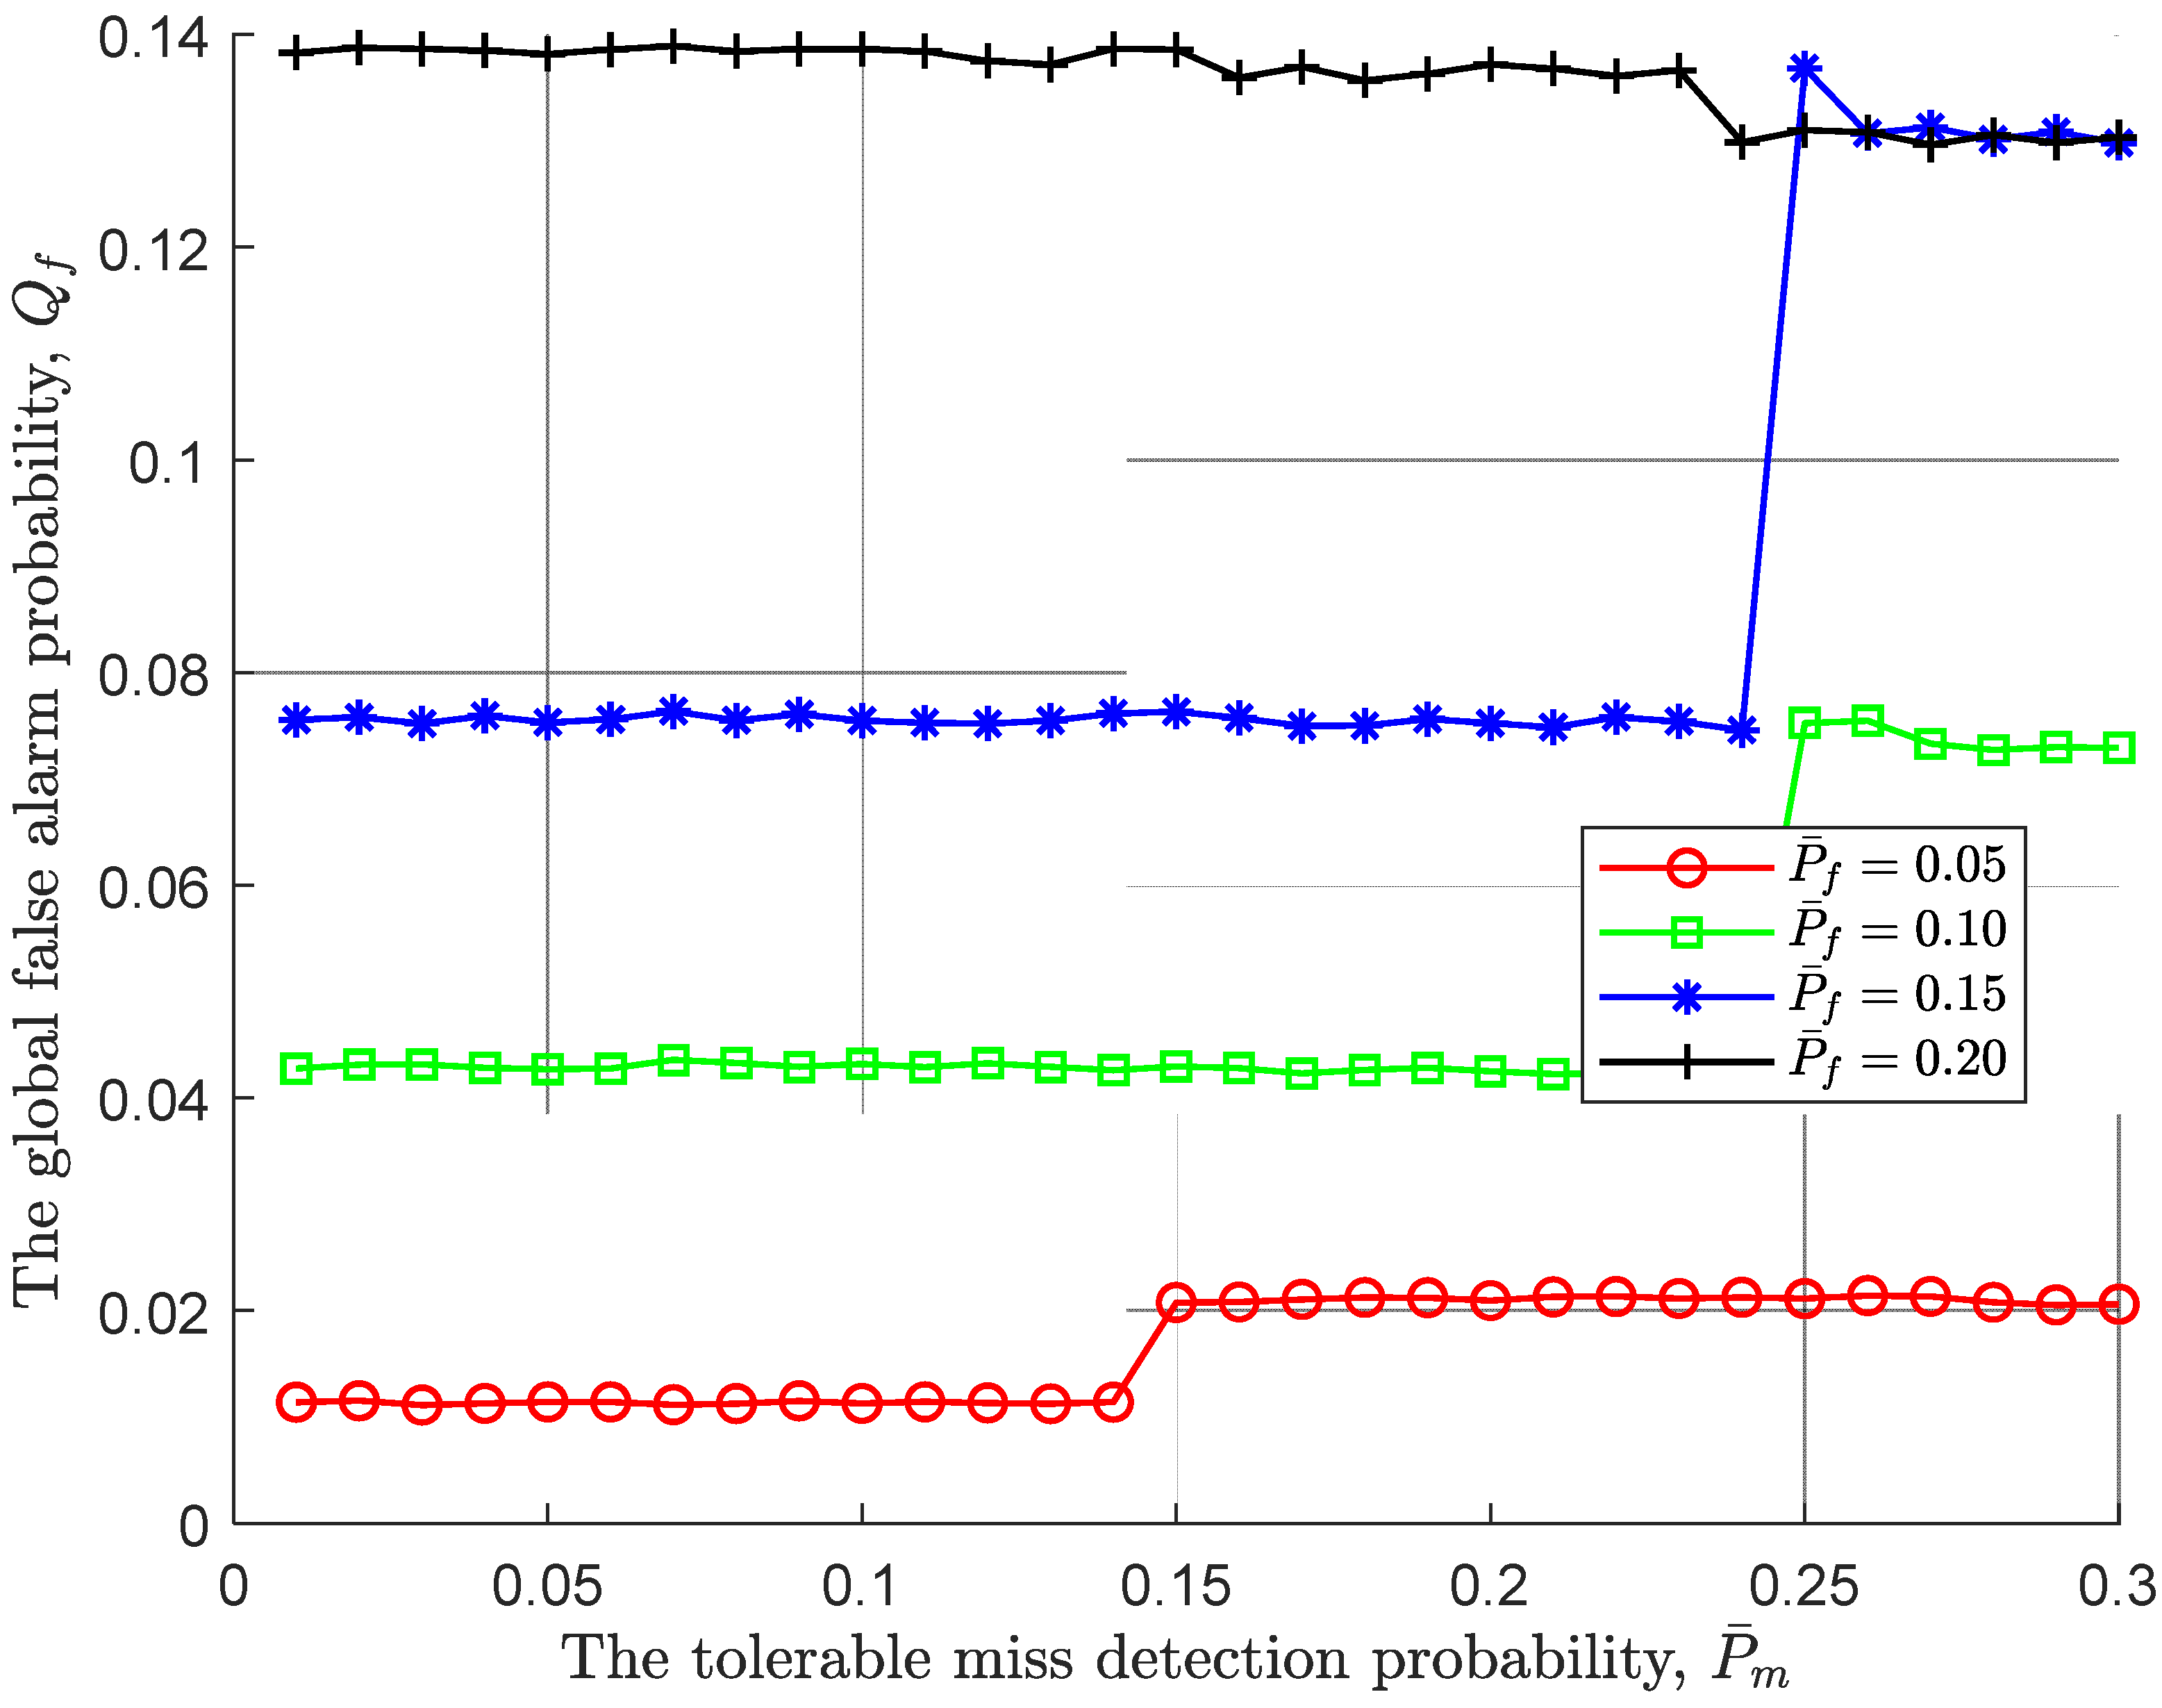
Next, we further take the impact of the tolerable miss detection probability on the global performance given a fixed tolerable false alarm probability into consideration. As displayed in
Figure 4, regardless of the tolerable miss detection probability, it is obvious that a large tolerable false alarm probability leads to a low upper threshold
, therefore being prone to accept
. However, it also should be noted that as the tolerable miss detection probability increases, the global false alarm probability under different tolerable false alarm has jitter at different positions, such as jitter up at
and jitter down when
. This is not surprise, and is a direct of that a pair of tolerable probabilities simultaneously change, and the decision condition is reached within a certain stopping time.
Figure 4.
The global false alarm probability vs the tolerable miss detection probability.
Figure 4.
The global false alarm probability vs the tolerable miss detection probability.
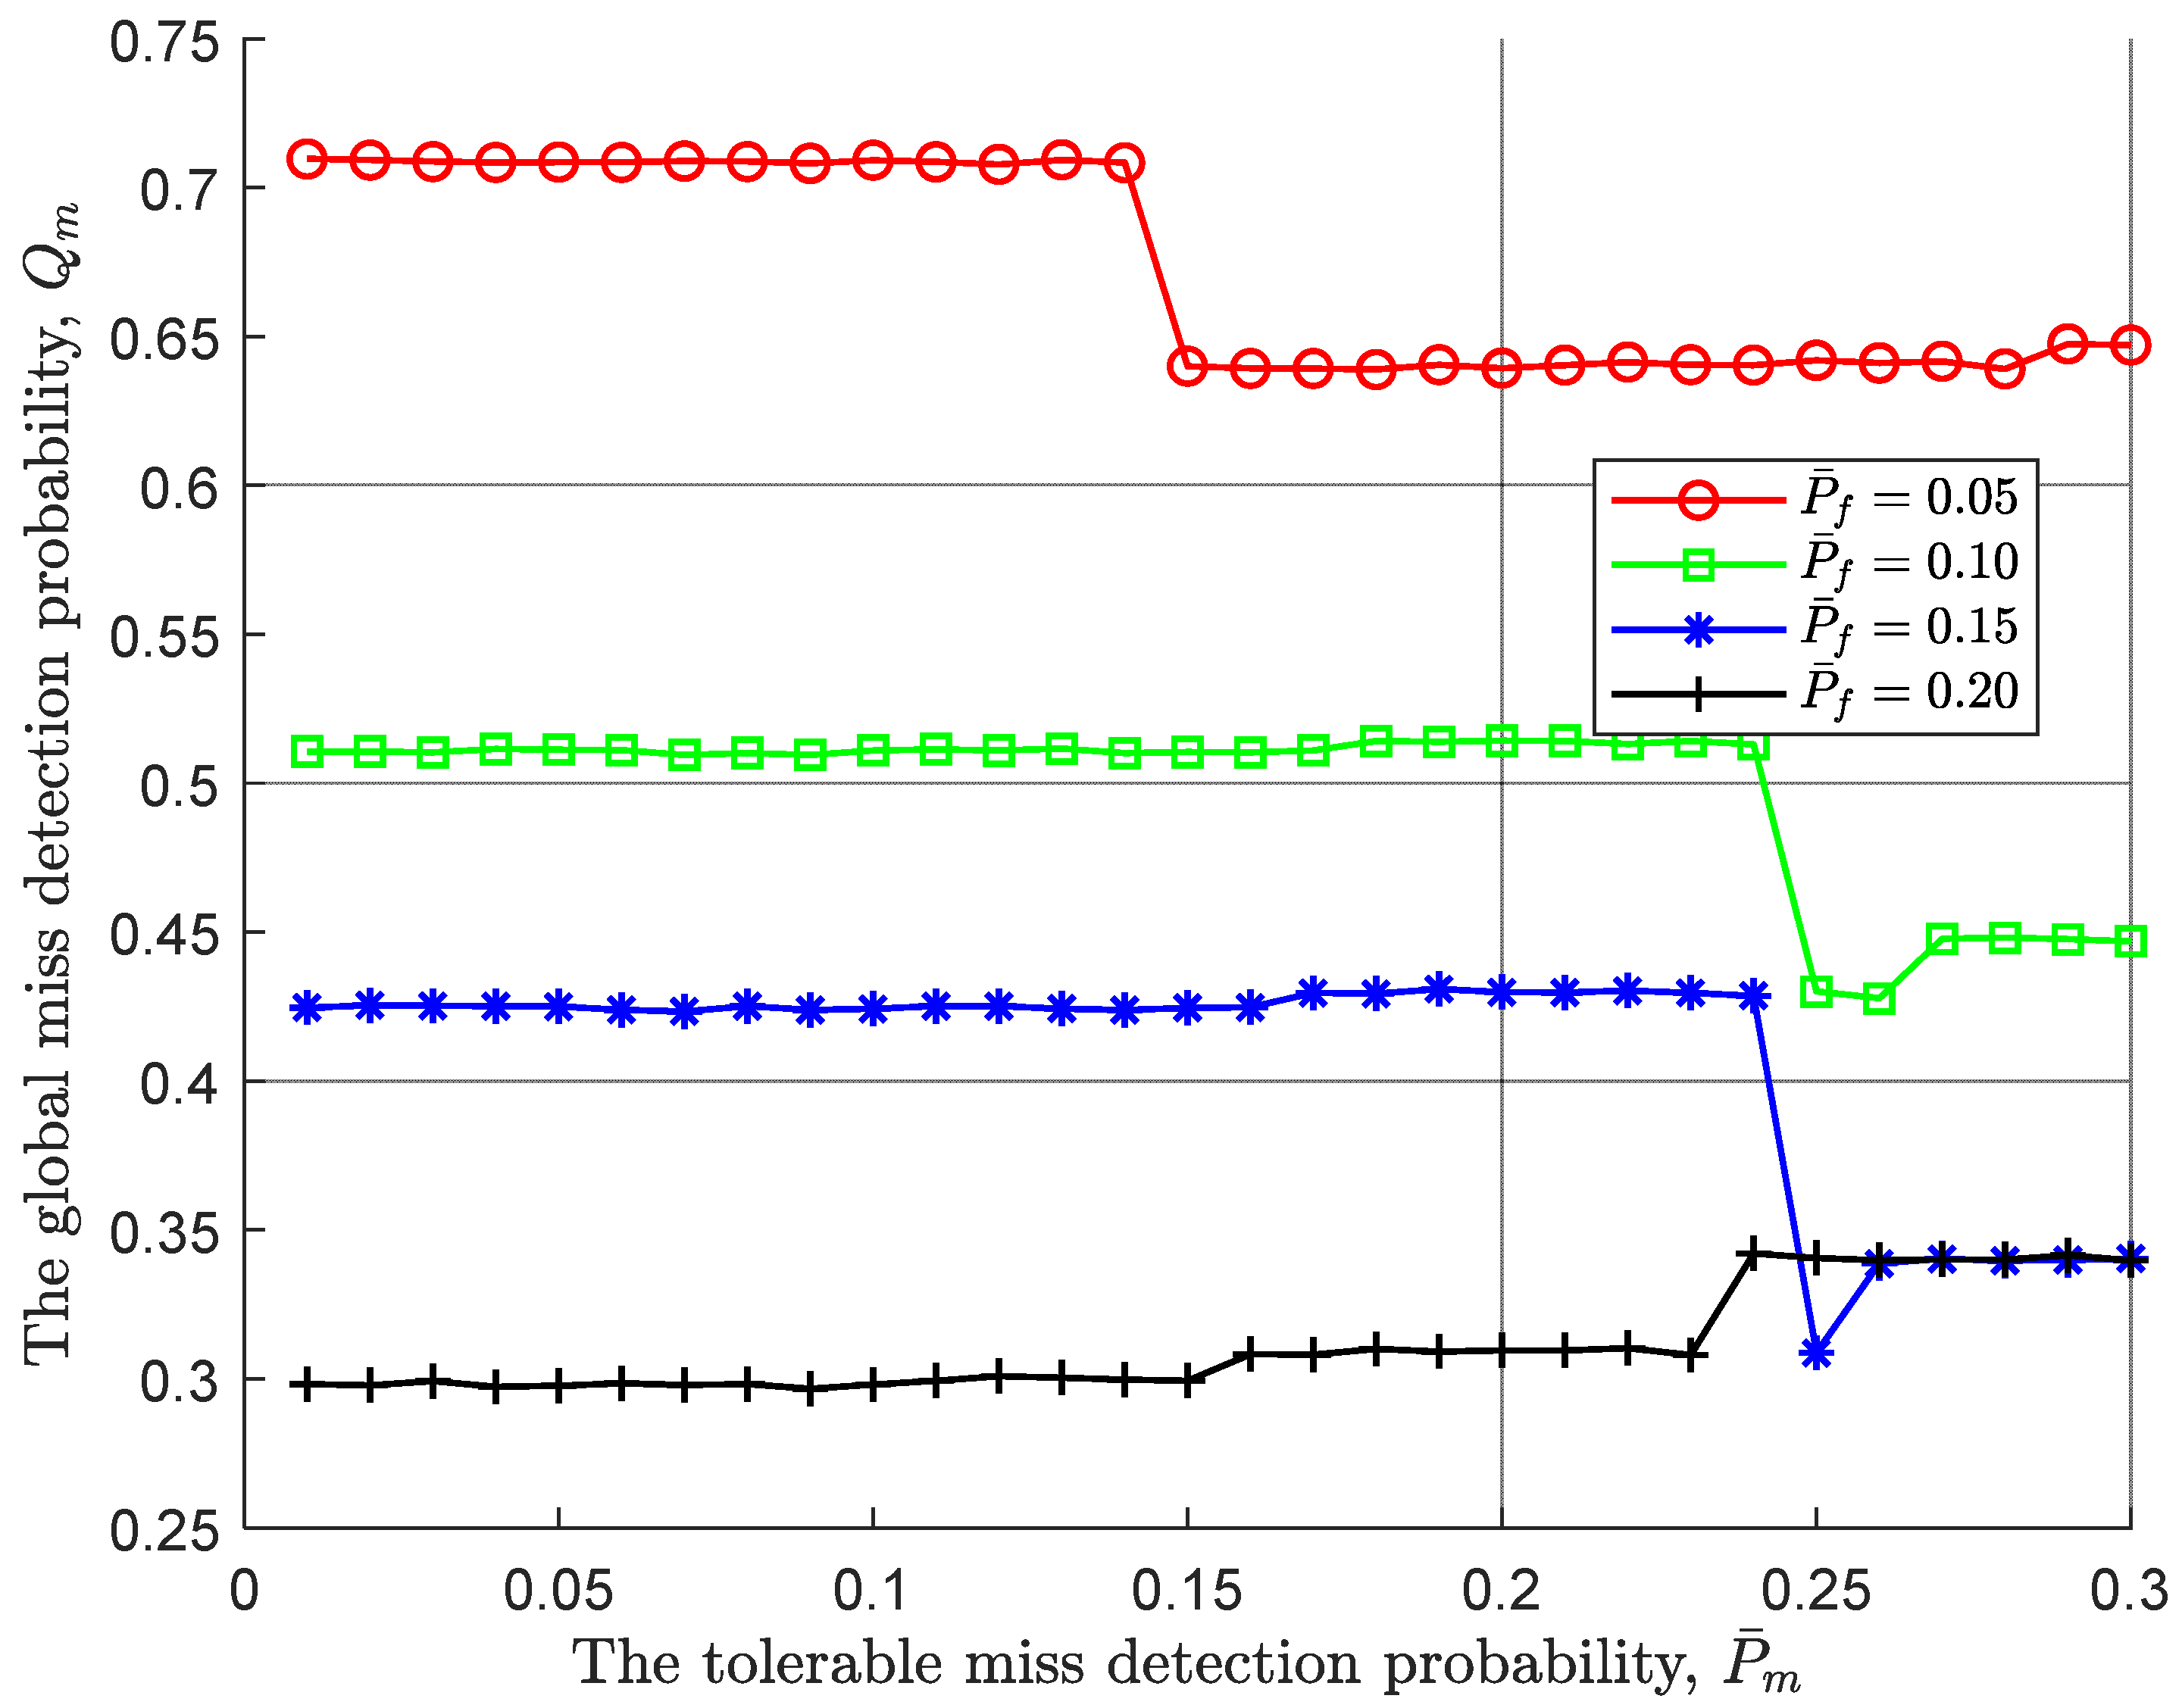
Similar to the global miss detection probability of
Figure 4, given the tolerable false alarm probability, the positive impact of the tolerable miss detection probability is illustrated in
Figure 5. In particular, the trend of the global miss detection probability is exactly the opposite to that of the global false alarm probability and the change interval is larger. There is no doubt that, the tolerable miss detection probability makes the lower threshold
smaller so that
is easier to accept.
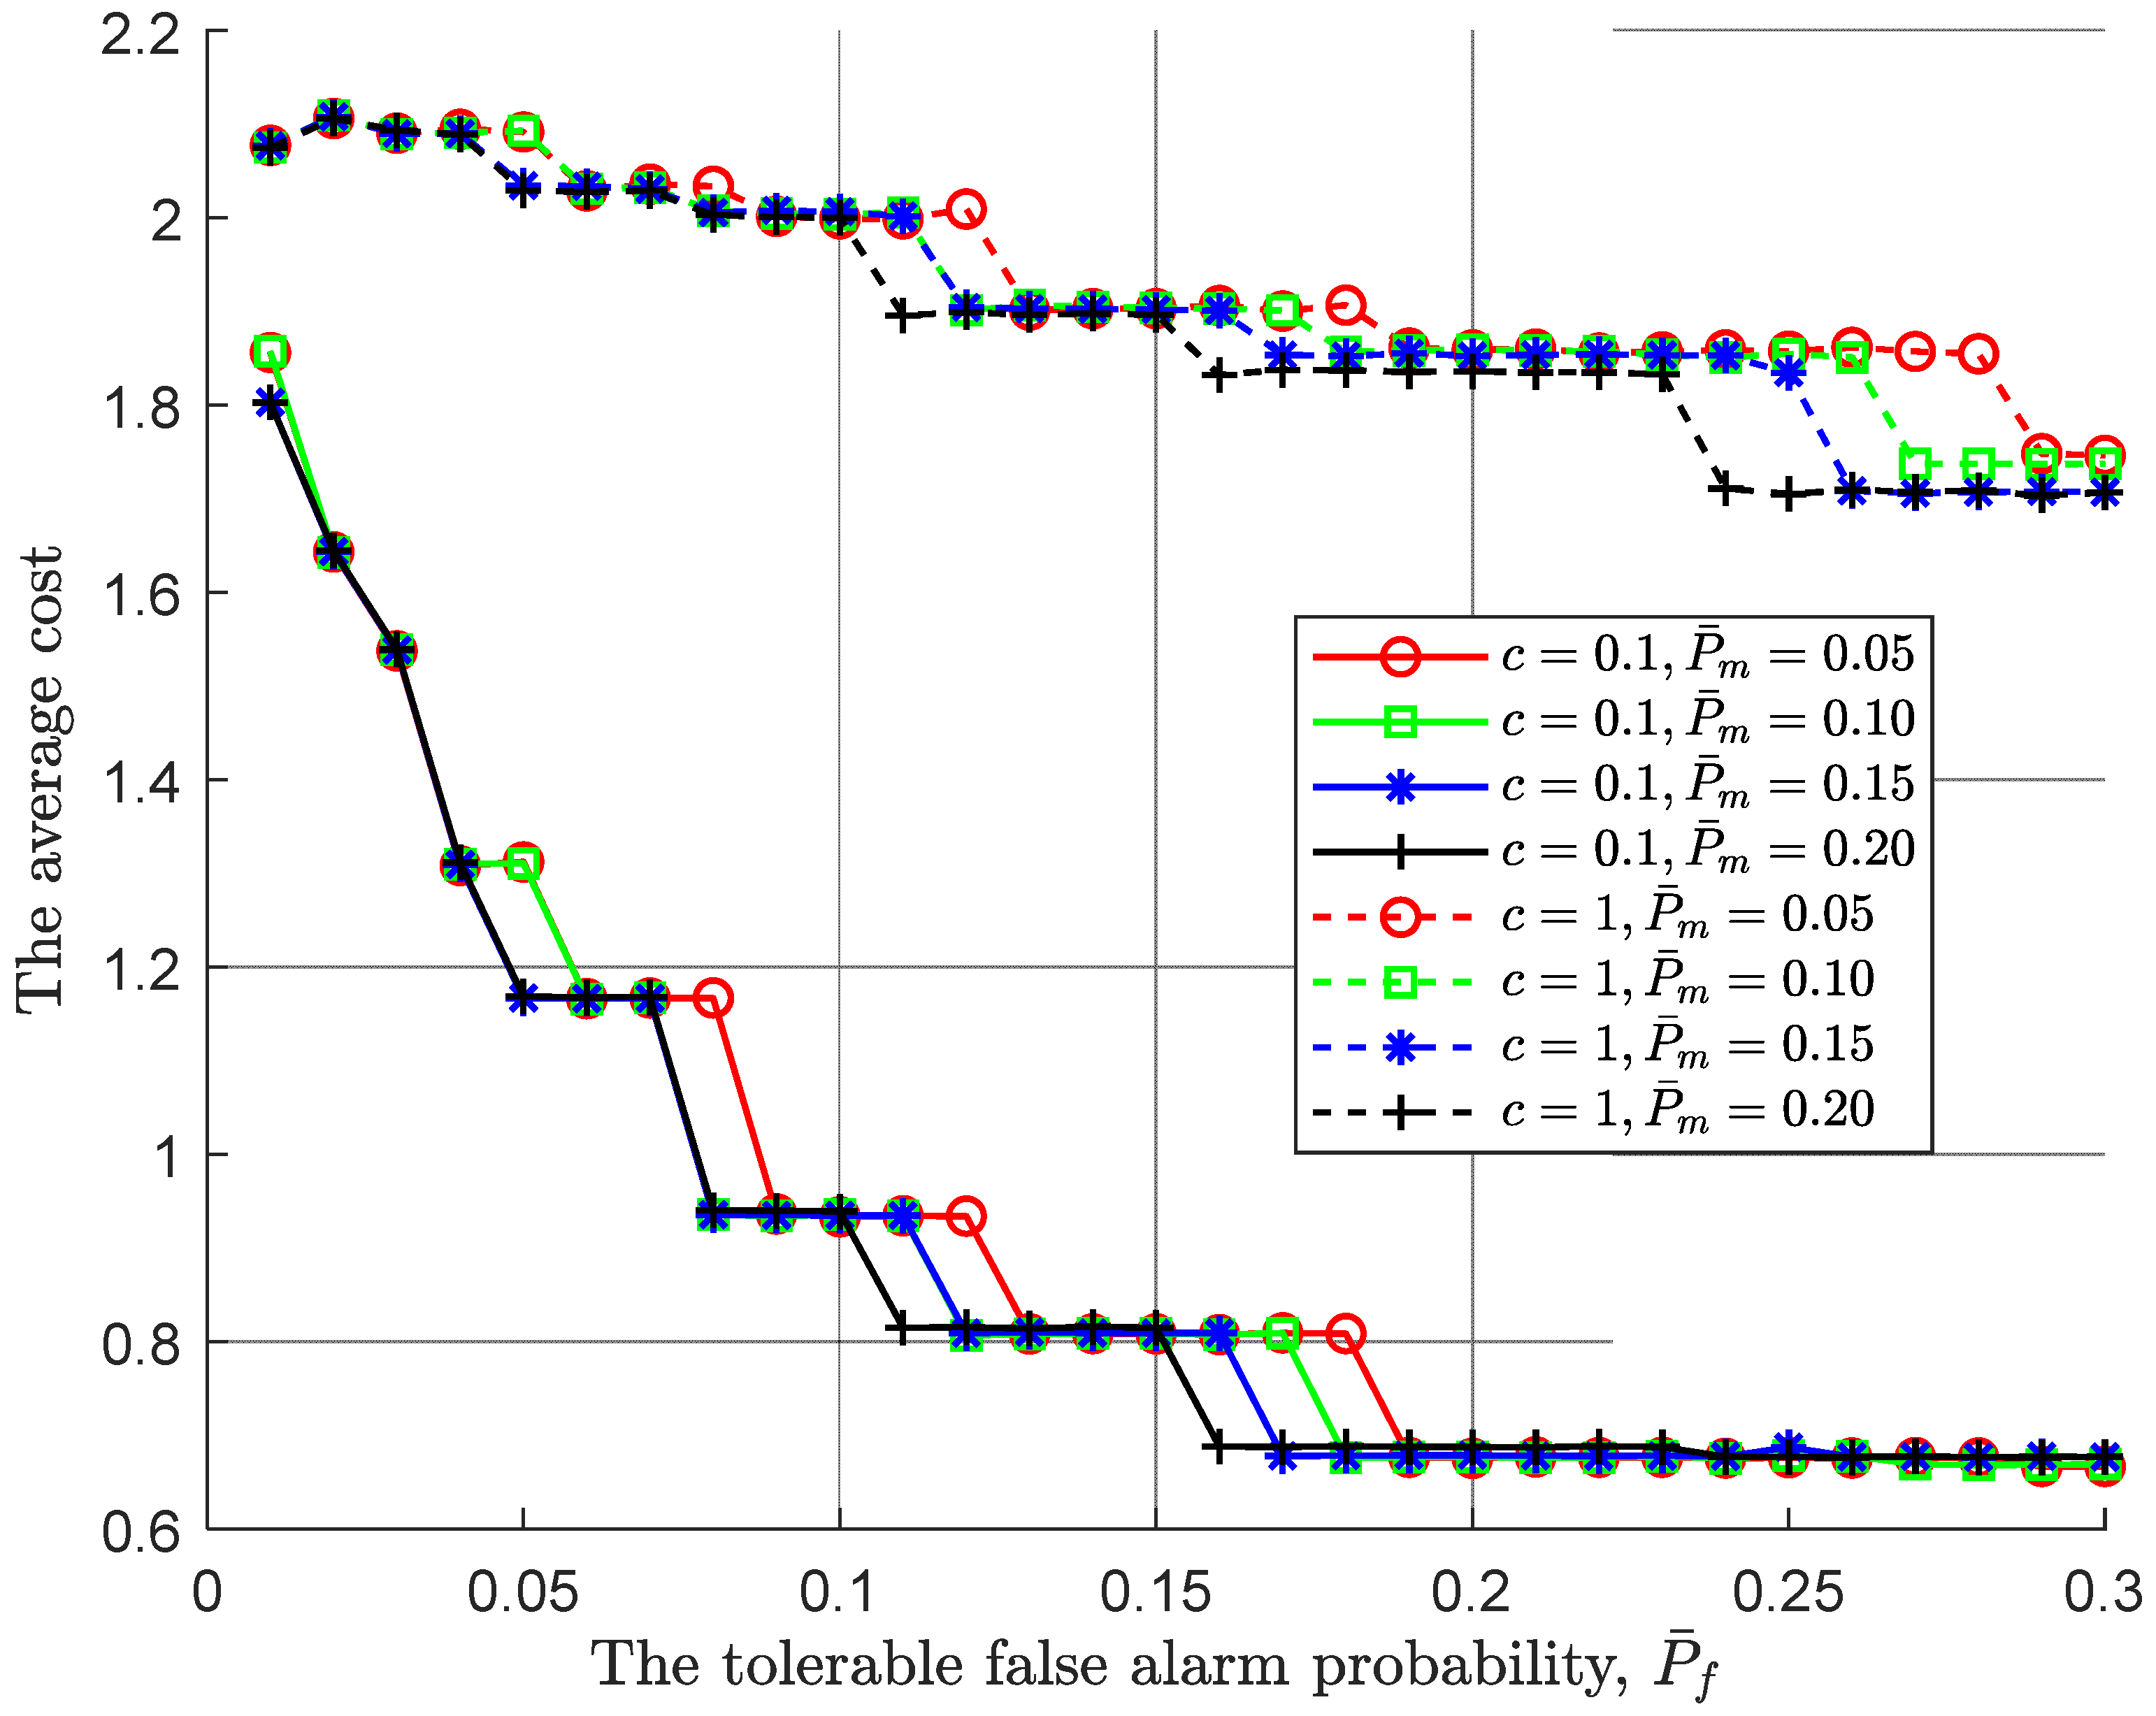
Following the joint impact of the tolerable performance metrics on the global performance, we further simulate the optimal cost of the tolerable performance under various costs of each observation taken, where the cost of each observation taken
is set to be 0.1 and 1. As shown in
Figure 6, for a pair of fixed tolerable performance, the larger cost of each observation taken
, the larger the average cost. Moreover, as the tolerable false alarm probability increases, the average cost decreases. This is to say, an increasing tolerable false alarm probability makes the lower/upper threshold larger/smaller, resulting in that the global decision is difficult to be made. Consequently, the stopping time increases. However, the increasing tolerable false alarm probability also makes the global miss detection probability decrease, as shown in
Figure 3. As a result, the global miss detection probability dominates the average cost because the cost about the miss detection decreases.
Figure 5.
The global miss detection probability vs the tolerable miss detection probability.
Figure 5.
The global miss detection probability vs the tolerable miss detection probability.
Figure 6.
The average cost vs the tolerable false alarm probability under various costs of each observation taken.
Figure 6.
The average cost vs the tolerable false alarm probability under various costs of each observation taken.
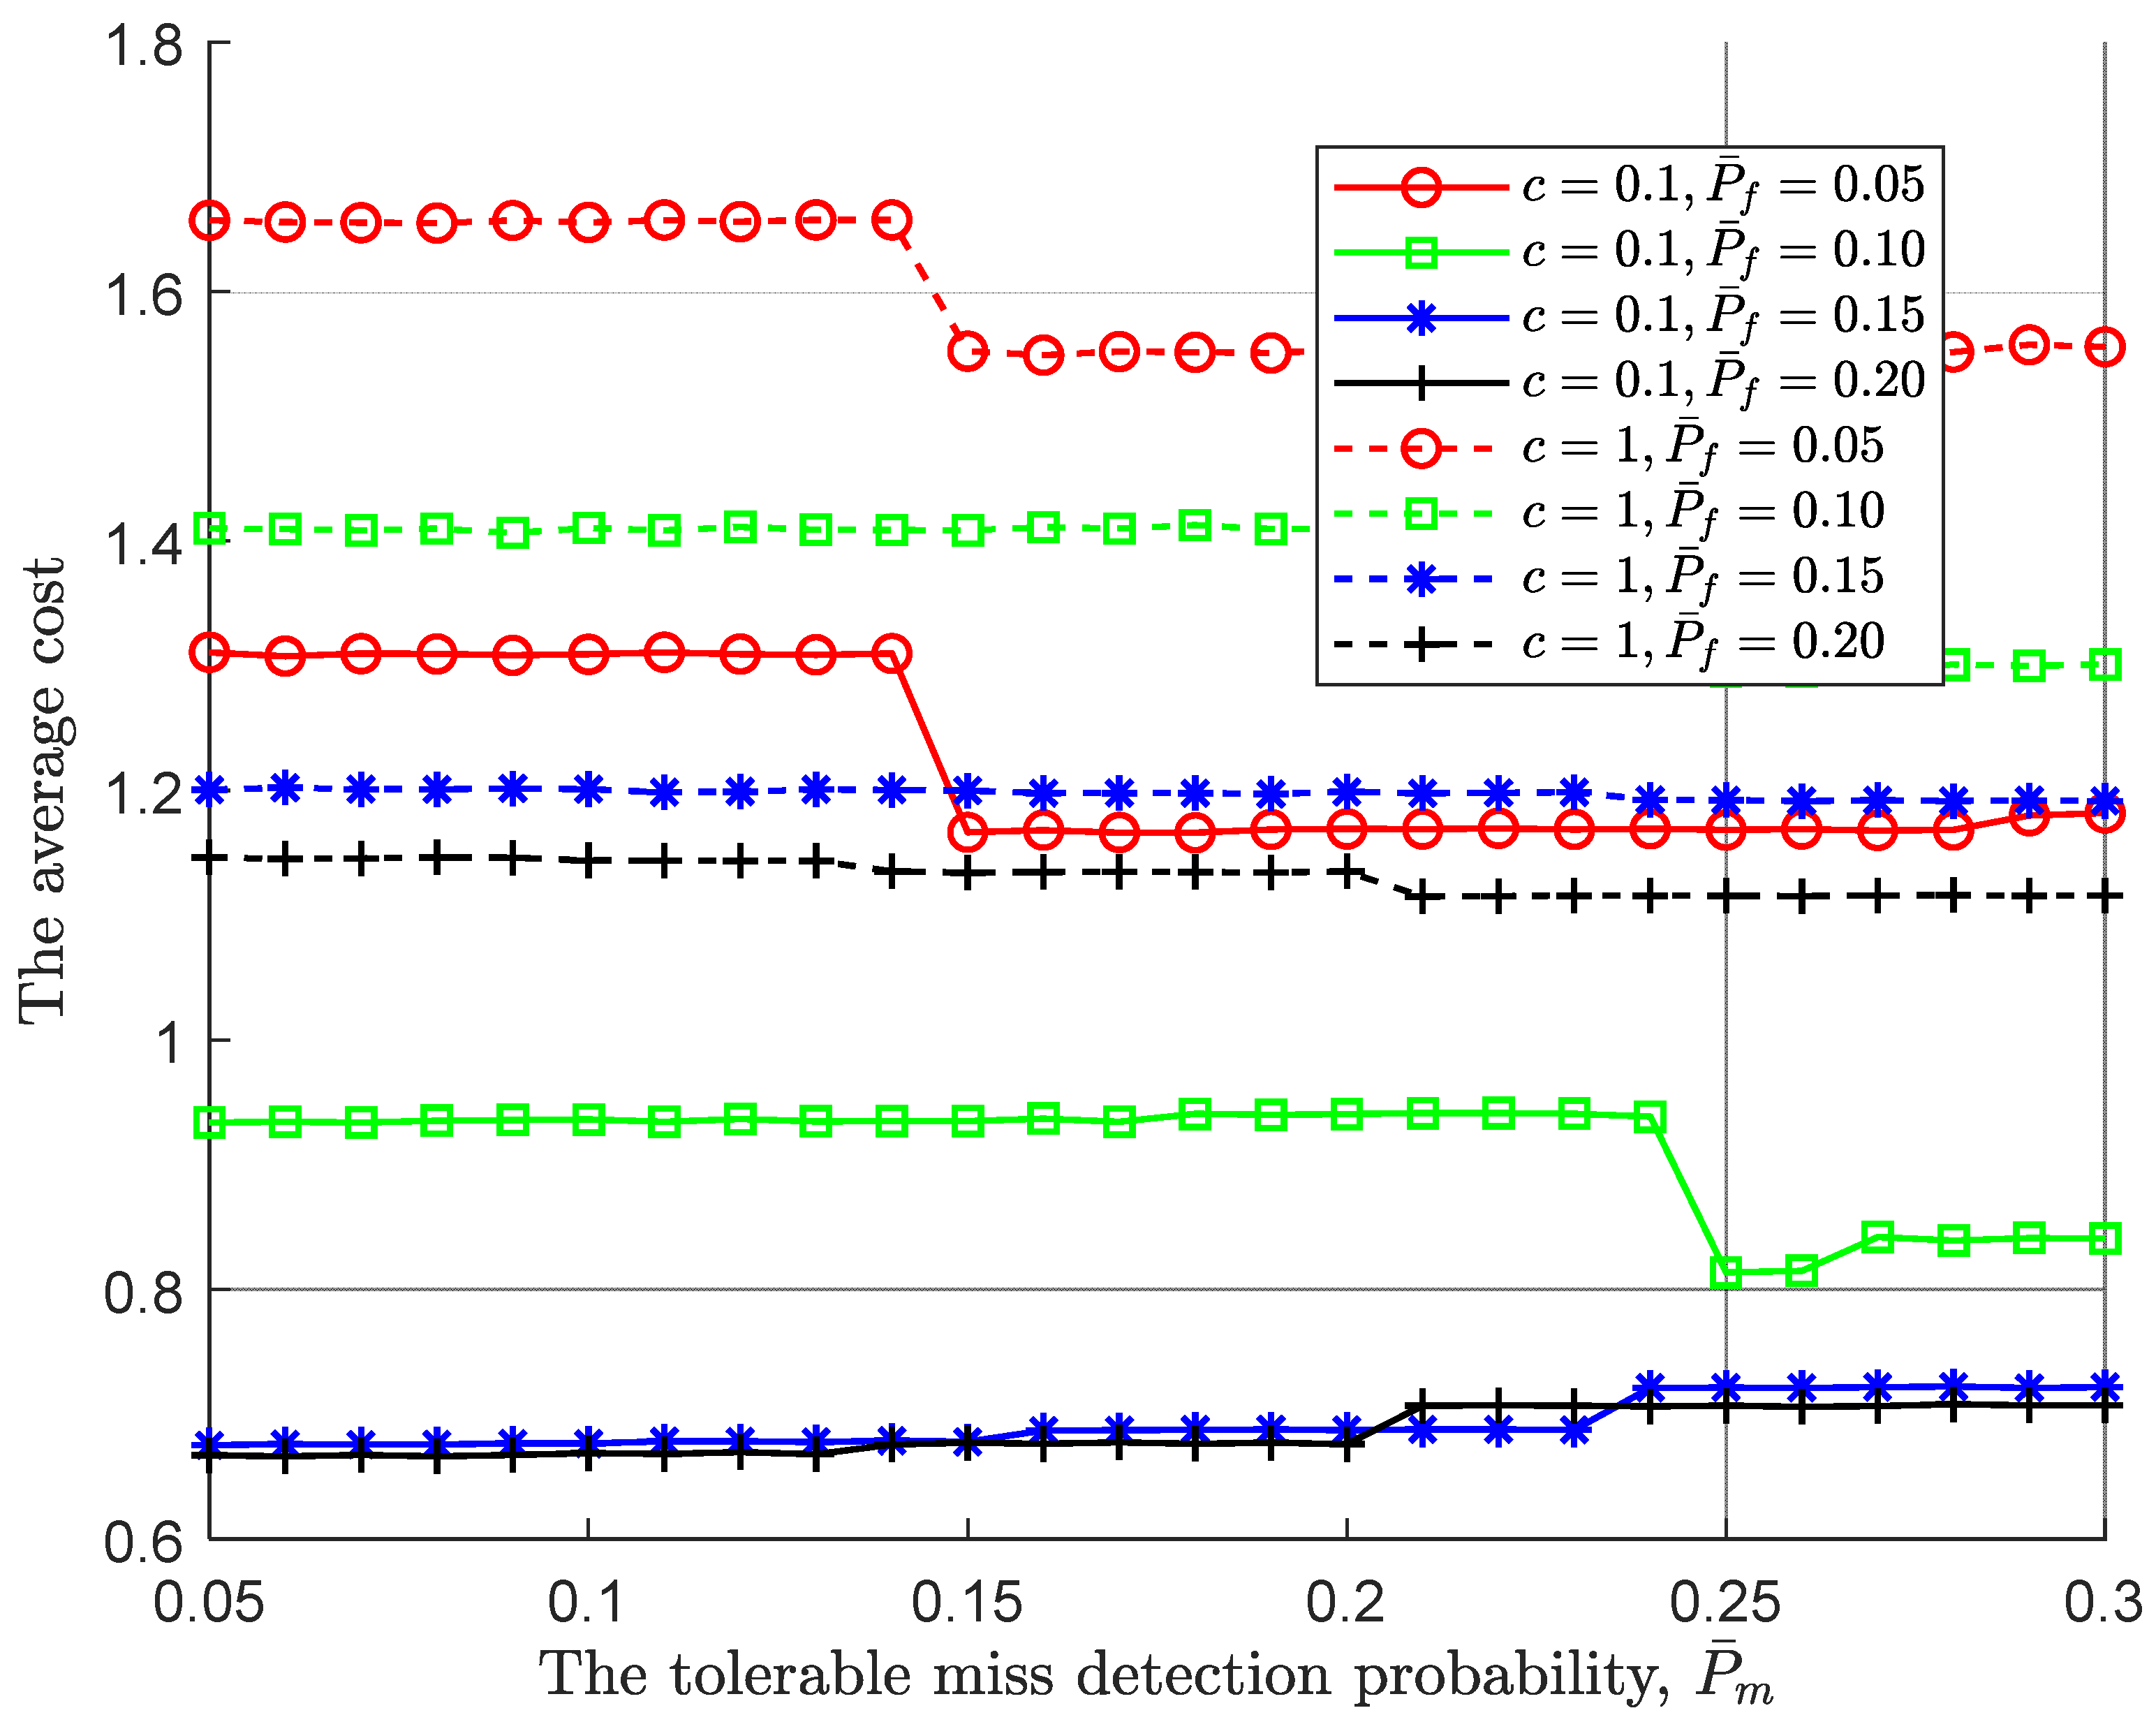
As with
Figure 6, the larger cost of each observation taken results in a lager average cost in
Figure 7. Following the global miss detection probability in
Figure 5, the average cost follows it. The simulation result also confirms once again that the global miss detection dominates the average cost. In summary, following PBPO methodology, the optimal sequential detection rule can be reached as the sensing environments to minimize the cost at a IoT device.
Author Contributions
Conceptualization, J. W.; methodology, J.W.; software, J.W.; validation, J.W.; formal analysis, J.W.; investigation, J.W.; resources, J.W.; data curation, J.W.; writing—original draft preparation, J.W.; writing—review and editing, J.W. and M. D.; visualization, J.W.; supervision, J.W., Z.Q., M.D., J.B., X.X., and W.C.; project administration, J.W. and J.B.; funding acquisition, J.W. and J. B. All authors have read and agreed to the published version of the manuscript.
