Preprint
Article

On the Intrinsic Properties Effects of the Heater Surface in Nucleate Pool Boiling: A Simulation Study

This version is not peer-reviewed.

Submitted:

26 December 2023

Posted:

27 December 2023

You are already at the latest version

Abstract
This study explores how the properties of heater materials impact nucleate pool boiling using a comprehensive simulation model. The model integrates well-known heat transfer mechanisms, allowing us to assess the effects of two distinct heater materials. Findings indicate that materials with higher thermal conductivity, such as copper, notably improve refrigeration efficiency in nucle- ate boiling. The study provides insights into the relationship between bubble growth, microlayer recovery beneath a bubble, temperature fluctuations, and heater properties. Comparisons between copper and silicon oxide underscore variations in bubble frequency, attributed to differences in bubble growth time, microlayer recovery time, and material-dependent behavior. The influence of neighboring bubbling sites, especially pronounced in silicon oxide due to its low thermal conductivity and diffusivity, was observed. Temperature variations in such materials became highly visible due to their significant inertia in recovery. Simulation results align well with empirical correlations, confirming the model’s versatility in capturing the intricate phenomena of nucleate pool boiling.
Keywords: 
Subject: 
Physical Sciences  -   Fluids and Plasmas Physics
Application of Aqueous Two-Phase System

1. Introduction

In contemporary research, power dissipation has emerged as a critical factor across various domains, spanning from the production of miniaturized electronics to nuclear power plants, as highlighted in reviews by [1,2,3]. Within the electronic industry, as MEMS processing technology advances towards high-speed, large buffer memory in smaller devices, there is a growing focus on the extensive study of pool boiling to achieve efficient cooling.
Nucleate boiling proves to be effective in dissipating a substantial heat flux with a minimal temperature difference, facilitating efficient component cooling. In pool boiling, heat is transferred from a surface to liquid in a macroscopic state of rest. The initiation of boiling occurs when the local temperature is sufficiently high to permit the formation and growth of vapor bubbles on surface imperfections. These imperfections or cavities act as nucleation sites for the growth of bubbles, arising from vapor initially trapped within them [4]. Surface roughness, porosity, and wettability are believed to influence boiling behavior, although bubble nucleation can also take place on a smooth surface without imperfections. In such cases, nucleation energy is contingent upon the contact angle, defined as the angle between a tangent to the liquid surface and the solid surface. Typically, a right angle is considered neutrally wetting, with lesser angles indicating hydrophilic properties and greater angles indicating hydrophobic characteristics. Both hydrophilic and hydrophobic surfaces contribute positively to improving boiling performance, with hydrophilic surfaces aiding in rewetting following bubble departure, and hydrophobic surfaces promoting bubble nucleation seeded by a stored vapor in cavities [1,2]. Additionally, the contact angle between the liquid-vapor interface at the bubble base and the surface varies during the stages of bubble growth and departure [5,6,7].
Recent research in nucleate pool boiling has emphasized the development of novel surface manipulation methods to enhance phase-change heat transfer. These methods include mechanical machining, chemical treatments, nanoparticle coatings, and micro-/nanoelectromechanical systems techniques, such as photolithography and reactive ion etching, as well as fiber-laser texturing that avoids additional layers [8,9,10,11,12]. In the context of ongoing efforts to improve heat transfer, this study investigates the impact of thermophysical properties on nucleate boiling for two materials with distinct characteristics: copper and silicon oxide. Notably, copper exhibits thermal diffusivity and conductivity two orders of magnitude greater than silicon oxide.
While numerous numerical models and experiments have explored the bubble cycle and precise bubble cycle data [13,14,15], predicting boiling heat transfer remains intricate due to the necessity of considering phenomena occurring over multiple scales—from the adsorbed vapor at the nanometer scale [16,17] to the bubble diameter at the millimeter scale. Timescales also vary widely, from microlayer formation at the microsecond scale ( 10 100 μ s ) to evaporation at the millisecond scale ( 1 10 m s ), significantly contributing to bubble growth [18,19,20,21,22]. Our proposed model is highly versatile, spanning multiple scales from nano to milli, and timescales from tenths of milliseconds to minutes, allowing the independent variation of parameters through computational simulations.
Reproducing boiling data is challenging due to contamination and cavity reactivation. Thus, our model analyzes bubble departure frequency in small copper and silicon oxide heaters, maintaining a fixed contact angle and comparing the results to established expressions and experimental data. Focusing on bubble departure frequency, which is simpler to observe during experimentation than other bubble characteristics, serves as a valuable metric for assessing the effectiveness of boiling on a given surface. This frequency is linked to the heater’s dissipation potency, depending on both the growth time of the bubbles and the recovery time of the microlayer of fluid, which rewets and cools the heater upon bubble departure [23].
Over the past half-century, significant efforts have been directed towards developing heat transfer models to determine these times. A theory presented in [24] outlines the rate of growth of a vapour bubble from a heated wall in a liquid near its saturation temperature. Predictions from this analysis bear some relation ( 25 per cent) to experimental results under conditions where assumptions are approximately valid. A corrected version is established in [25], substantially reducing the growth constant of bubbles and approaching experimental results more closely. However, recovery or wait times notably vary in each experiment. An expression for wait time was analytically derived by C.-H. Han and P. Griffith [26], considering transient heat conduction through the heater at a constant temperature to the microlayer of fluid, but significantly underestimate to experimental values of wait times. In an attempt to bridge this gap, Podowski et al. [27] consider the wall surface temperature as a time-dependent, fluctuating parameter, solved through a one-dimensional heat conduction equation through the wall. Although this consideration introduces a dependence on wall material properties in wait times, it still deviates from experimental results. In [28], an empirical relationship is proposed, fitting well with experimental data, and is the one utilized in our model.
Through numerical simulations, this study systematically investigates the effects of the thermophysical properties of the heater on nucleate pool boiling for two distinctly different heater materials, testing the proposed different mechanisms with semi-empirical relationships known in the literature.

2. Model

Consider a scenario of pool boiling, where a small heater plate is positioned horizontally in a container filled with stagnant refrigerant at atmospheric pressure (see Figure 1). The model consists of two distinct domains operating at different scales: the heat conduction process within the heater material and the growth and departure of bubbles from the surface. These domains are interconnected through the heat transfer mechanisms involved in surface cooling.

2.1. Heat conduction in the heater

Starting with the Fourier equation given by
1 α m d T d τ = ¯ 2 T + q ˙ κ m ,
the temperature field in the heater is estimated using the alternating-direction implicit (ADI) finite difference method, which is modified by an f factor ( 0 < f < 1 ) [30]. In Eq. (1), α m and κ m represent the heater’s thermal diffusivity and conductivity, respectively, and q ˙ denotes the heat flux sources and/or sinks.
The heater is divided into grid cells, and in each grid cell, the heat fluxes due to the first term in Eq. (1) are affected by the factor f, remaining the total heat flux according to Eq. (1) in each direction over a complete time step. The advantage of the modified ADI method lies in the fact that not only tridiagonal matrices need to be solved, but also the time steps can be significantly larger without compromising the convergence and stability of the solution. The time step limit for the conventional ADI method can now be increased by a factor of 1 / f through the use of this modified ADI method. For example, the time step limit can be increased by one order of magnitude with f = 0.1 , and the solutions still remain stable with high accuracy (see [30] for more details).
The heat generated by the heater is extracted from its top into the liquid. The extraction mechanisms include radiation, microconvection, microlayer evaporation due to bubble growth, and natural convection generated by the fraction of the free cell surface in contact with the liquid without bubbles. Radiation is always present, whereas the other extraction mechanisms are mutually exclusive. However, radiation heat is negligible in nucleate boiling. In essence, microconvection and microlayer evaporation are the relevant processes for heat extraction, despite being intermittent (refer to Section 2.2). As these mechanisms undergo relatively rapid changes over time, solving Eq. (1) using the ADI method is advantageous, especially since the precision is on the order of 2 in time ( O ( t 2 ) ), allowing for better tracking of temporal changes compared to explicit finite difference methods.

2.2. Heat transfer mechanisms

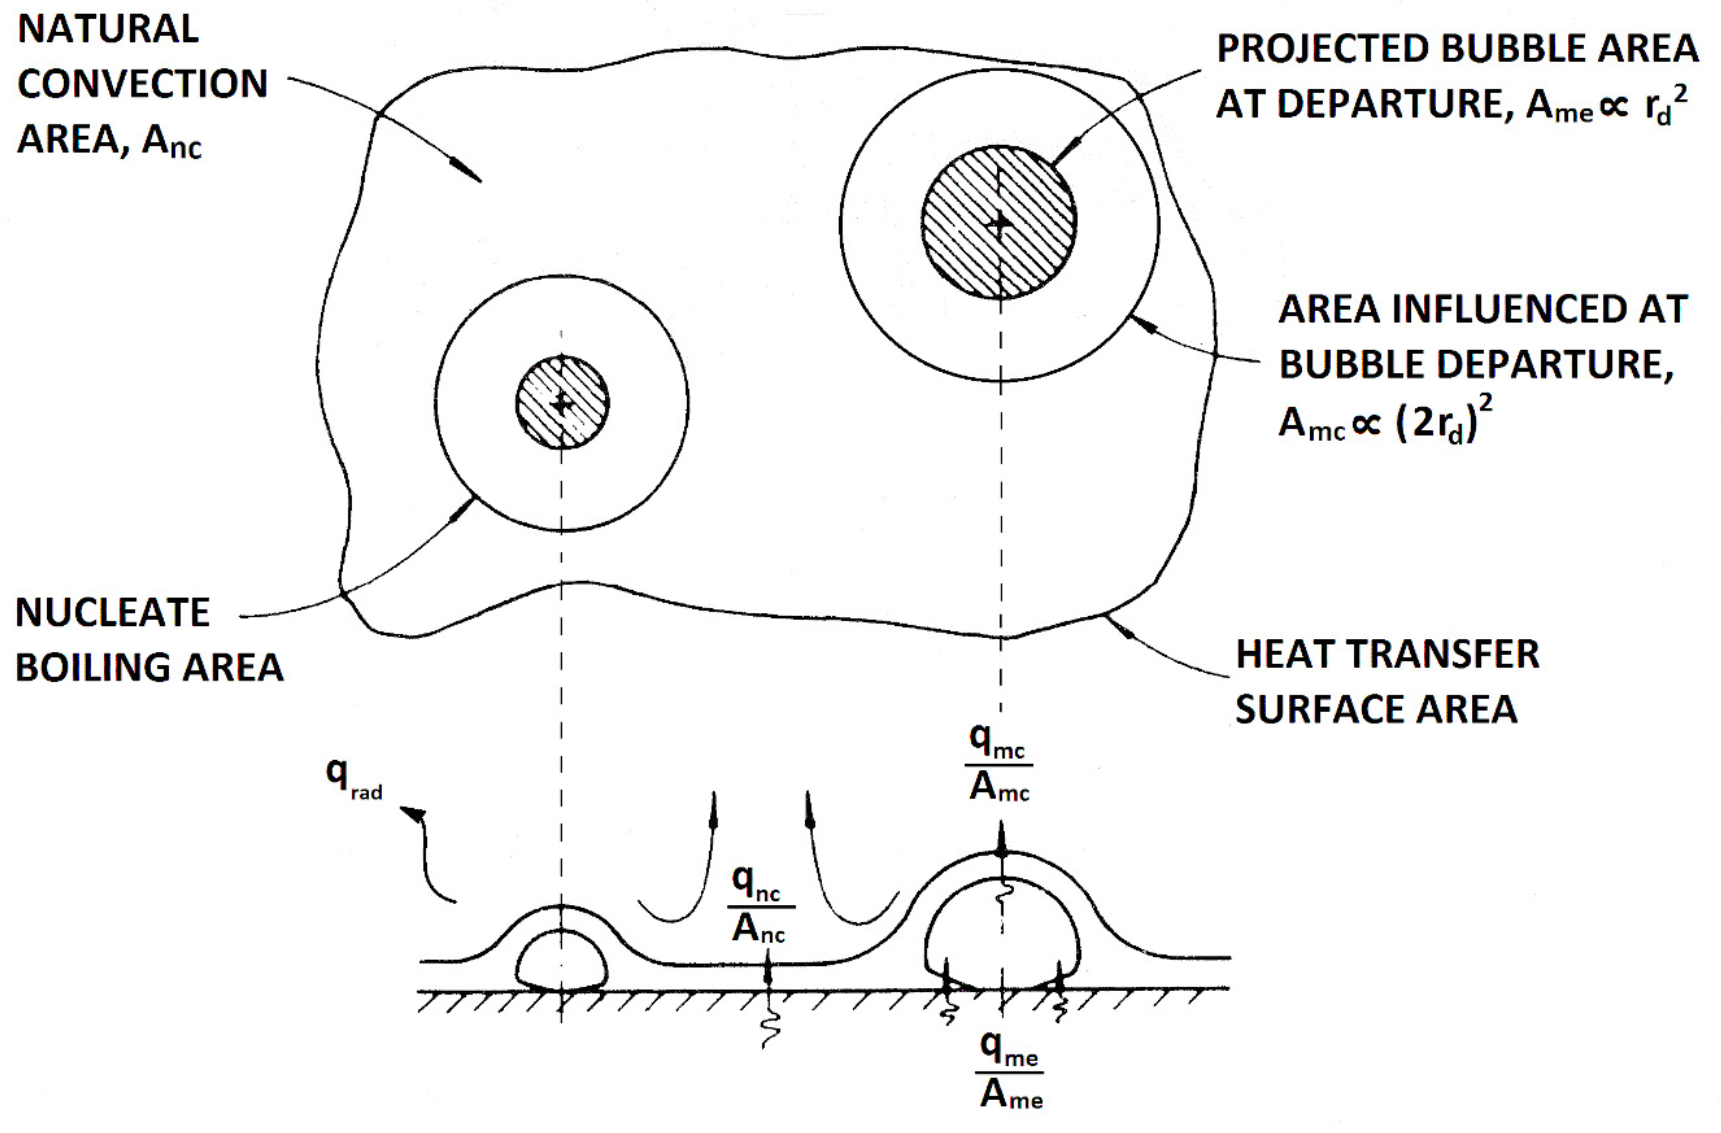
The mechanisms for extracting thermal energy from the heater and transferring it to the liquid are illustrated in Figure 2:
  • Natural convection ( q n c ): The density difference between the hot and cold fluid induces convective flows, extracting heat from the heater across its free area, A n c .
  • Microlayer evaporation, ( q m e ): It is assumed that the vapor mass forming the bubble originates from the evaporation of the superheated microlayer between the heater surface and the bubble itself.
  • Microconvection, ( q m c ): Detaching bubbles remove the superheated liquid layer in their vicinity. Colder liquid from the bulk of the pool quenches an area A m c , and heat is required to recover the microlayer subcooling.
  • Radiation, ( q r a d ): Heat is transferred in the form of electromagnetic waves from the heater to the liquid.
The total heat rate extracted from a cell to the liquid, q ˙ o u t , is given by the sum of individual contributions:
q ˙ o u t = q ˙ n c + q ˙ m c + q ˙ m e + q ˙ r a d .
The net heat rate extracted from a cell, q ˙ (see Eq. (1)), represents the difference between the power generated in the cell and the heat rate extracted from the upper cells through the aforementioned mechanisms.
Nucleation sites (cavities) are randomly placed at the cell centers of the heater, with radii chosen from normal distributions given by 6 ± 3 ; μ m [32]. At the active sites, bubbles grow attached to the cells until a critical detachment radius, r d , at which point bubbles depart, initiating the growth process again with a new bubble if the site becomes reactivated.
If a growing bubble touches other bubbles on the surface, they coalesce to form a single bubble at the nucleation site of the largest one, preserving the vapor mass.

2.2.1. Effect of the contact angle and natural convection

The current model incorporates the influence of the contact angle ϕ on the site activation process through the activation rule. Accordingly, a given site is active if its radius r satisfies [25]:
r m i n < r < r m a x ,
where
r m i n , m a x = δ 2 C 1 1 θ s θ w ± 1 θ s θ w 2 4 ζ C 3 δ θ w
with
ζ = 2 σ T s a t ρ v h f g , C 1 = 1 + c o s ϕ s i n ϕ a n d C 3 = 1 + c o s ϕ ,
where
δ : thermal boundary layer thickness
ϕ : contact angle between a tangent to the liquid surface and the solid surface
θ s : liquid subcooling, i.e., T s a t T
θ w : wall superheat of the cell containing the nucleation site, i.e., T w T s a t
ρ v : vapor density
h f g : latent heat of phase change
T s a t : saturation temperature
T : liquid bulk temperature
σ : surface tension.
The thermal boundary layer thickness is estimated as δ = κ / h ¯ , where κ is the liquid heat conduction coefficient, and h ¯ is the average heat transfer coefficient assessed using the average temperature of the heater. The average heat transfer coefficient is given by [33,34,35]:
h ¯ = κ L N u ¯ ,
where L is the heater side characteristic length, L = 4 A L P , with A L and P being the heater area and perimeter, respectively. N u ¯ is the Nusselt number calculated as:
N u ¯ = 0.54 c n c R a 1 / 4 , if 10 4 R a L < 10 7 0.15 c n c R a 1 / 3 , if 10 7 R a L < 10 11
where the Rayleigh number is defined as:
R a = g β l T w T L 3 ν α l ,
with g being the gravitational constant, β the thermal expansion coefficient of the liquid, ν the kinematic viscosity, and α l the thermal diffusivity of the liquid. The coefficient c n c is included to account for border effects in small heaters and extra agitation due to the detachment of nearby bubbles.
Finally, natural convection heat transfer acts on the portion of the heater surface in direct contact with the liquid, as shown in Figure 2. For every top cell of the heater, the convection heat transfer rate is given by:
d q n c d t = c n c h ¯ A i T w T ,
where A i is the area of cell i in contact with the liquid.

2.2.2. Microlayer evaporation and microconvection

In the microlayer evaporation model initially proposed by N. W. Snyder [36], a thin liquid microlayer is present beneath the hemispherical bubble during a specific stage of growth, occurring shortly after the initial formation of the equilibrium radius. Heat is transmitted through the microlayer, and its thickness diminishes due to evaporation in accordance with
q m e = 4 3 π r ( t + Δ t ) 3 r ( t ) 3 ρ v h l g ,
where r ( t ) is radius of the bubble at time t, and Δ t is the Monte Carlo step. The asymptotic growth of the radius of the attached bubble is provided by [25]:
r ( t ) = 0.470 P r 1 / 6 J a α l t 1 / 2 ,
where, P r is the Prandtl number, J a is the Jakob number. Eq. (11) is valid until the growing bubble radius reaches the detaching critical value r d , given by the Fritz criterion:
r d = 1 2 0.0148 ϕ 2 σ g ρ l ρ v ,
where g is the gravity and ρ l and ρ v are the liquid and vapor densities, respectively. When a bubble departs from the hot surface, it carries away a fraction of the superheated thermal layer. Colder liquid from the bulk of the pool quenches the surface. If the site on the surface is active, it implies that a new superheated thermal layer was formed (see Figure 2). According to this, the heat removal by the microconvection mechanism can be calculated using [37]
q m c = c l ρ l 2 3 π r d c m c r d 2 T w T 2 T ,
where c l is the specific heat of the liquid, and c m c is the microconvection coefficient representing the liquid volume around a bubble that is carried with the bubble after detachment. In the present model, it is taken to be equal to 1.2 1.3 , as suggested by [37], page 404.
The time required from the beginning of the generation of the thermal layer to the beginning of bubble growth is defined as the waiting period of a bubble, t w . Basu et al. [28] correlated the wait time and found that it was a strong function of wall superheat according to
t w = 139.1 ( T c a v i t y T s a t ) 4.1 ,
where T c a v i t y is the temperature of the cavity when the bubble departs. Thus, the heat q m c is removed by microconvection during the wait time t w . During that time of recovery of the microlayer, non-bubble growth occurs, and the cavity remains inactive. (The microlayer affected occupies an area double that of the bubble).

2.2.3. Radiation

The heat per unit of time removed through the radiation process is accounted for in the model by
d q r a d d t = A T ϵ σ s b T w 4 T 4 ,
where A T is the total area of the cell, ϵ is the emissivity of the upper surface of the heater (assumed to be equal to 0.8 in the present model), and σ s b is the Stefan-Boltzmann constant ( σ s b = 5.67 × 10 8 ; W / m 2 K 4 )

3. Results

3.1. Comparative Cooling Performance of S i O 2 and C u Heaters

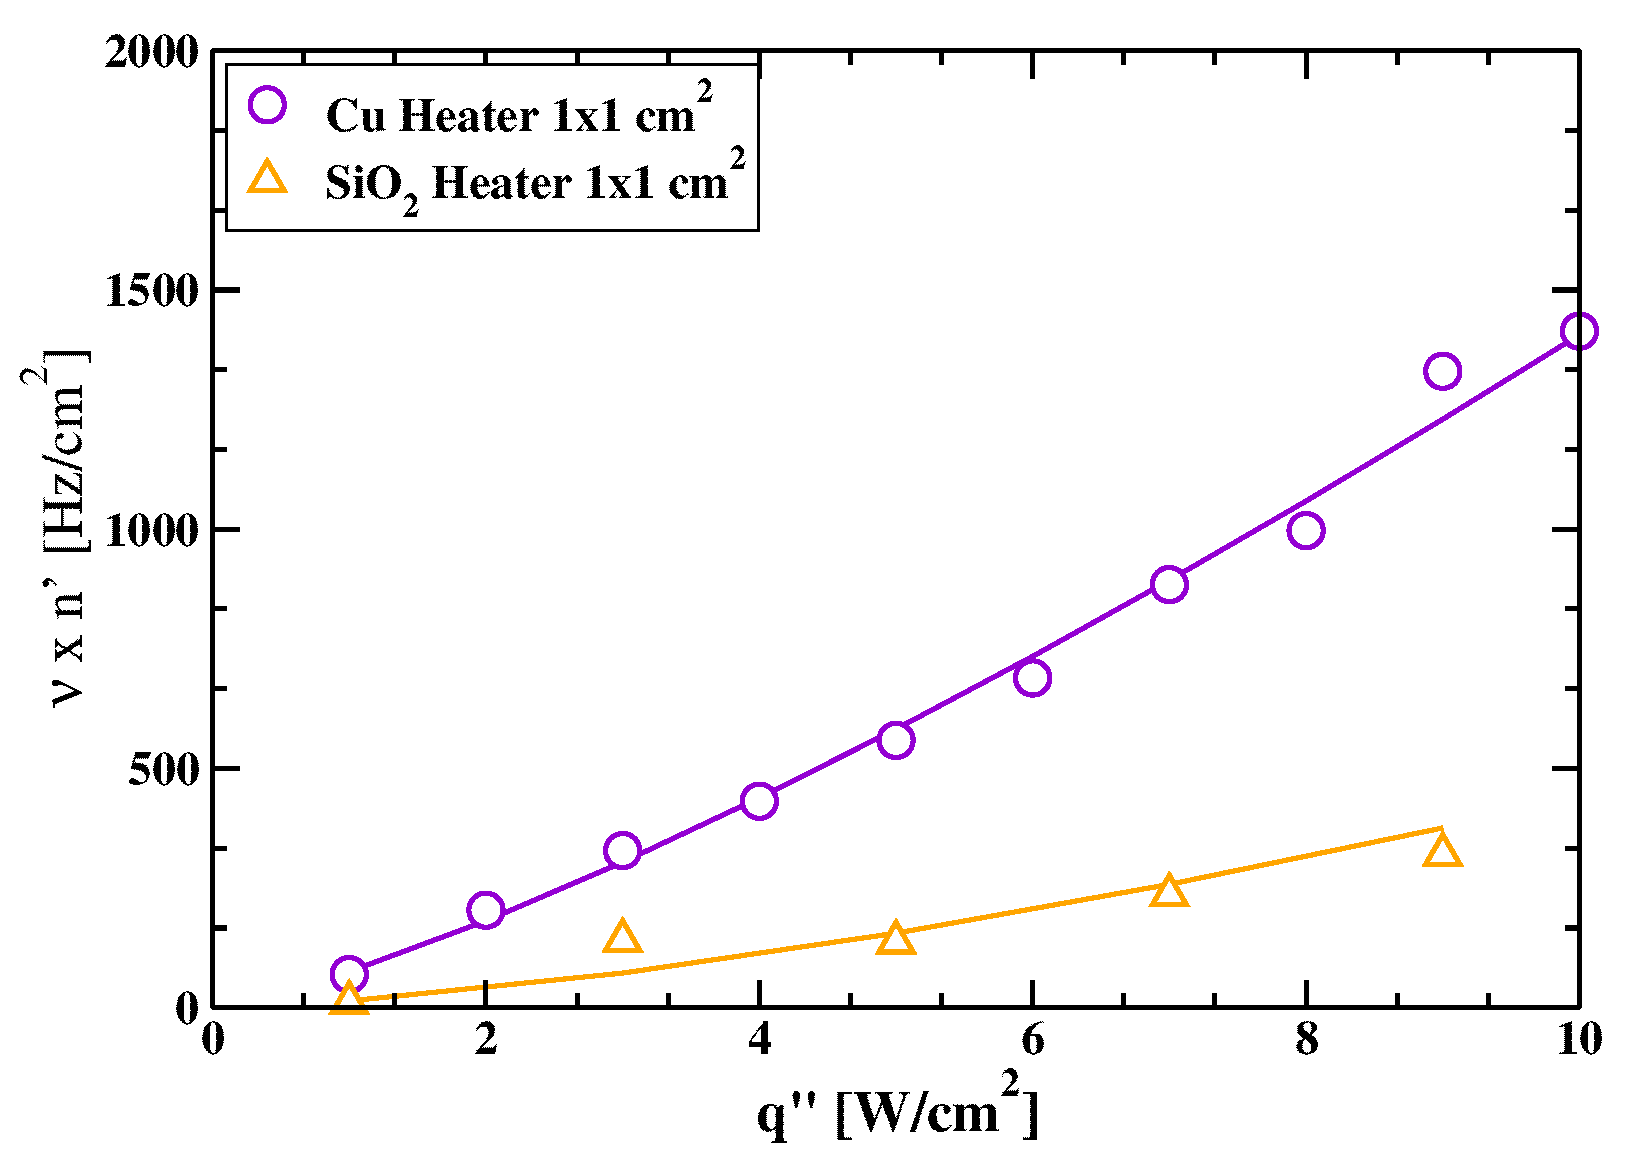
In this section, we examine how the intrinsic properties of the heater affect its refrigeration. The transfer of heat flux from the heater to the liquid relies on both the mean frequency of bubbles, denoted as ν , and their number, denoted as n , on the heater surface. In the literature [38], it is noted that this transfer is proportional to ν for the mean number of active sites. Figure 3 illustrates the product ν × n in the steady state as a function of the input power per area q " for both copper ( C u ) and silicon dioxide ( S i O 2 ) heaters using water as the refrigerant, with a fixed contact angle of ϕ = 20 . The heaters share identical dimensions of 1 × 1 × 0.25 c m 3 , with 20 cavities randomly distributed, sized according to Gaussian distributions given by 6 ± 3 ; μ m . As q " increases, ν × n rises for both heater types. Notably, for a given input power per area, the refrigeration, i.e., ν × n , is higher for copper heaters compared to silicon dioxide heaters. Thus, materials with greater thermal conductivity and diffusivity achieve better refrigeration through nucleate boiling.
It is important to note that these results are applicable under the assumption of a fixed contact angle and a constant cavity densities with Gaussian size distributions. In practical experiments, maintaining constant surface properties can be challenging. In essence, the model facilitates the systematic study of this phenomenon by varying one parameter at a time.
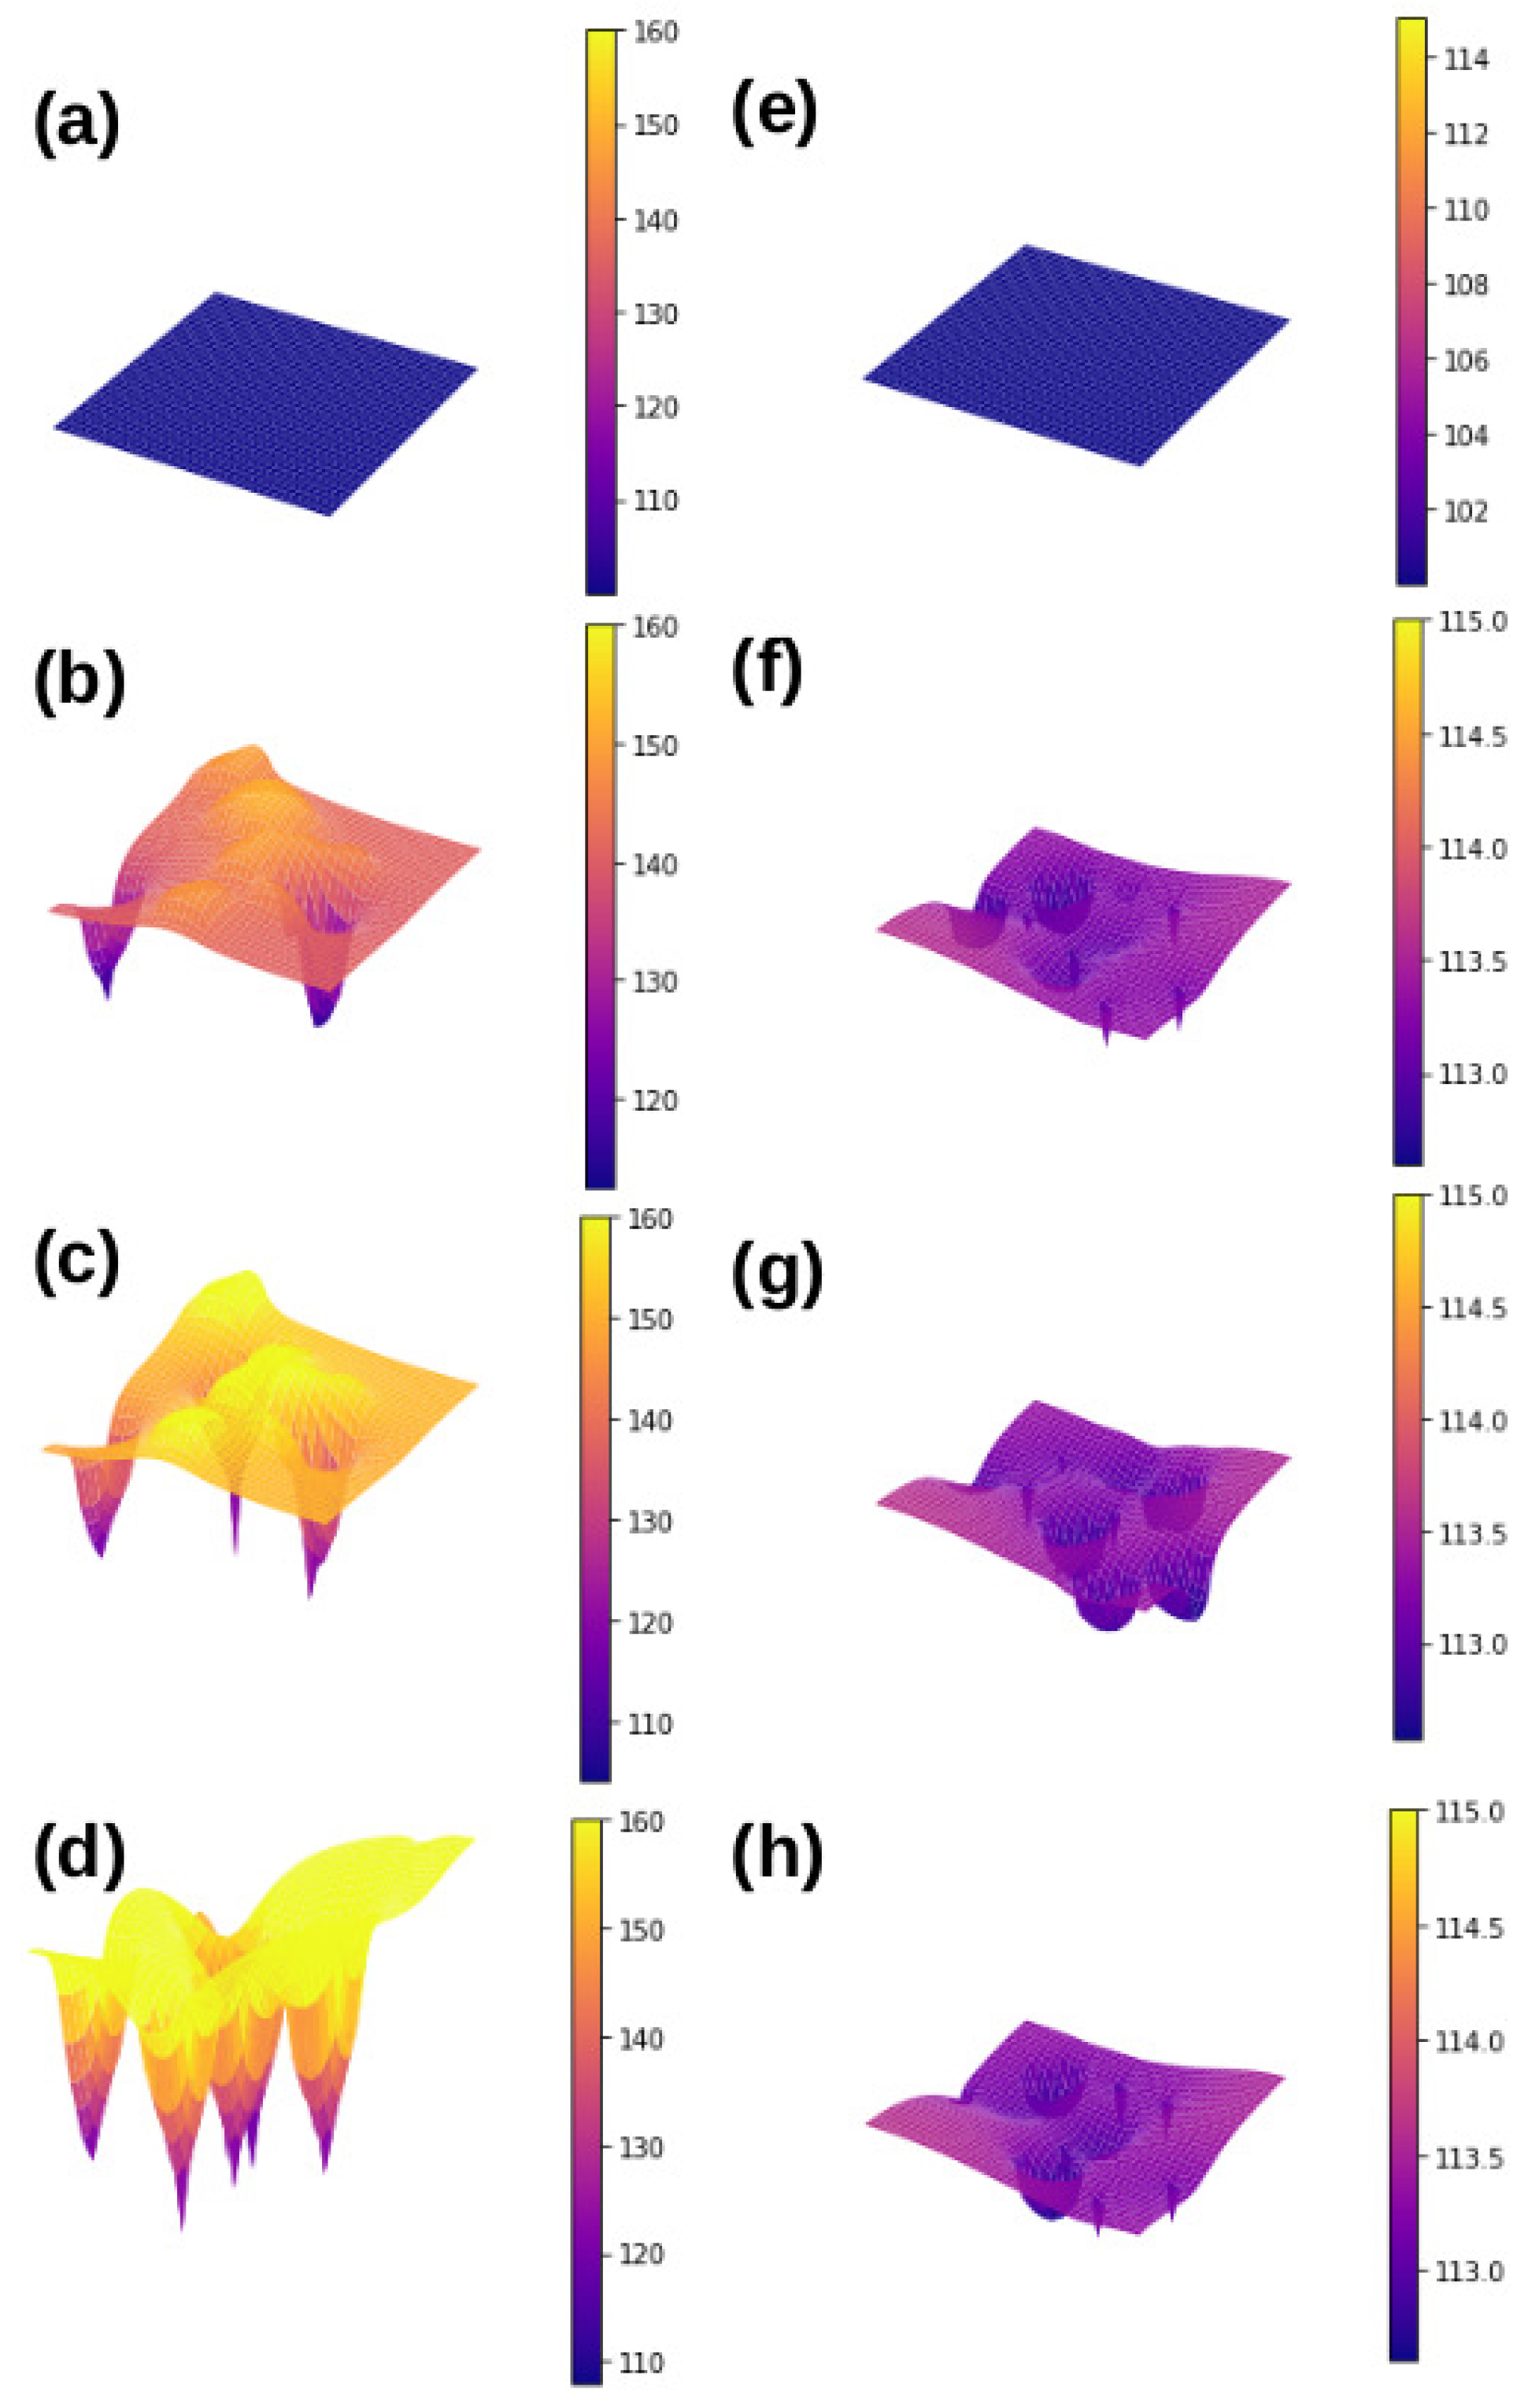
Upon cooling less efficiently, the S i O 2 heater attains a higher mean temperature than the C u heater, as illustrated in Figure 4 Temp-Bubbles (a-d) and (e-h) for S i O 2 and C u heaters, respectively, under a constant input power per area q " at different time intervals. Furthermore, upon comparing these figures, it becomes evident that temperature fluctuations are more pronounced in the S i O 2 heater than in the C u heater. These variations are particularly noticeable in the active cavities, where bubbles grow and subsequently depart from the surface.

3.2. Mean Bubble Frequency and Associated Times: A Comparison between S i O 2 and C u Heaters

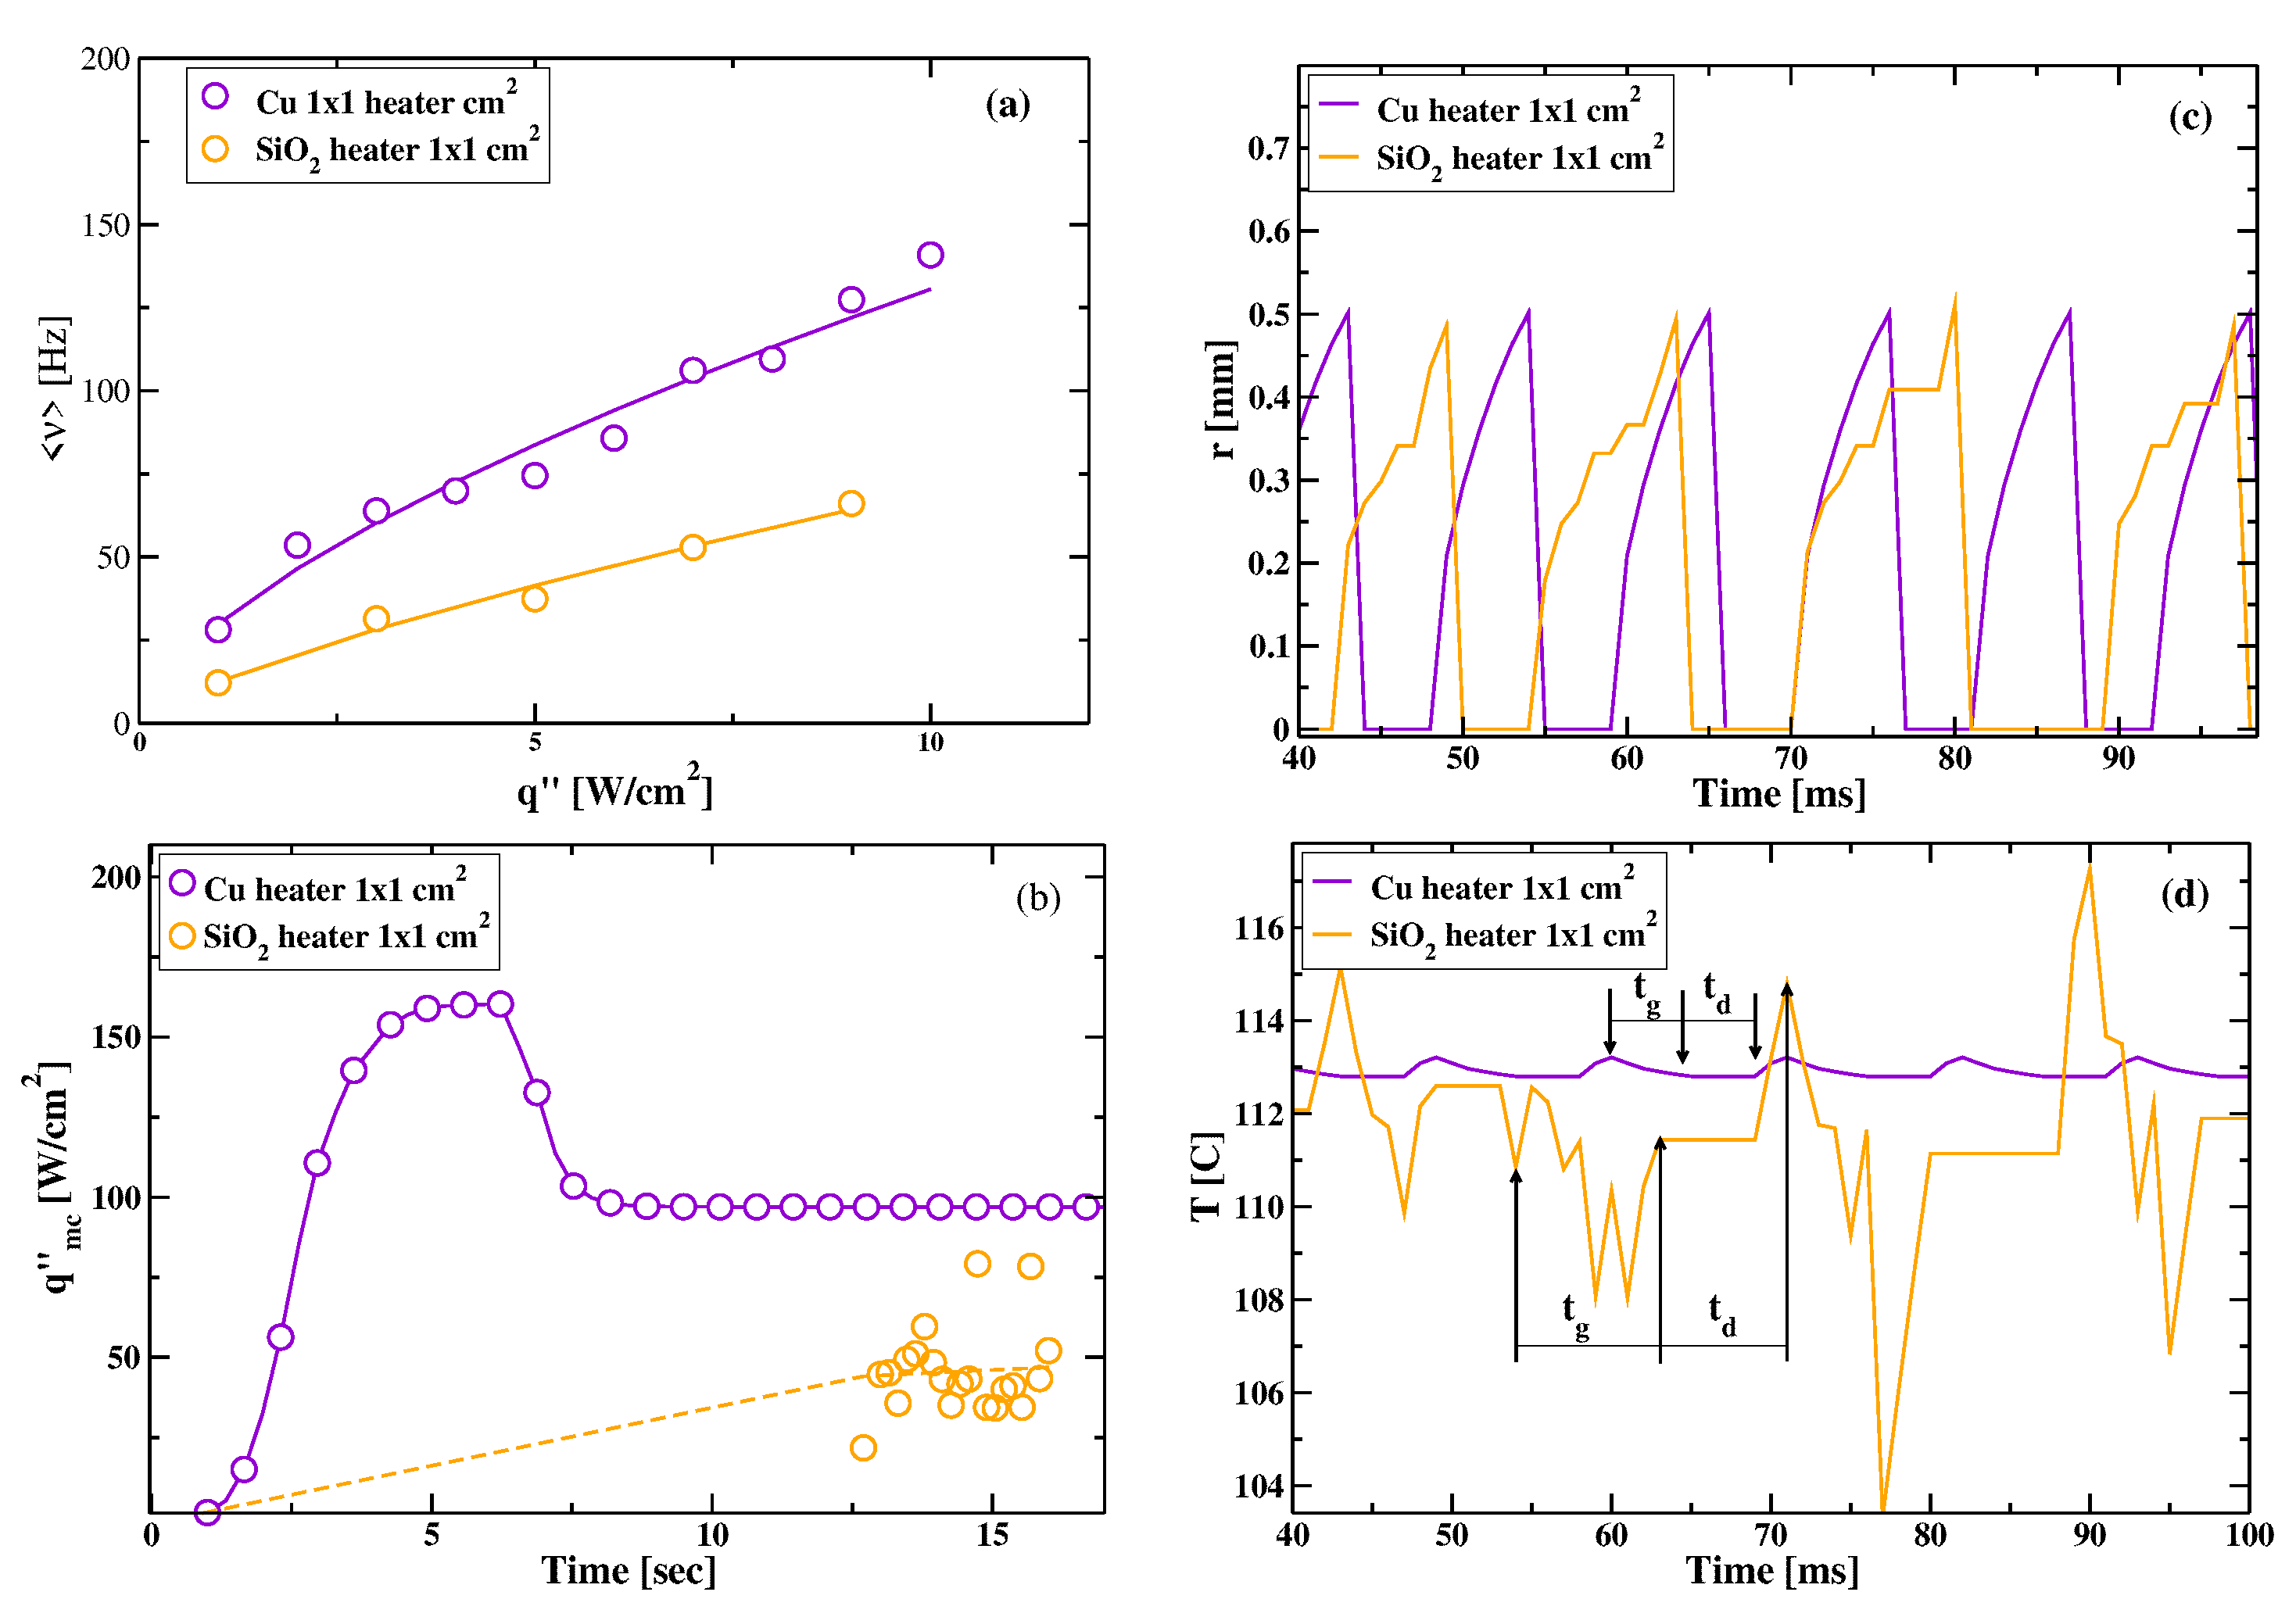
In Figure 5(a), the mean bubble frequency ν in the steady state is depicted against the input power per area q " for both C u and S i O 2 heaters, with a fixed contact angle of ϕ = 20 and 20 cavities randomly distributed according to Gaussian distributions ( 6 ± 3 ; μ m ). The mean frequency is calculated by averaging over time windows when the steady state is reached. Transient states, lasting up to ten seconds depending on the heater material, the refrigerant liquid, and q " , are illustrated in Figure 5(b). In this figure, the power per area extracted q " m c by microconvection is plotted for randomly chosen active cavities where the microlayer is recovering. This mechanism extracts significant heat volumes, especially for the C u heater, reaching around 100 W / c m 2 when the microlayer is recovering, as reported in experiments [39]. Notably, Figure 5(b) reveals substantial variations in q " m c for the S i O 2 heater, consistent with the temperature variations observed in the active cavities (refer to Figure 4 (e-h)).
Figure 5(c) displays the bubble radius growth r ( t ) on an active site as a function of time for both C u and S i O 2 heaters under fixed input power per area. The radii asymptotically grow until reaching the critical radius r D at which point the bubble departs from the heater surface (see Eqs. (11) and (12)). During bubble growth, the cavity temperature tends to decrease, as depicted in Figure 5(d), where the asymptotic T of the cavity versus time is plotted for the same data as in part (c) of the same figure. For the S i O 2 heater, the variations in T of the cavity are greater than those for the C u heater. Moreover, quiescent states are observed in bubbles on the S i O 2 heater, where the growth of their radii halts due to a collective effect with neighboring cavities. This collective behavior leads to a decrease in T of the cavity following the eventual growth and departure of bubbles (refer to parts (c) and (d)). Preliminary results from spatial correlations support this assertion, although they are beyond the scope of this study.
Finally, for saturated pool boiling, a recommended empirical correlation for the bubble frequency times the departure diameter D d = 2 r d is the following [40]:
ν D d = 1.18 t g t g + t d σ g ( ρ l ρ g ) ρ l 2 1 / 4 .
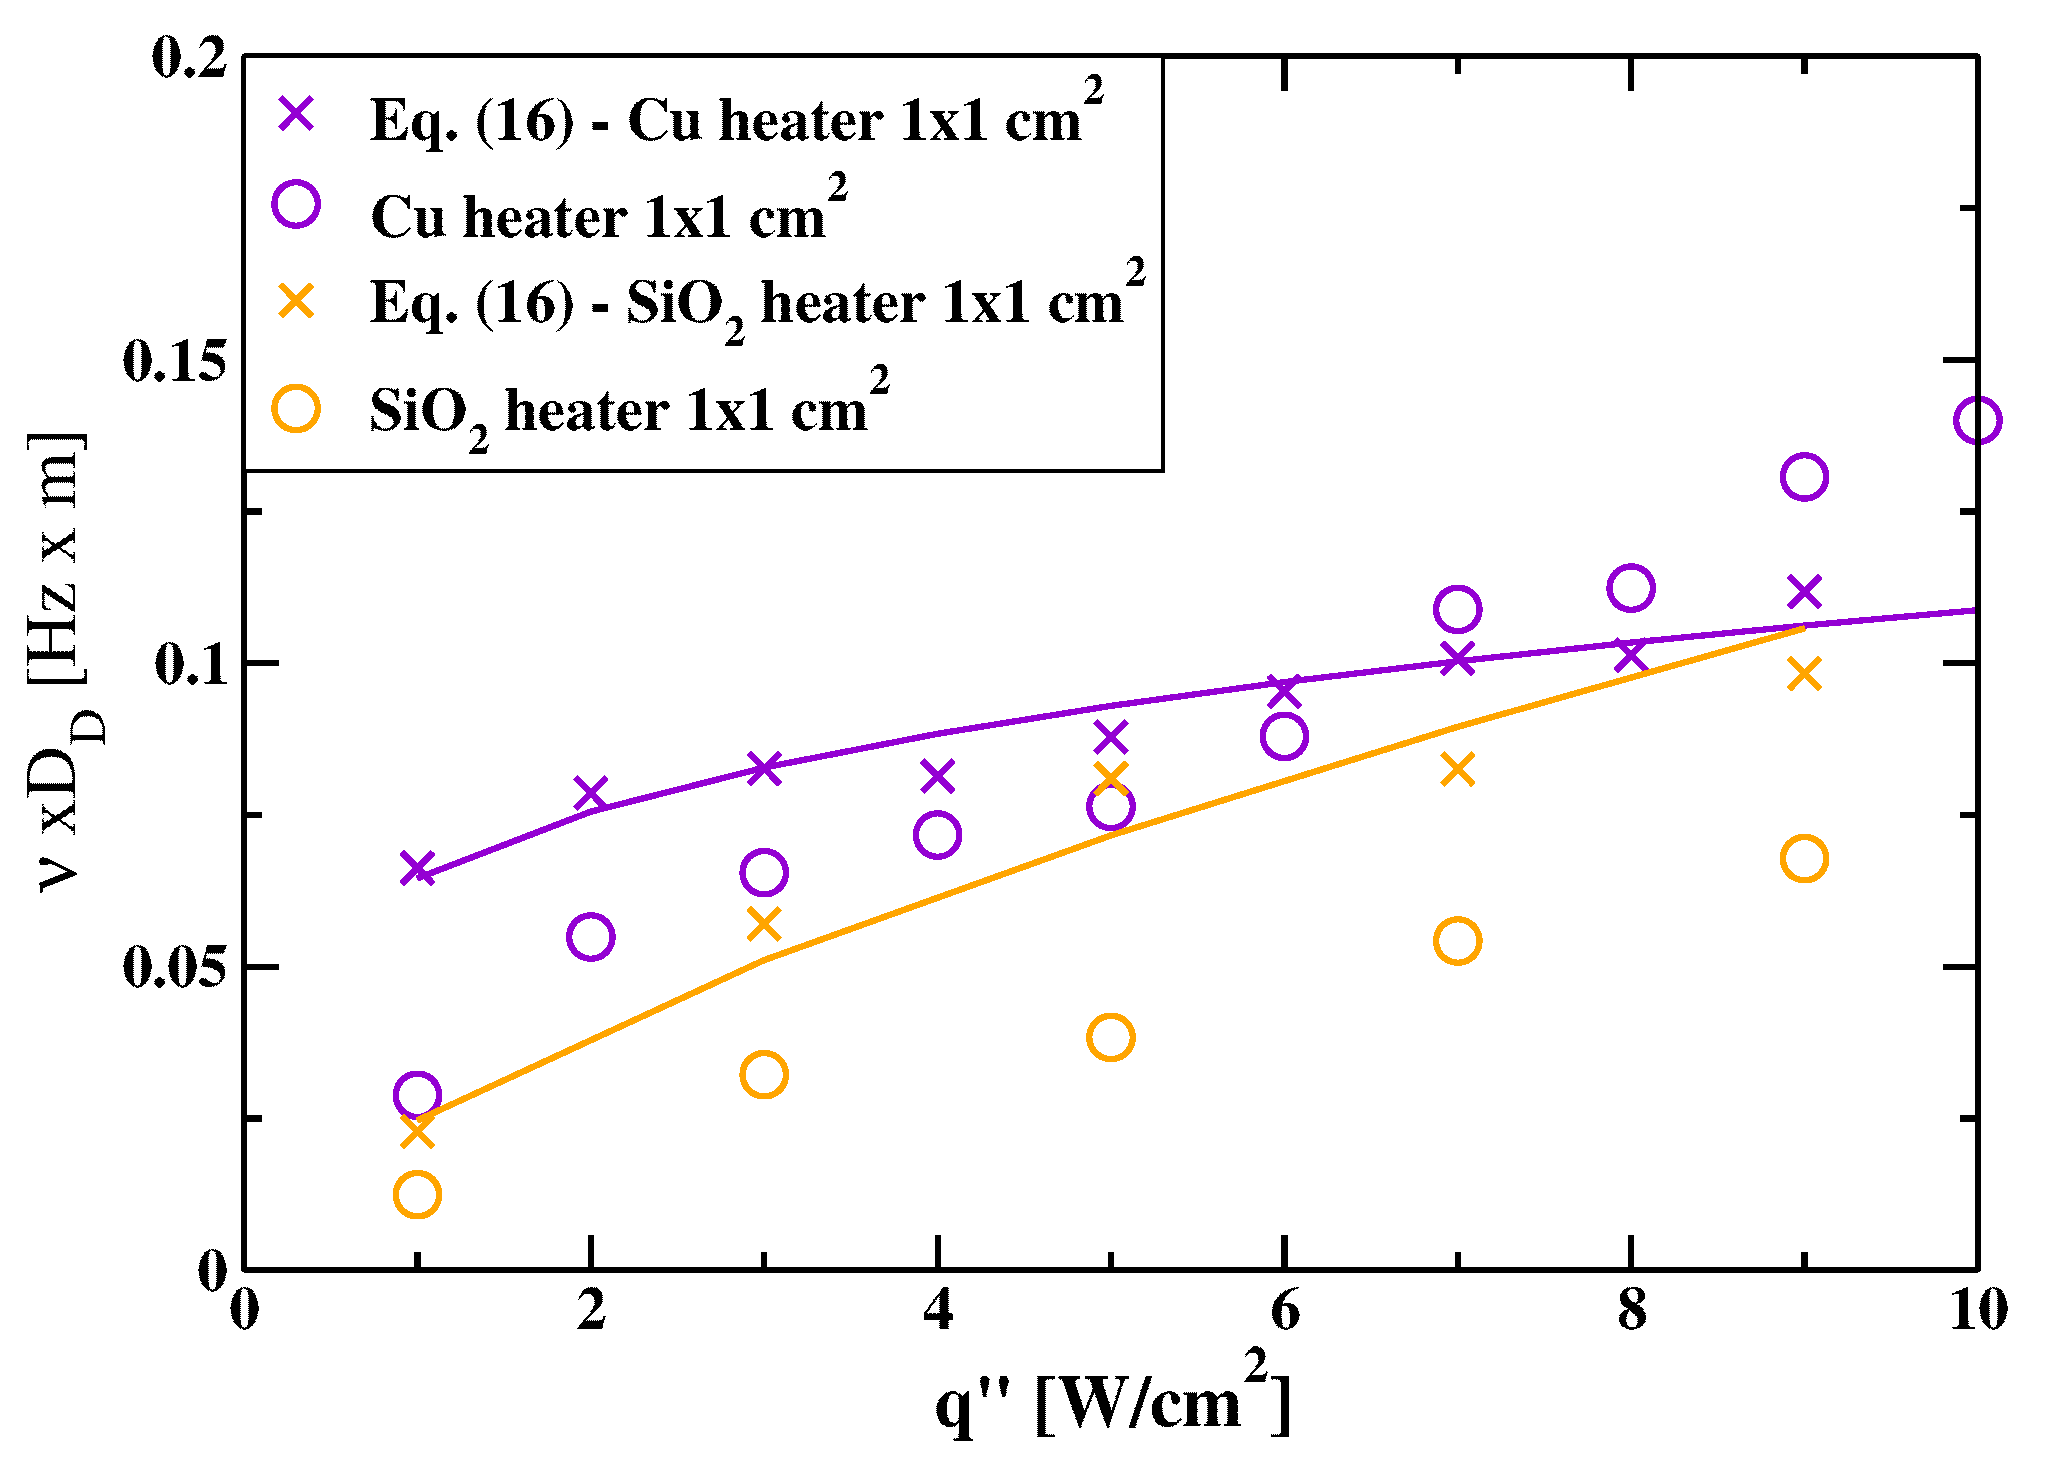
Here, t g represents the average growth time of a bubble, and t d is the average time lag between consecutive bubbles (Figure 5(c)). It is important to note that this latter time can be greater than the wait time t w defined by Eq. (14), as the microlayer may recover, and the cavity is influenced by the temperature of neighboring cavities. The values of t g and t d can be calculated using the evolution of the bubble radius at each active nucleation site as predicted by the model. The solid curves in Figure 6 are fitted to Eq. (16) for C u (violet line) and S i O 2 (orange line) heaters, and they are comparable to ν × D d for each type of heater (violet circle and orange circle for C u and S i O 2 heater, repctively).

4. Conclusions

We analyze the effect of the intrinsic properties of the heater material on nucleate boiling through a model introduced in this work. This model incorporates many ingredients known in the literature, describing the various mechanisms involved in this phenomenon. In experiments, it is impossible to change one parameter without modifying the others. In other words, these experiments are challenging to reproduce even under the same conditions. For example, the vapor trapped in surface imperfections changes significantly from one trial to another, making it difficult to study which mechanism is predominant when comparing results. Simulations allow us to overcome this problem and study changes by modifying one parameter at a time.
We compared two materials, C u and S i O 2 , and found a substantial difference in nucleate boiling refrigeration between a good thermal conductor like C u and a poor conductor like S i O 2 . Even assuming that the properties of both surfaces remain the same, i.e., they have the same density of cavities that can be activated with a certain Gaussian size distribution and that both surfaces maintain the contact angle with the refrigerant liquid, we found that the average bubble frequency varies from one material to another. This is attributed to both the bubble growth time and the time lapse between bubbles generated in the same active cavity, both of which exhibit a notable dependence on the material. We observed an influence of neighboring bubbling sites, especially in S i O 2 due to its very low thermal conductivity and diffusivity. In fact, temperature variations become highly visible in such materials due to their significant inertia in recovery. Finally, we contrasted the simulation results with a semi-empirical correlation known for the bubble frequency times the departure diameter, obtaining good agreement between them (see Eq. (16) and Figure 6).

References

  1. Yeh, L. Review of heat transfer technologies in electronic equipment. Trans. ASME-P-J. Electron. Pack. 1995, 117, 333–339. [Google Scholar] [CrossRef]
  2. Manglik, R.M. On the advancements in boiling, two-phase flow heat transfer, and interfacial phenomena. J. Heat Transfer 2006, 128, 1237–1242. [Google Scholar] [CrossRef]
  3. Kandlikar, S.G. History, advances, and challenges in liquid flow and flow boiling heat transfer in microchannels: a critical review. J. Heat Transfer 2012, 134, 034001. [Google Scholar] [CrossRef]
  4. Bankoff, S. Entrapment of gas in the spreading of a liquid over a rough surface. AIChE J. 1958, 4, 24–26. [Google Scholar] [CrossRef]
  5. Cho, H.J.; Wang, E.N. Bubble nucleation, growth, and departure: A new, dynamic understanding. Int. J. Heat Mass Transf. 2019, 145, 1–8. [Google Scholar] [CrossRef]
  6. Yabuki, T.; Nakabeppu, O. Heat transfer mechanisms in isolated bubble boiling of water observed with MEMS sensor. Int. J. Heat Mass Transf. 2014, 76 (C), 286–297. [Google Scholar] [CrossRef]
  7. Goodman, J.B.; Krase, N.W. Solubility of nitrogen in water at high pressures and temperatures. Ind. Eng. Chem. 1931, 23, 401–404. [Google Scholar] [CrossRef]
  8. Forrest, E.; et al. . EAugmentation of nucleate boiling heat transfer and critical heat flux using nanoparticle thin-film coatings. Int. J. Heat Mass 2010, 53, 58–67. [Google Scholar] [CrossRef]
  9. El-Genk, M.S.; Ali, A.F. Enhanced nucleate boiling on copper micro-porous surfaces. Int. J. Multiphase Flow 2010, 36, 780–792. [Google Scholar] [CrossRef]
  10. D. Ćoso, D.; Srinivasan, V.; Lu, M.C.; Chang, J.Y.; Majumdar, A. Enhanced heat transfer in biporous wicks in the thin liquid film evaporation and boiling regimes. J. Heat Transfer 2012, 134.
  11. Kandlikar, S. Controlling bubble motion over heated surface through evaporation momentum force to enhance pool boiling heat transfer. Appl. Phys. Lett. 2013, 102. [Google Scholar] [CrossRef]
  12. Paxson, A.T.; Yage, J.L.; Gleason, K.K.; Varanasi, K.K. Stable dropwise condensation for enhancing heat transfer via the initiated chemical vapor deposition (iCVD) of grafted polymer films. Adv. Mater 2014, 26, 418–423. [Google Scholar] [CrossRef]
  13. Son, G.; Dhir, V.K.; Ramanujapu, N. Dynamics and heat transfer associated with a single bubble during nucleate boiling on a horizontal surface. J. Heat Transf. 1999, 121. [Google Scholar] [CrossRef]
  14. Mukherjee, A.; Kandlikar, S.G. Numerical study of single bubbles with dynamic contact angle during nucleate pool boiling. Int. J. Heat Mass Transf. 2007, 50, 127–138. [Google Scholar] [CrossRef]
  15. Nam, Y.; Aktinol, E.; Dhir, V.K.; Ju, Y.S. Single bubble dynamics on a superhydrophilic surface with artificial nucleation sites. Int. J. Heat Mass Transf. 2011, 54, 1572–1577. [Google Scholar] [CrossRef]
  16. Churaev, N. The effect of adsorbed layers on van der waals forces in thin liquid films. Coll. Polym. Sci. 1975, 253, 120–126. [Google Scholar] [CrossRef]
  17. Chung, J.N.; Chen, T.; Maroo, S.C. A review of recent progress on nano/micro scale nucleate boiling fundamentals. Front. Heat Mass Transf. 2011, 2. [Google Scholar] [CrossRef]
  18. Urbano, A.; Tanguy, S.; Huber, G.; Colin, C. Direct numerical simulation of nucleate boiling in micro-layer regime. Int. J. Heat Mass Transf. 2018, 123, 1128–1137. [Google Scholar] [CrossRef]
  19. Jung, S.; Kim, H. Hydrodynamic formation of a microlayer underneath a boiling bubble. Int. J. Heat Mass Transf. 2018, 120, 1229–1240. [Google Scholar] [CrossRef]
  20. Zou, A.; Chanana, A.; Agrawal, A.; Jr., P.C.W.; Maroo, S.C. Steady state vapor bubble in pool boiling. Scient. Rep. 2016, 6.
  21. Giustini, G.; Jung, S.; Kim, H.; Walker, S. Evaporative thermal resistance and its influence on microscopic bubble growth. Int. J. Heat Mass Transf. 2016, 101, 733–741. [Google Scholar] [CrossRef]
  22. Sato, Y.; Niceno, B. A depletable micro-layer model for nucleate pool boiling. J. Comput. Phys. 2015, 300, 20–52. [Google Scholar] [CrossRef]
  23. Ghazivini, M.; Hafez, M.; Ratanpara, A.; Kim, M. A review on correlations of bubble growth mechanisms and bubble dynamics parameters in nucleate boiling. J. Thermal Analysis and Calorimetry 2022, 147, 6035–6071. [Google Scholar] [CrossRef]
  24. Cooper, M.G. The microlayer nucleate and bubble growth in pool booling. Int. J. Heat Mass Transf. 1969, 12, 915–933. [Google Scholar] [CrossRef]
  25. Stralen, S.J.D.V.; Sohal, M.S.; Cole, R.; Sluyter, W.M. Bubble growth rates in pure and binary systems: Combined effect of relaxation and evaporation microlayers. Int. J. Heat Mass Transf. 1975, 18, 453–461. [Google Scholar] [CrossRef]
  26. Han, C.Y.; Griffith, P. The mechanism of heat transfer in nucleate pool boiling - Part I. Int. J. Heat Mass Transf. 1965, 8, 887–904. [Google Scholar]
  27. Podowski, M.Z.; Podowski, R.M. Mechanistic Multidimensional Modeling of Forced Convection Boiling Heat Transfer. Sci. and Tech. of Nuclear Installations 2008, 2009. [Google Scholar] [CrossRef]
  28. Basu, N.; Warrier, G.R.; Dhir, V.K. Wall heat flux partitioning during subcooled flow boiling: Part 1 - Model development. J Heat Transfer 2005, 127, 131–140. [Google Scholar] [CrossRef]
  29. Buyevich, Y.A.; Webbon, B.W. The isolated bubble regime in pool nucleate boiling. Int. J. Heat Mass Transf. 1997, 40, 365–377. [Google Scholar] [CrossRef]
  30. Chang, M.J.; Chow, L.C.; Chang, W.S. Improved alternating-direction implicit method for solving transient three-dimensional heat diffusion problems. Num. Heat Transf, Part B: Fund.: An Int. J. Comp Meth. 1991, 19, 69–84. [Google Scholar] [CrossRef]
  31. Judd, R.; Hwang, K. The isolated bubble regime in pool nucleate boiling. J. Heat Transfer 1976, 98, 623. [Google Scholar] [CrossRef]
  32. Marcel, C.; Clausse, A.; Frankiewicz, C.; Betz, A.; Attinger, D. Numerical investigation into the effect of surface wettability in pool boiling heat transfer with a stochastic-automata model. Int. J. Heat Mass Transf. 2017, 111, 657–665. [Google Scholar] [CrossRef]
  33. McAdams, W. Heat Transmission, 3 ed.; McGraw-Hill: New York, 1954; chapter 4. [Google Scholar]
  34. Goldstein, R.; Sparrow, E.; Jones, D. Natural Convection Mass Transfer Adjacent to Horizontal Plates. International Journal of Heat and Mass Transfer 1973, 16, 1025. [Google Scholar] [CrossRef]
  35. Lloyd, J.; Moran, W. Natural Convection Mass Transfer Adjacent to Horizontal Surfaces of Various Platforms. ASME Paper, 1974.
  36. Snyder, N.W. Summary of conference on bubble dynamics and boiling heat transfer held at the Jet Propulsion Laboratory. Jpl memo, Jet Propulsion Laboratory, California Institute of Technology, 1956.
  37. Bergles, A. Boiling heat transfer. Modern Developments and Advances; Elsevier: New York, 1992; chapter Elements of boiling heat transfer; pp. 389–416. [Google Scholar]
  38. van Stralen, S.; Cole, R. Boiling Phenomena: Physicochemical and Engineering Fundamentals and Applications; Number 1 in Boiling Phenomena: Physicochemical and Engineering Fundamentals and Applications, Hemisphere Publishing Corporation, 1979. [Google Scholar]
  39. Golobic, I.; Petkovsek, J.; Baselj, M.; Papez, A.; Kenning, D.B.R. Experimental determination of transient wall temperature distributions close to growing vapor bubbles. Heat and Mass Transfer 2009, 45, 857–866. [Google Scholar] [CrossRef]
  40. van Straken, S.; Cole, R. Bolining phenomena; McGraw-Hill: New York, 1979; Vol. 1 of Physicochemical and Engineering Fundamentals ans Applications, chapter 6; pp. 155–165. [Google Scholar]
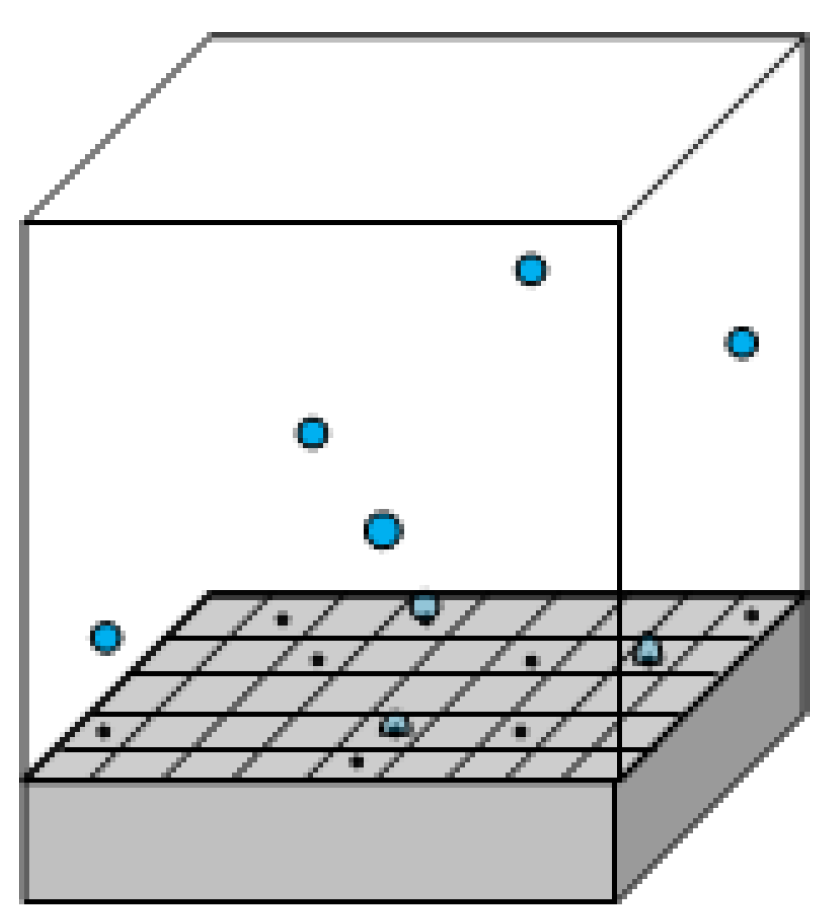
Figure 1. Model setup diagram: A heater, measuring a few centimeters, is placed at the bottom of the container, divided into cells of 250 × 250 × 250 μ m 3 (refer to Eq. (1)). Black dots and sky-blue semispheres depict cavities and bubbles, respectively. Cavities are randomly distributed at centers of cells (some of them may not have cavities), and a subset of them becomes activated based on Eq. (4), allowing vapor bubbles to develop. Since the investigated pool nucleate boiling regime is far from its critical state, the model does not concern itself with the fate of the bubbles once they depart. (This critical state does not necessarily align with the commonly studied boiling crisis, during which the maximum critical heat flux (CHF) is achieved [29].)
Preprints 94510 g001
Figure 2. Schematic representation of boiling heat transfer model including microlayer evaporation (extrahido de [31]).
Preprints 94510 g002
Figure 3. The product of the mean frequency of bubbles, ν , and their number, n , plotted against the input power per area q " for both copper (Cu) and silicon dioxide (SiO2) heaters. The simulations were conducted with a fixed contact angle of ϕ = 20 , and 20 cavities were randomly distributed on the surfaces with Gaussian size distributions given by 6 ± 3 ; μ m , which varied for each heater. The results represent an average over typically twenty-five samples. The C u heater with higher thermal conductivity and diffusivity exhibit enhanced refrigeration efficiency through nucleate boiling. The thermal conductivity and diffusivity of C u are κ C u = 401 W / m K and α C u = 116.5967 m m 2 / s , respectively compared to κ S i O 2 = 1.38 W / m K and α S i O 2 = 0.8344 m m 2 / s for the S i O 2 . Solid lines represent arbitrary power fits to the symbols, serving as guides for the eye.
Preprints 94510 g003
Figure 4. Temporal evolution of the surface temperature for (a)-(d) a S i O 2 heater and (e)-(h) a C u heater, both initially at the saturation temperature of water ((a) and (e)). Subsequently, the mean temperature of the S i O 2 heater is higher than that of the Cu heater. The temperature scale is shown on the right of each figure.
Preprints 94510 g004
Figure 5. (a) Mean bubble frequency ν in the steady state plotted against the input power per area q " , (b) power extracted q " m c by microconvection, (c) bubble radius growth r ( t ) , and (d) temperature T of the active cavity versus time, for both C u and S i O 2 heaters. The parameters are consistent with those in Figure 3 (see caption). In (b), the input power per area used is 5 W / c m 2 , while in (c) and (d), it is 7 W / c m 2 . In the transient, lasting on the order of ten seconds for both cavities in (b), the orange curve indicates a bubble departure at an early stage, after which the cavity remained inactive for a relatively extended period. Quiescent states are observed in bubbles on the S i O 2 heater, where the growth of their radii halts due to a collective effect with neighboring cavities (orange line in (c)).
Preprints 94510 g005
Figure 6. Product of the bubble mean frequency times the departure size as a function of q " , for both C u and S i O 2 heater. Cross symbols corresponds to the Eq.(16), with t g and t d calculated by simulations. The solid curves are fitted to cross symbols. The parameters are consistent with those in Figure 3 (see caption).
Preprints 94510 g006
Disclaimer/Publisher’s Note: The statements, opinions and data contained in all publications are solely those of the individual author(s) and contributor(s) and not of MDPI and/or the editor(s). MDPI and/or the editor(s) disclaim responsibility for any injury to people or property resulting from any ideas, methods, instructions or products referred to in the content.
Copyright: This open access article is published under a Creative Commons CC BY 4.0 license, which permit the free download, distribution, and reuse, provided that the author and preprint are cited in any reuse.
Alerts
Prerpints.org logo

Preprints.org is a free preprint server supported by MDPI in Basel, Switzerland.

Subscribe

© 2025 MDPI (Basel, Switzerland) unless otherwise stated