Submitted:
25 December 2023
Posted:
26 December 2023
You are already at the latest version
Abstract
Keywords:
1. Introduction
2. Results
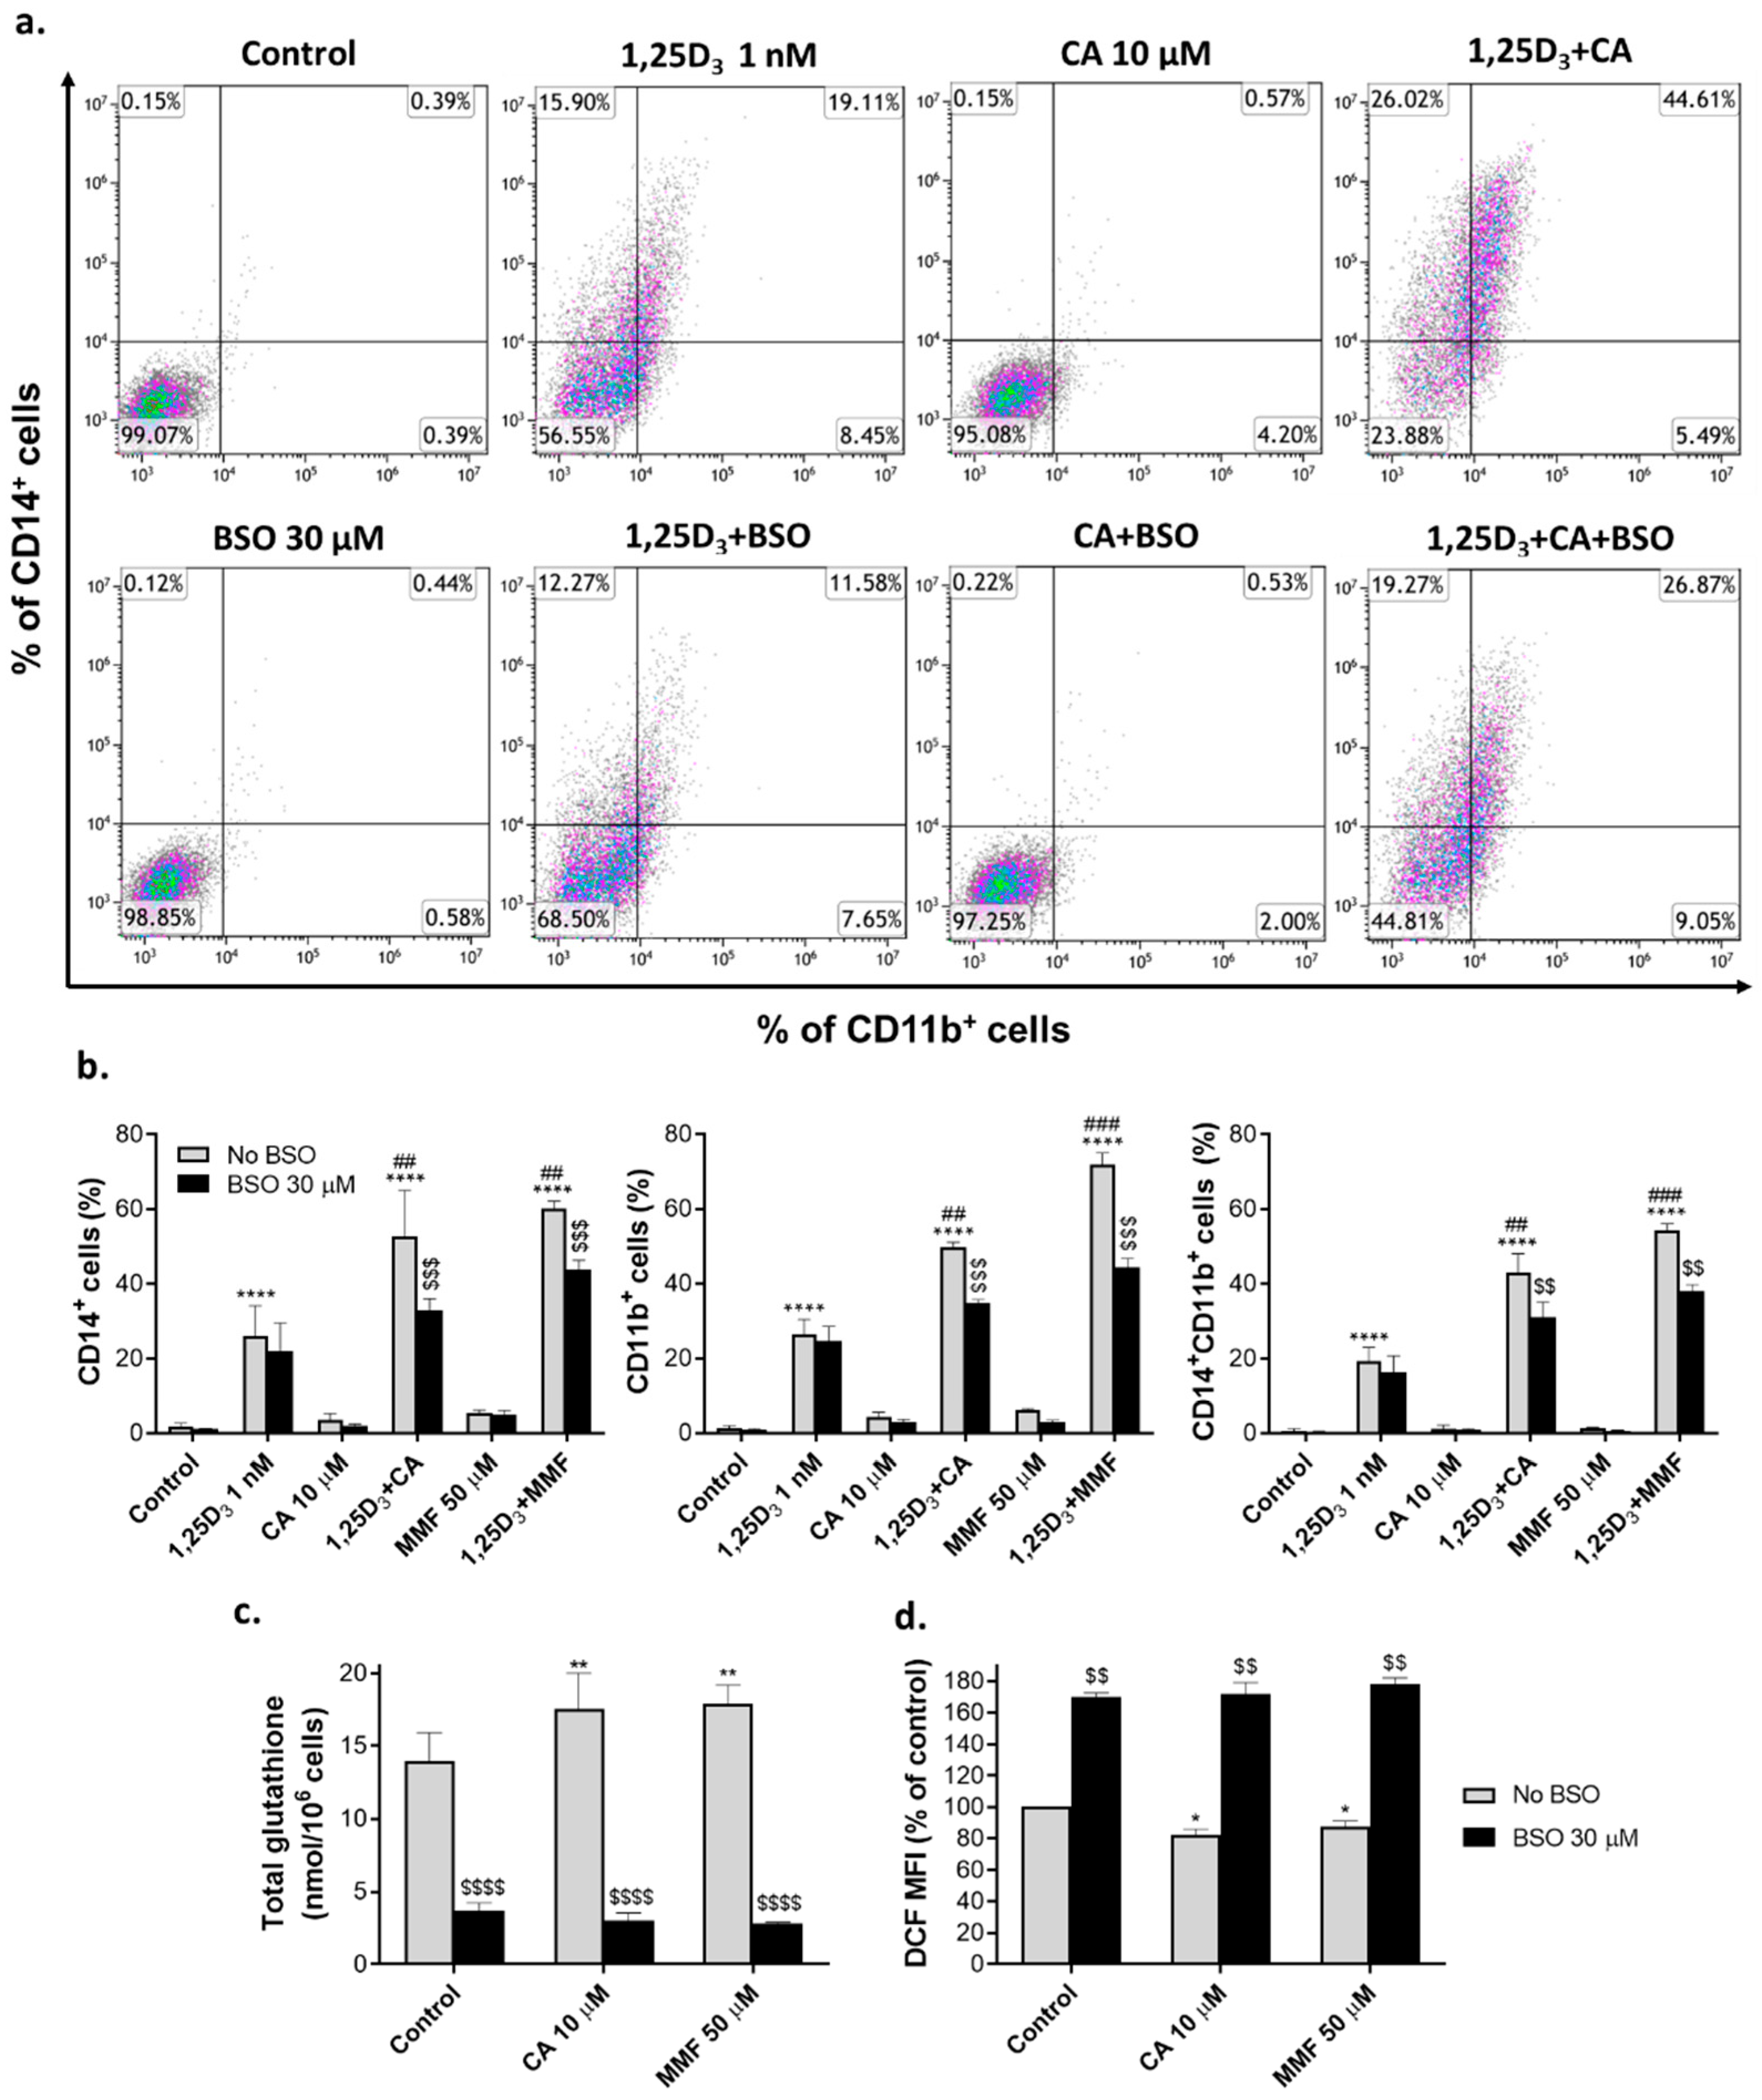
2.1. Glutathione depletion attenuates the differentiation-enhancing effects of Nrf2 activators
2.2. Effects of glutathione depletion on mRNA and protein levels of molecular regulators involved in cell differentiation
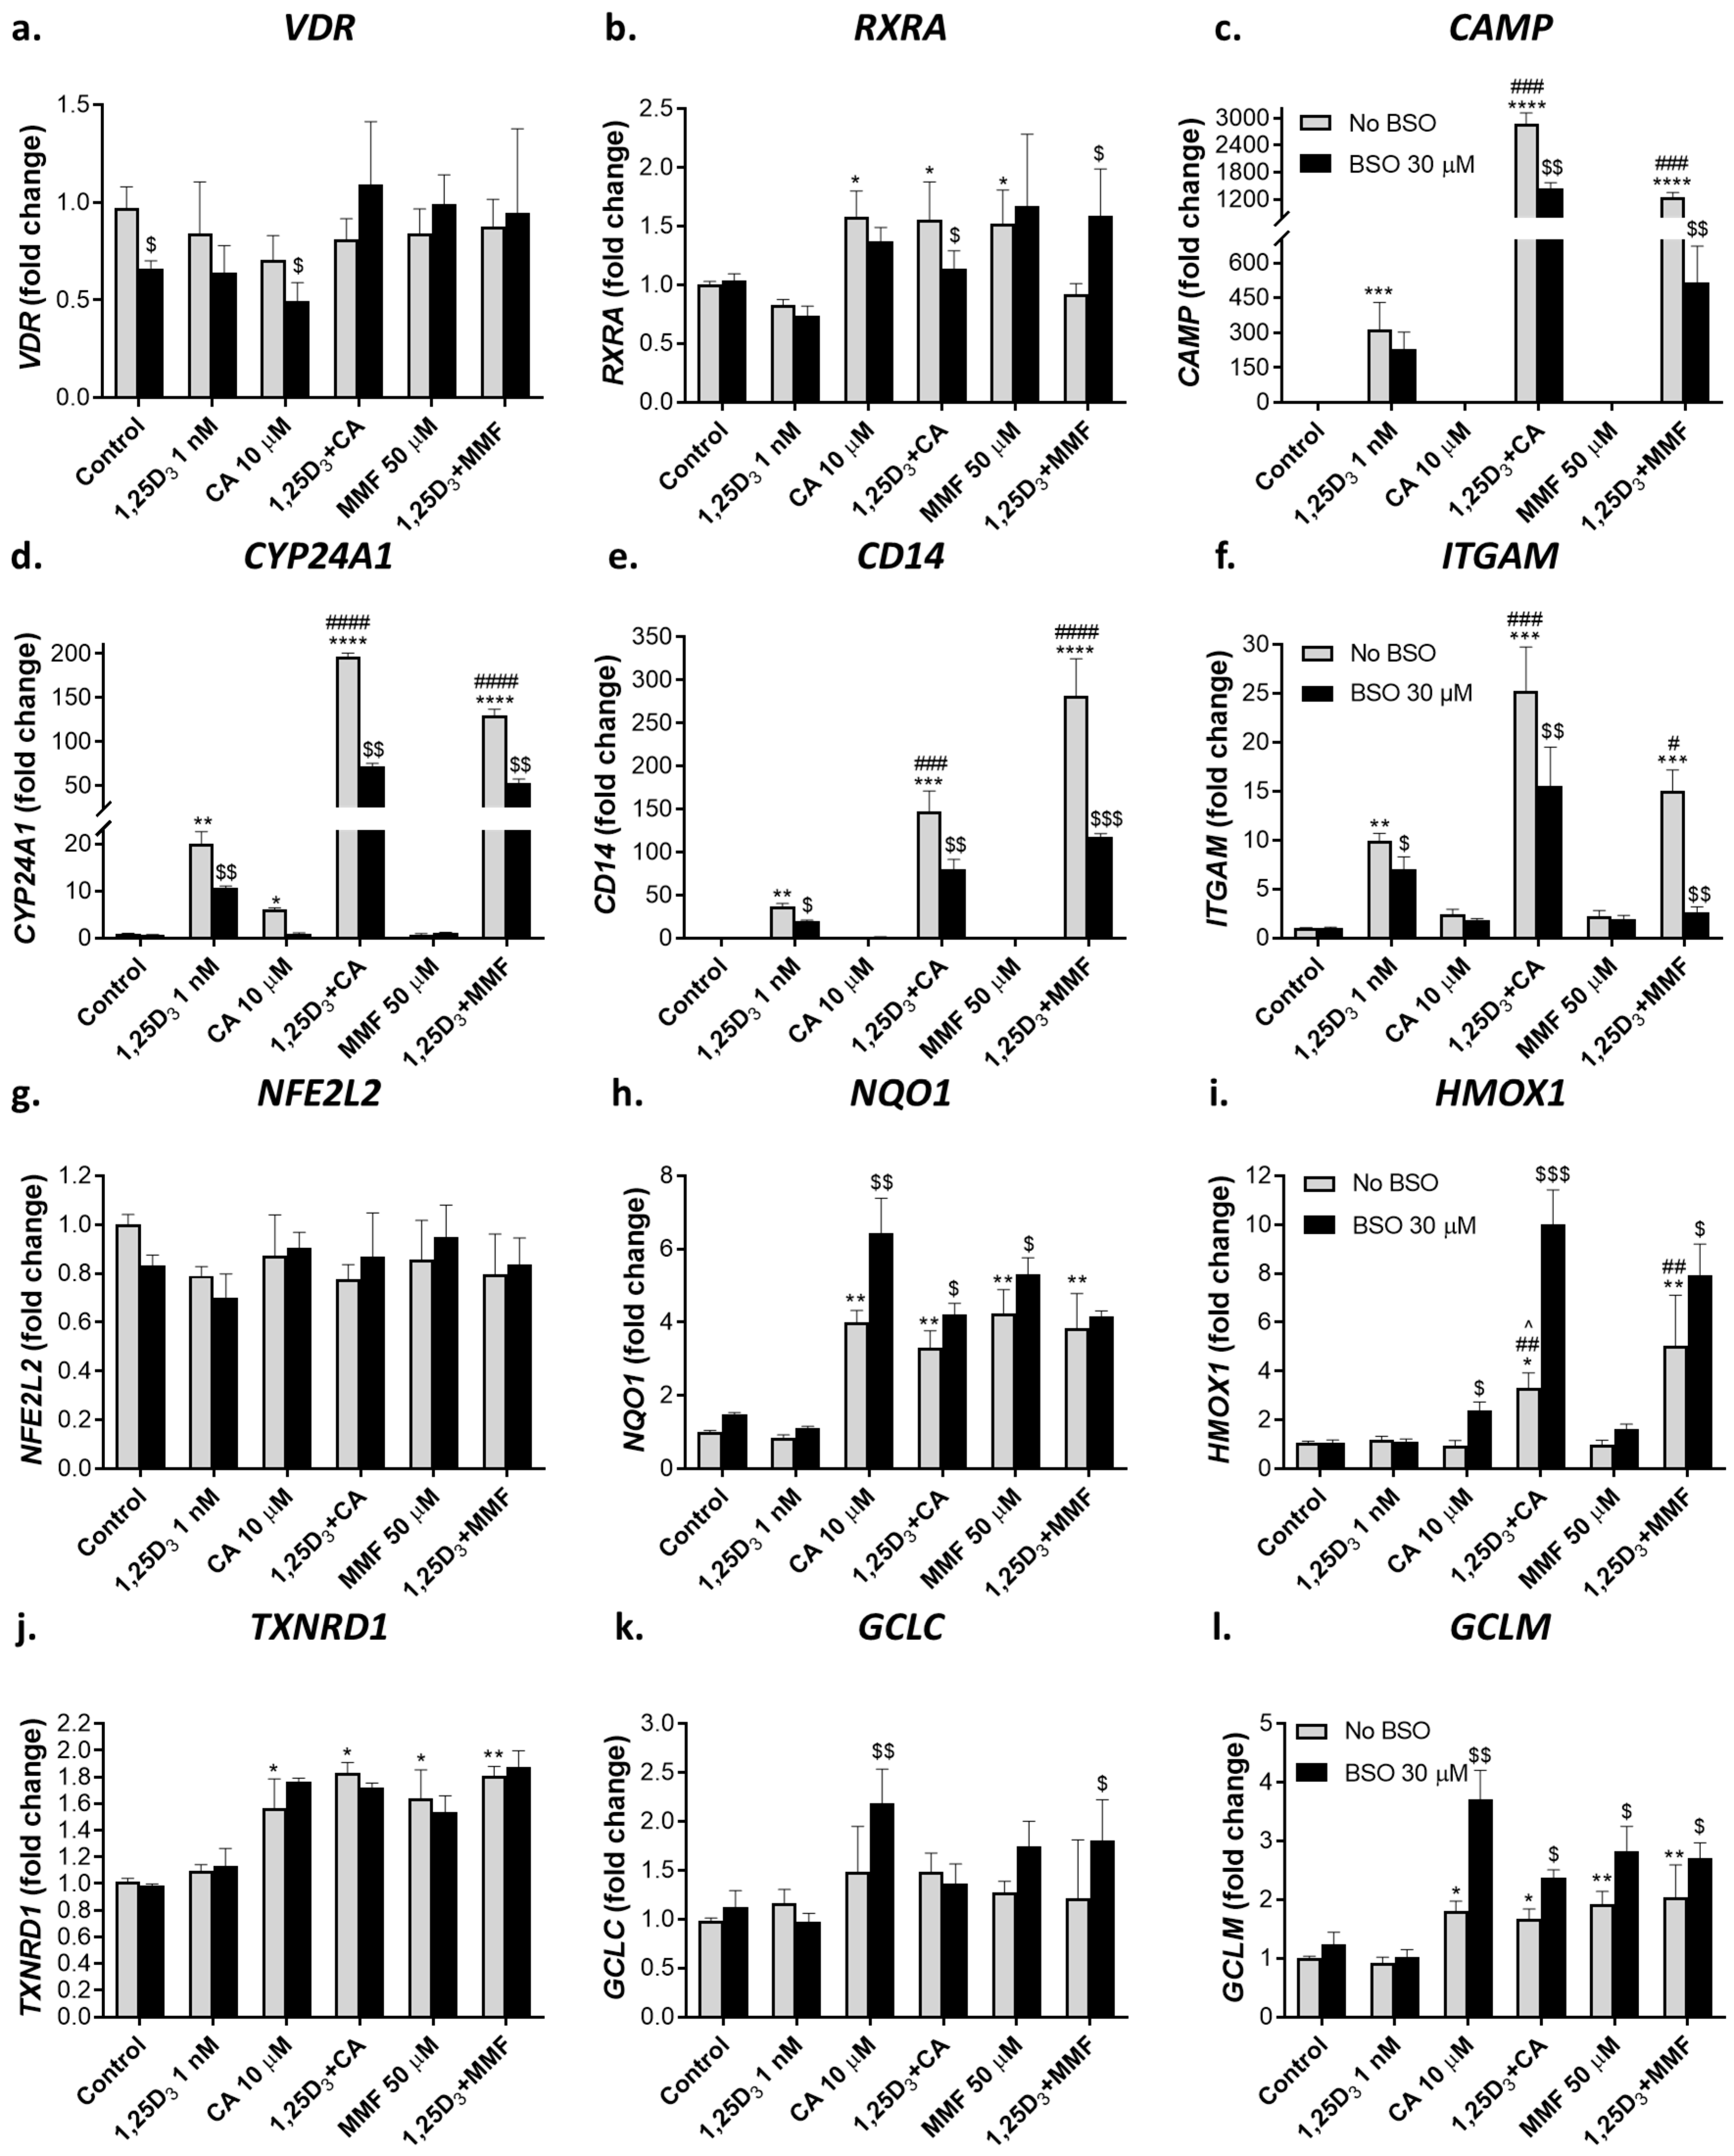
2.2.1. Glutathione depletion differentially affects mRNA expression of vitamin D- and Nrf2-related genes
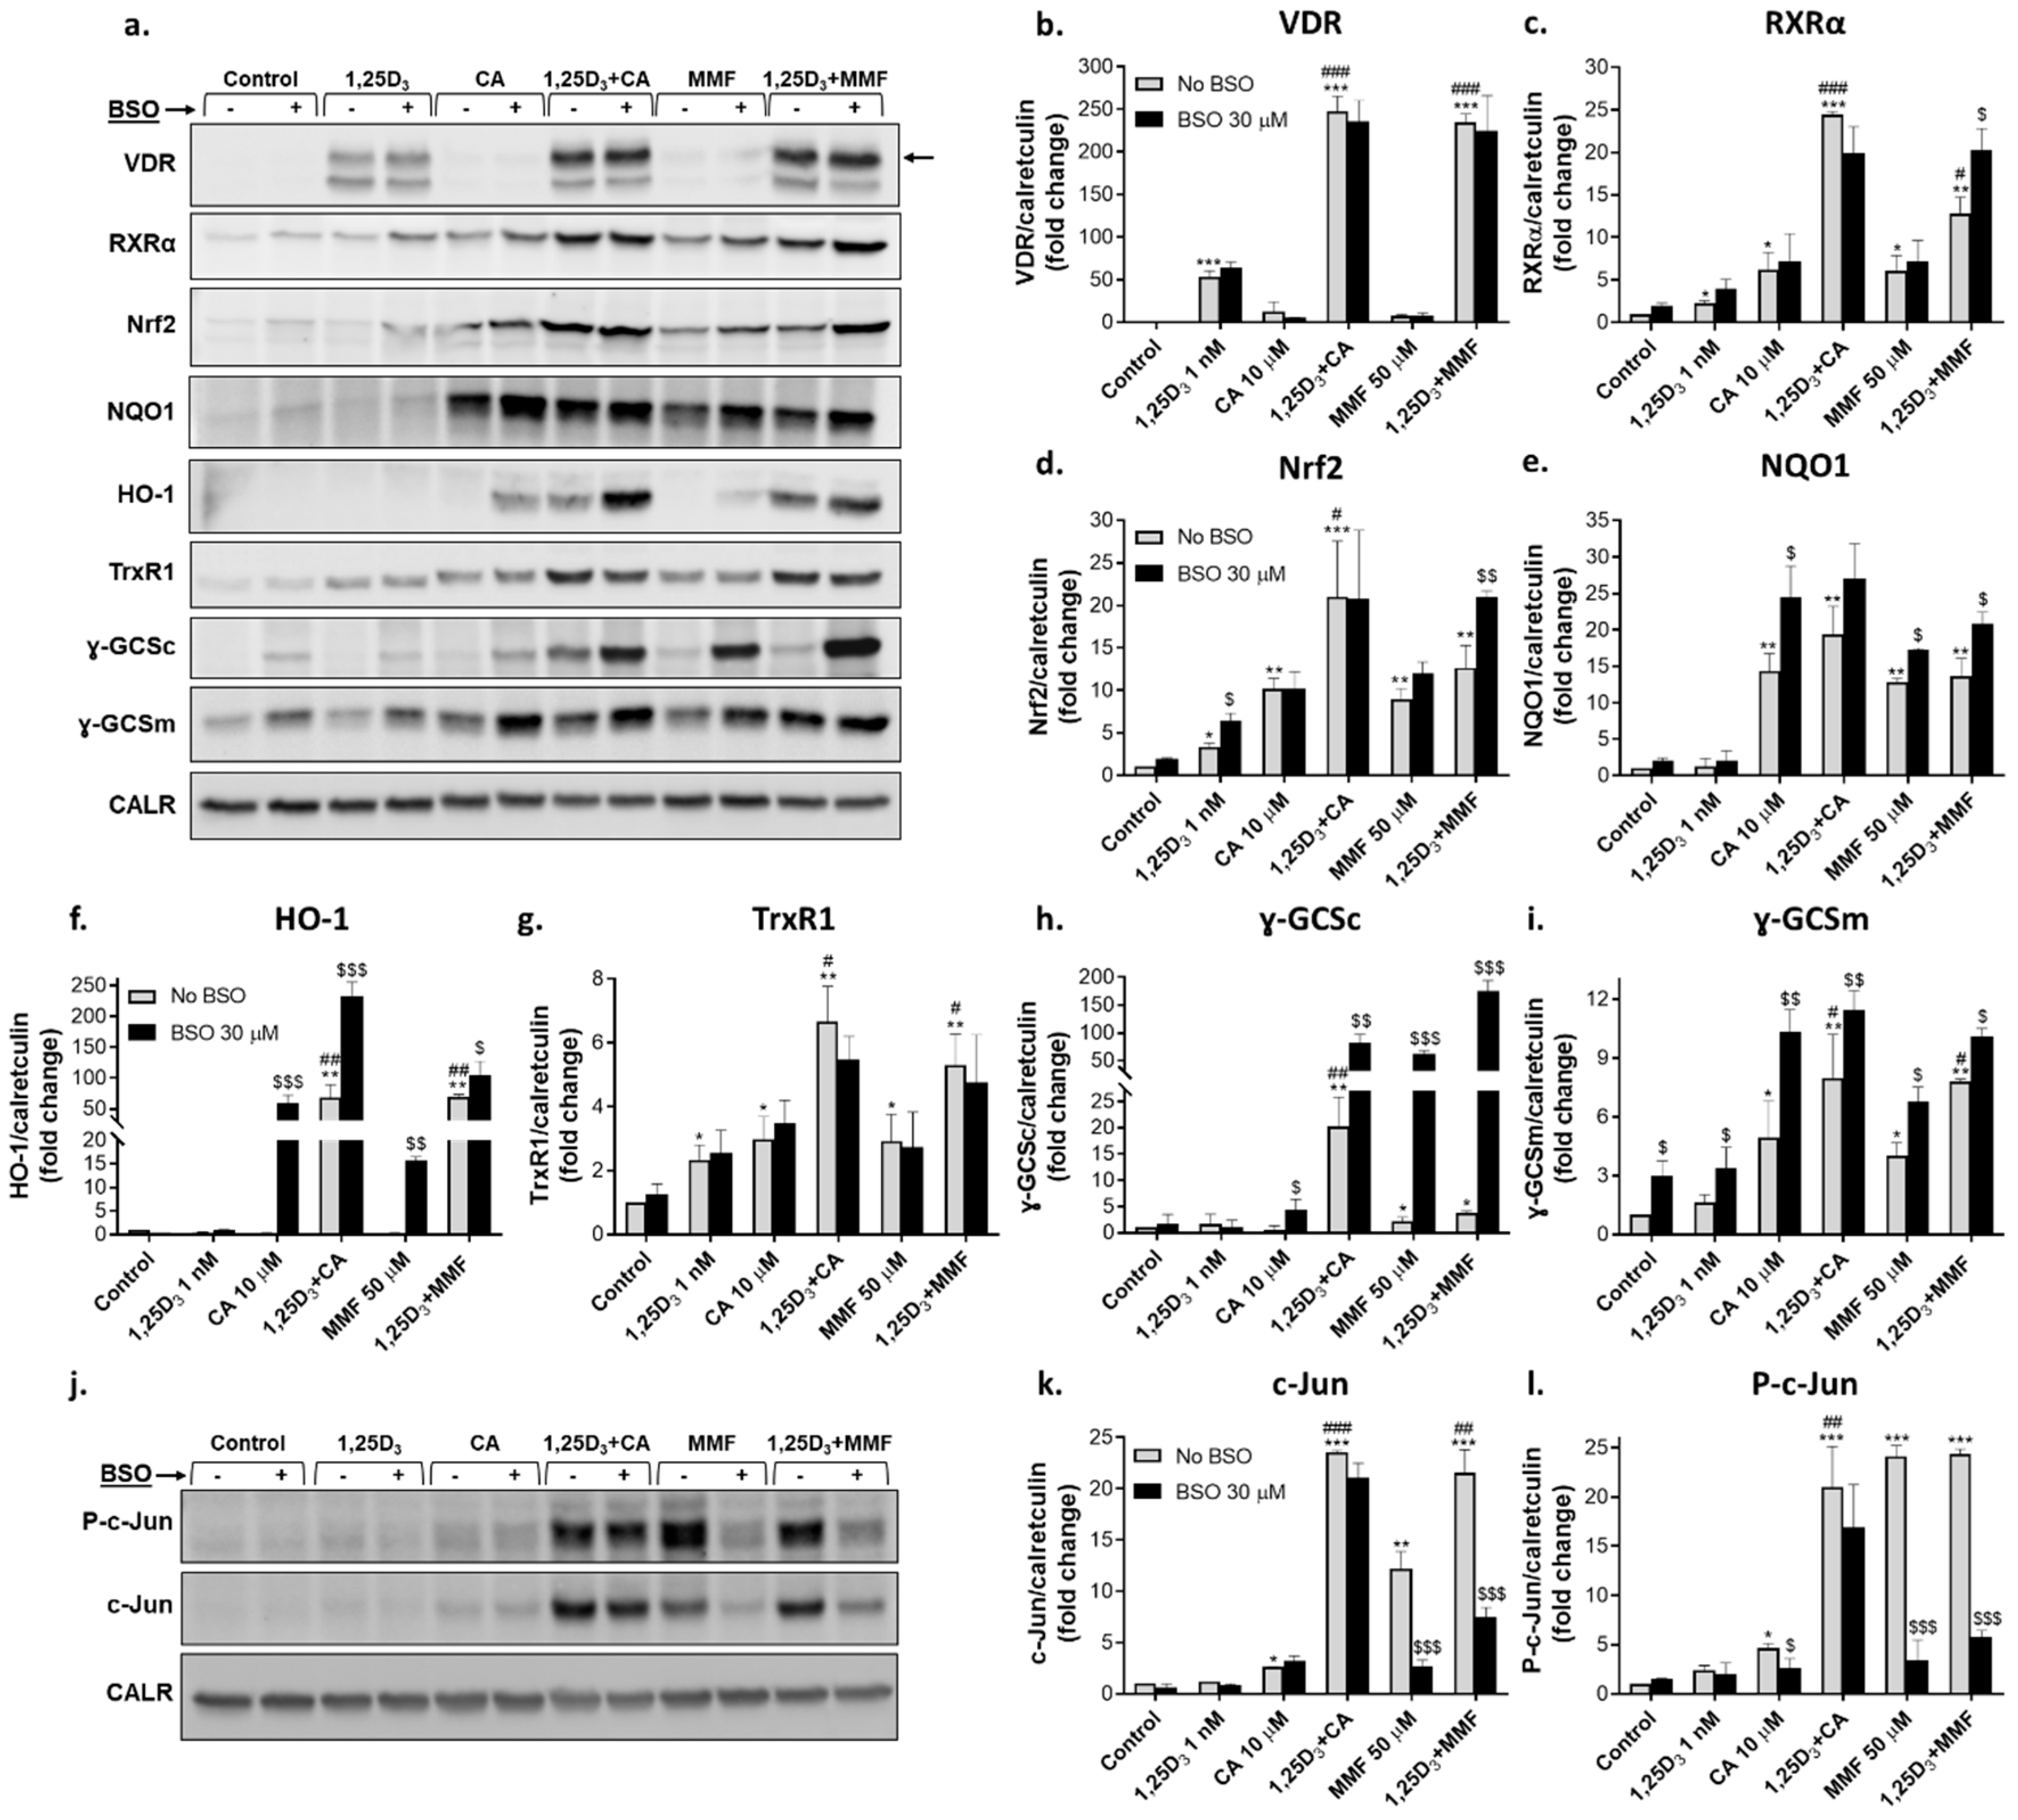
2.2.2. Glutathione depletion differentially affects the expression of proteins encoded by vitamin D- and Nrf2-related genes
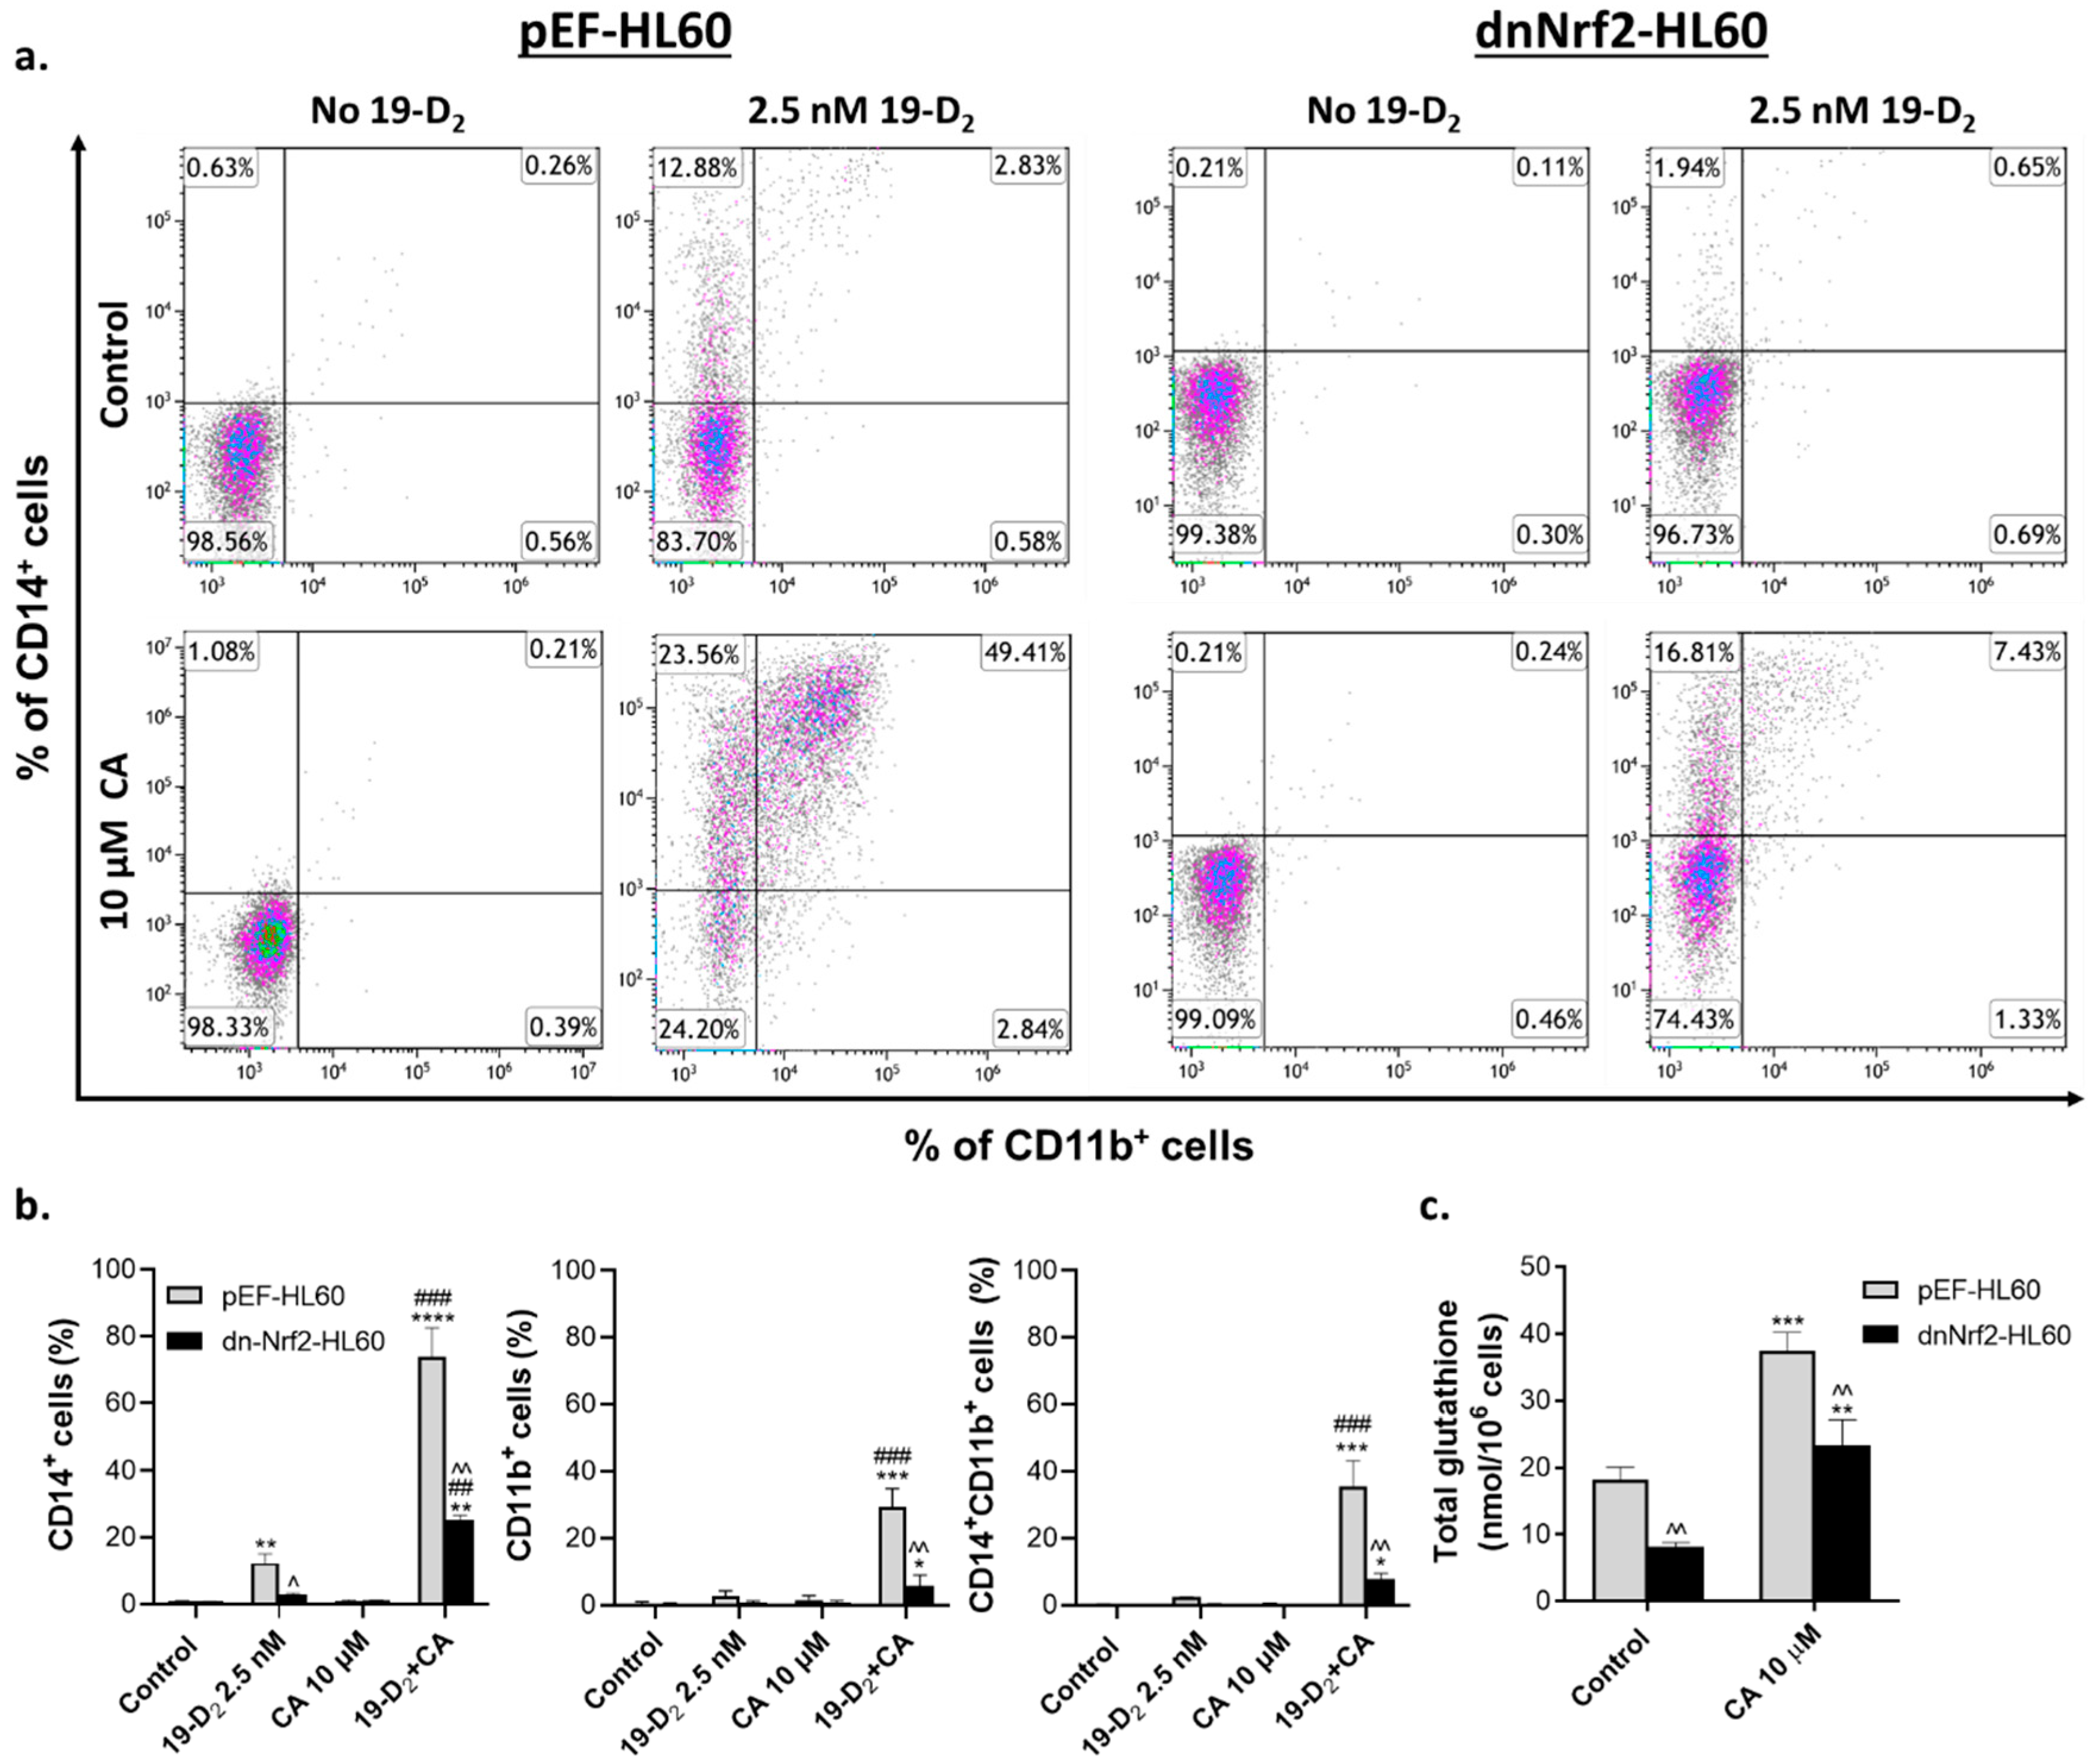
2.3. Introduction of exogenous GSH partially reverses the suppressing effect of a dominant-negative Nrf2 mutant on myeloid differentiation of HL60 cells
2.4. Effects of exogenous GSH on mRNA and protein levels of molecular regulators of cell differentiation in vector-transfected and dominant-negative Nrf2-expressing HL60 cells
2.4.1. Regulation of vitamin D- and Nrf2-related gene expression by GSH ethyl ester
2.4.2. Regulation of vitamin D- and Nrf2-related protein expression by GSH ethyl ester
2.5. Involvement of AP-1 in the regulation of VDR/RXRα protein expression and transcriptional activity and the enhancement of 1,25D3-induced cell differentiation by Nrf2 activators
3. Discussion
3.1. Involvement of glutathione in the regulation of VDR signaling and myeloid differentiation
3.2. Modulation of glutathione levels and Nrf2/ARE signaling: Role of the intracellular ROS accumulation
3.3. Modulation of c-Jun by glutathione and the role of AP-1 in differentiation enhancement
3.4. A possible role of proteasome inhibition in a cooperative upregulation of VDR and Nrf2 protein expression by VDDs and Nrf2 activators
4. Materials and Methods
4.1. Materials
4.2. Cell culture and stable transfection
4.3. Determination of cell differentiation markers
4.4. Determination of intracellular levels of reactive oxygen species
4.5. Preparation of whole cell lysates and western blotting
4.6. RNA extraction, cDNA synthesis, and RT-qPCR
| CAMP FR | GCTAACCTCTACCGCCTCCT |
| CAMP REV | GGTCACTGTCCCCATACACC |
| CD14 FR | CAACCTAGAGCCGTTTCTAAAGC |
| CD14 REV | GCGCCTACCAGTAGCTGAG |
| CYP24A1 FR | GGAAGTGATGAAGCTGGACAACA |
| CYP24A1 REV | CTCATACAACACGAGGCAGATAC |
| GAPDH FR | CATGAGAAGTATGACAACAGCCT |
| GAPDH REV | AGTCCTTCCACGATACCAAAGT |
| GCLC FR | GGAGGAAACCAAGCGCCAT |
| GCLC REV | CTTGACGGCGTGGTAGATGT |
| GCLM FR | GGAAGAAGTGCCCGTCCA |
| GCLM REV | CTGAACAGGCCATGTCAACT |
| HO-1 FR | AAGACTGCGTTCCTGCTCAA |
| HO-1 REV | GGTCCTTGGTGTCATGGGTC |
| ITGAM FR | CTGTCTGCCAGAGAATCCAGTG |
| ITGAM REV | GAGGTGGTTATGCGAGGTCTTG |
| NQO1 FR | AAAGAAGGCCATCTGAGCCC |
| NQO1 REV | CCAGGCGTTTCTTCCATCCT |
| Nrf2 FR | CCTTGTCACCATCTCAGGGG |
| Nrf2 REV | TGGGGTTTTCCGATGACCAG |
| TXNRD1 FR | ACGTTACTTGGGCATCCCTG |
| TXNRD1 REV | AGAAATCCAGCGCACTCCAA |
| VDR FR | GACCTGTGGCAACCAAGACT |
| VDR REV | AATCAGCTCCAGGCTGTGTC |
4.7. Total glutathione assay
4.8. Cell treatment with AP-1 decoy oligodeoxynucleotides
4.9. Transient transfection and reporter gene assay
4.10. Statistical analysis
5. Conclusions
Supplementary Materials
Author Contributions
Funding
Institutional Review Board Statement
Informed Consent Statement
Data Availability Statement
Acknowledgments
Conflicts of Interest
References
- Lazarevic, V.L. Acute myeloid leukaemia in patients we judge as being older and/or unfit. J Intern Med 2021, 290, 279–293. [Google Scholar] [CrossRef] [PubMed]
- Recher, C.; Rollig, C.; Berard, E.; Bertoli, S.; Dumas, P.Y.; Tavitian, S.; Kramer, M.; Serve, H.; Bornhauser, M.; Platzbecker, U.; et al. Long-term survival after intensive chemotherapy or hypomethylating agents in AML patients aged 70 years and older: a large patient data set study from European registries. Leukemia 2022, 36, 913–922. [Google Scholar] [CrossRef] [PubMed]
- Kayser, S.; Levis, M.J. Updates on targeted therapies for acute myeloid leukaemia. Br J Haematol 2022, 196, 316–328. [Google Scholar] [CrossRef] [PubMed]
- Short, N.J.; Ong, F.; Ravandi, F.; Nogueras-Gonzalez, G.; Kadia, T.M.; Daver, N.; DiNardo, C.D.; Konopleva, M.; Borthakur, G.; Oran, B.; et al. Impact of type of induction therapy on outcomes in older adults with AML after allogeneic stem cell transplantation. Blood Adv 2023, 7, 3573–3581. [Google Scholar] [CrossRef] [PubMed]
- Madan, V.; Koeffler, H.P. Differentiation therapy of myeloid leukemia: four decades of development. Haematologica 2021, 106, 26–38. [Google Scholar] [CrossRef] [PubMed]
- Yilmaz, M.; Kantarjian, H.; Ravandi, F. Acute promyelocytic leukemia current treatment algorithms. Blood Cancer J 2021, 11, 123. [Google Scholar] [CrossRef] [PubMed]
- Marcinkowska, E. Vitamin D Derivatives in Acute Myeloid Leukemia: The Matter of Selecting the Right Targets. Nutrients 2022, 14. [Google Scholar] [CrossRef]
- Cao, H.; Xu, Y.; de Necochea-Campion, R.; Baylink, D.J.; Payne, K.J.; Tang, X.; Ratanatharathorn, C.; Ji, Y.; Mirshahidi, S.; Chen, C.S. Application of vitamin D and vitamin D analogs in acute myelogenous leukemia. Exp Hematol 2017, 50, 1–12. [Google Scholar] [CrossRef] [PubMed]
- Rochel, N. Vitamin D and Its Receptor from a Structural Perspective. Nutrients 2022, 14. [Google Scholar] [CrossRef] [PubMed]
- Carlberg, C. Genomic signaling of vitamin D. Steroids 2023, 198, 109271. [Google Scholar] [CrossRef] [PubMed]
- Duffy, M.J.; Murray, A.; Synnott, N.C.; O’Donovan, N.; Crown, J. Vitamin D analogues: Potential use in cancer treatment. Crit Rev Oncol Hematol 2017, 112, 190–197. [Google Scholar] [CrossRef] [PubMed]
- Sokoloski, J.A.; Hodnick, W.F.; Mayne, S.T.; Cinquina, C.; Kim, C.S.; Sartorelli, A.C. Induction of the differentiation of HL-60 promyelocytic leukemia cells by vitamin E and other antioxidants in combination with low levels of vitamin D3: possible relationship to NF-kappaB. Leukemia 1997, 11, 1546–1553. [Google Scholar] [CrossRef] [PubMed]
- Amir, H.; Karas, M.; Giat, J.; Danilenko, M.; Levy, R.; Yermiahu, T.; Levy, J.; Sharoni, Y. Lycopene and 1,25-dihydroxyvitamin D3 cooperate in the inhibition of cell cycle progression and induction of differentiation in HL-60 leukemic cells. Nutr Cancer 1999, 33, 105–112. [Google Scholar] [CrossRef] [PubMed]
- Liu, Y.; Chang, R.L.; Cui, X.X.; Newmark, H.L.; Conney, A.H. Synergistic effects of curcumin on all-trans retinoic acid- and 1 alpha,25-dihydroxyvitamin D3-induced differentiation in human promyelocytic leukemia HL-60 cells. Oncol Res 1997, 9, 19–29. [Google Scholar] [PubMed]
- Danilenko, M.; Wang, X.; Studzinski, G.P. Carnosic acid and promotion of monocytic differentiation of HL60-G cells initiated by other agents. J Natl Cancer Inst 2001, 93, 1224–1233. [Google Scholar] [CrossRef] [PubMed]
- Sharabani, H.; Izumchenko, E.; Wang, Q.; Kreinin, R.; Steiner, M.; Barvish, Z.; Kafka, M.; Sharoni, Y.; Levy, J.; Uskokovic, M.; et al. Cooperative antitumor effects of vitamin D3 derivatives and rosemary preparations in a mouse model of myeloid leukemia. Int J Cancer 2006, 118, 3012–3021. [Google Scholar] [CrossRef]
- Kang, S.N.; Lee, M.H.; Kim, K.M.; Cho, D.; Kim, T.S. Induction of human promyelocytic leukemia HL-60 cell differentiation into monocytes by silibinin: involvement of protein kinase C. Biochem Pharmacol 2001, 61, 1487–1495. [Google Scholar] [CrossRef] [PubMed]
- Nachliely, M.; Sharony, E.; Kutner, A.; Danilenko, M. Novel analogs of 1,25-dihydroxyvitamin D2 combined with a plant polyphenol as highly efficient inducers of differentiation in human acute myeloid leukemia cells. J Steroid Biochem Mol Biol 2016, 164, 59–65. [Google Scholar] [CrossRef] [PubMed]
- Zhang, J.; Harrison, J.S.; Uskokovic, M.; Danilenko, M.; Studzinski, G.P. Silibinin can induce differentiation as well as enhance vitamin D3-induced differentiation of human AML cells ex vivo and regulates the levels of differentiation-related transcription factors. Hematol Oncol 2010, 28, 124–132. [Google Scholar] [CrossRef]
- Shabtay, A.; Sharabani, H.; Barvish, Z.; Kafka, M.; Amichay, D.; Levy, J.; Sharoni, Y.; Uskokovic, M.R.; Studzinski, G.P.; Danilenko, M. Synergistic antileukemic activity of carnosic acid-rich rosemary extract and the 19-nor Gemini vitamin D analogue in a mouse model of systemic acute myeloid leukemia. Oncology 2008, 75, 203–214. [Google Scholar] [CrossRef] [PubMed]
- Danilenko, M.; Wang, Q.; Wang, X.; Levy, J.; Sharoni, Y.; Studzinski, G.P. Carnosic acid potentiates the antioxidant and prodifferentiation effects of 1alpha,25-dihydroxyvitamin D3 in leukemia cells but does not promote elevation of basal levels of intracellular calcium. Cancer Res 2003, 63, 1325–1332. [Google Scholar] [PubMed]
- Bobilev, I.; Novik, V.; Levi, I.; Shpilberg, O.; Levy, J.; Sharoni, Y.; Studzinski, G.P.; Danilenko, M. The Nrf2 transcription factor is a positive regulator of myeloid differentiation of acute myeloid leukemia cells. Cancer Biol Ther 2011, 11, 317–329. [Google Scholar] [CrossRef] [PubMed]
- Yamamoto, M.; Kensler, T.W.; Motohashi, H. The KEAP1-NRF2 System: a Thiol-Based Sensor-Effector Apparatus for Maintaining Redox Homeostasis. Physiol Rev 2018, 98, 1169–1203. [Google Scholar] [CrossRef]
- Hecht, F.; Zocchi, M.; Alimohammadi, F.; Harris, I.S. Regulation of antioxidants in cancer. Mol Cell, 2023. [Google Scholar] [CrossRef]
- Berger, A.A.; Sottosanti, E.R.; Winnick, A.; Izygon, J.; Berardino, K.; Cornett, E.M.; Kaye, A.D.; Varrassi, G.; Viswanath, O.; Urits, I. Monomethyl Fumarate (MMF, Bafiertam) for the Treatment of Relapsing Forms of Multiple Sclerosis (MS). Neurol Int 2021, 13, 207–223. [Google Scholar] [CrossRef] [PubMed]
- Nachliely, M.; Trachtenberg, A.; Khalfin, B.; Nalbandyan, K.; Cohen-Lahav, M.; Yasuda, K.; Sakaki, T.; Kutner, A.; Danilenko, M. Dimethyl fumarate and vitamin D derivatives cooperatively enhance VDR and Nrf2 signaling in differentiating AML cells in vitro and inhibit leukemia progression in a xenograft mouse model. J Steroid Biochem Mol Biol 2019, 188, 8–16. [Google Scholar] [CrossRef] [PubMed]
- Wang, Q.; Salman, H.; Danilenko, M.; Studzinski, G.P. Cooperation between antioxidants and 1,25-dihydroxyvitamin D3 in induction of leukemia HL60 cell differentiation through the JNK/AP-1/Egr-1 pathway. J Cell Physiol 2005, 204, 964–974. [Google Scholar] [CrossRef] [PubMed]
- Wang, X.; Studzinski, G.P. The requirement for and changing composition of the activating protein-1 transcription factor during differentiation of human leukemia HL60 cells induced by 1,25-dihydroxyvitamin D3. Cancer Res 2006, 66, 4402–4409. [Google Scholar] [CrossRef]
- Alam, J.; Stewart, D.; Touchard, C.; Boinapally, S.; Choi, A.M.; Cook, J.L. Nrf2, a Cap'n'Collar transcription factor, regulates induction of the heme oxygenase-1 gene. J Biol Chem 1999, 274, 26071–26078. [Google Scholar] [CrossRef] [PubMed]
- Bover, J.; Dasilva, I.; Furlano, M.; Lloret, M.J.; Diaz-Encarnacion, M.M.; Ballarin, J.; Cozzolino, M. Clinical Uses of 1,25-dihydroxy-19-nor-vitamin D2 (Paricalcitol). Curr Vasc Pharmacol 2014, 12, 313–323. [Google Scholar] [CrossRef] [PubMed]
- Lu, S.C. Glutathione synthesis. Biochim Biophys Acta 2013, 1830, 3143–3153. [Google Scholar] [CrossRef] [PubMed]
- Murakami, S.; Motohashi, H. Roles of Nrf2 in cell proliferation and differentiation. Free Radic Biol Med 2015, 88, 168–178. [Google Scholar] [CrossRef] [PubMed]
- Zhao, Z.; Wang, Y.; Gao, Y.; Ju, Y.; Zhao, Y.; Wu, Z.; Gao, S.; Zhang, B.; Pang, X.; Zhang, Y.; et al. The PRAK-NRF2 axis promotes the differentiation of Th17 cells by mediating the redox homeostasis and glycolysis. Proc Natl Acad Sci U S A 2023, 120, e2212613120. [Google Scholar] [CrossRef] [PubMed]
- La Rosa, P.; Russo, M.; D’Amico, J.; Petrillo, S.; Aquilano, K.; Lettieri-Barbato, D.; Turchi, R.; Bertini, E.S.; Piemonte, F. Nrf2 Induction Re-establishes a Proper Neuronal Differentiation Program in Friedreich’s Ataxia Neural Stem Cells. Front Cell Neurosci 2019, 13, 356. [Google Scholar] [CrossRef] [PubMed]
- Hinoi, E.; Fujimori, S.; Wang, L.; Hojo, H.; Uno, K.; Yoneda, Y. Nrf2 negatively regulates osteoblast differentiation via interfering with Runx2-dependent transcriptional activation. J Biol Chem 2006, 281, 18015–18024. [Google Scholar] [CrossRef] [PubMed]
- Yagishita, Y.; Chartoumpekis, D.V.; Kensler, T.W.; Wakabayashi, N. NRF2 and the Moirai: Life and Death Decisions on Cell Fates. Antioxid Redox Signal 2023, 38, 684–708. [Google Scholar] [CrossRef]
- Liebermann, D.A.; Gregory, B.; Hoffman, B. AP-1 (Fos/Jun) transcription factors in hematopoietic differentiation and apoptosis. Int J Oncol 1998, 12, 685–700. [Google Scholar] [CrossRef] [PubMed]
- Wurm, S.; Zhang, J.; Guinea-Viniegra, J.; Garcia, F.; Munoz, J.; Bakiri, L.; Ezhkova, E.; Wagner, E.F. Terminal epidermal differentiation is regulated by the interaction of Fra-2/AP-1 with Ezh2 and ERK1/2. Genes Dev 2015, 29, 144–156. [Google Scholar] [CrossRef]
- Li, J.; King, I.; Sartorelli, A.C. Differentiation of WEHI-3B D+ myelomonocytic leukemia cells induced by ectopic expression of the protooncogene c-jun. Cell Growth Differ 1994, 5, 743–751. [Google Scholar]
- Grant, S.; Freemerman, A.J.; Birrer, M.J.; Martin, H.A.; Turner, A.J.; Szabo, E.; Chelliah, J.; Jarvis, W.D. Effect of 1-beta-D-arabinofuranosylcytosine on apoptosis and differentiation in human monocytic leukemia cells (U937) expressing a c-Jun dominant-negative mutant protein (TAM67). Cell Growth Differ 1996, 7, 603–613. [Google Scholar]
- Novoszel, P.; Drobits, B.; Holcmann, M.; Fernandes, C.S.; Tschismarov, R.; Derdak, S.; Decker, T.; Wagner, E.F.; Sibilia, M. The AP-1 transcription factors c-Jun and JunB are essential for CD8alpha conventional dendritic cell identity. Cell Death Differ 2021, 28, 2404–2420. [Google Scholar] [CrossRef]
- Comandante-Lou, N.; Baumann, D.G.; Fallahi-Sichani, M. AP-1 transcription factor network explains diverse patterns of cellular plasticity in melanoma cells. Cell Rep 2022, 40, 111147. [Google Scholar] [CrossRef] [PubMed]
- Chai, Y.C.; Mieyal, J.J. Glutathione and Glutaredoxin-Key Players in Cellular Redox Homeostasis and Signaling. Antioxidants (Basel) 2023, 12. [Google Scholar] [CrossRef] [PubMed]
- Di Giacomo, C.; Malfa, G.A.; Tomasello, B.; Bianchi, S.; Acquaviva, R. Natural Compounds and Glutathione: Beyond Mere Antioxidants. Antioxidants (Basel) 2023, 12. [Google Scholar] [CrossRef]
- Franco, R.; Cidlowski, J.A. Apoptosis and glutathione: beyond an antioxidant. Cell Death Differ 2009, 16, 1303–1314. [Google Scholar] [CrossRef] [PubMed]
- Fraternale, A.; Brundu, S.; Magnani, M. Glutathione and glutathione derivatives in immunotherapy. Biol Chem 2017, 398, 261–275. [Google Scholar] [CrossRef] [PubMed]
- Esposito, F.; Agosti, V.; Morrone, G.; Morra, F.; Cuomo, C.; Russo, T.; Venuta, S.; Cimino, F. Inhibition of the differentiation of human myeloid cell lines by redox changes induced through glutathione depletion. Biochem J 1994, 301 Pt 3, 649–653. [Google Scholar] [CrossRef]
- Lian, G.; Gnanaprakasam, J.R.; Wang, T.; Wu, R.; Chen, X.; Liu, L.; Shen, Y.; Yang, M.; Yang, J.; Chen, Y.; et al. Glutathione de novo synthesis but not recycling process coordinates with glutamine catabolism to control redox homeostasis and directs murine T cell differentiation. Elife 2018, 7. [Google Scholar] [CrossRef] [PubMed]
- Kim, H.J.; Barajas, B.; Chan, R.C.; Nel, A.E. Glutathione depletion inhibits dendritic cell maturation and delayed-type hypersensitivity: implications for systemic disease and immunosenescence. J Allergy Clin Immunol 2007, 119, 1225–1233. [Google Scholar] [CrossRef]
- Kim, J.M.; Kim, H.; Kwon, S.B.; Lee, S.Y.; Chung, S.C.; Jeong, D.W.; Min, B.M. Intracellular glutathione status regulates mouse bone marrow monocyte-derived macrophage differentiation and phagocytic activity. Biochem Biophys Res Commun 2004, 325, 101–108. [Google Scholar] [CrossRef] [PubMed]
- Ardite, E.; Barbera, J.A.; Roca, J.; Fernandez-Checa, J.C. Glutathione depletion impairs myogenic differentiation of murine skeletal muscle C2C12 cells through sustained NF-kappaB activation. Am J Pathol 2004, 165, 719–728. [Google Scholar] [CrossRef] [PubMed]
- Chung, J.H.; Kim, Y.S.; Noh, K.; Lee, Y.M.; Chang, S.W.; Kim, E.C. Deferoxamine promotes osteoblastic differentiation in human periodontal ligament cells via the nuclear factor erythroid 2-related factor-mediated antioxidant signaling pathway. J Periodontal Res 2014, 49, 563–573. [Google Scholar] [CrossRef] [PubMed]
- Fujita, H.; Ochi, M.; Ono, M.; Aoyama, E.; Ogino, T.; Kondo, Y.; Ohuchi, H. Glutathione accelerates osteoclast differentiation and inflammatory bone destruction. Free Radic Res 2019, 53, 226–236. [Google Scholar] [CrossRef]
- Satoh, T.; Kosaka, K.; Itoh, K.; Kobayashi, A.; Yamamoto, M.; Shimojo, Y.; Kitajima, C.; Cui, J.; Kamins, J.; Okamoto, S.; et al. Carnosic acid, a catechol-type electrophilic compound, protects neurons both in vitro and in vivo through activation of the Keap1/Nrf2 pathway via S-alkylation of targeted cysteines on Keap1. J Neurochem 2008, 104, 1116–1131. [Google Scholar] [CrossRef] [PubMed]
- Dinkova-Kostova, A.T.; Kostov, R.V.; Canning, P. Keap1, the cysteine-based mammalian intracellular sensor for electrophiles and oxidants. Arch Biochem Biophys 2017, 617, 84–93. [Google Scholar] [CrossRef] [PubMed]
- Satoh, T.; Lipton, S. Recent advances in understanding NRF2 as a druggable target: development of pro-electrophilic and non-covalent NRF2 activators to overcome systemic side effects of electrophilic drugs like dimethyl fumarate. F1000Res 2017, 6, 2138. [Google Scholar] [CrossRef] [PubMed]
- Wang, X.; Dawod, A.; Nachliely, M.; Harrison, J.S.; Danilenko, M.; Studzinski, G.P. Differentiation agents increase the potential AraC therapy of AML by reactivating cell death pathways without enhancing ROS generation. J Cell Physiol 2020, 235, 573–586. [Google Scholar] [CrossRef] [PubMed]
- Wang, L.; Leite de Oliveira, R.; Huijberts, S.; Bosdriesz, E.; Pencheva, N.; Brunen, D.; Bosma, A.; Song, J.Y.; Zevenhoven, J.; Los-de Vries, G.T.; et al. An Acquired Vulnerability of Drug-Resistant Melanoma with Therapeutic Potential. Cell 2018, 173, 1413–1425. [Google Scholar] [CrossRef] [PubMed]
- Wang, S.Z.; Poore, B.; Alt, J.; Price, A.; Allen, S.J.; Hanaford, A.R.; Kaur, H.; Orr, B.A.; Slusher, B.S.; Eberhart, C.G.; et al. Unbiased Metabolic Profiling Predicts Sensitivity of High MYC-Expressing Atypical Teratoid/Rhabdoid Tumors to Glutamine Inhibition with 6-Diazo-5-Oxo-L-Norleucine. Clin Cancer Res 2019, 25, 5925–5936. [Google Scholar] [CrossRef] [PubMed]
- Tsai-Turton, M.; Luong, B.T.; Tan, Y.; Luderer, U. Cyclophosphamide-induced apoptosis in COV434 human granulosa cells involves oxidative stress and glutathione depletion. Toxicol Sci 2007, 98, 216–230. [Google Scholar] [CrossRef] [PubMed]
- Zhang, L.; Tew, K.D. Reductive stress in cancer. Adv Cancer Res 2021, 152, 383–413. [Google Scholar] [CrossRef] [PubMed]
- Korge, P.; Calmettes, G.; Weiss, J.N. Increased reactive oxygen species production during reductive stress: The roles of mitochondrial glutathione and thioredoxin reductases. Biochim Biophys Acta 2015, 1847, 514–525. [Google Scholar] [CrossRef] [PubMed]
- Maity, S.; Rajkumar, A.; Matai, L.; Bhat, A.; Ghosh, A.; Agam, G.; Kaur, S.; Bhatt, N.R.; Mukhopadhyay, A.; Sengupta, S.; et al. Oxidative Homeostasis Regulates the Response to Reductive Endoplasmic Reticulum Stress through Translation Control. Cell Rep 2016, 16, 851–865. [Google Scholar] [CrossRef] [PubMed]
- Bejjani, F.; Evanno, E.; Zibara, K.; Piechaczyk, M.; Jariel-Encontre, I. The AP-1 transcriptional complex: Local switch or remote command? Biochim Biophys Acta Rev Cancer 2019, 1872, 11–23. [Google Scholar] [CrossRef] [PubMed]
- Shaulian, E. AP-1—The Jun proteins: Oncogenes or tumor suppressors in disguise? Cell Signal 2010, 22, 894–899. [Google Scholar] [CrossRef] [PubMed]
- Marinho, H.S.; Real, C.; Cyrne, L.; Soares, H.; Antunes, F. Hydrogen peroxide sensing, signaling and regulation of transcription factors. Redox Biol 2014, 2, 535–562. [Google Scholar] [CrossRef] [PubMed]
- Hayes, J.D.; Dinkova-Kostova, A.T.; Tew, K.D. Oxidative Stress in Cancer. Cancer Cell 2020, 38, 167–197. [Google Scholar] [CrossRef]
- DeNicola, G.M.; Karreth, F.A.; Humpton, T.J.; Gopinathan, A.; Wei, C.; Frese, K.; Mangal, D.; Yu, K.H.; Yeo, C.J.; Calhoun, E.S.; et al. Oncogene-induced Nrf2 transcription promotes ROS detoxification and tumorigenesis. Nature 2011, 475, 106–109. [Google Scholar] [CrossRef] [PubMed]
- Venugopal, R.; Jaiswal, A.K. Nrf2 and Nrf1 in association with Jun proteins regulate antioxidant response element-mediated expression and coordinated induction of genes encoding detoxifying enzymes. Oncogene 1998, 17, 3145–3156. [Google Scholar] [CrossRef] [PubMed]
- Gesser, B.; Rasmussen, M.K.; Raaby, L.; Rosada, C.; Johansen, C.; Kjellerup, R.B.; Kragballe, K.; Iversen, L. Dimethylfumarate inhibits MIF-induced proliferation of keratinocytes by inhibiting MSK1 and RSK1 activation and by inducing nuclear p-c-Jun (S63) and p-p53 (S15) expression. Inflamm Res 2011, 60, 643–653. [Google Scholar] [CrossRef] [PubMed]
- Grzegorzewska, A.P.; Seta, F.; Han, R.; Czajka, C.A.; Makino, K.; Stawski, L.; Isenberg, J.S.; Browning, J.L.; Trojanowska, M. Dimethyl Fumarate ameliorates pulmonary arterial hypertension and lung fibrosis by targeting multiple pathways. Sci Rep 2017, 7, 41605. [Google Scholar] [CrossRef] [PubMed]
- Chen, F.; Wang, Q.; Wang, X.; Studzinski, G.P. Up-regulation of Egr1 by 1,25-dihydroxyvitamin D3 contributes to increased expression of p35 activator of cyclin-dependent kinase 5 and consequent onset of the terminal phase of HL60 cell differentiation. Cancer Res 2004, 64, 5425–5433. [Google Scholar] [CrossRef] [PubMed]
- Gocek, E.; Kielbinski, M.; Wylob, P.; Kutner, A.; Marcinkowska, E. Side-chain modified vitamin D analogs induce rapid accumulation of VDR in the cell nuclei proportionately to their differentiation-inducing potential. Steroids 2008, 73, 1359–1366. [Google Scholar] [CrossRef] [PubMed]
- Gocek, E.; Marchwicka, A.; Baurska, H.; Chrobak, A.; Marcinkowska, E. Opposite regulation of vitamin D receptor by ATRA in AML cells susceptible and resistant to vitamin D-induced differentiation. J Steroid Biochem Mol Biol 2012, 132, 220–226. [Google Scholar] [CrossRef] [PubMed]
- van den Bemd, G.C.; Pols, H.A.; Birkenhager, J.C.; van Leeuwen, J.P. Conformational change and enhanced stabilization of the vitamin D receptor by the 1,25-dihydroxyvitamin D3 analog KH1060. Proc Natl Acad Sci U S A 1996, 93, 10685–10690. [Google Scholar] [CrossRef] [PubMed]
- Jaaskelainen, T.; Ryhanen, S.; Mahonen, A.; DeLuca, H.F.; Maenpaa, P.H. Mechanism of action of superactive vitamin D analogs through regulated receptor degradation. J Cell Biochem 2000, 76, 548–558. [Google Scholar] [CrossRef]
- Li, X.Y.; Boudjelal, M.; Xiao, J.H.; Peng, Z.H.; Asuru, A.; Kang, S.; Fisher, G.J.; Voorhees, J.J. 1,25-Dihydroxyvitamin D3 increases nuclear vitamin D3 receptors by blocking ubiquitin/proteasome-mediated degradation in human skin. Mol Endocrinol 1999, 13, 1686–1694. [Google Scholar] [CrossRef]
- Kongsbak, M.; von Essen, M.R.; Boding, L.; Levring, T.B.; Schjerling, P.; Lauritsen, J.P.; Woetmann, A.; Odum, N.; Bonefeld, C.M.; Geisler, C. Vitamin D up-regulates the vitamin D receptor by protecting it from proteasomal degradation in human CD4+ T cells. PLoS One 2014, 9, e96695. [Google Scholar] [CrossRef] [PubMed]
- Peleg, S.; Nguyen, C.V. The importance of nuclear import in protection of the vitamin D receptor from polyubiquitination and proteasome-mediated degradation. J Cell Biochem 2010, 110, 926–934. [Google Scholar] [CrossRef]
- Yang, R.; Zhang, J.; Li, J.; Qin, R.; Chen, J.; Wang, R.; Goltzman, D.; Miao, D. Inhibition of Nrf2 degradation alleviates age-related osteoporosis induced by 1,25-Dihydroxyvitamin D deficiency. Free Radic Biol Med 2022, 178, 246–261. [Google Scholar] [CrossRef]
- Golonko, A.; Pienkowski, T.; Swislocka, R.; Lazny, R.; Roszko, M.; Lewandowski, W. Another look at phenolic compounds in cancer therapy the effect of polyphenols on ubiquitin-proteasome system. Eur J Med Chem 2019, 167, 291–311. [Google Scholar] [CrossRef]
- Andreani, C.; Bartolacci, C.; Wijnant, K.; Crinelli, R.; Bianchi, M.; Magnani, M.; Hysi, A.; Iezzi, M.; Amici, A.; Marchini, C. Resveratrol fuels HER2 and ERalpha-positive breast cancer behaving as proteasome inhibitor. Aging (Albany NY) 2017, 9, 508–523. [Google Scholar] [CrossRef]
- Sato, A.; Okada, M.; Shibuya, K.; Watanabe, E.; Seino, S.; Suzuki, K.; Narita, Y.; Shibui, S.; Kayama, T.; Kitanaka, C. Resveratrol promotes proteasome-dependent degradation of Nanog via p53 activation and induces differentiation of glioma stem cells. Stem Cell Res 2013, 11, 601–610. [Google Scholar] [CrossRef] [PubMed]
- Hasima, N.; Aggarwal, B.B. Targeting proteasomal pathways by dietary curcumin for cancer prevention and treatment. Curr Med Chem 2014, 21, 1583–1594. [Google Scholar] [CrossRef] [PubMed]
- Petiwala, S.M.; Li, G.; Bosland, M.C.; Lantvit, D.D.; Petukhov, P.A.; Johnson, J.J. Carnosic acid promotes degradation of the androgen receptor and is regulated by the unfolded protein response pathway in vitro and in vivo. Carcinogenesis 2016, 37, 827–838. [Google Scholar] [CrossRef]
- Cortese, K.; Daga, A.; Monticone, M.; Tavella, S.; Stefanelli, A.; Aiello, C.; Bisio, A.; Bellese, G.; Castagnola, P. Carnosic acid induces proteasomal degradation of Cyclin B1, RB and SOX2 along with cell growth arrest and apoptosis in GBM cells. Phytomedicine 2016, 23, 679–685. [Google Scholar] [CrossRef]
- Alsamri, H.; Alneyadi, A.; Muhammad, K.; Ayoub, M.A.; Eid, A.; Iratni, R. Carnosol Induces p38-Mediated ER Stress Response and Autophagy in Human Breast Cancer Cells. Front Oncol 2022, 12, 911615. [Google Scholar] [CrossRef]
- Alsamri, H.; Hasasna, H.E.; Baby, B.; Alneyadi, A.; Dhaheri, Y.A.; Ayoub, M.A.; Eid, A.H.; Vijayan, R.; Iratni, R. Carnosol Is a Novel Inhibitor of p300 Acetyltransferase in Breast Cancer. Front Oncol 2021, 11, 664403. [Google Scholar] [CrossRef] [PubMed]
- Valdes, A.; Garcia-Canas, V.; Artemenko, K.A.; Simo, C.; Bergquist, J.; Cifuentes, A. Nano-liquid Chromatography-orbitrap MS-based Quantitative Proteomics Reveals Differences Between the Mechanisms of Action of Carnosic Acid and Carnosol in Colon Cancer Cells. Mol Cell Proteomics 2017, 16, 8–22. [Google Scholar] [CrossRef] [PubMed]
- Toyama, T.; Looney, A.P.; Baker, B.M.; Stawski, L.; Haines, P.; Simms, R.; Szymaniak, A.D.; Varelas, X.; Trojanowska, M. Therapeutic Targeting of TAZ and YAP by Dimethyl Fumarate in Systemic Sclerosis Fibrosis. J Invest Dermatol 2018, 138, 78–88. [Google Scholar] [CrossRef]
- Booth, L.; Cruickshanks, N.; Tavallai, S.; Roberts, J.L.; Peery, M.; Poklepovic, A.; Dent, P. Regulation of dimethyl-fumarate toxicity by proteasome inhibitors. Cancer Biol Ther 2014, 15, 1646–1657. [Google Scholar] [CrossRef]
- Valesky, E.M.; Hrgovic, I.; Doll, M.; Wang, X.F.; Pinter, A.; Kleemann, J.; Kaufmann, R.; Kippenberger, S.; Meissner, M. Dimethylfumarate effectively inhibits lymphangiogenesis via p21 induction and G1 cell cycle arrest. Exp Dermatol 2016, 25, 200–205. [Google Scholar] [CrossRef]
- Rushworth, S.A.; Zaitseva, L.; Murray, M.Y.; Shah, N.M.; Bowles, K.M.; MacEwan, D.J. The high Nrf2 expression in human acute myeloid leukemia is driven by NF-kappaB and underlies its chemo-resistance. Blood 2012, 120, 5188–5198. [Google Scholar] [CrossRef] [PubMed]
- Ganan-Gomez, I.; Wei, Y.; Yang, H.; Boyano-Adanez, M.C.; Garcia-Manero, G. Oncogenic functions of the transcription factor Nrf2. Free Radic Biol Med 2013, 65, 750–764. [Google Scholar] [CrossRef] [PubMed]
- Kannan, S.; Irwin, M.E.; Herbrich, S.M.; Cheng, T.; Patterson, L.L.; Aitken, M.J.L.; Bhalla, K.; You, M.J.; Konopleva, M.; Zweidler-McKay, P.A.; et al. Targeting the NRF2/HO-1 Antioxidant Pathway in FLT3-ITD-Positive AML Enhances Therapy Efficacy. Antioxidants (Basel) 2022, 11. [Google Scholar] [CrossRef] [PubMed]


Disclaimer/Publisher’s Note: The statements, opinions and data contained in all publications are solely those of the individual author(s) and contributor(s) and not of MDPI and/or the editor(s). MDPI and/or the editor(s) disclaim responsibility for any injury to people or property resulting from any ideas, methods, instructions or products referred to in the content. |
© 2023 by the authors. Licensee MDPI, Basel, Switzerland. This article is an open access article distributed under the terms and conditions of the Creative Commons Attribution (CC BY) license (http://creativecommons.org/licenses/by/4.0/).


