1. Introduction
Following the enhanced oil and gas exploration, only some of the dominant hydrocarbon transport paths of sand have the presence of oil and gas. This fact is not only related to the development of traps but also affected by the effectiveness of the dominant transport paths of sand. Valid hydrocarbon accumulations are found near the area only when the dominant transport paths of sand communicate with the oil source fault that migrates hydrocarbon from the expulsion area of source rock. Therefore, diagnosis of the distribution of the effective dominant hydrocarbon transport paths of sand is crucial to correctly understanding the oil and gas distribution pattern and guiding oil and gas exploration in the slope area of oil and gas bearing basins.
Generally speaking, previous research on the effectiveness of the dominant hydrocarbon transport path of the sand body can be summarized as two aspects: one is to study the effectiveness of the transporting property of the sand body itself by identifying the paleotectonic ridges at the top interface of the stratigraphic layer containing the sand body and the contiguously distributed area of sand body [
1,
2,
3,
4,
5,
6,
7]. The area of connected sand bodies overlapping with the paleotectonic ridge is believed to be the effective transport path of the sand carrier. Another aspect is to judge the effective dominant hydrocarbon transport paths of sand bodies based on the spatial relationship between the studied paths and the upward migration of oil and gas from the depressions [
8,
9,
10,
11,
12,
13,
14]. Only the dominant hydrocarbon transport path of the sand bodies connected to or near the vertical transport area of oil and gas in the depressions is the effective dominant path for oil and gas migration by sand bodies. Although these researches have played an important role in correctly understanding the hydrocarbon distribution pattern in the slope areas of hydrocarbon-bearing basins and guiding their exploration, they fail to quantitatively study the effectiveness of the dominant hydrocarbon transport paths of sand bodies. A quantitative study on the distance between the dominant hydrocarbon transport paths of sand bodies and oil source faults can help more accurately recognize the effective dominant hydrocarbon transport paths of sand bodies and their distribution, which will improve the oil and gas exploration in the slope area of hydrocarbon-bearing basins. Therefore, it is of great significance to research the prediction method of the distribution of the effective dominant hydrocarbon transport path of the sand body.
2. Geological Setting
This area is in the E
1sl Formation in the southern area of the Qikou depression of Bohai Bay Basin (Qinan)
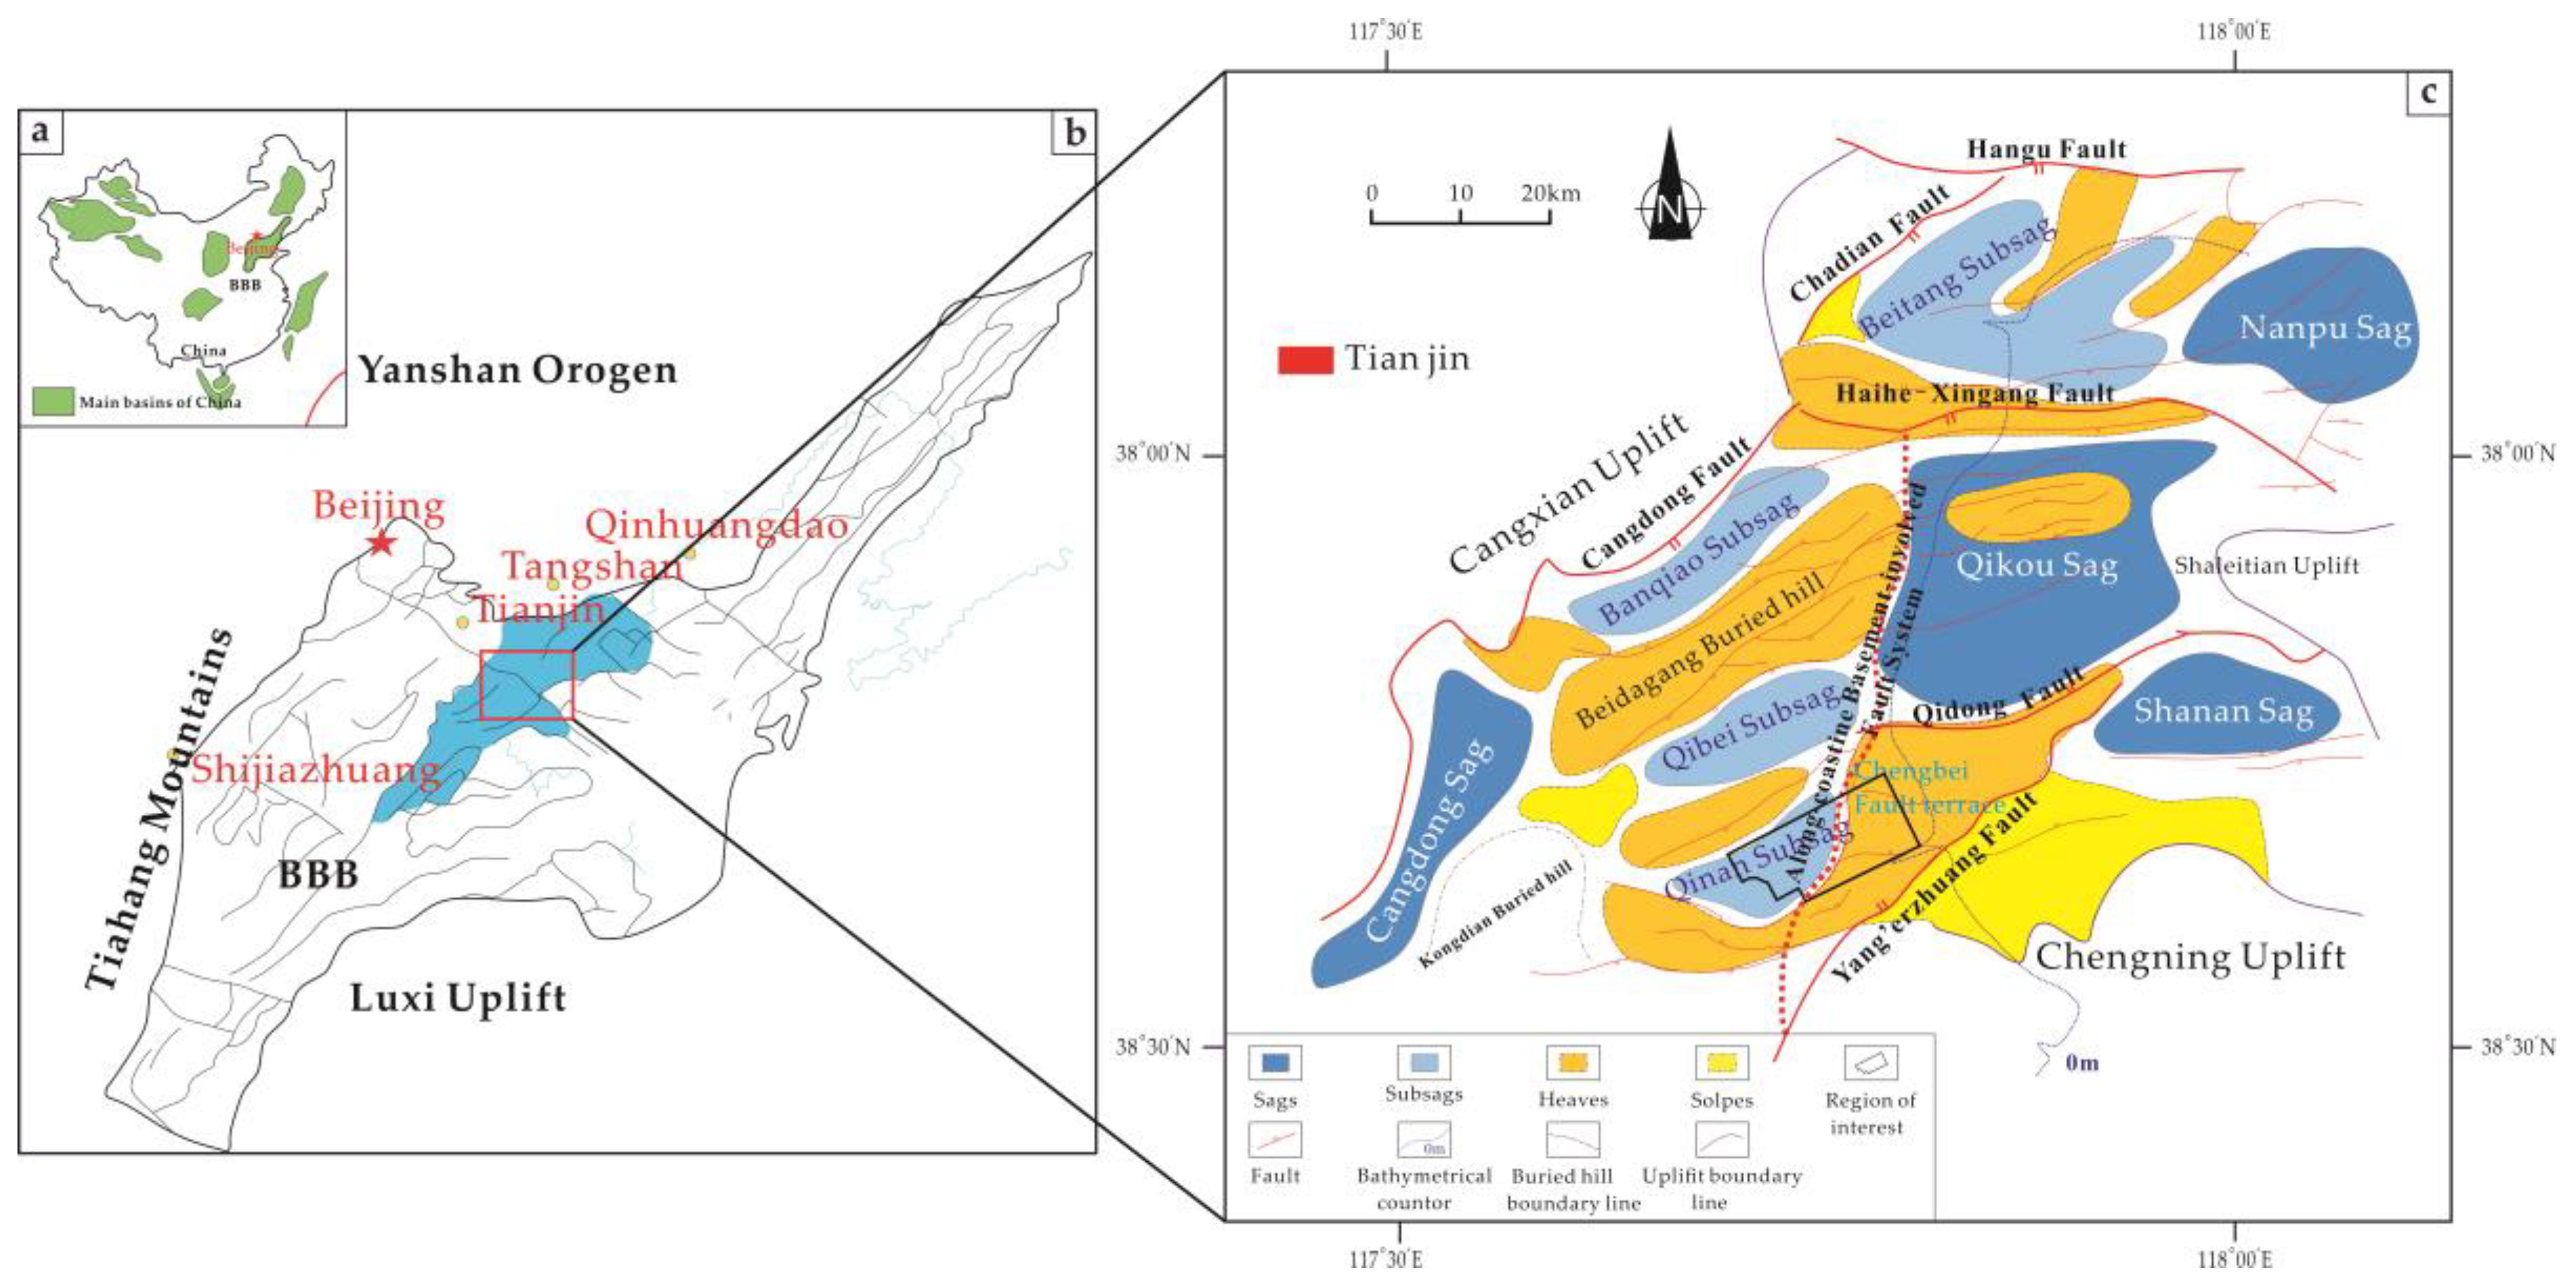
,Qinan area is located in the southern part of the Qikou depression, consisting of two tectonic zones: the Qinan slope area and the Chengbei fault slope area (
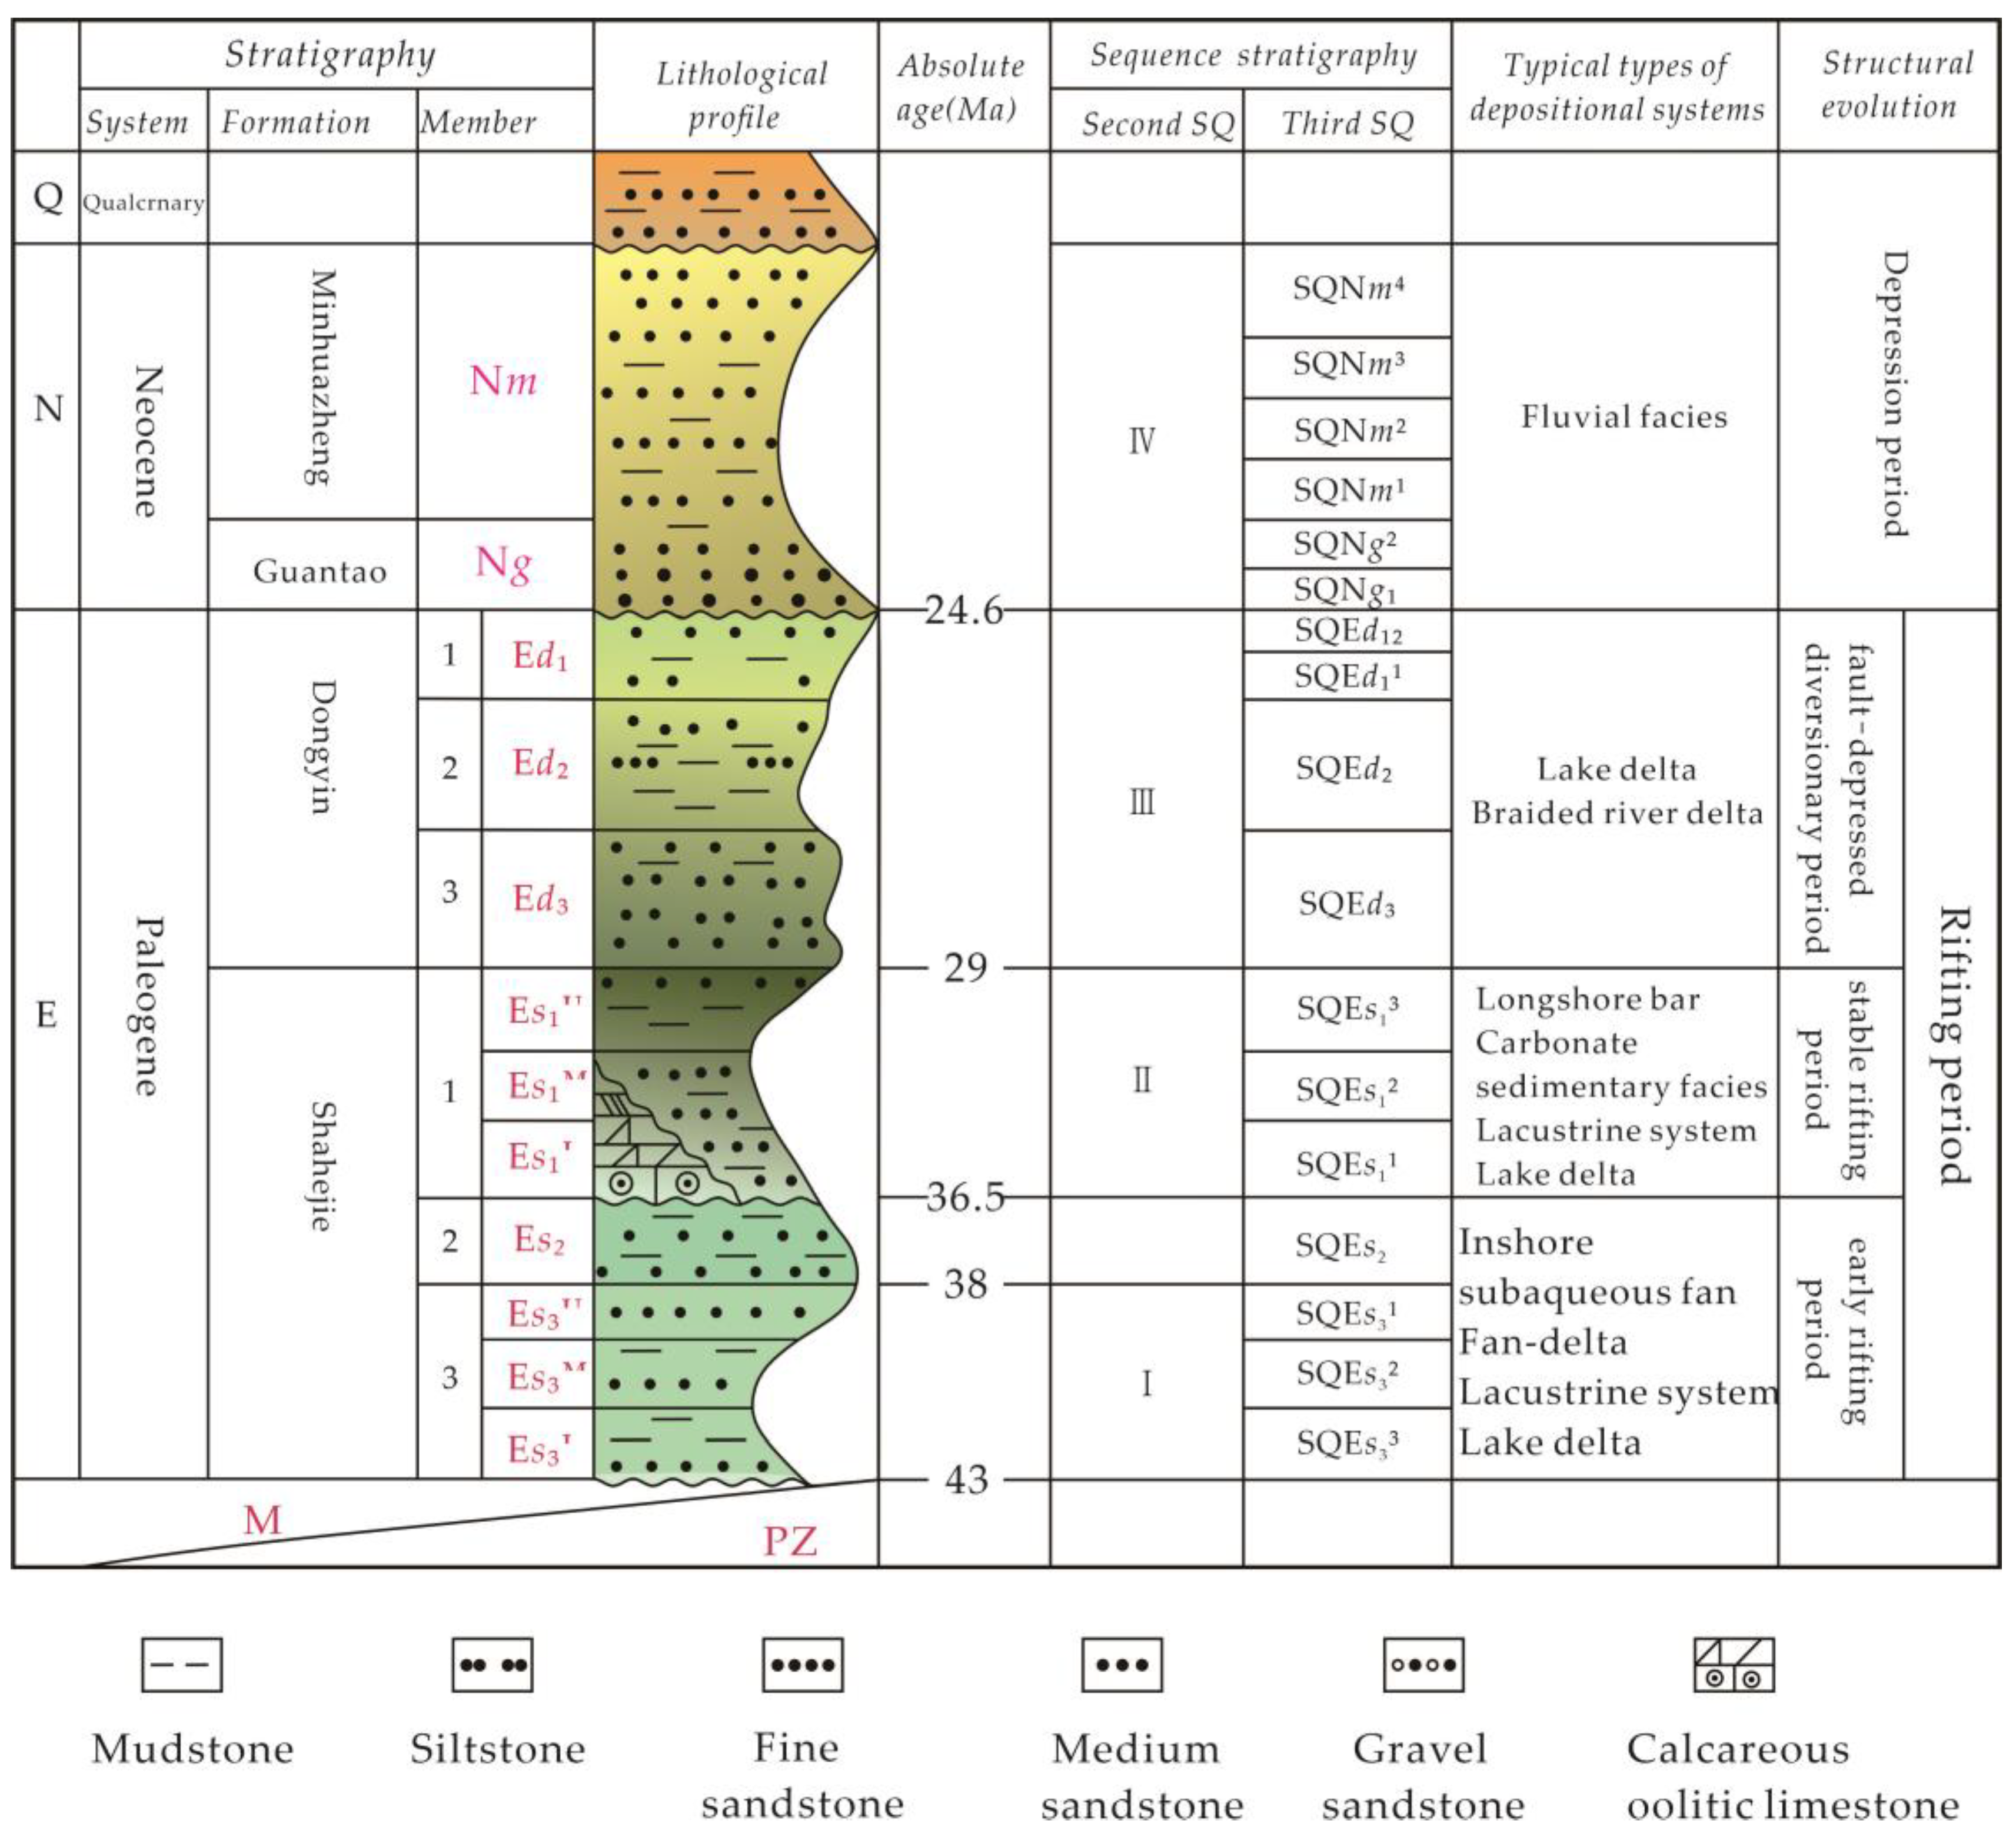
Figure 1). The study area is the leading oil-producing area of the entire depression with intensified hydrocarbon exploration. Based on previous classifications, the stratigraphic units in the study area include the Paleoproterozoic, the Neoproterozoic, and a small amount of the Quaternary from the bottom to the top (
Figure 2). The Paleoproterozoic can be further divided into the Kongdian, Shahejie, and Dongying Formations, and the Neoproterozoic is divided into the Guantao Formation and the Minghuazhen Formation. A significant amount of oil and gas in the study area is distributed in the Shahejie Formation, especially in the formation’s lower first member. Only a tiny amount of oil and gas is discovered in the Dongying and Guantao Formations. The oil and gas are sourced from the source rock in the E
s3 Formation in the main northeastern depression of Qikou.
3. Methods
3.1. The Effective Dominant Paths of Sand Bodies Transporting Oil and Gas and Their Distribution
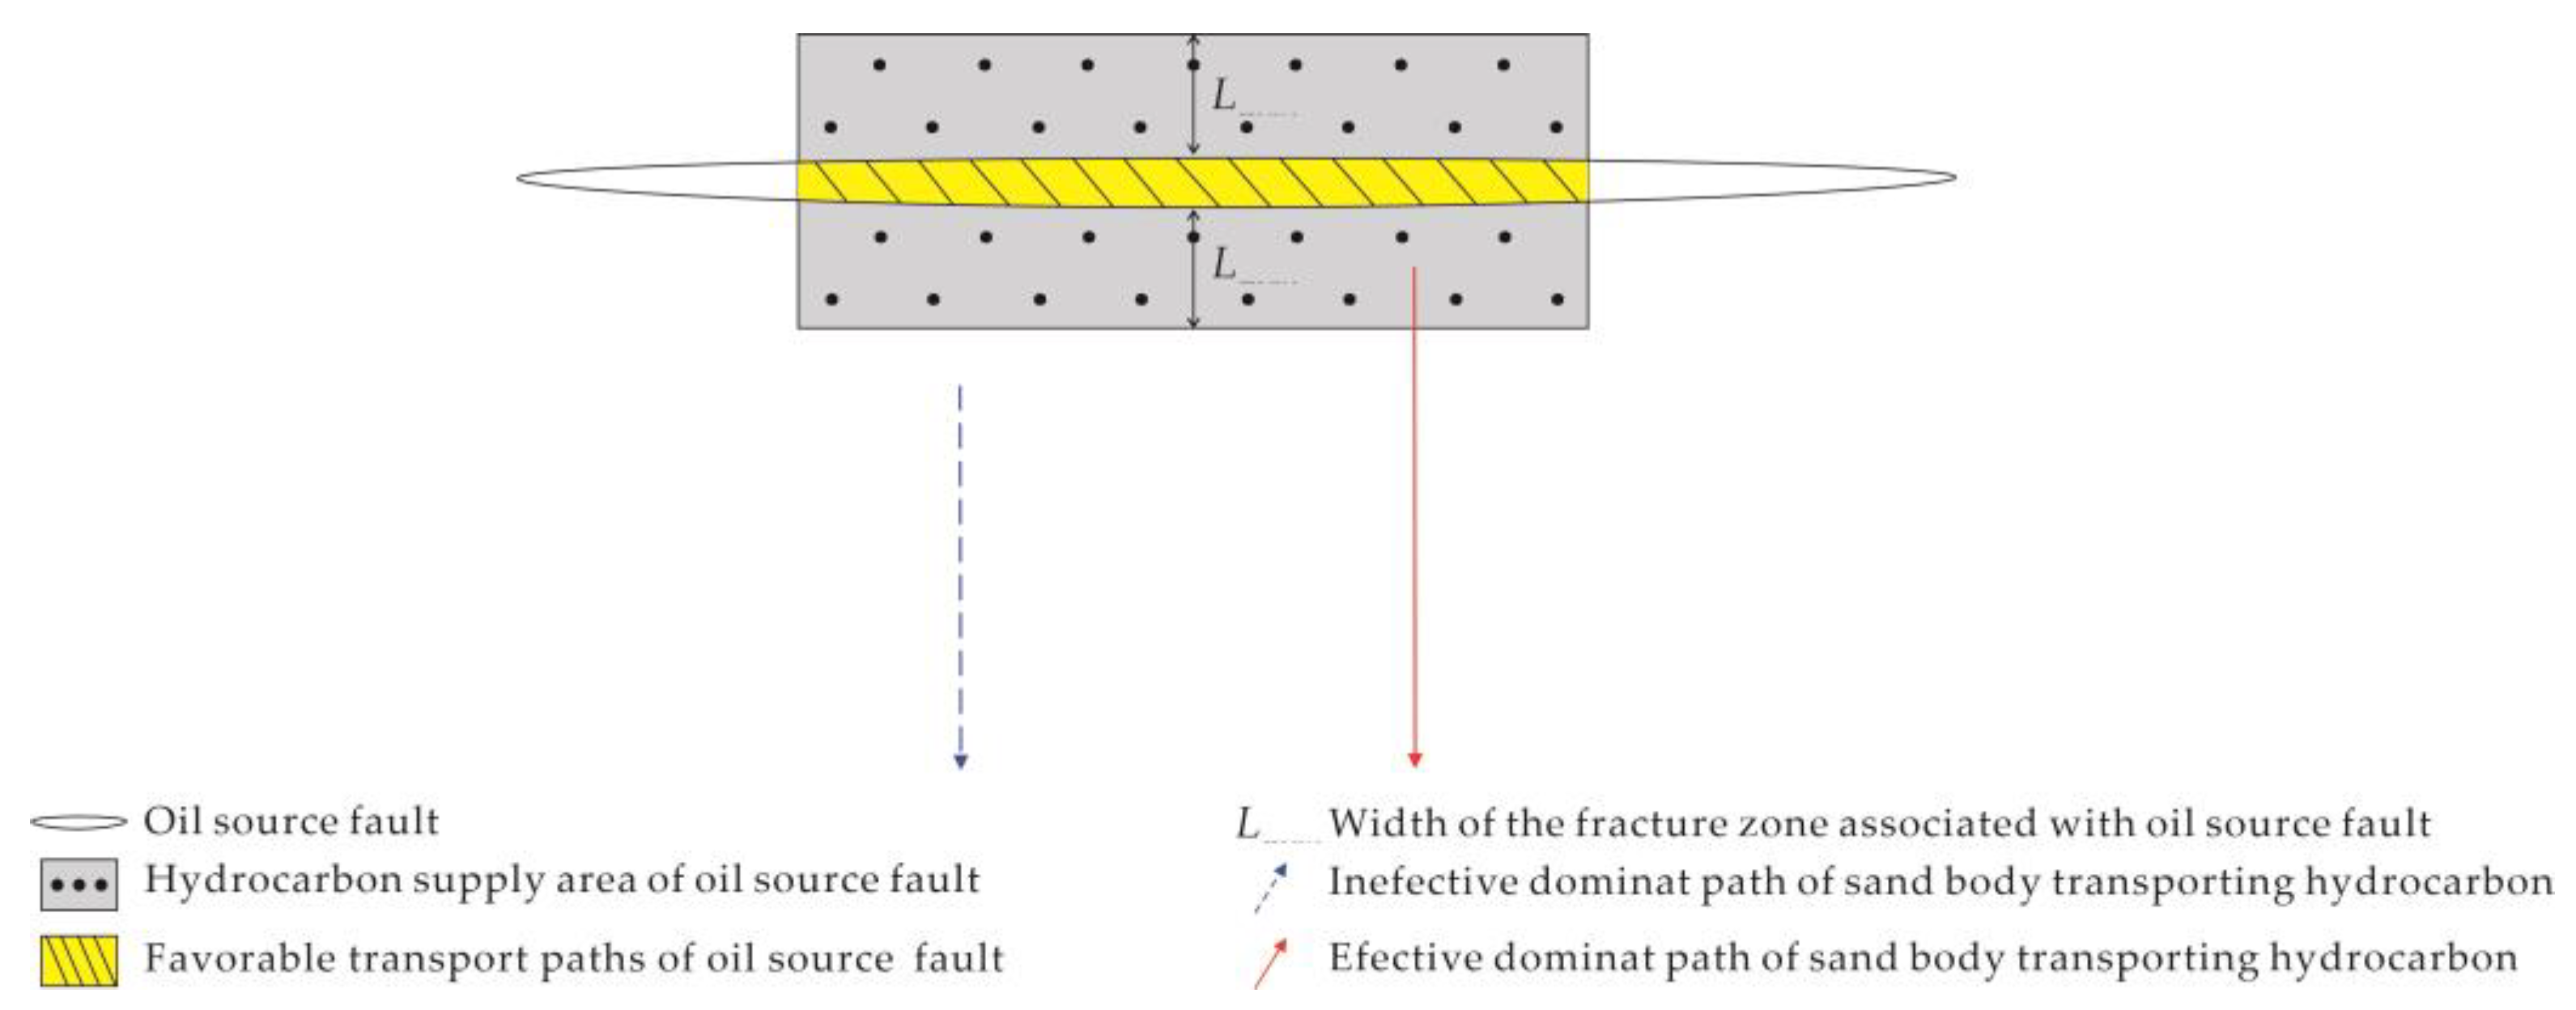
The effectiveness of the dominant paths of sand bodies transporting oil and gas is determined by the spatial relationship between the studied paths and the hydrocarbon supply area of the oil source faults. Only when they are spatially connected will the sand carrier catch the hydrocarbon from the depression and become the effective dominant path of the sand body transporting oil and gas, as shown in
Figure 3.
To conclude, the distribution of effective dominant paths of sand bodies transporting oil and gas should be those dominant transport paths of sand connected with the hydrocarbon supply area of the oil source fault.
3.2. The Prediction Method of the Distribution of the Effective Dominant Paths of Sand Body Transporting Oil and Gas
To predict the distribution of the effective dominant path of sand bodies transporting oil and gas, we first need to determine the distribution of the dominant hydrocarbon transport paths of sand bodies and the hydrocarbon supply area of oil source faults.
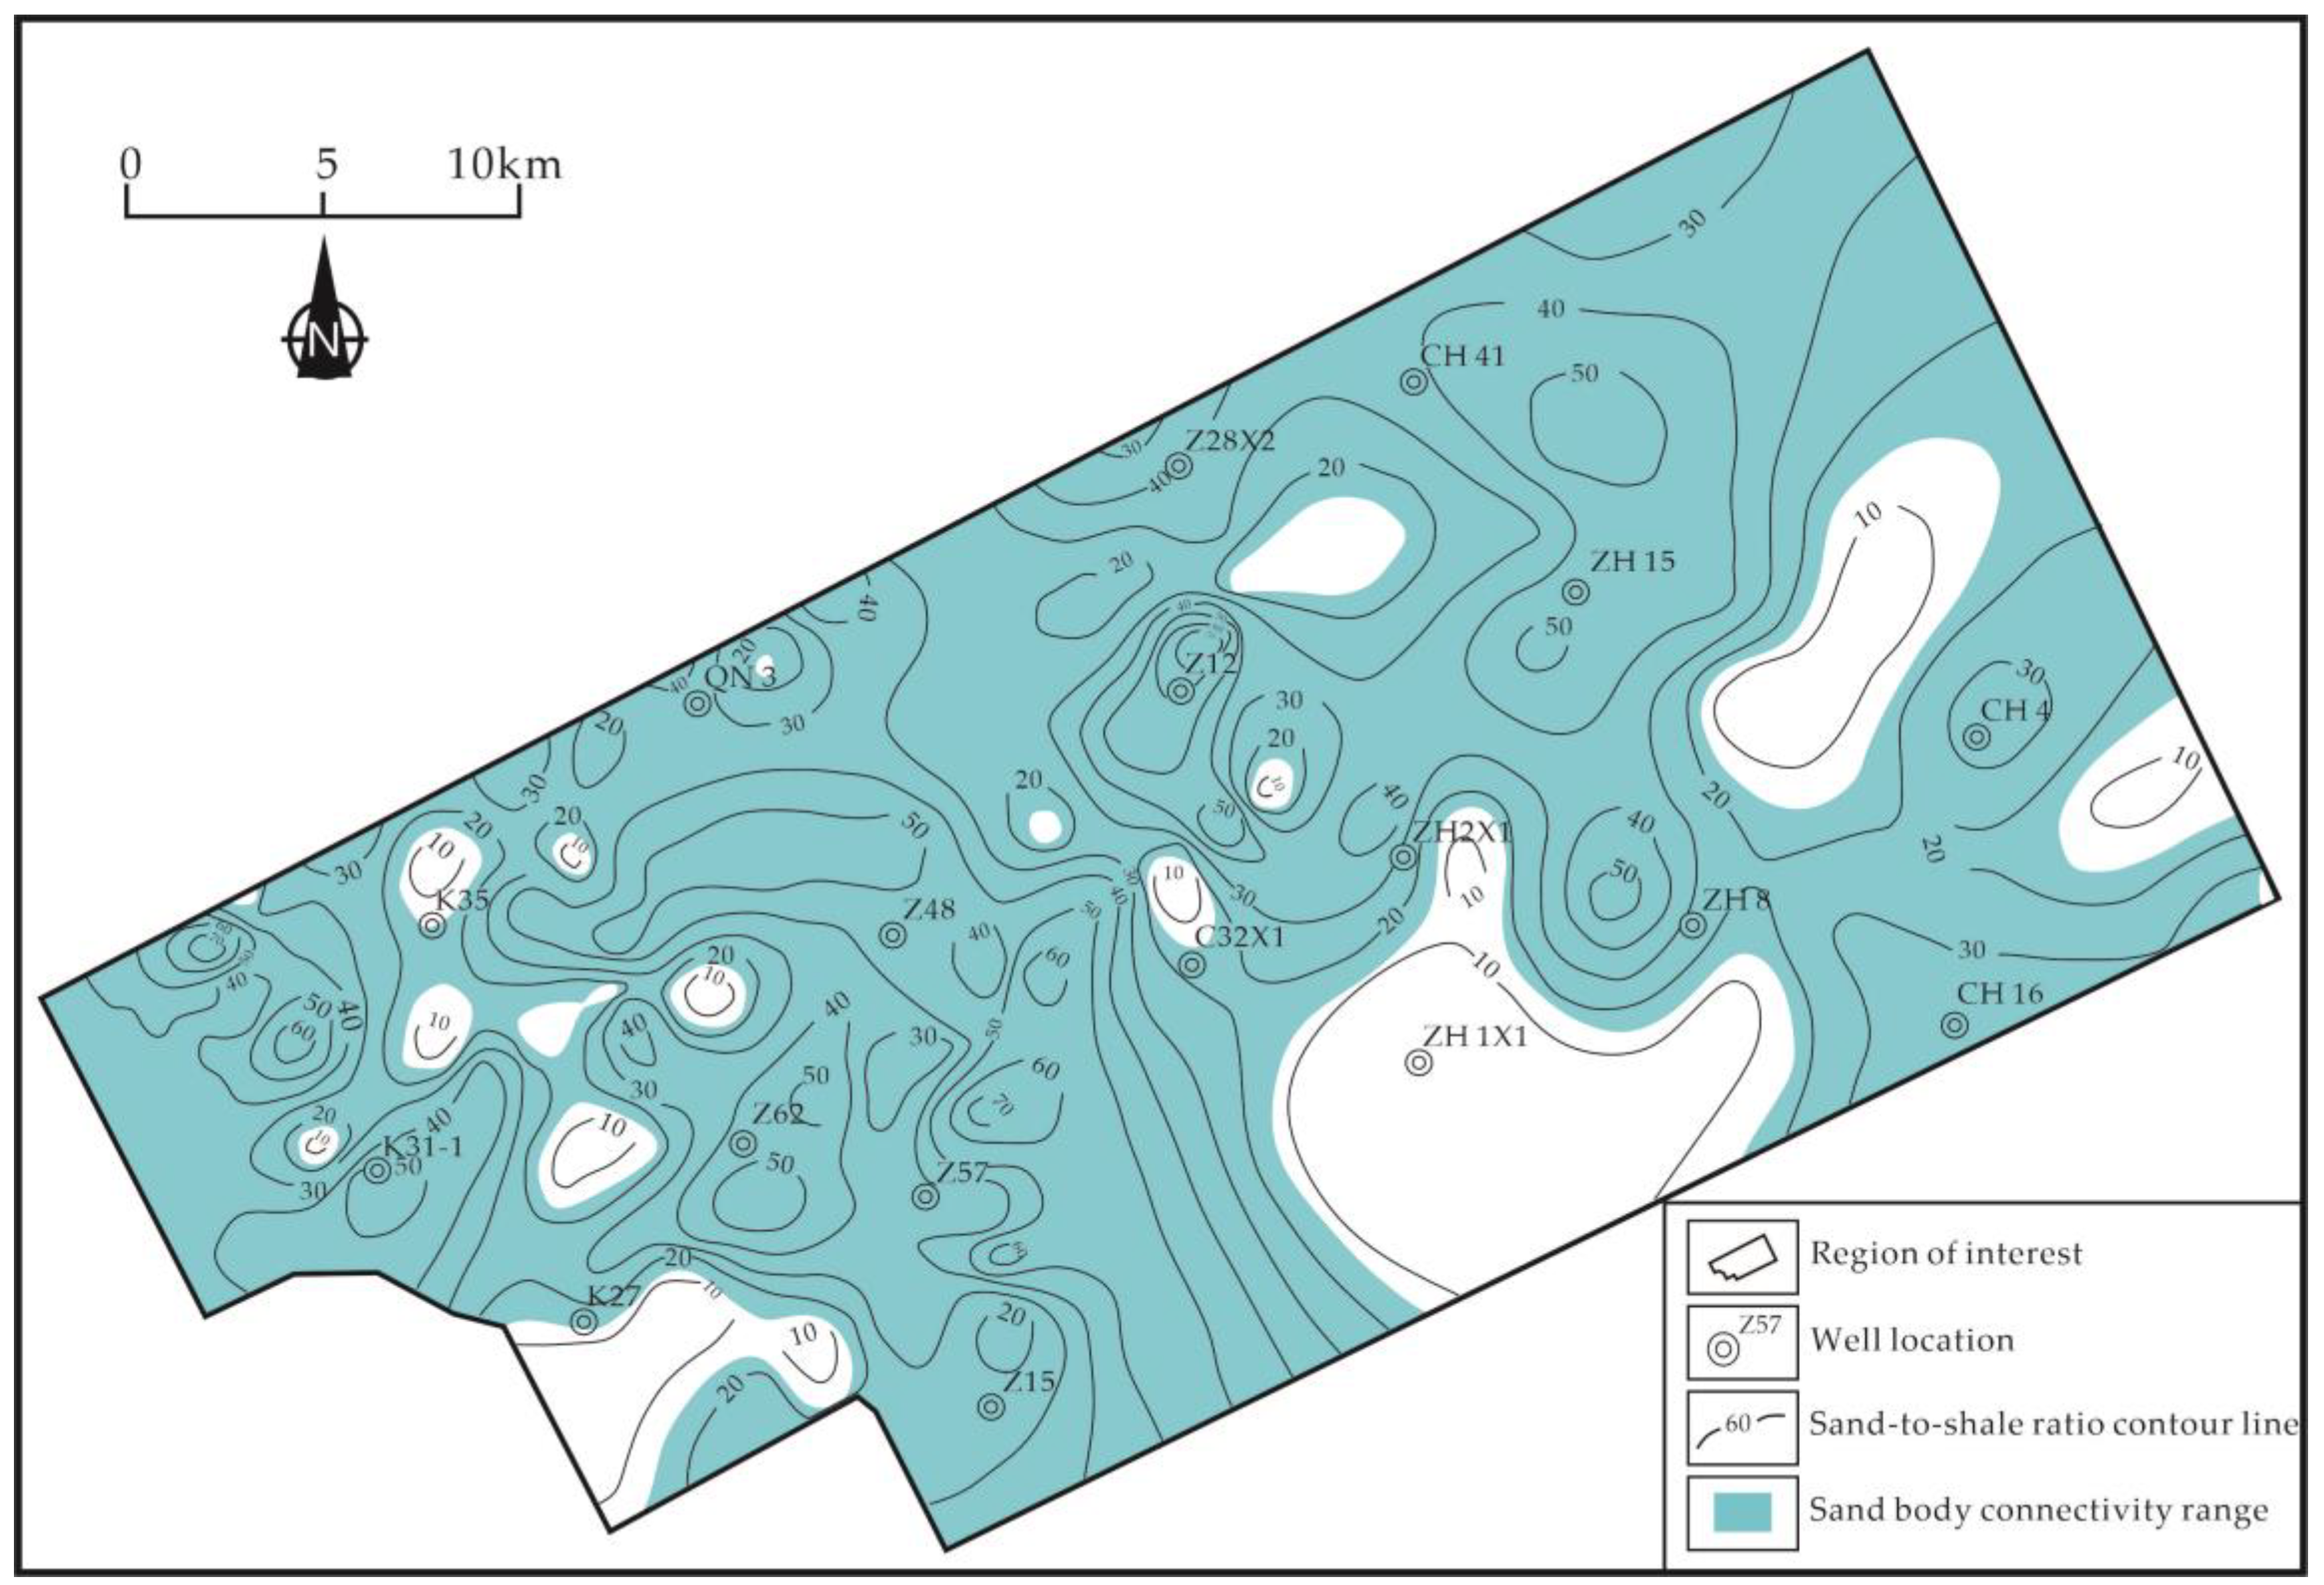
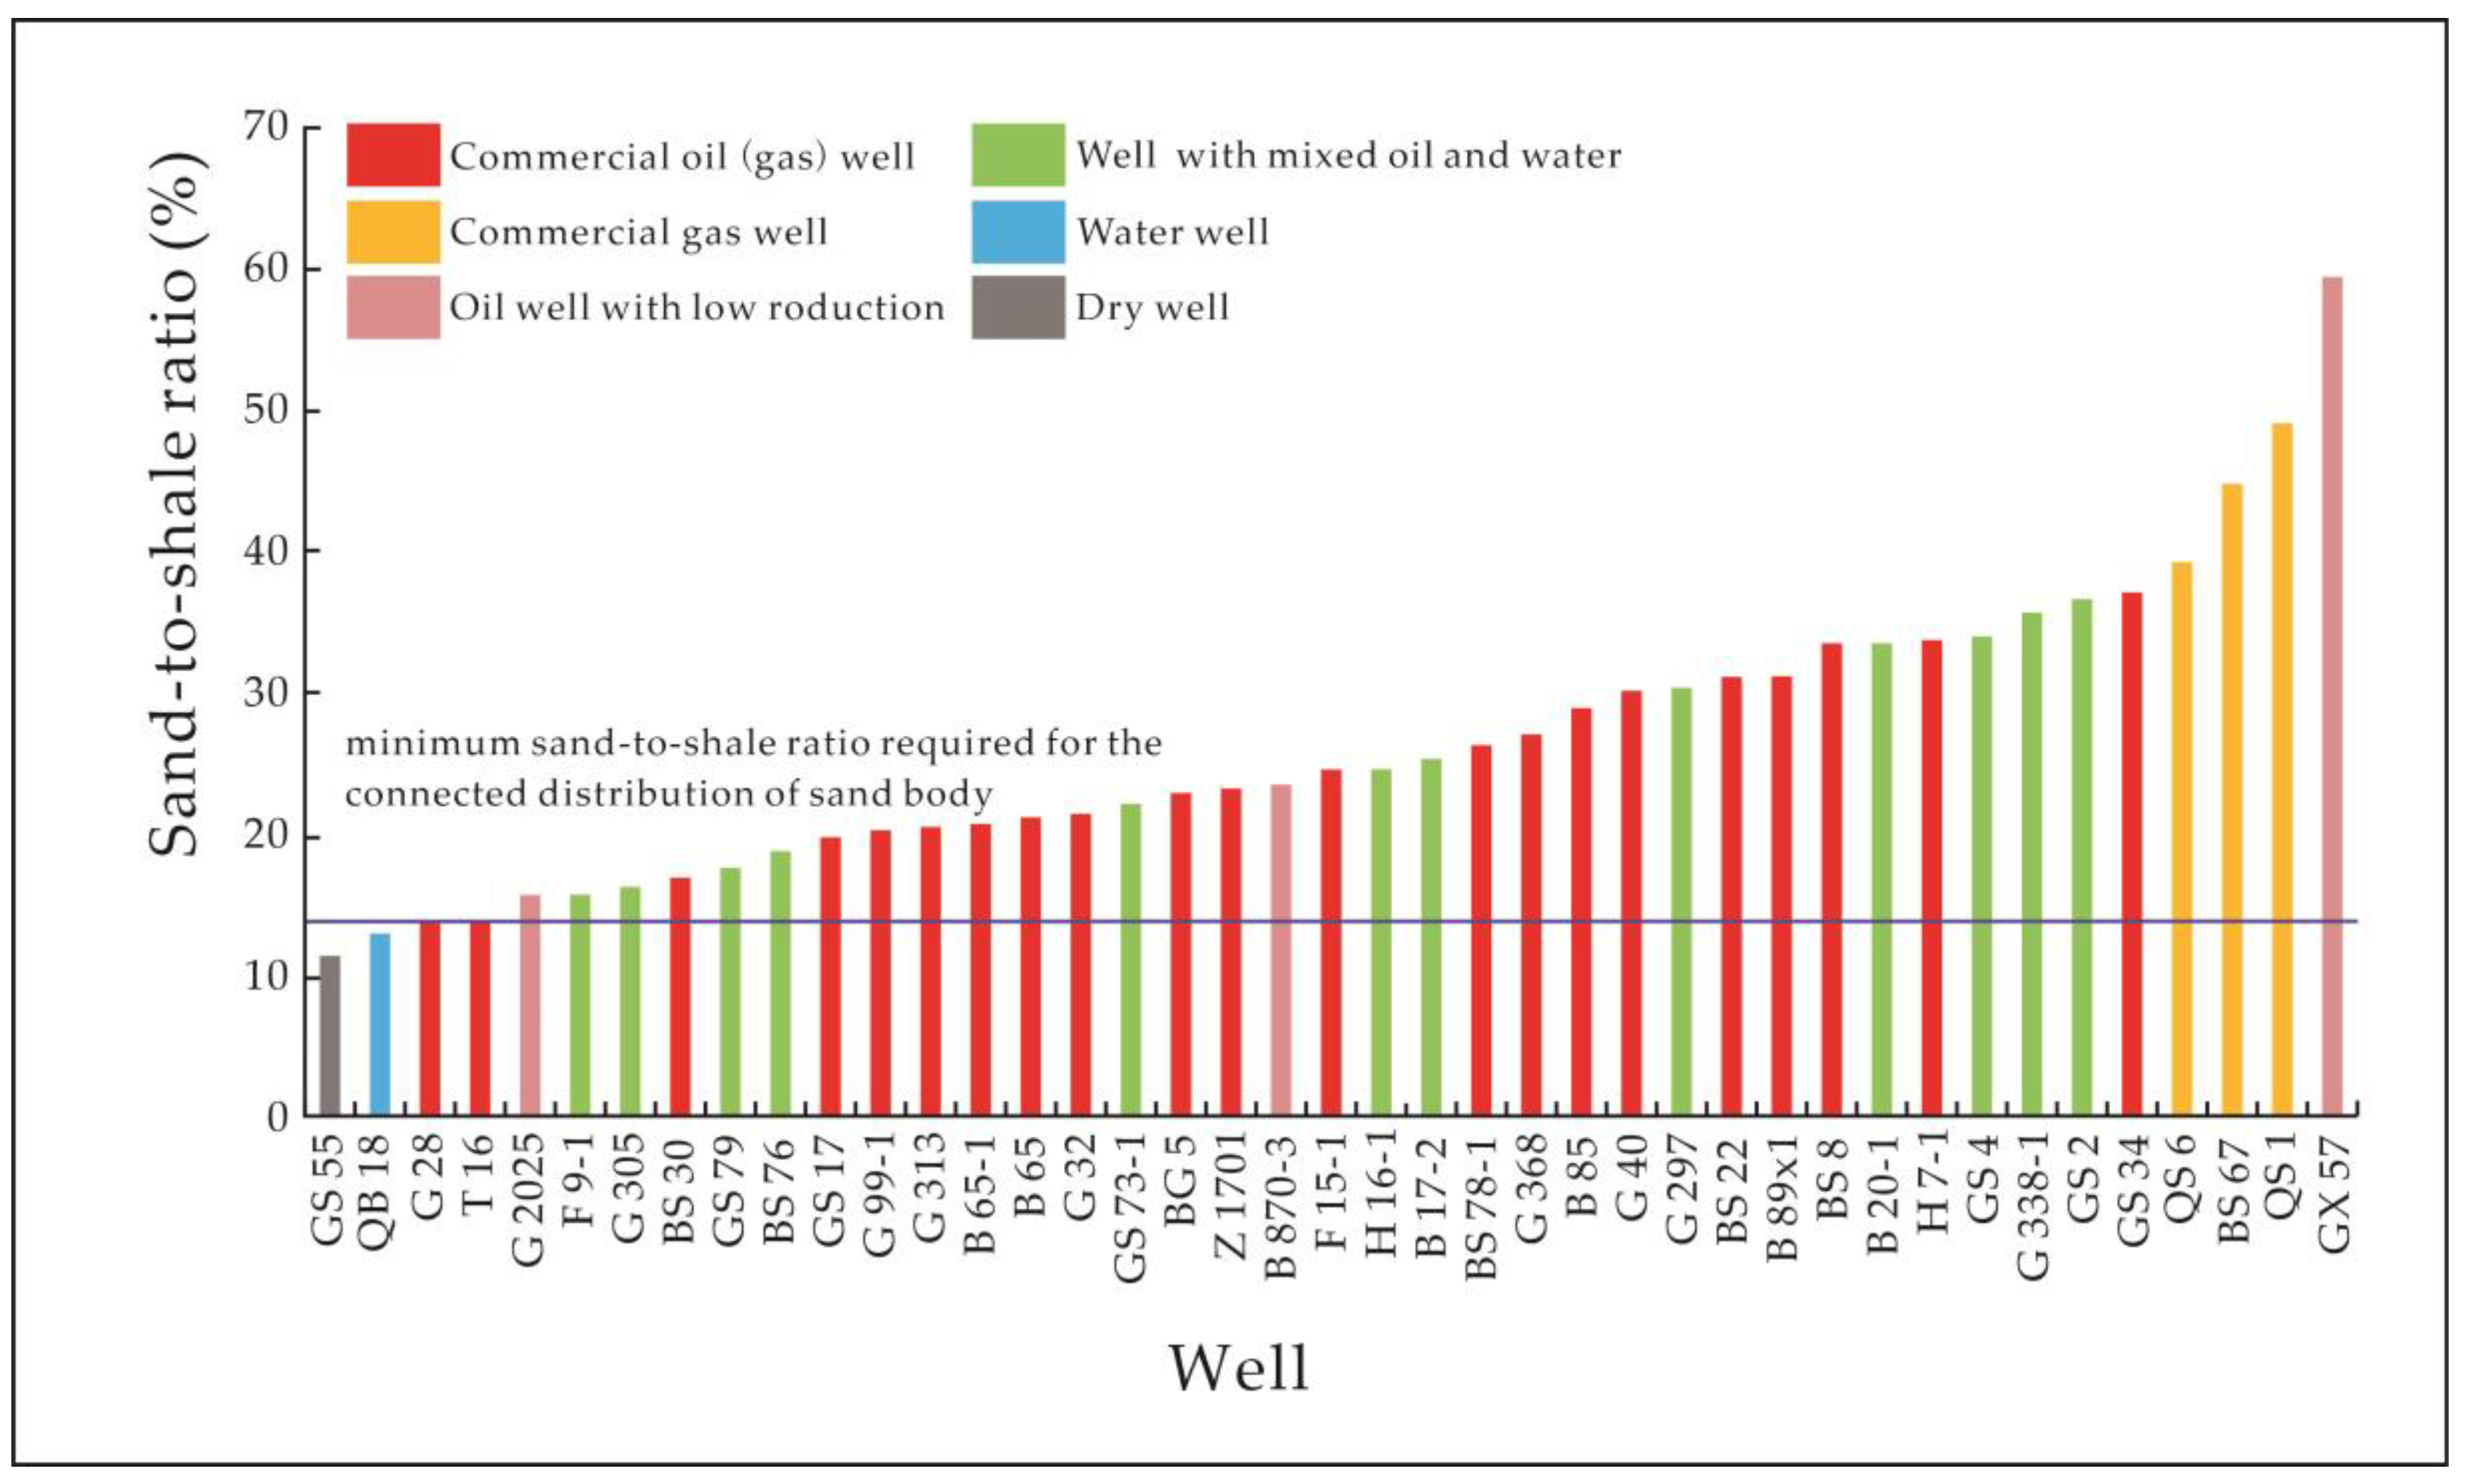
The distribution of connected sand bodies and the location of a paleotectonic ridge at the top interface of the stratigraphic layer where the sand bodies are located is a prerequisite for determining the effective dominant paths of sand bodies transporting oil and gas. The sand-to-shale ratio is often used to identify the connectivity of sand bodies. The sand-to-shale ratio of the stratigraphic layer containing sand bodies and its associated planar distribution map is often available using the drilling data. The minimum sand-to-shale ratio required for the sand bodies to communicate can be determined by adopting the method from the literature [
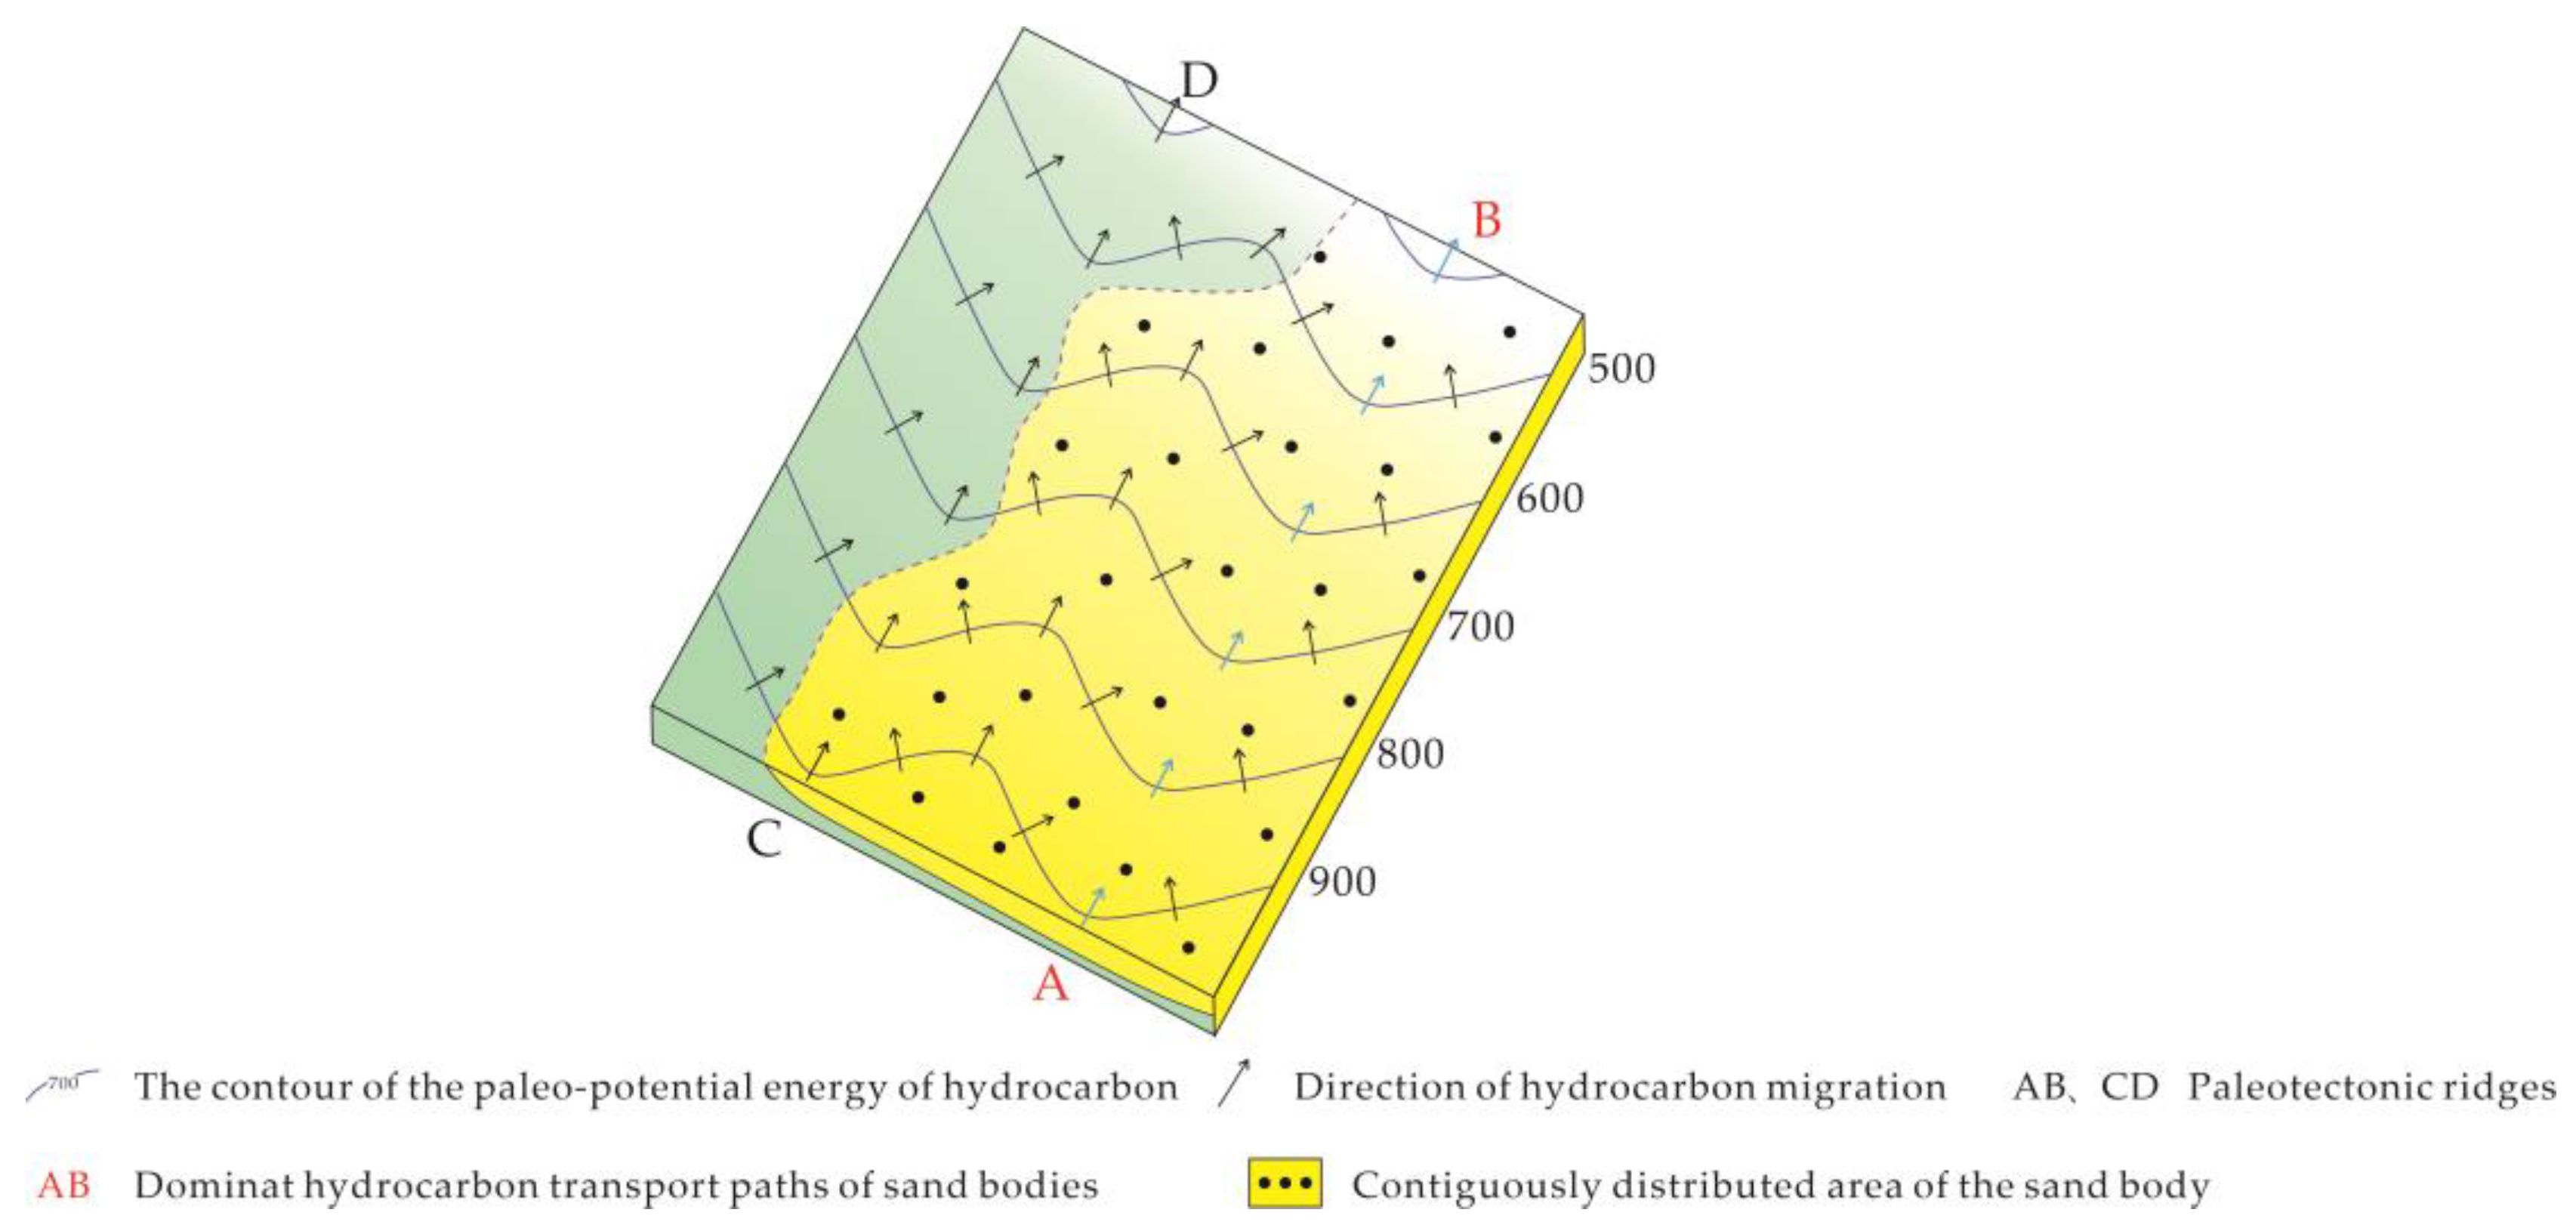
15]. We can identify the contiguously distributed area of the sand body in the study area by delineating the areas that are greater than or equal to it (
Figure 4).
The paleo-burial depth during the hydrocarbon accumulation period is recovered by the method from the literature [
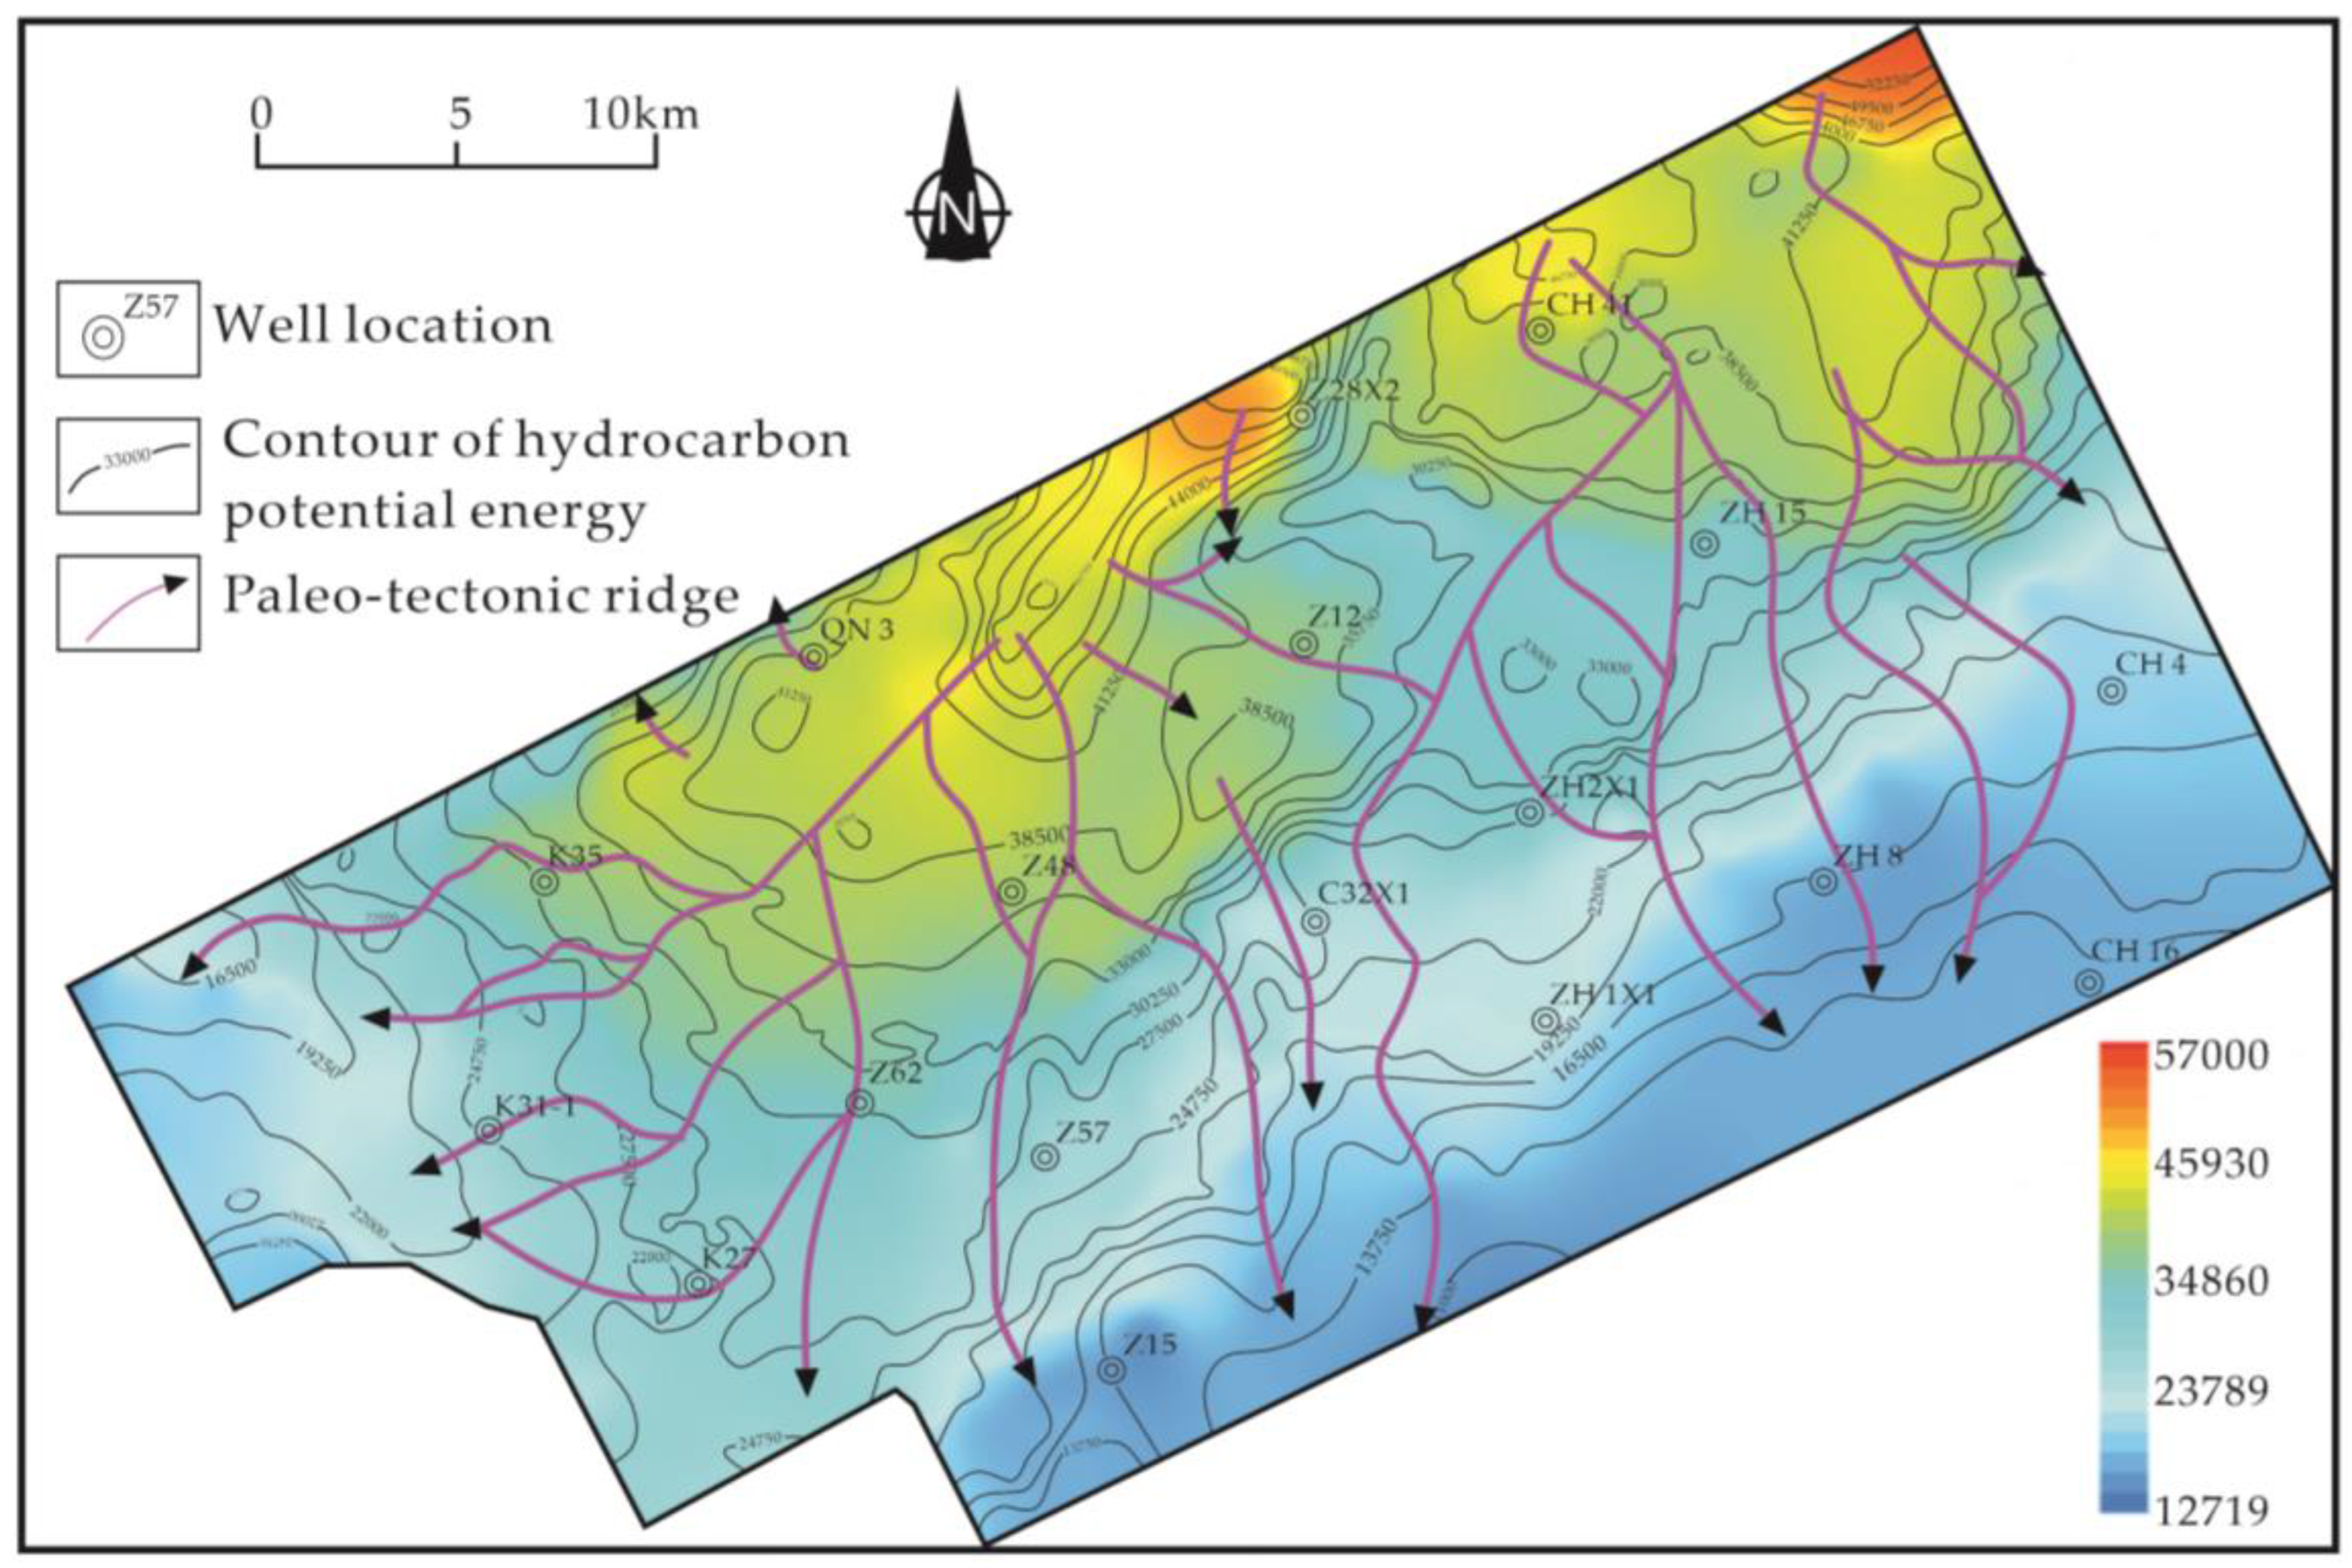
16]. Then the value of the paleo-potential energy of hydrocarbon is derived by equation 1. We can first get the present-day burial depth at the top interface of the stratigraphic layer where the sand body is located based on the 3D seismic data. Then the paleo-burial depth during the hydrocarbon accumulation period can be recovered by applying the method in the literature . Afterward, the value of the paleo-potential energy during the formation period of hydrocarbon accumulation is calculated by Equation 1. Finally, we can delineate the distribution of paleotectonic ridges at the top interface of the strata containing the sand bodies by identifying the normal convergence lines on the contour map of pale-potential energy, as shown in
Figure 5.
Where:
Φ-paleo hydrocarbon potential energy value, kJ;
Z-paleoburial depth, m;
P-fluid pressure, MPa (its magnitude is equal to
ρw Z, where
ρw is the density of formation water, g/cm
3);
ρ-hydrocarbon density, g/cm
3;
g-gravitational acceleration, m/s
2.
The dominant hydrocarbon transport paths of the sand body can be predicted by superimposing the distribution of the discovered zones with connected sand bodies and the distribution of paleotectonic ridges at the top interface of the strata containing the sand bodies, as illustrated in
Figure 5.
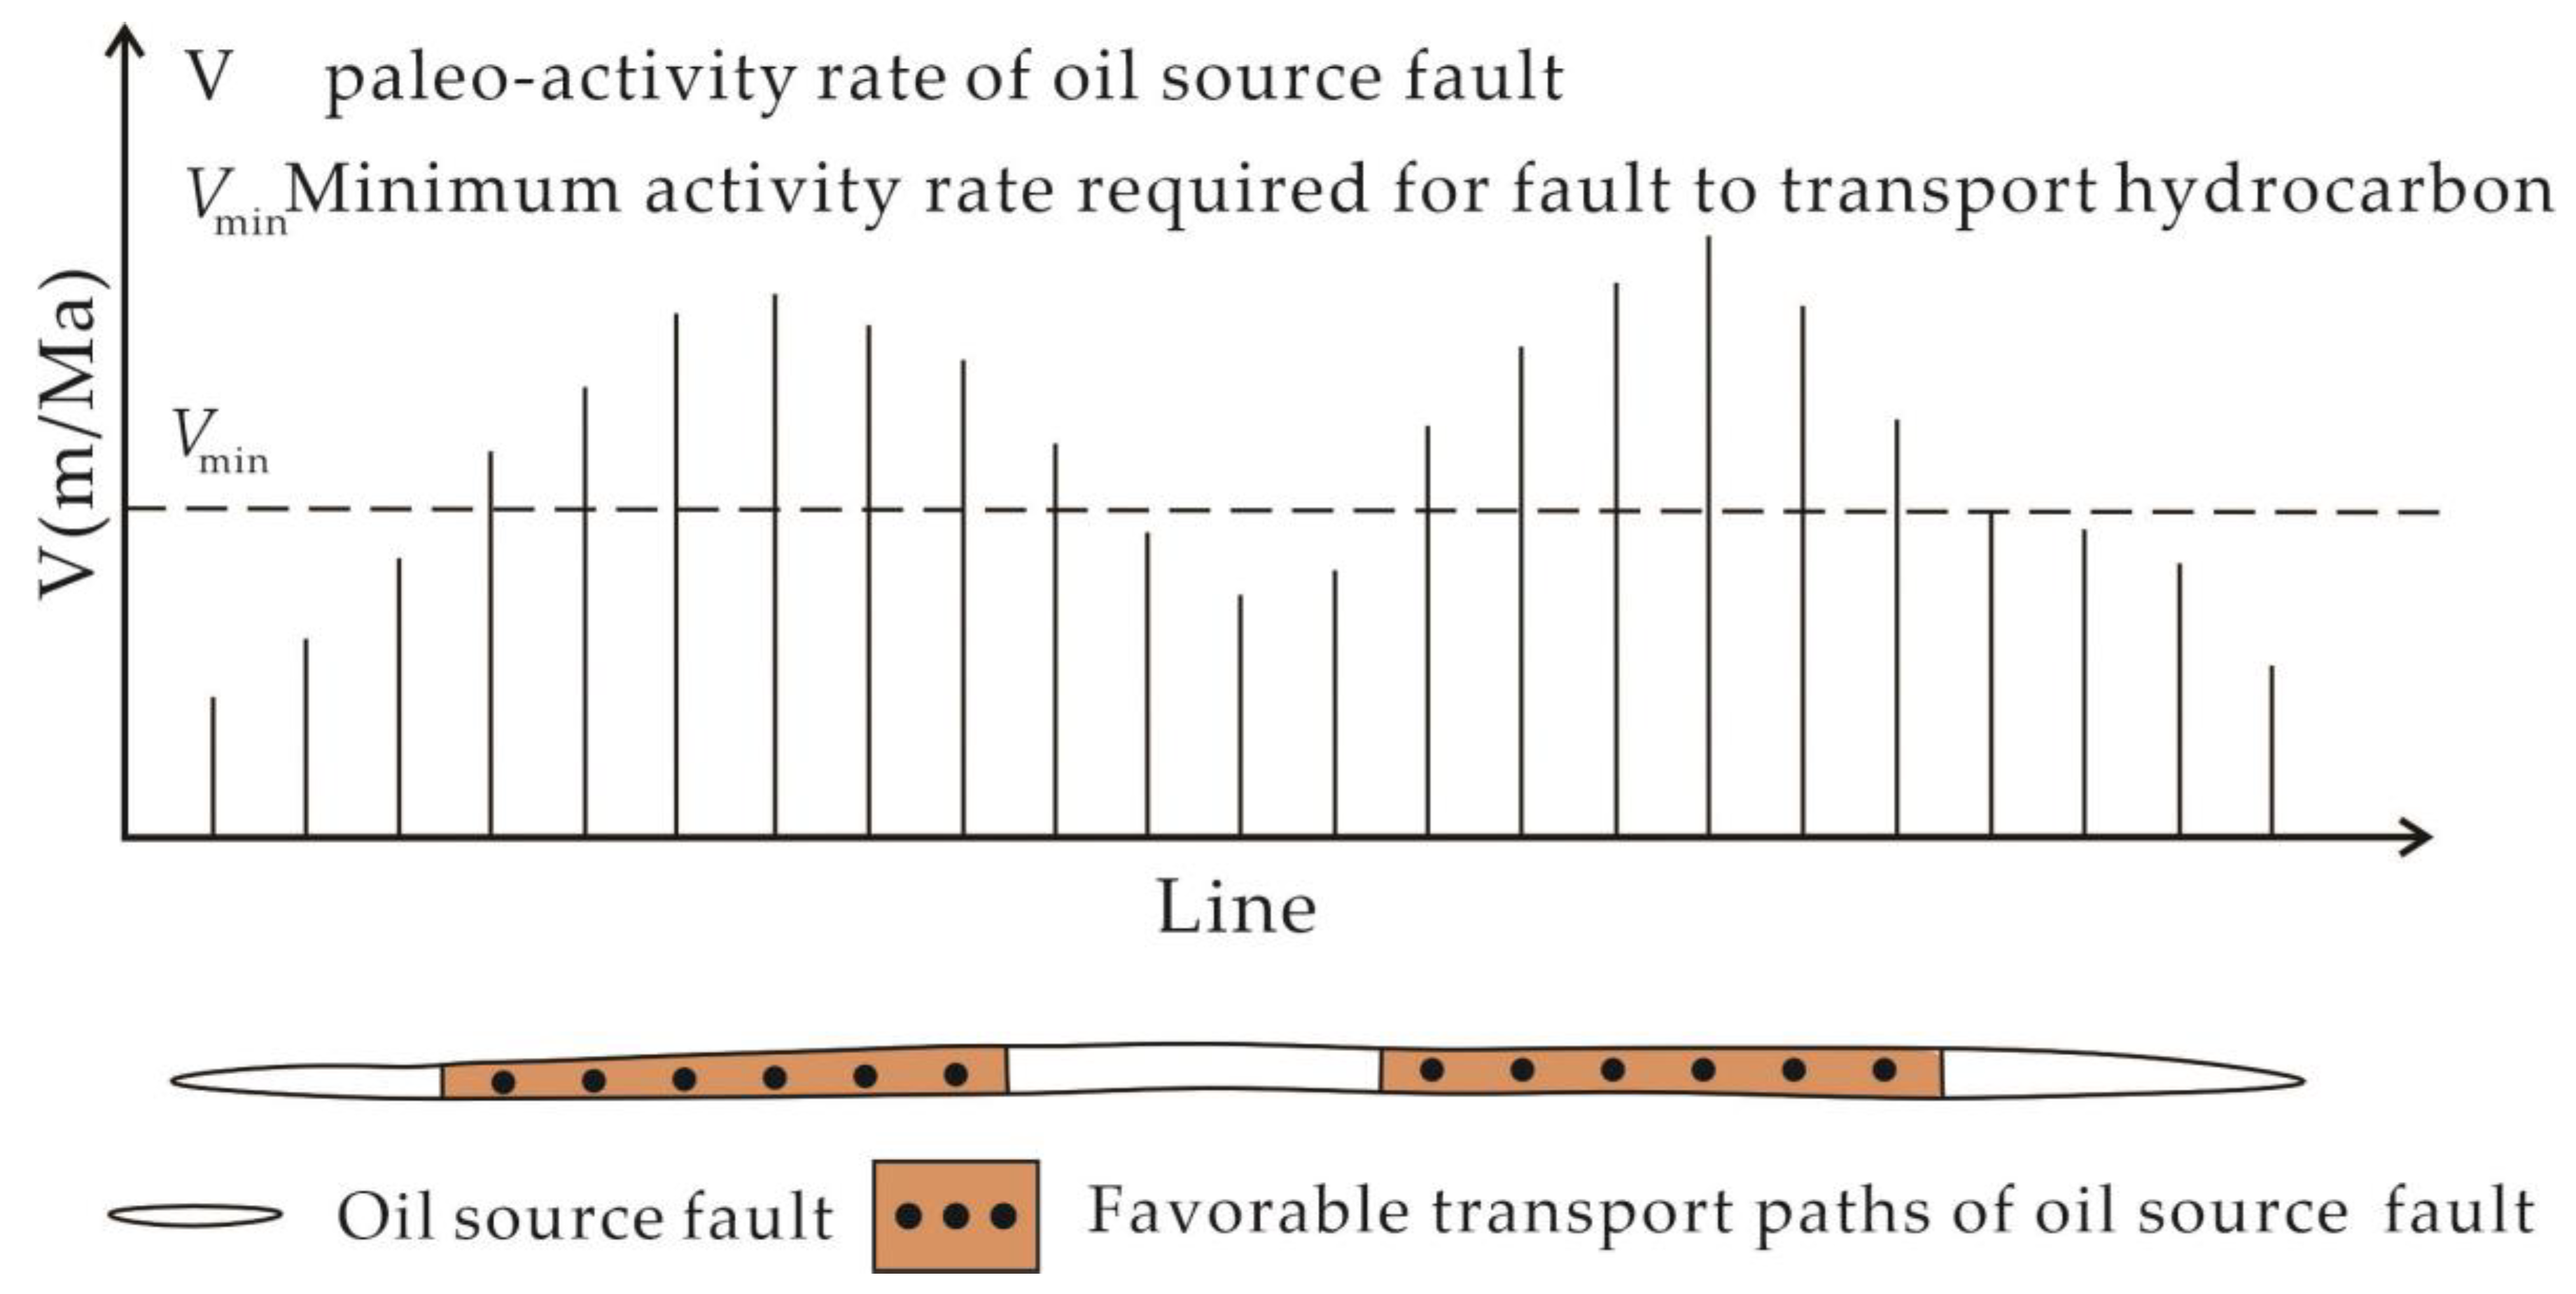
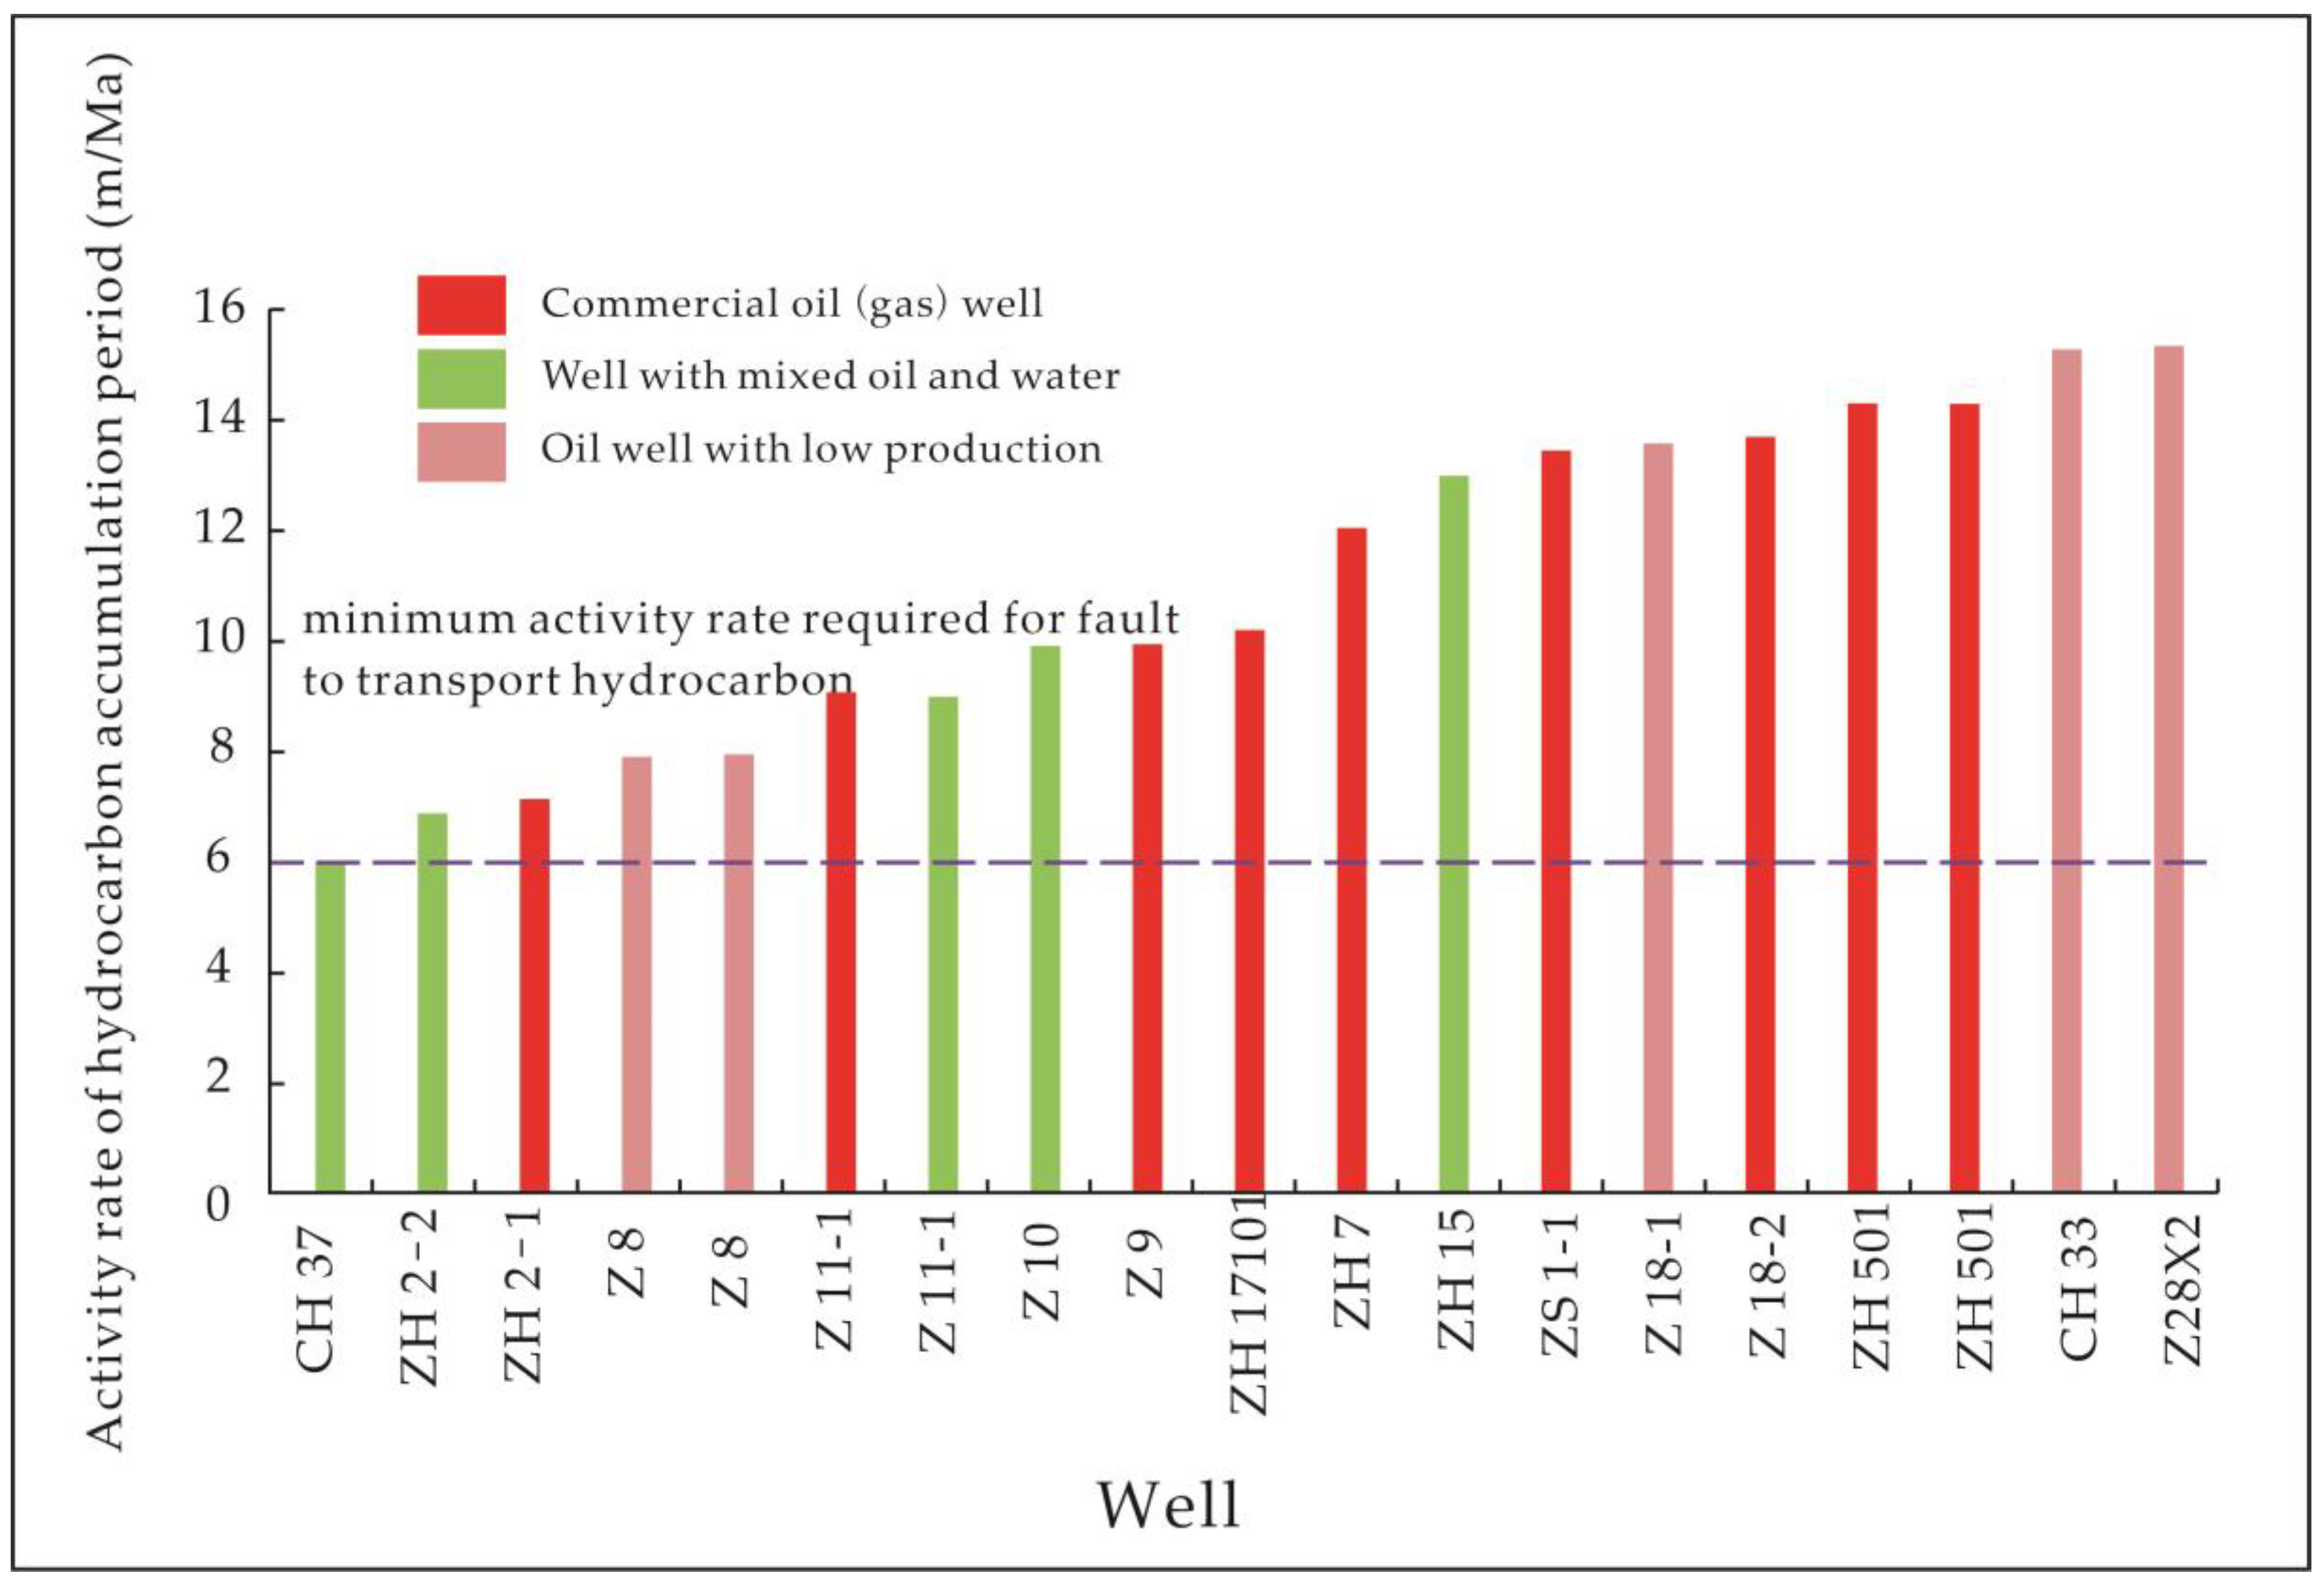
To determine the hydrocarbon supply area of the oil source fault, we must determine the favorable transport path of the fault and the width of the fracture zone associated with the oil source fault. The oil source faults are the ones that connect the source rock with the sand body-bearing strata sand bodies and are active during the formation period of hydrocarbon accumulation. At first, we need to split the oil source faults from all kinds of faults in the target formation, dissecting different strata. Afterward, the paleo-activity rate can be derived by dividing the paleo-fault throw by the period of active faulting. The paleo-fault throw is estimated based on the present-day fault throw using the maximum fault throw subtraction method [
17]. We then can obtain the minimum activity rate required for faults to transport by using the related method from the literature [
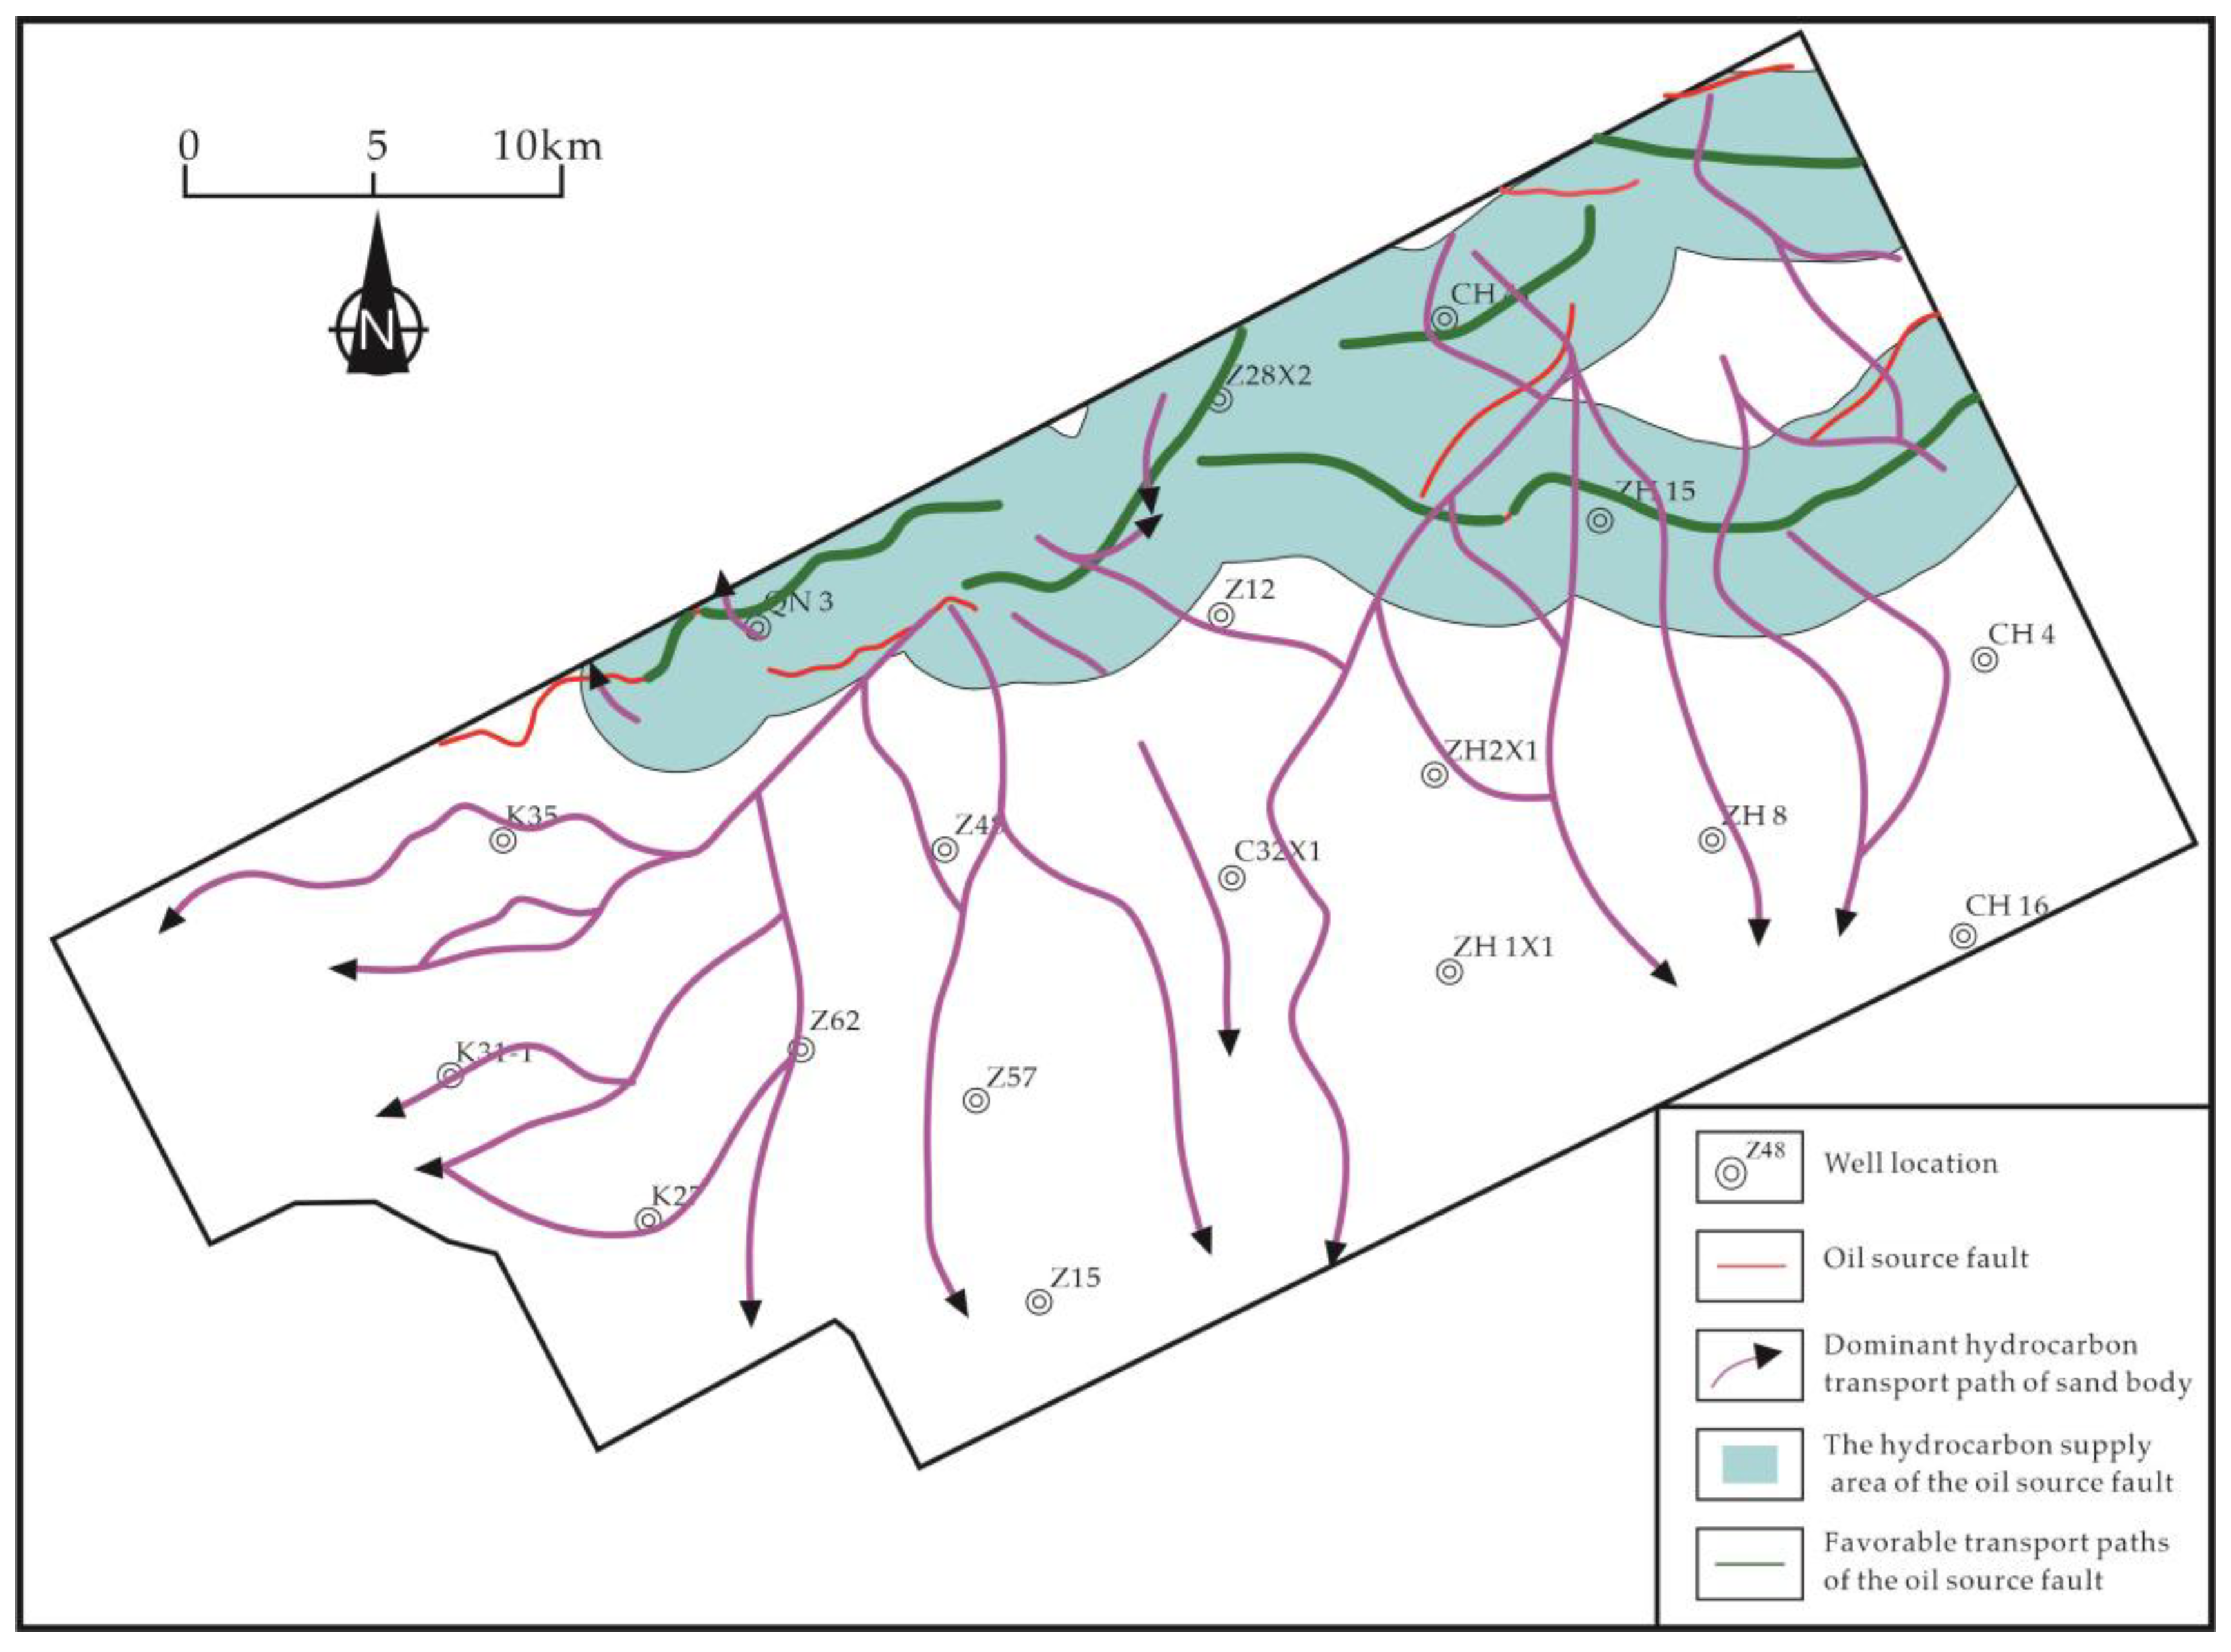
18]. The areas with fault activity rates greater than or equal to the minimum value are grouped to locate the favorable transport paths of the oil source faults, as demonstrated in
Figure 5.
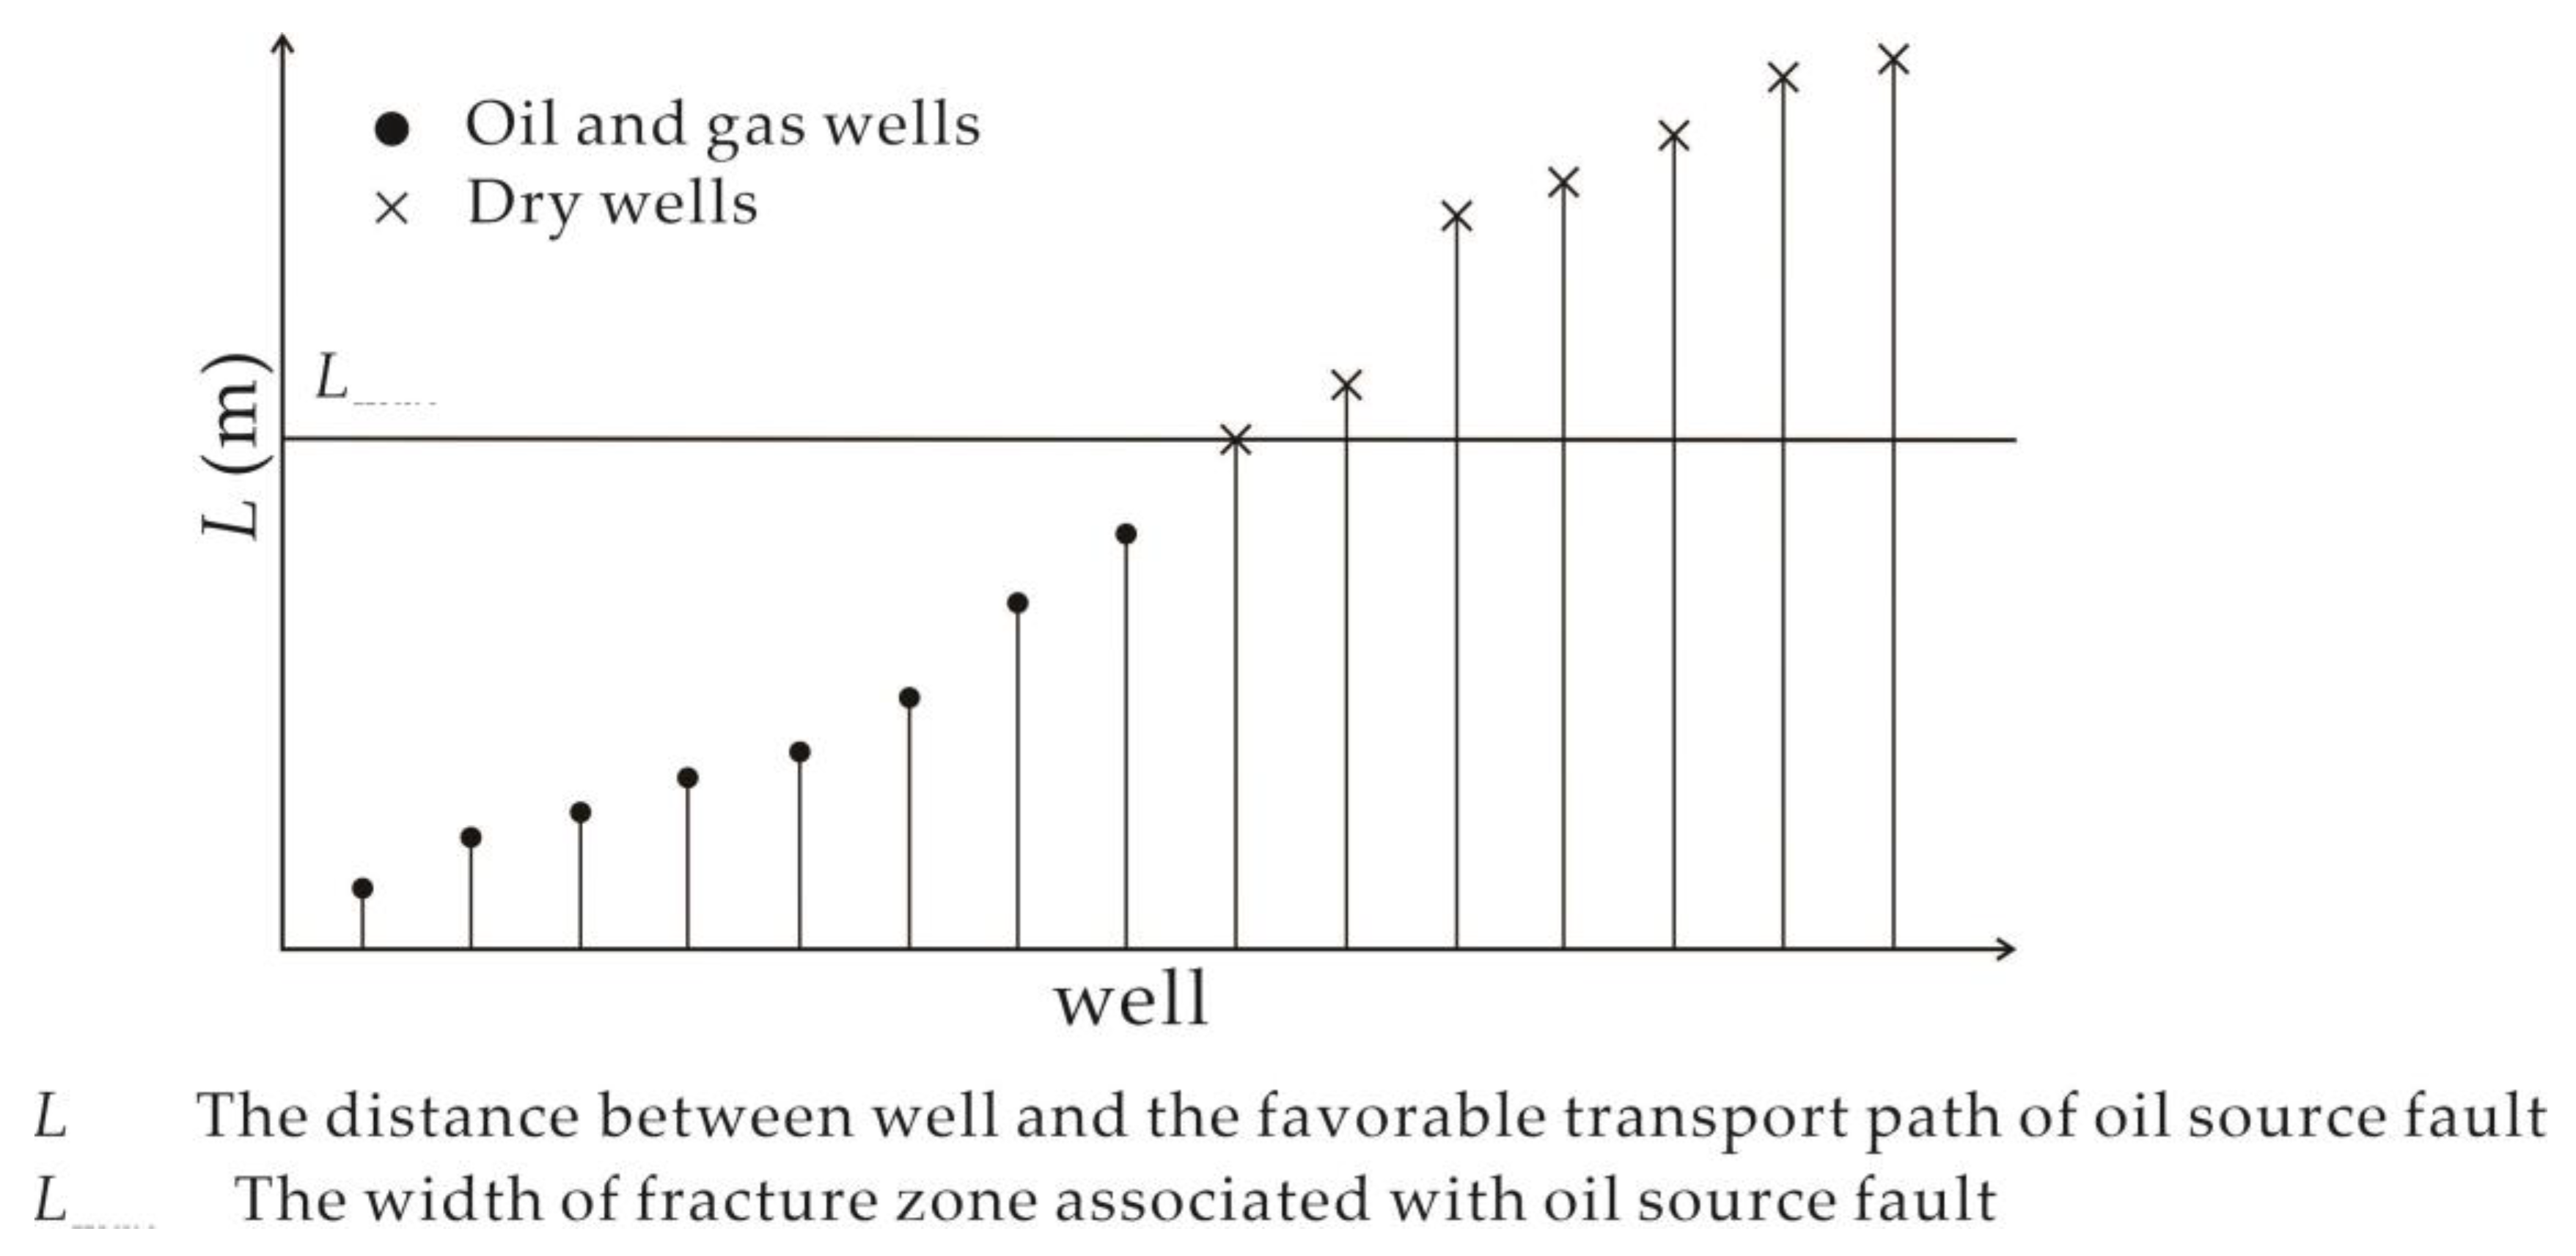
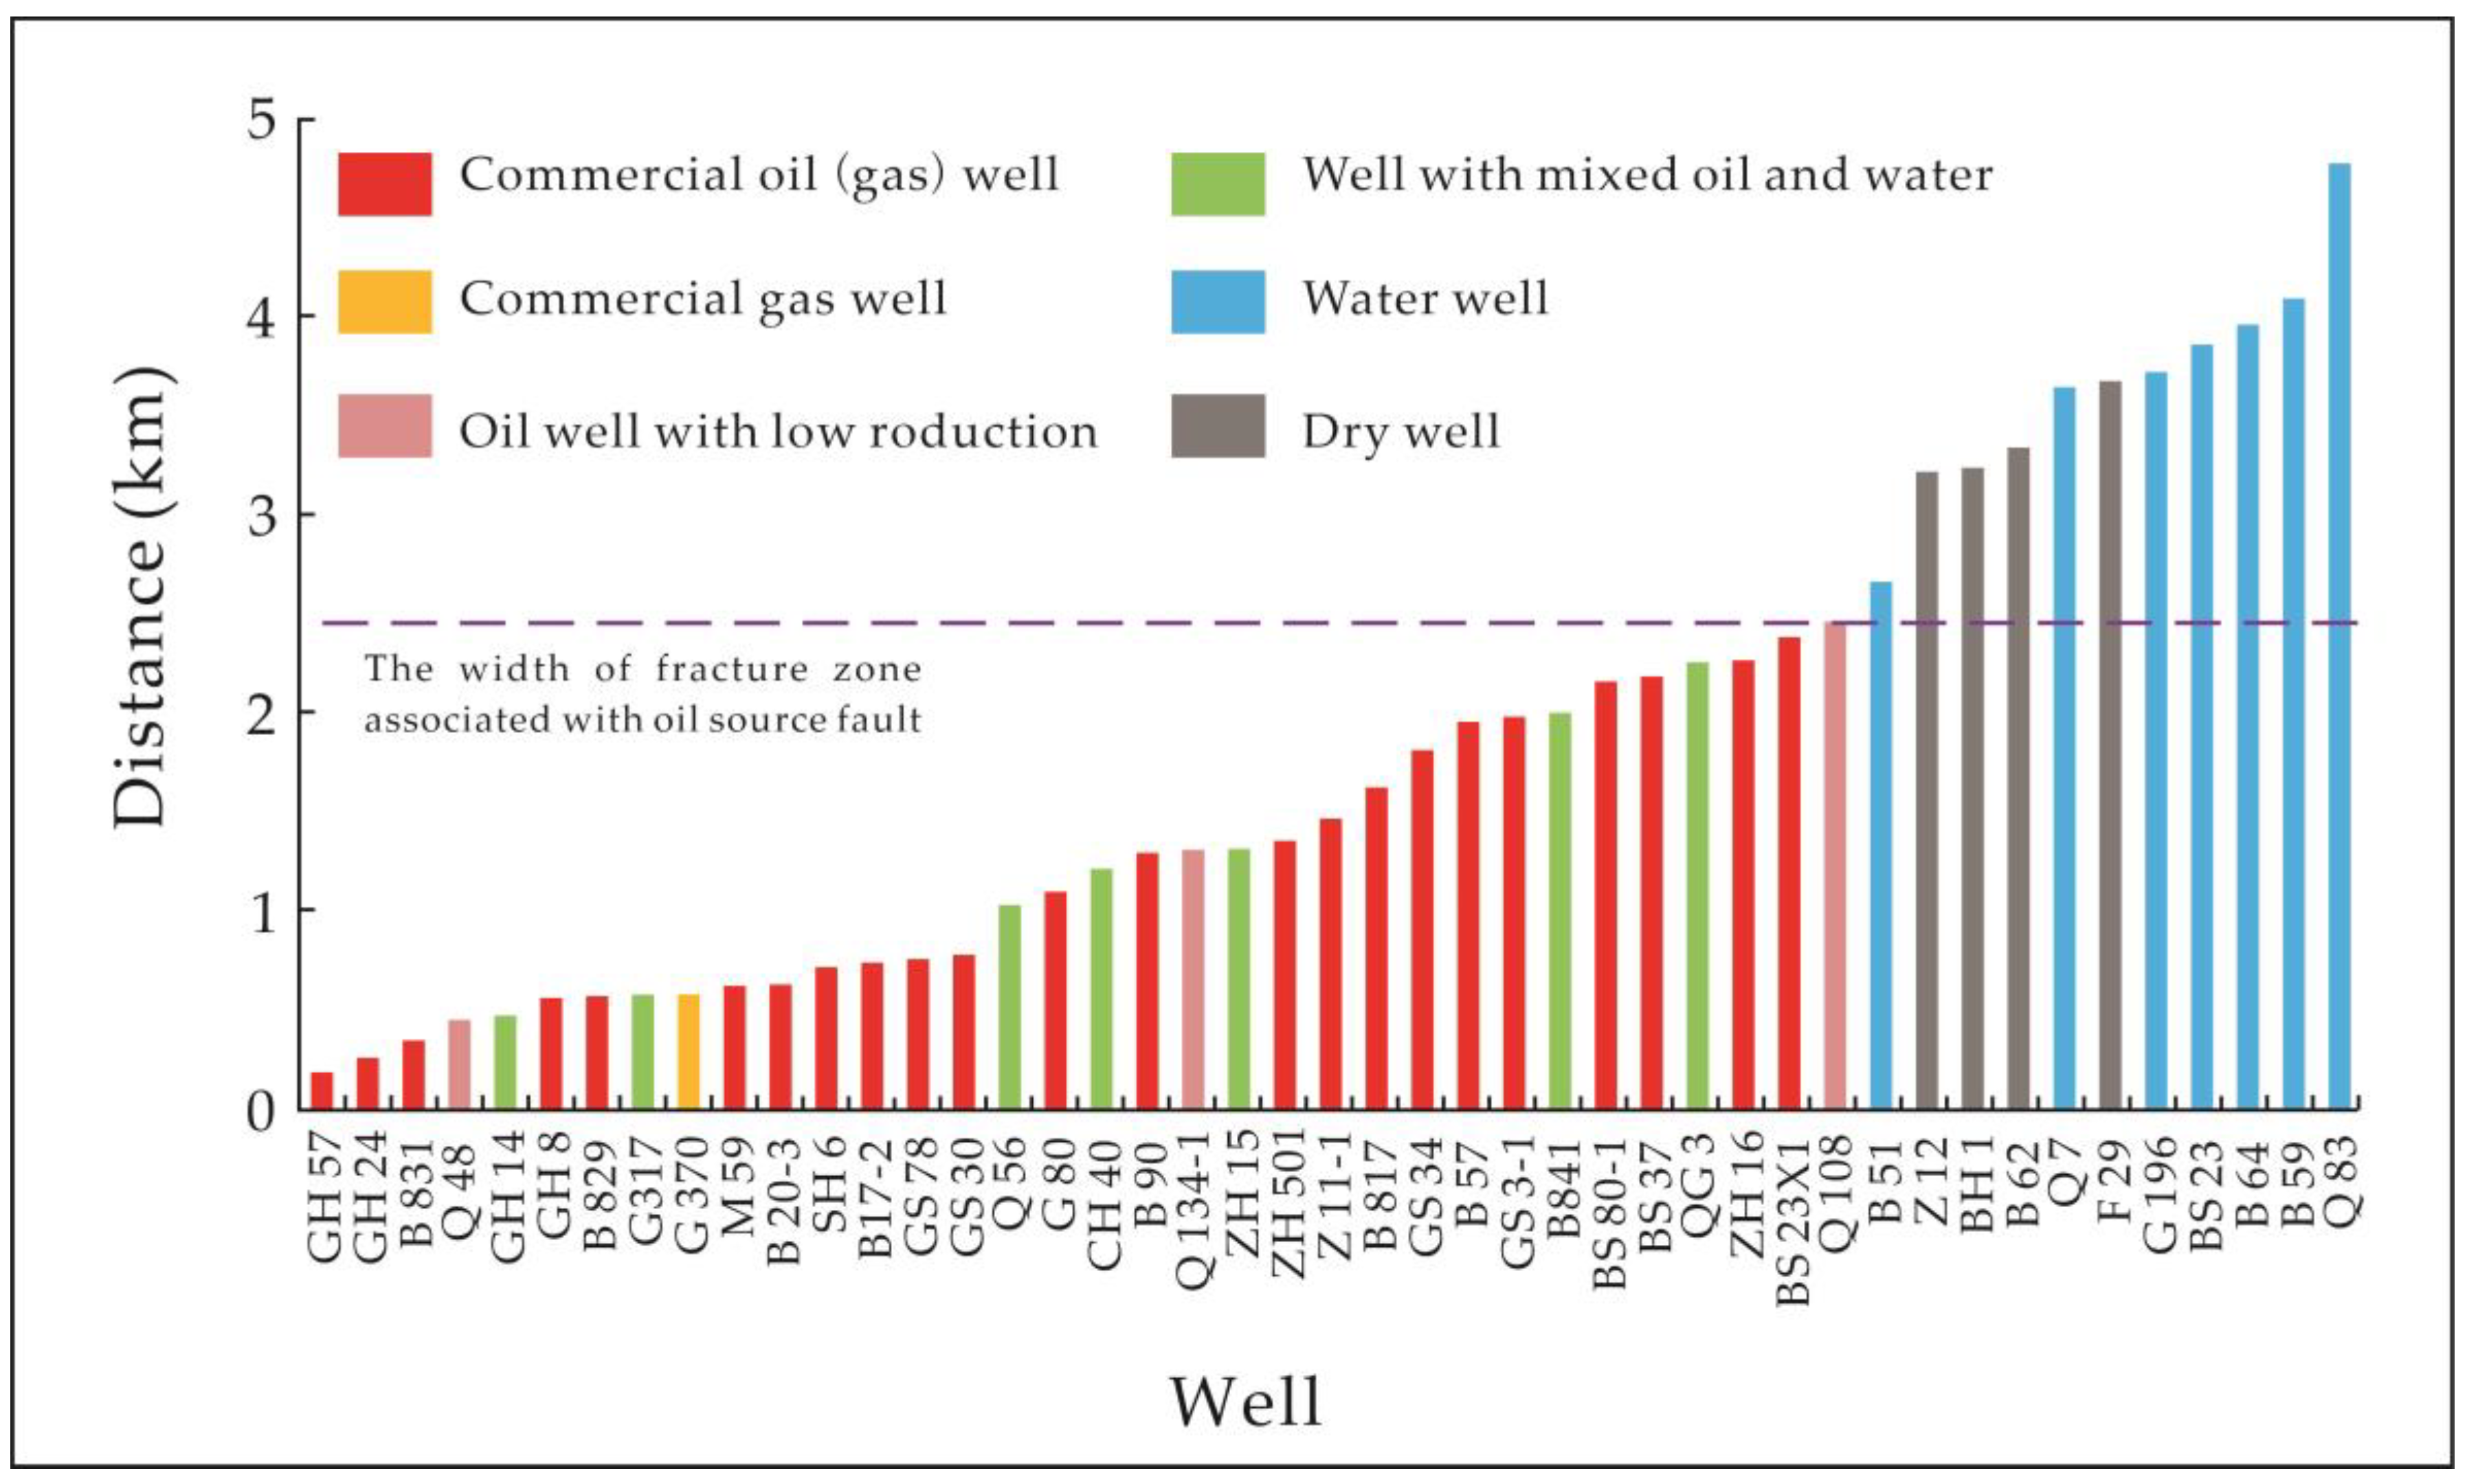
Limited by current technology, it is impossible to directly measure the width of the fracture zones associated with oil source faults developed during the formation period of hydrocarbon accumulation. However, it can be indirectly computed by sorting the distance between all wells in the study area and their nearest favorable hydrocarbon transport paths of the oil source faults and identifying the maximum distance between the producing wells and the paths (
Figure 6). The basis is that the formation of hydrocarbon accumulation is related to the occurrence of the associated fracture zone and the presence of the dominant hydrocarbon transport paths of oil source faults. Therefore, the maximum distance between the oil and gas well and the favorable hydrocarbon transport paths of oil source faults can indirectly indicate the width of the fracture zone associated oil source fault.
Figure 3 shows that the hydrocarbon supply area of oil source faults can be determined by combining the above-determined favorable hydrocarbon transport paths and the width of the associated fracture zone. Then the distribution of the effective dominant path of sand body transporting oil and gas can be obtained by overlapping the hydrocarbon supply area of the oil source faults and the predicted dominant hydrocarbon transport path of sand discussed in the previous section.
4. Results and Discussion
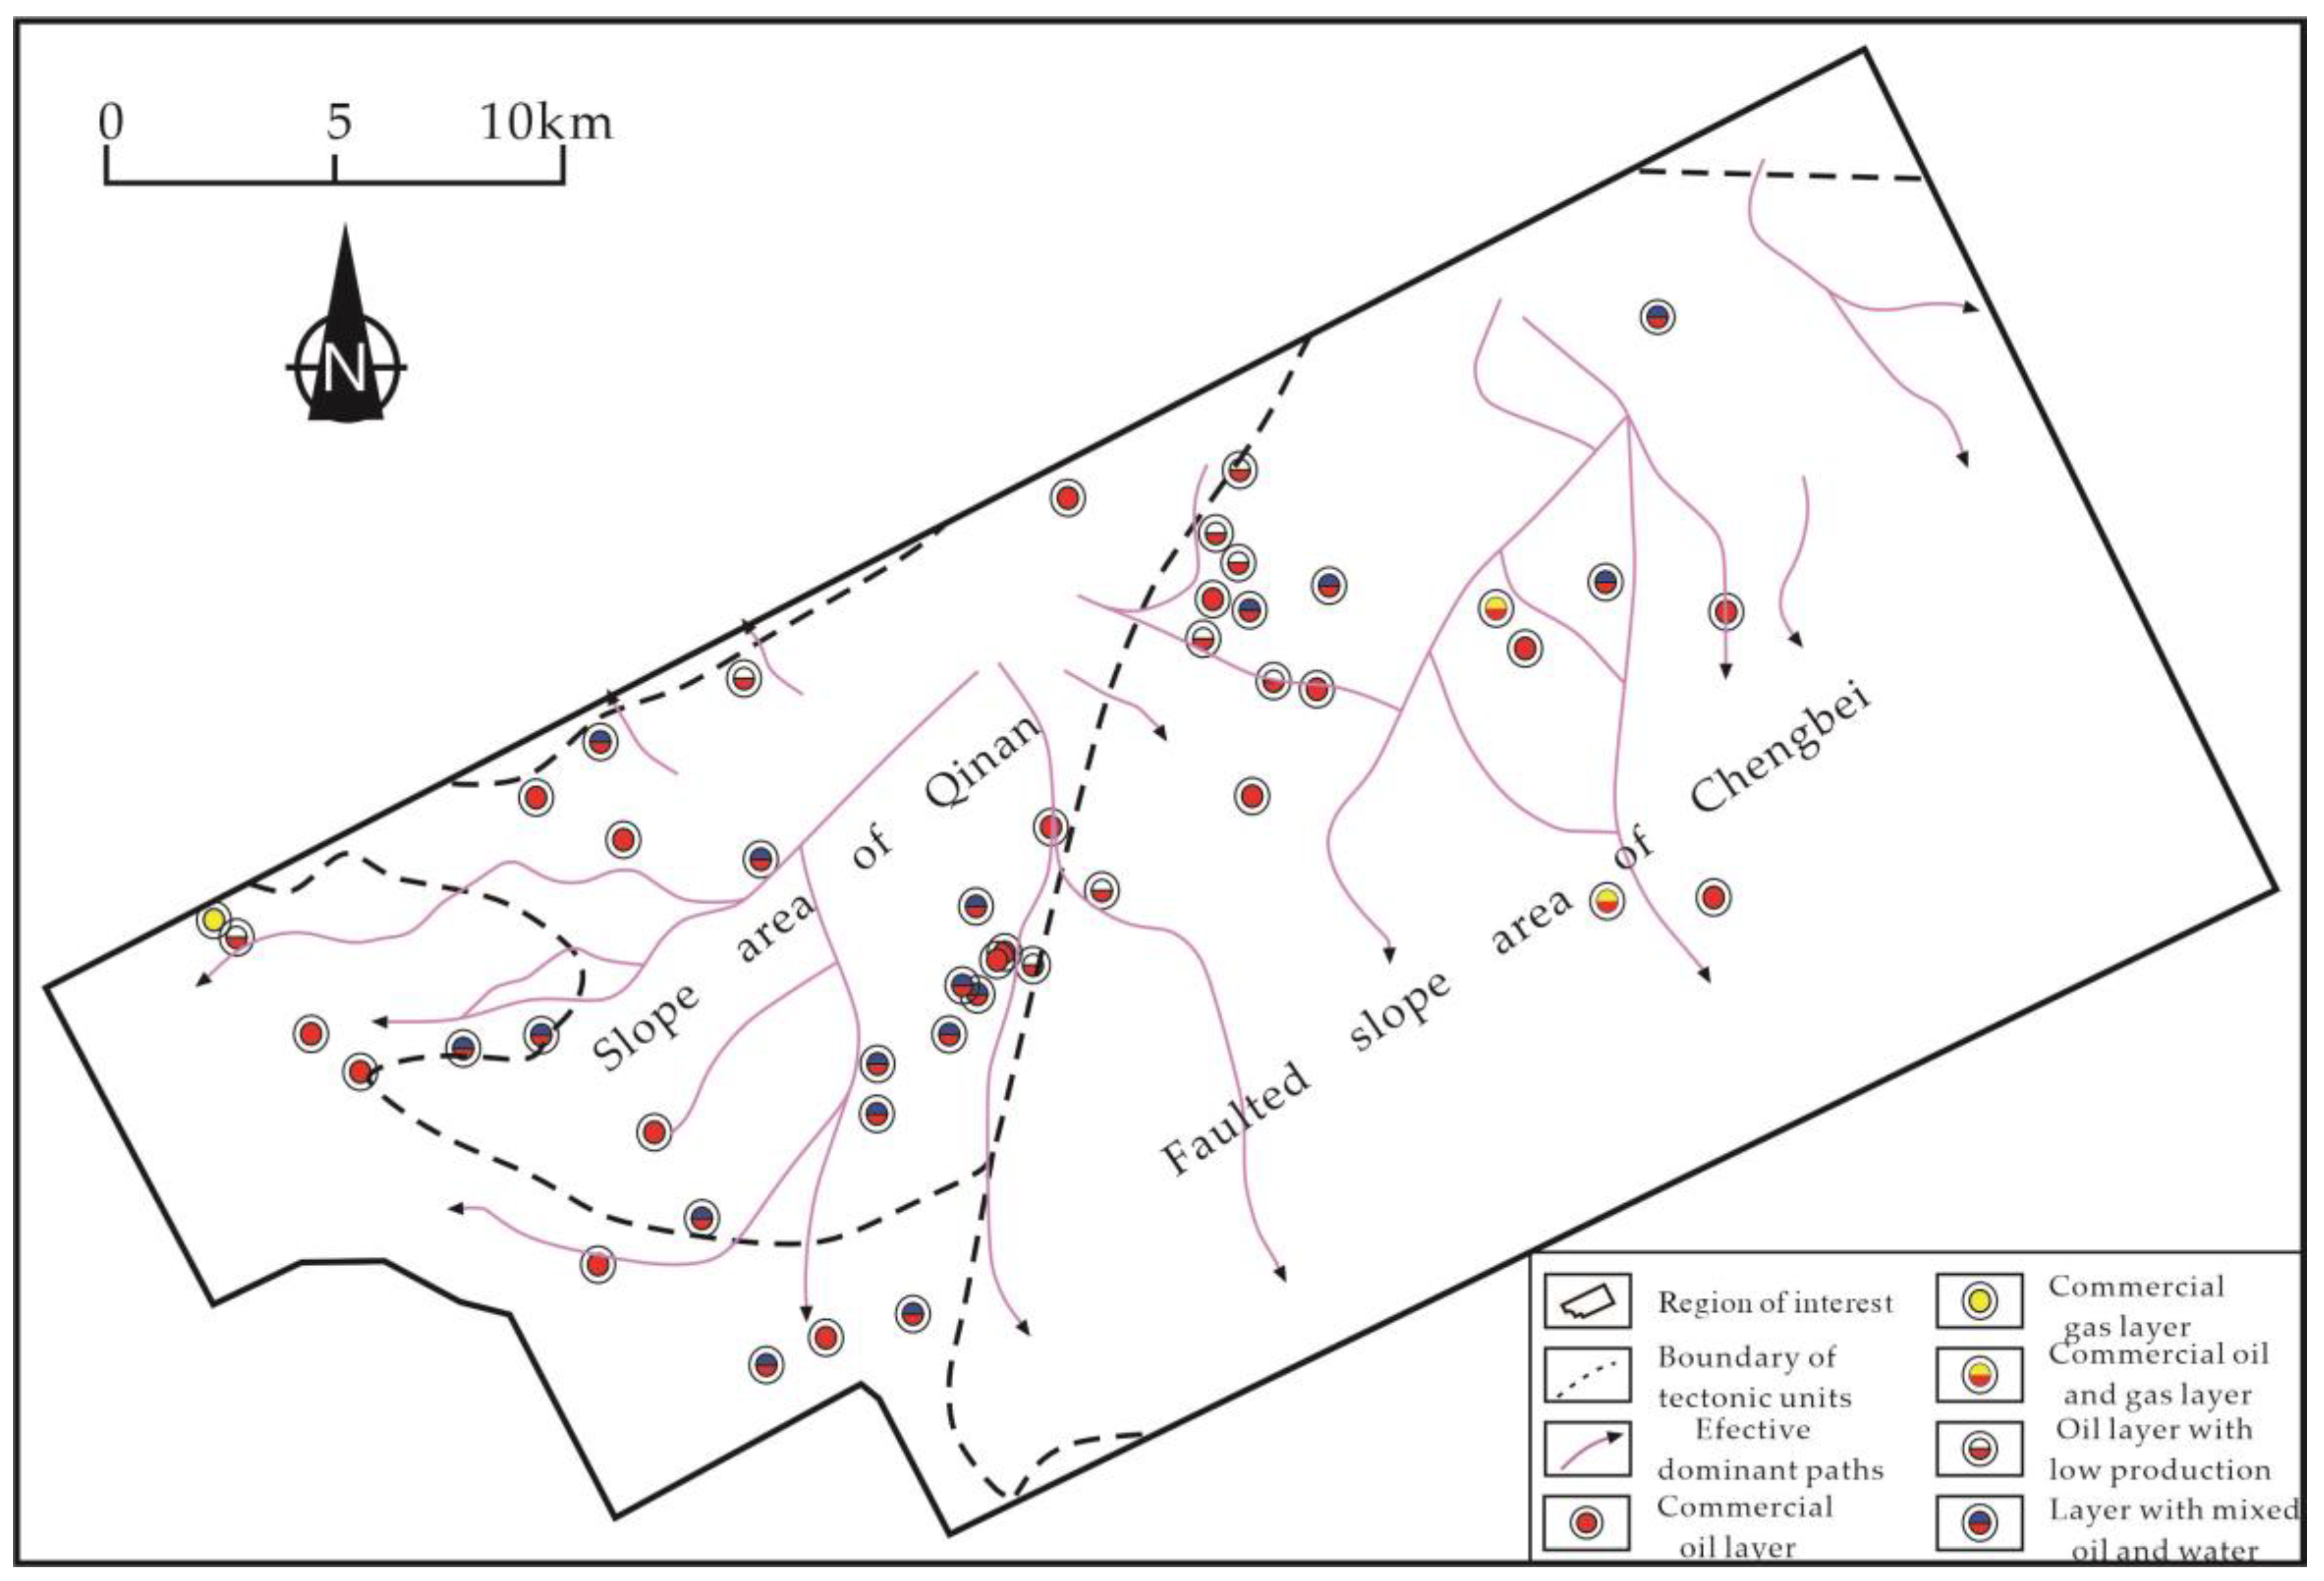
Figure 7 demonstrates that hydrocarbons mainly exist in the western part of the study area, with a small amount present in the southeast. This fact is related to the development of the structure traps, but more importantly, to the distribution of the effective dominant paths of sand bodies transporting oil and gas. Therefore, the key to its oil and gas exploration is to accurately predict the distribution of effective dominant paths of sand bodies transporting oil and gas in the E
3s1L Formation.
We applied the previously described method to the prediction of the distribution of the effective dominant hydrocarbon transport paths of the sand body located in the E3s1L Formation in the southern area of the Qikou depression of Bohai Bay Basin (Qinan). The predicted results are compared with the known distribution pattern of hydrocarbon in the study area to test the feasibility of the method adopted in this paper.
After counting the sand-to-shale ratio of the E
3s1L Formation available from the drilling log data, we make the distribution map of the ratio (
Figure 8). The minimum ratio of the studied formation in the Qinan area that allows oil and gas migration is about 15% (
Figure 9). Using a 15% cutoff, we delineate the distribution of the connected sand bodies in the study area (
Figure 8). The map clearly shows that most parts of the study area have connected sand bodies, except for the southeast area and a small part in the west.
The present-day burial depth of the top interface of the target formation in the study area is determined based on 3D seismic data. The paleo burial depth during the formation period of the hydrocarbon accumulations, the middle and late depositional period of the Minghuazhen Formation, is derived using the recovery method described in the literature [
10]. Based on these results, the value of the paleo-potential energy is calculated by equation 1. The distribution of paleotectonic ridges at the top of the target formation in the study area is identified by mapping the normal convergence line of the paleo potential energy on its contour map.
Figure 9 shows that the paleotectonic ridges in the E
3s1L Formation are widely distributed in the Qinan region, where the eastern region is more developed and extends further in length than the western part.
By superimposing the contiguously distributed areas of the sand body in the E
3s1L Formation and the distribution of its paleotectonic ridges in the study area, we obtain the dominant hydrocarbon transport path of sand bodies of the target formation.
Figure 11 shows that such favorable paths are developed and distributed throughout the region, with the western part being more developed than the eastern part. The dominant path in the eastern part extends north to south, while the dominant path in the western part extends from northeast to southwest.
Next, we split the different types of faults developed in the E
3s1L Formation in the Qinan area based on the dissecting strata observed on 3D seismic data. The oil source faults are identified based on the rules that they must link the source rock in the E
s3 Formation with the targeted E
3s1L Formation, and they must be active during the formation period of hydrocarbon accumulation, which is the middle and late deposition period of Minghuazhen Formation.
Figure 12 illustrates that the oil source faults in the E
3s1L Formation in the Qinan area are poorly developed, with local NE-orientated distribution in the northeastern area. We determine the present-day fault throw of the target formation from the 3D seismic data and then obtain the paleo-fault throw during the time forming hydrocarbon accumulation using the maximum fault throw subtraction method [
11,
12]. Afterward, we derive the paleoactivity rate of the faults by dividing the paleo-fault throw by the active faulting period. Based on the value of the minimum activity rate required for the faults to transport in the Qikou Depression (
Figure 12), the distribution of the favorable hydrocarbon transport paths of oil source faults in the Qikou area is obtained (
Figure 11). These favorable paths searched in E
3s1L Formation in the Qinan area are mainly distributed in the northeast.
By counting the distance between the dominant hydrocarbon transport path of sand and the favorable transport path of oil source faults in the E
3s1L Formation in the Qikou Depression, we estimate the width of the fracture zone associated with oil source faults in the area to be around 2.5km (
Figure 13). Based on this, we predict the oil and gas supply area of the E
3s1L Formation in the Qinan area, mainly located on the Northeastern side of the area.
By superimposing the distribution of the dominant hydrocarbon transport paths of sand with the oil and gas supply area of oil source faults, we obtain the effective dominant path of sand bodies transporting oil and gas.
Figure 7 shows that the effective dominant paths of sand transporting oil and gas in the E
3s1L Formation are widely distributed in the Qinan region, with the western part being more developed than the eastern part. The dominant paths in the eastern part extend from the north to the south, while those in the western side extend from the northeast to the southwest.
Figure 7 shows that oil and gas are primarily located in the western side of the studied area, with only a slight amount in the South‘eastern area. The distribution of oil and gas agree with the distribution of the effective dominant paths of sand body transporting oil and gas. It is reasonable as oil and gas can only migrate and accumulate in the Qinan region through these effective migration paths to form hydrocarbon accumulation. The effective paths are getting oil from the underlying source rock in the E
s3 Formation in the hydrocarbon supply area of the main northeastern depression of Qikou by oil source faults. Therefore, oil and gas shows are often found near these dominant paths during exploration practice.
5. Conclusions
(1) The effective dominant paths of sand bodies transporting oil and gas are defined as the dominant transport paths of the sand body that connect with the supply area of the oil source fault. Better development of such paths will lead to more convergence of oil and gas in the slope area and the formation of hydrocarbon accumulations.
(2) A method for predicting the distribution of effective dominant paths of sand bodies transporting oil and gas is established by superimposing the dominant transport paths of sand and the supply area of the oil source faults. The former is determined by the overlapped area of the connected sand body and the paleotectonic ridge at the top of the stratigraphic layer where the sand body is located. The latter is determined by locating the favorable transport path of the oil source fault and the width of the associated fracture zone.
(3) The effective dominant paths of sand transporting oil and gas in the E3s1L Formation are widely distributed in the Qinan region of Bohai Bay Basin, with better development in the west than the east. The effective dominant path of sand transporting oil and gas in the eastern part extends from north to south, while those paths in the western part extend from northeast to southwest, which is favorable for the convergence of oil and gas generated from source rocks in the study area and the formation of oil and gas accumulations in the E3s1L Formation. It is consistent with the fact that a large amount of oil and gas exists in the central and westernSha part of the study area, and controversially a tiny amount of oil and gas was discovered in the southeast region.
Author Contributions
Conceptualization, Y.C., H.Y.; methodology, Y.C.; software,Y.W.; validation, Y.C., H.Y. and Y.Z.; formal analysis, Y.Z.; investigation, Y.W.andY.Y.; resources, Y.W.andY.Z.; data curation, Y.C.andY.Y.; writing—original draft preparation, Y.C.; writing—review and editing, C.Y. and H.Y.; visualization, Y.C.; supervision, H.Y.; project administration, H.Y.; funding acquisition, H.Y. All authors have read and agreed to the published version of the manuscript.
Funding
This research was funded by Natural Science Foundation of Heilongjiang Province(LH2022D013,LH2023D005). In 2021 this work was also supported by Central Support Project for Young Talents in Local Universities in Heilongjiang Province(14011202101), and Key Research and Development Project of Heilongjiang Province (JD22A022)..
Data Availability Statement
Not applicable.
Acknowledgments
We are very grateful to the reviewers and editors for their contributions to improving this paper.
Conflicts of Interest
The authors declare that they have no conflict of interest.
References
- Sun, T.W.; Fu, G.; Wang, F.; Zhang, L.T.; Xie, G.X.; Lü, Y.F. Control effect of transporting ridge in hydrocarbon accumulation in the uplift area outside of source area: A Fuyu oil layer case study in Xingbei Region, Daqing placanticline. Journal of Central South University(Science and Technology) 2014, 45, 4308–4316. [Google Scholar]
- Lin, Y.X.; Sun, N.F.; Guo, F.X.; Yan, X.X.; Meng, C.; Li, X.F.; Liu, H.; Li, X.Q. Mechanism and quantitative evaluation method of the petroleum migration system. Petroleum Geology and Experiment 2015, 37, 237–245. [Google Scholar]
- Fu, G.; Deng, W.; Wang, W.; Wang, H.R. Controlling Factors and Prediction Method of Hydrocarbon Migration Pathway Distribution in Different Forms of Sandbodies. Journal of Xi’an Shiyou University(Natural Science Edition) 2016, 31, 23–29. [Google Scholar]
- Jiang, R.F.; Guo, M.G.; Zhu, J.T.; Zhou, J.; Xiang, Y.G. Evaluation of 3D Hydrocarbon Migration System in Baodao Sag in the Deep-water Area of Qiongdongnan Basin. Journal of Southwest Petroleum University(Science & Technology Edition) 2018, 40, 57–66. [Google Scholar]
- Su, W.; Yang, H.F.; Chuai, Y.Y.; Zhang, H.G.; Hu, Z.W. Neogene hydrocarbon migration and inspiration in the gentle slope belt, Southern Bohai Sea: A case from Kenli 9 oilfield group. Marine Geology Frontiers 2020, 36, 69–76. [Google Scholar]
- Luo, X.R.; Zhang, L.Q.; Zhang, L.K.; Lei, Y.H.; Cheng, M.; Shi, H.; Cao, B.F. Heterogeneity of clastic carrier bed and hydrocarbon migration and accumulation. Acta Petrolei Sinica 2020, 41, 253–272. [Google Scholar]
- Xiao, J.Q.; Jiang, T.; Fu, L.; Zhu, Y.C.; Liu, D.D.; Guan, D.Y. Genetic model of tectonic ridge in Northern Slope of Bonan Low uplift and its relationship with oil and gas. Journal of Chengdu University of Technology (Science & Technology Edition) 2021, 48, 317–325. [Google Scholar]
- Sun, Y.H.; Zhao, B.; Dong, Y.X.; Zheng, X.F.; Hu, M. Control of faults on hydrocarbon migration and accumulation in the Nanpu Sag. Oil & Gas Geology 2013, 34, 540–549. [Google Scholar]
- Wang, W.; Sun, T.W.; Cao, L.Z.; Lü, Y.F.; Fu, G.; Lu, X.Q.; Deng, W.; Zhang, H. A quantitative evaluation method of probability for diversion flow oil and gas laterally from faults to sand bodies: A case study from Leave Chu Structure in the Raoyang Sag, Bohai Bay Basin. Oil & Gas Geology 2016, 37, 979–989. [Google Scholar]
- Lü, D.Y.; Zhang, H.G.; Ma, X.G.; Guan, D.Y.; Zhang, S. Exploration Practices from Uplift and Slope Zones in Eastern Part of Bohai Sea and Its Inspiration. Bulletin of Geological Science and Technology 2018, 37, 84–89. [Google Scholar]
- Fu, G.; Wang, H. Differences in distribution characteristics of oil and gas by controlling fault-sand transporting systems in uplifted and slope areas. Journal of China University of Petroleum (Edition of Natural Science) 2018, 42, 22–30. [Google Scholar]
- Li, Z.M.; Qiu, N.S.; Liu, N.; Cai, C.; Tian, J.Z.; Wang, Y.J.; Gao, T.; Gu, Q. Applying quantitative fluorescence techniques to characterize mechanism of hydrocarbon migration and accumulation in thick source strata: a case study of Member 4 of Shahejie Formation, Langgu sag in Bohai Bay Basin. Acta Petrolei Sinica 2019, 40, 1158–1171. [Google Scholar]
- Xue, Y.A.; Niu, C.M.; Wang, D.Y.; Yang, C.C.; Liu, Y.J.; Zhang, H.G.; Wang, Y.C. New understanding of shallow hydrocarbon migration and new exploration progress in the Bohai Sea. Acta Petrolei Sinica 2019, 40, 29–37. [Google Scholar]
- Fu, G.; Han, X. Methodology for predicting transfer position of oil and gas transmission from fault in depression to sand body in slope area. Journal of China University of Petroleum(Edition of Natural Science) 2021, 45, 42–50. [Google Scholar]
- Luo, X.R.; Lei, Y.H.; Zhang, L.K.; Chen, R.Y.; Chen, Z.K.; Xu, J.H.; Zhao, J. Characterization of carrier formation for hydrocarbon migration: concepts and approaches. Acta Petrolei Sinica 2012, 33, 428–436. [Google Scholar]
- Fu, G.; Wang, H.R. Prediction Method of Favorable Position in Oil-Gas Accumulation around Oil-Source Fault and its Application. Tectonics and Metallogenesis 2019, 43, 71. [Google Scholar]
- Tan, K.J.; Wei, P.S.; Lü, X.M.; Mou, Z.H. Research on quantitative resumption method of stratum paleothickness and its application--taking the Ludong area in Zhunge’er Basin as an example. Natural Gas Industry 2005, 25, 25–28. [Google Scholar]
- Mark, G.R.; Bruce, S.H.; Steve, N.; Peter, B.F.; Bruce, D.T. Three-dimensional geometry and evolution of a salt-related growth-fault array: Eugene Island 330 field, offshore Louisiana, Gulf of Mexico. Marine and petroleum geology 1998, 15, 309–328. [Google Scholar]
|
Disclaimer/Publisher’s Note: The statements, opinions and data contained in all publications are solely those of the individual author(s) and contributor(s) and not of MDPI and/or the editor(s). MDPI and/or the editor(s) disclaim responsibility for any injury to people or property resulting from any ideas, methods, instructions or products referred to in the content. |
© 2023 by the authors. Licensee MDPI, Basel, Switzerland. This article is an open access article distributed under the terms and conditions of the Creative Commons Attribution (CC BY) license (http://creativecommons.org/licenses/by/4.0/).
