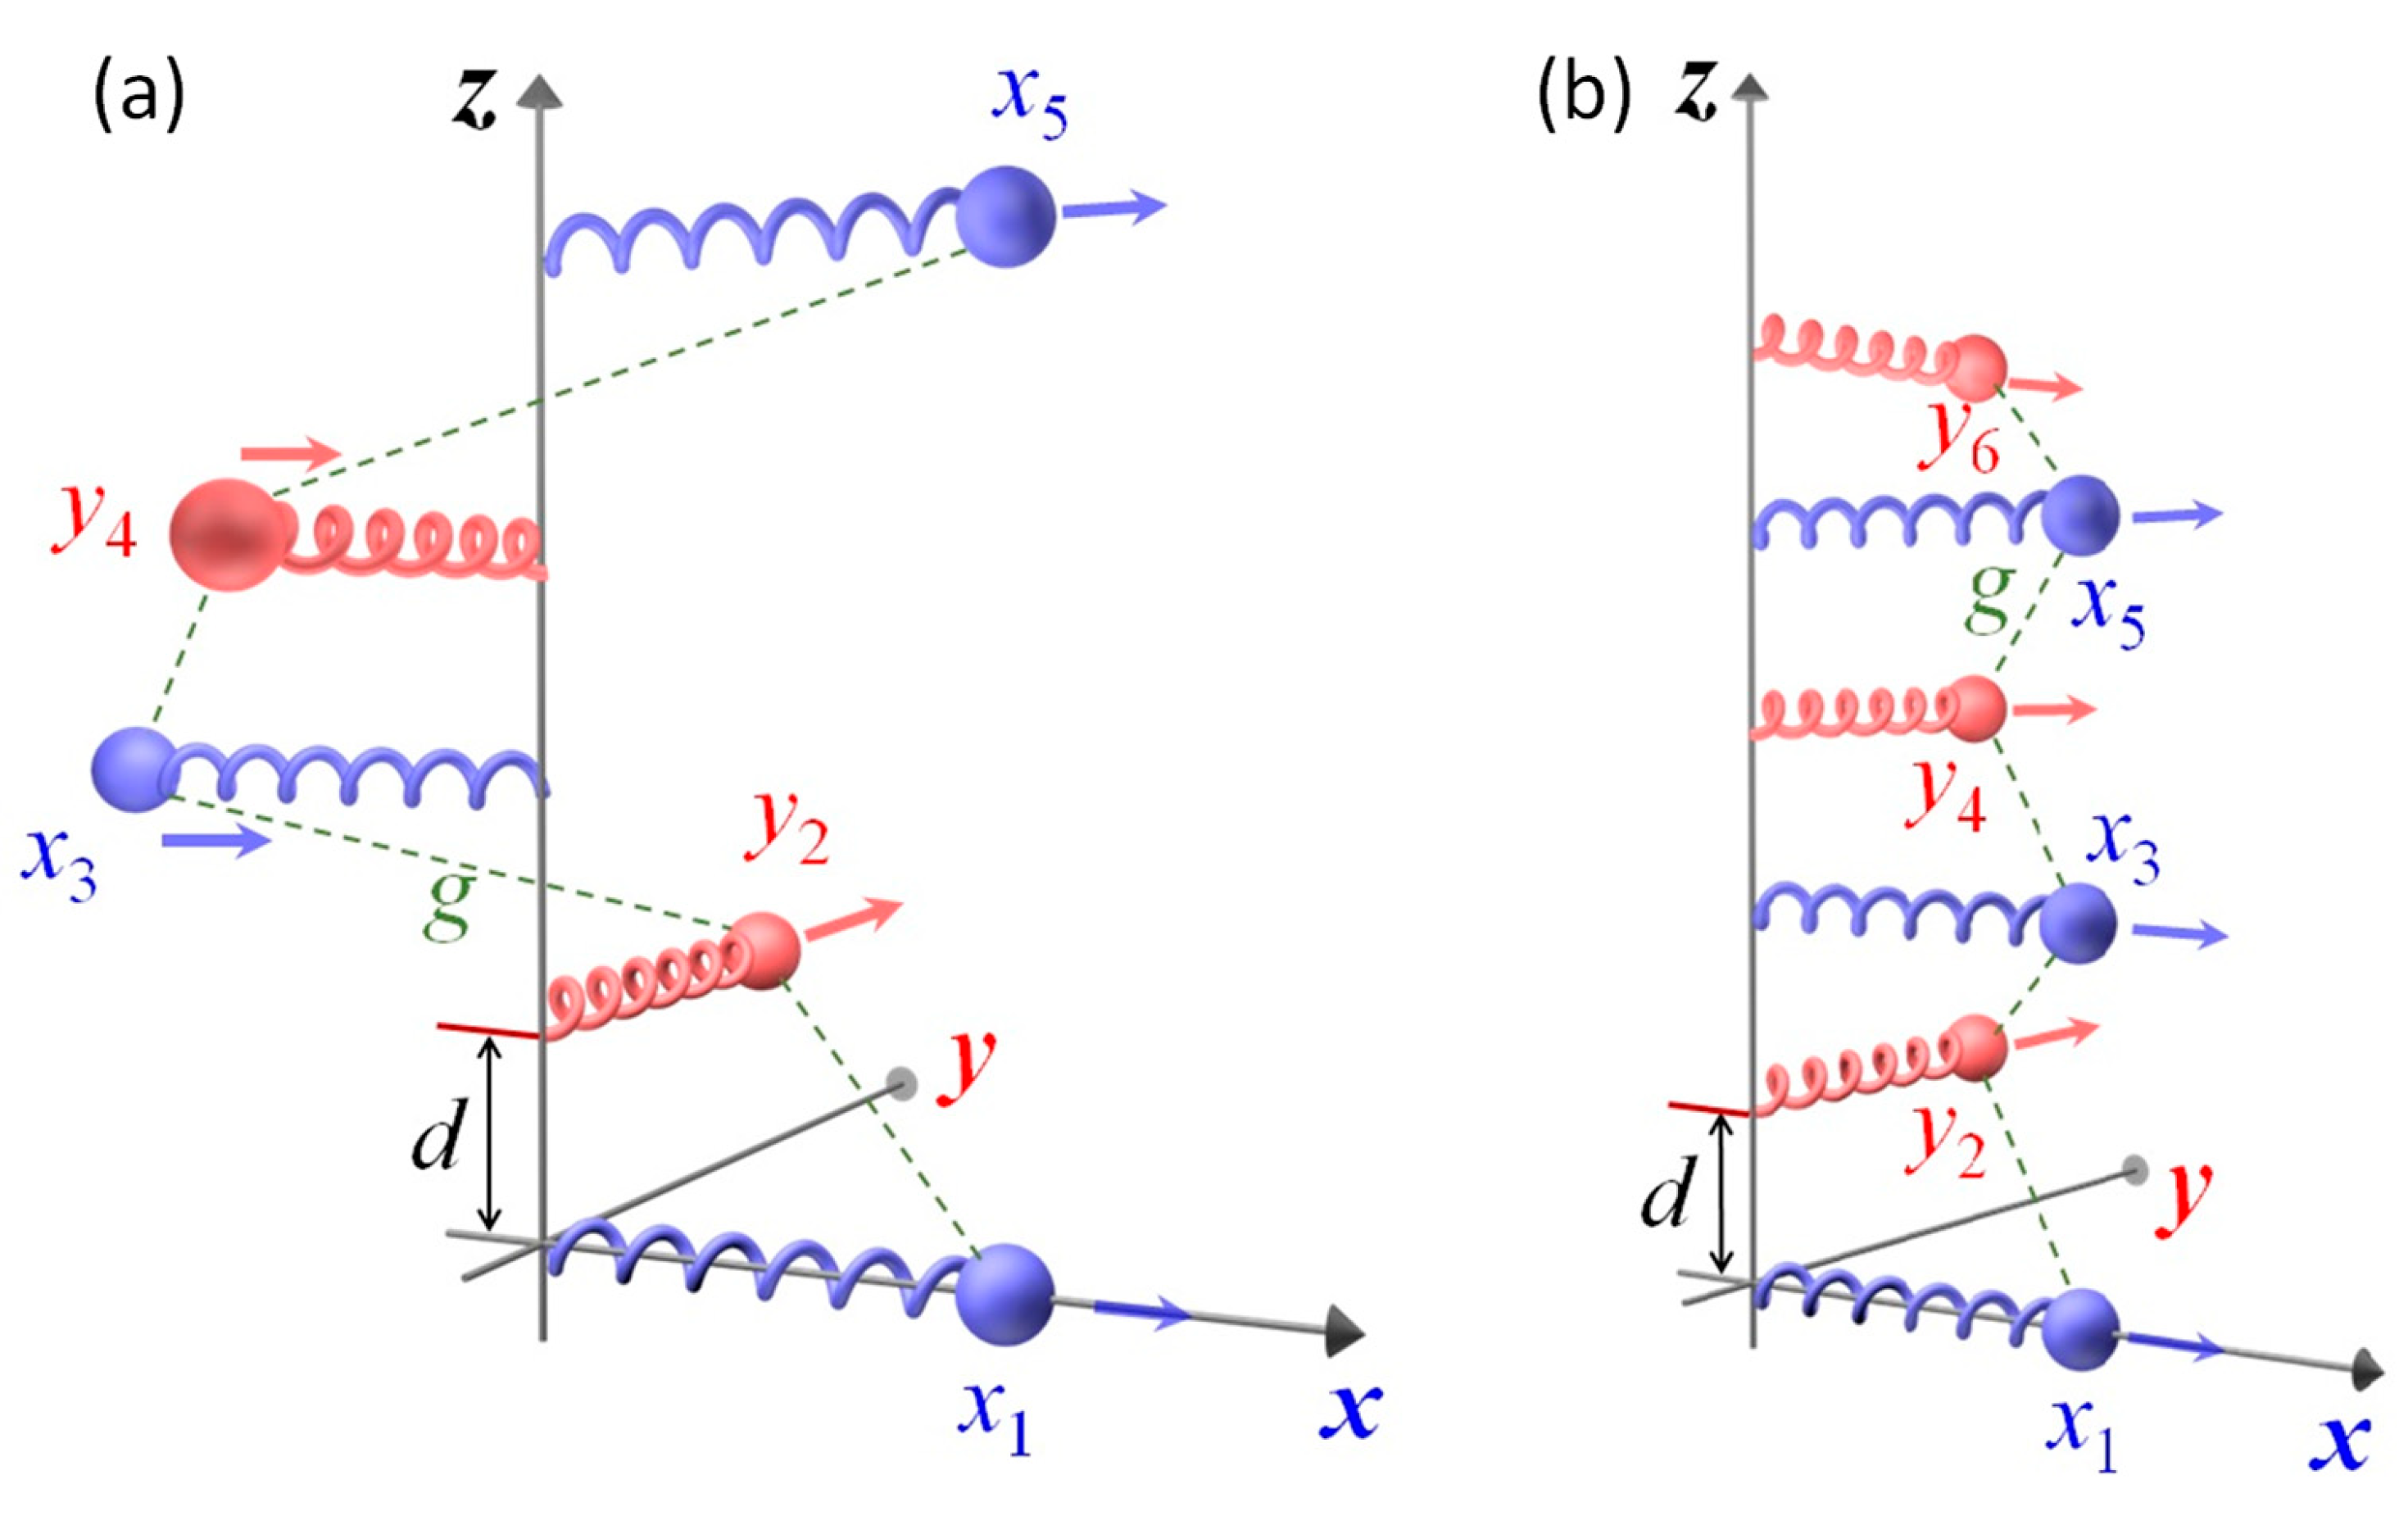
We consider two kinds of N-Oscillator Born-Kuhn (NOBK) models, the helically stacked and vertically stacked NOBK models as shown in
Figure 1. Using the convention in which
positive displacement always corresponds to particle’s motion in the positive direction of either
- or
-axis, and restricting consideration to identical damping coefficients
, identical resontant frequencies
, as well as identical nearest-neighbors coupling constants
, the equations of motion for the oscillators in the helical NOBK model (
Figure 1A) are,
Figure 1.
N-Oscillator Born-Khon models: (a) the helically stacked and (b) the corner stacked.
Figure 1.
N-Oscillator Born-Khon models: (a) the helically stacked and (b) the corner stacked.
where the alternating
on the left hand side are due to simple physical considerations, and there are
N equations corresponding to
N oscillators in the system. Since our primary interest is in system’s gyrotropic response, we assume harmonic drive in the form of a plane electromagnetic wave of frequency
and wave number
propagating in the positive
-direction,
where
and
are the effective charge and mass parameters characterizing the oscillating charge distributions. Applying the steady state solutions,
For both the helical and corner NOBK models, the induced polarization can then be found as,[
21,
22]
where
,
is the bulk concentration of NOBK molecules. The “
” sign is for the helical NOBK model, and the “
” sign is for the corner NOBK model. Insert
Equation 9 into
Equations 10 and
11, one has,
with
The exact expressions for polarization as a function of
become rather cumbersome and not very illuminating for
, which motivates us to use the quasi-static (long-wavelength) approximation,
, and keep only linear terms in
,
Since
for both helical and corner NOBK models, according to
Equation 15,
and
can be written as, [
16,
21,
22]
with
where
is the gyration, representing chiral induced polarization. If we only consider chiral effect, after averaging in three-dimensional space, we get
In the following section, we will discuss in detail how different NOBK models, the number of oscillators, and oscillator parameters affect the ORD and CD responses, i.e., and .
2.1. Helical NOBK model
For the helical NOBK model, according to
Appendix A,
can be written as,
where
. Thus,
Let’s look at
N = 2 case,
l = 1 and
j =2, so,
.
Table 1 shows the calculated
,
, and
for
N = 2
l (even numbers ofoscillators) and
N = 2
l + 1 (odd number odcillators), with
. It is noticed that when
N = 2
l, the expressions for
,
, and
become more complecated, while for
N = 2
l + 1 they are much simpler.
Below we will give an extensive discussion on how both ORD and CD change with N under different damping and coupling consitions. To make all the quantaties comparible, we set , , and , thus .
- (1)
Large damping
In cases where
b is large and
c is very small, corresponding to weak coupling (
, the expressions in
Table 1 yield
Table 1.
The resulted , , and expression for helical NOBK models
Table 1.
The resulted , , and expression for helical NOBK models
| N |
|
|
|
|
|
|
|
|
|
|
|
|
|
|
|
|
|
|
|
|
|
|
|
| 3 |
|
|
|
|
|
|
|
| 7 |
|
|
|
| 9 |
|
|
|
Table 2.
The resulted , , and expression for corner NOBK models
Table 2.
The resulted , , and expression for corner NOBK models
| N |
|
|
|
|
|
|
|
|
|
|
|
|
|
|
|
|
|
|
|
|
|
|
|
i.e., according to
Equations 20 and
21, the functional shapes of both ORD and CD with respect to
x remain unchanged. Only the magnitude of ORD and CD experiences a linear increase with
N.
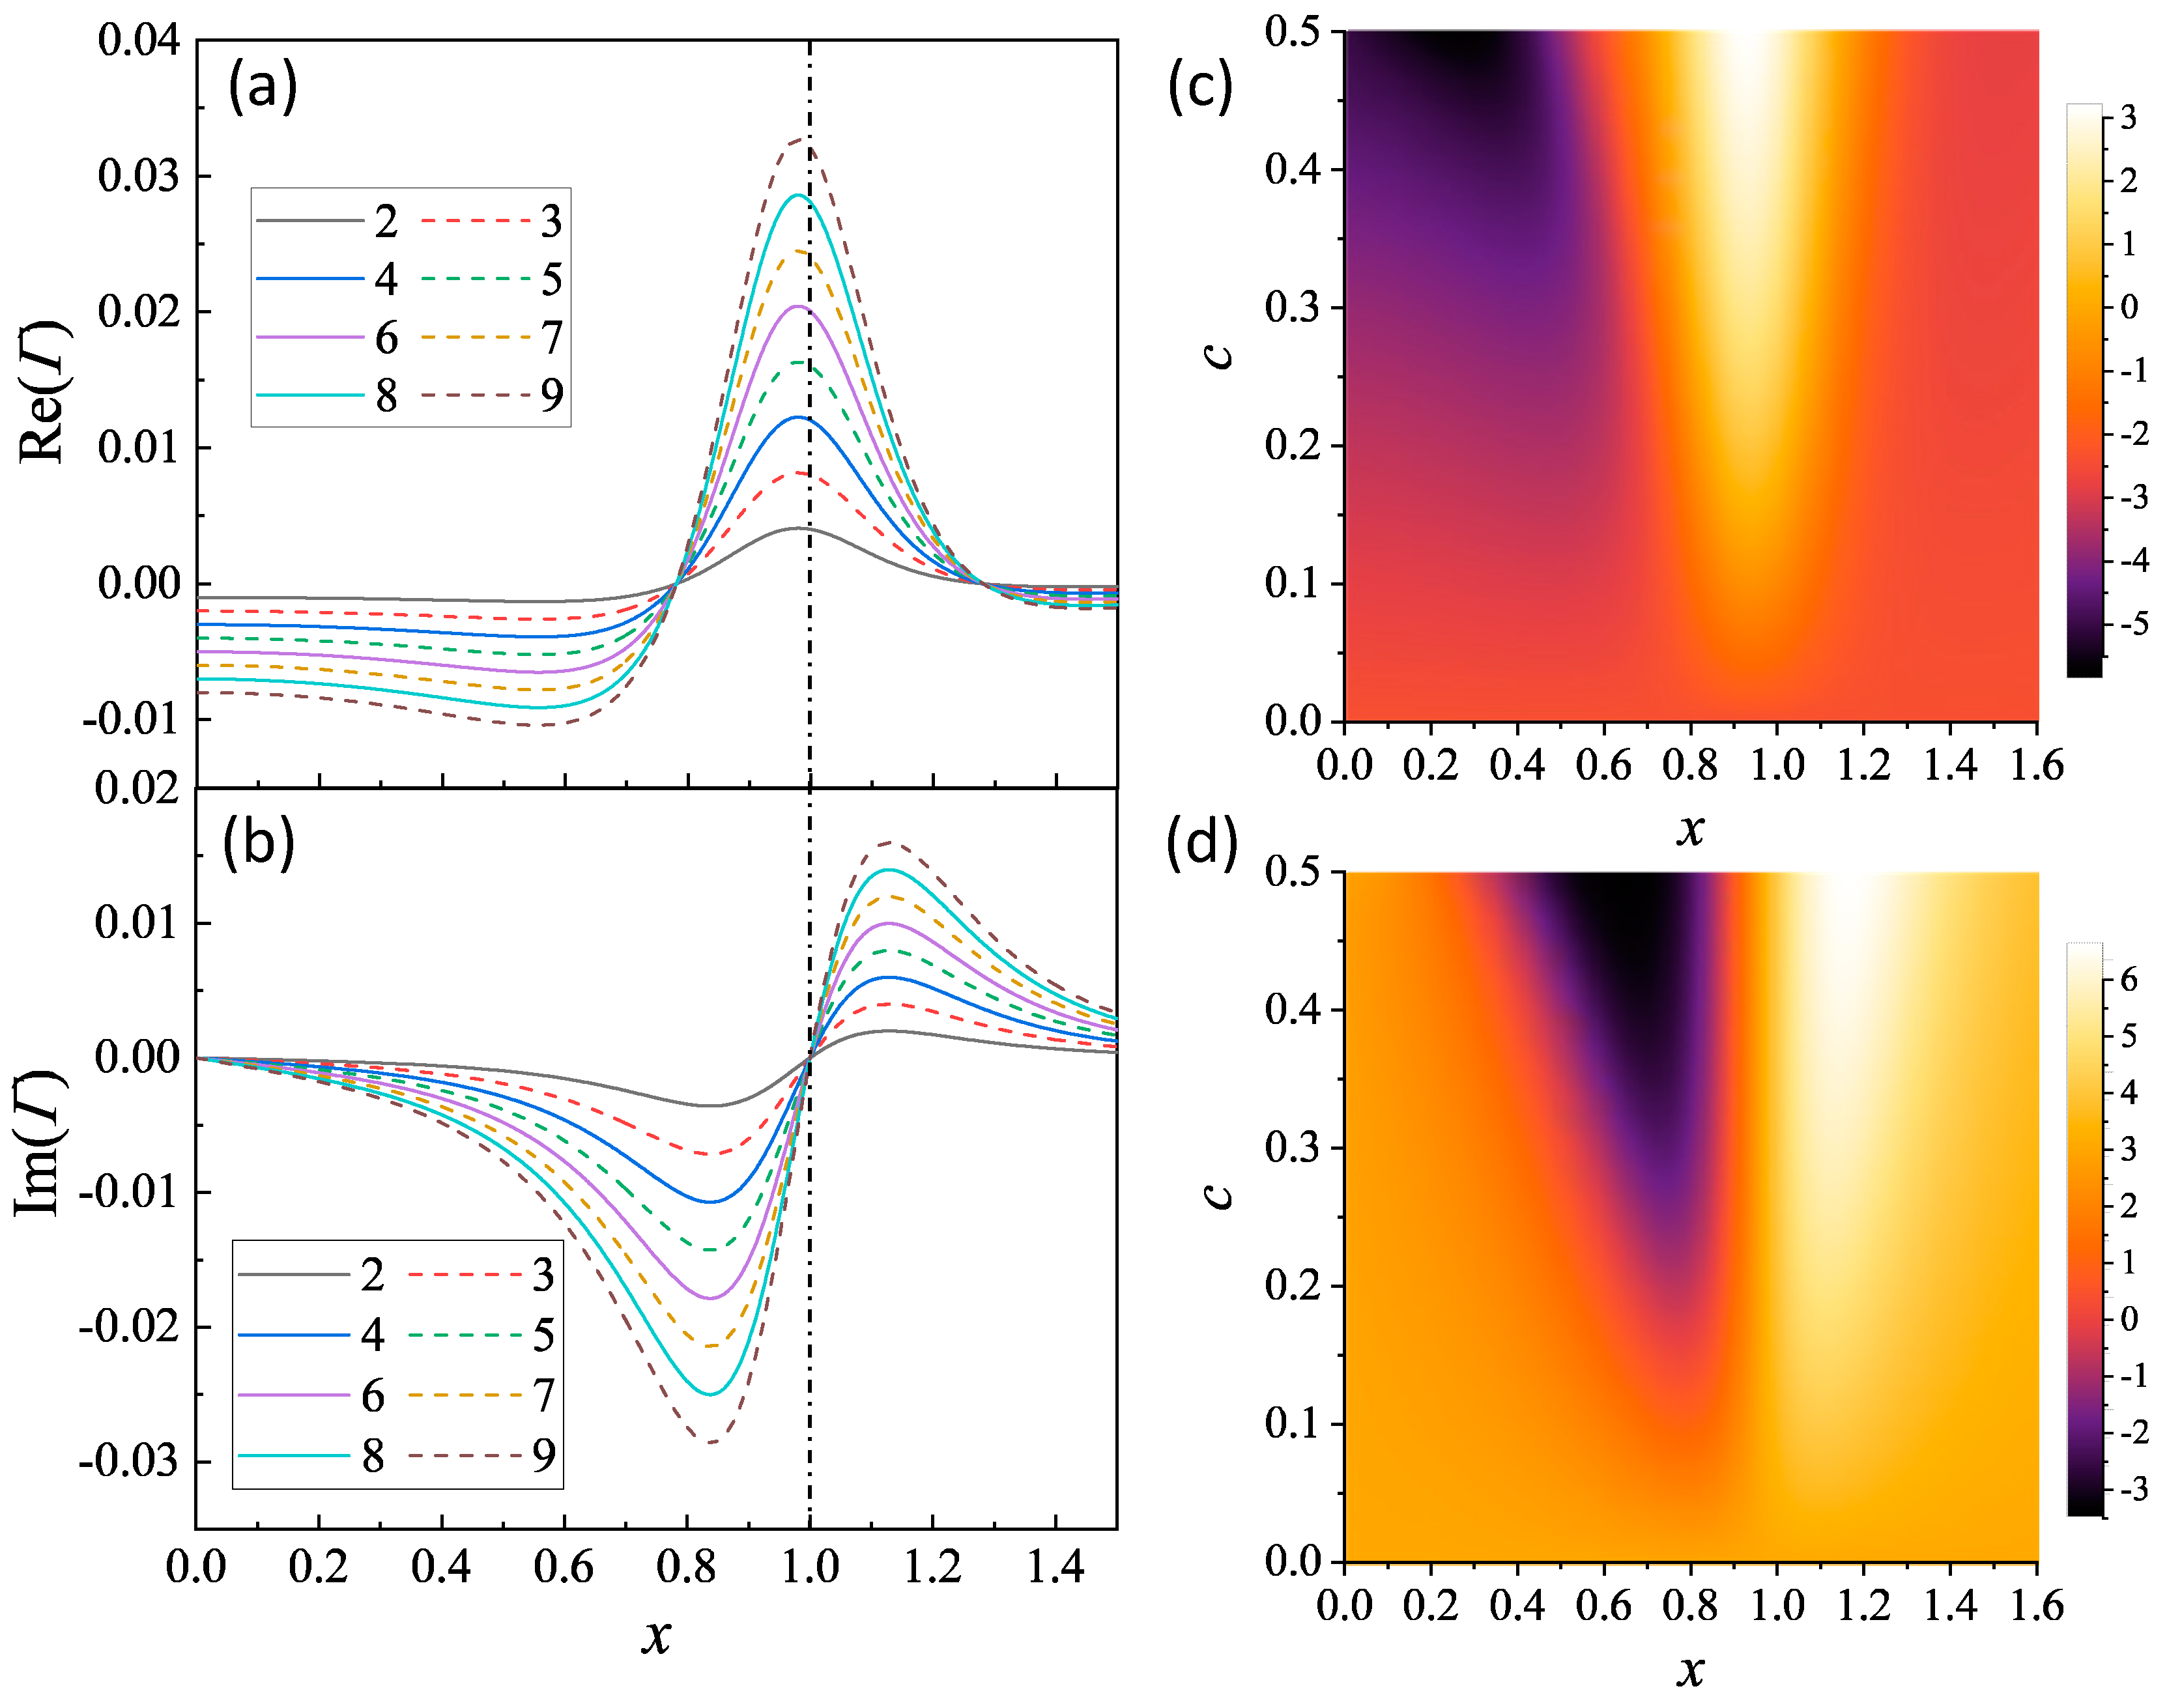
Figure 2a,b show the plots of
and
versus
x for
and
at
N = 2 to 9. As expected, the overall amplitudes of
and
increase with
N.
exhibits a primary peak around
, precisely at
, where
attains its maximum value. At
,
reaches zero. Beyond these two
x values,
is negative. Thus, for a fixed
c with the increase of
N, this
peak becomes sharper. On the contrary,
exhibits a bisinuate line shape. At
,
. This observation is consistent across all values of
N,
b, or
c, since at
,
and according to the expressions for
in
Table 1, the
value is real. At
,
reaches a negative dip; while at
,
achieve a positive peak. Due to strong damping, both
and
curves are not symmetric about
, and the overall magnitudes of
and
are smaller than 0.04.
In addition,
and
are both influenced by the coupling strength
c.
Figure 2c,d present two-dimensional (2D) map plots of
and
with varying
c from 0.01 to 0.6 for
N = 6. Several features can be seen: (1) The peak intensity of
consistently increases with
c, as indicated by
Equation 24,
. (2) The
peak exhibits increased broadening with higher
c values. (3) The separation of the negative dip location
and positive peak location
for
increases with
c. In more detail,
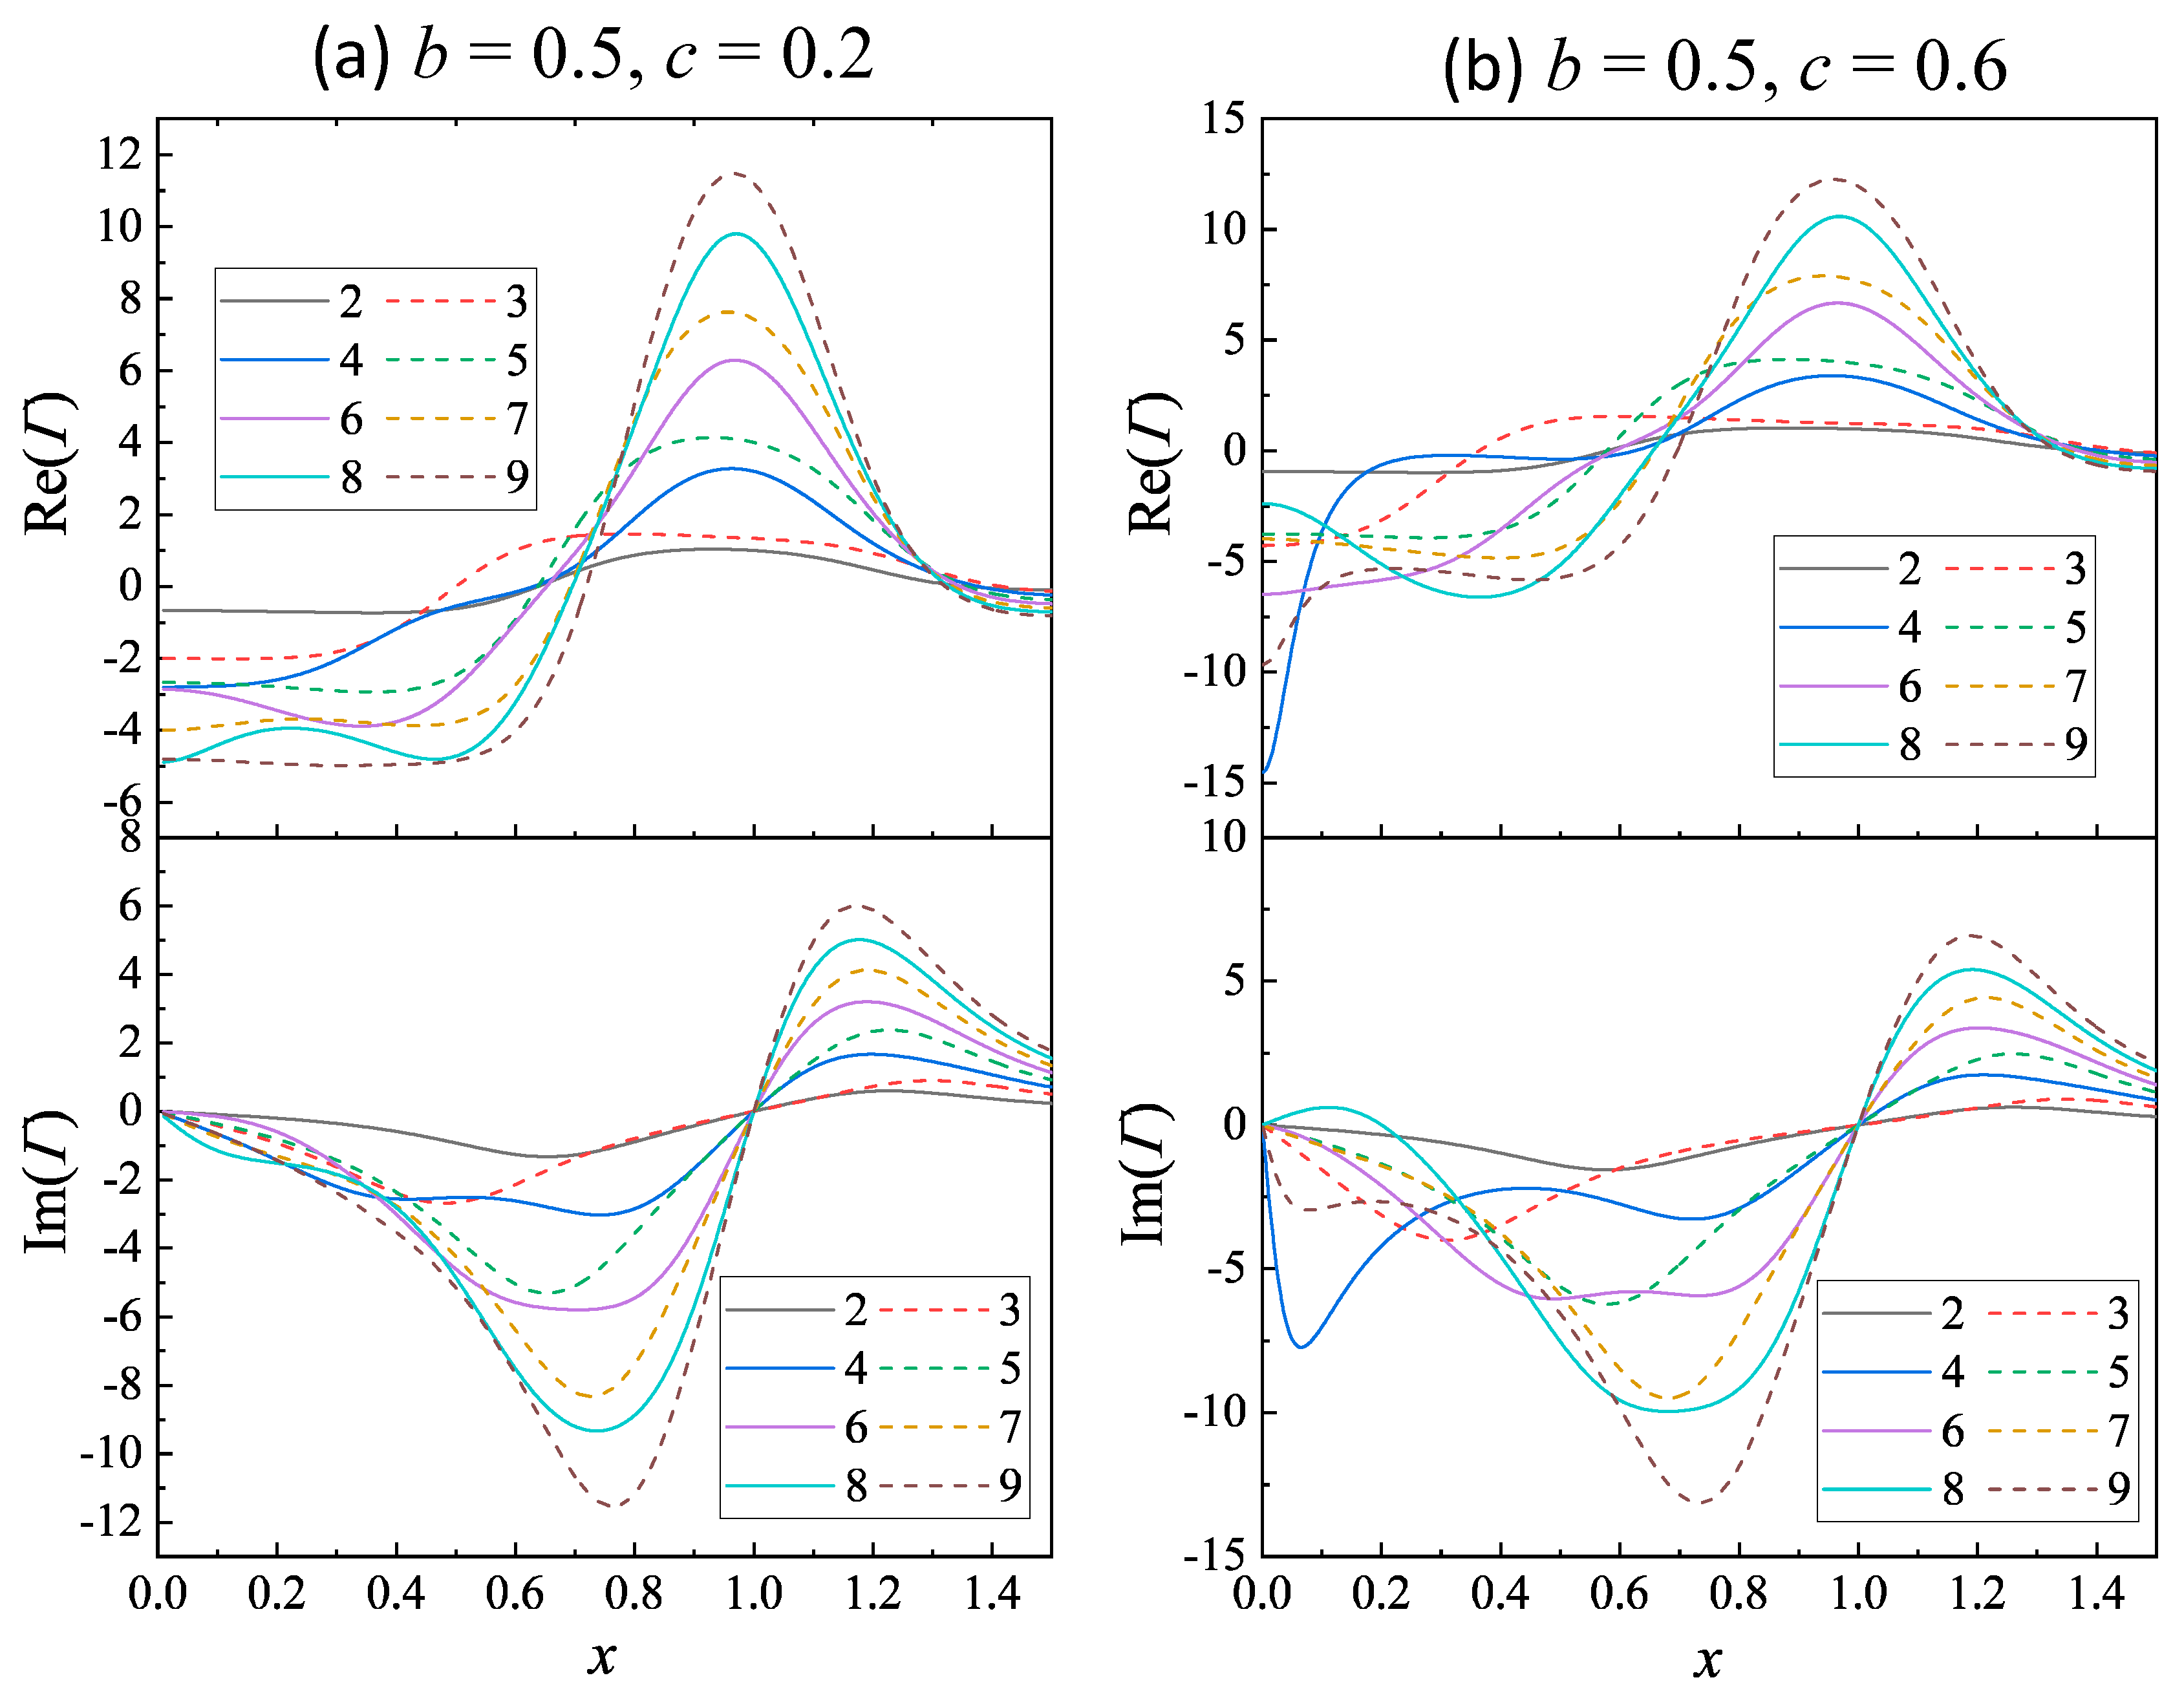
Figure 3a shows plots of
and
versus
x for
&
at
N = 2 to 9. While most
plots display a prominent peak, those for
N = 2, 3, and 5 exhibit a notably broad peak. Also, the
plots for different
N show varying zero-crossing locations, as evident in
Figure 2a. Although the maximum
continues to monotonically increase with
c, the location
undergoes slight shifts. For
N = 2, 4, 6, and 8,
; whereas for
N = 5, 7, and 9,
varies from 0.93, to 0.96, then to 0.97. In the case of
N = 3, the broad peak prevents a clear definition of a maximum. Additionally, for
, the spectral shape of
becomes more complicated.
For odd N, the still maintains the bisinuate line-shape, but both and vary with N. Specifically, the (, ) values are (0.48, 1.31), (0.66, 1.23), (0.73, 1.19), and (0.77, 1.17) for N = 3, 5, 7, and 9, respectively. This implies that the seprataion between and decreases with N. For even N (except for N = 2), the shape of becomes more complicated at : For N = 4 and 6, distinct double dips emerge, while for N = 8, a notably broad dip appears.
As the coupling strength
c increases to 0.6, indicating a scenario of strong damping and strong coupling, both
and
relationships for
N = 2 to 9 closely resemble those at
c = 0.2, with distinct
,
, and
for a fixed
N, as shown in
Figure 3b. For
N = 2, 4, 6, and 8,
; while for
N = 5, 7, and 9,
varies from 0.93, to 0.94, then to 0.95. The values of (
,
) are (0.31, 1.35), (0.58, 1.26), (0.69, 1.22), and (0.73, 1.19) for
N = 3, 5, 7, and 9, respectively.
Figure 4.
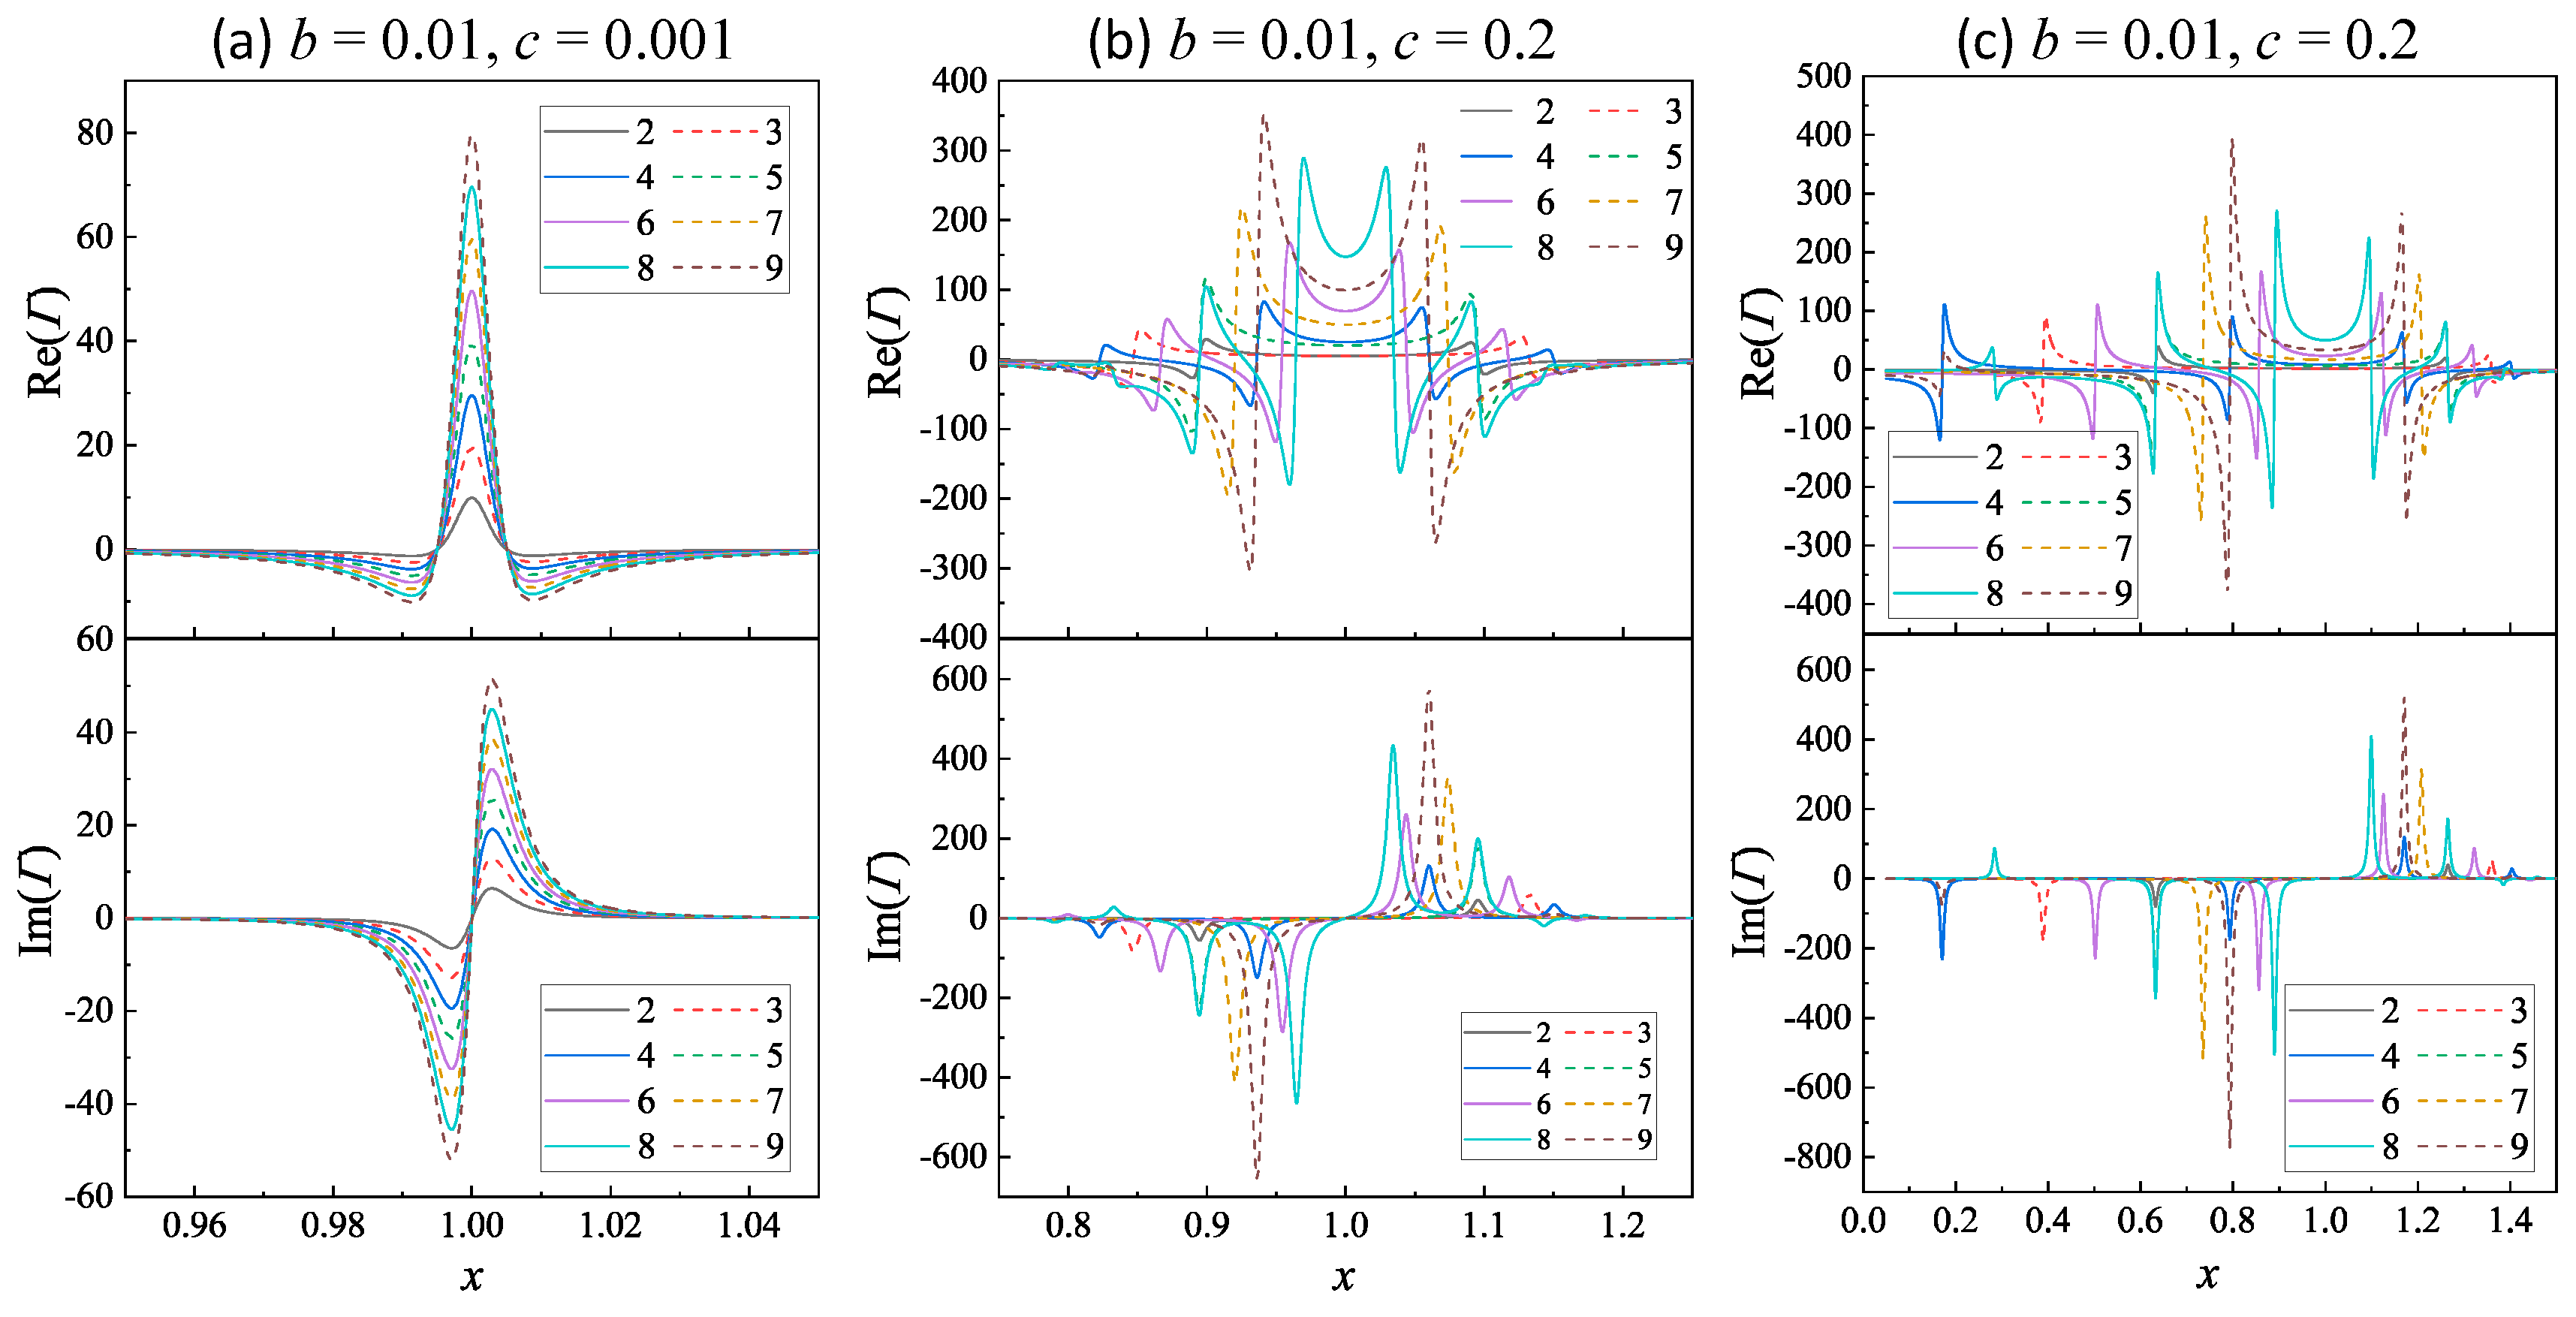
The plots of and at N = 2 to 9 for and (a) , and (c) .
Figure 4.
The plots of and at N = 2 to 9 for and (a) , and (c) .
- (1)
Small damping
Figure 4 plots the selected
and
relationships for
N = 2 to 9 at b = 0.01 and
c = 0.001, 0.2, and 0.6. In the scenario where
, corresponding to large damping and weak coupling, both
and
have the same spectral shape as shown in
Figure 4a. They are symmetric about
, with
for all
N. There are two zero-crossings for
, located at
0.995 and 1.005, respectively. Thus, the
spectra are notably sharper than those in
Figure 2a and the corresponding maximum values are on the order of 10 – 80, significantly larger than those in situations with larger damping. For
relationship, both
and
are at 0.997 and 1.003, resulting in a small spectral span but much greater magnitudes compared to
Figure 2b. Clearly, the magnitude of both
and
increases monotonically with
N.
When
c increases to 0.2, both
and
relationships become more complicated as shown in
Figure 4b. For
N = 3, 5,7, and 9, the
spectra share a similar shape, featuring a positive curved band centered around
and two large negative dips near each zero-crossing location, with the width of the central band decreasing with
N. For
N = 2, 4, 6, and 8, the central bands are relatively narrower than their
N + 1 counterparts. While the spectrum is slightly off symmetry about
, there are
N/2 zero crossings in
and
regions, respectively. Near each zero crossing, there is either a negative dip or a positive peak. Similar features are observed for the
relationship: For
N = 3, 5, 7, and 9, there is only a negative dip at
and a positive peak at
, with specific (
,
) being (0.85, 1.13), (0.89, 1.095), (0.92, 1.07), and (0.94, 1.06), respectively. For
N = 2, 4, 6, and 8,
N/2 positive peaks and
N/2 negative dips are evident in the spectra. Specifically, for
N = 2,
and
appear at 0.89 and 1.09; for
N = 4, two negative dips occur at 0.94 and 0.82, and two positive peaks at 1.06 and 1.15; for
N = 6, the negative dips are at 0.95, 0.87, 1.17, and postive peaks locate at 1.04, 1.12, 0.80; for
N = 8, dips are at 0.96, 0.89, 0.79, and 1.14, peaks at 1.03, 1.1, 1.17, and 0.83. Clearly the number of peaks/dips in the
plots corresponds to the number of zero crossings in the
plots.
As
c increases to 0.6, signifying a strong coupling case, the
and
relationships become even more complicated as shown in
Figure 4c. All the
and
spectra become markedly asymmetric, with espectral features stretched in
region. For
N = 2, 3, 4, 5, 6, 7, and 8, both the
and
spectra closely resemble those at
c = 0.2, yet with increased asymmetry and expanded separations of relative peaks or dips. However, for
N = 9, two zero-crossing locations emerge for
at
and for
, negative dips appear at 0.79 and 0.17, accompanied by two positive peaks at 1.17 and 1.4.
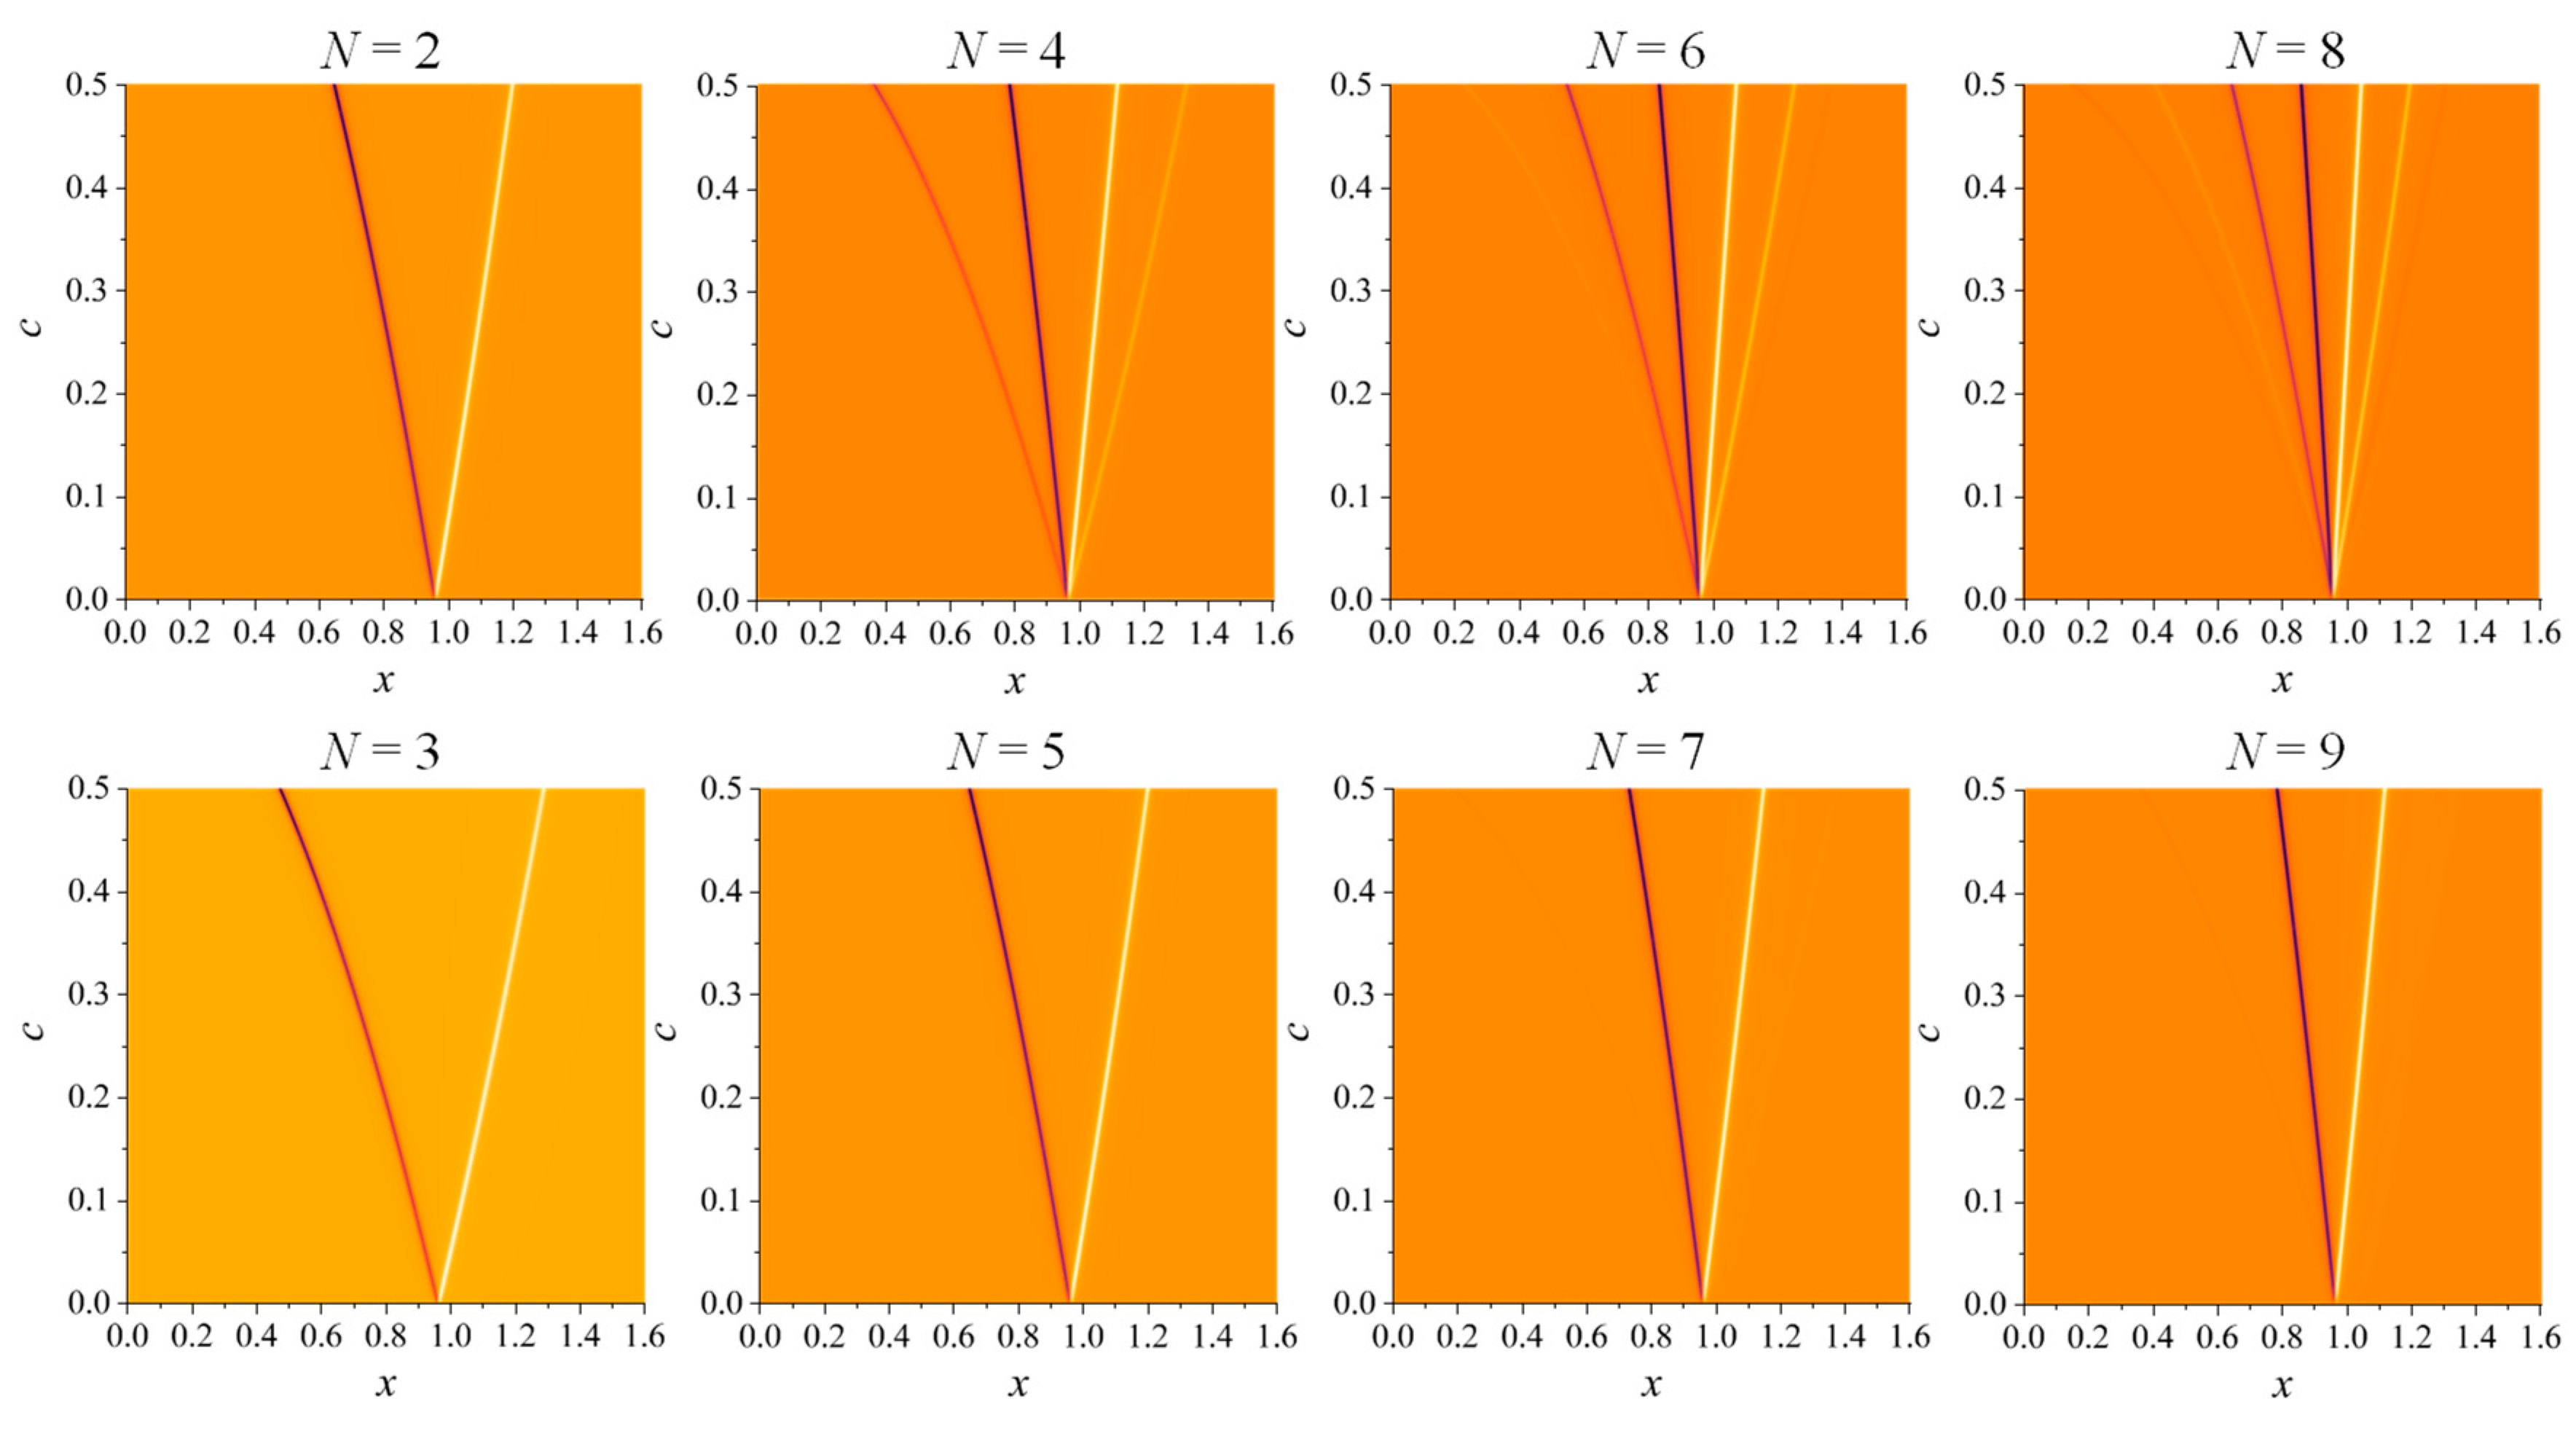
To better understand the observed splitting behaviors for different values of
c,
Figure 5 presents the 2D maps of
as
c varies from 0.001 to 0.6. The darker line-like fetures in the plots represent sharp dips while the bright curves represents sharp peaks. Initially, all maps exhibit one dip and one peak at very small
c, and depending on
N and
c, these dip and peak split into multiple dip and peak lines. For
N = 2, 3, 5, and 7, the dominate features in the
maps consist of one dip line and one peak line at
and
, respectively. With the incease of
c, the separation between
and
increases monotonically. However, for the same
c, the
and
seperations become smaller with increased
N. In contrast, for even
N (> 2), multiple dips and peaks emerge. For example, for
N = 4, two distinct dip lines appear at
and two peak lines occur at
. These four lines remain in both
N = 6 and
N = 8 maps. But in the
N = 6 map, a faint peak line emerges to the left of the second dip line, and a very weak dip line appears to the right of the second peak line. For
N = 8, compared to
N = 6, a very weak dip line is added on the far left, while a weak peak line is introduced on the far right.
The splitting of the peaks/dips for large
c arises from the degeneracy of the coupled oscillators in a weak damping case. When
c is very small, the dominant oscillation modes in the NOBK system are the bonding and anti-bonding modes. As discussed in Ref.[
16], the
and
correspond to bonding and anti-bonding modes of the system for
N = 2. In fact, as
c increases, the stronger coupling between two adjacent oscillators leads to the degeneration of oscillation modes. Since
b is very small, the NOBK system can be treated as
N-coupled harmonic oscillators with an intrinsic frequency of
. Due to the coupling, the new collective oscillation mode
becomes,[
24]
By numerically examining the negative dip and positive peak locations of
, we find that these locations are exactly corresponding to all the collected modes
for
N = 2
l and some selected modes for
N = 2
l + 1. In fact, an equation
can be used to fit all these
x locations. For
N = 2
l, according to
Equation 25, there are a total of 2
l resonant modes emerging, which correspond to the
l dips and
l peaks shown in the top row of
Figure 5. By fitting these locations, we find that
. Thus, each of the collective modes of the
N = 2
l BK oscillators can exhibit a chiral response. For
N = 2
l + 1, when
k =
l + 1,
, meaning that each oscillator in the NOBK model vibrates with its own intrinsic frequency, results in the absence of chiral response. Therefore, for
N = 3, only two chiral modes with
(which correspond to
and
, or
) are present. For
N = 5, except for the
, only when the modes of
and
demonstrate chiral response, and these two modes give
, which is consistent with the case for
N = 2. For
N = 7, we found two
a values,
and
, which correspond to
and
,
and
modes. For
N = 9, also two a values are valide,
and
, due to
and
,
and
modes. Thus, for
N = 2
l + 1, all modes
with
do not exhibit chiral response. Such a result is due to the intrinsic mirror semmetry of the collective osscilation of these modes. Let’s take
N = 5 for example, the eigen vectors for
are
,
,
,
, and
, respectively. The clearly eigen vector for
shows non-zero
x-component oscillators, and they are on the same plane; while the eigen vectors for
and
are mirror vectors about
x-
z plane: the amplitudes for the first
y-oscillator and second
y-oscillator are interchangible. Therefore, these two modes do not show chiral response. Similar features are observed for the eigen vectors for
and
of
N = 7 case, and eigen vectors for
&
,
&
for
N = 9 case.
