1. Introduction
Intrusion detection is a process of monitoring events occurring within a computer system or network, followed by analyzing the monitoring data to identify indications of intrusion attempts. Intrusion refers to attempts to gain unauthorized access to a computer system or network, potentially threatening the availability, integrity, and confidentiality of a computer network system. The system used to perform intrusion detection is known as an Intrusion Detection System (IDS) [
1]. Intrusion detection is generally carried out by matching network traffic patterns with known attack patterns or by identifying abnormal network traffic patterns [
2]. In general, anomaly-based network intrusion detection systems are categorized into three categories: knowledge-based systems, computational approaches, and statistical approaches [
3]. One statistical methodological approach used in intrusion detection is Statistical Process Control (SPC), widely applied across various sectors including industries and services. Besides detecting changes in manufacturing and service processes, SPC can also be applied in IDS. Research has explored the application of SPC in the context of intrusion detection [
4].
Statistical Process Control (SPC) has played a major role in product quality control since Shewhart [
5] introduced the control chart techniques by applying statistical methods to monitor the industrial processes. One of the multivariate control charts which is commonly used to monitor the process mean is Hotelling’s
T2 control chart [
6], which can be used to monitor either individual or subgroup observations. In SPC concepts, an outlier can be defined as an observation that significantly deviates from other observations, which indicates that the observation is observed by a different process [
7]. The Hotelling’s
T2 chart is not suitable to detect the presence of multiple outlier [
8], due to the masking and swamping effect [
9], especially for highly outlier contaminated data. The statistic of
T2, which is based on the classical estimator, is easily affected and decreased by the presence of outliers [
10,
11]. Moreover, the performance of control charts will decrease if the variables monitored increase [
12].
To overcome those problems, several methods have been proposed to minimize the effects of outliers by changing the classical estimator with a robust estimator, especially for the covariance matrix estimator. The performance of the
T2 control chart in monitoring mean shifts will increase if a robust estimator is utilized [
13]. Many robust methods have been adopted to develop a
T2 control chart to minimize the effect of outliers. These methods such as Minimum Volume Ellipsoid (MVE) [
14], Trimming Method [
15,
16], Minimum Vector Variance [
17,
18], Successive Difference Covariance Matrix (SDCM) [
10,
19], Minimum Covariance Determinant (MCD) [
15,
20], Reweighted minimum covariance determinant (RMCD) [
21], and Fast Minimum Covariance Determinant (Fast-MCD), whose good performance on monitoring small to medium outlier contaminated data with 30% breakdown point [
22]. The latest development of robust estimators is the Minimum Regularized Covariance Determinant (MRCD) method [
23], which uses the concept of data-driven algorithm and regularization to avoid overfitting problems. The MRCD estimator can be used to detect outliers in high-dimensional data. Besides the robust estimator, the Hotelling’
T2 chart can also be developed using a non-parametric approach as a control limit, namely the bootstrap resampling method [
24].
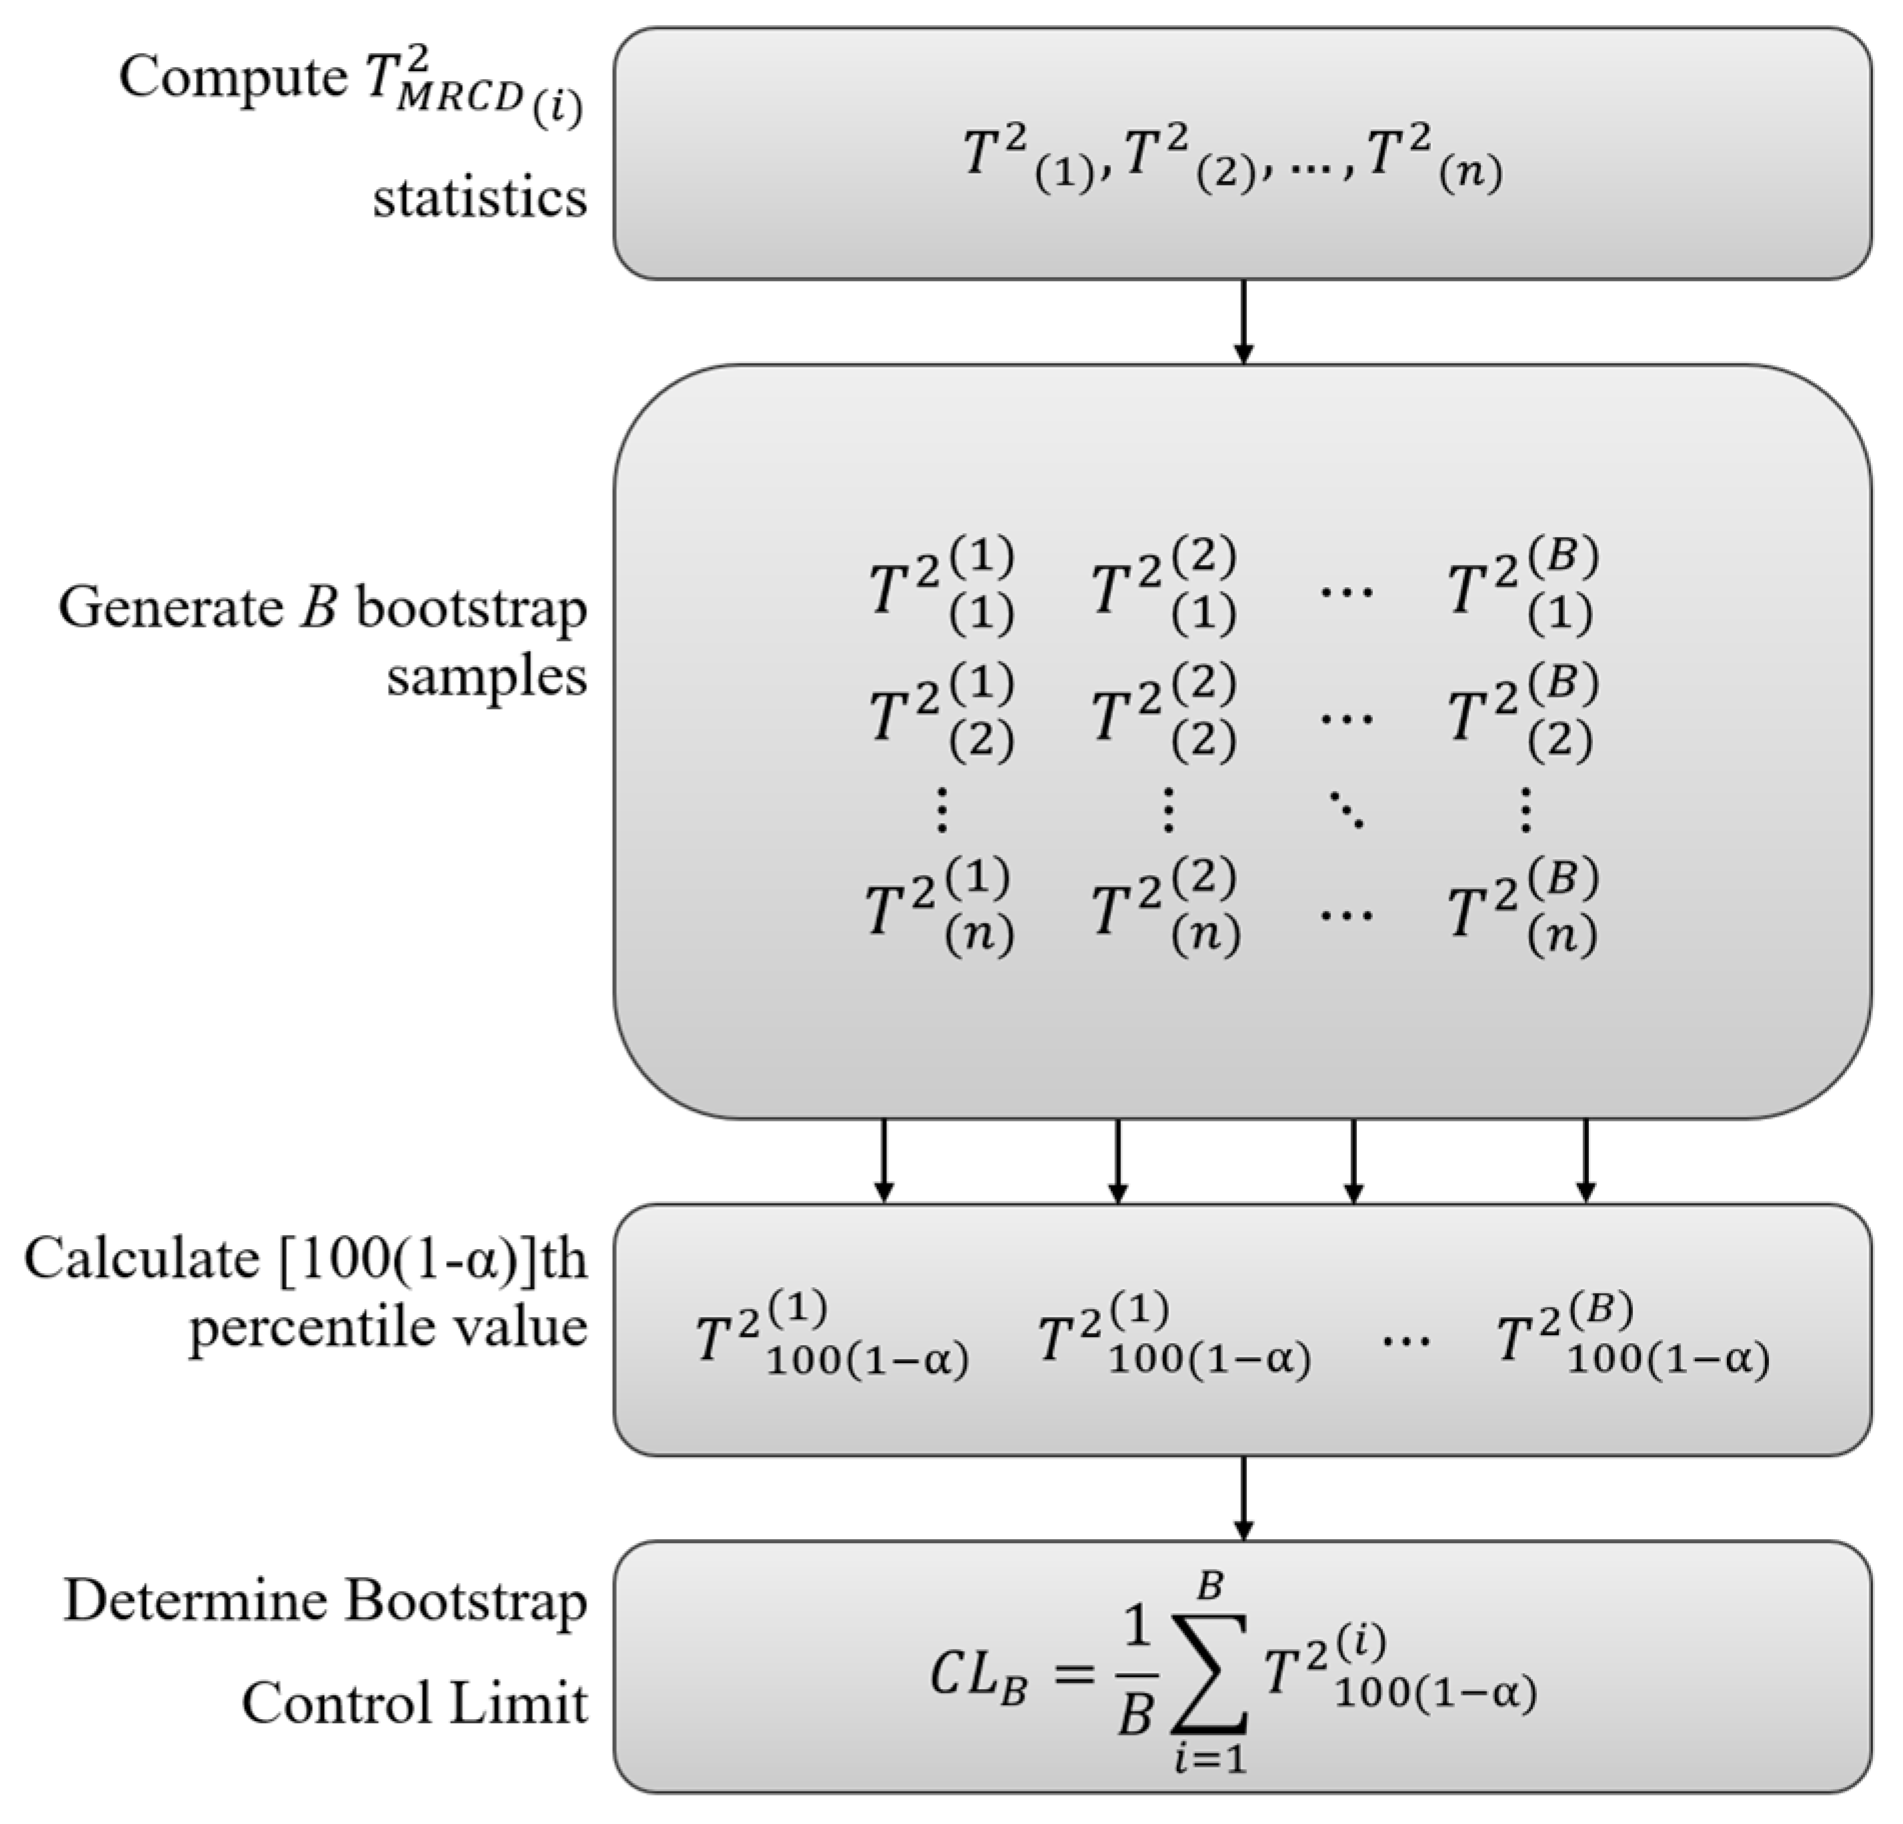
This research focuses on developing bootstrap-based robust
T2 control charts with MRCD estimators for detecting intrusion. This method will be applied to the UNSW-NB15 dataset. The rest of this paper is organized as follows:
Section 2 presents the related work. In
Section 3, the explanation of the proposed chart construction is presented.
Section 4 provides the methodology and procedure of the proposed chart.
Section 5 shows the application results of the proposed chart for the IDS dataset. Finally,
Section 6 is allocated for the conclusion and future research.
2. Related Works
The SPC method commonly used in intrusion detection is a multivariate control chart. Ye et al. [
25] initiated the use of Markov Chain techniques,
T2 Hotelling, and chi-square multivariate tests for intrusion detection. Then Ye et al. [
26] proposed a technique based on Hotelling's
T2 that can detect both counter relationships and mean-shift anomalies. Qu, Hariri, and Yousif [
27] use the
T2 Hotelling diagram to detect intrusions on a network called real-time Multivariate Analysis for the Network Attack detection algorithm (MANA) by updating control limits at certain time intervals. Zhang, Zhu, and Jin [
28] developed a Support Vector Clustering (SVC) based control diagram with performance results similar to the
T2 diagram for detecting anomalies in computer networks. Tavallaee et al. [
29] apply Covariance Matrix Sign (CMS) to detect Denial of Service (DoS) attacks. Sivasamy and Sundan [
30] compared the performance of the
T2 Hotelling control chart with the SVM and TANN methods and found that Hotelling’s
T2 accuracy level was high for all types of attack classes.
In addition to Hotelling's
T2, Rastogi et al.
[31] stated that in theory MEWMA and MCUSUM can be used in intrusion detection, however, intrusion detection data involves many quality characteristics so MEWMA and MCUSUM are not suitable for use. Camacho et al [
32] use PCA based on Multivariate Statistical Process Control (MSPC) to monitor intrusions. Ahsan et al. [
33] use PCA-based Hotelling’s
T2 which produces more efficient computational time. The use of non-parametric control limits improves performance on the
T2 control diagram with a Successful Difference Covariance Matrix (SDCM) in the form of Kernel Density Estimation [
34] and Bootstrap Resampling
[35]. Then Ahsan et al. [
36] developed robust Hotelling’s
T2 based on Fast-MCD which shows better performance in detecting outliers in intrusion detection systems.
5. Results and Discussions
The UNSW-NB15 dataset was built using the IXIA PerfectStorm tool at the Australian Centre for Cyber Security (ACCS) by generating a combination of normal activities and realistic, modern artificial attacks for research purposes related to Network Intrusion Detection Systems (NIDS) [
45]. Compared to other NIDS datasets, UNSW-NB15 excels in complexity, referring to patterns of modern network traffic attacks, making it suitable for evaluating intrusion detection systems [
46]. The training set of UNSW-NB15 consists of 175,341 records with 38 metric features and record labels which are normal labels and several types of intrusion labels that are presented in
Table 2.
The data application is conducted through three methods: conventional Hotelling’s
T2, robust
T2 based on Fast-MCD, and the proposed diagram, which is the robust
T2 based on MRCD. The construction of the control chart is divided into two phases: Phase I for establishing control limits and Phase II for the detection process and calculating the performance of the control chart. In the conventional Hotelling’s
T2 control chart, the
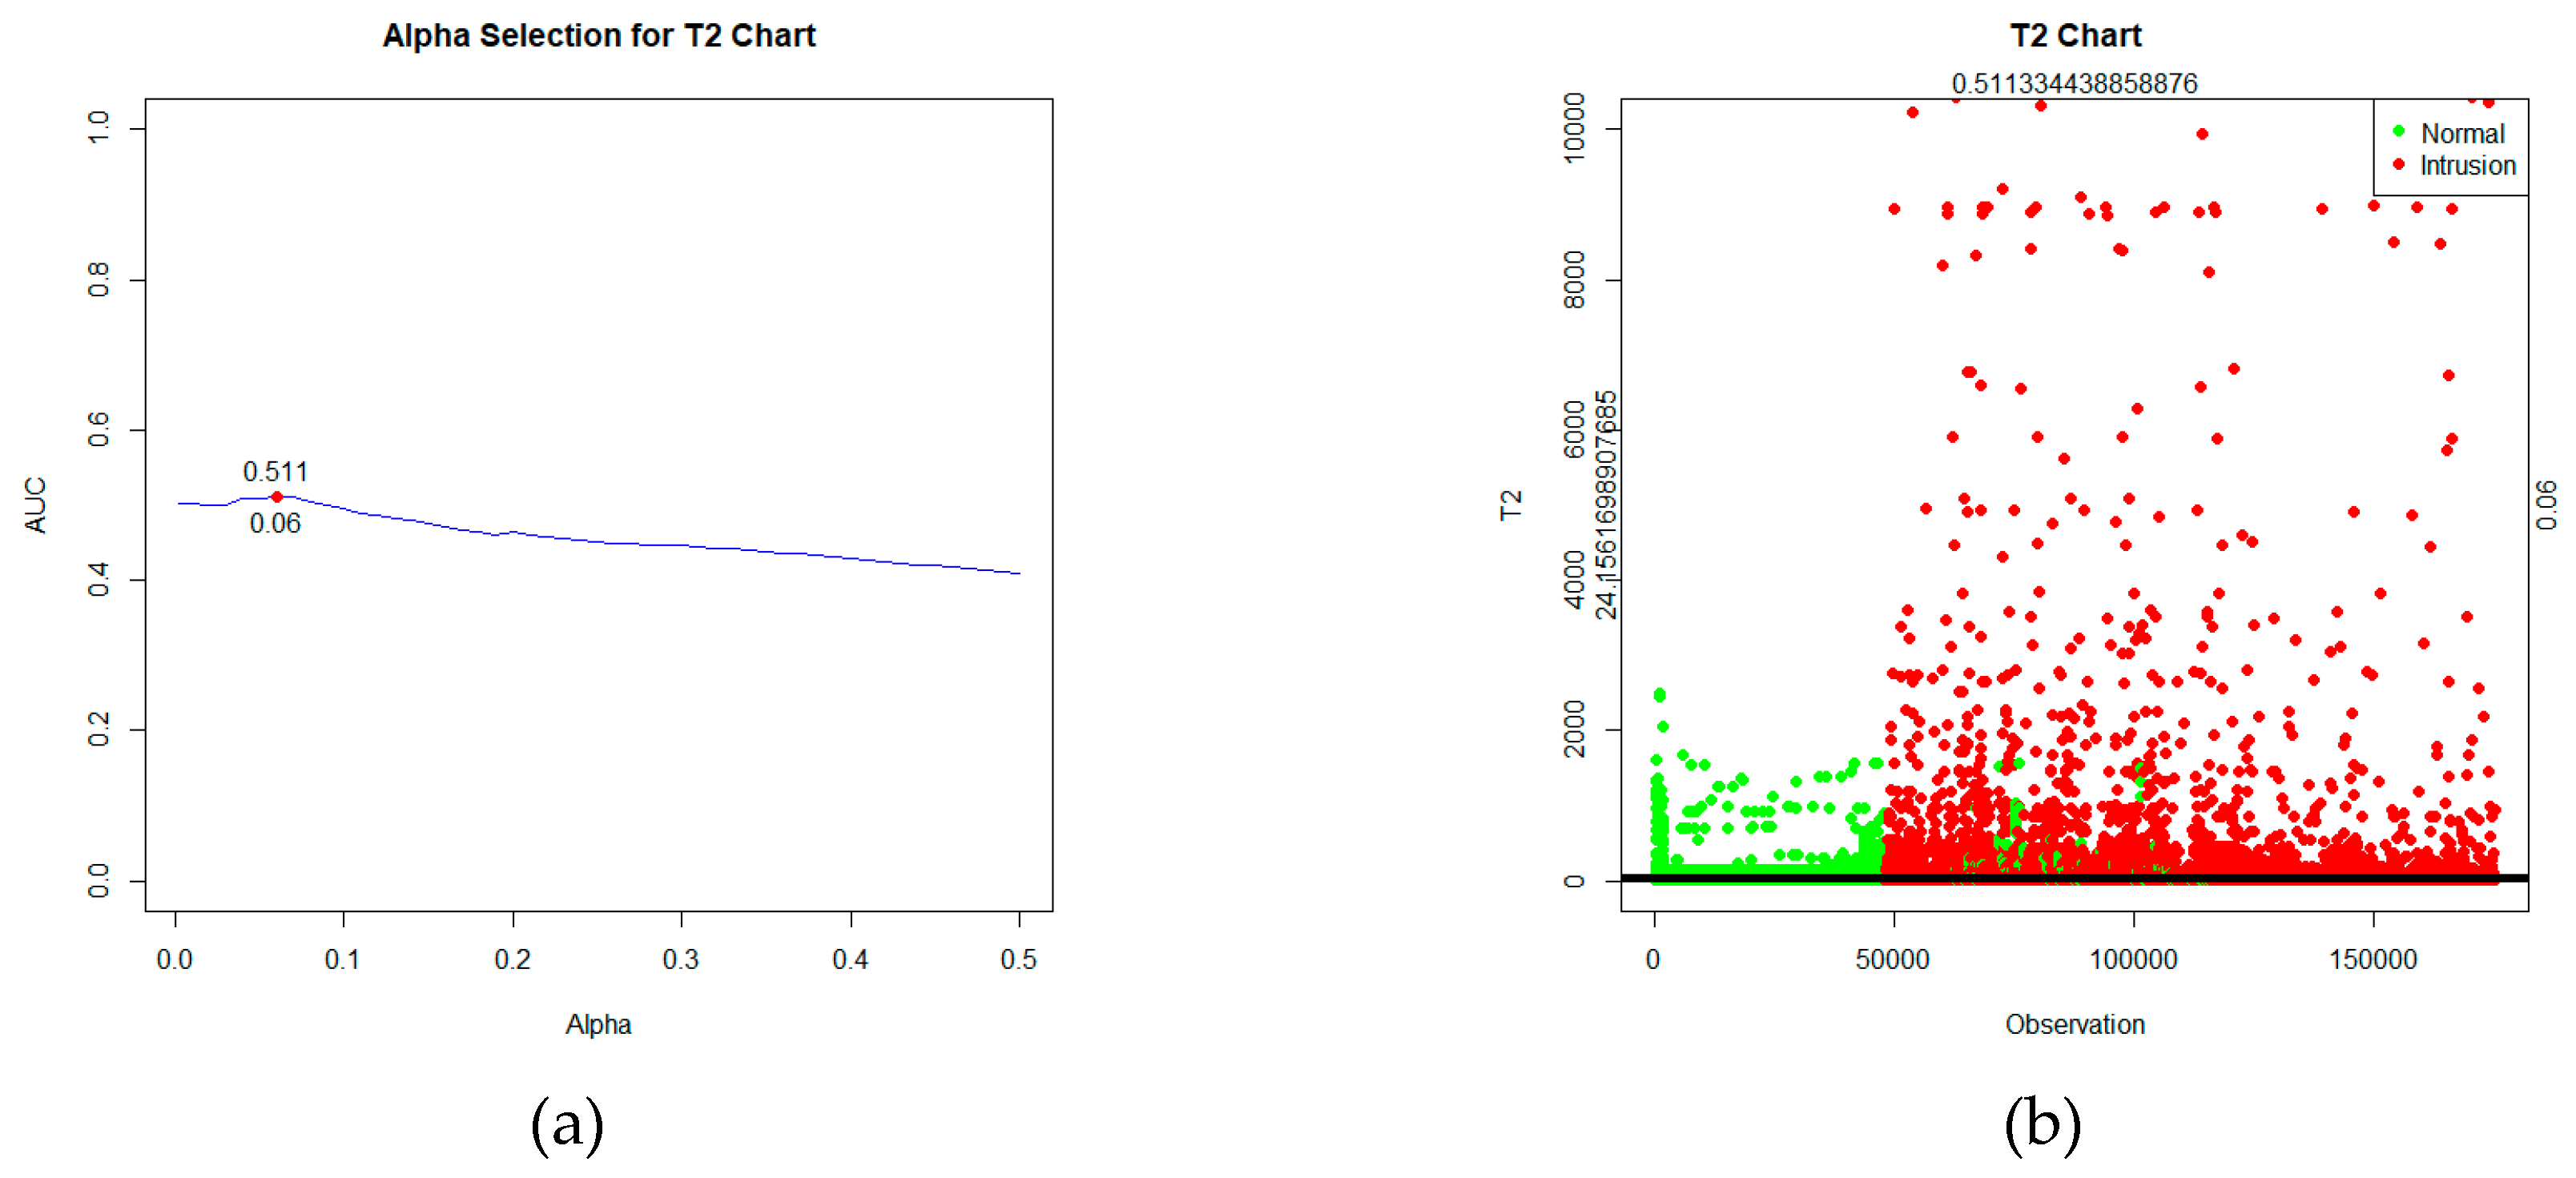
T2 statistic is calculated using equation (2.29), with control limits determined based on the significance level using the criteria of the highest AUC value, which is α=6%, as depicted in
Figure 2(a). After computing the statistics and establishing control limits, the control chart can be visualized, as shown in
Figure 2(b).
Based on
Figure 2, the statistical plot depicts two types of data labels: green for normal data and red for intrusion data. These statistics will be tested against the control limits. If the value of the statistic
T2 >
, the observation is detected as an intrusion. While if the statistic
T2 ≤
, the observation is detected as normal. Based on the labels and the detection outcomes obtained, a confusion matrix table can be formed in
Table 3.
Next, in the construction of a control chart for Robust
T2 based on Fast-MCD, the
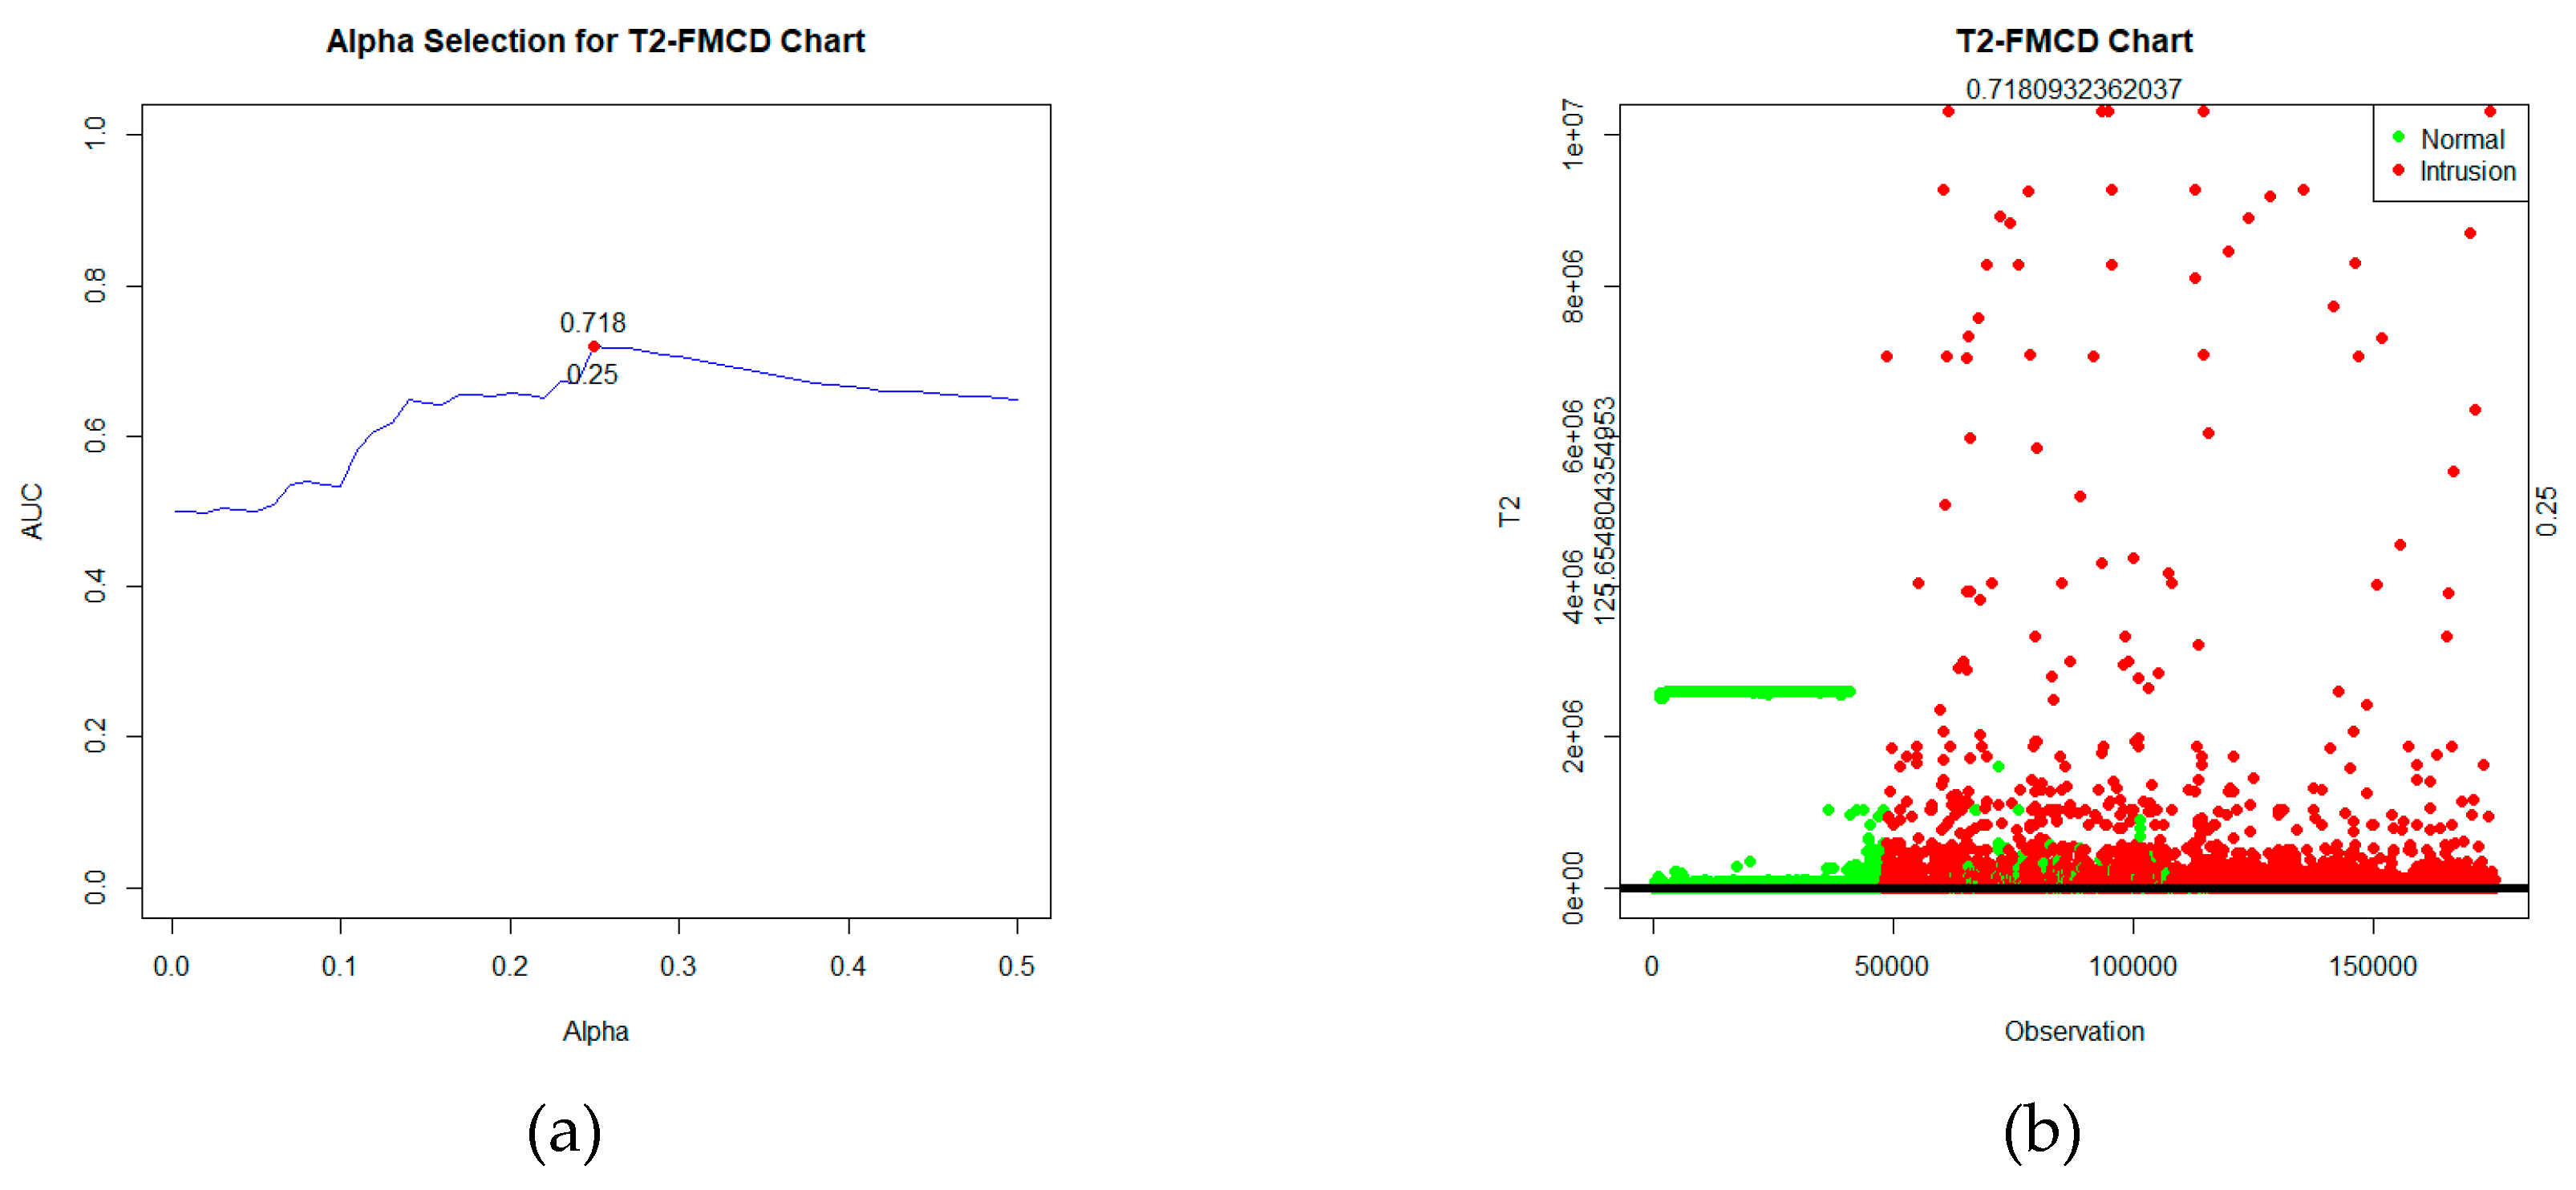
T2 statistic is calculated, and the control limits are determined based on the significance level using the criteria of the highest AUC value, which is α=25%, as depicted in
Figure 3(a). After computing the statistics and establishing the control limits, the control chart can be visualized, as seen in
Figure 3(b).
Based on the figure, the statistical plot depicts two types of data labels: green for normal data and red for intrusion data. These statistics will be tested against the control limits. If the value of the statistic
T2FMCD >
, the observation is detected as an intrusion. While if the statistic
T2FMCD ≤
, the observation is detected as normal. Based on the labels and the detection outcomes obtained, a confusion matrix table can be formed and evaluated as
Table 4.
Based on
Table 4, it can be known that the performance of Robust
T2 based on Fast-MCD on the UNSW-NB15 data is quite good, with an AUC value of 0.718. Additionally, with an FP Rate of 0.25, there's a relatively low FN rate of 0.314.
For constructing the proposed chart of Robust
T2 based on MRCD, the
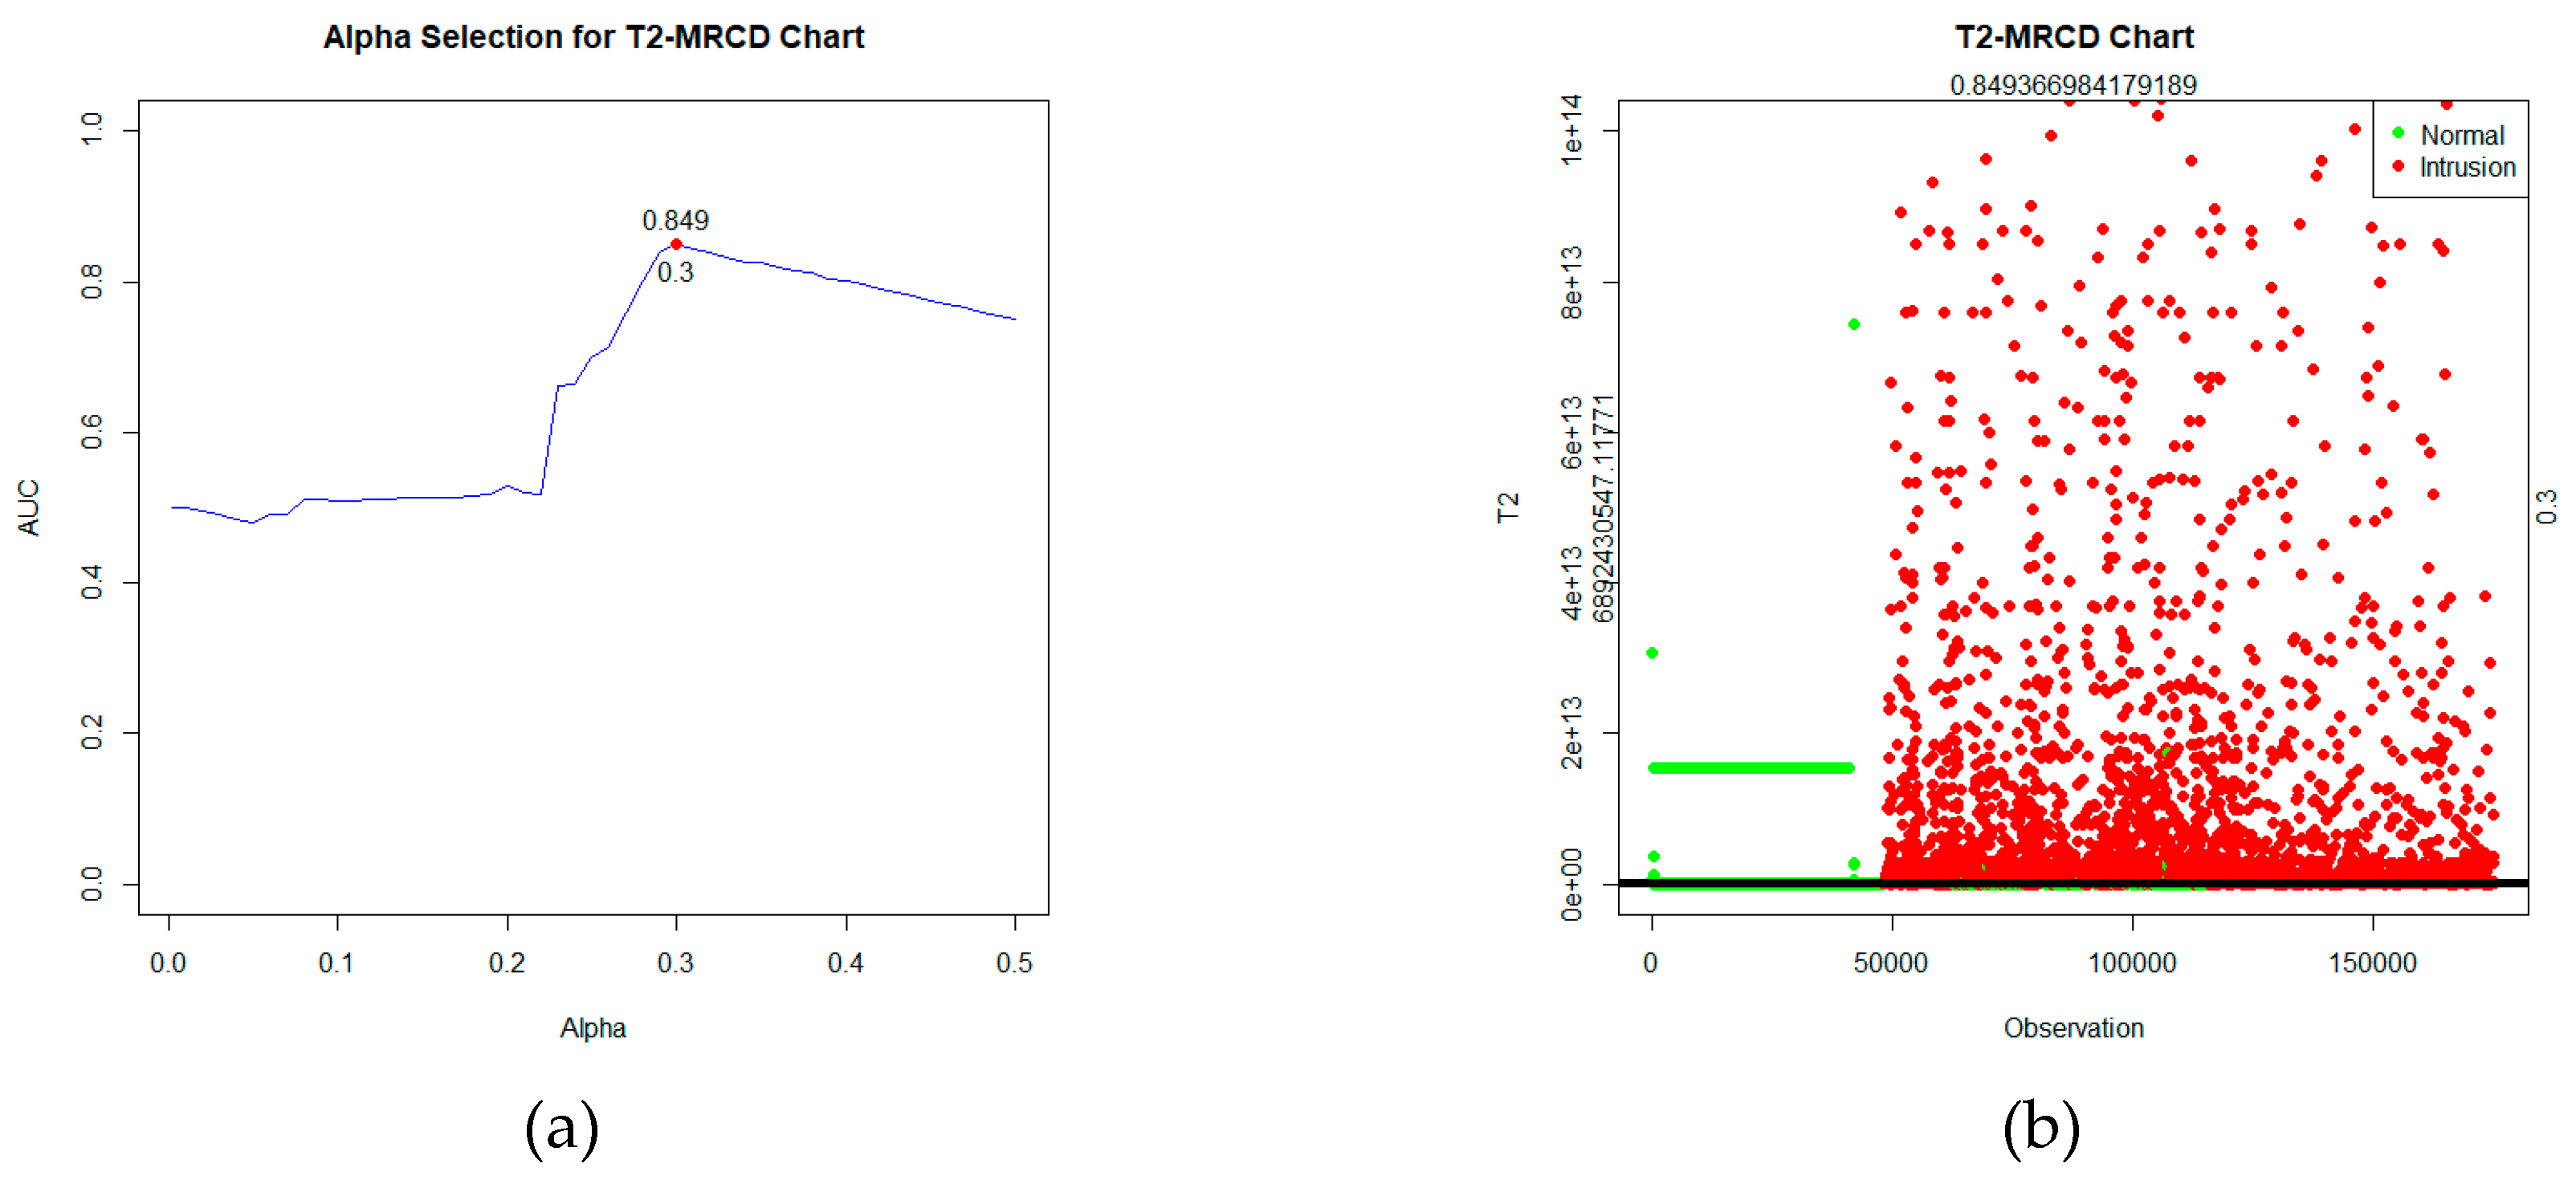
T2 statistic is calculated using, and the control limits are determined based on the significance level using the criteria of the highest AUC value, which is α=30%, as depicted in
Figure 4(a). After computing the statistics and establishing control limits, the control chart can be visualized, as shown in
Figure 4(b).
Based on
Figure 4, the statistical plot depicts two types of data labels: green for normal data and red for intrusion data. These statistics will be tested against the control limits. If the value of the statistic
T2 MRCD >
, the observation is detected as an intrusion. While if the statistic
T2MRCD ≤
, the observation is detected as normal. Based on the labels and the detection outcomes obtained, a confusion matrix table can be formed and evaluated in
Table 5.
Based on
Table 5, it's apparent that the performance of Robust
T2 based on MRCD on the UNSW-NB15 data is excellent, with an AUC value of 0.849. Additionally, with an FP Rate of 0.298, there's an exceptionally low FN rate of only 0.004.
After applying the UNSW-NB15 data using these three methods, the performance of each chart can be compared and evaluated based on several goodness and error criteria, as presented in
Table 6.
Table 6 displays the Accuracy, AUC, FP Rate, FN Rate, and execution time of the three methods used in this study. The conventional
T2 method, with its straightforward steps, took only 286 seconds. The Fast-MCD-based
T2 method, known for its efficiency, required 1,470 seconds. Meanwhile, the MRCD-based
T2, featuring a complex algorithm, took a longer time of 8,108 seconds.
The duration of execution time correlates with the quality of the chart's performance in detecting intrusions. Based on the AUC values, the conventional T2 Hotelling chart showed poor performance in intrusion detection, achieving an AUC of only 0.511. Both robust T2 charts demonstrated better performance than the conventional T2. The Fast-MCD-based T2 had a relatively good AUC value of 0.718. On the other hand, the proposed MRCD-based T2 had the best performance with the highest AUC value of 0.849 and an exceptionally low FN Rate of 0.004, indicating a very low chance of undetected intrusions.


